1. Introduction
Garbage sorting is an activity that stores garbage by a certain category and carries out subsequent recycling or treatment according to a scientific basis. With rapid urbanization and population growth, the production of household solid waste becomes a huge obstacle to urban governance and sustainable development worldwide. Household pre-classification is of great significance to the overall treatment of municipal waste, by reducing landfilling and promoting material recycling. The policy of household waste management in China began to sprout in the 1950s. A garbage sorting system has been implemented in China for more than 20 years. Since 2019, more intensive garbage sorting policies have been introduced one after another [
1,
2], requiring garbage to be sorted into four categories, which are recyclable waste, kitchen waste, hazardous waste and other waste, but the garbage sorting results are still unsatisfactory. In the early stage, garbage sorting promotion attempts are mainly propaganda and education, whose effect is little. The main obstacles mainly include the situation of “informal scavengers” [
3,
4], the low popularizing rate of the common sense of garbage sorting, the backwardness of recycling facilities, and deficiencies in the waste classification policy [
5]. These obstacles make it difficult to fully promote the garbage sorting policy, and the rate of households participating in garbage sorting remains at a low level. The question of how to optimize the current policies and stimulation measurements to improve the participation of community residents in garbage sorting has become a problem worth studying.
Work has been performed focusing on Municipal Solid Waste (MSW) policy scenario simulation, in which the mainstream modeling methods can be divided into traditional modeling methods and complex system modeling methods [
6].
Among the traditional modeling methods, statistical analysis methods such as time series analysis [
7] and regression analysis [
8,
9] are often used to predict the amount of municipal waste production [
6] as well as analyzing policy effectiveness [
10]. However, these methods rely heavily on the quality of the history data, so the predictions’ accuracy is difficult to be guaranteed, and it is impossible to explore the influencing mechanism of numerous factors. In addition, management decision models such as the cost–benefit analysis [
11], life cycle evaluation model [
12] and multi-objective decision analysis model [
13] are often used to guide the formulation of comprehensive urban life management schemes [
14]. But these methods are all static analysis methods, lacking flexibility and effectiveness. The fuzzy-stochastic method is often adopted while analyzing a waste management system with uncertainty problems but it might prompt intricate sub-models in practical problems [
15].
The policy scenario simulation of MSW is a complex system modeling problem, which involves the influence and interaction among households, individual collectors, enterprises and governments. Agent-based modeling shows great applicability in simulating the complex reality [
16].
Agent-based model (ABM) is a computational model used to simulate the impact of individual behaviors and interactions on the overall system [
17]. In ABM, agents represent individuals that operate autonomously based on mechanisms that are incorporated into them. ABM remains the only known approach that can simulate how a set of agents interact and communicate with each other, allowing the macro-level phenomenon disassembled into micro-level patterns [
16]. By decomposing the intricate giant system into small systems that can interact with each other, the multi-agent system becomes easier to manage and simulate [
18,
19].
In recent years, ABM has been applied to study the behavior of household garbage classification and recycling. Luo et al. [
20] combined the complex adaptive system theory with an agent-based modeling method, considering the interactions among the producers, residents and governments of household appliances, building a model for the recycling and utilization of used household appliances in China, simulating individual behaviors and exploring the industry evolution trend under various policy scenarios. Walzberg et al. [
21] established an agent-based model for the recycle and reuse of photovoltaic components in the United States which integrated social factors with economic factors and technical factors and analyzed the sensitivity of each factor with a machine learning meta-model. Meng et al. [
22] collected human behavioral preferences by designing a questionnaire for basic information, and built a multi-agent model, which was applied to Suzhou to simulate the garbage sorting results of urban residents under three typical household waste management policies. Ceschi et al. [
23] established an agent-based model for simulation based on the real data of a community in Taiwan, which confirmed the actual trend of waste recycling and proved the effectiveness and reliability of using ABM to verify waste management policies.
These studies illustrated the complex factors affecting household waste disposal behavior. For practical policy implication, integrated models are needed taking all three kinds of factors, which are individual factors, social factors and external policy factors.
Studies on influencing factors of individual garbage collection behavior decision-making are widely carried out [
24]. Legal policy has proved to be one of the strongest and most effective methods. Europe and U.S. are now carrying out mandatory waste sorting and recycling policies, leading to a leap in the household waste separation participation rate [
25]. Propaganda communication is also an effective way, both through media appeal and through targeted door-to-door publicity [
26]. Customized resident-centered feedback is considered to be a simple, low-cost but effective method to engage residents in a recycling program in the trial carried out in Portsmouth [
27]. Public education can improve the willingness of garbage classification in many ways [
28], such as strengthening public environmental awareness, promoting the public understanding of the principle of garbage classification, and helping the public to learn the benefits of garbage classification [
29,
30,
31]. Social network also plays a significant role in the promotion of garbage classification, which is especially evident in acquaintance society [
32]. Monetary rewards and punishments, such as charging for discarded garbage, fines for non-sorting behavior, and positive rewards for sorting behavior, are also major factors influencing human behavior decisions [
33]. Easier access to disposal facilities and standardized waste bags can intuitively promote garbage sorting behavior by reducing the effort people need to exert to participate in pro-environment activities [
10,
30].
In 2018, Tong et al. [
34] carried out the experiment applying ABM to a community, looking into the behavior changes of the residents. But since 2019, more and more cities in China started to implement mandatory classification of household garbage, thus different policies and business patterns in the community level arose.
This paper is based on the study carried out by Tong et al. [
34], aiming to consider all relevant factors while simulating the possible result under newly emerged policies. To analyze how these policies and structures can effect residents’ behavior, we use the Theory of Planned Behavior (TPB) [
35,
36], taking individual factors (including education level, environmental awareness, family income, geographical location, etc.) and social factors in acquaintance society (including social rewards and punishments, social behaviors, etc.) into the consideration range of individual behavior decision-making, realized the continuous adjustment of external incentive parameters. We designed a total of eight policy scenarios according to the actual situation of the study area for simulation.
Moreover, this paper provides a visualization platform serving for policy makers. It is important to show the participation status at the community scale to make pointed adjustments according to the impact of facilities’ layouts and policies, so we designed a three-dimensional scenario of the community that can intuitively visualize the participation rate of garbage sorting behavior in different buildings in the community. Finally, a 3D online virtual system was developed and it provides the functions of both global-level and community-level household waste disposal behavior simulation. Through this system, students can adjust different factors and observe the simulation results to better understand the behavior theory.
2. Materials and Methods
2.1. Overview of the Study Region
As the main place for residents’ daily life and social interaction, community is a small micro-system. In the promotion of garbage classification behavior, the community acts as a subject of constraint on residents’ behavior and plays a decisive role. The community provides incentive measures for garbage classification, which can guide families to perform garbage classification behavior [
37].
The study took a typical residential community, Community H, in Beijing, as an example to establish a residential garbage classification and recycling model simulating the participation rate of garbage sorting activities under the incentive of different community garbage sorting policies, and explored the optimal incentive of community garbage sorting policies. This community is chosen because it is rapidly urbanizing and eagerly needs to find ways to promote garbage sorting and carry out effective waste management, which is typical in most first-tier and second-tier cities in China.
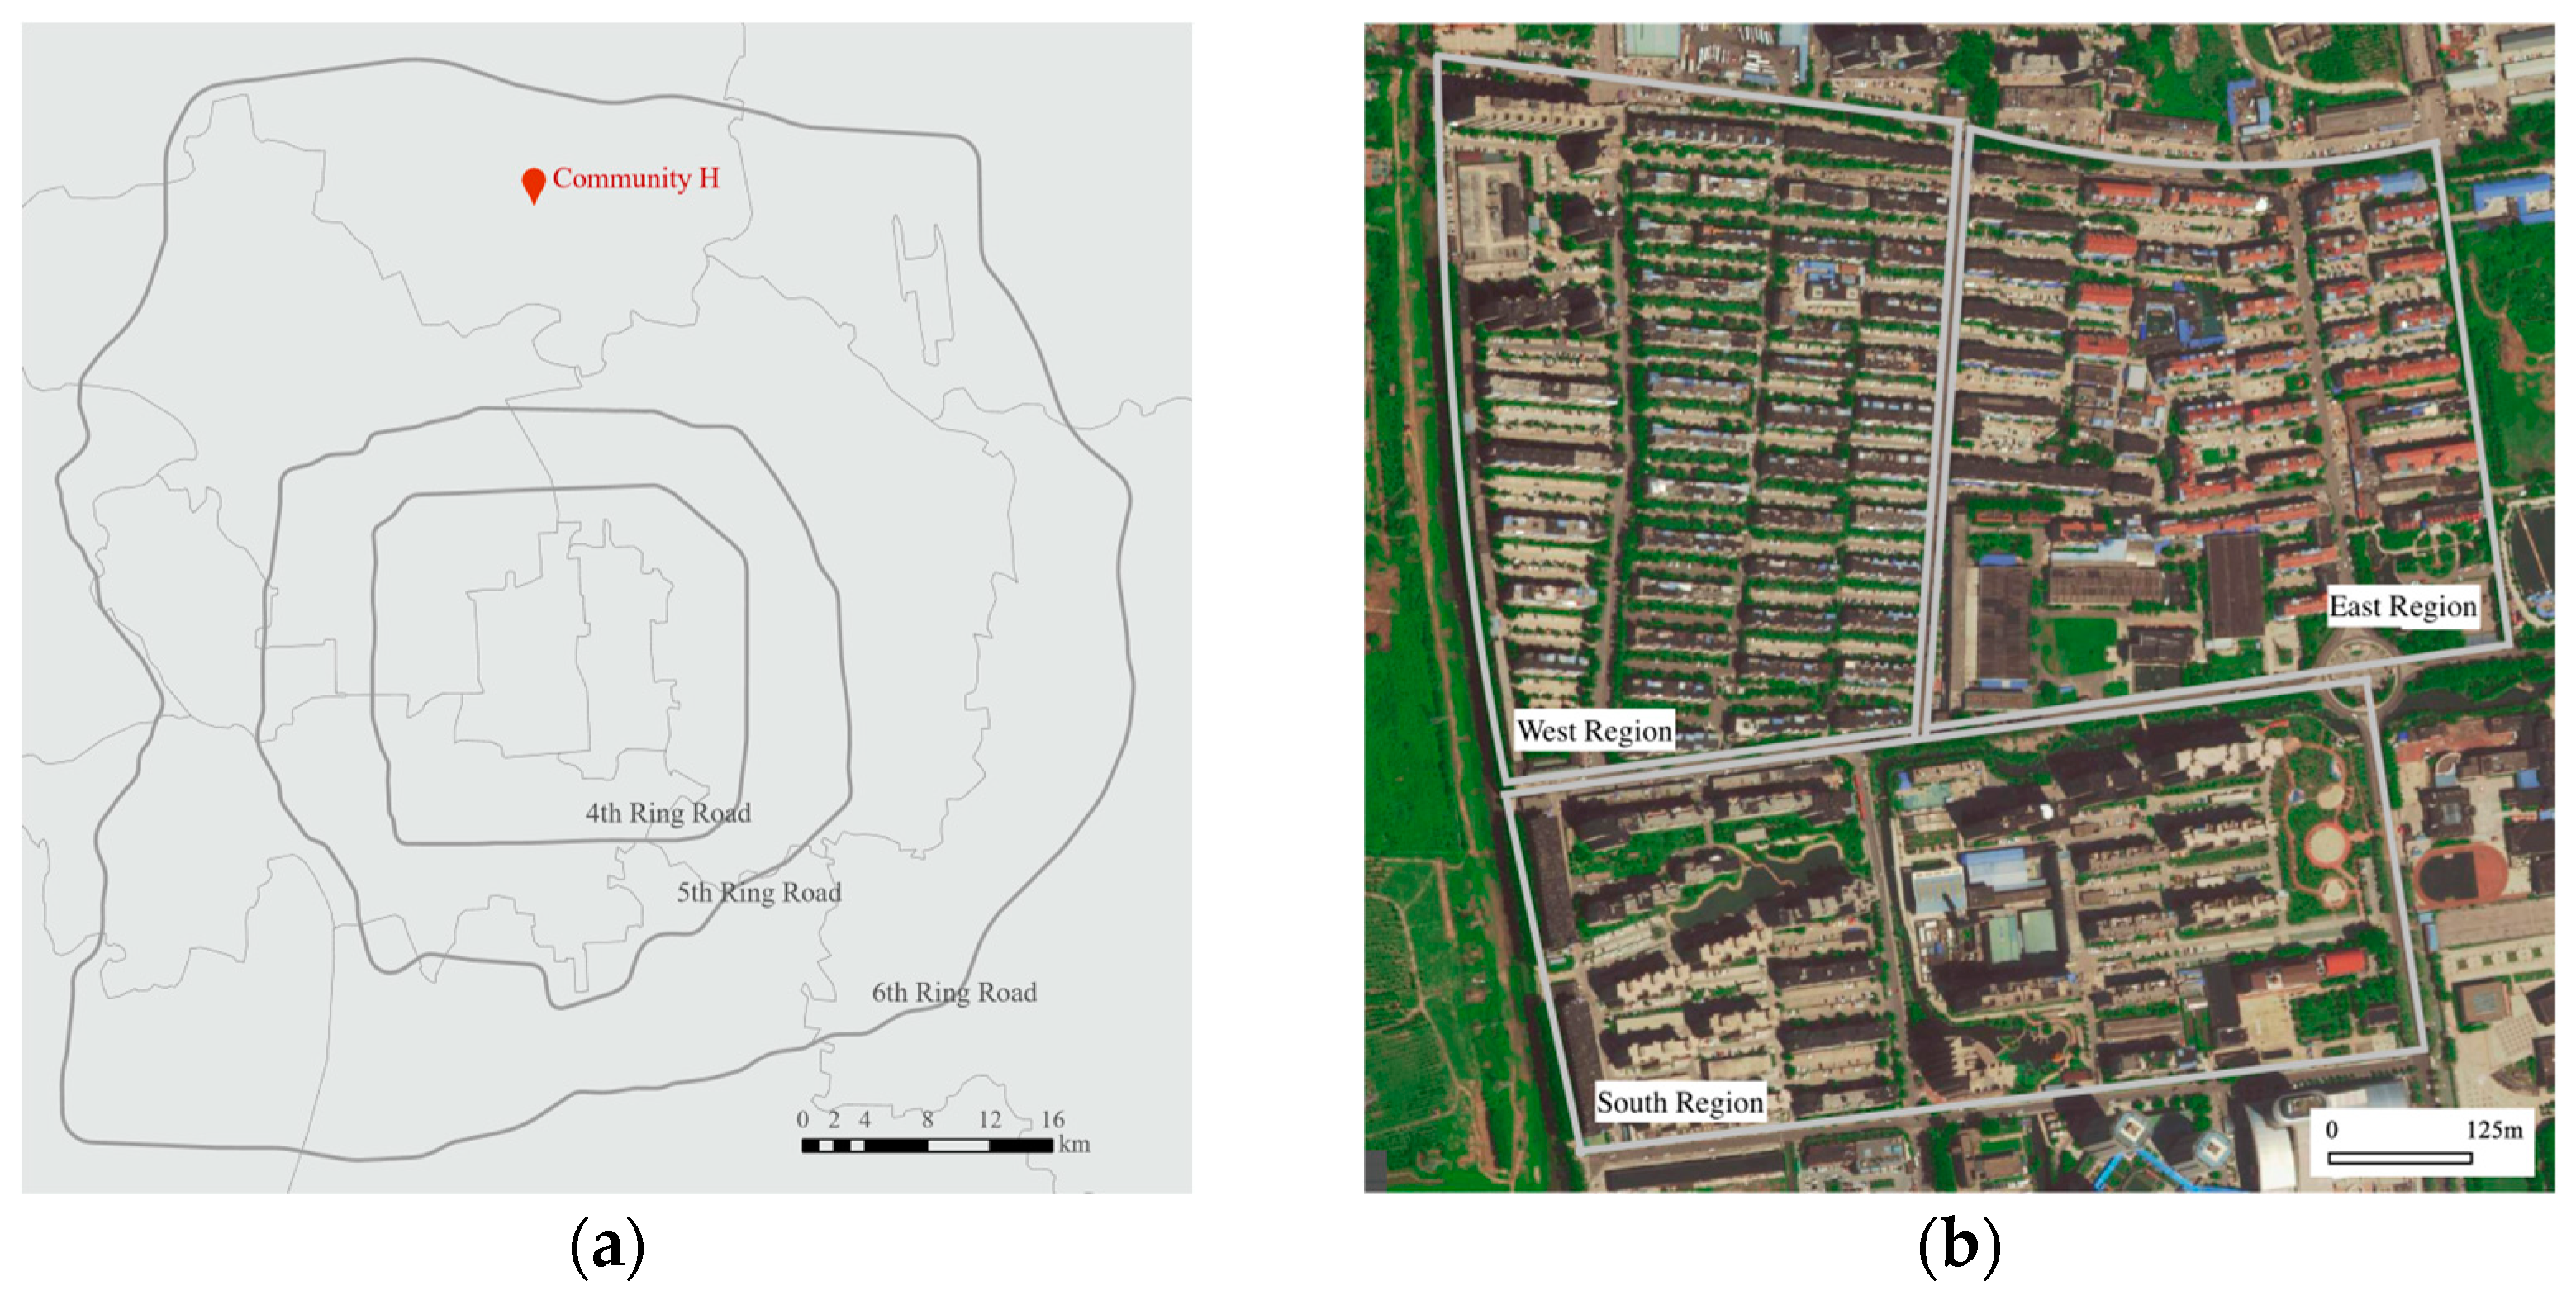
Community H is located in the northern suburb of Beijing. The community was built 20 years ago, covering an area of over 500,000 square meters, with about 10,000 households. It has three neighborhoods: (1) the east district group, which is mainly the resettlement housing of the local villagers after demolition; (2) the west district group, which is affordable housing for employees of the colleges nearby; and (3) the southern district group, which is mainly for the general scattered house buyers.
The three neighborhoods have different demographic compositions. The east district is mainly inhabited by local residents, who were originally local farmer before this area was built into a new town. The residents share a medium education level, and their corresponding household income as well as environmental protection awareness and knowledge are at a medium level.
The west district provides affordable housing for staff working in a college nearby. The average education level is high, and the corresponding family income, environmental awareness and knowledge are relatively high.
The group in the southern district is mainly inhabited by retail house buyers, whose average education level is relatively low, and their household income, environmental awareness and knowledge are also low.
Figure 1a,b below are the map and remote satellite image map of Community H, respectively.
Actions were taken to promote garbage sorting in Community H early since 2001 [
34]. But with the construction of a “zero-waste city” launching officially in 2019 and many other policies released immediately after [
1], the promotion of garbage sorting became extraordinarily urgent.
There are two ways for residents to dispose of classified solid waste: door-to-door collection or fixed facilities. To encourage residents to sort their waste, communities can provide incentives for both types of recycling. Traditional individual collectors are the most common type of door-to-door collection, but face problems like the absence of formal ways to make appointments and a lack of transparent pricing standards, leading to bad experiences and feelings for the residents. The introduction of organized, professional recycling staff to provide door-to-door service to community residents could improve the situation. As for fixed garbage sorting facilities, community can provide a credit or cash reward to families for their initiative garbage sorting behavior, which can lead to an increase in garbage sorting participation.
In the context of the above background, our study designs three major categories and eight subdivided policy scenarios, as shown in
Table 1.
2.2. Technical Protocol
The study first conducts a background investigation on the development of urban waste management in China in micro-scope and a field experiment in Community H’s garbage sorting situation. Based on the result, eight simulation scenarios are then designed according to the actual situation of garbage classification that might occur in Community H. Scenarios are divided into three main categories: door-to-door recycling solutions only, fixed garbage sorting facilities only, and mixed scenarios. The three scenarios can also be subdivided according to the strength of policy incentives. Different scenarios correspond to different policy parameters. Details are listed in
Section 3.1.
An agent-based model is built to model the heterogeneity of households in different neighborhoods by combining the survey data and scenario parameters, engaging TPB. We redevelop the program using the Python language on the open-source program package Mesa based on Apache2.0 to improve the visualization function of the model [
38].
With the simulation result, two-dimensional and three-dimensional visualization are produced. Python matplotlib and pyecharts were used for two-dimensional visualization and chart visualization of the simulation results, and ArcGIS Pro was used to build three-dimensional building scenes in the study area for three-dimensional visualization.
Finally, the model simulation results are analyzed to evaluate the advantages and disadvantages of the eight policy scenarios.
2.3. ABM Algorithm Design
Agents are an entity that have an autonomous ability and can make decisions in the virtual environment. The algorithm takes the families living in the community as the simulated agent objects, sets the corresponding attributes and behaviors for the family agents, and constructs the overall community model for the management and control of the family agents. Then, it simulates the household garbage sorting behavior through the families’ decisions and the interactions between each other. The community can be regarded as a two-dimensional grid matrix, in which each grid point represents a class of agents in households, fixed garbage sorting facilities, and streets. In the model of the work carried out by Tong et al. [
34], the community is abstracted as a two-dimensional grid matrix of 101 × 101, which is divided into three groups: the west, east and south districts. There are streets between the three regions, and fixed garbage sorting facilities are set in the groups and on the roads. The agents in the model, the families, are distributed as grids in these three groups.
The attributes and behaviors of the household agents are designed as
Figure 2a. It should be noted that attributes of the agents such as family size, education level and income level are all connected to their belonging regions. The household’s environmental awareness is connected to their education level.
There are several assumptions:
Assume that families produce a certain amount of garbage every day. When the current amount of garbage is greater than the maximum amount of garbage the family can accommodate, the family will make the choice to dispose of the garbage;
Assume that families will consider various factors and choose the most effective way to dispose of garbage. They take time (related to their distance to the nearest garbage sorting facility) and money (related to the monetary award of certain policies) into consideration;
Assume that there is a social activity every Monday. In the social activity, families will learn about the garbage disposal methods of other families in their social circle and make a basic judgment on the social norms of garbage recycling that week, which will influence their decision making.
Figure 2b is an overview of the TPB model of families to decide their garbage disposal action. Personal factors (e.g., available time, income, pro-environmental awareness, recycling knowledge), external incentives (e.g., economic and non-economic reward and punishment) and social norm (the recycling rate in the family’s social circle) work together in influencing the household’s garbage disposal intention. Besides the household’s intention, their behaviors are also connected to their perceived behavioral controls.
In the running process, once the household’s stocked garbage reaches an upper limit, the household should choose a garbage disposal method. The family’s choice will change over time until the system reaches a stable state, and the garbage disposal behavior of each family no longer changes; at this time, the operation will end. The mainline flow of the model is shown in
Figure 2c.
2.4. Spatial Mapping Algorithm between Two-Dimensional Raster and Three-Dimensional Scene
In the study, the abstract from the real three-dimensional scene to the two-dimensional raster agent and the mapping from the two-dimensional raster simulation results to the three-dimensional building scene were carried out. The following three spatialization principles should be considered.
Firstly, the corresponding rationality of the number and topological relationship between households and recycling facilities before and after abstraction should be considered. According to the statistical survey, there are about 10,000 households living in Community H, including about 3200 households in both the western and eastern districts and about 3500 households in the southern districts. In the model, we set the households of each district in the three groups shown in
Figure 3. The number of households in the west, east and south districts are 3249, 3249, and 3533, respectively, which is consistent with the statistical results. The garbage collection facilities in the model are also similar to those in reality, with 6 set up, located at (50, 0), (15, 15), (85, 20), (15, 65), (5, 70) and (80, 95). Two of them are located on the streets that divide the group, one is located in the west, one is located in the east, and two are located in the south. All of them are consistent with the topological relationship of the real scene.
Secondly, the correspondence between the actual geographical distance and the abstract grid point distance should be considered. From a microscopic perspective, it is unreasonable to lay the residents of a building on a two-dimensional plane and measure the two-dimensional distance. However, the concept of “distance” in the model is in fact only used to calculate the time it takes to dispose of garbage, which is the distance from the household to the garbage collection facility. From such a macro perspective, using a two-dimensional grid distance to simulate the distance between households and recycling facilities is statistically reasonable.
Finally, 117 3D building models of Community H are reconstructed according to the satellite image and surveying data. The spatial mapping from the two-dimensional raster to the three-dimensional model is proposed. In 3D visualization, it is necessary to invert the prediction results of the two-dimensional raster matrix back to each 3D building. The idea of inversion is to subdivide each group into buildings and try to ensure the rationality of the division of the location of the buildings and the number of residents. Therefore, a unique mapping logic is designed for the distribution of buildings. Finally, the garbage recycling participation rate of households in 117 buildings is counted and colored.
To popularize the research for college students or general public, a spatial-temporal dynamic 3D system was developed based on ArcGIS and Python.
4. Discussion
According to the simulation results of scenario 1 (door-to-door recycling participation rate of 22%) and scenario 2 (door-to-door recycling participation rate of 34%), it can be found that the stronger the incentive of the door-to-door recycling policy, the more households choose door-to-door recycling. At the same time, it can be seen that under the same door-to-door recycling policy incentives, the distribution of households in each group choosing door-to-door recycling is spread relatively similarly around the average, indicating that the driving effect of this policy incentive on families is not related to geographical location. Therefore, door-to-door recycling can be a good choice for the households that either face difficulties accessing the disposal facilities or do not have enough time to dispose of their waste in person.
According to the simulation results of scenario 3 (facilities participation rate of 18%), scenario 4 (facilities participation rate of 26%), and scenario 5 (facilities participation rate of 57%), it can be found that the stronger the incentive of a fixed facilities policy, the more households choose to throw their garbage in fixed facilities. At the same time, under the same fixed facilities’ delivery policy incentives, the distribution of families choosing fixed facilities delivery is not spread equally, and a higher proportion of families near fixed facilities choose fixed facilities delivery. This is because for the household that is closer to the fixed facilities it takes less time to dump trash, and they benefit more from the same incentives than those that are farther away.
It can also be found from the above scenarios that the composition structure of recycling methods chosen by households in different groups is quite different. The participation rate of garbage sorting and recycling of the west region is higher than that of the east region, and that of the east region is higher than that of the south region. This is caused by the obvious differences in education level among the three groups. Families with a higher education level tend to have stronger environmental awareness and richer environmental knowledge, so families with higher education level tend to participate more actively in garbage recycling activities. The same result was obtained in research conducted in Ujjain, India, emphasizing the need of educational interventions and involvement of women’s self-help groups [
40].
According to the comparison of simulation results between scenario 1 (door-to-door recycling participation rate of 22%) and scenario 6 (door-to-door recycling participation rate of 27%), it can be found that although the door-to-door recycling method in scenario 6 has the same incentive as scenario 1, the door-to-door recycling participation rate is higher than scenario 1. This is because the factors affecting families are not only their internal costs and external incentives, but also the influence of the social environment. In the social interaction process, families can understand the garbage dumping behavior of other families in the social circle. If a large number of families around them are conducting garbage classification and recycling, they will also be affected and carry out garbage classification and recycling [
41]. It is found in a program in Makassar city that the involvement of existing neighborhood association leaders is an important factor for encouraging community residents to participate in recycling activities, as they can influence the social norms among residents through social interactions [
42]. It has also been found that people’s pro-environment attitudes are related to the environment status [
30], indicating that with more households taking part in the recycling program, the outcomes for the environment can improve, and households can have a stronger pro-environmental attitude. Furthermore, the community can promote the social activities of families through some activities, encouraging residents to interact more with families that actively participate in garbage classification. These model families can take the lead in guiding other families to participate in recycling garbage, thus improving the participation rate of the whole community. Dai et al. [
43] suggests taking different approaches according to residences who are close to or separated from local community, e.g., block leaders taking part in the doorstepping propaganda or only “outsiders” as door steppers.
Due to increasing labor costs and environmental protection standards, the traditional informal urban recycling system based on door-to-door collection has encountered difficulties keeping a high recycling rate for household-generated recyclable waste, especially for low value materials, such as glasses, plastics, and so on. Therefore, the transformation of the waste recycling industry is of great significance for environmental protection [
4]. This transformation process cannot be separated from two aspects of policy support. First of all, considering the incentives of the two recycling methods for residents, it is necessary to ensure that the incentive of recycling methods after transformation and upgrading is greater than that of traditional individual collectors. This includes economic incentives and time costs. The appointment channel should be open and easy to use when setting up professional recyclers and should provide a high economic compensation. In addition, the community should restrict the traditional waste recyclers, or conduct unified training management, and let them join the organization of door-to-door recycling specialists, so as to transform the waste recycling industry from the root. Botti et al. [
44] put forward that door-to-door recycling should be well designed and managed, for the well-being of the recyclers as well as the environment. In Brazil the National Solid Waste Policy standardized and affirmed the existence of the scavengers [
45] and also confirmed this belief.
The effect of punitive measures is also significant. In the absence of penalties for wrongful disposal, residents tended to drop their waste at fixed facilities, while when penalties were imposed, a large number of residents turned to door-to-door recycling. Therefore, the community can take certain punishment measures for the residents who mistakenly dispose of their garbage, which can effectively prevent the occurrence of wrongly sorted garbage being sent to fixed recycling facilities, and can also improve the participation rate of garbage recycling. The community can choose two ways to check which family is performing the classification correctly. One is setting up recyclers to check whether the garbage classification is correct while standing next to the garbage disposal facilities. Another is producing garbage bags with special QR codes for each family respectively, allowing recyclers to check if the sorting is correct when they open the bag.
With the assumptions that families’ utilities are influenced by their distance to the nearest garbage sorting facility and families’ environmental awareness relies on their education level, we can make the following deductions. When designing the location of fixed facilities, the community should try to ensure that the radiation range of each recycling facility is distributed as evenly as possible. At the same time, a cost–benefit analysis should be performed to select the appropriate number of fixed facilities. Also, the publicity of environmental protection knowledge in the community can enrich the general knowledge of environmental protection among the residents, improving the average awareness of environmental protection, and thus increase the participation rate of garbage recycling.
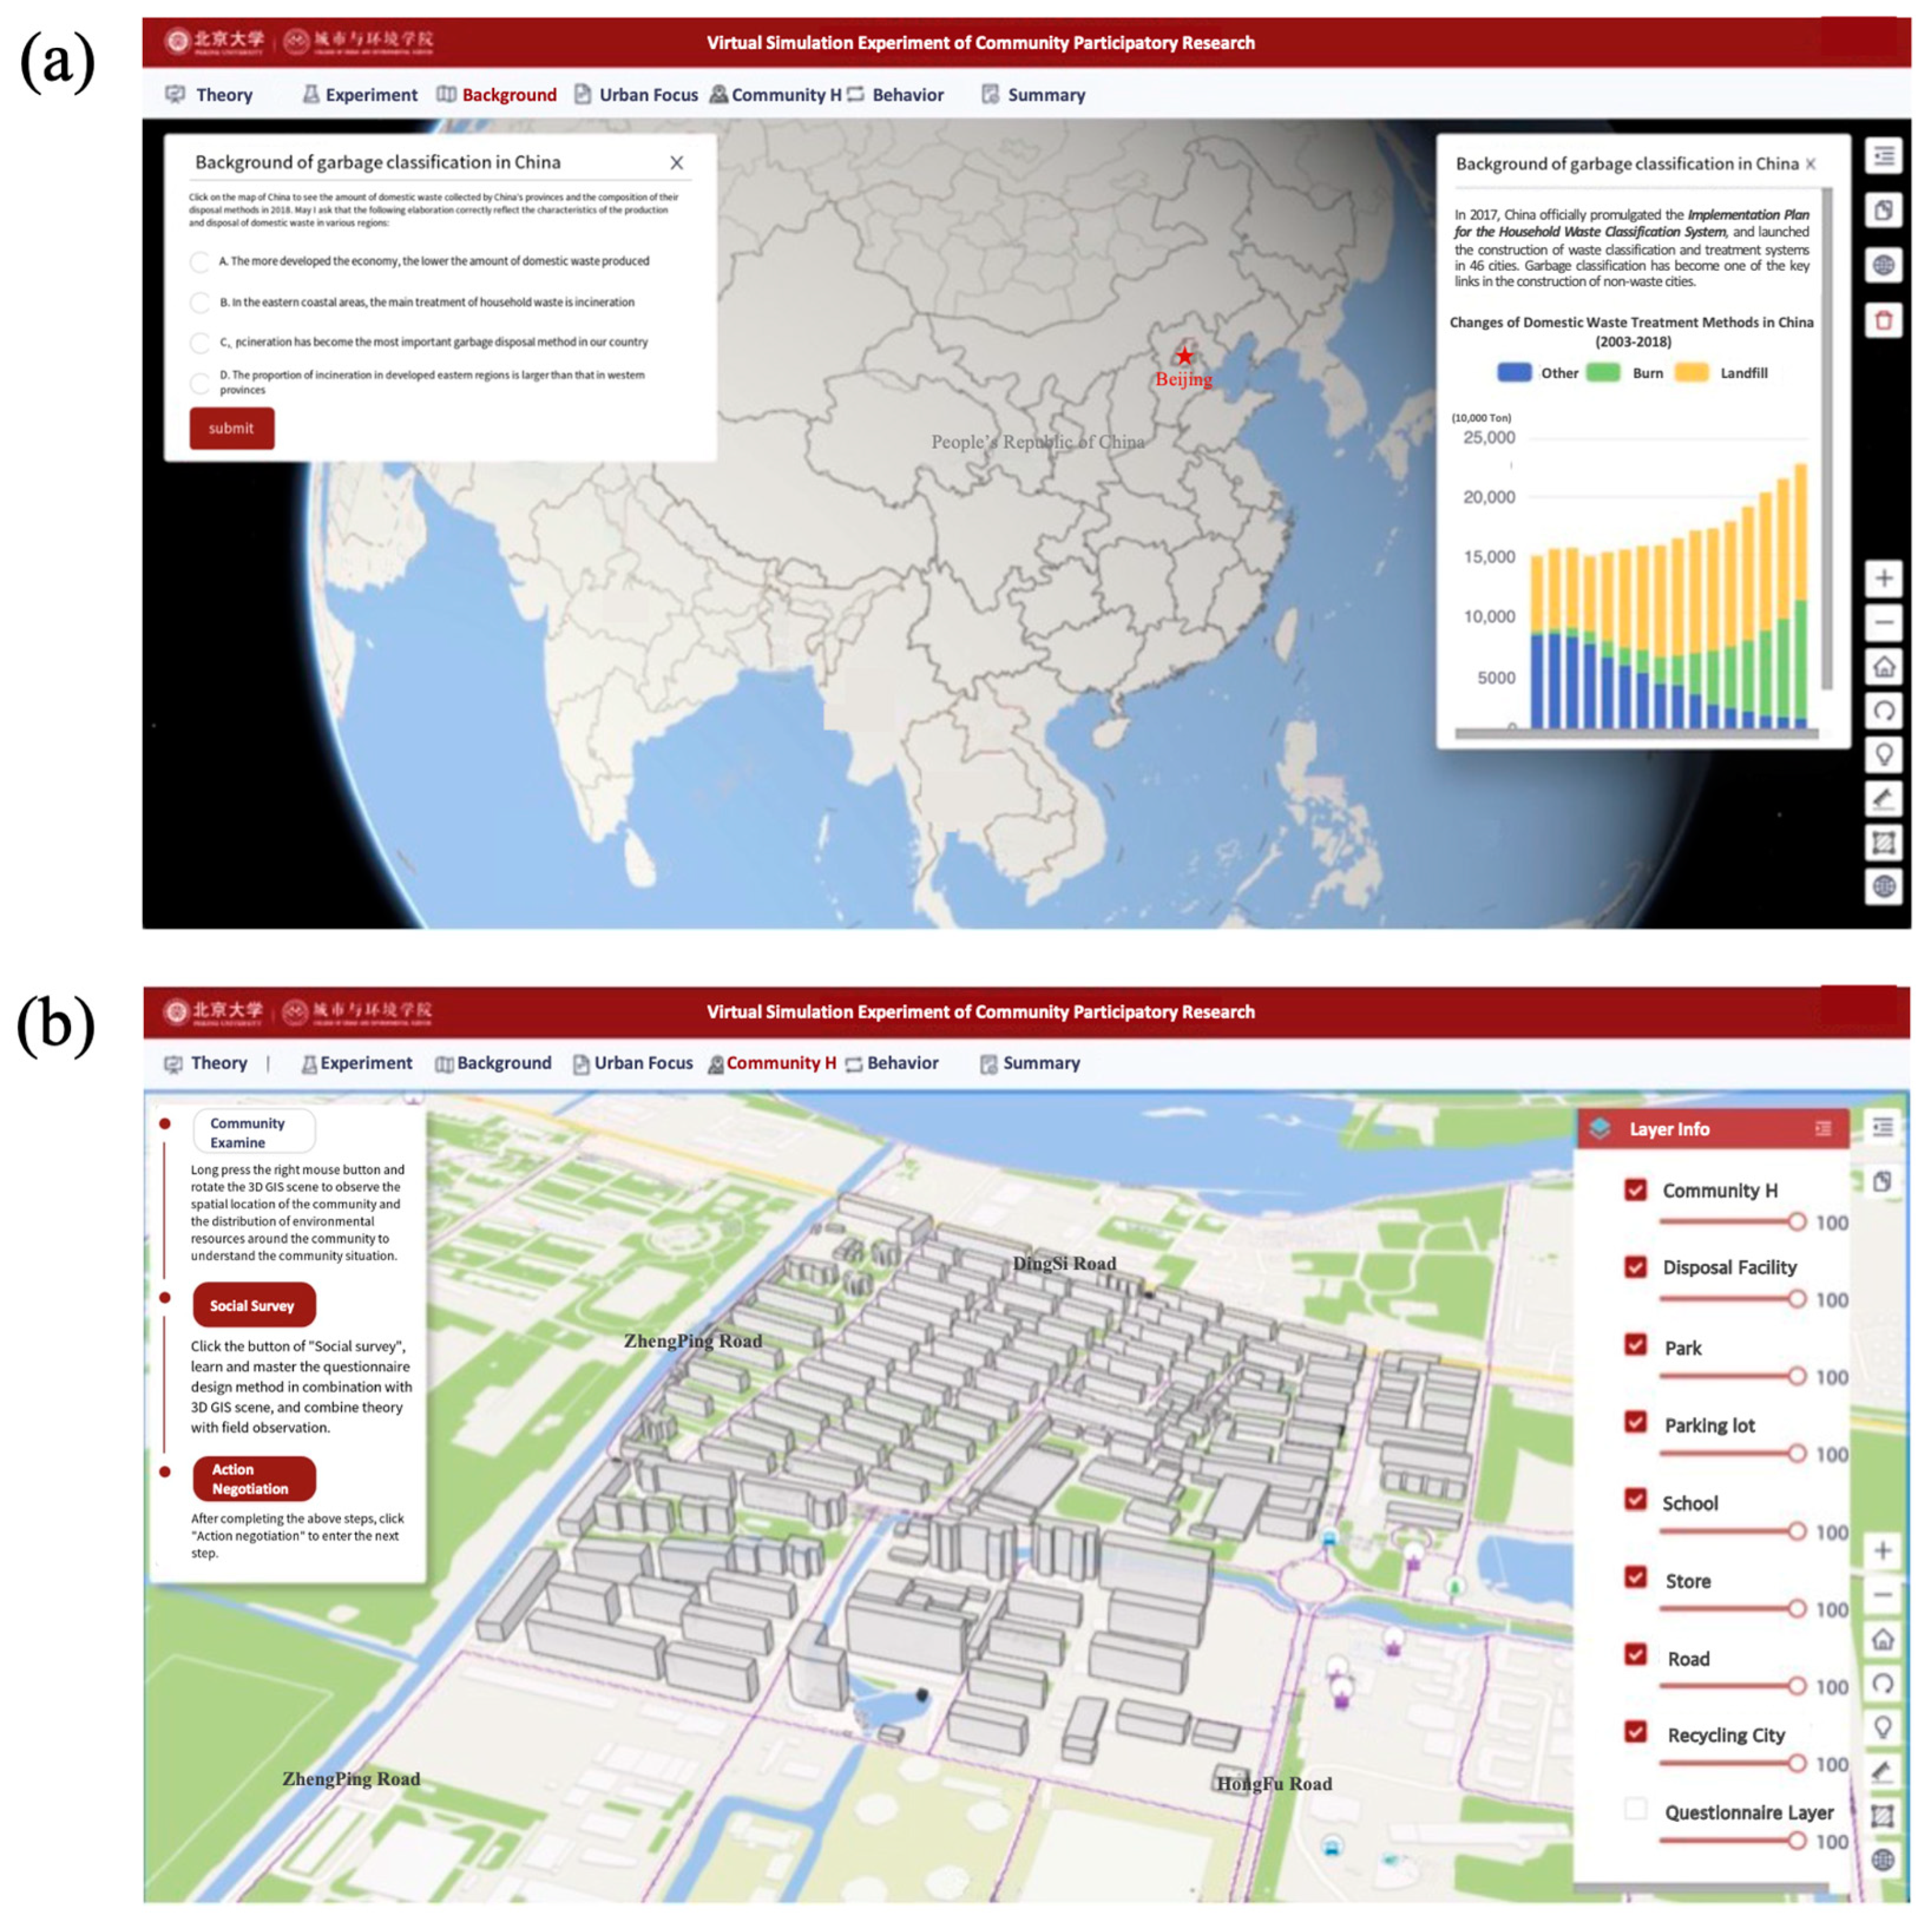
The online teaching platform equipped with this model (
http://geography.pku.edu.cn:8080/pkuPartCommunity/llxx.html (accessed on 24 June 2023)) is used by students mostly from Peking University. Students can log into the simulation platform to learn the theoretical background and community overview, adjust various factors in the simulation experiment, select different policy scenarios, and finally return the corresponding simulation results, as shown in
Appendix A,
Figure A1. Students can participate in the whole process interactively, which helps them understand the factors that influence the agent’s behavior under different scenarios. The teaching platform is connected to the Chinese National Virtual Reality Experimental Teaching Shared Platform and has been highly rated [
46].
5. Conclusions
The participation rate of residents is critical in the implementation of garbage sorting policies in today’s communities. We take Community H in northern suburb Beijing as an example, to simulate the community household behavior of garbage classification and recycling under different policy scenarios that are prevalent in Chinese cities since 2019. This is done to analyze the effectiveness of community garbage classification policies while regarding the heterogeneity of urban communities in contemporary China. To facilitate the dialogue between the researchers and policy practitioners, we developed a visualization method at the community level to effectively compare the impacts of different policy scenarios.
Under the circumstance that the community has a transformed door-to-door recycling specialist for waste recycling services, and also sets up fixed facilities for garbage sorting, giving cash rewards to families with correct sorting, and taking punitive measures for families with incorrect sorting, the participation rate of garbage recycling in the community can reach 76%, which is an ideal rate of garbage sorting. The implementation of this policy is in line with the actual current situation of society, so it is worth promoting.
The shortcomings of the simulation algorithm and visualization research of community residents’ garbage classification behavior designed in this paper are as follows: (1) The model parameter setting is not rigorous enough. The setting of the model parameters mainly depends on the results of the previous community questionnaire survey and the hypothesis of the policy scenario. Without rigorous derivation, the rationality of the model cannot be proved. The lack of rigor is partly because the TPB theory is a conceptualized theory, which is difficult to explain rigorously when used in quantitative research; (2) There are still a lot of policy factors that have not been taken into account. Since it is difficult to quantify the effects of policy incentives on different people, it is difficult to measure the corresponding parameter changes of subtle policy factors. In the future, more detailed questionnaires can be used to include rich factors into the scope of the model. Although the results in this paper are consistent with logic and empirical cognition, the verification of real data is still lacking, and the unavailability of real data is also a major reason; and (3) This experiment mainly aims to simulate and evaluate the business model emerging in the community garbage classification in Beijing. As a result, it is indeed greatly affected by the local background. In the future, more incentive mechanisms from different countries can be included in the model.


