Abstract
The conversion of CO2 gas from the global emission to methanol can be a route to look at in addressing greenhouse gas (GHG) issues. Photocatalysis has been attracting attention in the conversion of CO2 to methanol, as it is seen to be one of the most viable, economic, and sustainable strategies. The biggest hindrance to the use of metal oxide photocatalysts was the poisoning by sulfur content in the CO2 gas feedstock. Therefore, in the development of photocatalysts using metal oxide-based additives, the metal needs to be in the form of metal sulfides to avoid catalyst poisoning due to the presence of H2S. The magnesium sulfide-based TiO2 (MgS-TiO2) photocatalyst has not been synthesized and studied for its photocatalytic potential. In this study, a novel MgS-TiO2 photocatalyst was synthesized using a combination of wet impregnation and hydrothermal method and characterized to determine the physical and chemical properties of the photocatalyst. Characterization results have shown the presence of MgS on the native TiO2 photocatalyst. The optimization of MgS-TiO2 formulation was conducted, wherein the MgS and TiO2 ratio of 0.5 wt % has been shown to give the highest methanol yield of 229.1 μmol/g·h. The photocatalytic parameter optimization results showed that temperature and catalyst loading were the most important factors that impacted the photocatalytic process. In contrast, reaction time had the least significant effect on the CO2 photocatalytic reduction to methanol. This concludes that the MgS-TiO2 photocatalyst has potential and can be used for the photocatalytic reduction of CO2 to methanol.
1. Introduction
In 1950, the world emitted six billion tons of CO2, and, by the year 1990, the CO2 emission had quadrupled, reaching more than twenty-two billion tons. Entering the 20th century, emissions have continued to grow rapidly to over 34 billion tons each year [1]. At the 2015 Paris Climate Conference and Conference of Parties (COP) 21, Malaysia pledged to reduce its CO2 emissions per unit of gross domestic product (GDP) by 45 percent from the 2005 level by 2030 [2]. Therefore, it is very crucial to explore feasible solutions to reduce GHG emissions, especially CO2, to a safer level. Another way to address CO2 emission is by converting it into higher value products. Among the chemicals that can be produced from CO2 are dimethyl ether (DME), dimethyl carbonate (DMC), polycarbonate, methanol, and urea [3].
Methanol is a liquid chemical used in thousands of everyday products, including plastics, paints, cosmetics, and fuels. More than 95 billion liters are produced worldwide, and methanol is the world’s most-shipped chemical commodity [4]. The conversion of CO2 gas from the global emission to methanol can be a route to look at in addressing the GHG issues. CO2 can be converted to methanol using various techniques, such as chemical, biological, electrochemical, reforming, and photochemical process [3]. Under the photochemical process, photocatalysis has been attracting the most attention in the conversion of CO2 to methanol, as it is seen to be the most viable, economic, and sustainable strategy. The photocatalytic CO2 reduction technology is an economical and sustainable solution to alleviate the concentration of atmospheric CO2 by which CO2 as a feedstock can be converted into value-added chemicals or fuels [5]. The photocatalytic CO2 reduction method converts CO2 to valuable products by using solar energy. It is a complex combination of photochemical and photophysical processes [6]. There are three factors that merit consideration in order to enhance the product yield for the photocatalysis process: photocatalyst choice, photoreactor design, and the optimization of experimental parameters [7].
Honda and Fujishima presented pioneering work in 1979 of photocatalytic water splitting on TiO2 electrodes, which has attracted widespread attention in clean, environmentally friendly, and economical processes [8]. Various semiconductor photocatalysts, including metal oxides, metal hydroxides, oxynitrides, sulfides and metal-free semiconductors, have been investigated [9,10]. Selection of the photocatalyst is a very crucial factor that determines the effectiveness of the photocatalytic process. Photocatalysis process can occur, depending on the band gap of the photocatalyst that will be able to absorb the light and generate the charge carrier. The wider the band gap, the lower the ability of the photocatalyst to absorb the light. The second factor that determines the effectiveness of the photocatalysis process is the redox potential of the desired products [11].
Among many semiconductors tested, TiO2 is the most promising, as it is chemically and biologically stable, light-activated, effective, inert, affordable, and cheap. The mechanism of the surface reactions over light-illuminated TiO2 are also well known [12]. The TiO2-based photocatalyst has been shown to have high potential in the photocatalytic conversion of CO2 to methanol [13,14,15,16,17]. However, the usage of TiO2 as photocatalyst has several setbacks. TiO2 has a wide band gap with lower efficiency towards light energy conversion. It also has a fast photoinduced electron–hole pair recombination rate that lowers the photocatalytic activity and has limited CO2 adsorption capacity [18]. Extensive study on TiO2 modification has been employed in various studies to overcome these weaknesses. Among the modifications to enhance the efficiency of TiO2 photocatalyst includes metal and non-metal doping, co-photocatalyst, semiconductor coupling, crystal and facet engineering, state-of-the-art morphologies, and novel structures [19].
Modification of TiO2 with the addition of metal doping has shown to be able to improve its photocatalytic performance under light radiation. Furthermore, the photocatalysts were able to be recycled up to five photocatalytic activity cycles [20]. Mg doping has received attention recently due to the ionic radius of Mg that was similar to Ti. Mg-containing TiO2 was reported to promote the energy position of the conduction band and increase in the amount of CO2 chemisorption in the presence of water, leading to an enhancement in the efficiency of the catalyst. Enhancement of photogenerated charge separation is possible in isomorphically substituted Mg-doped TiO2. Because the difference in the formal charge of Mg2+ and Ti4+ obliges the creation of oxygen vacancies, these vacancies can serve as traps for photogenerated electrons on the photocatalyst surface [21].
The biggest hindrance to the use of metal oxide catalyst was the poisoning by sulfur content in the gas feedstock. The CO2 from the natural gas source would contain H2S that would poison the catalyst and reduce activity. In the development of photocatalyst using metal oxide-based additive, the metal needs to be in the form of metal sulfides to avoid the catalyst from being poisoned by H2S in the CO2 gas feedstock [22]. Relatively, metal sulfides have higher conductive bands than many of the metal oxide semiconductors, resulting in unique light absorption ability [3]. Since the photocatalyst is already in the metal sulfide form, the presence of H2S will not affect its activity, as the H2S gas cannot react with the photocatalyst in its sulfide state. Hence, metal sulfides are suitable for photocatalysis and photoreduction of CO2 to hydrocarbon fuels.
Therefore, in this study, a novel alkaline metal sulfide (MgS), added to the TiO2 photocatalyst, was synthesized using a simplified method through the combination of wet impregnation method and hydrothermal reaction method. The photocatalyst was characterized to determine its physical and chemical properties. The potential of MgS-TiO2 for the photocatalytic conversion of CO2 to methanol was determined. The optimum photocatalytic operating parameters for the conversion of CO2 to methanol using MgS-TiO2 was also identified.
2. Materials and Methods
2.1. Materials
Titanium oxide anatase powder, TiO2 (99.7%), sodium thiosulphate anhydrous, Na2S2O3·5H2O (99.5%), and N-methyldiethanolamine, MDEA (98%) were purchased from Sigma-Aldrich. Magnesium nitrate hexahydrate, Mg(NO3)2·6H2O (99.5%), and ethanol, C2H5OH (95%) were purchased from R&M Chemicals. CO2, argon, and hydrogen (99.9995%) were purchased from Air Liquide Gases. All chemicals were of analytical grade and used without further purification.
2.2. Synthesis of MgS-TiO2
A series of MgS-TiO2 photocatalysts were prepared using a combination of wet impregnation method in aqueous solution followed by the hydrothermal reaction method. In this study, the amount of Mg loaded onto TiO2 was investigated in the range from 0.10 to 1.00 wt %. The TiO2 anatase powder was dispersed in the ethanolic solution (3:1) to form slurry solution. Then, premeasured amounts of Mg(NO3)2·6H2O and Na2S2O3·5H2O were dissolved in ethanolic solution and stirred for 15 min. The mixed solution was then added to the TiO2 dispersed solution and stirred for another 15 min. The mixture was added dropwise into 200 mL ethanolic solution that was placed in an ultrasonic bath set to 60 °C and sonicated for 1 h. The sonicated solution was placed into stainless-steel Teflon-coated hydrothermal reactor and placed in oven at 150 °C for 12 h. The photocatalyst synthesized was centrifuged at 4000 rpm for 15 min and washed thoroughly with water. The photocatalyst was dried in the oven at 70 °C for overnight to remove any excess water. Finally, the photocatalyst was calcined in air at 400 °C for 4 h with the ramping rate of 1 °C/min to activate the uncalcined photocatalyst. MgS-0 did not contain any MgS and only TiO2. MgS-1 was doped with 0.1 wt % of MgS on TiO2, MgS-2 with 0.5 wt %, and MgS-3 with 1 wt % of MgS.
2.3. Characterization
Solid-state UV-vis diffuse absorbance spectra were obtained from a Shimadzu 2600 UV/Vis-NIR spectrophotometer, equipped with an integrated sphere in the wavelength range of 200–800 nm, using BaSO4 as a reflecting standard. The actual amount of Mg and S doped in MgS–TiO2 samples was analyzed by inductively coupled plasma optical emission spectrophotometer (ICP-OES) Perkin Elmer (AVIO 500 Max). The various samples were mixed with HNO3 for digestion, followed by the addition of deionized HPLC grade water. The morphology information of the MgS-TiO2 photocatalysts was determined using field emission scanning electron microscopy (FESEM) (Hitachi SU8020). The samples were coated with a layer of platinum prior to scanning at 50 kX magnification. Energy-dispersive X-ray spectroscopy (EDX) (Hitachi TM3000) was used to determine the elemental mapping of the photocatalyst. Three (3) areas for each sample were chosen, and the elements’ concentrations were measured in triplicates. The average results of the triplicate measurements were then reported. For Fourier transform infrared spectroscopy (FTIR), the IR spectrum was collected by scanning the sample from 4000 to 400 cm−1 in the transmission mode using a Perkin Elmer spectrophotometer (Spectrum 3). The resulting FTIR spectra were used to analyze and identify the functional groups present in the photocatalyst. The effect of incorporating Mg onto the crystal structure of TiO2 was analyzed using powder XRD (Shimadzu 7000) conducted with CuKα radiation (40 kV, 40 mA) at 2θ angles from 2° to 80° and a scan speed of 4°/min. This technique was used to identify the type of TiO2 phases and Mg species present. N2 adsorption–desorption analysis was performed on ASAP 2020 V4.02 at 77 K. The samples were degassed at 423 K and 10−6 Torr. The Brunauer–Emmett–Taller (BET)-specific surface area was calculated using the adsorption branch of the isotherms. The pore size distributions were determined by the Barret–Joyner–Halenda (BJH) method, applying the desorption branch. The microporosity was assessed from t-plot construction using the Harkins–Jura correlation. X-ray photoelectron spectroscopy study was performed using a Thermo Scientific K-Alpha XPS spectrometer equipped with a monochromator aluminum source (Al Kα radiation hν = 1486.7 eV). The instrument was operated at 15 kV and 20 mA with short scan pass energy of 50 eV.
2.4. Photocatalytic Experimental Set-Up
The photocatalytic reduction of CO2 to methanol was performed in a closed glass-quartz reactor of 330 mL capacity volume. The experimental setup was equipped with a gas inlet, outlet, gas sampling port, and a liquid sampling port (Figure 1).
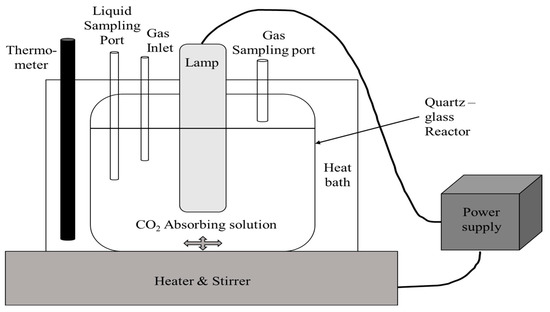
Figure 1.
Photocatalytic experimental set-up.
An amount of 3 g of the photocatalyst was dispersed in 300 mL of CO2 absorbing solution (40% MDEA aqueous solution) and ultrasonicated for 10 min to ensure homogeneous dispersion. The mixture was purged with argon to remove any dissolved gases followed by CO2 purging for the required time to obtain the CO2 saturated reaction mixture. The photocatalytic system was illuminated internally by a SOBO UVC-9W double lamp, 250 nm, and intensity of 3 mW/cm2. A small aliquot of liquid sample was taken out at a regular time interval in the range of 1 to 24 h and analyzed. A gas chromatograph, Agilent Model 6890, equipped with headspace sampler and flame ionization detector (GCFID), was used to determine the methanol concentration. Four samples with different MgS doping concentration were tested in the photocatalytic activity experiment. The photocatalytic activity experiment was conducted using 1% photocatalyst loaded into the CO2-absorbing solution (MDEA), which was illuminated with light for a continuous period of 3 h. At the end of the 3 h, the liquid portion was sampled and analyzed using GC-FID to determine the methanol concentration. To ascertain that the formed products originated from the photoreduction of CO2, a blank experiment that was UV-illuminated in the absence of both CO2 and the catalyst was performed in a preconditioned reactor.
2.5. Optimization of Photocatalytic Parameters
An experimental method was designed using three-variable (coded as X1, X2, and X3), central composite design (CCD), coupled with response surface methodology (RSM) to optimize interactions between temperature of reaction, catalyst loading, and reaction time, and a total of 18 runs were used for this study. For the independent variables temperature of reaction (X1, 30–50 °C), catalyst loading (X2, 0.4–2%), and reaction time (X3, 3–6 h), the dependent variable of methanol yield (Y, µmol/g·h) was modelled using Design-Expert, version 6.0.6. (State-Ease, Inc., Minneapolis, MN, USA). Statistical analysis of the model was performed using analysis of variance (ANOVA) with a 95% confidence level. Coefficient of determination (R2), F-test, and p-value were used to test the statistical significance of models. Regression analysis was performed and fit using the following empirical second-order polynomial model for experimental data (Equation (1)):
3. Results and Discussion
3.1. Characterization of MgS-TiO2
The bandgap energy shifting characteristics of MgS-TiO2 photocatalyst was investigated using ultraviolet-visible (UV-vis) spectrophotometer, and the results obtained were compared with pure TiO2, as depicted in Figure 2. The band gap energies of all samples were obtained from the Tauc plot by extrapolating a tangent line to the abscissa axis [23]. It can be observed that the absorption edge of the TiO2, MgS-1, and MgS-3 was 425 nm, with the band gap energy value calculated to be 2.91 eV. There was no noticeable shift in the spectra after the addition of MgS-1 and MgS-3, suggesting that Mg doping does not influence the band gap of TiO2. A similar finding was also observed in a previous Mg-doped TiO2 study, where the doping of Mg did not alter the band energy gap of TiO2 significantly [21]. However, for MgS-2, it was seen that the absorption edge is slightly shifted to a higher wavelength of 430 nm that resulted in lower band gap energy of 2.88 eV.
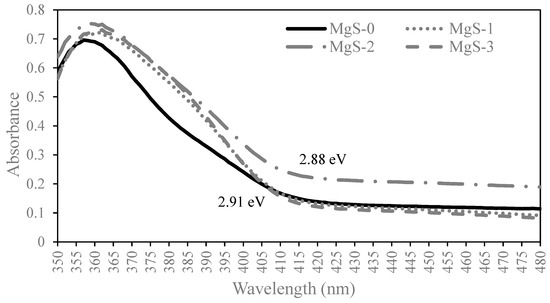
Figure 2.
UV-Vis Absorbance Spectrum for MgS-0, MgS-1, MgS-2 and MgS-3.
The compositional analysis of the photocatalyst was conducted using ICP-OES. The analysis results are indicated in Table 1. The ICP-OES analysis showed that MgS-0 was not detected with Mg or S and confirmed the presence of Mg and S in MgS-1, MgS-2 and MgS-3. The results showed that the Mg and S content increases with the increase in the photocatalyst doping for both elements. The concentrations of Mg in MgS-1, MgS-2, and MgS-3 were lower than the doping concentration, as not all the Mg has been incorporated onto the TiO2 base photocatalyst. The hydrothermal reaction during the synthesis process has increased the ability of the S compound to be incorporated onto the TiO2 more effectively, hence showing higher concentration of S compared to Mg. This confirms that Mg and S have been incorporated into the base TiO2 photocatalyst that has been synthesized.

Table 1.
ICP-OES analysis results.
The FESEM image was used to determine the morphology of MgS-TiO2 photocatalyst. The growth of mixed and agglomerated spherical shaped particles of MgS-doped TiO2 can be clearly seen in Figure 3. FESEM images indicate that TiO2 and MgS-TiO2 photocatalyst have similar morphology of spherical shape, and the addition of MgS onto the TiO2 did not change the morphological structure of the base TiO2 photocatalyst.
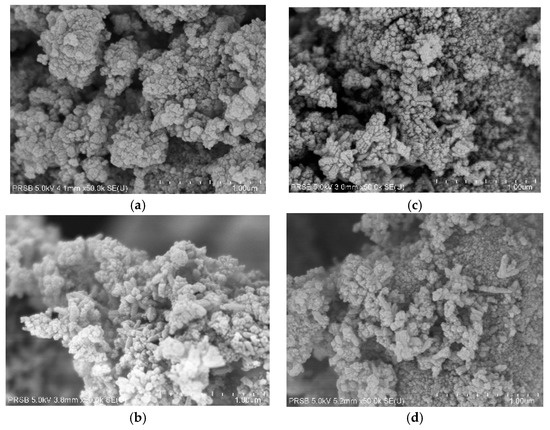
Figure 3.
FESEM with 50 kX magnification for (a) MgS-0, (b) MgS-1, (c) MgS-2, and (d) MgS-3.
Figure 4 displays the results of the EDX analysis, while Figure 5 shows the EDX mapping and location for each element (O, Mg, S, Ti) for MgS-2. EDX analysis was able to detect the composition of Ti and O in all the samples. The Mg was detected in MgS-1, MgS-2, and MgS-3. The S content was only able to be detected in MgS-2 and MgS-3. The S in MgS-1 was not able to be detected, as the content was under the detection limit of EDX. It can be seen from the EDX results that the Mg and S compositions of MgS-2 are higher compared to MgS-3, even though the doping of MgS in MgS-2 was lower than MgS-3. There was a difference in the compositional analysis between ICP-OES and EDX. This was due to the analysis of ICP-OES, which was based on the total composition of the photocatalyst sample, whereas the EDX compositional analysis was based on the content of the surface morphology of the area under investigation.
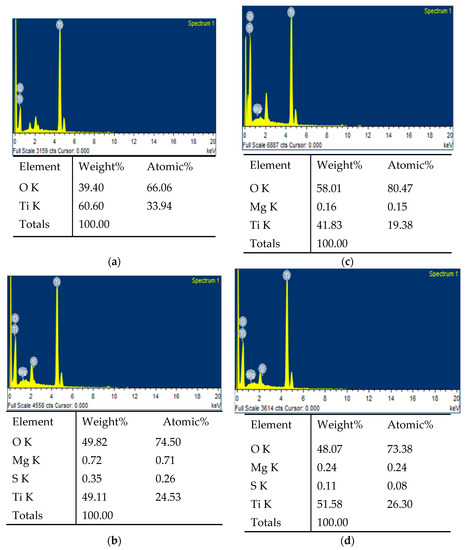
Figure 4.
EDX analysis for (a) MgS-0, (b) MgS-1, (c) MgS-2, and (d) MgS-3.

Figure 5.
EDX mapping and location for MgS-2 for each element (O, Mg, S, and Ti).
FTIR scan was measured in the range of 400 to 4000 cm−1 to confirm the presence of MgS that has been added onto TiO2. The FTIR spectra for TiO2 and MgS-TiO2 are shown in Figure 6. Both samples exhibit peaks at 1650 and 3450 cm−1, corresponding to O-H stretching and bending. An absorption band between 400 and 1000 cm−1 was attributed to Ti-O stretching vibrations, where the same absorption band correlation was found in the study by Yee et al. (2017) [20]. MgS-TiO2 showed a significant decrease in the transmittance peak compared to TiO2 within 1000–2300 cm−1 wavelength range. The FTIR spectrum of MgS-TiO2 showed strong absorption peaks around 440 and 550 cm−1 for the stretching mode of vibration of the MgS structure. This confirmed the presence of MgS in the TiO2 photocatalyst that has been synthesized. The wavelength number of the vibrational peaks for MgS-TiO2 agreed with the previous reported literature values [24].
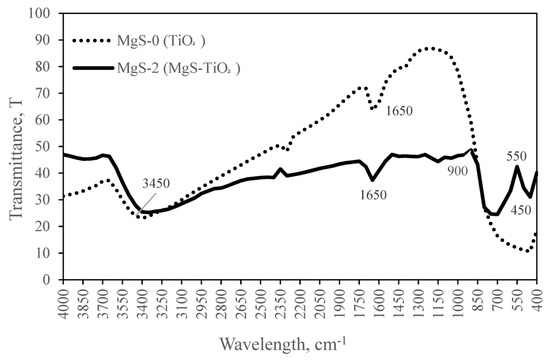
Figure 6.
FTIR analysis of the MgS-0 and MgS-2 photocatalysts performed in the range of 400–4000 cm−1.
XRD patterns were recorded to determine crystalline structure and phase compositions. Figure 7 shows the XRD patterns of the MgS-0 (TiO2) and MgS-2 (MgS-TiO2) photocatalysts. The XRD pattern of MgS-0 and MgS-2 indicated increased peak intensity of the crystalline phase distribution. This crystalline structure is apparently stable and can enhance photocatalytic activities [25]. The diffractogram of MgS-2 differs from the pure MgS-0 (TiO2), and it shows band broadening with decreased peak intensity. The diffraction peaks in the XRD pattern around 2θ of 25.32°, 38.04°, 48.16°, 62.76°, 69.08°, and 75.1°, which can be associated with the (A101), (A004), (A105), (A204), (A116), and (A215) crystal planes of anatase-phase TiO2. The samples exhibit similar XRD curves for both samples, and all the diffraction peaks can be indexed to the TiO2 anatase powder that is being used for the synthesis. For MgS-2, the TiO2 crystals in the form of rutile were found at around 27.42° (R110), 36.12° (R200), 41.28° (R111), and 54.0° (R220) [26]. The XRD analysis of MgS-2 revealed that the anatase phase accounted for 31% of the sample, whereas the rutile phase accounted for 18%. This shows that the synthesis process of incorporating the MgS onto the TiO2 anatase based catalyst caused some of the anatase phase to change to rutile phase during the calcination process. For MgS-2, there are no characteristic diffraction peaks of MgS, probably owing to its low content and high dispersity. Simultaneously, the XRD peak position of TiO2-loaded MgS shows small changes to some extent, suggesting that MgS ions did not incorporate into the TiO2 lattice and only loaded on the surface of TiO2. X-ray spectroscopy is a very useful technique to analyze the surface nature and composition of solids, and, in the present work, this would confirm that MgS is mainly on the surface of TiO2, without being incorporated into the TiO2 lattice.
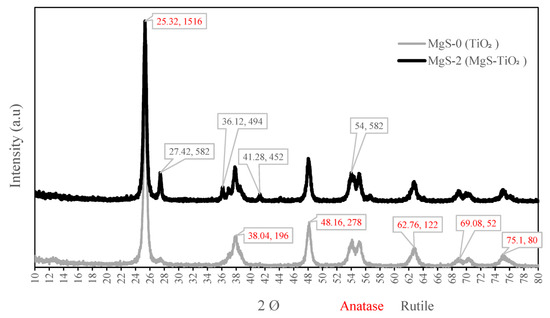
Figure 7.
XRD pattern of the MgS-0 and MgS-2 photocatalyst performed for 2Ø in the range of 10–80 degrees.
Textural properties of the synthesized photocatalyst were determined by the N2 physical adsorption–desorption method, as shown in Figure 8. N2 adsorption–desorption isotherms of all samples were of type IV, indicating a typical mesoporous structure. The MgS-0 (TiO2) exhibited a type H3 hysteresis, indicating the agglomeration of particles forming slit-shaped pores. However, after doping with MgS, the hysteresis loop gradually shifted towards the H1 type, indicating the presence of ink-bottled pores and cylindrical-through pores [27]. BET surface area, pore volume, and average pore size are presented in Table 2. The total pore volume of pure TiO2 and doped MgS–TiO2 were almost equal. After doping with MgS, the pore size of the photocatalyst increased from 89 Å in TiO2 to maximum of 123 Å in MgS-TiO2. The presence of these pores in MgS-doped TiO2 samples confirms that the interaction between MgS with TiO2 leads to the rearrangement of pores.
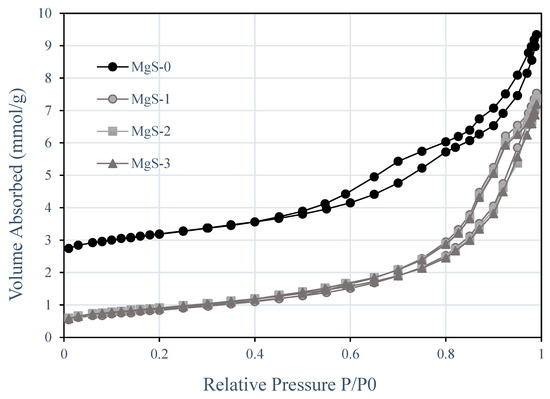
Figure 8.
N2 adsorption–desorption isotherm for MgS-0, MgS-1, MgS-2, and MgS-3.
Table 2.
Textural properties of the photocatalyst.
To investigate the changes in the chemical environment, XPS measurements were performed on the prepared MgS-TiO2 photocatalysts. The XPS spectra of all catalysts were shown in Figure 9. Figure 9a shows two peaks at 458.68 and 464.38 eV for the Ti spectrum, which were assigned to Ti 2p3/2 and Ti 2p1/2 of Ti4+. Figure 9b shows the spectrum of O 1s of TiO2, where the peak observed at 529.78 was attributed to lattice oxygen (Ti–O). The presence of the Mg 2p peak (Figure 9c) and the S 2p (Figure 9d) peak indicates the successful doping of MgS onto TiO2.
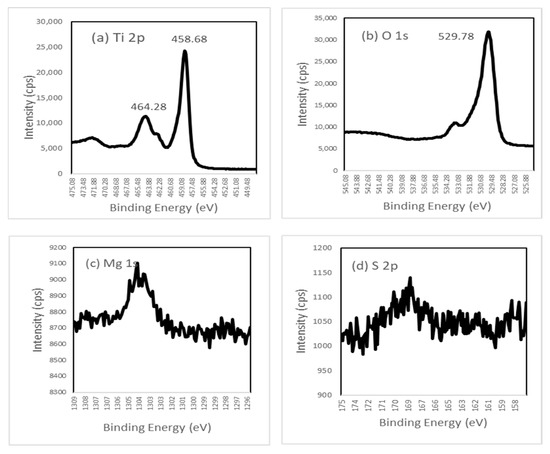
Figure 9.
XPS spectra of MgS-TiO2 for (a) Ti 2p, (b) O 1s, (c) Mg 1s, and (d) S 2p.
3.2. Photocatalytic Activity
The blank experiments that consist of UV-illuminated in the absence of both CO2 and the catalyst confirmed the absence of any carbon-containing compounds. Therefore, the obtained products resulted from the experiment originated from the photocatalytic reduction of CO2. Figure 10 showed the photocatalytic activity of the photocatalyst that has been synthesized. Methanol yield was calculated using Equation (2), considering the methanol concentration from the GC analysis, the catalyst doping, and the reaction.
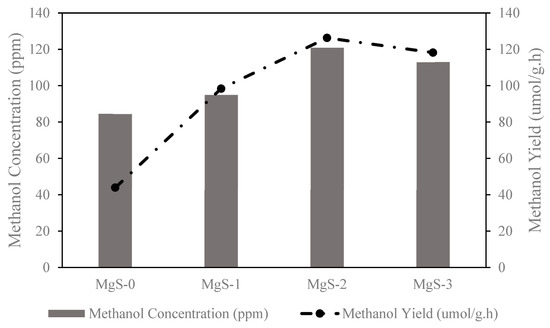
Figure 10.
Photocatalytic activities of MgS-0, MgS-1, MgS-2, and MgS-3.
Methanol yield for MgS-0 was 43.9 μmol/g·h, MgS-1 was 98.4 μmol/g·h, MgS-2 was 126.3 μmol/g·h, and MgS-3 was 118.2 μmol/g·h. Results showed that the presence of MgS on the TiO2 has caused an increase in the methanol yield, and MgS-TiO2 doped with 0.5 wt % concentration (MgS-2) showed the highest photocatalytic activity. Based on a previously reported study on Mg/TiO2 photocatalyst by Olowoyo et al. (2018), it was shown that the optimum performance was achieved by employing 0.5 wt % Mg loading [21]. From this study, the characterization results of MgS-2 were shown to have lower band energy of 2.88 eV with mixed anatase and rutile crystalline structure and higher surface composition of Mg and S on the surface of the photocatalyst that resulted in higher photocatalytic activity. Even though the anatase phase in MgS-TiO2 was lower, the photocatalytic activity increased due to the presence of the rutile phase [28]. A study conducted by Olowoyo et al. (2019) found that the adsorption energies are higher in anatase surface than rutile, suggesting that methanol product would desorb from the rutile surface faster than the anatase to give a better photocatalytic activity [29]. Behnajady et al. (2011) discovered that the overall number of available photogenerated carriers for the photocatalytic reduction is not dependent on the catalyst additive concentration, but more related to the strong connection with the chemical structure of the outermost layers [28]. The study by Manzanares et al. (2014) found that the incorporation of Mg on TiO2 changed the acid base properties that promote a highly modified surface with a major presence of Ti3+ and hydroxyl groups [30]. A similar study used Mg-doped TiO2 for the photocatalytic conversion of CO2 to methanol, which was performed by Olowoyo et al. (2018). In this study, the Mg doping was in the form of MgO–TiO2. The methanol yield was higher (5910 µmol/g·h), but it used a different synthesis method and photocatalytic parameter reaction [21]. The metal oxide doping showed a better photocatalytic conversion compared to metal sulfides doping, but this would not solve the problem of the metal oxide photocatalyst being poisoned by H2S in the CO2 gas feedstock. Therefore, in this study, it can be stated that the incorporation of MgS on TiO2 is responsible for the enhancement of the photoactivity of the photocatalyst compared to the base TiO2 photocatalyst.
3.3. Photocatalytic Conversion of CO2 to Methanol
For the photocatalytic conversion of CO2 to methanol experiment, TiO2 anatase was tested against MgS-TiO2 at 0.5 wt % (MgS-2). The experiment was conducted continuously for 24 h to determine the photocatalytic activity, as shown in Figure 11. The highest methanol concentration was achieved after 4 h for MgS-2, but TiO2 achieved the highest methanol concentration after 6 h. The methanol concentration started to decrease for both TiO2 and MgS-2 after 8 h. As methanol is a volatile substance, after a long period of time in the reactor, the methanol vaporized into the gas phase, and the liquid phase will have a decrease in the methanol concentration. Xu et al.’s (2017) study showed that the formation of Ti3+ in Mg-doped TiO2 samples could be responsible for their higher activities in comparison with native TiO2, since Ti3+ can help delay the recombination of the e−−h+ pair. The combination effect of lattice distortion and defects with Ti3+ was found to increase the photocatalytic activity nearly three times [31]. Selvaratnam and Koodali (2018) stated that the Mg doping on TiO2 also alters the acid–base properties and enhances the more basic character in TiO2 [32]. Therefore, the properties favor better adsorption of CO2 at the surface of MgS-TiO2 that resulted in higher methanol yield.
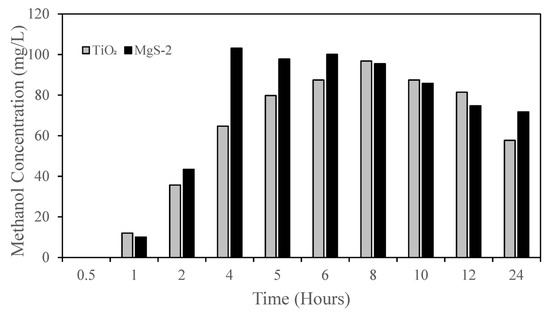
Figure 11.
Photocatalytic conversion of CO2 to methanol for TiO2 and MgS-2.
3.4. Optimization of Photocatalytic Parameters
Response surface methodology was used to map the response of methanol yield to changes in reaction temperature, catalyst loading, and reaction time. Design parameters and methanol yield are shown in Table 3.
Table 3.
Design of experiment by RSM and methanol yield.
Application of CCD to the photocatalytic process generated the following second-order polynomial equations, developed after removing insignificant terms from the analysis and reprocessing the data, as shown by Equation (3).
The positive notation of the individual terms shows a synergetic effect, while each term’s negative inscription shows a negative impact. An excellent goodness of fit was obtained for all 18 photocatalytic tests, where R2 > 0.9431 was found to be close to 1, indicating that the model was correct and significant. Predicted responses were obtained by substituting independent variable values into Equation (3).
The ANOVA analysis of photocatalytic reduction of CO2 to methanol is presented in Table 4. Reliable regression coefficients were obtained for all combinations of test variables. The results of the statistical analysis in Table 4 showed the model linear terms (temperature) and (catalyst loading) significantly affected CO2 photoreduction, where the p-value was <0.05. In contrast, reaction time had the least significant effect on CO2 photoreduction, where the p-value was >0.05.
Table 4.
ANOVA analysis of photocatalytic reduction of CO2 to methanol.
Three-dimensional response surface curves were plotted to study the interactions between various parameters for CO2 photoreduction to methanol (Figure 12) and were used to optimize responses. The methanol yield increased as the temperature increased, but it decreased with increasing catalyst loading and reaction time. Because of the increased adsorption–desorption mechanism on the catalyst surface, it was noticed that methanol yield increased with increasing temperature [33]. Methanol yield showed a significant reduction at a high catalyst loading due to the excess of catalyst, and the used medium had high turbidity of photocatalyst suspensions, limiting light penetration and decreasing CO2 photoconversion efficiency [34]. A previous study also reported the methanol production was increased from 2 to 2.5 h and became nearly constant after 4 h [35]. Hence, this explained why the reaction time from 3 to 6 h did not affect the methanol conversion.
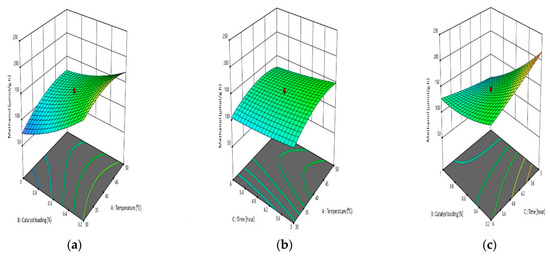
Figure 12.
Interaction of two parameters on CO2 photoreduction: (a) catalyst loading–temperature, (b) time–temperature, (c) catalyst loading–time.
3.5. Effects of Catalyst Recycling
Reusability of catalysts is essential for developing heterogeneous catalysts. To evaluate the recyclability of the photocatalyst for the reduction of CO2 to methanol, a recycling test was performed. The photocatalyst was easily separated by centrifugation of the reaction mixture, and the methanol yields were measured for four cycles. It was observed that the catalyst maintained the same methanol yields after three cycles, but in the 4th catalytic experiment, the recycled catalyst showed a 5% drop in methanol production. The photocatalytic conversion experiment (Figure 13) revealed that, after 8 h, the active sites became active, and only a few sites became active after recycling; thus, the main sites remain deactivated. Therefore, it can be concluded that the photocatalyst can be recycled for four cycles. The deficiency of the catalyst can be addressed by adding fresh catalyst to the reaction.
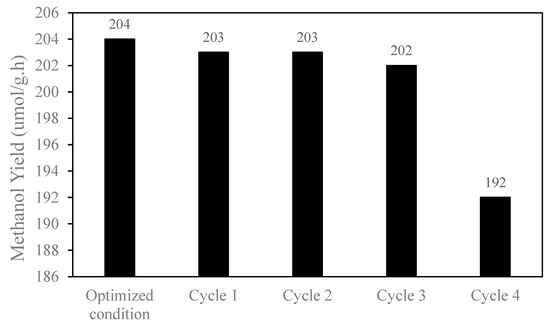
Figure 13.
Effect of catalyst recycling to methanol production.
3.6. Proposed Reaction Mechanism
Reduction of CO2 to methanol was difficult to proceed just by the photocatalyst itself due to the high stability of the CO2 gas. The presence of reductants, such as H2 or H2O, can provide protons to react with the adsorbed CO2 on a photocatalyst surface and electrons to form products. This will enhance the process of CO2 conversion by lowering the required input energy [36]. The following reactions are suggested for the photocatalytic reduction of CO2 to methanol.
2H2O + 4h+ O2 + 4H+ +0.82 V
CO2 + 6H+ + 6e− CH3OH + H2O −0.38 V
Figure 14 displayed the valance band (VB) of MgS-TiO2 (+1.85 V), which was more positive than the water splitting oxidation potential (+0.82 V), and the conduction band (CB) of MgS-TiO2 (−0.85 V) was more negative than the CO2/CH3OH reduction potential (−0.38 V). These band structures resulted in the suitability of MgS-TiO2 to catalyse the photocatalytic reaction that leads to the conversion of CO2 into methanol.
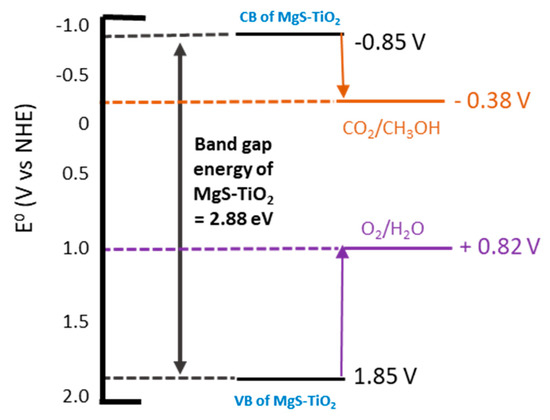
Figure 14.
Band gap position of MgS-TiO2.
3.7. Comparison with Previous Study
As TiO2 has a wide band gap with lower efficiency towards light energy conversion, fast photoinduced electron–hole pair recombination rates that lower the photo-catalytic activity, and has limited CO2 adsorption capacity, modification of the TiO2 photocatalyst with the addition of metal doping in order to make it more efficient has been a popular strategy to enhance its photocatalytic activity. Table 5 summarizes some previously used metal-doped TiO2 photocatalysts and their performance compared to the current research work. In this study, the MgS-TiO2 photocatalyst showed maximum yield of 229.1 µmol/g·h of methanol, which is higher than the other reported catalyst. However, the formation of other products, such as formaldehyde, formic acid, as well as backward reaction, still limit the maximum achievable methanol yield [37].
Table 5.
Comparison with previous results.
4. Conclusions
MgS-TiO2 photocatalyst was successfully synthesized using a combination of wet impregnation and hydrothermal method. Characterization results from ICP-OES, FESEM, EDX, FTIR, and XRD analysis confirmed the presence of MgS on the native TiO2 photocatalyst. Results showed that the optimum MgS and TiO2 ratio of 0.5 wt % gave the highest methanol yield of 229.1 μmol/g·h. The optimization of the photocatalytic parameter has shown that the most significant factors that affected the photocatalytic process are temperature and catalyst loading. Reaction time was found to have the least significant effect on the photocatalytic process of CO2 reduction to methanol. This concludes that MgS–TiO2 photocatalyst has the potential and can be used for the photocatalytic reduction of CO2 to methanol.
Author Contributions
Conceptualization, methodology, software, validation, formal analysis, investigation, data curation, writing—original draft preparation, and visualization, N.M.Y.; writing—review and editing, N.M.Y. and O.P.C.; resources and funding acquisition, O.P.C. Supervision, O.P.C. and S.S. Project administration, M.M.Z. and O.P.C. All authors have read and agreed to the published version of the manuscript.
Funding
This research was funded by PETROLIAM RESEARCH FUND, Gastech PETRONAS grant number 015MD0-065.
Data Availability Statement
Not applicable.
Acknowledgments
The technical support provided by CO2 Research Centre (CO2RES), Institute of Contaminant Management, is duly acknowledged.
Conflicts of Interest
The authors declare no conflict of interest.
References
- Hannah Ritchie, M.R. Hannah Ritchie and Max Roser—‘CO2 and Greenhouse Gas Emissions’. Published Online at Our-WorldInData.org. 2017; p. 2017. Available online: https://ourworldindata.org/co2-emissions#citation (accessed on 23 February 2022).
- MITI. Malaysia and the United Nations Framework Convention on Climate Change (UNFCCC)—The Paris Agreement. Minist. Int. Trade Ind. 2017, 3. Available online: https://www.miti.gov.my/miti/resources/Article_on_Malaysia_UNFCCC-_Paris_Agreement.pdf?mid=572 (accessed on 23 February 2022).
- Adekoya, D.; Tahir, M.; Amin, N.A.S. Recent trends in photocatalytic materials for reduction of carbon dioxide to methanol. Renew. Sustain. Energy Rev. 2019, 116, 109389. [Google Scholar] [CrossRef]
- Hobson, C.; Márquez, C. Renewable Methanol Report. Methanol. Inst. 2018, 103, 1–26. Available online: https://www.methanol.org/wp-content/uploads/2019/01/MethanolReport.pdf (accessed on 23 February 2022).
- Chakrabortty, S.; Nayak, J.; Ruj, B.; Pal, P.; Kumar, R.; Banerjee, S.; Sardar, M.; Chakraborty, P. Photocatalytic conversion of CO2 to methanol using membrane-integrated Green approach: A review on capture, conversion and purification. J. Environ. Chem. Eng. 2020, 8, 103935. [Google Scholar] [CrossRef]
- Al-Saydeh, S.A.; Zaidi, S.J.; El-Naas, M.H. Conversion of Carbon Dioxide: Opportunities and Fundamental Challenges. Am. J. Eng. Appl. Sci. 2018, 11, 138–153. [Google Scholar] [CrossRef]
- Lais, A.; Gondal, M.A.; Dastageer, M.A. Semiconducting oxide photocatalysts for reduction of CO2 to methanol. Environ. Chem. Lett. 2018, 16, 183–210. [Google Scholar] [CrossRef]
- Nazimek, D.; Czech, B. Artificial photosynthesis—CO2 towards methanol. IOP Conf. Ser. Mater. Sci. Eng. 2011, 19, 012010. [Google Scholar] [CrossRef]
- Xie, S.; Zhang, Q.; Liu, G.; Wang, Y. Photocatalytic and photoelectrocatalytic reduction of CO2 using heterogeneous catalysts with controlled nanostructures. Chem. Commun. 2016, 52, 35–59. [Google Scholar] [CrossRef]
- Harish, S.; Archana, J.; Navaneethan, M.; Ponnusamy, S.; Singh, A.; Gupta, V.; Aswal, D.K.; Ikeda, H.; Hayakawa, Y. Synergetic effect of CuS@ZnS nanostructures on photocatalytic degradation of organic pollutant under visible light irradiation. RSC Adv. 2017, 7, 34366–34375. [Google Scholar] [CrossRef]
- Liu, L.; Wang, S.; Huang, H.; Zhang, Y.; Ma, T. Surface sites engineering on semiconductors to boost photocatalytic CO2 reduction. Nano Energy 2020, 75, 104959. [Google Scholar] [CrossRef]
- He, G.; Zhang, J.; Hu, Y.; Bai, Z.; Wei, C. Dual-template synthesis of mesoporous TiO2 nanotubes with structure-enhanced functional photocatalytic performance. Appl. Catal. B Environ. 2019, 250, 301–312. [Google Scholar] [CrossRef]
- Wu, J.; Lin, H.M. Photo reduction of CO2 to methanol via TiO2 photocatalyst. Int. J. Photoenergy 2005, 7, 115–119. [Google Scholar] [CrossRef]
- Pastrana-Martínez, L.M.; Silva, A.M.T.; Fonseca, N.N.C.; Vaz, J.R.; Figueiredo, J.L.; Faria, J.L. Photocatalytic Reduction of CO2 with Water into Methanol and Ethanol Using Graphene Derivative–TiO2 Composites: Effect of pH and Copper(I) Oxide. Top. Catal. 2016, 59, 1279–1291. [Google Scholar] [CrossRef]
- Rajalakshmi, K.; Jeyalakshmi, V.; Krishnamurthy, K.R.; Viswanathan, B. Photocatalytic Reduction of Carbon Dioxide by Watr on Titania: Role of Photophysical and Structural Properties; NISCAIR-CSIR: New Delhi, India, 2012. [Google Scholar]
- Nogueira, M.V.; Lustosa, G.M.M.M.; Kobayakawa, Y.; Kogler, W.; Ruiz, M.; Filho, E.S.M.; Zaghete, M.A.; Perazolli, L.A. Nb-Doped TiO2 Photocatalysts Used to Reduction of CO2 to Methanol. Adv. Mater. Sci. Eng. 2018, 2018, 7326240. [Google Scholar] [CrossRef]
- Tasbihi, M.; Schwarze, M.; Edelmannová, M.; Spöri, C.; Strasser, P.; Schomäcker, R. Photocatalytic reduction of CO2 to hydrocarbons by using photodeposited Pt nanoparticles on carbon-doped titania. Catal. Today 2019, 328, 8–14. [Google Scholar] [CrossRef]
- Zhao, H.; Pan, F.; Li, Y. A review on the effects of TiO2 surface point defects on CO2 photoreduction with H2O. J. Mater. 2017, 3, 17–32. [Google Scholar] [CrossRef]
- Shehzad, N.; Tahir, M.; Johari, K.; Murugesan, T.; Hussain, M. A critical review on TiO2 based photocatalytic CO2 reduction system: Strategies to improve efficiency. J. CO2 Util. 2018, 26, 98–122. [Google Scholar] [CrossRef]
- Yee, C.Y.; Kait, C.F.; Fatimah, H.; Wilfred, C.; Taha, M.F.B.; Yunus, N.B.M. Preparation and Characterization of Mg/TiO2 for Visible Light Photooxidative-Extractive Deep Desulfurization. Sains Malays. 2017, 46, 493–501. [Google Scholar] [CrossRef]
- Olowoyo, J.O.; Kumar, M.; Singhal, N.; Jain, S.L.; Babalola, J.O.; Vorontsov, A.V.; Kumar, U. Engineering and modeling the effect of Mg doping in TiO2 for enhanced photocatalytic reduction of CO2 to fuels. Catal. Sci. Technol. 2018, 8, 3686–3694. [Google Scholar] [CrossRef]
- Sheldon, D. Methanol Production—A Technical History. Johns. Matthey Technol. Rev. 2017, 61, 172–182. [Google Scholar] [CrossRef]
- Barajas-Ledesma, E.; García-Benjume, M.; Espitia-Cabrera, I.; Ortiz-Gutiérrez, M.; Espinoza-Beltrán, F.; Mostaghimi, J.; Contreras-García, M. Determination of the band gap of TiO2–Al2O3 films as a function of processing parameters. Mater. Sci. Eng. B 2010, 174, 71–73. [Google Scholar] [CrossRef]
- Rasu, K.K.; Sakthivel, P.; Muthukrishnan, P.; Venkatesan, G.P. Investigation on the structural and optical properties of Mn2+ doped MgS nanoparticles synthesized by hydrothermal method. Optik 2020, 225, 165774. [Google Scholar] [CrossRef]
- Devi, L.G.; Kavitha, R. Review on modified N–TiO2 for green energy applications under UV/visible light: Selected results and reaction mechanisms. RSC Adv. 2014, 4, 28265–28299. [Google Scholar] [CrossRef]
- Athira, K.; Merin, K.; Raguram, T.; Rajni, K. Synthesis and characterization of Mg doped TiO2 nanoparticles for photocatalytic applications. Mater. Today Proc. 2020, 33, 2321–2327. [Google Scholar] [CrossRef]
- Leofanti, G.; Padovan, M.; Tozzola, G.; Venturelli, B. Surface area and pore texture of catalysts. Catal. Today 1998, 41, 207–219. [Google Scholar] [CrossRef]
- Behnajady, M.A.; Alizade, B.; Modirshahla, N. Synthesis of Mg-Doped TiO2 Nanoparticles under Different Conditions and its Photocatalytic Activity. Photochem. Photobiol. 2011, 87, 1308–1314. [Google Scholar] [CrossRef]
- Olowoyo, J.O.; Kumar, M.; Jain, S.L.; Babalola, J.O.; Vorontsov, A.V.; Kumar, U. Insights into Reinforced Photocatalytic Activity of the CNT–TiO2 Nanocomposite for CO2 Reduction and Water Splitting. J. Phys. Chem. C 2019, 123, 367–378. [Google Scholar] [CrossRef]
- Manzanares, M.; Fàbrega, C.; Ossó, J.O.; Vega, L.F.; Andreu, T.; Morante, J.R. Engineering the TiO2 outermost layers using magnesium for carbon dioxide photoreduction. Appl. Catal. B Environ. 2014, 150–151, 57–62. [Google Scholar] [CrossRef]
- Xu, Y.; Wu, S.; Wan, P.; Sun, J.; Hood, Z.D. Introducing Ti3+ defects based on lattice distortion for enhanced visible light photoreactivity in TiO2 microspheres. RSC Adv. 2017, 7, 32461–32467. [Google Scholar] [CrossRef]
- Selvaratnam, B.; Koodali, R.T. TiO2-MgO mixed oxide nanomaterials for solar energy conversion. Catal. Today 2018, 300, 39–49. [Google Scholar] [CrossRef]
- Ahadzi, E.; Ramyashree, M.; Priya, S.S.; Sudhakar, K.; Tahir, M. CO2 to green fuel: Photocatalytic process optimization study. Sustain. Chem. Pharm. 2021, 24, 100533. [Google Scholar] [CrossRef]
- Bahari, M.; Mamat, C.; Jalil, A.; Shing, L.; Hassan, N.; Aziz, F.; Alhassan, M.; Nawawi, M.; Kidam, K.; Setiabudi, H. Enriching the methanol generation via CO2 photoconversion over the cockscomb-like fibrous silica copper. Fuel 2022, 328, 125257. [Google Scholar] [CrossRef]
- Nguyen, T.-V.; Wu, J.C. Photoreduction of CO2 in an optical-fiber photoreactor: Effects of metals addition and catalyst carrier. Appl. Catal. A Gen. 2008, 335, 112–120. [Google Scholar] [CrossRef]
- Nguyen, T.P.; Nguyen, D.L.T.; Nguyen, V.-H.; Le, T.-H.; Vo, D.-V.N.; Trinh, Q.T.; Bae, S.-R.; Chae, S.Y.; Kim, S.Y.; Van Le, Q. Recent Advances in TiO2-Based Photocatalysts for Reduction of CO2 to Fuels. Nanomaterials 2020, 10, 337. [Google Scholar] [CrossRef] [PubMed]
- Manzoor, N.; Sadiq, M.; Naqvi, M.; Sikandar, U.; Naqvi, S.R. Experimental Study of CO2 Conversion into Methanol by Synthesized Photocatalyst (ZnFe2O4/TiO2) Using Visible Light as an Energy Source. Catalysts 2020, 10, 163. [Google Scholar]
- Khan, M.M.R.; Uddin, M.R.; Abdullah, H.; Karim, K.M.R.; Yousuf, A.; Cheng, C.K.; Ong, H.R. Preparation and Characterization of CuFe2O4/TiO2 Photocatalyst for the Conversion of CO2 into Methanol under Visible Light. Int. J. Chem. Mol. Eng. 2016, 10, 1273–1280. [Google Scholar] [CrossRef]
Disclaimer/Publisher’s Note: The statements, opinions and data contained in all publications are solely those of the individual author(s) and contributor(s) and not of MDPI and/or the editor(s). MDPI and/or the editor(s) disclaim responsibility for any injury to people or property resulting from any ideas, methods, instructions or products referred to in the content. |
© 2023 by the authors. Licensee MDPI, Basel, Switzerland. This article is an open access article distributed under the terms and conditions of the Creative Commons Attribution (CC BY) license (https://creativecommons.org/licenses/by/4.0/).