Article

An Evolutionary Game Analysis of Shared Private Charging Pile Behavior in Low-Carbon Urban Traffic

1
Policy Research Center, Tianjin Research Institute for Water Transport Engineering, M.O.T., Tianjin 300456, China
2
School of Government, Liaoning Normal University, Dalian 116000, China
*
Authors to whom correspondence should be addressed.
Sustainability 2023, 15(13), 10149; https://doi.org/10.3390/su151310149
Submission received: 17 May 2023 / Revised: 14 June 2023 / Accepted: 20 June 2023 / Published: 26 June 2023
(This article belongs to the Special Issue Towards Green and Smart Cities: Urban Transport and Land Use)

Abstract

:
Choosing new energy vehicles for travel, especially electric vehicles, is an important component of building a low-carbon urban transportation system. However, the charging need of electric vehicle users is still constrained by the unreasonable layout and insufficient supply of public charging piles in cities. Private charging pile sharing, as an alternative policy tool, can play a beneficial role in solving this problem. However, it needs decision-makers in urban transportation to take corresponding measures to promote. This paper constructs an evolutionary game model to study the decision behavior of participants in a private pile-sharing platform. Through numerical simulation analysis, it is found that under most parameter conditions, the government tends to establish a shared charging pile platform based on public interests. Private charging pile owners are influenced by the relationship between the cost of supply modification and revenue, and they tend to join the shared platform when they expect to recover the modification cost. The research conclusions of this paper will provide support for exploring how participants make decisions to maximize overall benefits in the development of low-carbon urban transportation.

1. Introduction

With the growth of global environmental concerns and the energy crisis, many countries have established “double carbon” targets that require cross-border and global collaboration on energy revolution and industrial transformation [1]. In the realm of urban transportation, low-carbon development is a significant trend, and sustainable travel is being encouraged. New energy vehicles, particularly electric vehicles, can be widely adopted to reduce vehicle emissions. The establishment of low-carbon urban transportation systems is crucial for energy conservation and emission reduction [2].
While more and more owners of new electric vehicles are choosing to install charging stations in their private parking spaces, some do not have their own parking spaces or necessary installation conditions and must use public charging stations. The growing demand for charging infrastructure, particularly charging stations, is being met with accelerated construction [3]. Despite the rapid growth of public charging stations, issues related to their layout and inadequate supply can deter potential electric vehicle purchases due to fears of charging difficulties [3].
Private charging pile sharing can effectively utilize idle charging resources, enhance the economic efficiency of private charging piles, and facilitate the green and low-carbon development of urban transportation [4]. Private charging piles are typically only utilized 1–2 times per week on average [5]. However, private pile sharing can accommodate an additional 10–15 cars, significantly alleviating the scarcity of charging infrastructure in cities [3].
To promote the private pile-sharing model, decision-makers in the development of low-carbon urban transportation need to involve various stakeholders and formulate policies, along with the construction of sharing platforms, to achieve optimal social benefits. This study uses evolutionary game theory to develop a model that considers the interest relationship between charging pile owners and decision-makers of the sharing platform in the private pile sharing mode. The aim is to analyze the behaviors of both parties and explore how they can make decisions that maximize overall benefits for the development of low-carbon urban transportation. Through this analysis, the study provides insights into how the participants can work together to achieve mutual gains in this emerging market.

2. Literature Review

Private charging pile sharing is an emerging solution to address the insufficient supply of public charging infrastructure for electric vehicles. Many researchers and industrial engineers are currently studying this problem [6]. The research can be divided into three main areas, based on different aspects.
Currently, the rise in electric vehicle usage has led to the emergence of a novel model for private charging pile sharing. Numerous scholars have conducted research on the associated issues within this model. Wang et al. emphasized the impact of risk on private charging pile owners and the role of service quality in benefit distribution. They proposed an improved Shapley value model that considers the contributions and risks of different stakeholders, enhancing multi-party cooperation [7]. However, determining reasonable pricing for charging pile sharing remains unresolved. Zhao et al. adopted a non-cooperative game model to consider the charging behavior of electric vehicle consumers and determine the shared price of charging piles [8]. They also constructed a bilateral bargaining game model, based on Rubin’s rotating bargaining game, to account for information asymmetry among private charging pile owners, electricity retailers, and electric vehicle users. They found that there is no solution to the unilateral bargaining between the private charge pile owner and the electricity retailer or the EV user. Private charge pile owners need to combine the unilateral pricing of electric selling companies and EV owners to determine the optimal price through further derivation [9]. Chen et al. proposed a hierarchical scheduling model for electric vehicles with shared charging piles. This model utilizes upper-level and lower-level scheduling to determine the charging time and location of electric vehicles, respectively. A sharing capacity model based on the generalized Nash game is employed to determine the sharing scheme of private charging piles. The distinguishing factors between charging stations and shared charging piles in terms of their provision of charging services are analyzed and identified [10]. Fu et al. proposed a peer-to-peer (P2P) private charging pile-sharing system based on blockchain technology. They conducted a case study in Shanghai’s Lujiazui business district to verify the system’s applicability. The study revealed that private EV charging piles were more popular than public charging piles [11].
The current research primarily focuses on the allocation of costs and benefits associated with private charging station sharing, as well as case studies of countries providing charging services [12,13]. However, there is a lack of analysis regarding the behavior of private charging station owners who participate in sharing programs. This aspect of research can serve as a valuable reference for analyzing shared parking space behavior. With the rise in car ownership, the search for available parking spaces has become increasingly challenging, leading to the emergence of shared parking as a viable solution. Yan et al. conducted a declarative selection experiment to understand the tendency of parking space owners to participate in shared parking under different conditions. Their findings indicate that various factors, including socio-demographic characteristics, contextual variables, income levels, and psychological concerns, play significant roles in shaping the willingness of parking space owners to participate in platform-based shared parking programs [14]. Xiao et al. built on parking management research and proposed an auction-based shared parking space market behavior model that considers the impact of expected regret on participants’ bids. Results show that the normative goal and the combination of gain and economic goals are identified as preferred objectives for the shared parking auction market. To promote sustainable development, it is recommended to set a market entry threshold to exclude certain participants, and guide participants towards adopting preferred goals, thereby reducing welfare loss [15]. These studies have thoroughly analyzed the decision-making psychology of various stakeholders and the potential role that government can play in shaping it, providing a valuable reference for the research focus of this paper.
Additionally, the evolutionary game model utilized in this study is a well-established approach in the field of decision-making research for government and enterprise. For instance, the implementation of this method has demonstrated favorable outcomes in the realm of low-carbon development [16,17]. Zhao et al. proposed a tripartite evolutionary game theory to investigate the behavior strategies of power grid enterprises, banks, and governments in low-carbon grid technology innovation cooperation [18]. Zou et al. introduced evolutionary game theory and constructed a dynamic evolution tripartite game model, with universities as suppliers of low-carbon technologies, enterprises as demanders, and the government as the promoter and regulator. The study revealed the interaction between different actors and the influence of initial participation intentions on government participation [19]. Liao et al. explored effective carbon tax mechanisms in the post-subsidy era by establishing the evolutionary game between local governments and automakers. They conducted an empirical analysis based on China’s actual situation and an optimal carbon tax mechanism, and the parameter sensitivities were analyzed and compared in different scenarios by using evolution analysis [20]. Cao et al. proposed a pricing strategy for electric vehicle charging operators and analyzed the dynamic evolution process between electric vehicle users and charging operators in Shanghai. They conducted a sensitivity analysis of factors affecting the system’s evolution and equilibrium [21]. Zhang et al. applied evolutionary game theory to study policy choices in the waste battery-reuse supply chain, considering information asymmetry and limited rationality among government, manufacturer, and consumer participants. They established an evolutionary game model that includes echelon utilization and remanufacturing choices, revealing the balance in government support, echelon utilization, and consumer participation [22].

3. Models

3.1. Model Assumptions and Symbol Definition

The traditional game theory based on the assumption of perfect rationality makes it difficult to obtain reliable conclusions because of the complex socio-economic environment and decision-making problems. Evolutionary game theory has emerged as a superior analytical tool for finite rational games. It is based on the principles of biological evolution and posits that individuals within a group can attain a stable dynamic equilibrium by engaging in processes such as imitation, learning, and mutation to develop an evolutionary-stable strategy. Therefore, this paper constructs an evolutionary game model to study the game phenomenon between the platform party and the charging pile owners in the establishment of the charging pile sharing platform, assuming that the platform is invested in and built by the government.
The government decision is divided into two policymaking options, active and inactive. In active policymaking, two policy perspectives, support and regulation, are considered. For government support, two policy instruments are introduced in the model; namely, the government establishes a sharing platform and gives subsidies to charging pile owners for the platform. Establishing a sharing platform can improve the efficiency of travelers in finding shared charging piles, which is conducive to improving the overall utilization rate of charging piles. On the other hand, direct subsidies are given to the owners of charging piles participating in the sharing platform as support. The government’s regulatory measures are perceived as punitive, with a management fee imposed on charging stations that do not participate in the sharing platform. There is no proactive policy option to maintain the status quo, leaving charging station owners to decide whether or not to join the sharing platform. The following assumptions are made for the game scenario:
(1)
Assume that both the government and the owners of charging piles are finite rational, and both can make the evolutionary game of sharing charging piles reach a stable state through self-learning, and assume that the government-led sharing platform can reduce the idle rate of charging piles through optimal resource allocation and bring feedback benefits to the owners of charging piles.
(2)
The government has two strategies, “active” and “inactive”, and the proportions of choosing the two strategies are x and (1 − x), respectively, x 0,1 .
(3)
Charging pile owners have two strategies, “participation” and “non-participation”, and the proportions of choosing the two strategies are y and (1 − y), respectively, y 0 , 1 .
R denotes the social revenue enhancement brought by the overall charging pile utilization rate of the society, and G denotes the stable revenue level of the charging pile owner when operating the charging pile normally. Although the charging pile is not saturated, in general, the utilization rate of the local area is not high, and the idle rate of the charging pile is considered as p, where two high and low idle rates, i.e., P l , P h , , exist. The loss caused by the complete idleness of the charging pile is L. The investment used for the transformation of the charging pile to access the platform is I. Therefore, the evolutionary game payment matrix is shown in Table 1.

3.2. Replication Dynamic Equation Building

u represents the expected benefit of the strategy. u p G u n G represents the expected benefit when the government undertakes an active policy and the expected benefit when the government undertakes an inactive policy. u G represents the average expected benefits when the government chooses different strategies. u i C represents the expected benefit when the charging pile owner adopts the participation strategy; u k C represents the expected benefit when the charging pile owner adopts the non-participation strategy, and u C represents the average expected benefit when the charging pile owner chooses different strategies. According to the description of the payment matrix, the expected benefits of the two behavioral choices of active and inactive government policies are as follows:
u p G = y ( R A β S ) + ( 1 y ) ( R + γ F A P l E )
u n G = y ( P l E ) + ( 1 y ) ( E )
The average benefit of government decisions is
u G = x u p G + 1 x u n G .
The expected benefits of the charging pile owner’s decision are
u i C = x ( G + Δ G + β S I ) + ( 1 x ) ( G + Δ G P l L I )
u k C = x G P l L γ F + 1 x G P h L .
The average benefit of charging pile owner decisions is
u C = y u i C + 1 y u k C
According to the basic idea of the replication dynamic model proposed by Taylor and Jonker [23], the probabilities, x and (1 − x), that the government chooses the strategies of “active” and “inactive”, and the probabilities, y and (1 − y), that the charging pile owner chooses the strategies of “participation” and “non-participation” are both functions of time, t. The replication dynamic equation can be employed to depict how a strategy behavior’s frequency of selection changes dynamically within a population over time. The replication dynamic equation of a single population can be expressed as:
d z i d t = z i [ f ( z ) i f ¯ ( z ) ]
z i represents the frequency at which strategy i is selected; f ( z ) i represents the expected return when strategy i is adopted, and the average expected return when the whole group chooses different strategies. Accordingly, the replication dynamic equation of the government decision is
d x d t = x [ u p G u G ] = x ( 1 x ) [ R + γ F A P l E + E + ( 2 P l E β S γ F E ) y ]
The replicated dynamic equation for the charging pile owner’s decision is
d y d t = y [ u i C u C ] = y ( 1 y ) [ Δ G P l L I + P h L + ( 2 P l L P h L + β S + γ F ) x ]
Let B = R + γ F A P l E + E ,  C = 2 P l E β S γ F E ,  M = Δ G P l L I + P h L , N = 2 P l L P h L + β S + γ F , we can get d x d t = x ( 1 x ) ( B + C y ) , d y d t = y ( 1 y ) ( M + N x ) .

3.3. Analysis of Evolutionary Stabilization Strategies

Letting d x d t = 0 , while d y d t = 0 , we find the five equilibrium points of the system, respectively: ( 0 , 0 ) , ( 0,1 ) , ( 1,0 ) , ( 1,1 ) , and M N , B C .
According to the replication dynamic equation, the Jacobi matrix, J, of the system is obtained as
J = ( 1 2 x ) ( B + C y ) y ( 1 y ) N x ( 1 x ) C ( 1 2 y ) ( M + N x ) .
According to the stability theorem of differential equations, the evolutionary stabilization strategy is stable to smaller disturbances, and the derivative of d x d t must be less than 0. If the determinant of the matrix J meets D e t J > 0 , and the trace of the matrix meets T r ( J ) < 0 , the point is a local asymptotically stable immobile point, i.e., the evolutionary stabilization strategy (ESS). Five equilibrium points are brought into the Jacobi matrix, and the results are shown in Table 2.
U = B + C M + N B M N 2 C .
According to Table 2, further discussion of parameter values is necessary to determine the determinants and trace values of the five equilibrium points. The research [14,24] suggests that income plays a crucial role in sharing decision-making behavior. For charging pile owners, it is imperative to evaluate whether adopting an access platform strategy will yield benefits greater than equipment renovation costs. Based on Zhao’s analysis of private charging pile pricing for sharing [8], it can be inferred that private owners can benefit from sharing behavior under certain platform subsidies. Using ZigBee, 4G, and other wireless technologies, charging piles realize charging pile positioning, charging pile charge and discharge control, and charging pile status monitoring by applying wireless data transmission modules, acquisition modules, intelligent gateways, and other devices [24]. With the continuous advancement of charging pile networking technology, equipment transformation costs will further decrease. Therefore, it is assumed that access to the sharing platform by charging pile owners will result in increased benefits due to reduced management costs, platform subsidies, and revenue. The total revenue generated from management cost reduction, platform subsidies, and participation in the shared platform exceeds the expenses incurred for charging pile transformation, denoted as Δ G I + P l L + β S + γ F > 0 , i.e., M + N > 0 .
On the other hand, from the perspective of overall social benefits, if the public cost paid by the government to make positive decisions can maximize social benefits is considered, that is, the value of P l E + R A β S , i.e., B + C . According to Hu’s research [12], private charging stations are currently utilized on average only 1–2 times per week, resulting in low utilization rates. However, by adopting a private sharing model, an additional 10–15 vehicles can be serviced each week, leading to a decrease in idle charging station rates and alleviating urban charging shortages. Fu’s research [11] also confirms that the implementation of sharing models in Shanghai has increased the popularity of private charging stations.
Therefore, it is assumed in this paper that positive decision-making will result in a reduction of the idle rate of charging piles and facilitate an overall enhancement of social benefits, denoted as P l E + R > A + β S .
In addition, according to the analysis of the benefits of shared charging in research [25], the partnership between actors (energy companies, terminal operators, platform providers, and industrial groups) enables partners to collect huge sets of user data. This might serve to better analyze EV markets, target specific customer groups, or develop other paid services. Therefore, government subsidies for this model have significant social benefits. In terms of subsidy funds, local governments are not burdened by sharing platform subsidies. Subsidy policies have played a crucial role in promoting new energy vehicles, as evidenced by China’s 13-year subsidy policy and its successful outcomes. It is assumed that the continuity of this policy can cover the model’s evolution time. The values for each equilibrium point are presented in Table 3 below.

4. Numerical Simulation Analysis of Four Evolutionary Game Models

4.1. Construction of System Dynamics Simulation Model

According to the modeling analysis of the strategic decisions of both the government and the owner of the charging pile, the results of each party’s evolutionary game under different conditions are given, using system dynamics (SD) to depict the evolution of the game between the government and the owners of the charging posts. An evolutionary game system dynamics model of the mixed strategies of the government and the owner of the charging post was developed to characterize the long-term dynamic behavior of the game relationship between the two players; it provides a simulation platform for studying the evolution trend under different conditions and formulating practical countermeasures.
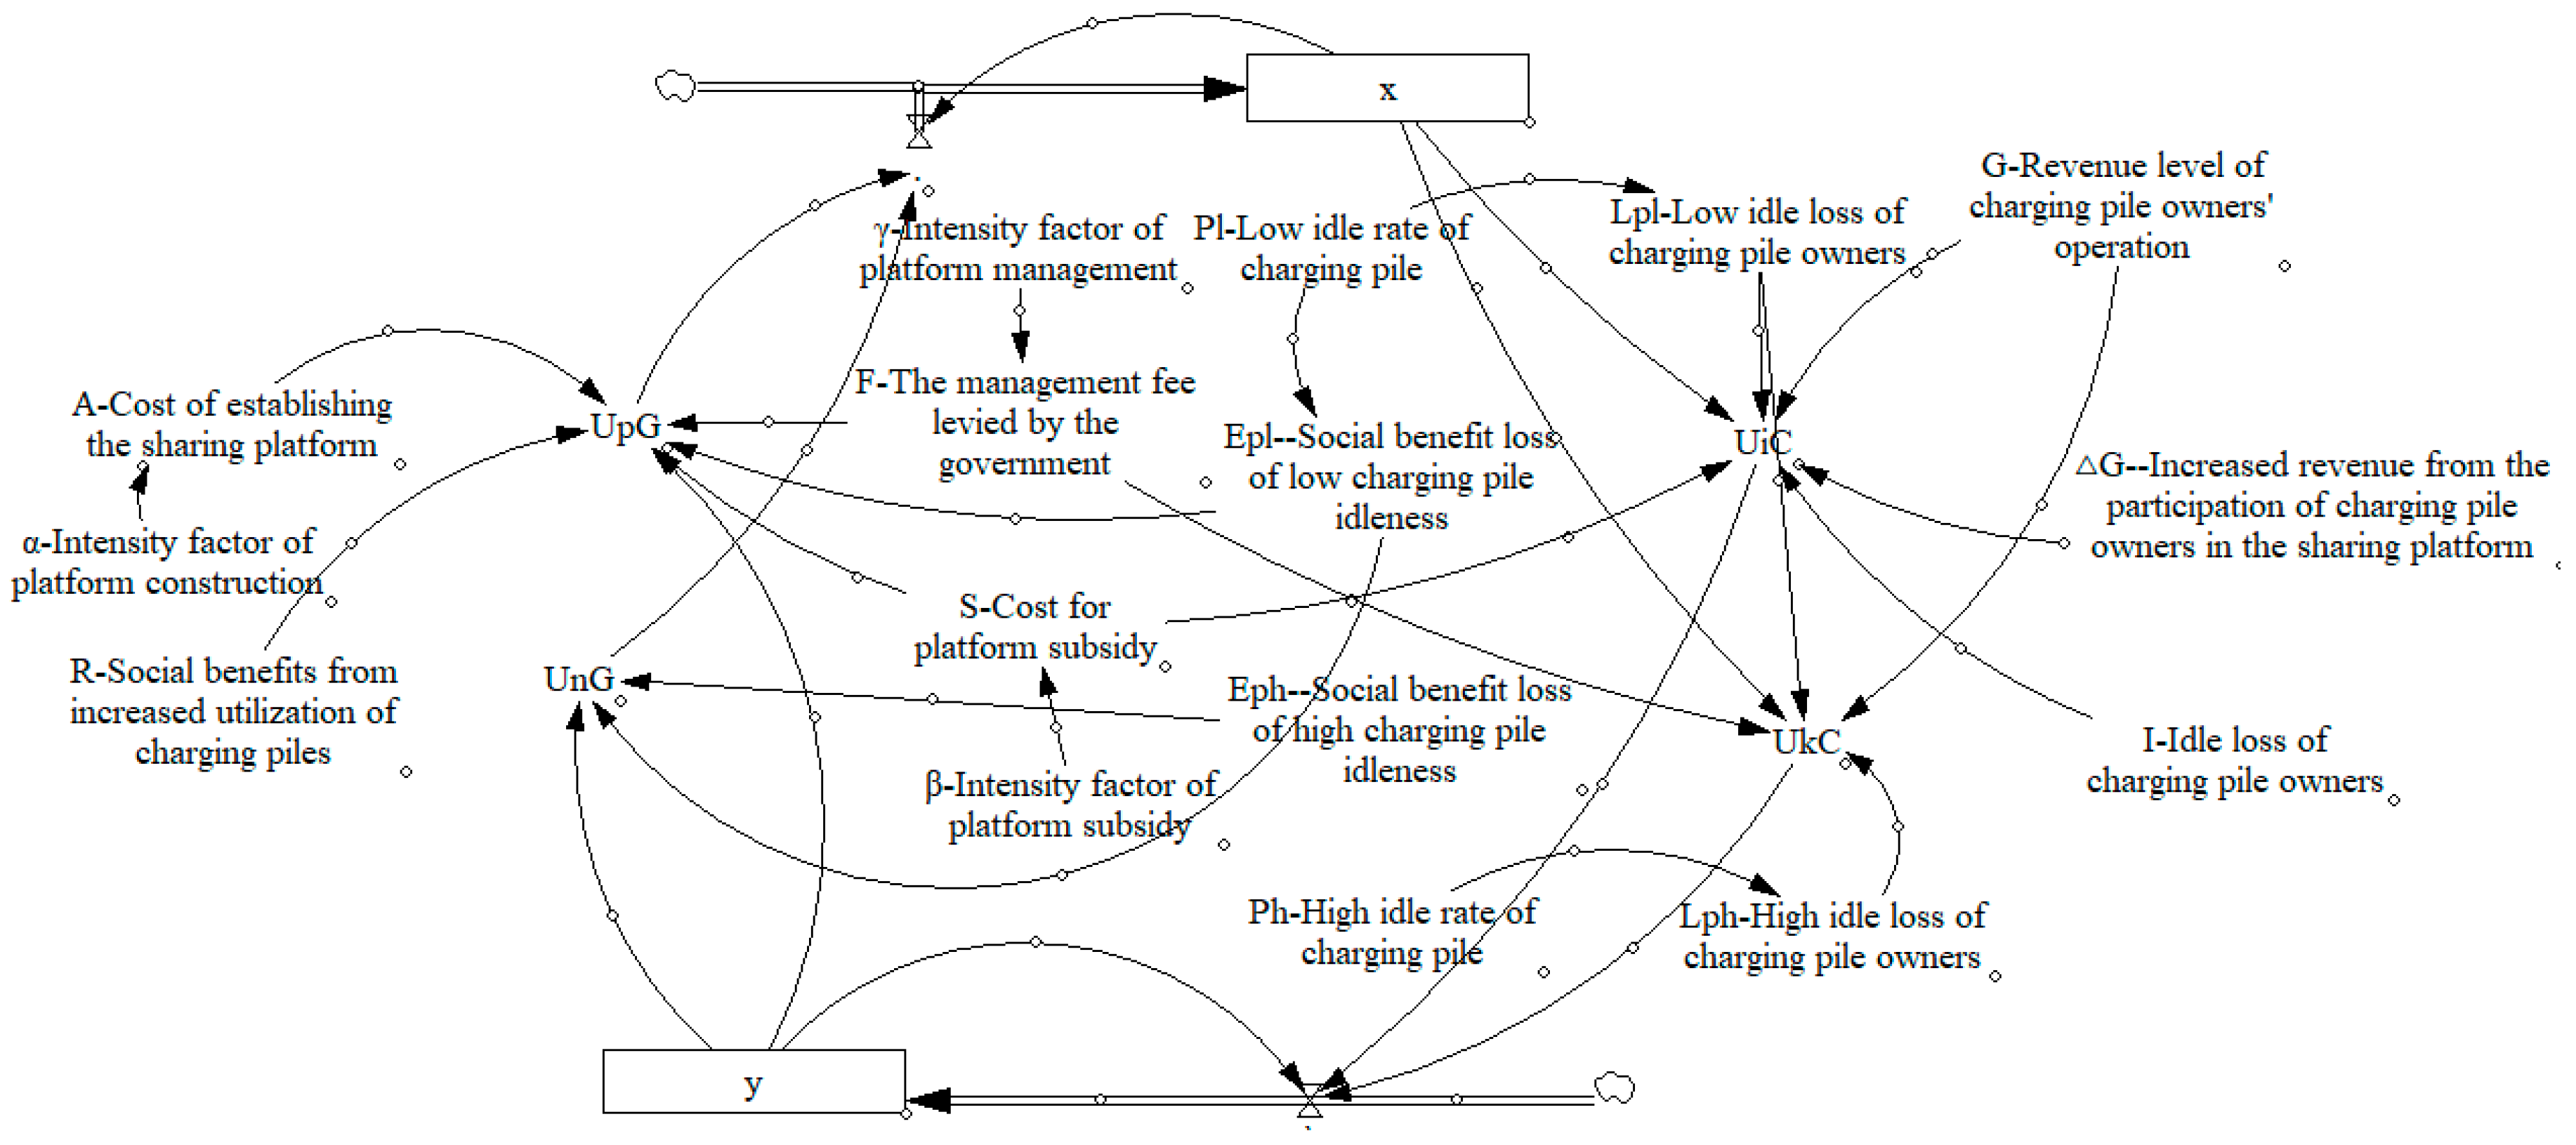
To further verify the strategy choices of both parties under different conditions, the system dynamics model is used for simulation analysis. As a powerful tool to study the dynamic problems of complex systems, system dynamics can effectively portray the decision-making behavior of interested parties from a system perspective. In addition, Vensim is an industrial-strength simulation software for improving the performance of real systems. Vensim’s rich feature set emphasizes model quality, connections to data, flexible distribution, and advanced algorithms. Vensim PLE software is widely adopted to simulate the evolution of a game based on the SD simulation method [26]. In this paper, we use Vensim PLE 6.3 software to establish an SD model of strategic materials cross-border supply chain decision-making and conduct simulation analysis to explore the evolutionary strategies among the subjects. According to the replication dynamic equation discussed before, the SD model is shown in Figure 1.

4.2. Simulation Results and Sensitivity Analysis for Different Scenarios

The initial conditions of the model are set as follows: the initial time is 0, the final time is 12 months, and the time step is 0.0015625 [27]. According to the research [28,29], based on the real situation and the assumptions of the model, the revenue level for the owner-operated charging station is 100 units, the cost of retrofitting to connect the charging station to the platform for network control and unified settlement is 60 units, the revenue increase for the charging station owner’s participation in the sharing platform is 20 units, the idle loss for the charging station owner is 150 units, and the social efficiency loss for the idle charging station is 200 units. The government’s cost for building the sharing platform is 80 units, the subsidy cost is 20 units, the management fee charged for the charging station operation is 40 units, and the social efficiency gain from the charging station utilization improvement is 150 units. The initial values for , β , and γ are set to 1, while P l and P h are set to 0.1 and 0.7, respectively [30,31].
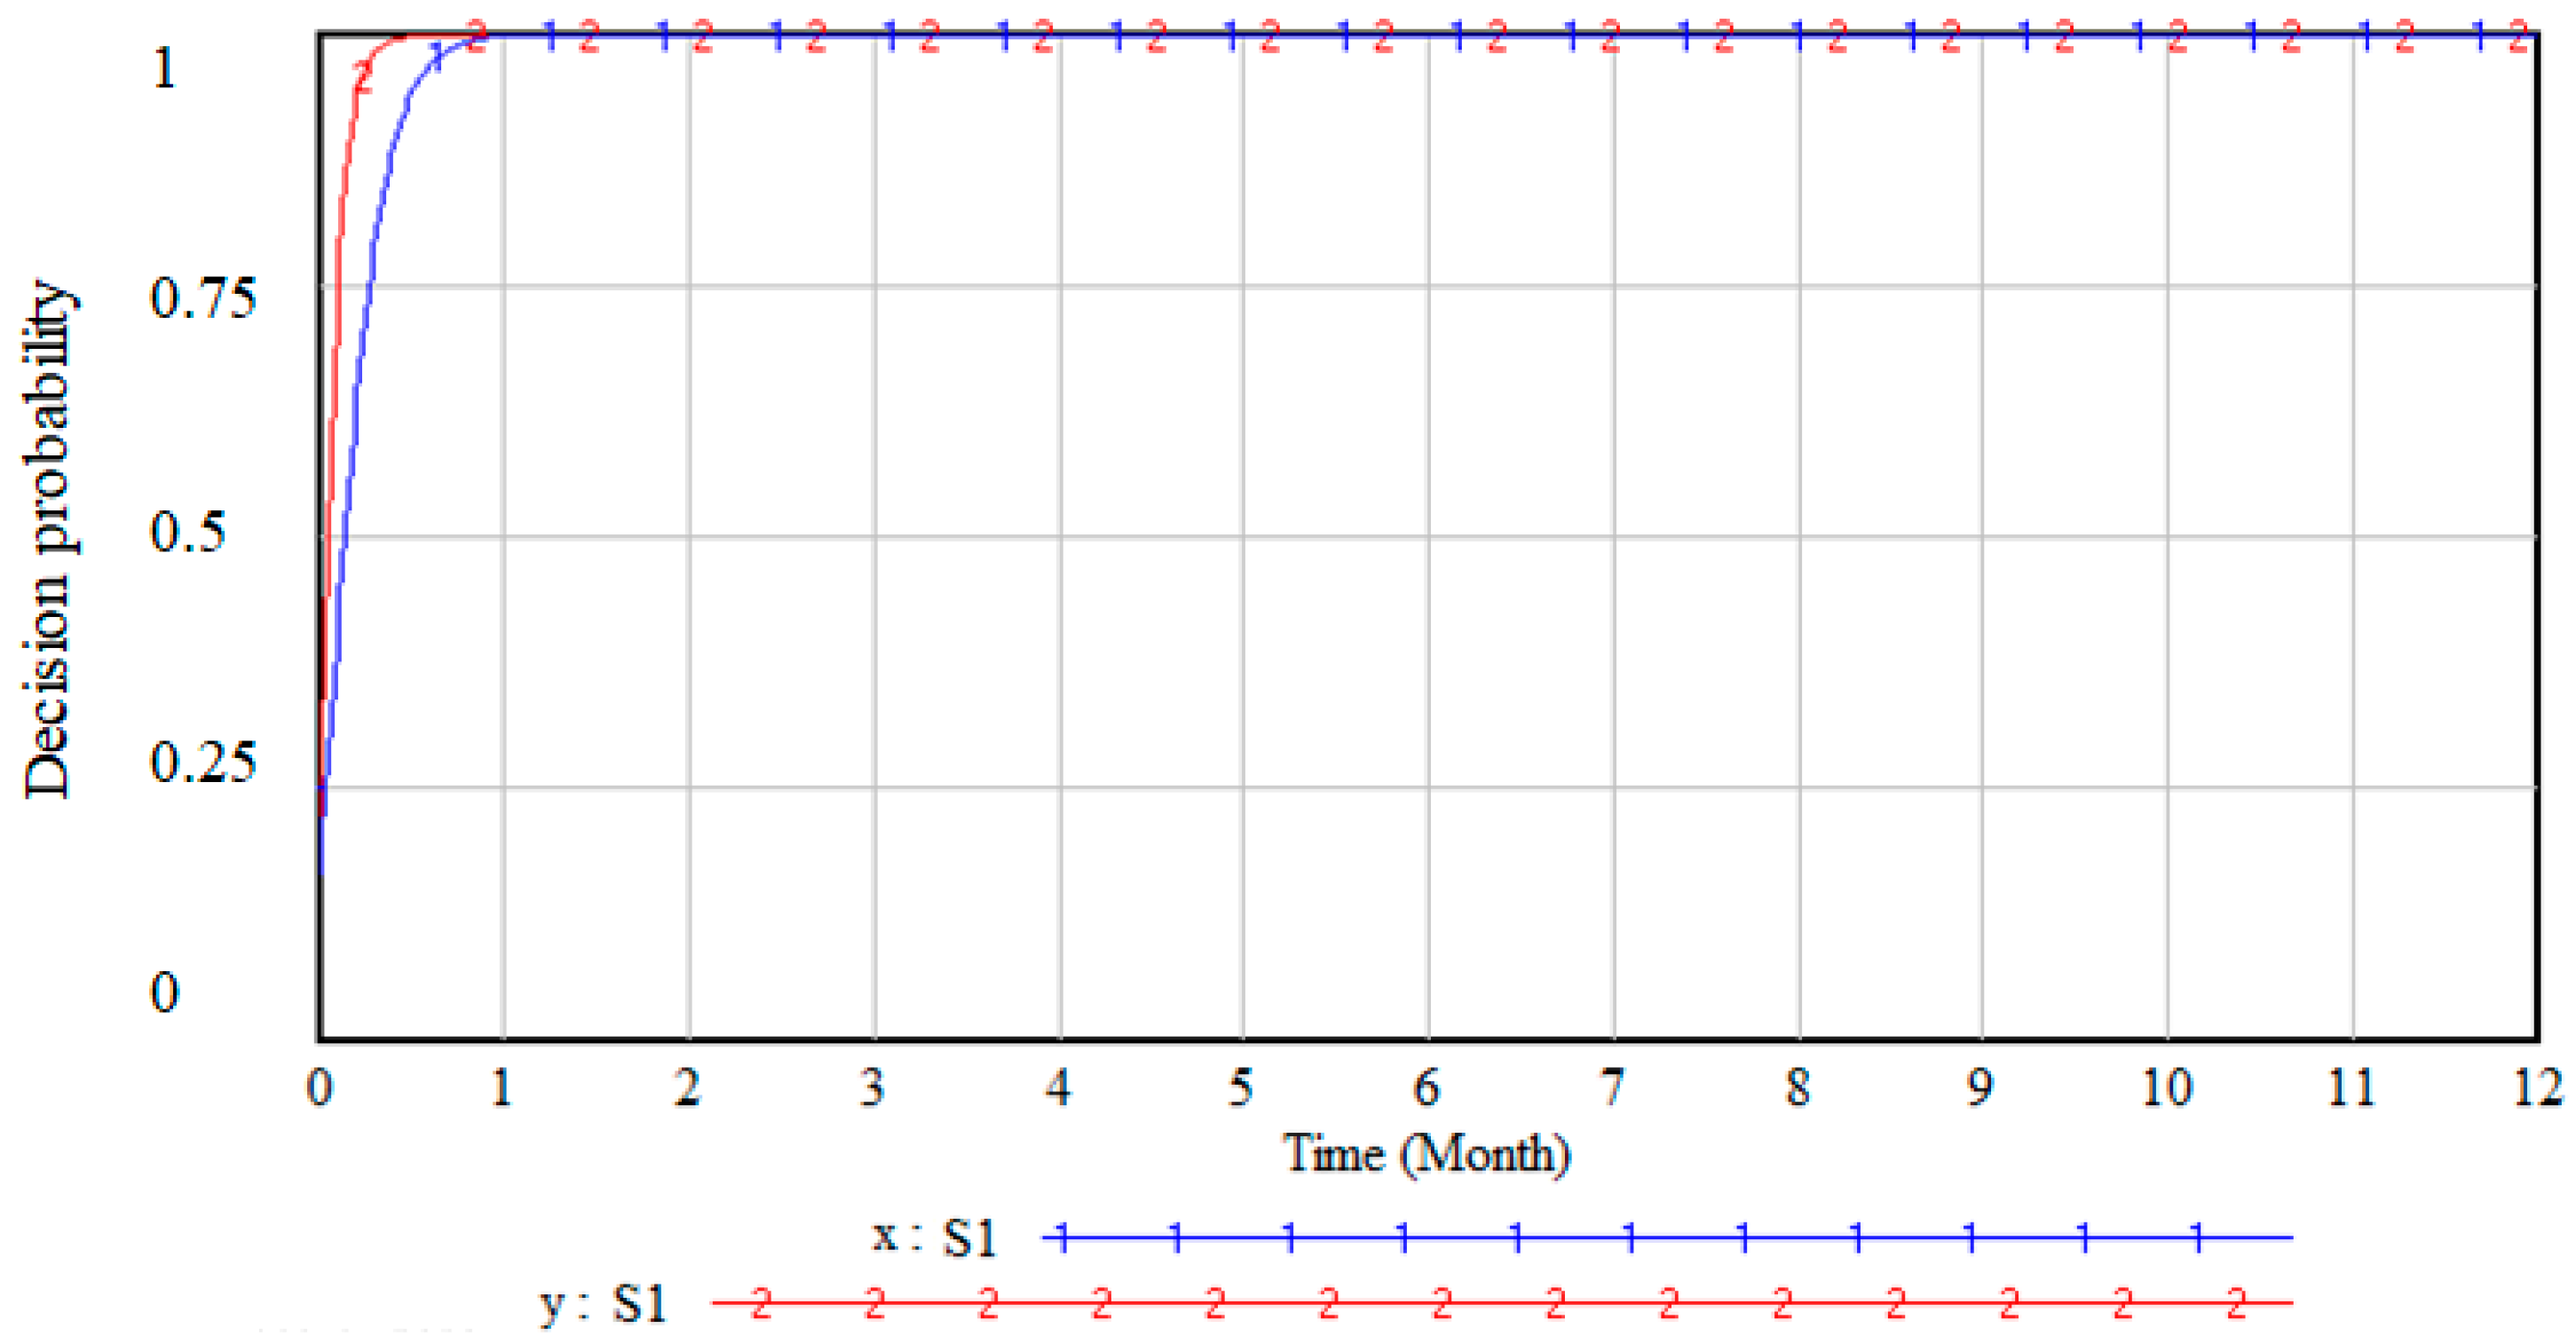
With the initial values input, the simulation results are shown in Figure 2. Under the initial parameter conditions, both the platform operator (government) and the charging station owner take active decisions, and a stable equilibrium point (1,1) is reached, which is consistent with the rough analysis of evolutionary stability. Considering the intensity factors , β , and γ, and the charging station idle rate conditions, P l and P h , set in the model, different game scenarios are discussed, and simulation analyses are conducted with different parameter combinations based on the actual situation.
(1)
Sensitivity simulation for different cost intensity cases
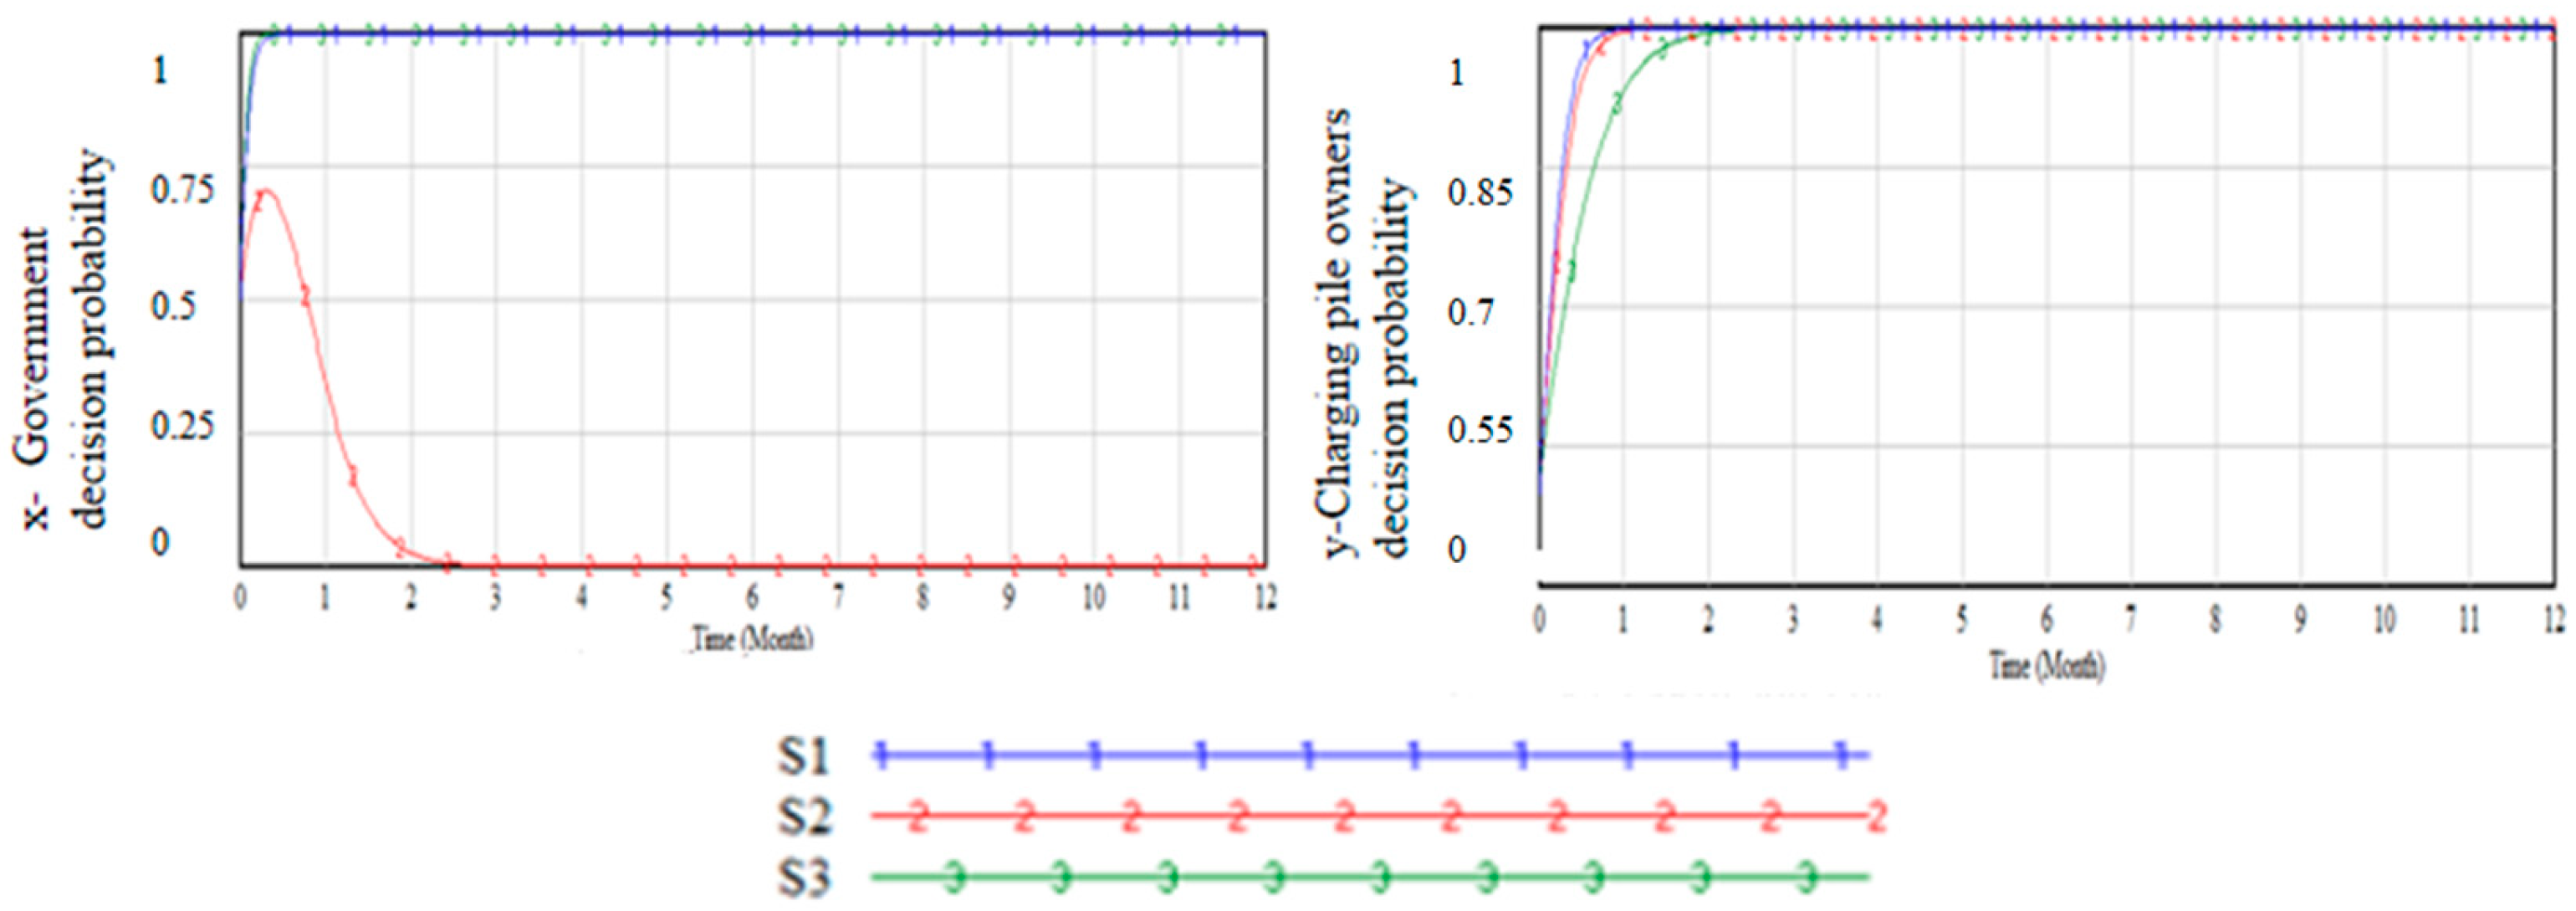
As the proactive measures taken by the platform (government) require expenditure, such as establishing a sharing platform and providing subsidies to platform users, the cost of policymaking has a significant impact on government decision-making. Only appropriate subsidies can stimulate the enthusiasm of charging station owners to join the platform and not cause excessive financial pressure. Different cost intensities will directly affect the value of A + β S P l E R . Therefore, it is necessary to discuss the values of the intensity parameter. Situation 1 is the initial parameter and serves as a control. Situation 2 is set to twice the parameter level of Situation 1, where the cost level is higher. Situation 3 is set when the cost level is lower. The value scenarios are shown in Table 4. The simulation results are shown in Figure 3.
As can be seen from the results, when the cost intensity increases significantly, the government’s strategy choice changes (indicated by S2), shifting from an active decision to an inactive one. This indicates that cost changes have a significant impact on decision-making, and the formulation of this policy puts significant pressure on the platform party’s (i.e., the government) finances. On the other hand, changes in cost intensity do not alter the decision outcome for the charging station owners, but a significant increase in cost intensity can accelerate their participation rate in platform decision-making.
(2)
Sensitivity simulation on the intensity of overhead costs of the platform party (government)
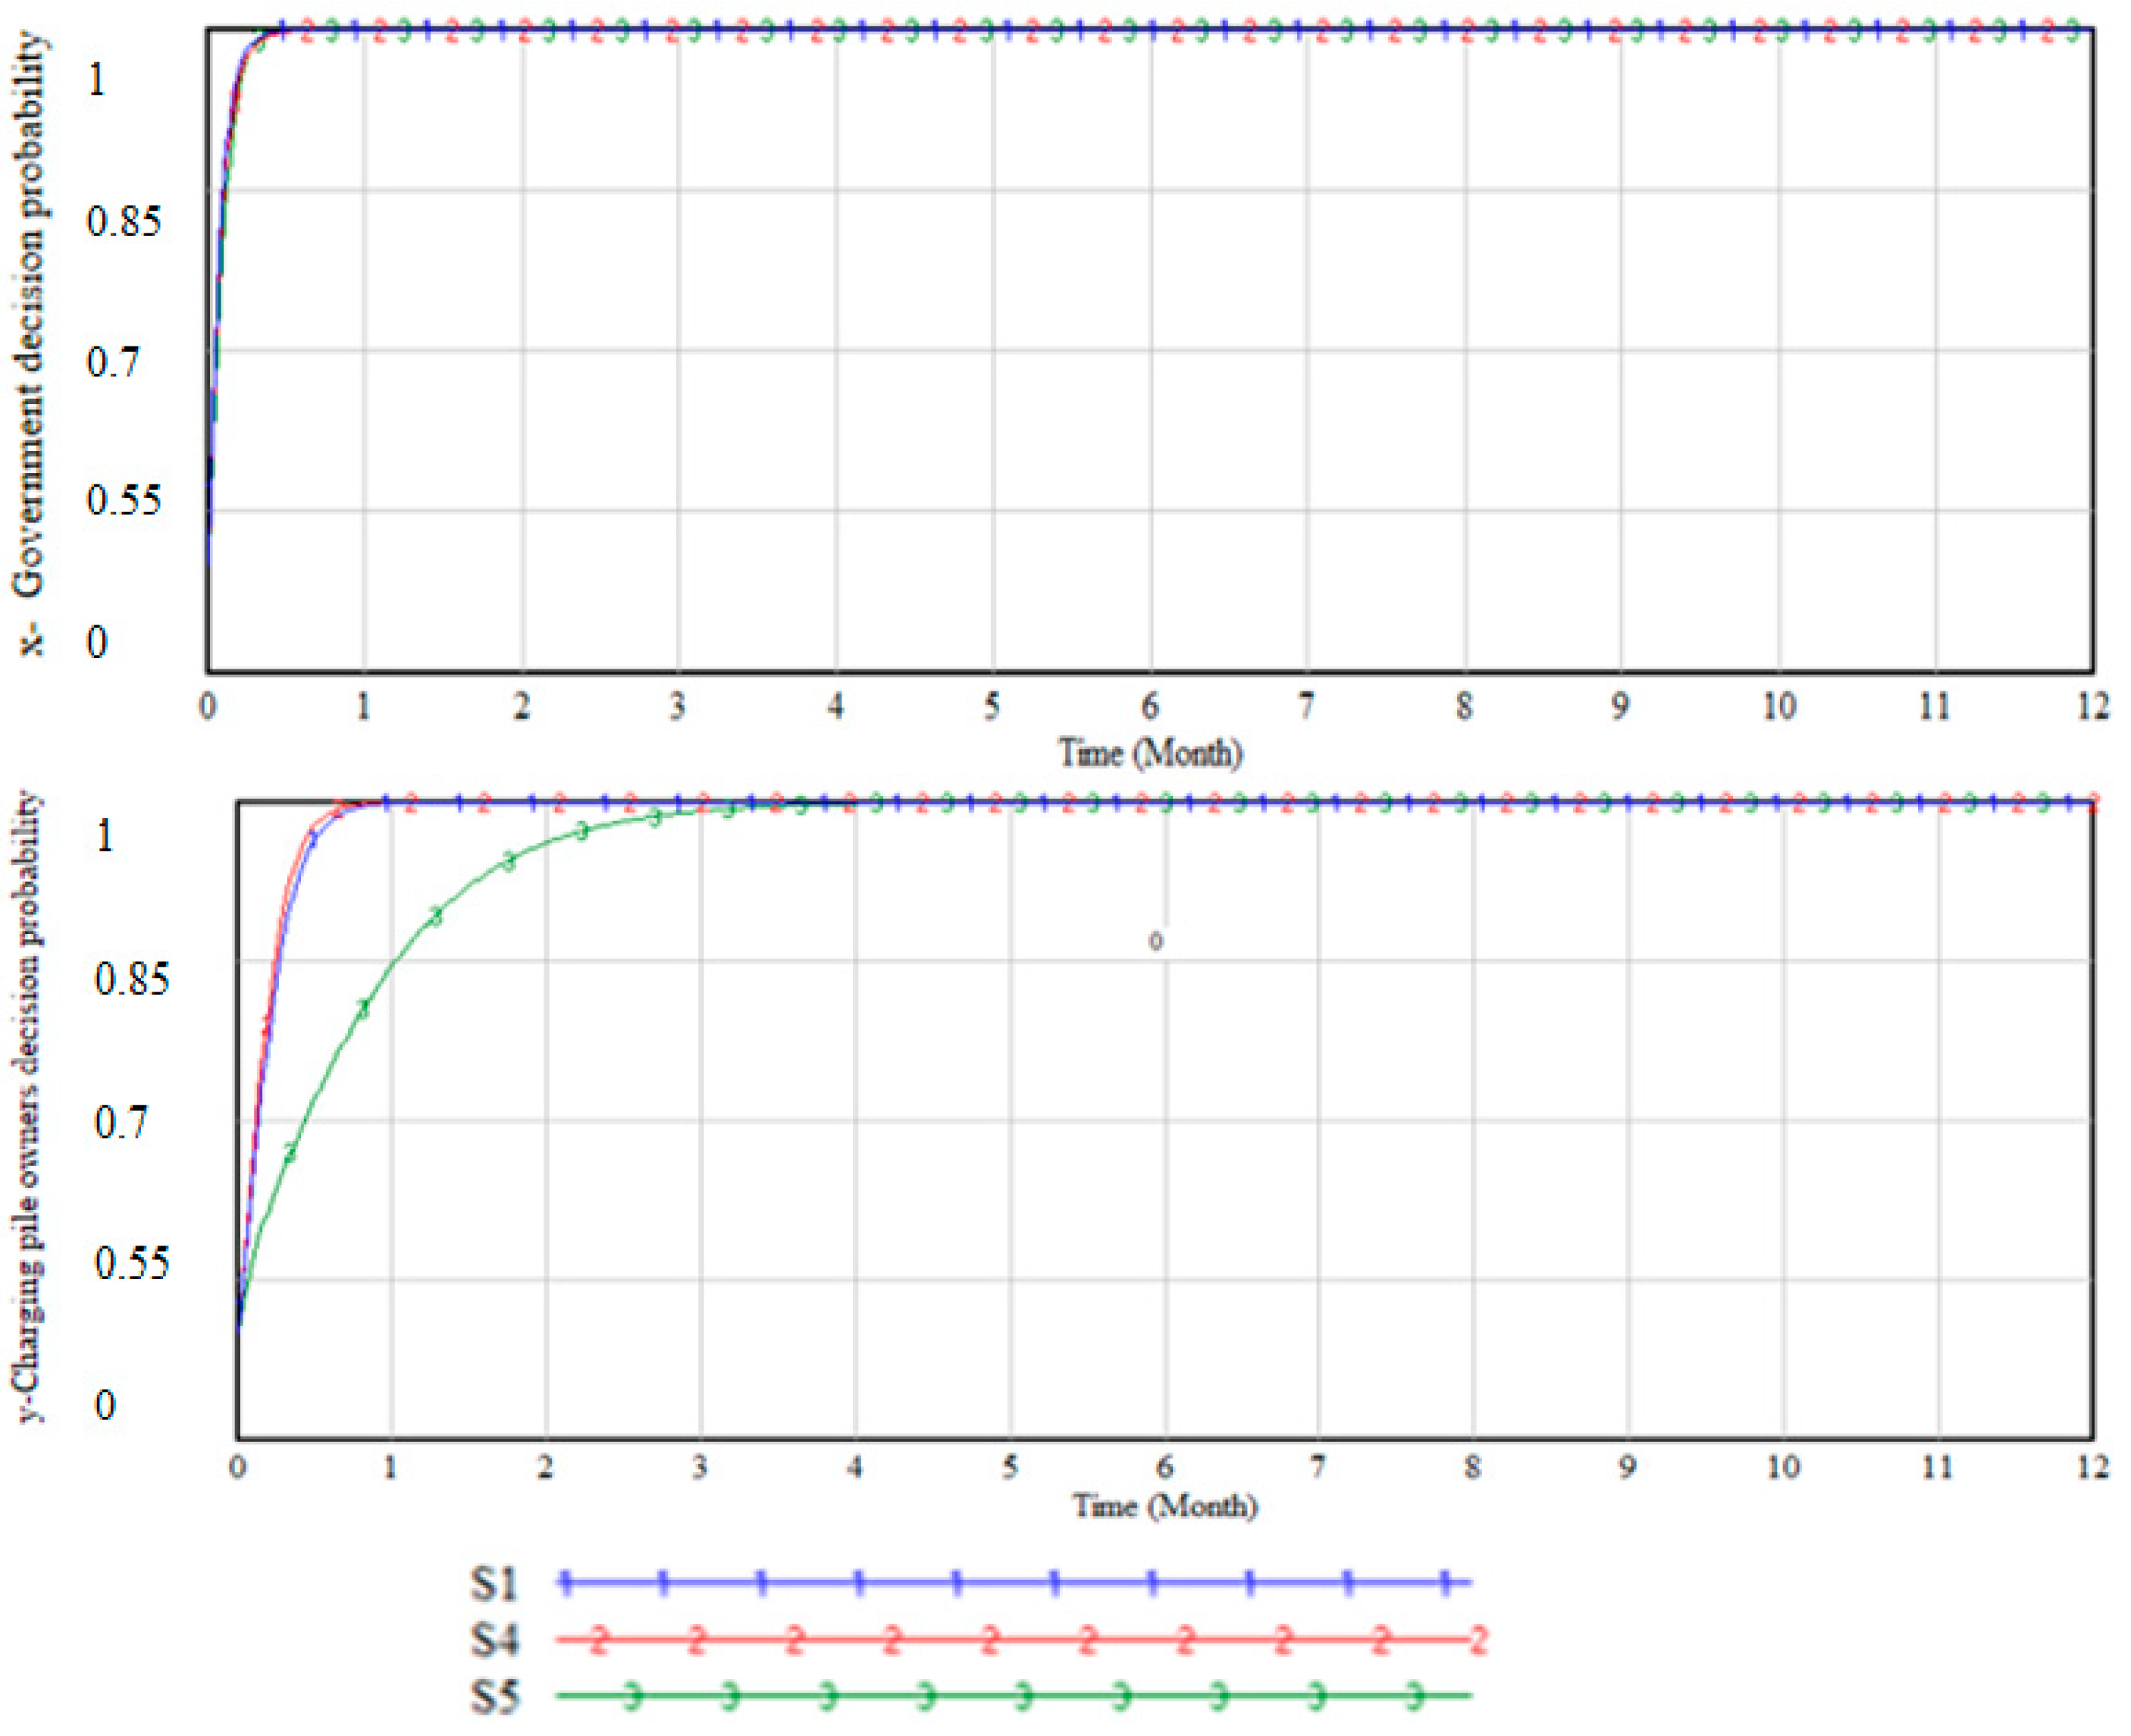
In the model design, within the game scenario where the platform (government) takes an active decision but the charging station owner chooses not to, the management fee for charging station operation is not exempted. γ is the intensity parameter for implementing this decision, with γ = 2 representing a high management fee level and γ = 0.5 representing a low management fee level, corresponding to scenarios 4 and 5 in Table 5, respectively. The simulation results are shown in Figure 3, compared with the initial scenario 1. The influence of different management fee levels on government policy choices is relatively small. The main impact of government decisions is still the social benefits of the policy, and the financial revenue generated by the management fee has a limited impact on decision-making. The increase in management fee intensity will accelerate the rate of charging station owners joining the sharing platform decision-making, reflecting the sensitivity of charging station owner decisions to costs. The simulation results are shown in Figure 4.
(3)
Sensitivity simulation on the idle rate of charging piles
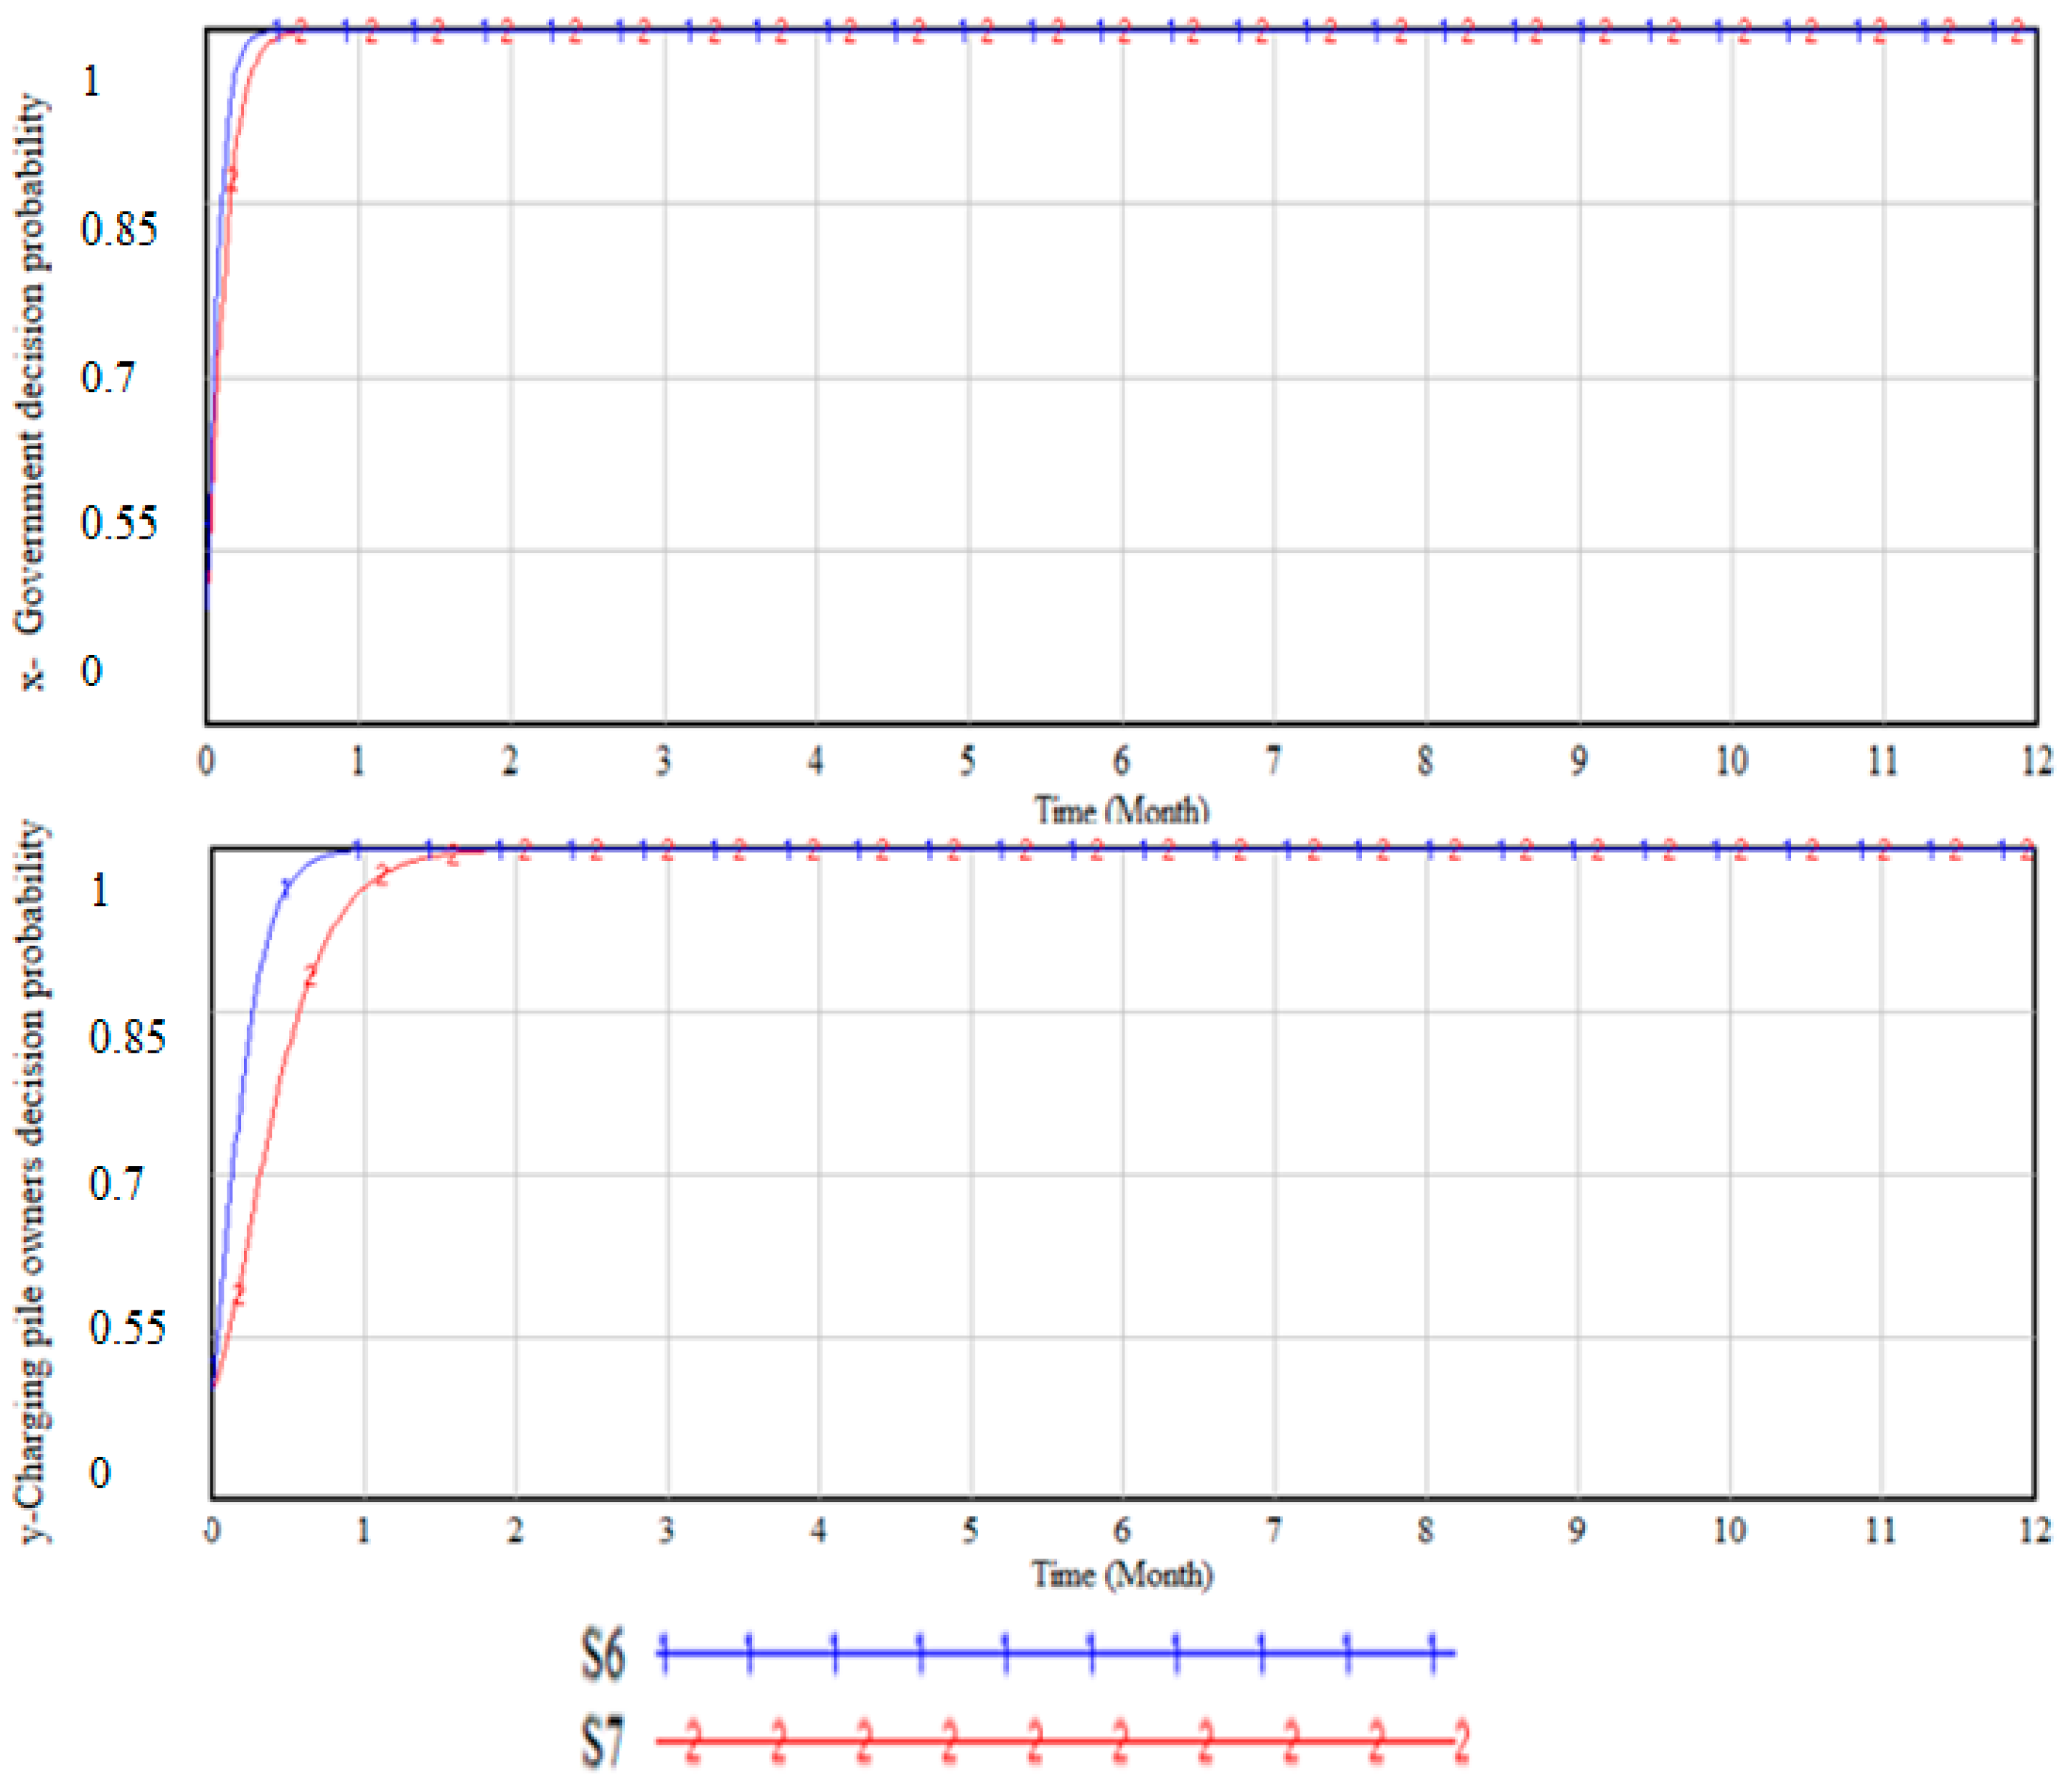
The idle rate of charging piles reflects the actual usage of the charging piles. Personal charging piles are often used 1–2 times a week and have a high idle rate. The overall idle rate of charging piles in an urban area reflects the adaptation level of the overall charging infrastructure configuration, and reducing the overall idle rate is also an important goal for the charging pile platform operation to solve the uneven distribution of charging piles. Setting scenario 6 as the high idle rate scenario and scenario 7 as the low idle rate scenario, the idle rates are shown in Table 6, and the simulation results are shown in Figure 5. The decrease in idle rate will also reduce the rate at which the government and charging pile owners make joint decisions on platform sharing.
(4)
Sensitivity simulation on market development stages
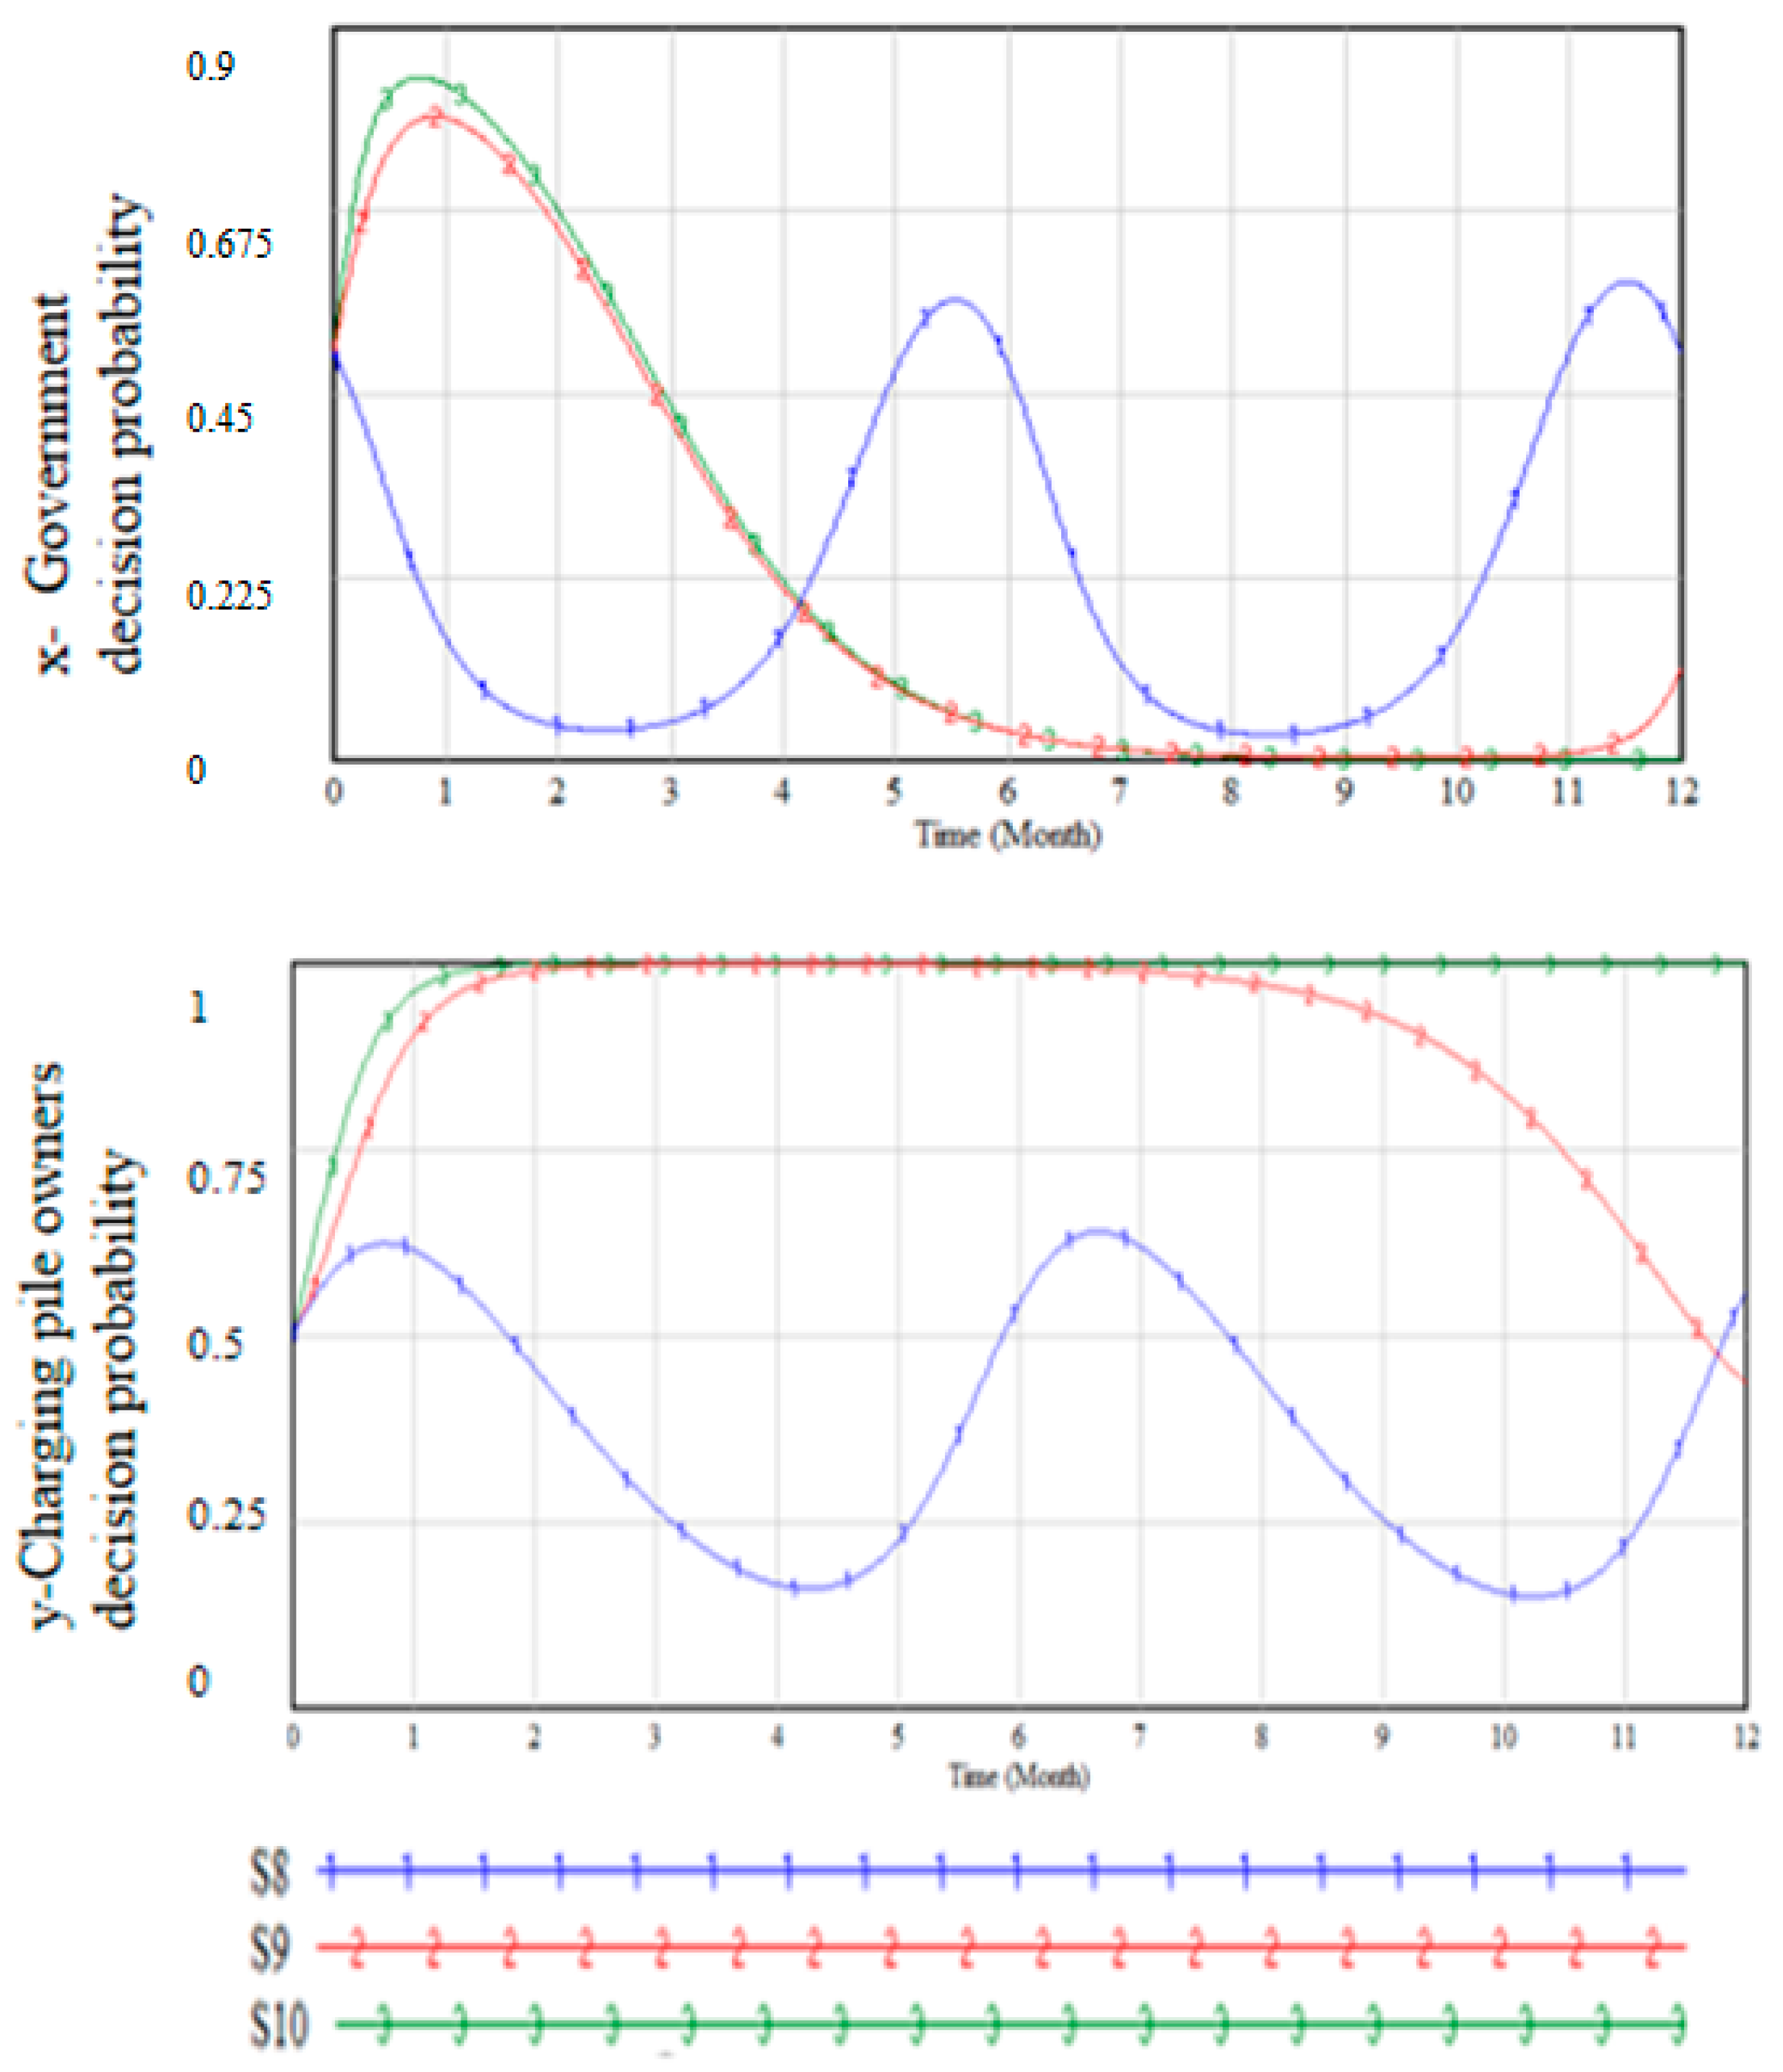
As many cities have already launched related shared charging station construction, the cost of charging station transformation will continue to change with the continuous maturity and progress of technology. Therefore, scenario 8 is designed for the later stage of the market, where the idle rate of charging stations enters the normal range, the shared charging station market tends to be saturated, and the cost of charging station operation and maintenance increases significantly. Scenario 9 represents the mature stage of the market, where the idle rate of charging stations enters the normal range, and the transformation cost gradually decreases to a certain level as the market size expands. Scenario 10 represents the initial stage of the market, where personal charging stations grow rapidly, resulting in a rise in the overall idle rate of charging stations, and the shared charging station market is just starting, with high transformation prices. The coefficient values under each scenario are shown in Table 7.
Under the condition that the idle rate enters the normal range, the adjustment of the decision-making behavior of both parties increases with the increase in retrofitting costs, leading to unstable fluctuations and making the game process difficult to control. It is challenging to obtain an evolutionarily stable strategy. Additionally, sensitivity simulations for varying cost intensities indicate that the increasing costs of sharing platforms will expedite private charging pile owners’ decision-making to participate in shared charging piles. Furthermore, according to sensitivity simulations on idle rates of charging piles, a decrease in idle rates will reduce the decision rate of private charging pile owners to join shared charging piles. The decision of private charging pile decision-makers is influenced by two opposing factors. The simulation results are shown in Figure 6. When comparing S8 and S10, it was found that as the cost increases and the idle rate decreases, the stable state of S10 joining the sharing platform changes to an unstable and fluctuating state, similar to that shown in S8 in the figure. This reflects that changes in idle rates have a dominant influence on decision-making.
(5)
Sensitivity simulation on the parameters of social benefits and charging post owners’ revenue levels
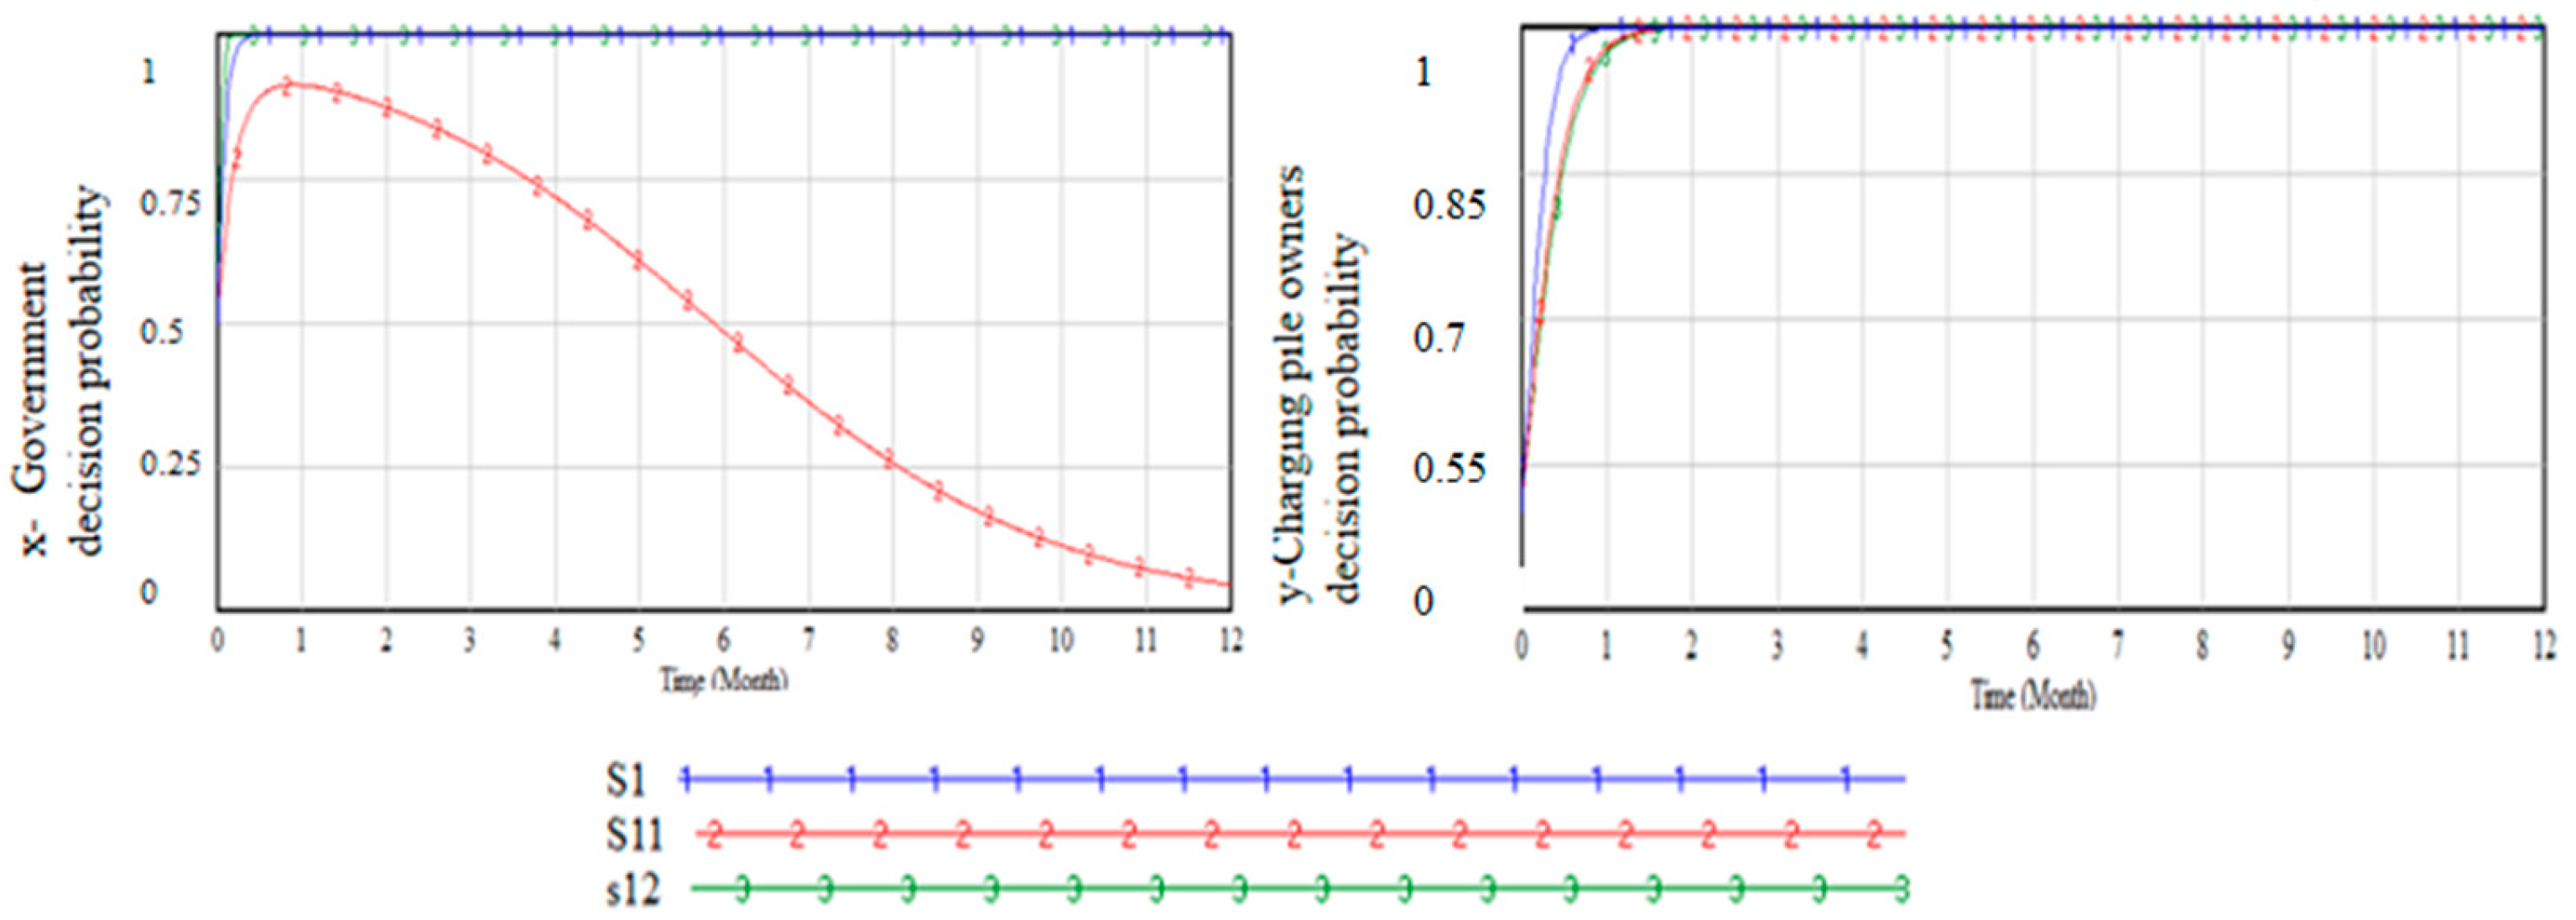
The social benefits reflect the improvement of the travel experience of electric vehicle drivers and the carbon reduction benefits brought by some private car owners choosing to purchase or replace their cars with electric vehicles, due to the overall increase in the use of charging stations in the city. The quantification of this parameter needs to consider both the overall development of electric vehicle travel and the overall social benefits brought by the development of low-carbon transportation in the city. This is challenging to accurately determine and is compared in two scenarios, high and low. Similarly, the normal revenue level of charging station owners is also compared in two scenarios, high and low, with the parameter values shown in Table 8. The simulation results, as shown in Figure 7, demonstrate that as the social benefits significantly decrease, the government’s decision-making changes from proactive to inactive. Conversely, the improvement of social benefits accelerates the government’s decision-making process towards a more proactive approach, reflecting the government’s consideration of overall social development. The decision of charging station owners remains unchanged.
(6)
Sensitivity simulation on charging stake owners’ participation in a revenue-sharing platform
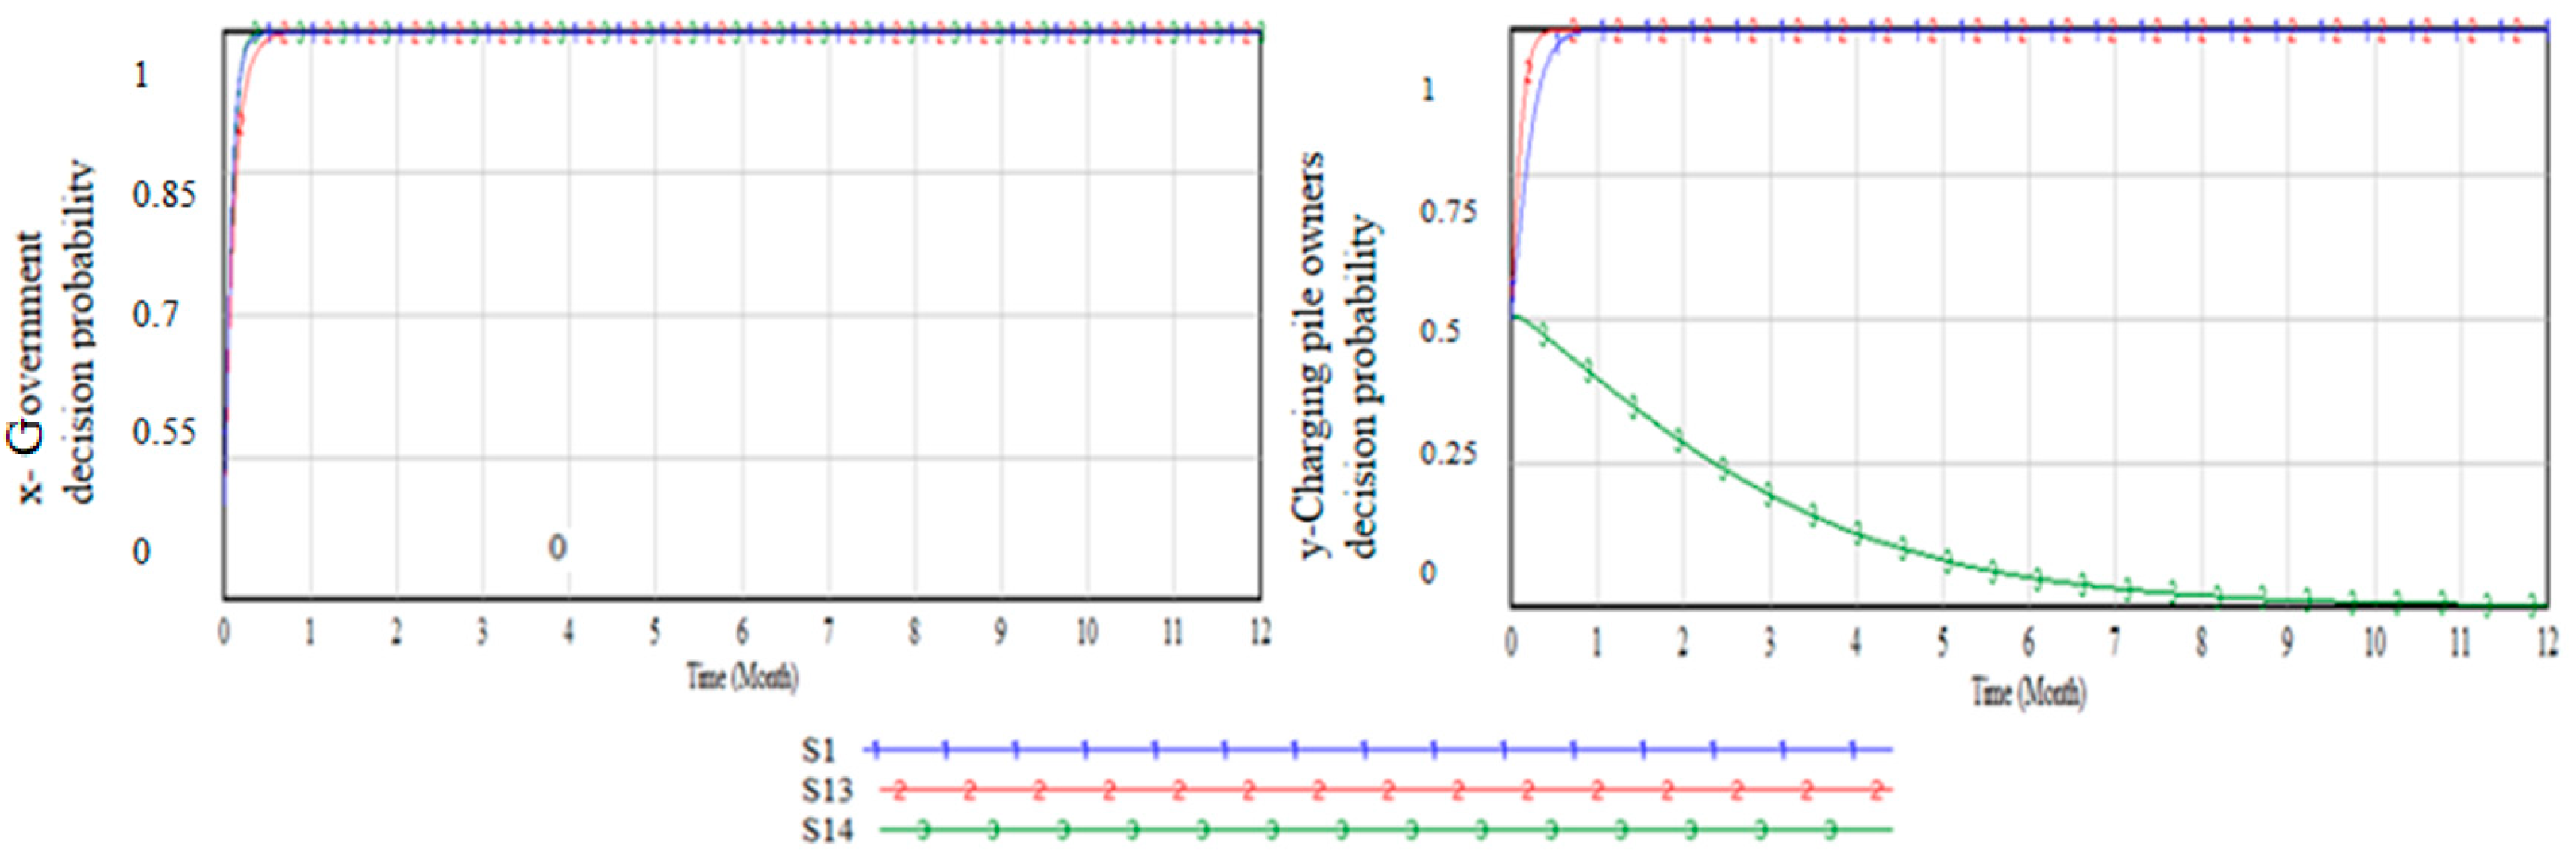
The costs and benefits of participating in a sharing platform are important considerations for charging station owners in making decisions from a business perspective. In this study, we compared two scenarios: one where the benefits of participation increase while costs remain unchanged (Scenario 13), and another where the benefits remain constant while costs increase (Scenario 14). The parameter values used in the simulation are presented in Table 9, and the simulation results are shown in Figure 8. When the benefits of participation in the sharing platform increase, charging station owners accelerate their decision-making process to participate. However, when the costs of retrofitting the charging stations increase significantly, while the benefits remain unchanged, charging station owners switch from a participation strategy to a non-participation strategy. The government’s decision remains unchanged, but the speed at which it adopts an active strategy increases when charging station owners switch to a non-participation strategy.
In conclusion, the costs and benefits of participating in a sharing platform are critical factors for charging station owners in making business decisions. As shown in our simulation results, charging station owners are more likely to participate when the benefits increase. However, if the costs increase significantly, they may choose to opt out of the sharing platform. These findings have important implications for policymakers and charging station owners in promoting the adoption of electric vehicles and developing sustainable transportation systems.
The Table 10 below illustrates the impact of each factor on the decision-making process for both parties, based on a comprehensive sensitivity analysis.
The above analysis provides a more definitive conclusion regarding the impact of individual factor changes and simultaneous changes in multiple acting factors on decision-making for both sides of the game. Subsequently, we conducted further analysis to determine which factor is dominant when two or more factors change simultaneously with opposing effects.
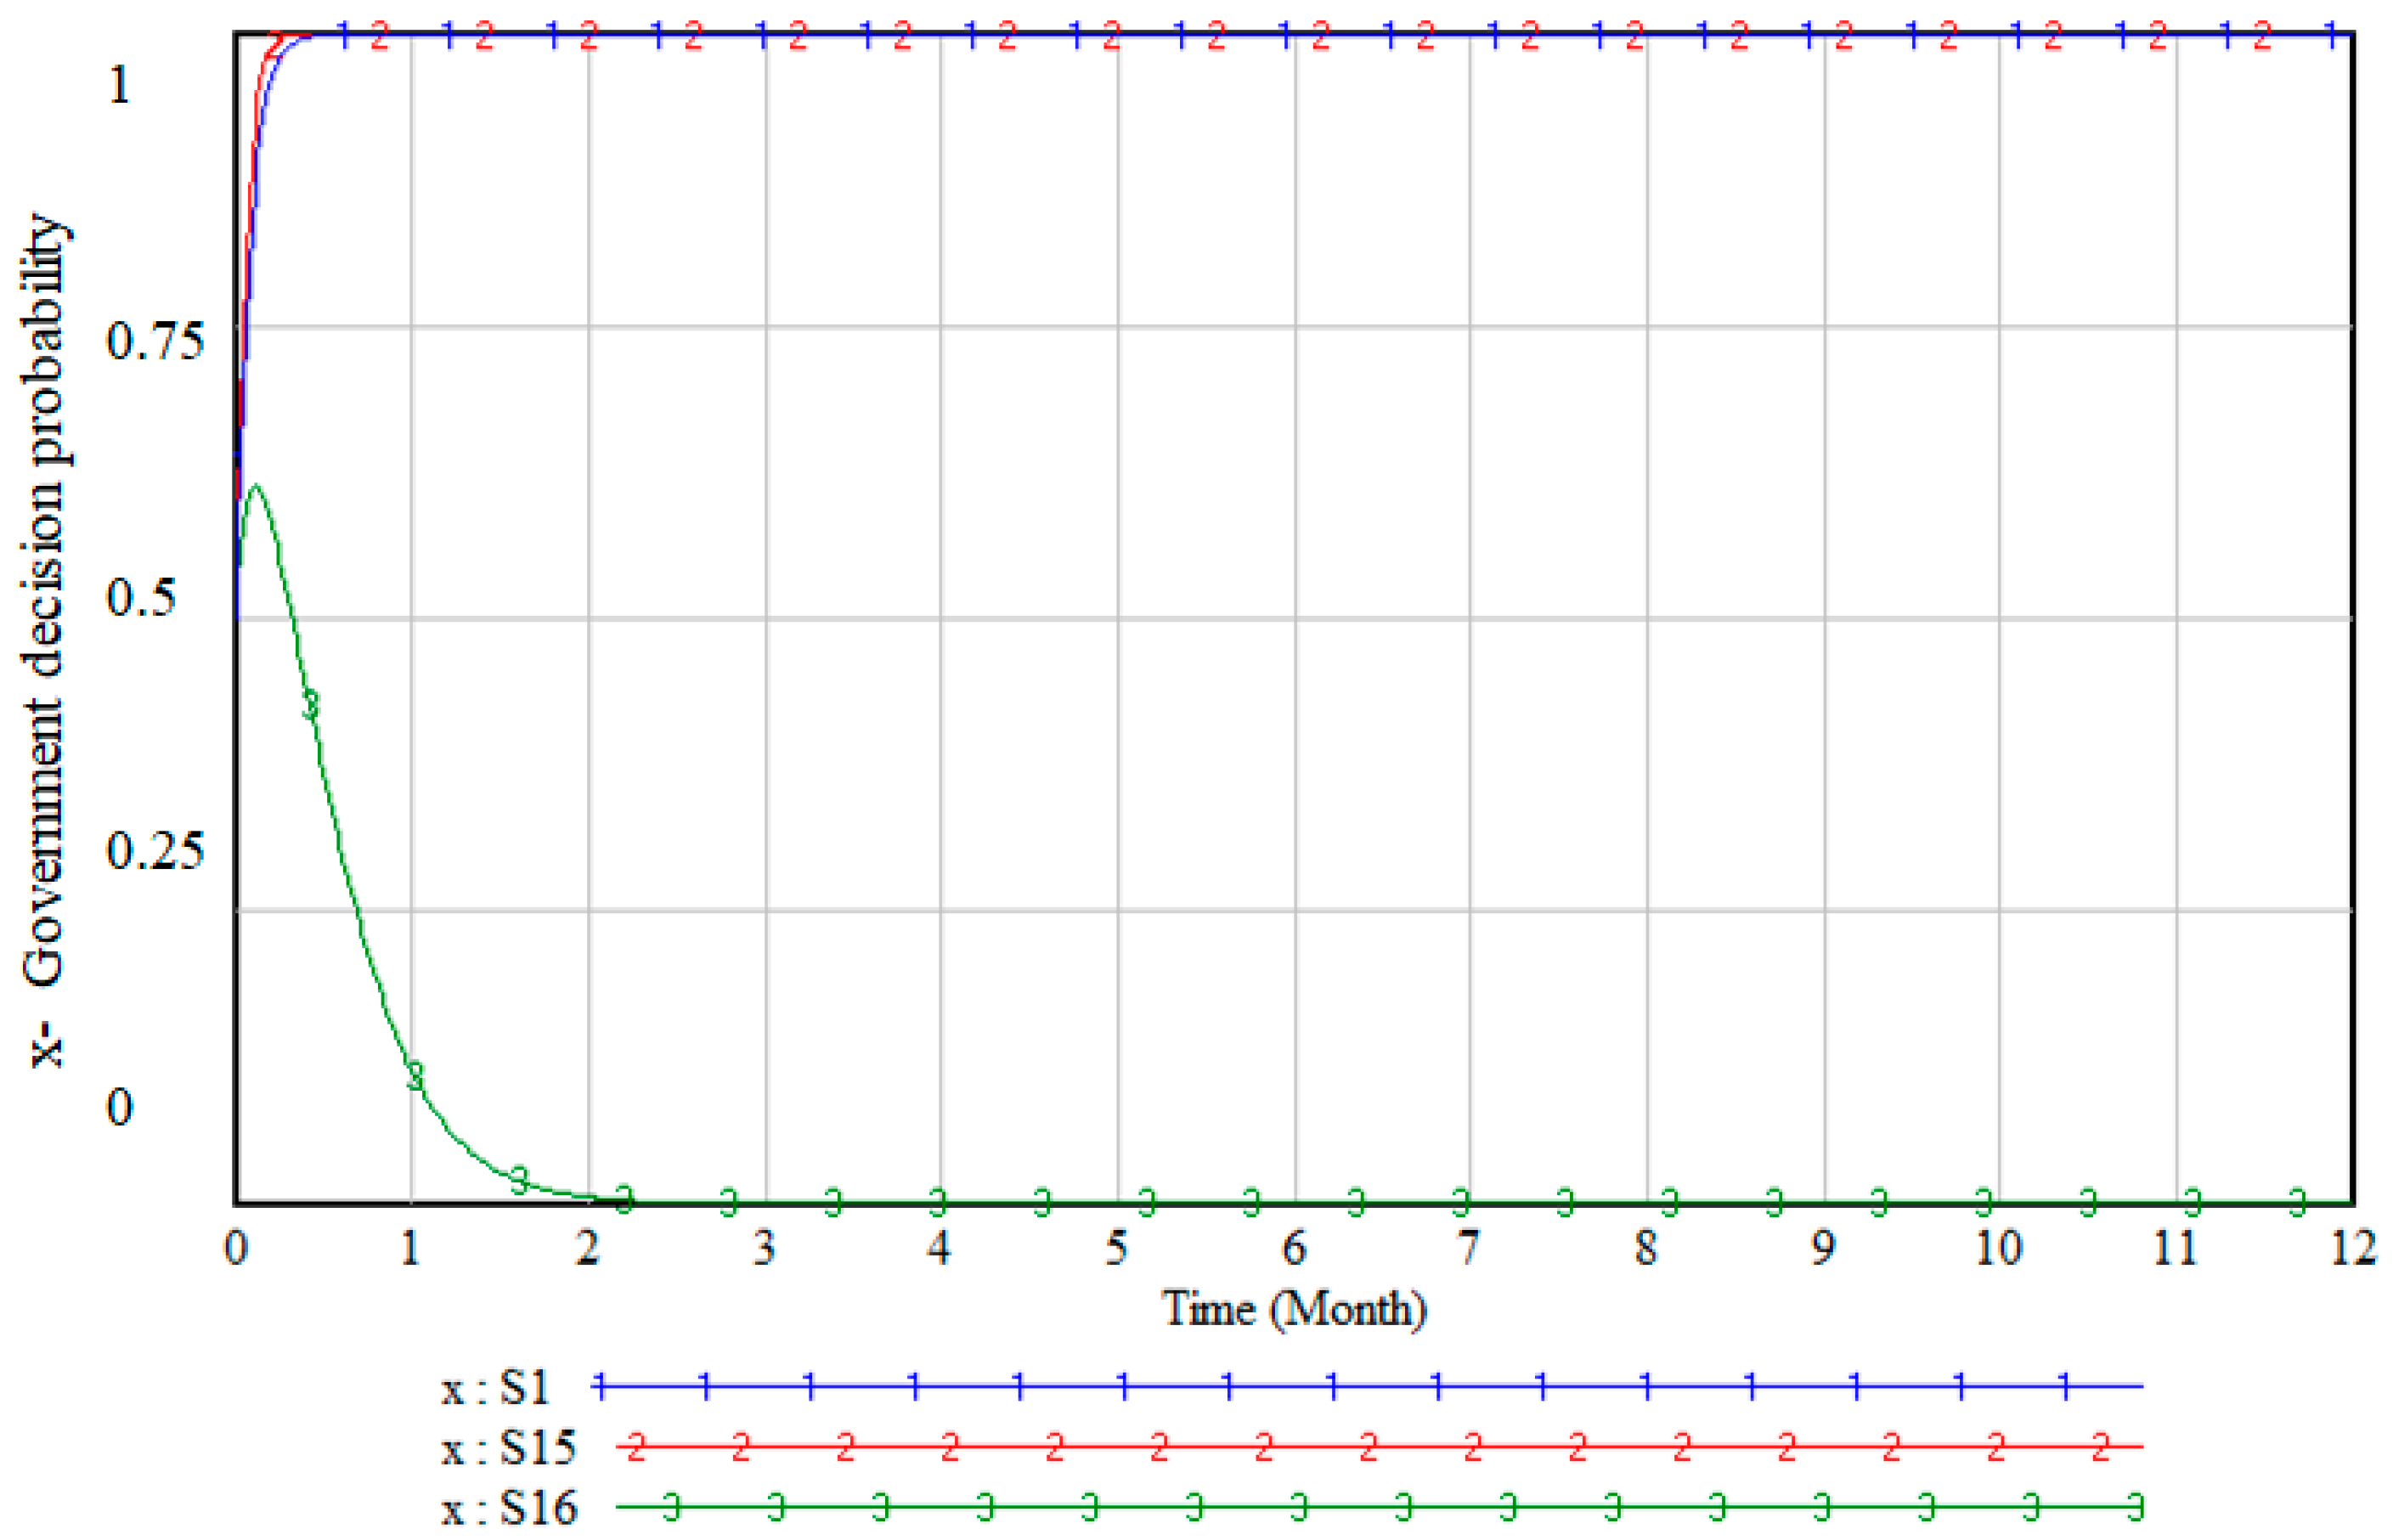
The impact of simultaneous changes in government subsidy intensity and social benefits on government decision-making was analyzed, taking into account their differing effects (Table 11). Scenarios 15 and 16 were designed to compare against the baseline scenario, where the government’s decision shifts from positive to inactive, while keeping other parameters constant and with a significant increase in subsidy costs. This is depicted by line S15 in the figure, which aligns with the findings of our previous sensitivity analysis. In scenario 16, a significant increase in the social benefit parameter results in a positive shift of the decision, as depicted by line S16 in the Figure 9. The decision rate also increases, compared to scenario 1, indicating that social benefit has a greater impact on government decisions, even with equal multiplicative changes of both factors.
Three factors, namely participation platform revenue, idle rate, and retrofitting cost with distinct roles, are selected to analyze their simultaneous impact on private charging pile owners’ decision-making process (Table 12).
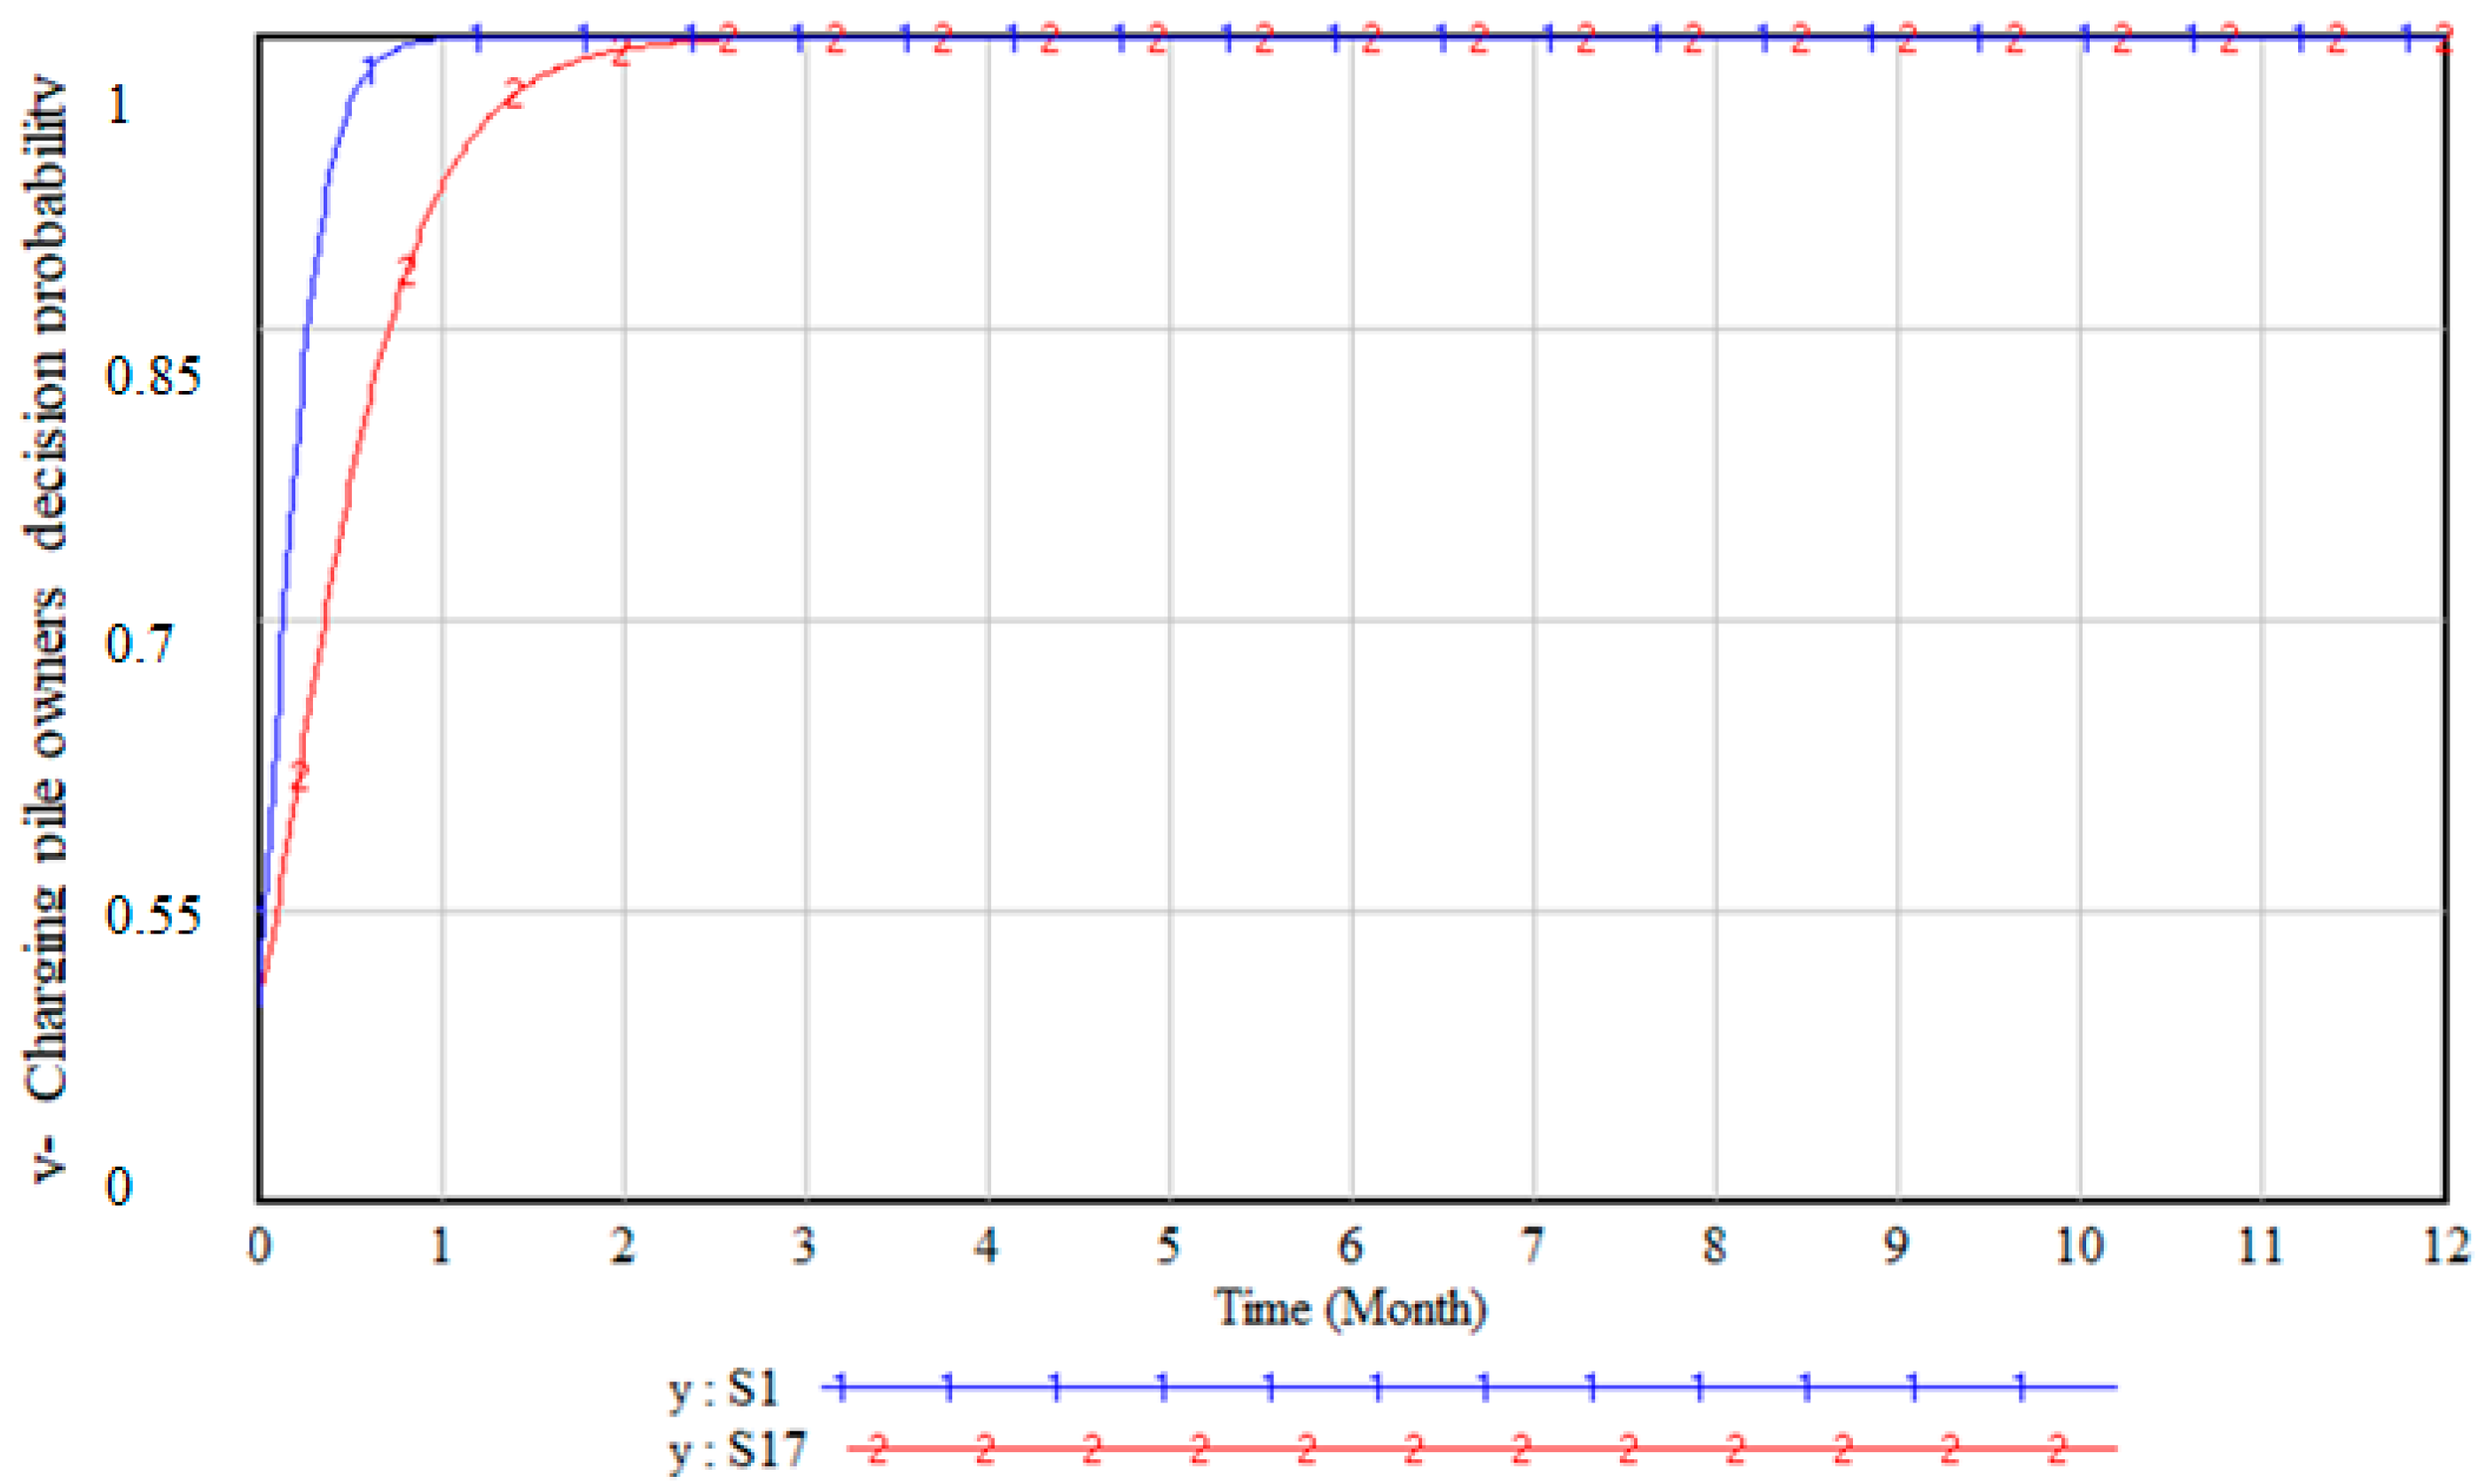
Scenario 17 is designed to compare with the initial situation. With all other parameters held constant and indicator values increased by a factor of two, private charging pile owners exhibit a decreased rate of positive decision-making compared to Scenario 1’s initial state, as depicted in line S17 in the Figure 10. This reflects the greater negative impact of retrofitting costs on decision-making.
5. Conclusions

As urban transportation advances towards environmentally friendly and low-carbon solutions, the popularity of electric private cars is on the rise. However, the issue of unreasonable distribution and underutilization of charging stations has hindered residents’ choices for green travel. To address this problem, promoting a “private charging station sharing” mode is necessary. In this article, a game theory model and a system dynamics-based evolutionary simulation model are constructed to analyze the decision-making benefits of both sides in the private pile-sharing mode, involving the charging pile owner and the platform builder (government). We establish the evolutionary game payoff matrix for both decision-making parties to derive the mathematical expressions of their expected and average revenues. Based on the replication dynamic model, we formulate the replication dynamic equations for both parties and elucidate the functions of decision-making and related factors. Finally, a system dynamics simulation model is developed to facilitate computation and resolution. The model innovatively incorporates an intensity factor to assign coefficients to relevant factors, thereby facilitating a more comprehensive analysis of the influence weights of each factor and enabling multi-scenario evolutionary game simulation. It combines the idle rate and platform cost level in an innovative way to propose an analysis of market development stages, making the model analysis dynamic and providing strong support for government decision-making timing. In conjunction with the actual development situation, a sensitivity analysis of external factors, such as government subsidies and the advancement of private charging pile sharing technology, is conducted to provide a comprehensive explanation of their impact mechanism and effect results on decision-making behavior among game players, leading to the following conclusions:
(1)
Shared charging piles are a feasible solution to alleviate the imbalance of vehicle pile configuration, promote the low-carbon development of urban transportation, reduce the idle rate of existing charging piles, and provide more convenient charging services for urban electric vehicle users, which meets the interests of both the government and charging pile owners. Both sides will weigh the benefits (including social benefits) and costs of implementing the charging pile-sharing strategy to make decisions. A shift from a proactive strategy to a non-proactive strategy by either side will accelerate the decision of the other party.
(2)
When Δ G I + P l L + β S + γ F > 0 , i.e.,   M + N > 0 , and P l E + R > A + β S , the comprehensive benefits of the charging pile owner joining the sharing platform strategy, such as the management fee reduction, financial subsidies, and idle rate reduction, exceed the charging pile modification expenses, and the social benefits brought by the government’s proactive decision-making are greater than the investment in building the sharing platform, the system obtains an evolutionarily stable strategy. Under this circumstance, both parties have the driving force to actively engage in charging sharing platforms, which conforms to the pursuit of benefits by charging pile owners and the maintenance of social public interests by the government.
(3)
Policy decisions to improve the controllability of the strategic material cross-border supply chain are affected by external factors such as international market prices and international geopolitical situations. When the cost intensity increases significantly, the government tends to adopt a non-proactive policy, but charging pile owners will accelerate the decision to carry out supply chain integration. When the risk increases significantly, it will also accelerate the rate at which the government and charging pile owners carry out supply chain integration decisions. However, simultaneous significant fluctuations in price and risk will make the decision-making behavior of both parties unstable and difficult to control, and it is difficult to obtain an evolutionarily stable strategy during the game process.
(4)
The analysis indicates that simultaneous changes in government subsidies and social benefits have a greater impact on government decision-making when compared to the former alone. Three distinct factors, namely platform income, idle rate, and retrofit cost, were identified as having an effect on the private charging pile owners’ decision-making process. When these three factors change simultaneously, retrofit costs—acting as a negative factor—exert a more significant influence than the other two. In cases where platform costs and idle rates undergo simultaneous changes, the latter has a greater impact on private charging pile owners’ decision-making.
(5)
The government’s ability to bear the financial expenditure required for policy formulation determines the direction of government decision-making. When the government tends to adopt a non-proactive decision, charging pile owners will adopt a supply chain integration strategy to avoid the huge losses that may be caused by supply chain interruptions. When the international market price of strategic materials is in a stable operating state, it is the best time window for the government to implement relevant policies.

Author Contributions

Conceptualization, L.Z. (Lequn Zhu); data curation, X.L.; methodology, L.Z. (Lequn Zhu) and L.Z. (Linlin Zhang); writing—original draft, L.Z. (Lequn Zhu); writing—review and editing, R.Z. and X.L. All authors have read and agreed to the published version of the manuscript.

Funding

This research was funded by the National Key Research and Development Program, grant number 2022YFE0113500, the Tianjin Key Research and Development Program, grant number 22YFZCSN00030, and the project of TIWTE (TKS20230406).

Data Availability Statement

All data are provided in the paper.

Conflicts of Interest

The authors declare no conflict of interest.

References

  1. Song, J.; He, G.; Wang, J.; Zhang, P. Shaping future low-carbon energy and transportation systems: Digital technologies and applications. iEnergy 2022, 1, 285–305. [Google Scholar] [CrossRef]
  2. Li, Z. Development Mode and Strategy of Low-Carbon Urban Transportation. J. Eng. Stud. 2011, 3, 105–112. [Google Scholar] [CrossRef]
  3. Patt, A.; Aplyn, D.; Weyrich, P.; van Vliet, O. Availability of private charging infrastructure influences readiness to buy electric cars. Transp. Res. Part A Policy Pract. 2019, 125, 1–7. [Google Scholar] [CrossRef]
  4. Wang, H.; Ma, H.; Liu, C.; Wang, W. Optimal scheduling of electric vehicles charging in battery swapping station considering wind-photovoltaic accommodation. Electr. Power Syst. Res. 2021, 199, 107451. [Google Scholar] [CrossRef]
  5. Hu, X.; Yang, Z.; Sun, J.; Zhang, Y. Sharing economy of electric vehicle private charge posts. Transp. Res. Part B Methodol. 2021, 152, 258–275. [Google Scholar] [CrossRef]
  6. Funke, S.Á.; Sprei, F.; Gnann, T.; Plötz, P. How much charging infrastructure do electric vehicles need? A review of the evidence and international comparison. Transp. Res. Part D Transp. Environ. 2019, 77, 224–242. [Google Scholar] [CrossRef]
  7. Wang, Y.; Zhao, Z.; Baležentis, T. Benefit distribution in shared private charging pile projects based on modified Shapley value. Energy 2023, 263, 125720. [Google Scholar] [CrossRef]
  8. Zhao, Z.; Zhang, L.; Yang, M.; Chai, J.; Li, S. Pricing for private charging pile sharing considering EV consumers based on non-cooperative game model. J. Clean. Prod. 2020, 254, 120039. [Google Scholar] [CrossRef]
  9. Zhao, Z.; Zhang, L.; Zhu, J.; Li, S.; Song, X. Pricing of private charge sharing service based on bilateral bargaining game. Sustain. Cities Soc. 2020, 59, 102179. [Google Scholar] [CrossRef]
  10. Chen, J.; Huang, X.; Cao, Y.; Li, L.; Yan, K.; Wu, L.; Liang, K. Electric vehicle charging schedule considering shared charging pile based on Generalized Nash Game. Int. J. Electr. Power Energy Syst. 2022, 136, 107579. [Google Scholar] [CrossRef]
  11. Fu, Z.; Dong, P.; Li, S.; Ju, Y.; Liu, H. How blockchain renovate the electric vehicle charging services in the urban area? A case study of Shanghai, China. J. Clean. Prod. 2021, 315, 128172. [Google Scholar] [CrossRef]
  12. Hu, Y.; Wang, Z.; Li, X. Impact of policies on electric vehicle diffusion: An evolutionary game of small world network analysis. J. Clean. Prod. 2020, 265, 121703. [Google Scholar] [CrossRef]
  13. Vidhi, R.; Shrivastava, P. A review of electric vehicle lifecycle emissions and policy recommendations to increase EV penetration in India. Energies 2018, 11, 483. [Google Scholar] [CrossRef]
  14. Yan, Q.; Feng, T.; Timmermans, H. Investigating private parking space owners’ propensity to engage in shared parking schemes under conditions of uncertainty using a hybrid random-parameter logit-cumulative prospect theoretic model. Transp. Res. Part C Emerg. Technol. 2020, 120, 102776. [Google Scholar] [CrossRef]
  15. Xiao, H.; Xu, M. Modelling bidding behaviors in shared parking auctions considering anticipated regrets. Transp. Res. Part A Policy Pract. 2022, 161, 88–106. [Google Scholar] [CrossRef]
  16. Cheng, J.; Yi, J.; Dai, S.; Xiong, Y. Can low-carbon city construction facilitate green growth? Evidence from China’s pilot low-carbon city initiative. J. Clean. Prod. 2019, 231, 1158–1170. [Google Scholar] [CrossRef]
  17. Duan, W.; Li, C.; Zhang, P.; Chang, Q. Game modeling and policy research on the system dynamics-based tripartite evolution for government environmental regulation. Clust. Comput. 2016, 19, 2061–2074. [Google Scholar] [CrossRef]
  18. Zhao, X.; Bai, Y.; Ding, L.; Wang, L. Tripartite evolutionary game theory approach for low-carbon power grid technology cooperation with government intervention. IEEE Access 2020, 8, 47357–47369. [Google Scholar] [CrossRef]
  19. Zou, C.; Huang, Y.; Hu, S.; Huang, Z. Government participation in low-carbon technology transfer: An evolutionary game study. Technol. Forecast. Soc. Chang. 2023, 188, 122320. [Google Scholar] [CrossRef]
  20. Liao, D.; Tan, B. An evolutionary game analysis of new energy vehicles promotion considering carbon tax in post-subsidy era. Energy 2023, 264, 126156. [Google Scholar] [CrossRef]
  21. Cao, S.; Pan, L.; Mao, X. Research on the pricing strategies of electric vehicle charging operators based on an evolutionary game model. Energy Sustain. Dev. 2022, 71, 378–388. [Google Scholar] [CrossRef]
  22. Zhang, H.; Zhu, K.; Zhou, D.; Zhou, Y.; Xu, Z. Waste battery-to-reutilization decisions under government subsidies: An evolutionary game approach. Energy 2022, 259, 124835. [Google Scholar] [CrossRef]
  23. Taylor, P.D.; Jonker, L.B. Evolutionary stable strategies and game dynamics. Math. Biosci. 1978, 40, 145–156. [Google Scholar] [CrossRef]
  24. Hao, J.; Chen, J.; Chen, Q. Floating charge method based on shared parking. Sustainability 2018, 11, 72. [Google Scholar] [CrossRef] [Green Version]
  25. Pradel, B.; Fulda, A.S.; Huber, A. Sharing charging stations. A socio-economical study on sharing private charging stations for electric vehicles: Actors, social organizations and practices. In Proceedings of the 11th ITS European Congress, Glasgow, Scotland, 6–9 June 2016; Its European Congress: Lisbon, Portugal, 2016. [Google Scholar]
  26. Shan, S.N.; Duan, X.; Ji, W.Y.; Zhang, T.T.; Li, H. Evolutionary game analysis of stakeholder behavior strategies in ‘Not in My Backyard’ conflicts: Effect of the intervention by environmental Non-Governmental Organizations. Sustain. Prod. Consum. 2021, 28, 829–847. [Google Scholar] [CrossRef]
  27. Qiu, Y.; Shi, M.; Zhao, X. System dynamics mechanism of cross-regional collaborative dispatch of emergency supplies based on multi-agent game. Complex Intell. Syst. 2023, 9, 2321–2332. [Google Scholar] [CrossRef]
  28. Gnann, T.; Plötz, P.; Wietschel, M. Can public slow charging accelerate plug-in electric vehicle sales? A simulation of charging infrastructure usage and its impact on plug-in electric vehicle sales for Germany. Int. J. Sustain. Transp. 2019, 13, 528–542. [Google Scholar] [CrossRef]
  29. Cheng, H.; Luo, T.; Kang, C.; Xin, J.; Wan, H.; Pei, F.; Tian, X. An interactive strategy of grid and electric vehicles based on master-slaves game model. J. Electr. Eng. Technol. 2020, 15, 299–306. [Google Scholar] [CrossRef]
  30. Niu, B.; Chen, K.; Chen, L.; Ding, C.; Yue, X. Strategic Waiting for Disruption Forecasts in Cross-Border E-Commerce Operations. Prod. Oper. Manag. 2021, 30, 2840–2857. [Google Scholar] [CrossRef]
  31. Gong, S.; Gao, X.; Li, Z.; Chen, L. Developing a Dynamic Supervision Mechanism to Improve Construction Safety Investment Supervision Efficiency in China: Theoretical Simulation of Evolutionary Game Process. Int. J. Environ. Res. Public Health 2021, 7, 3594. [Google Scholar] [CrossRef]
Figure 1. System dynamics model of charging pile sharing platform decision-making.
Sustainability 15 10149 g001
Figure 2. Simulation results under the initial parameters.
Sustainability 15 10149 g002
Figure 3. Simulation results of the sensitivity of the system to cost intensity.
Sustainability 15 10149 g003
Figure 4. Simulation results of the sensitivity of the system to overhead intensity of the platform party.
Sustainability 15 10149 g004
Figure 5. Simulation results of the sensitivity of the system to the risk factor.
Sustainability 15 10149 g005
Figure 6. Simulation results of the sensitivity of the system to the international situation.
Sustainability 15 10149 g006
Figure 7. Simulation results of the sensitivity of the system to the level of social benefits and charging post owners’ benefits.
Sustainability 15 10149 g007
Figure 8. Simulation results of the sensitivity of the system to the costs and benefits of charging station owners participating in the sharing platform.
Sustainability 15 10149 g008
Figure 9. Simulation results of simultaneous changes in government subsidy intensity and social benefits.
Sustainability 15 10149 g009
Figure 10. Simulation results of simultaneous changes in participation platform revenue, idle rate, and retrofit cost.
Sustainability 15 10149 g010
Table 1. Payment matrix for both parties involved in the game.
OwnersPlatform Side—Government
ActiveNot Active
Participation( R A β S , G + Δ G + β S I )( P l E , G + Δ G P l L I )
Non-participation( R + γ F A P l E , G P l L γ F )( E , G P h L )
R—Social benefits from increased utilization of charging piles. A—Cost of establishing the sharing platform. S—Cost of platform subsidy. F—The management fee levied by the government. G—Revenue level of charging pile owners’ operation. Δ G —Increased revenue from the participation of charging pile owners in the sharing platform. P—Charging pile idle rate, for low idle, for high idle. L—Idle loss of charging pile owners. I—The transformation cost of charging pile access to the platform. E—Social benefit loss of charging pile idleness. , β , γ —Intensity factor of platform construction, subsidy, and management costs.
Table 2. Jacobi matrix results of five equilibrium points.
Equilibrium Point D e t J T r J
(0,0) B M B + M
(0,1) ( B + C ) M B + C M
(1,0) B ( M + N ) M + N B
(1,1) ( B + C ) ( M + N ) ( B + C + M + N )
( x * , y * ) U 0
Table 3. Stability of each equilibrium point.
Equilibrium Point D e t J T r J Stability
(0,0)>0>0Unstable
(0,1)<0To be determinedSaddle point
(1,0)<0To be determinedSaddle point
(1,1)>0<0ESS
( x , y )>00Center point
Table 4. Values of cost intensities in different scenarios.
ParameterSituation 1Situation 2Situation 3
120.5
β 120.5
Table 5. Values of overhead intensity of the platform party (government) in different scenarios.
ParameterSituation 1Situation 4Situation 5
γ120.5
Table 6. Idle rate values for different scenarios.
ParameterSituation 1Situation 6Situation 7
P l 0.10.30.1
P h 0.70.90.3
Table 7. Coefficient values for different market development stages.
ParameterSituation 8Situation 9Situation 10
322
P h 0.30.30.5
Table 8. Parameter values for social benefits and charging stake owners’ benefit levels in different scenarios.
ParameterSituation 1Situation 11Situation 12
R15075300
G10050200
Table 9. Parameter values of costs and benefits for charging station owners participating in the sharing platform under different scenarios.
ParameterSituation 1Situation 13Situation 14
Δ G 2010020
I6060100
Table 10. Influence of each factor on the decision-making of both sides of the game.
Influencing FactorsImpact on Decision-Making
Government Establish a Sharing PlatformPrivate Charger Owners Join the Platform
Platform construction costNegativePositive
Government subsidy intensityNegativePositive
Idle ratePositivePositive
OverheadPositive (extremely limited)Positive
Social benefitsPositiveNegative(extremely limited)
Participation in shared platform benefitsNegative (extremely limited)Positive
Retrofit CostPositive (extremely limited)Negative
Table 11. Government subsidy intensity and social benefit values under different scenarios.
ParametersScenario 1Scenario 15Scenario 16
β 204040
E200200400
Table 12. Platform revenue, idle rate, and retrofit cost values for different scenarios.
ParametersScenario 1Scenario 17
Δ G 2040
I60120
P l 0.10.3
P h 0.70.9
Disclaimer/Publisher’s Note: The statements, opinions and data contained in all publications are solely those of the individual author(s) and contributor(s) and not of MDPI and/or the editor(s). MDPI and/or the editor(s) disclaim responsibility for any injury to people or property resulting from any ideas, methods, instructions or products referred to in the content.