Article

A Signal Coordination Model for Long Arterials Considering Link Traffic Flow Characteristics

1
College of Civil Engineering and Architecture, Zhejiang University, Hangzhou 310058, China
2
Enjoyor Technology Co., Ltd., Hangzhou 311422, China
3
College of Information Engineering, Zhejiang University of Technology, Hangzhou 310023, China
*
Author to whom correspondence should be addressed.
Sustainability 2023, 15(20), 14874; https://doi.org/10.3390/su152014874
Submission received: 12 September 2023 / Revised: 4 October 2023 / Accepted: 12 October 2023 / Published: 13 October 2023
(This article belongs to the Special Issue Towards Green and Smart Cities: Urban Transport and Land Use)

Abstract

:
In order to improve the travel efficiency on a long arterial with massive signals, this paper proposed a mixed integer linear programming model, MaxBandLAM, to simultaneously optimize the arterial partition scheme and signal coordination schemes with the consideration of link traffic flow characteristics. The weighted sum of the two-way green bandwidths on links across the arterial was taken as its objective. The link volume to capacity rations were taken as the weights. The number of sub-zones, the allocation of signals and links, signal cycle, offset and phase sequence, the coordination speed, as well as the two-way green bandwidths of sub-zones and of links are the decision variables. A numerical test was carried out on a virtual arterial with twenty signals. The results indicate the scheme generated by the MaxBandLAM model can provide a more reasonable partition scheme and coordination schemes compared to those generated by Synchro and the models with no traffic flow characteristics of links consideration. For the scenario of dominating the main road through flows, the average delay, average stop number, and average travel speed at intersections for all-turning flows and main road through flows in the MaxBandLAM scheme, all performed well.

1. Introduction

Signal coordination has been extensively recognized as one of the most efficient and economic measures to improve operation efficiencies of traffic systems, mitigate traffic congestion, and reduce stop numbers and emissions in travel. It makes traffic flows traverse successively signalized intersections smoothly through jointly adjusting their signal cycles, phase sequences, and offsets. Due to this, in recent decades, a large number of scholars and traffic engineers are dedicated to the theoretical study and practical application of this field.
Two targets are generally used to optimize signal timing schemes to smooth overall traffic flow propagation on an arterial, the green bandwidth and traffic performances. The green bandwidth is the portion of the signal cycle time, in which a platoon of vehicles can traverse adjacent signalized intersections at some given speed without stopping. The traffic performances usually refer to delay, stop number, queue, or emission. By analyzing the traffic flows’ travel characteristics impacted by signal timing schemes, then the corresponding performance-based coordination model will be derived. Hu used a full sample trajectory data to build a geometric relationship between the upstream intersection release pattern and the downstream intersection arrival pattern, and then coordinated neighbor signals with the goal of minimizing delay [1]. Zhang constructed a delay-minimization model on the basis of a cell-transmission representation of traffic dynamics [2]. Luo utilized the floating car trajectory data to capture the delay and queuing dynamics in arterial corridors [3]. Li extended the delay models for isolated intersections to the case of coordinated intersections by explicitly incorporating the effects of residual queue and signal offset [4]. Ding derived the delay and emissions calculation model under the two timing strategies of “intercepting the front vehicles” and “intercepting the rear vehicles” [5]. Despite the fact that traffic performances are more intuitive, Gartner et al. pointed out the performance-based coordination models may not achieve a gratifying success in practice without an adequate bandwidth [6]. Yang compared the bandwidth-based models and the performance-based models in an arterial with nine signalized intersections in Lawrence, Kansas, and found that the bandwidth-based approach outperformed the performance-based approach [7]. Therefore, we developed a traffic signal coordination model for an arterial with massive signals in this paper along the line of the green bandwidth. The remainder of this section mainly reviews the bandwidth-based models.
In 1966, Little firstly formulated a set of mixed integer linear programming model (MILP) to maximize the two-way green bandwidth for an arterial, called the MAXBAND model, by analyzing the relationship between the green bandwidth and signal timing parameters from a time–space diagram [8]. The cycle length, vehicle speed, and offset are the decision variables. Later, they advanced this work through introducing the phase sequence as a decision variable, which was proved to be an important factor influencing the green bandwidth by Tian [9,10]. Chang extended the MAXBAND model from a single arterial or triangular network to a multi-arterial closed network, taking into consideration the effect of left-turn phase sequence [11]. Considering different distributions of traffic flows and capacities on links along an arterial, Gartner developed an another type of bandwidth-maximizing model, the MULTIBAND model [6,12]. In their model, the bandwidth of each individual link was not restricted to be equal to other links, so the link bandwidth could better match its traffic flow and capacity. Zhang relaxed the symmetrical requirement of bands of the left- and right-hand side with respect to the progression line in MULTIBAND to acquire a greater whole bandwidth [13]. Furthermore, Zhang and Li, respectively, considered the uncertainties in signal timing scheme and vehicle progression time in the arterial signal coordination [14,15]. Considering the technological advantages of connected autonomous vehicles (CAV), Xu proposed an coordination control model for arterials with dedicated CAV lanes, with the aim to ensure that all CAVs can pass intersections without stopping [16].
Unfortunately, a desirable green bandwidth may not be attainable for an arterial with an excessive number of signalized intersections. The more signalized intersections, the more constraints in the bandwidth-based models, and a smaller optimal solution can be obtained. When the number exceeds sixteen, there are no two-way green bandwidth solutions [17]. To solve this problem, partition technology was created. The entire arterial was broken and divided into some small control sub-zones, firstly according to the correlation between adjacent intersections. Then, the signals were coordinated in each individual sub-zone independently. The cycle length, distance, and flow are the main three factors to determine the location of the break point. Yagoda proposed to use the Coupling Index as the partition criterion, in which Coupling Index was formulated as the ration of traffic volume and distance [18]. Hook proposed to use the Strength of Attraction to partition the entire arterial [19]. In addition to traffic volume and distance, roadside parking and travel time were considered in this index. In Synchro, a traffic simulation software for signal timing optimization, flow, travel time, cycle time, storage capacity, and flow dispersion were considered [20]. Tian believed a sub-zone containing three to five intersections has a significant bandwidth [21]. A heuristic partition approach was developed on the basis of volume, distance, saturation degree, and queue length between two neighboring intersections. Shen formulated a hierarchical fuzzy computing model to calculate the correlation degree between adjacent intersections [22]. Zheng introduced the complex network theory to divide the entire arterial, in which the topological structure of the road network was constructed with the correlation degree between intersections [23]. Lan proposed a new correlation model and sub-zone division model through the correlation analysis method and regression analysis method, in which the impact of traffic dispersion characteristics on signal coordination was considered [24].
It is not hard to observe that no signal coordination is taken into account when partitioning the entire arterial into some small sub-zones. This conventionally happens after the accomplishment of partitioning. No optimal solution can be asserted to have been received when singly performing any one partition technology without coordination consideration. This is due to the coordination control is the final target. To solve this problem, Zhang built a MILP model, MaxBandLA, to simultaneously optimize the arterial partition and signal coordination in each sub-zone [25]. In his model, some partition constraints are constructed based on the connectivity between intersections and links in the same sub-zone. Little’s MAXBAND model is taken to coordinate signals, and the average two-way bandwidth across all sub-zones is adopted as the target. The numerical tests show that the MaxBandLA model has a greater bandwidth and better travel efficiency in main street than Synchro.
However, the MaxBandLA model has not considered the impact from the phase sequence, queue clear time, and variation restriction of speed between adjacent links, leading to its limited application. Moreover, the optimal sub-zone number is determined by enumeration, not from the model. Most importantly, the MaxBandLA model has not considered the characteristics of traffic volume and flow capacity for each link. This may break the arterial at links with great volume to capacity ratios just for slight improvements in the average bandwidth. More vehicles cannot enjoy the green band and need to slow or stop. Thus, a modified MaxBandLA model, MaxBandLAM, is proposed in this paper from the above three aspects to further improve the travel efficiency for long arterials with a large number of signalized intersections. Compared to the MaxBandLA model, the MaxBandLAM model can ameliorate the coordination scheme from both temporal and spatial dimensions. In the temporal dimension, the addition of phase sequences, queue clear times, and variation restrictions of speed between adjacent links as decision variables into the MaxBandLAM model can make signal coordination schemes better match link traffic characteristics so that a greater bandwidth can be obtained. In the spatial dimension, the addition of sub-zone numbers as decision variables and the considerations of link traffic characteristics can avoid frequently breaking the long arterial and select links with light traffic flows as the breakpoints. The results of a numerical test, carried out on a virtual arterial with twenty signals, indicated that the scheme generated by the MaxBandLAM model can provide a more reasonable partition scheme and coordination schemes compared to those generated by Synchro and the models with no traffic flow characteristics of links consideration. For the scenario of dominating the main road through flows, the average delay, average stop number, and average travel speed at intersections for all-turning flows and the main road through flows in the MaxBandLAM scheme all performed well.

2. Materials and Methods

2.1. Notations and Interpretations

MaxBandLAM was modeled to optimize the two-way green bandwidth of an arterial with n signalized intersections using the following notations. The two travel directions along the artery in this paper are, respectively, referred to be inbound and outbound, as illustrated in Figure 1. The outbound and inbound through phases are the coordination phases. Intersections are consecutively numbered from 1 to n along the outbound direction. The same applies to the link number, but with the maximum number n 1 . All intersections are controlled by the fixed-time strategy. The term signal sometimes is used in this paper to represent the signalized intersection just for function consideration. The notations are summarized firstly in Table 1, and some are presented in Figure 1.
In those notations, b j , b ¯ j , b i , b ¯ i , θ i , δ i , δ ¯ i , z j , t i , t ¯ i , β j i , α j i , λ j are decision variables, γ i , γ i , γ i , w i , w ¯ i , ϕ i , ϕ ¯ i , Δ i , are auxiliary variables, and others are model parameters. All time variables and parameters are in the unit of cycle length for the purpose of linearizing the MaxBandLAM model. The interference variable w i refers to the start time gap between through green and green band along the outbound, whereas the interference variable w ¯ i refers to the end time gap between through green and green band along the inbound. Those two interference variables are defined to ensure outbound and inbound green bands are in their respective green. The queue clear time τ i τ ¯ i is the time to release outbound (inbound) queuing vehicles come from upstream side streets. The internode offset ϕ i ϕ ¯ i refers to time gap between the red centers of signals i and i + 1 closest to the outbound (inbound) green band from the left (right). The intranode offset Δ i is the time gap between the center of r i and the nearest center of r i ¯ . Through those two types of node offsets, the calculation of time difference between location A and B in Figure 1, an important geometric relationship, called loop integer constraint, for green bands between adjacent signals can be derived as follows:
ϕ i + ϕ ¯ i + Δ i Δ i + 1 = γ i
In the above formulations, term ϕ i + γ i + Δ i is the time difference derived from the outbound direction, and term γ i ϕ ¯ i + Δ i + 1 is derived from the inbound direction.
Similarly, from the time difference between location C and D, C ¯ and D ¯ and ϕ i and ϕ ¯ i can be, respectively, substituted by the formulations below:
ϕ i = ( 1 / 2 ) ( r i r i + 1 ) + ( w i w i + 1 ) + t i τ i + 1
ϕ ¯ i = ( 1 / 2 ) ( r ¯ i r ¯ i + 1 ) + ( w ¯ i w ¯ i + 1 ) + t ¯ i τ ¯ i
Furthermore, the intranode offset Δ i is related to the outbound and inbound left-turn phase sequences. All four patterns are shown in Figure 2 and represented by the two binary variables δ i and δ ¯ i in Table 2. A following formulation thus can be built to express the intranode offset Δ i by δ i and δ ¯ i :
Δ i = ( 1 / 2 ) [ ( 2 δ i 1 ) l i ( 2 δ ¯ i 1 ) l ¯ i ]
Now, the loop integer constraint can be reformulated as follows:
( w i + w ¯ i ) ( w i + 1 + w ¯ i + 1 ) + ( t i + t ¯ i ) + ( r i r i + 1 ) + ( δ i l i δ ¯ i l ¯ i ) + ( δ i + 1 l i + 1 δ ¯ i + 1 l ¯ i + 1 ) ( τ i + 1 + τ ¯ i ) = γ i
Through this constraint, some important factors for band progression among adjacent signals have been established connections, including the interference variables w i , w ¯ i , w i + 1 , w ¯ i + 1 , link travel time t i , t ¯ i , red duration of coordination phases r i , r i + 1 , left-turn phase sequences δ i , δ ¯ i , δ i + 1 , δ ¯ i + 1 , green duration of left-turn phases l i , l ¯ i , l i + 1 , l ¯ i + 1 , and queue clear times τ ¯ i , τ i + 1 .

2.2. Model Formulation

In this section, we built the MaxBandLAM model as a mixed integer linear programing model to simultaneously optimize the arterial partition scheme and signal coordination schemes for long arterials, with the consideration of link traffic flow characteristics. Four modules are contained in this model. One is the objective function to evaluate the quality of the coordination scheme. The other three are the constraint modules to limit the boundaries of feasible solutions, ensuring that the optimal scheme can be applied in practice. The first one is the partition module to partition long arterials into several small sub-zones. Five constraints to allocate signals and links to suitable sub-zones are contained in this module. The second one is the signal coordination module to obtain the greatest bandwidth for each sub-zone by adjust signal timing schemes. The last one is the link bandwidth module to gain individual bandwidth for each link.

2.2.1. Objective Function

In MaxBandLAM, we aim to maximize the weighted sum of the outbound and inbound bandwidths of links across the arterial. The directional volume to capacity ratios on links are utilized as the weight. The formulation is as follows:
max i = 1 n 1 ( a i b i + a ¯ i b ¯ i )
where a i = ( v i S i ) p and a ¯ i = ( v ¯ i S ¯ i ) p . p is the exponential power, taking 0, 1, 2, and 4.
By the objective function setting, the schemes with larger number of sub-zones can be avoided. This is because when an arterial is broken frequently, despite the maximum green bandwidth in each sub-zone becoming large, there are also more broken links with zero bandwidth. The target may not be better than those schemes with smaller number of sub-zones. Additionally, with traffic characteristics considered, links with light flows have a greater probability to be selected as the breakpoint than those with heavy flows. This is reasonable for making more vehicles travel smoothly without stopping.

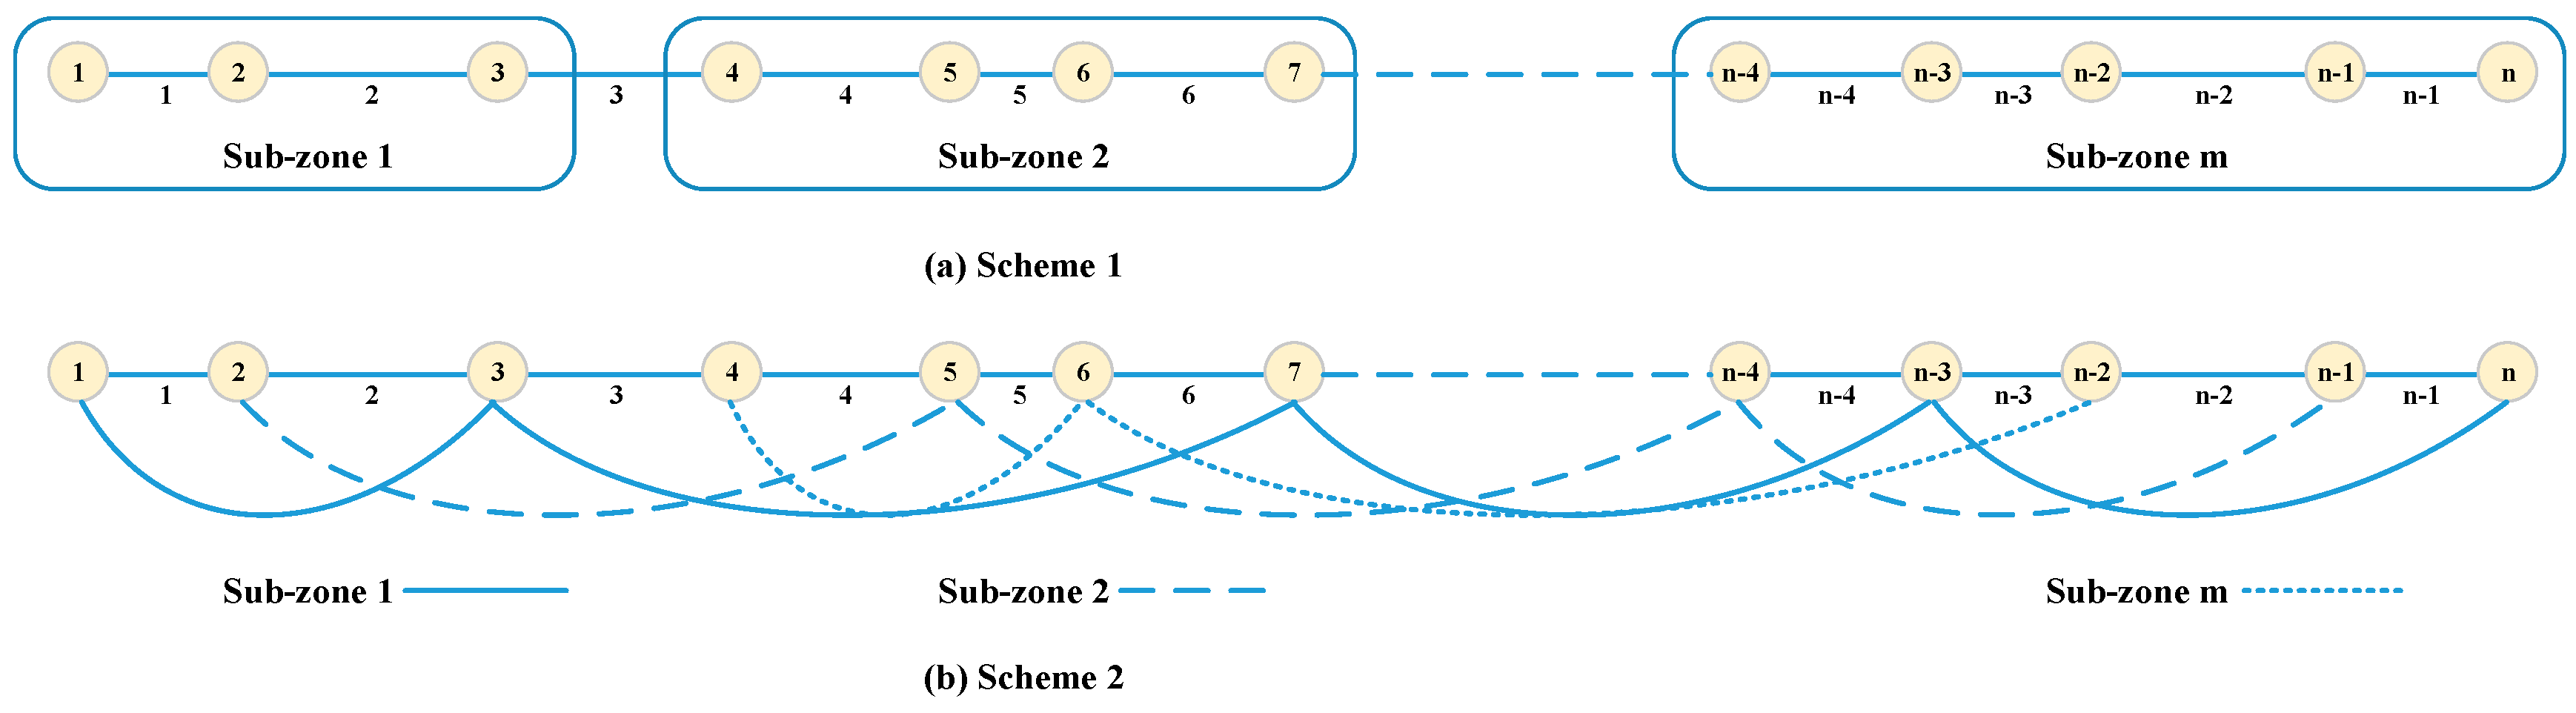
2.2.2. Partition Constraints

In this section, constraints (2)–(6) are constructed to partition the long arterial into some sub-zones based on the connectivity between signals and links in the same sub-zone. As shown in Figure 3, scheme 1 is the ideal partition scheme that we wish to obtain for each sub-zone is an individual connected tree. Scheme 2 is the unsatisfactory scheme that we need to avoid. Three binary variables, β j i , α j i , λ j , are thus introduced. β j i is used to indicate whether the intersection i belongs to sub-zone j . α j i is used to indicate whether the link i belongs to sub-zone j . λ j is used to indicate whether sub-zone j exists or not. There are 1 yes, 0 no holds for all these three variables.
i I β j i M λ j i I β j i                                                                                           j J
j J β j i = 1                                                                                                                         i I
3 + M ( λ j 1 ) i β j i 6 + M ( 1 λ j )                                         j J
i = 1 n 1 α j i = i I β j i λ j                                                                                           j J
2 α j i β j i + β j i + 1 1 + α j i                                                                                           i I / { n } , j J
where I is the intersection (signal) set or link set. J is the candidate sub-zone set. Constraint (2) determines whether sub-zone j exists or not. When i I β j i is greater than or equals 1, there are some signals allocated to sub-zone j . Sub-zone j really exists, and λ j equals 1, named an authentic sub-zone. Otherwise, sub-zone j is a virtual sub-zone without signals, and λ j equals 0. Through this variable, the optimal number of sub-zones can be obtained. Constraint (3) ensures that one signal can only belong to one sub-zone. Constraint (4) restricts the number of signals in each authentic sub-zone in order to ensure that an adequate two-way green bandwidth can be attained. Here, we selected the interval of [3,6] inspired by Tian, who partitioned an arterial into sub-zones each with three to five signals [21]. Other intervals can be easily taken into consideration just by modifying the numerical value in this formulation. Constraint (5) is formulated based on the fact that the number of signals is one more than the number of links for each authentic sub-zone. Constraint (6) ensures that both the adjacent signals i and i + 1 should be allocated to the same authentic sub-zone if the link i is in this sub-zone. Otherwise, at least one signal would be allocated to other sub-zones.

2.2.3. Signal Coordination Constraints for Sub-Zones

The MAXBAND model developed by Little is adopted here with the consideration of sub-zones. Constraints (7) and (8) ensure that the outbound and inbound band are in the green of their corresponding coordinated phase, 1 r i 1 r ¯ i , respectively. When β j i equals 1, signal i is allocated to sub-zone j . The bandwidth b j b ¯ j of sub-zone j is impacted by this signal. Constraints (7) and (8) are equivalent to w i + b j ( 1 r i ) 0 and w ¯ i + b ¯ j ( 1 r ¯ i ) 0 , respectively. Otherwise, constraints (7) and (8) are relaxed. No impact on the bandwidth of sub-zone j would been brought by signal i .
w i + b j ( 1 r i ) M ( 1 β j i )                         i I , j J
w ¯ i + b ¯ j ( 1 r ¯ i ) M ( 1 β j i )                         i I , j J
Constraint (9) is derived from modifying the above loop integer constraint with sub-zone consideration. Left-turn phase sequence and clear time are considered in this constraint. Constraint (10) is an integer constraint. When j J α j i equals 1, link i is not a breakpoint and allocated to an sub-zone; the adjacent signals i and i + 1 , connected by this link, also belong to this sub-zone. The bandwidth of this sub-zone is impacted by signals i and i + 1 . Constraint (9) is equivalent to the loop integer constraint. Otherwise, link i is a breakpoint, and the adjacent signals i and i + 1 belong to two different sub-zones. There is no green band for link i . Constraint (9) is relaxed.
M ( j J α j i 1 ) w i + w ¯ i ( w i + 1 + w ¯ i + 1 ) + ( t i + t ¯ i ) + δ i l i δ ¯ i l ¯ i δ i + 1 l i + 1 + δ ¯ i + 1 l ¯ i + 1 γ i ( r i + 1 r i ) ( τ ¯ i + τ i + 1 ) M ( 1 j J α j i )                         i I / { n }
γ i = int e g e r                                                                                                 i I
Constraint (11) imposes a limit upon the feasible boundary for the common cycle length z j , avoiding an impractical scheme generated.
1 T 2 z j 1 T 1                                                 j J
Constraints (12) and (13) limit the outbound and inbound coordinated speed d i / t i d ¯ i / t ¯ i , respectively. Also, the subjected sub-zone is considered in those two constraints.
M ( α j i 1 ) + ( d i / f i ) z j t i ( d i / e i ) z j + M ( 1 α j i )                         i I / { n } , j J
M ( α j i 1 ) + ( d i / f ¯ i ) z j t ¯ i ( d i / e ¯ i ) z j + M ( 1 α j i )                         i I / { n } , j J
Constraints (14) and (15) limit the outbound and inbound coordinated speed variation between adjacent links, d i + 1 / t i + 1 d i / t i d ¯ i + 1 / t ¯ i + 1 d ¯ i / t ¯ i , which are located in the same sub-zone, respectively. When α j i equals 1, and α j i + 1 equals 1, both links i and i + 1 belong to sub-zone j ; the inverse of coordinated speed variation on those two links is limited to the range of [ 1 / u i , 1 / h i ] for outbound and [ 1 / u ¯ i , 1 / h ¯ i ] for inbound. When α j i α j i + 1 holds for any j subjected to set J , one link is the breakpoint. No evident speed variation constraint exists. Constraints (14) and (15) are relaxed.
M ( α j i + α j i + 1 2 ) + ( d i / u i ) z j ( d i / d i + 1 ) t i + 1 t i ( d i / h i ) z j + M ( 2 α j i α j i + 1 )                         i I / { n 1 , n } , j J
M ( α j i + α j i + 1 2 ) + ( d i / u ¯ i ) z j ( d i / d i + 1 ) t ¯ i + 1 t ¯ i ( d i / h ¯ i ) z j + M ( 2 α j i α j i + 1 )                         i I / { n 1 , n } , j J
Constraint (16) is a non-negative constraint.
b i , b ¯ i , b j , b ¯ j , w i , w ¯ i 0

2.2.4. Link Bandwidth

When link i is allocated to one sub-zone, its bandwidth should equal the bandwidth of this sub-zone. Otherwise, it is a breakpoint with zero bandwidth. Based on this, constraints (17)–(19) were built. Constraint (17) was built to set both the outbound and inbound bandwidth to zero for links who are breakpoints. When j J α j i equals 0, link i is a breakpoint, belonging to no sub-zone. Constraint (17) is equivalent to b i + b ¯ i = 0 . Together with the non-negative constraint, b i = b ¯ i = 0 can be acquired. Constraint (18) was built to set the outbound bandwidth b i for link i to be b j if α j i equals 1. Similarly, constraint (19) was built to set the inbound bandwidth b ¯ i for link i to be b ¯ j if α j i equals 1.
0 b i + b ¯ i M j J α j i                                                   i I
b j + M ( α j i 1 ) b i b j + M ( 1 α j i )                         i I / { n } , j J
b ¯ j + M ( α j i 1 ) b ¯ i b ¯ j + M ( 1 α j i )                         i I / { n } , j J

3. Results

3.1. Test Setup

Four signal coordination schemes with partition consideration were carried out on a virtual arterial with 20 signalized intersections. Scheme 1 was generated by Synchro Studio 7, a popular traffic simulation software for signal timing optimization, which partitions arterials according to the coordinatability factors (CF) of adjacent intersections and coordinates signals based on the delay minimization. Four partition strategies with different CF thresholds are provided in Synchro: “one system”, “divide rarely”, “divide sometimes”, and “divide often”. For the given arterial setting, the strategy of “divide often” was selected here for five sub-zones generated, whereas all other three strategies still treat the arterial as one whole system. Scheme 2 was generated by the MaxBandLAM model developed in this paper. Scheme 3 was generated by the MaxBandLA model developed by Zhang with the addition of left-turn phase sequence, clear time, and limit on speed variation between adjacent links on the same sub-zone, termed as MaxBandLA-1. Fixing the number of sub-zone in the MaxBandLA-1 model as same as that generated by the MaxBandLAM model, termed as MaxBandLA-2 model. Then, we used this model to generate the scheme 4. Different from the MaxBandLAM model, the MaxBandLA-1 and MaxBandLA-2 models took the mean two-way bandwidth of all the sub-zones as its objective function, as follows:
max j J ( b j + b ¯ j ) / J
where J is the cardinality for set J .
The objectives in MaxBandLAM and MaxBandLA model are both collected as performance indexes in all above four schemes. For simplicity, we took the total link bandwidth to represent the objective of the weighted sum of the two-way bandwidths of links across the arterial in MaxBandLAM model, and the mean sub-zone bandwidth represent the objective in MaxBandLA-1 and MaxBandLA-2 models.
The link distances and traffic demands were randomly generated and listed in Table 3, where the symbol “LT” represents the left-turn, the “TH” represents the through, and “RT” represents the right-turn. The east–west bound is the main road bound while treating the east bound as the outbound direction and the west bound as the inbound direction. The south–north bound is the side-street bound. The traffic volumes for the through of the east–west bound are always dominated. The permitted cycle length is in the interval of [60 s, 120 s] for all the signals. The free-flow speeds on the links along the main road bound were all set to 60 km/h and 40 km/h for all side streets. The upper and lower bounds of coordination speeds for all main roads were set to 60 km/h and 40 km/h, respectively. The upper and lower bounds of variation on coordination speeds between adjacent links were all set to 7.9 km/h and −7.9 km/h, respectively. The corresponding inverses are 0.0121(m/s)−1 and −0.0121(m/s)−1.
The timing plan for each individual signal was optimized by Synchro Studio 7, including the cycle length, split, and phase sequence. The time to eliminate the 50th queue length was taken as the clear time. Table 4 shows the timing plan and clear time for each individual signal. The cycle length is in the unit of seconds, and the others are all in the units of cycles. The MaxBandLAM, MaxBandLA-1 and MaxBandLA-2 model were solved in the General Algebraic Modeling System (GAMS) using the CPLEX solver, on a Lenovo computer with 2.6 GHz Intel i7 CPU and 8 GB of RAM [26]. The split information in these models was the same as in Table 4. For all these three models, in less than one minute can the optimal solution be acquired.

3.2. Test Results

Table 5 shows the coordination scheme generated by Synchro. Sub-zones, cycles, belonged signals, offsets, and two-way bandwidths in seconds and in cycles are listed. In this scheme, the twenty signals were partitioned into five sub-zones. The numbers of signals in these sub-zones have significant fluctuations. Sub-zone 4 has the most signals of ten, sub-zone 2 contains six, sub-zone 1 contains two, and both sub-zones 3 and 5 contain only one. Also, the two-way bandwidths of sub-zones are evidently different. The more signals, the less bandwidth provided, except in sub-zones 3 and 5. Sub-zone 1 provides 1.0375 cycles the two-way bandwidth, sub-zone 2 provides 0.5222 cycles, and sub-zone 4 provides just 0.25 cycles. The total link bandwidth is 1.0695 cycles, and the mean sub-zone bandwidth is 0.6 cycles.
Table 6 shows the coordination scheme generated by MaxBandLAM. In this scheme, the twenty signals were partitioned into four sub-zones. The numbers of signals in sub-zones are in the range of [3,6] due to constraint (4). More specifically, sub-zone 1 contains four signals, sub-zone 2 contains six, and both sub-zones 3 and 4 contain five. Compared to the scheme generated by Synchro, this scheme has greater two-way bandwidths for all sub-zones. Each sub-zone can provide prominent two-way bandwidths to smooth the travel for through flows in the east–west bound. Sub-zone 1 provides 1.058 cycles the two-way bandwidth, sub-zone 2 provides 1.112 cycles, sub-zone 3 provides 1.113 cycles, and sub-zone 4 provides 1.167 cycles. The total link bandwidth is 2.6695 cycles, and the mean sub-zone bandwidth is 1.1125 cycles. All these two performance indexes obtained enormous improvements in contrast to the Synchro scheme.
Table 7 shows the coordination scheme generated by MaxBandLA-1. In this scheme, the twenty signals were partitioned into six small-size sub-zones. Each sub-zone contains either three or four signals. Similar to the scheme generated by MaxBandLAM, each sub-zone can provide significant two-way bandwidth for through flows of east–west bound, ranging from 1.058 cycles to 1.168 cycles. The total link bandwidth is 2.2236 cycles, and the mean sub-zone bandwidth is 1.1272 cycles. There was a 16.7% decrease in the total link bandwidth and a 1.3% increase in the mean sub-zone bandwidth in contrast to the MaxBandLAM scheme.
Table 8 shows the coordination scheme generated by MaxBandLA-2. Due to the scheme setup, the twenty signals were also partitioned into four sub-zones in this scheme. The numbers of signals in sub-zones were also in the range of [3,6]. Sub-zone 1 contained five signals, sub-zone 2 contained four, sub-zones 3 contained six, and sub-zone 4 contained five. Like the two schemes generated by MaxBandLAM and MaxBandLA-1, this scheme also provided significant two-way bandwidth for through flows in the east–west bound in each sub-zone. Sub-zone 1 provided 1.058 cycles the two-way bandwidth, sub-zone 2 provided 1.142 cycles, sub-zone 3 provided 1.106 cycles, and sub-zone 4 provided 1.167 cycles. The total link bandwidth was 2.5869 cycles, and the mean sub-zone bandwidth was 1.11825 cycles. There was a 3.1% decrease in the total link bandwidth and a 0.5% increase in the mean sub-zone bandwidth in contrast to the MaxBandLAM scheme. There was a 16.3% increase in the total link bandwidth and a 0.8% decrease in the mean sub-zone bandwidth in contrast to the MaxBandLA-1 scheme.

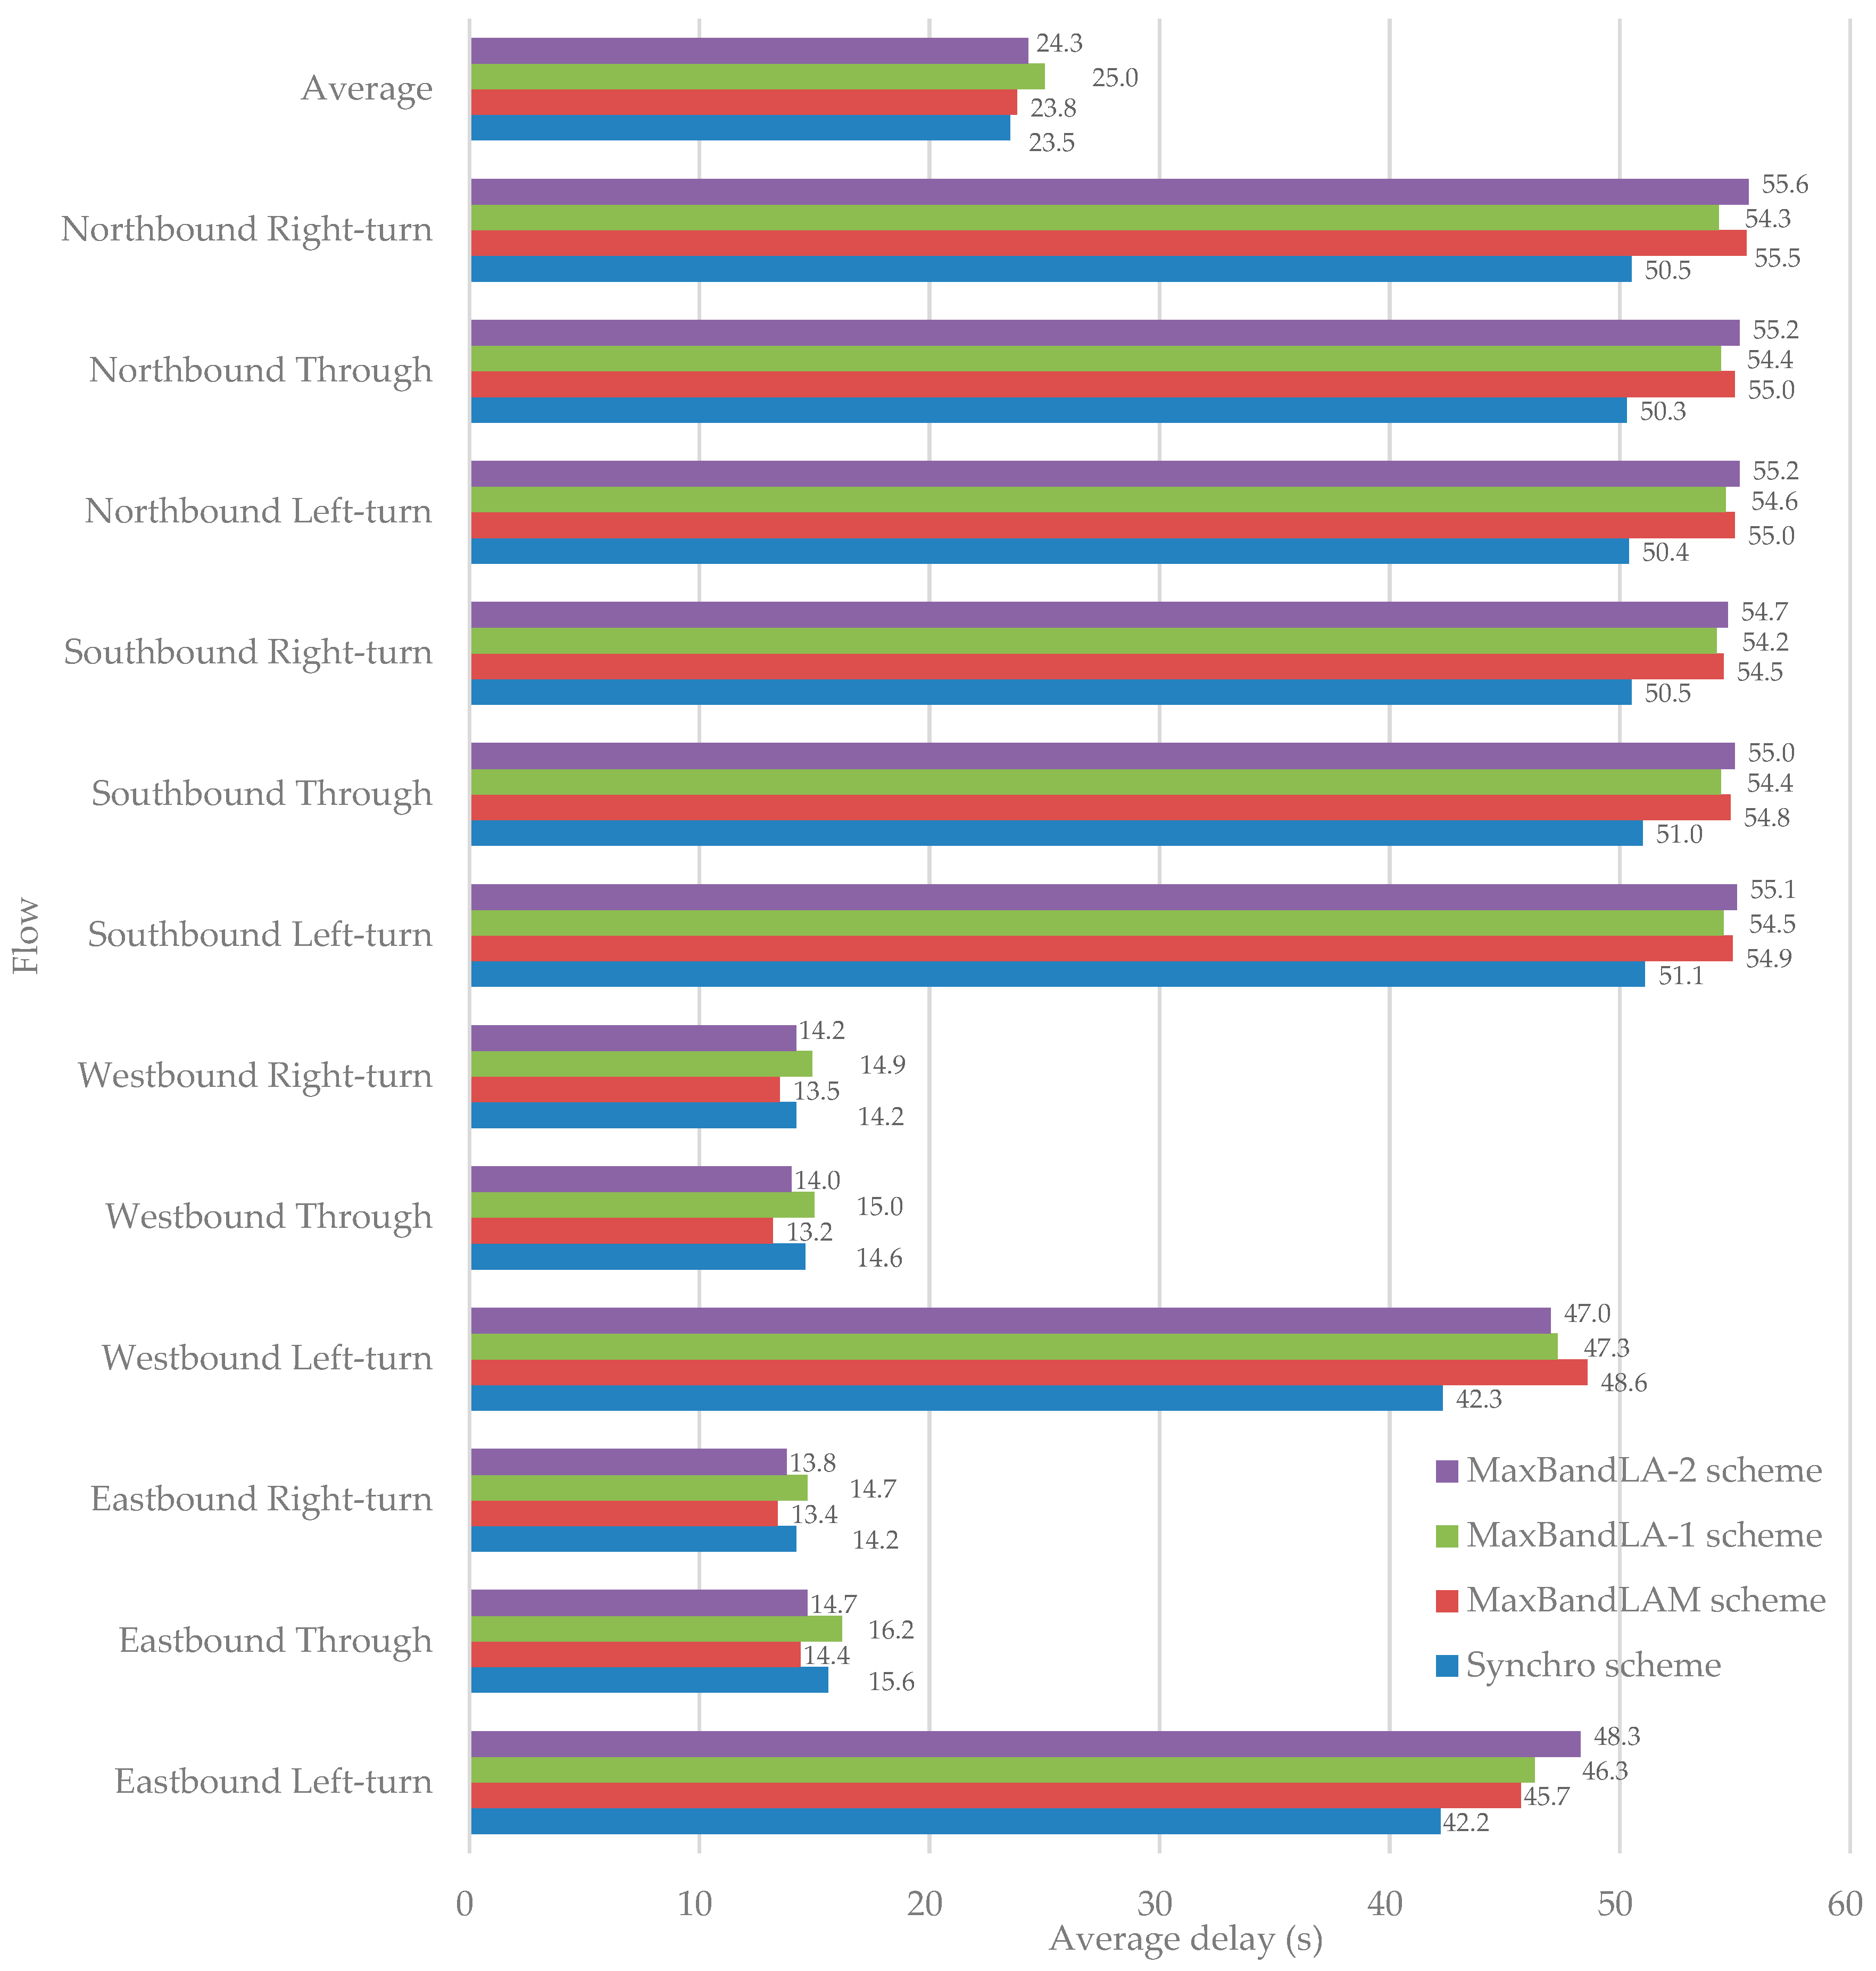
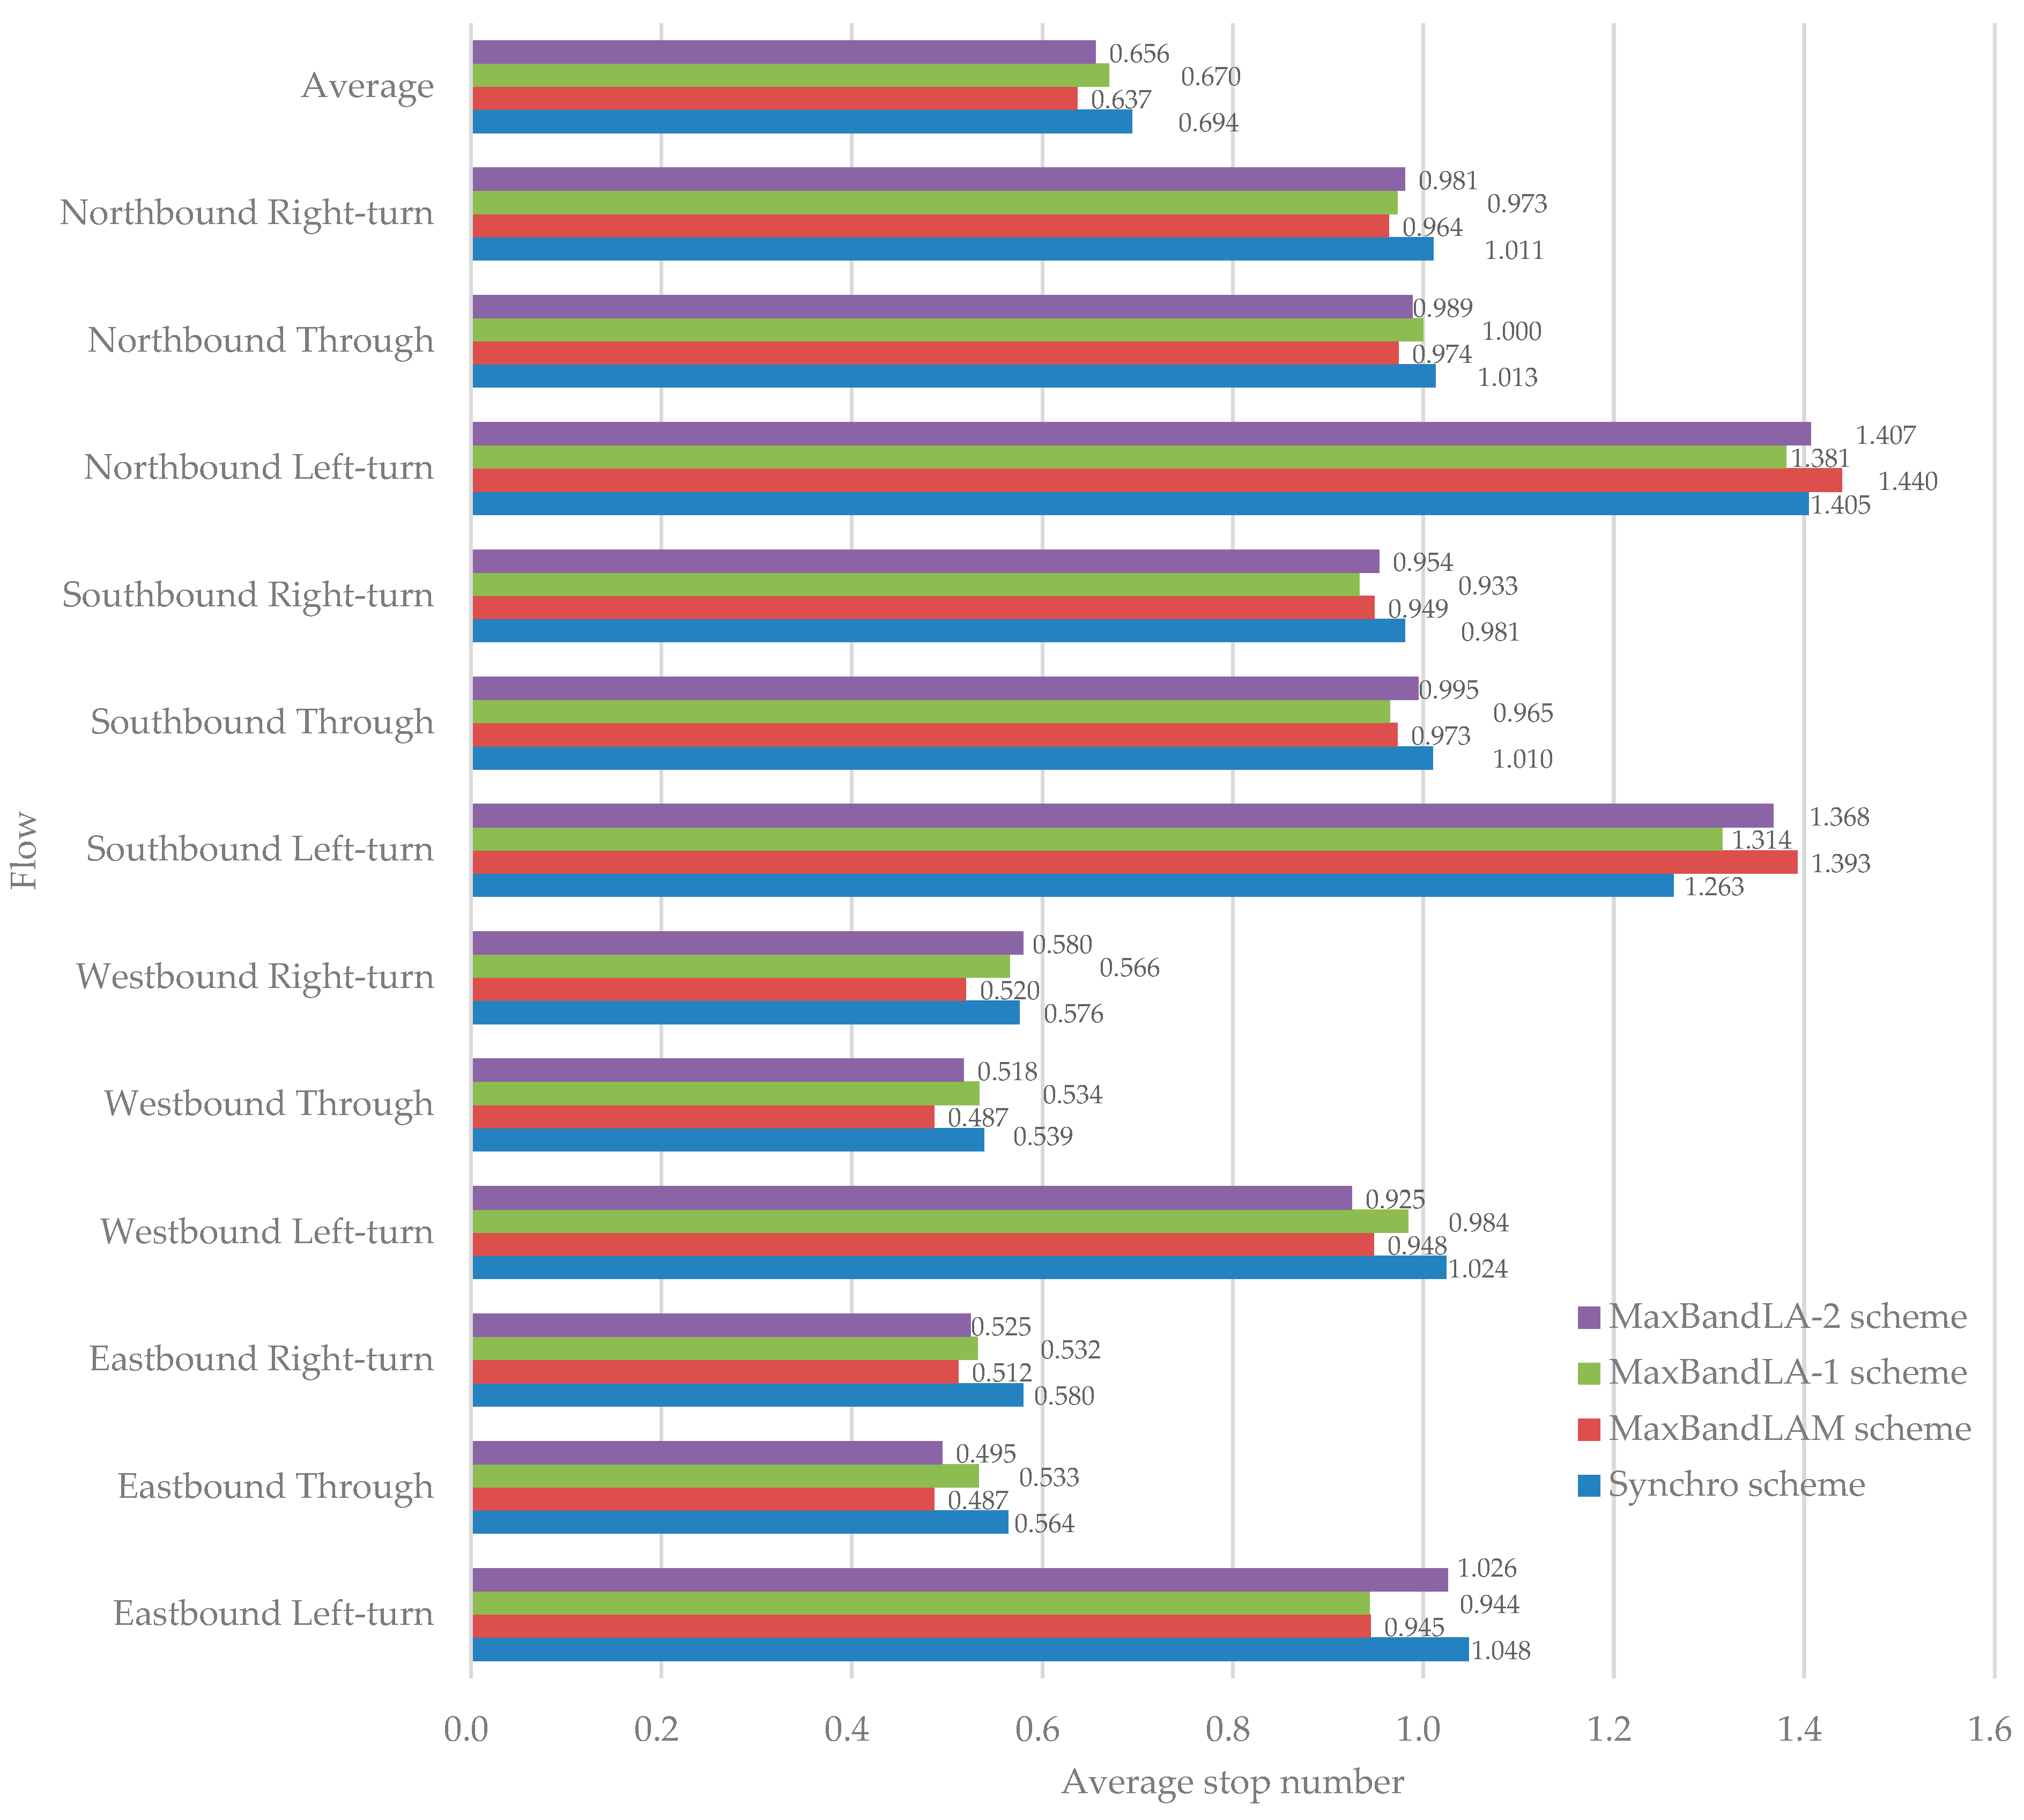
3.3. Simulation Analysis

To examine the impacts on traffic flow movement by the above four coordination schemes, they were fed into the SimTraffic simulation module in Synchro. The MaxBandLAM, MaxBandLA-1, and MaxBandLA-2 schemes used the same yellow and all-red intervals as the Synchro scheme. The average delay, average stop number, and average travel speed per vehicle at intersection were picked out as the performance indexes, presented in Figure 4, Figure 5 and Figure 6.
It can be observed that the MaxBandLAM scheme had the most satisfactory improvement on the traffic flow movement. For flows of all turns at intersections, it had the fastest average travel speed, fewest average stop number, and second minimum average delay among the four schemes. Its average delay was just slightly greater than the Synchro scheme, 23.8 s vs. 23.5 s. This could be attributed to its more reasonable partition schemes. The Synchro scheme had the minimum average delay, largest average stop number, and second slowest average travel speed. The MaxBandLA-1 scheme had the maximum average delay, second largest average stop number, and slowest average travel speed. MaxBandLA-2 scheme has the second maximum average delay, second largest average stop number, and second fastest average travel speed.
For eastbound and westbound through flows, both the MaxBandLAM scheme and the MaxBandLA-2 scheme were better than the Synchro scheme in all these three performance indexes. But, the MaxBandLA-1 scheme was better only in the average stop number compared to the Synchro scheme. Moreover, the MaxBandLAM scheme was better than the MaxBandLA-2 scheme in all these three performance indexes, although they had the same number of sub-zones.

4. Discussion

From the analysis on the results in Table 5, Table 6, Table 7 and Table 8, it is not hard to observe that the Synchro scheme had the smallest total link bandwidth and mean sub-zone bandwidth among the above four schemes. This may be because Synchro partitions an arterial according to CF, an empirical model, and coordinates signals based on the objective of delay minimization, not bandwidth maximization. These two processes are carried out separately, and no bandwidths are considered. Whether or not adjacent signals allocated to the same sub-zone is in regard to link geometric structures, traffic flow characteristics, and signal schemes. Thus, some signals are treated as isolated nodes with no bandwidth. Some sub-zones generated still contain excessive signals and provide limited two-way green bandwidths.
The MaxBandLAM scheme has the largest total link bandwidth and ample mean sub-zone bandwidth due to its simultaneous optimization of the arterial partition scheme and signal coordination schemes, with the consideration of link traffic flow characteristics. Only a 1.3% decrease occurs in the mean sub-zone bandwidth compared to the largest. It is wonderful that taking the total link bandwidth as an objective can also obtain a desirable mean sub-zone bandwidth. The MaxBandLA-1 scheme has the largest mean sub-zone bandwidth but a relatively smaller total link bandwidth. This is because the MaxBandLA-1 model takes the maximum mean sub-zone bandwidth as its objective. A scheme with more breakpoints may be produced to obtain a larger sub-zone bandwidth. Furthermore, no link flow characteristics are considered in MaxBandLA-1. A link with a heavy flow will be broken, whereas the adjacent signals connected by links with light flow may be coordinated. This can further lead to the total link bandwidth decreasing.
The MaxBandLA-2 scheme has the second largest total link bandwidth and mean sub-zone bandwidth. Although this scheme has the same number of sub-zones as the MaxBandLAM scheme, their breakpoint locations are different, owing to their different objectives. The MaxBandLAM scheme breaks the arterial on links 4, 10, and 15, whereas this scheme breaks the arterial on links 5, 9, and 15. Link 4 has lighter through flow of east–west bound than link 5, and link 10 has lighter through flow of east–west bound than link 9. This leads to the difference of two-way green bandwidths of sub-zones for these two schemes. The two-way green bandwidths of sub-zone 2 in the scheme generated by MaxBandLA-2 obtains evident improvements, despite a slight decline in sub-zone 3, compared to the MaxBandLAM scheme. Therefore, it can be concluded that taking the weighted sum of the two-way bandwidths of links across an arterial as objective can produce different coordination schemes compared to the objective of the mean two-way bandwidth of all the sub-zones.
Furthermore, in contrast to the MaxBandLA-1 scheme, the scheme generated by MaxBandLA-2 has a significant improvement in the total link bandwidth and a trivial decline in the mean sub-zone bandwidth. This proves that frequently breaking an arterial a fixed number of signals may produce an imperfect scheme.
According to the results of the simulation analysis, the MaxBandLAM scheme also performs well in improving the travel efficiency for a long arterial with dominated main road through flow, following by the MaxBandLA-2 scheme. This is because the links with lighter flows were picked out as the breakpoints in the MaxBandLAM scheme, and more vehicles can enjoy the green band. Compared to the MaxBandLAM and MaxBandLA-2 schemes, the MaxBandLA-1 scheme performed the worst in the travel efficiency improvement. This could prove that although frequently breaking a long arterial could obtain a significant the mean sub-zone bandwidth, it may not acquire a desirable improvement in the travel efficiency for the entire arterial. The more breakpoints, the greater number of links with no green band provided. And in these links, vehicles need to slow down or stop to traverse. Thus, there still exists a lot of room for improvement for the MaxBandLA-2 scheme.

5. Conclusions

In this study, a mixed integer linear programming model, MaxBandLAM, was developed to coordinate a long arterial with massive signals. In this model, partitioning the long arterial into some sub-zones and coordinating signals for each individual sub-zone were simultaneously optimized with the consideration of the link traffic characteristics. A numeric test was carried out on a virtual long arterial with twenty signals. Some conclusions can be received from the test results:
(1)
Frequently breaking a long arterial to partition it into more sub-zones can provide a significant two-way green bandwidth for each sub-zone. But, for traffic flows on the whole arterial, more sub-zones may deteriorate their travel efficiencies.
(2)
Links with light traffic flows should have greater priority than links with heavy flows to be selected as the breakpoints. This can lead to further improvement in the travel efficiencies for traffic flows on the whole arterial.
(3)
Compared to taking the mean two-way bandwidth of all the sub-zones as the objective to simultaneously optimize the partition scheme and signal coordination schemes for a long arterial, the objective of the weighted sum of the two-way bandwidths of links across the arterial are preferable. This can not only avoid frequently breaking an arterial but also pick out some more suitable links with light traffic flows as breakpoints.
(4)
Due to the numeric test performed in this paper being on a virtual arterial with a fixed traffic demand, some stochastic factors will influence the conclusion. More numeric tests on real data should be carried out in future research so that some more profound insights can be derived. Furthermore, the comparison of the combination of some partition technologies and signal coordination technologies with the MaxBandLAM model is also worth conducting in future research.

Author Contributions

Conceptualization, G.Q., S.J. and D.W.; methodology, G.Q., S.J. and X.W.; software, X.W. and Y.Z.; validation, G.Q., S.J. and D.W.; formal analysis, X.W. and Y.Z.; resources, G.Q. and Y.Z.; data curation, G.Q. and Y.Z.; writing—original draft preparation, G.Q. and X.W.; writing—review and editing, G.Q. and D.W.; visualization, X.W. and D.W.; supervision, G.Q. and D.W.; project administration, X.W. and D.W. All authors have read and agreed to the published version of the manuscript.

Funding

This research was funded by the National Key R&D Plan Project of China, grant number 2019YFE0126100, and the Major Science and Technology Innovation Projects in Hangzhou, China, grant number 2022AIZD0079.

Institutional Review Board Statement

Not applicable.

Informed Consent Statement

Not applicable.

Data Availability Statement

The data presented in this study are openly available at https://pan.baidu.com/s/1be3JzKnnU0zZV3QqLrIZiQ/ (accessed on 28 June 2023).

Conflicts of Interest

The authors declare no conflict of interest.

References

  1. Hu, H.; Wu, X.; Liu, H.X. Managing oversaturated signalized arterials: A maximum flow based approach. Transp. Res. Part C Emer. 2013, 36, 196–211. [Google Scholar] [CrossRef]
  2. Zhang, L.; Yin, Y.; Lou, Y. Robust signal timing for arterials under day-to-day demand variations. Transp. Res. Rec. 2010, 2192, 156–166. [Google Scholar] [CrossRef]
  3. Luo, X.; Liu, B.; Jin, P.J.; Cao, Y.; Hu, W. Arterial traffic flow estimation based on vehicle-to-cloud vehicle trajectory data considering multi-intersection interaction and coordination. Transp. Res. Rec. 2019, 2673, 68–83. [Google Scholar] [CrossRef]
  4. Li, L.; Huang, W.; Lo, H.K. Adaptive coordinated traffic control for stochastic demand. Transp. Res. Part C Emer. 2018, 88, 31–51. [Google Scholar] [CrossRef]
  5. Ding, S.; Chen, X.; Yu, L.; Wang, X. Arterial offset optimization considering the delay and emission of platoon: A case study in Beijing. Sustainablity 2019, 11, 3882. [Google Scholar] [CrossRef]
  6. Gartner, N.H.; Assmann, S.F.; Lasaga, F.; Hou, D.L. Multiband-a variable-bandwidth arterial progression scheme. Transp. Res. Rec. 1990, 1287, 212–222. [Google Scholar]
  7. Yang, X. Comparison among computer packages in providing timing plans for Iowa arterial in Lawrence, Kansas. J. Transp. Eng.-ASCE 2001, 127, 311–318. [Google Scholar] [CrossRef]
  8. Little, J.D.C. The synchronization of traffic signals by mixed-integer linear programming. Oper. Res. 1966, 14, 568–594. [Google Scholar] [CrossRef]
  9. Little, J.D.C.; Kelson, M.D.; Gartner, N.H. Maxband: A program for setting signals on arteries and triangular networks. Transp. Res. Rec. 1981, 795, 40–46. [Google Scholar]
  10. Tian, Z.; Mangal, V.; Liu, H. Effectiveness of lead–lag phasing on progression bandwidth. Transp. Res. Rec. 2008, 2190, 22–27. [Google Scholar] [CrossRef]
  11. Chang, C.P.; Cohen, S.L.; Liu, C.; Chaudhary, N.A.; Messer, C. Maxband-86. program for optimizing left-turn phase sequence in multiarterial closed networks. Transp. Res. Rec. 1988, 1181, 61–67. [Google Scholar]
  12. Gartner, N.H.; Assman, S.F.; Lasaga, F.; Hou, D.L. A multi-band approach to arterial traffic signal optimization. Transp. Res. Part B Meth. 1991, 25, 55–74. [Google Scholar] [CrossRef]
  13. Zhang, C.; Xie, Y.; Gartner, N.H.; Stamatiadis, C.; Arsava, T. Am-band: An asymmetrical multi-band model for arterial traffic signal coordination. Transp. Res. Part C Emer. 2015, 58, 515–531. [Google Scholar] [CrossRef]
  14. Zhang, L.; Yin, Y. Robust synchronization of actuated signals on arterials. Transp. Res. Rec. 2008, 2080, 111–119. [Google Scholar] [CrossRef]
  15. Li, J. Bandwidth synchronization under progression time uncertainty. IEEE Trans. Intell. Transp. Syst. 2014, 15, 749–759. [Google Scholar] [CrossRef]
  16. Xu, L.; Jin, S.; Li, B.; Wu, J. Traffic signal coordination control for arterials with dedicated CAV lanes. J. Intell. Connect. Veh. 2022, 5, 72–87. [Google Scholar] [CrossRef]
  17. Ma, N.; Shao, C.; Zhao, Y. Influence factors of coordination control system in signalized intersections. J. Harbin Inst. Technol. 2011, 43, 112–117. [Google Scholar] [CrossRef]
  18. Yagoda, H.N.; Principle, E.H.; Vick, C.E.; Leonard, B.G. Subdivision of signal systems into control areas. Traffic Eng. 1973, 43, 42–45. [Google Scholar]
  19. Hook, D.; Albers, A. Comparison of alternative methodogies to determine breakpoints in signal progression. In Proceedings of the 69th Annual Meeting of Institute of Transportation Engineers, Las Vegas, NV, USA, 1–4 August 1999. [Google Scholar]
  20. Husch, D.; Albeck, J. Synchro Studio 7.0 User Guide, 7th ed.; Trafficware Ltd.: Sugar Land, TX, USA, 2006. [Google Scholar]
  21. Tian, Z.; Urbanik, T. System partition technique to improve signal coordination and traffic progression. J. Transp. Eng.-ASCE 2007, 133, 119–128. [Google Scholar] [CrossRef]
  22. Shen, G.; Yang, Y. A dynamic signal coordination control method for urban arterial roads and its application. Front. Inf. Technol. Electron. Eng. 2016, 17, 907–918. [Google Scholar] [CrossRef]
  23. Zheng, L.; Liu, H.; Ding, T. Mining method for road traffic network synchronization control area. Green Intell. Transp. Syst. 2018, 419, 949–959. [Google Scholar]
  24. Lan, H.H.; Wu, X.Y. Research on key technology of signal control subarea partition based on correlation degree analysis. Math. Probl. Eng. 2020, 2020, 1879503. [Google Scholar] [CrossRef]
  25. Zhang, L.; Song, Z.; Tang, X.; Wang, D. Signal coordination models for long arterials and grid networks. Transp. Res. Part C Emer. 2016, 71, 215–230. [Google Scholar] [CrossRef]
  26. Brooke, A.; Kendirck, D.; Meeraus, A. GAMS: A User’s Guide, 3rd ed.; The Scientific Press: South San Francisco, CA, USA, 1992. [Google Scholar]
Figure 1. Time–space diagram of green bands.
Sustainability 15 14874 g001
Figure 2. The four possible patterns of left-turn phases.
Sustainability 15 14874 g002
Figure 3. Arterial partition.
Sustainability 15 14874 g003
Figure 4. Average delay per vehicle at intersections (s).
Sustainability 15 14874 g004
Figure 5. Average stop number per vehicle at intersections.
Sustainability 15 14874 g005
Figure 6. Average travel speed per vehicle at intersections (km/h).
Sustainability 15 14874 g006
Table 1. Model notations.
NotationIllustration
I Intersection (Signal) set or link set. Link i connects intersection i and i + 1 , except link n , which is a virtual link;
J Candidate sub-zone set;
b j b ¯ j Outbound (inbound) green bandwidth of sub-zone j (cycles);
b i b ¯ i Outbound (inbound) green bandwidth of link i (cycles);
γ i Loop integer variable to reflect the relationship between outbound and inbound bandwidth on link i ;
γ i γ i integer variable;
t i t ¯ i Outbound (inbound) travel time on link i (cycles);
w i w ¯ i Interference variable on link i (cycles);
θ i Offset between signal i and i + 1 , measured as the time from the center of a red of signal i to the next center of red of signal i + 1 (cycles);
ϕ i ϕ ¯ i Internode offset of signal i and i + 1 (cycles);
Δ i Intranode offset of signal i (cycles);
δ i δ ¯ i 
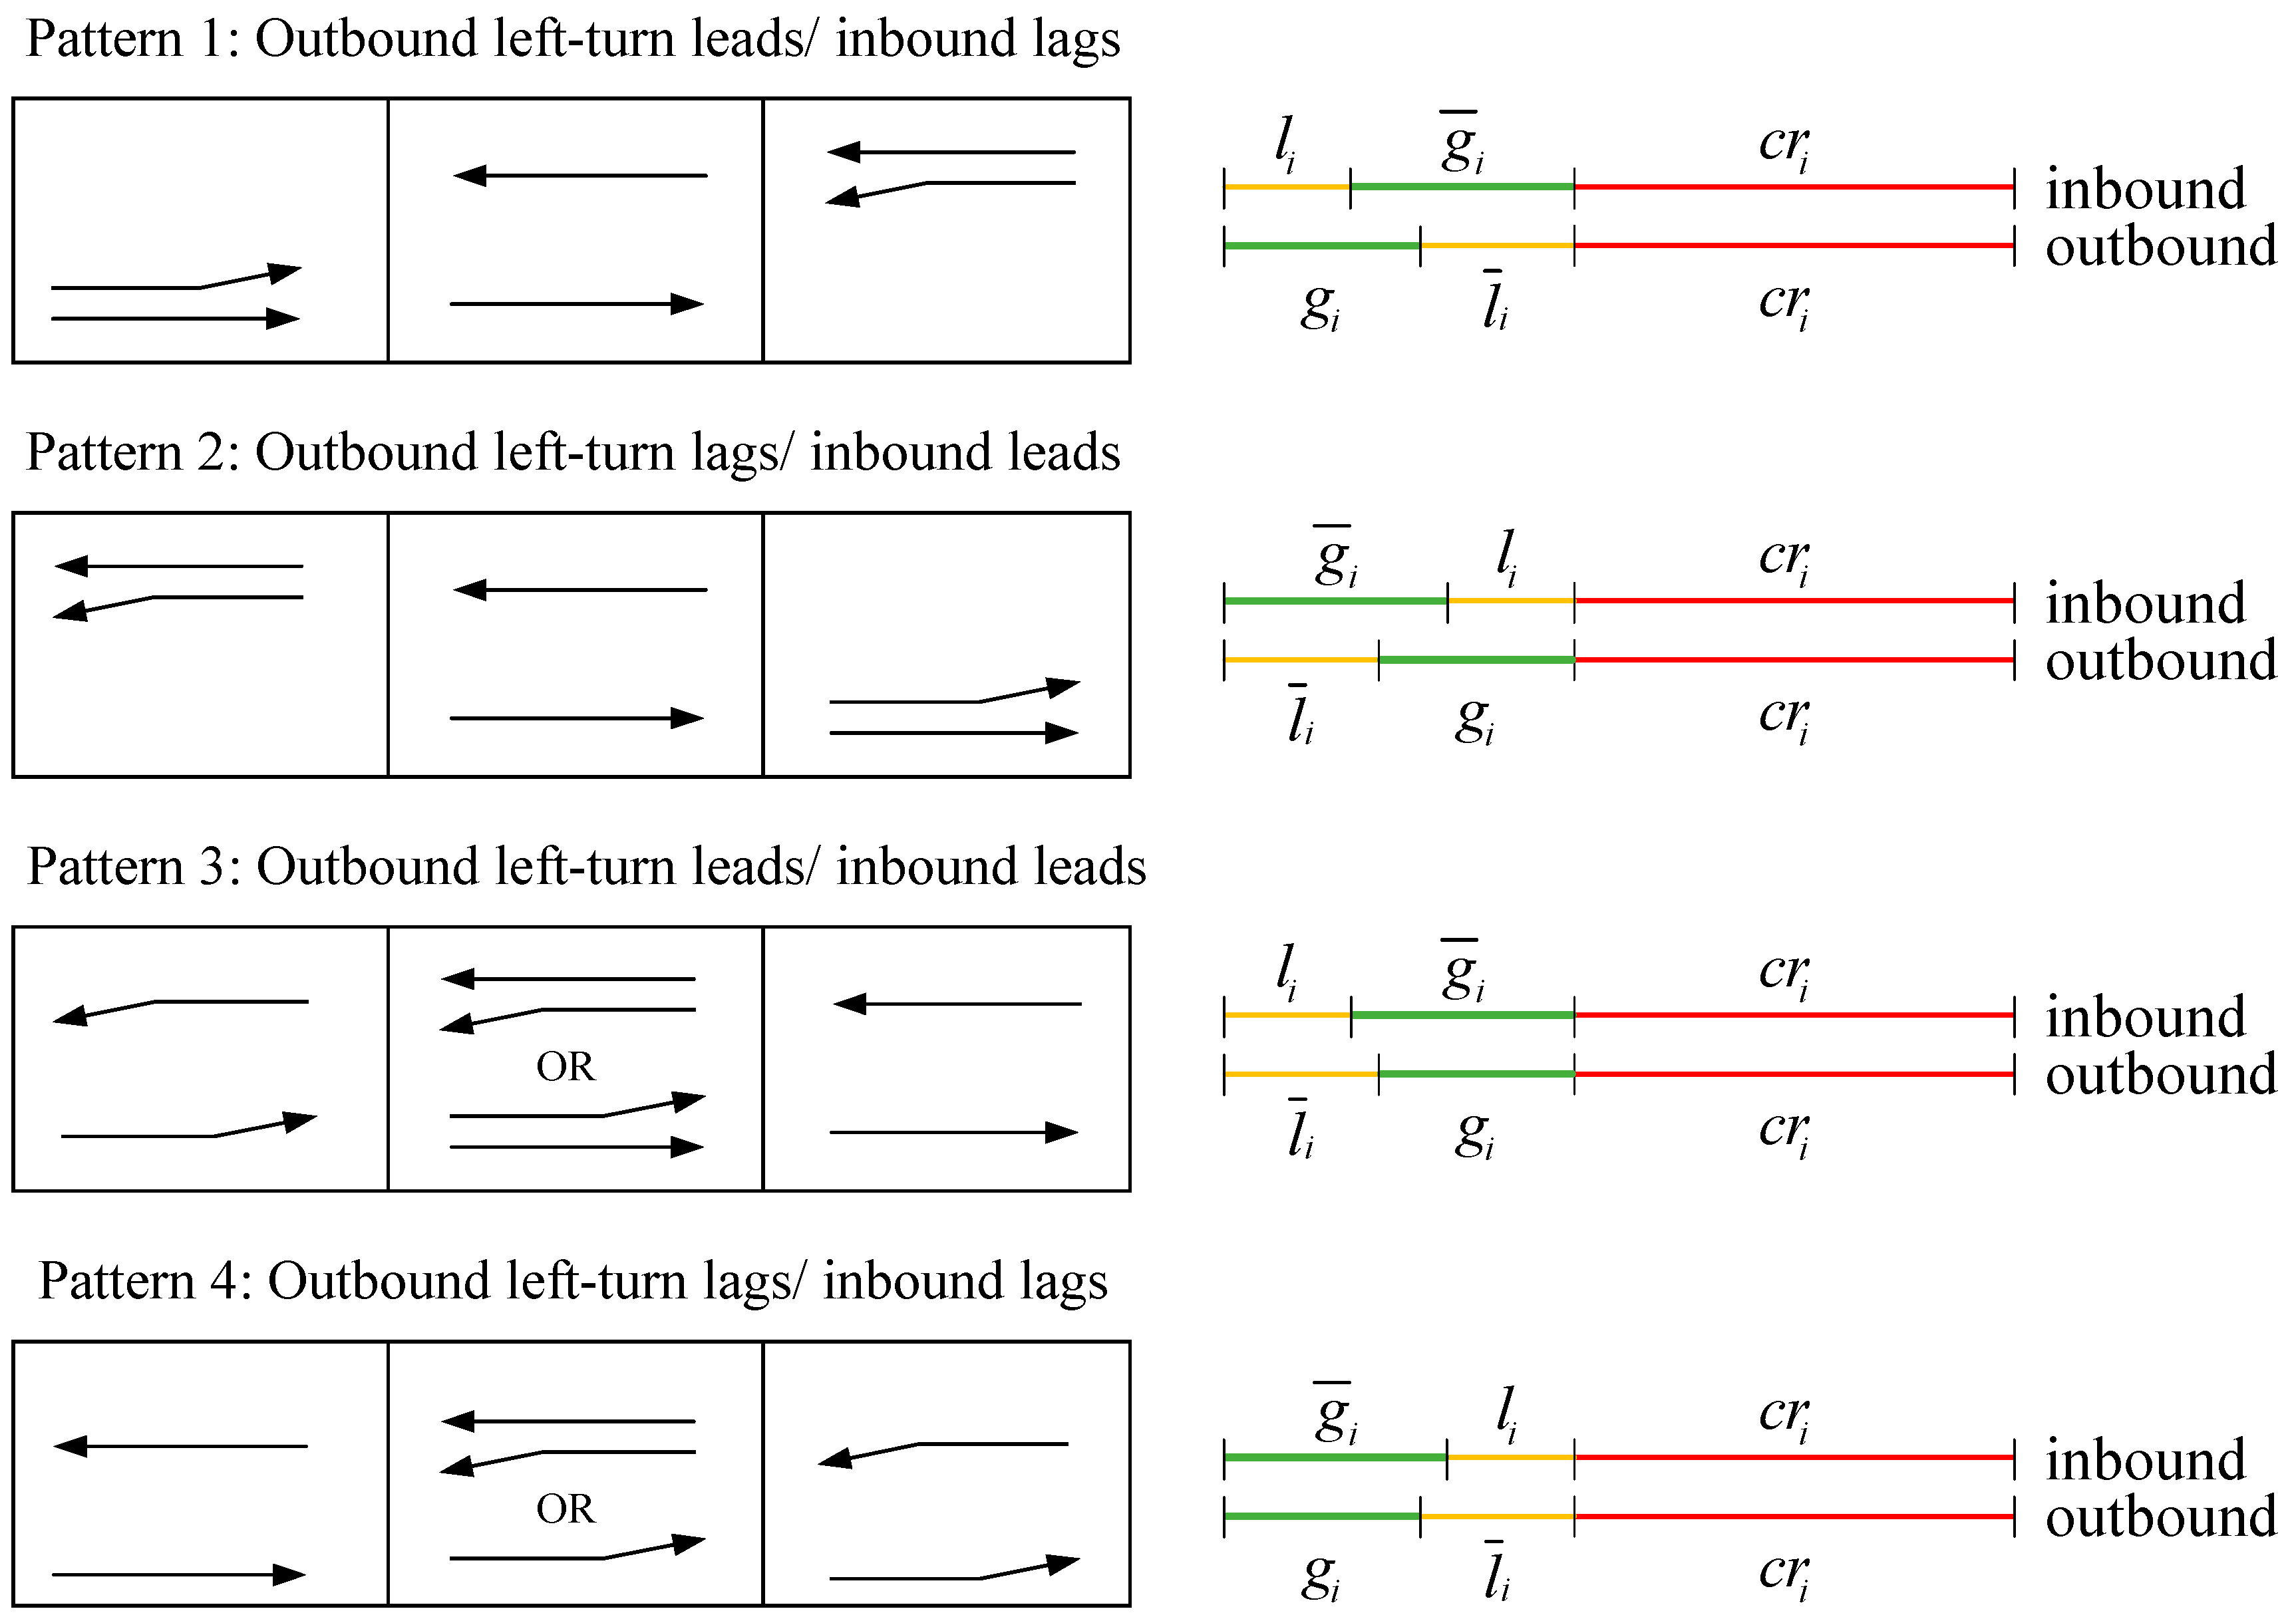
Left-turn phases pattern, a binary variable;
g i g ¯ i Green time for outbound (inbound) through phases of signal i (cycles);
l i l ¯ i Green time for outbound (inbound) left-turn phases of signal i (cycles);
r i r ¯ i Red time for outbound (inbound) through phases of signal i (cycles);
c r i Common red time for both outbound and inbound directions to permit flow propagation on side streets (cycles);
τ i τ ¯ i Outbound (inbound) queue clear time at intersection i (cycles);
z j The inverse of common cycle length in sub-zone j (cycles/second);
d i Distance of link i (meters);
e i e ¯ i Lower limit on speed of link i (meters/second);
f i f ¯ i Upper limit on speed of link i (meters/second);
h i h ¯ i Lower limit on speed variation between links i and i + 1 (meters/second);
u i u ¯ i Upper limit on speed variation between links i and i + 1 (meters/second);
T 1 , T 2 Lower and upper limits on cycle length (seconds);
k i Target ratios of inbound to outbound bandwidth on link i ;
a i a ¯ i Outbound (inbound) bandwidth weight of link i ;
v i v ¯ i Outbound (inbound) volume for through flow on link i ;
S i S ¯ i Outbound (inbound) saturation flow rate for through on link i ;
β j i A binary variable to determine whether the intersection i belongs to sub-zone j , 1 yes, 0 no;
α j i A binary variable to determine whether the link i belongs to sub-zone j , 1 yes, 0 no. Note that α j n = 0 hold for all sub-zones, representing link n is a virtual link;
λ j A binary variable to determine whether sub-zone j exists or not, 1 yes, 0 no.
Table 2. Left-turn patterns.
PatternIntranode Offset Δ i Variable δ i Variable δ ¯ i Illustration
1 Δ i = ( 1 / 2 ) ( l i + l ¯ i ) 01Outbound left-turn leads and inbound lags
2 Δ i = ( 1 / 2 ) ( l i + l ¯ i ) 10Outbound left-turn lags and inbound leads
3 Δ i = ( 1 / 2 ) ( l i l ¯ i ) 00Outbound left-turn leads and inbound leads
4 Δ i = ( 1 / 2 ) ( l i l ¯ i ) 11Outbound left-turn lags and inbound lags
Table 3. Link distances and traffic demands.
Signal NumberDistance
(m)
East Bound (pch/h)West Bound (pch/h)North Bound (pch/h)South Bound (pch/h)
LTTHRTLTTHRTLTTHRTLTTHRT
13411971439531881320641391774414016930
2695273121760260126877971862810317758
35942371412105227152410491166389217434
4533282118873263120790102176289416830
5296205145610120614731121161843111618336
6497211156611020816136284177508316135
736621814918723615151101101671911416350
87742431523952511425711311855413117927
94752091412952061469951341885414718017
1035926314001002701307851301333013012529
1164320513879220313027386143577814629
1240322114537421113911121241544712415239
133572151644531981695651111982011419453
145242281297872121419741162071611421944
1551823512738821812071051031304911112835
1634420513989621815057579191418518838
17518252147310525415181001091324611013738
183982091540531971538741081733511916759
197802181577722271476691191624111716345
20-1881450531771390681101944710420041
Table 4. Timing plan and clear time for individual signal.
Signal NumberCycle
(s)
East BoundWest BoundSide-Street
Split of
through
Phase
(Cycles)
Split of
Left-Turn
Phase
(Cycles)
Clear
Time
(Cycles)
Split of
through
Phase
(Cycles)
Split of
Left-Turn
Phase
(Cycles)
Clear
Time
(Cycles)
Split
(Cycles)
1850.5760.2000.0930.5650.1880.0830.235
2700.5290.2570.0950.5290.2570.1080.214
3800.6000.2250.1020.5880.2130.0940.188
4700.5430.2710.1020.5290.2570.0980.200
5800.5880.2000.1010.5880.2000.0990.213
6950.6210.1890.0960.6210.1890.0940.189
71000.5800.2000.0820.6000.2200.080.200
81050.5710.2100.0850.5710.2100.0960.219
91050.5710.1900.0820.5710.1900.0750.238
10900.5560.2440.0890.5560.2440.0960.200
11900.5780.2330.0810.5670.2220.0850.200
121000.6000.1900.0830.5900.1800.0840.220
131200.6330.1670.0880.6250.1580.0790.208
141000.5700.2000.0840.5700.2000.0780.230
15800.5630.2500.0910.5500.2380.0910.200
16900.6000.1890.0940.6000.1890.0760.211
171000.6100.2100.0700.6100.2100.0880.180
18960.6040.1880.0860.5940.1770.0840.219
191060.6040.1890.0770.6040.1890.0840.208
20900.5890.1890.0850.5780.1780.0860.233
Table 5. Coordination scheme generated by Synchro.
Sub-Zone
Number
Cycle (s)Signal NumberOffset (s)Two-Way Bandwidth
(s)(Cycle)
1801041 + 421.0375
224
2903023 + 240.5222
429
555
663
789
821
31059000
410010012 + 130.25
1111
1249
1349
1412
1542
1679
1789
1820
1943
59020000
Table 6. Coordination scheme generated by MaxBandLAM.
Sub-Zone
Number
Cycle (s)Signal NumberOffset (s)Two-Way Bandwidth
(s)(Cycle)
11201063 + 631.058
231
337
453
2925051 + 511.112
616
747
833
960
1040
312011068 + 661.113
1258
1316
1429
1548
411416067 + 661.167
1719
1847
1936
2047
Table 7. Coordination scheme generated from MaxBandLA-1.
Sub-Zone
Number
Cycle (s)Signal NumberOffset (s)Two-Way Bandwidth
(s)(Cycle)
11201063 + 631.058
229
363
453
21115064 + 651.168
621
745
31158064 + 641.112
970
1043
49211053 + 521.145
1258
1336
511614065 + 641.113
1541
1647
1731
69218054 + 531.167
1936
2063
Table 8. Coordination scheme generated from MaxBandLA-2.
Sub-Zone
Number
Cycle (s)Signal NumberOffset (s)Two-Way Bandwidth
(s)(Cycle)
11201063 + 631.058
230
353
454
534
21116063 + 631.142
743
833
959
312010067 + 661.106
1126
1258
1315
1429
1549
411416067 + 661.167
1720
1847
1936
2070
Disclaimer/Publisher’s Note: The statements, opinions and data contained in all publications are solely those of the individual author(s) and contributor(s) and not of MDPI and/or the editor(s). MDPI and/or the editor(s) disclaim responsibility for any injury to people or property resulting from any ideas, methods, instructions or products referred to in the content.

