Article

Urban Forests, Territorial Planning and Political Stability: Key Factors to Face Climate Change in a Megacity

by
Maurício Lamano Ferreira
1,*,
Claudia Terezinha Kniess
2,3,4,
Wanderley Meira Silva
5 and
Anderson Targino da Silva Ferreira
1,6,7
1
Department of Geoenvironmental Analyses, University of Guarulhos, Guarulhos 07023-070, Brazil
2
Graduate Program in Civil Engineering, Sao Judas Tadeu University, Sao Paulo 03166-000, Brazil
3
Department of Administration, Federal University of Sao Paulo, Osasco 06120-042, Brazil
4
Synthesis Center on Global Cities, Institute of Advanced Studies, University of Sao Paulo, Sao Paulo 05508-060, Brazil
5
Department of Intelligent and Sustainable Cities, Nove de Julho University, Sao Paulo 03155-000, Brazil
6
São Paulo State Technological College of Jahu, Technology in Environment and Water Resources, Rua Frei Galvão, s/n, Jardim Pedro Ometto, Jaú 17212-599, Brazil
7
Oceanographic Institute of the University of São Paulo, Praça do Oceanográfico, 191, Cidade Universitária, Sao Paulo 05508-120, Brazil
*
Author to whom correspondence should be addressed.
Sustainability 2023, 15(13), 10092; https://doi.org/10.3390/su151310092
Submission received: 3 April 2023 / Revised: 8 May 2023 / Accepted: 8 June 2023 / Published: 26 June 2023
(This article belongs to the Special Issue Climate Change and Urban Ecology)

Abstract

:
Megacities across the planet face a range of economic and territorial challenges. Future climate predictions suggest that several urban areas will present greater social and environmental problems in the coming decades, which makes strategic planning urgent and necessary for sustainable adaptation in all senses, i.e., economic, social and environmental. Some cities in the global south, such as Sao Paulo, had a history of rapid urban development without environmental planning throughout the 20th century, making urgent the need to expand green infrastructure, especially with the connection of forest fragments to the urban fabric. Therefore, this study aimed (i) to evaluate the increase in official urban parks throughout history, considering the spatialization and typologies of new parks in the territory of Sao Paulo, (ii) to understand the ecosystem services provided by urban forests and its distribution in the city, and (iii) to associate the temporal stability attributes of recent environmental secretaries with the officialization of protected areas in the city of Sao Paulo. The results revealed that only at the beginning of the 21st century was there an effective increase in the number of protected areas that shelter fragments of urban forests, contrasting the strong socio-spatial segregation that occurred in the 20th century with an economically vulnerable population that occupied peripheral areas with greater natural disaster risk. Political stability was a key factor for success in the environmental management of a megacity. The scenarios of environmental injustice reported in this manuscript can be revised with the implementation of policies and actions aimed at expanding green infrastructure in strategic sites, based on specific park typologies for each location. Such actions may come from public–private partnerships (PPP) that subsidize the socio-environmental transformation of the territory.

1. Introduction

Urban forests (UFs) play an important role in the context of cities. Numerous studies have reported multiple environmental and social benefits of green areas, including the mitigation of heat islands [1,2], removal of air pollutants [3,4] and nutrient cycling [5,6]. Urban vegetation has also been regarded for its important role in the local economy, i.e., in real estate valuation [7,8] and in human health and well-being, either by offering places for health promotion [9] or by offering natural products and food [10].
The distribution of UFs is not usually homogeneous in medium and large cities, especially in those that have experienced rapid urban growth over the last century. These cities present a mosaic of green areas immersed in a gray concrete matrix with poor soil water permeability and low promotion of ecosystem services [11]. These areas are notably marked by the lack of strategic environmental planning and misuse of land for climate change adaptation and food security purposes [12], since urban collectives from different parts of the world have used urban green areas to promote spaces for the production and sale of food, reducing the carbon footprint [13].
Climate change is directly affecting people’s lives, as well as the stability of UFs. Currently, more than 50% of plant species in cities face high average values of air temperature, leading to changes in ecological patterns and processes, a fact that opens an opportunity for biological invasion in urban centers [14]. This situation may impose numerous challenges for future climatic scenarios [15].
Among mitigation and adaptation actions against climate change, the use of UFs associated with ecosystem processes stands out. This component integrates biodiversity and its ecosystem services into an overall strategy to assist cities in coping with the adverse impacts of climate change. The expansion of UFs should occur through proper management and be guaranteed by a strong regulation system, ensuring that idle urban green spaces are decreed as protected areas (PAs).
Official PAs can be parks of different typologies, i.e., sports park, waterside park and neighborhood park. However, the formalization of these official areas represents an expensive process for the public treasury, thus leading this action to the second plan regarding strategies and political decisions for low-income settlements. This is even more evident in megacities of developing countries, where social challenges are most pronounced.
The expansion of green infrastructure through the qualification of urban forests is strongly associated with strategies to reduce the risk of natural disasters, which is one of the greatest social challenges in the face of extreme weather events [16]. Expanding and investing in protected areas is, in addition to being an efficient alternative for maintaining biodiversity and ecosystem services, an alternative that seeks income, since every USD 1 invested in protected areas in Brazil is reverted to USD 7 in economic benefits [17].
Although the allocation of public funds is something inherent to each territory, in Brazil, the administrative divisions of the environment usually receive less public funding than other sectors. This becomes even worse when considering a periodic change of public managers in the leadership of these divisions, hindering the continuity of medium- and long-term projects [18]. Thus, the temporal stability of a secretary at the head of the environment secretariat is crucial for the perpetuity and execution of projects aimed at adaptive transformation [19,20].
Furthermore, large cities in developing countries struggle with important cases of corruption and lack of governance, which contributes to this unfortunate scenario. In this context, this set of factors has led the green infrastructure of some large and megacities to a public management abyss. This is the case of the megacity of Sao Paulo, one of the five largest cities in the world, with a population of more than 21 million inhabitants in the metropolitan area [21]. Approximately 48% of the municipal territory is covered by green areas; however, they are very poorly distributed [22].
The city presents severe socioeconomic contrasts and a scenario of environmental injustice, with extremely wooded neighborhoods and high real estate values in some places and a population living in poor settlements immersed in completely gray environments, below the poverty line, in other parts of the city [23]. In this sense, some directions can help stakeholders to understand and strategically plan megacities. Thus, this work addressed the following questions: How did the gray increase and population growth in Sao Paulo influence the provision of urban green spaces (and their respective ecosystem services) for the population that arrived and occupied new areas of the territory? How can political stability be used in favor of expanding urban forests in one of the largest cities on the planet?
The Secretariat of Green and Environment of Sao Paulo (SGESP) had more than ten secretaries in the last decade, preventing long-lasting projects. Undoubtedly, the provision of healthy environments may transform the current situation of socio-environmentally unplanned cities, bringing more benefits to residents and lower public costs in several administrative sectors, e.g., public health [24]. This study addresses strategic issues of public management that may be useful in promoting the city’s green infrastructure in low-income settlements, adapting the urban area to face the climate crisis and proposing long-lasting environmental projects, independent of public management per se.

2. Materials and Methods
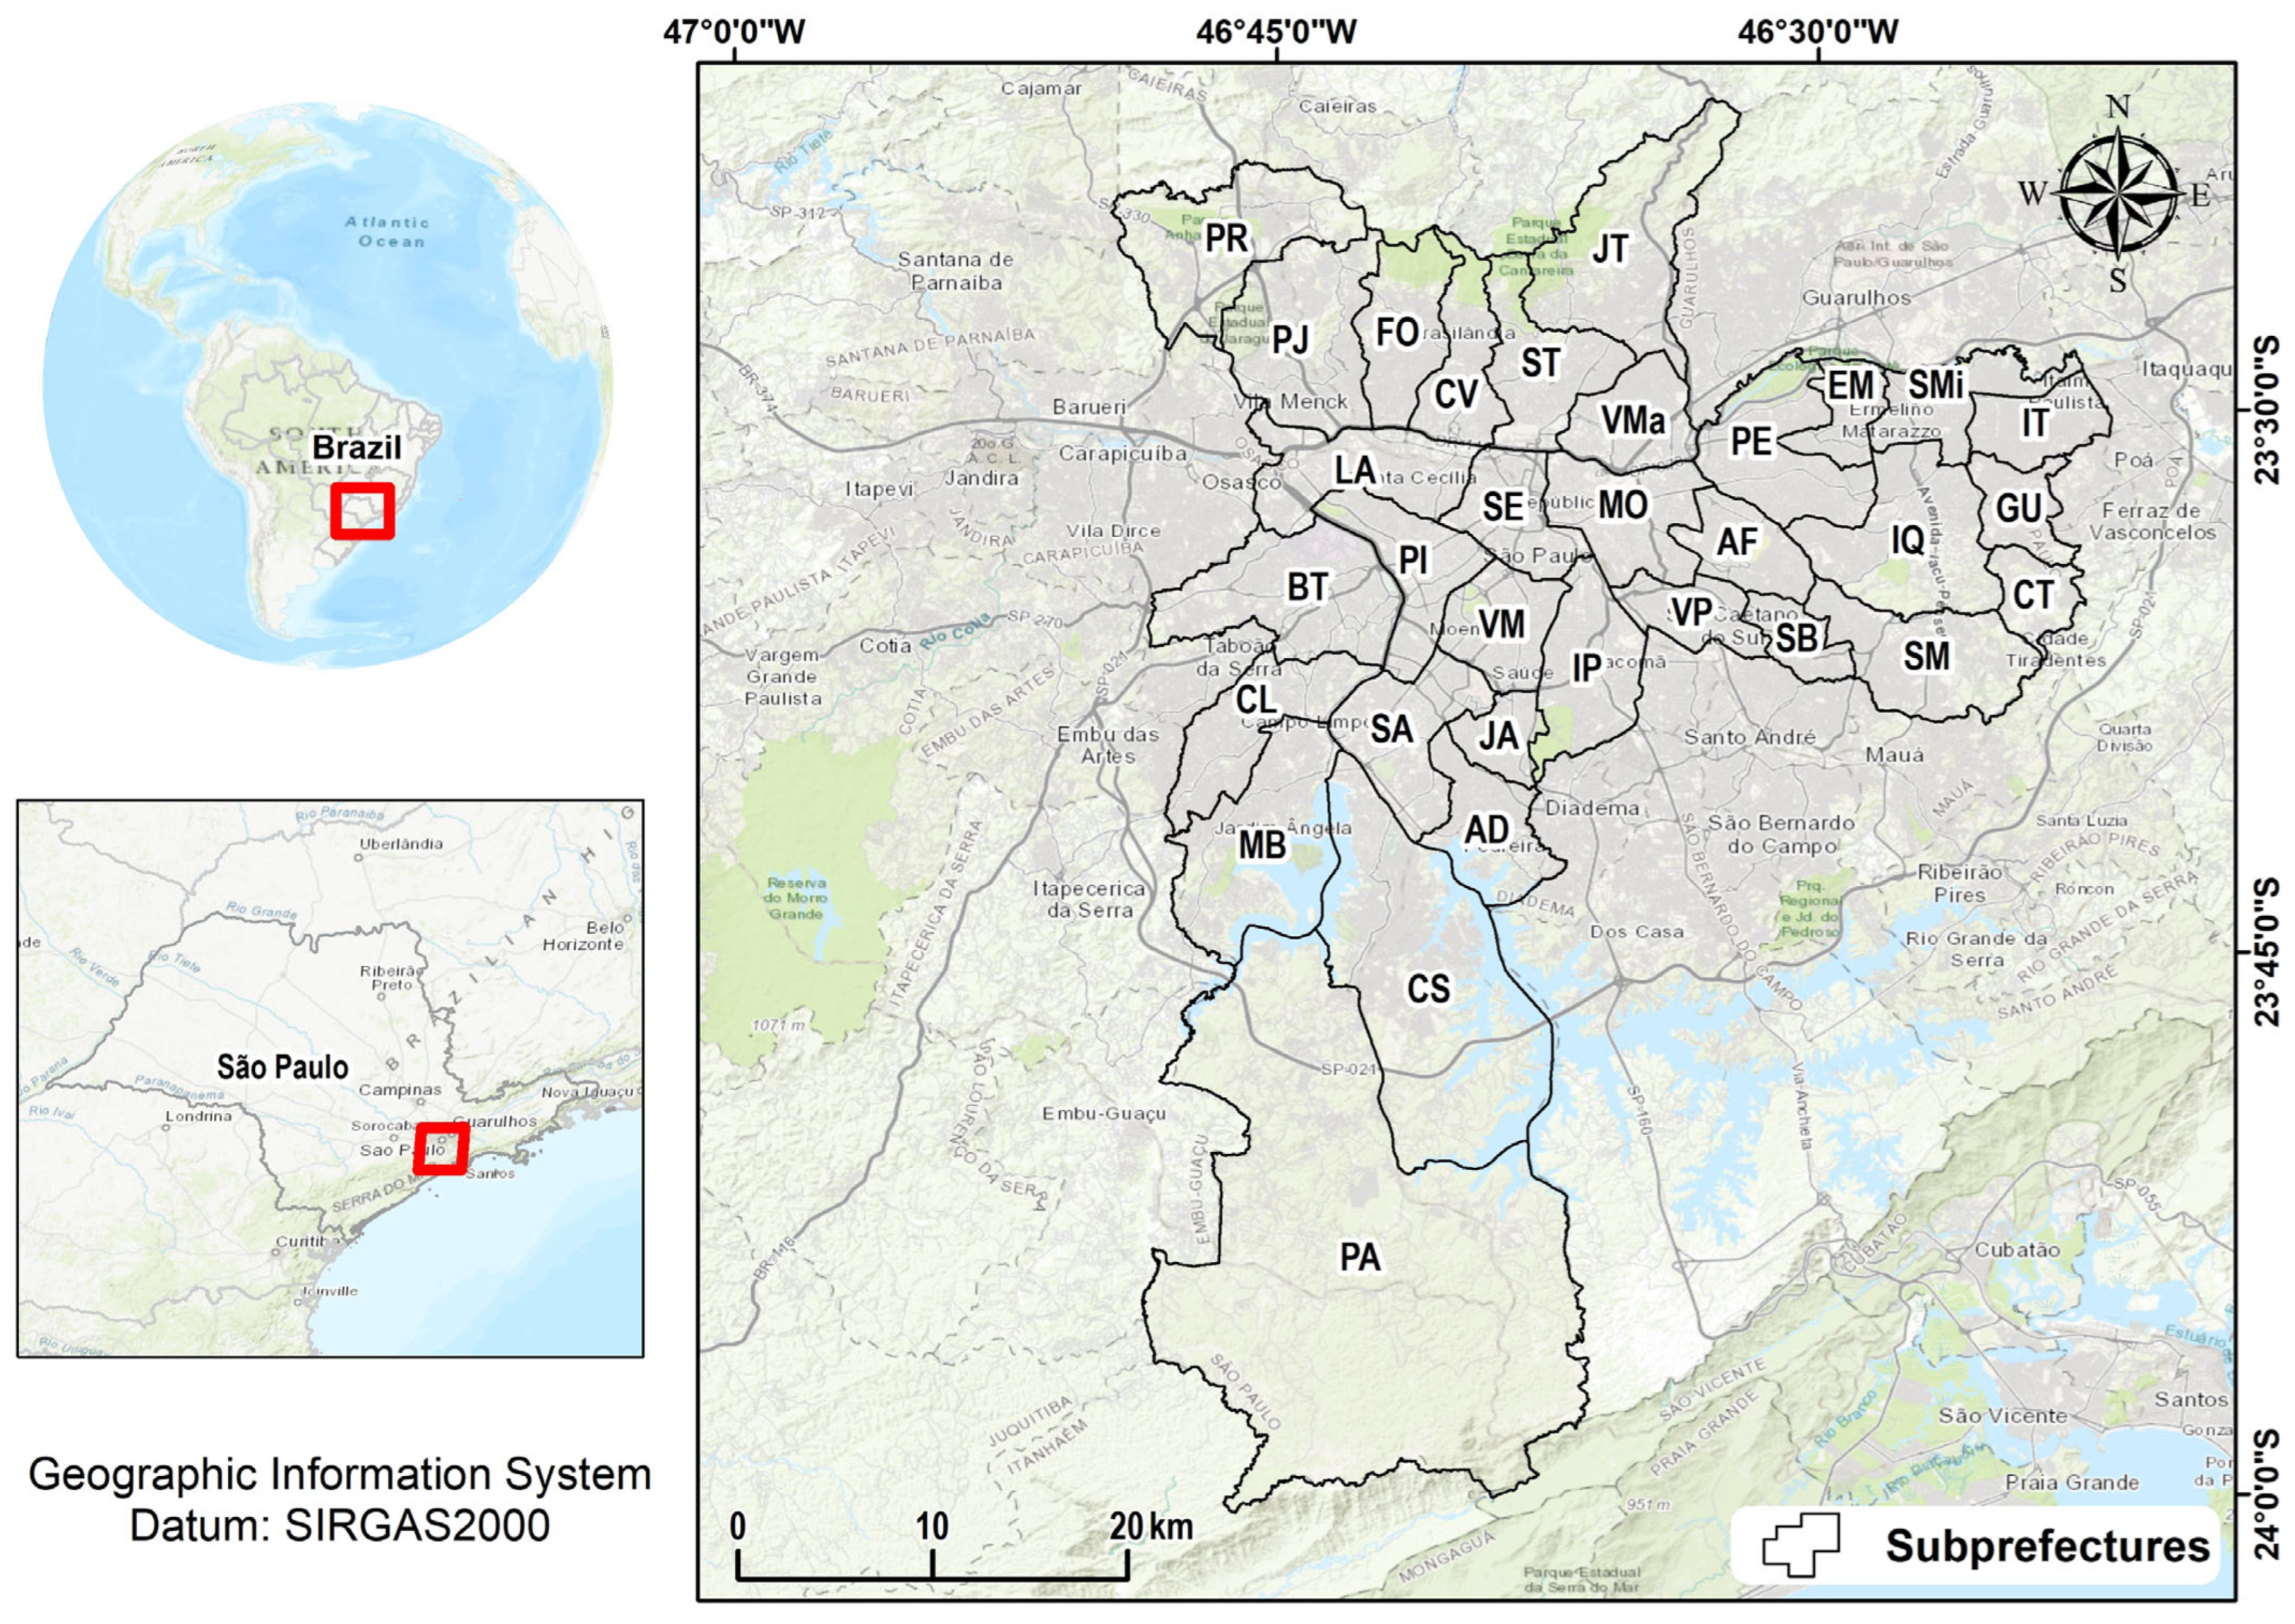
2.1. Study Area

Sao Paulo is one of the largest cities in the world, with an area of about 1521 km², located in southeastern Brazil. By definition, Sao Paulo can be considered a megacity, as its estimated demography of more than 12 million inhabitants [23] exceeds the definitions proposed by Kraas and Mertins [25], which advocate that a megacity is inhabited by more than ten million people. It is worth mentioning that the Brazilian census occurs every 10 years and the last one was supposed to take place in 2020. However, due to the pandemic, the census was carried out in 2022 and the data have not yet been officially published.
The city presents heterogeneity in its physical environment. The climate is humid subtropical, with an annual average of 19 °C, ranging from 15 °C in winter to 24 °C in summer [26]. Air humidity is influenced by the humid air masses that come from the ocean and by the cold fronts that move through the south of the country, with an annual average of 75% [27]. In some parts of the city, the topography is uneven, with the elevation varying between around 700 m in the east zone and 1135 m at Pico do Jaraguá west of the city. The landform is composed of hills and valleys, which at some points even have slopes greater than 25°. This topography presents challenges for urban planning and mobility and has been an important factor in shaping the urban development of the city over time [28].
The city is characterized by a dense and diverse urban landscape composed of 32 subprefectures (Figure 1). The central region has many tall buildings while on the outskirts low buildings and houses predominate. Public transport consists of trains, subways and buses, which in 2022 transported almost 2 billion people. However, the lack of public policies to adapt to climate change, scarcity of green areas and intense vehicle traffic have a negative impact on poor air quality, increased urban temperature and loss of ecosystem services [27,29,30].

2.2. Socioeconomic and Historical Data on the Management of Green Areas in Sao Paulo

The historical assessment of protected areas with an emphasis on green spaces was based on publications, maps, reports, specific legislation and other materials made available by the Sao Paulo Municipal Secretariat for Green and Environment (SGE), the Municipal Secretariat of Subprefectures of Sao Paulo and the Secretariat for the Environment of the State of Sao Paulo through on-site visits and publications of the SGE itself [31,32].
Information on the amount of budget allocations of the respective municipal departments were obtained from official sources of Sao Paulo City Hall, based on an on-site visit. After a request to the City Hall, the data were sent in electronic spreadsheets and processed according to the objectives of this study.
The Brazilian HDI follows the same three dimensions of the global HDI—longevity, education, and income. The average weight of each variable in this index has the same weight, as it is considered that longevity, education and income are equally important elements for guaranteeing human development of the population. The result ranges from 0 to 1, so that the closer to the maximum value, the greater the human development of a given location [33].
Principal component analysis (PCA) was conducted with the aim of correlating socioeconomic, environmental and socio-environmental vulnerability attributes. This test was conducted in the PAST statistical program [34].

2.3. Protected Area Distribution, Typology, and Ecosystem Services in Sao Paulo

The evaluation of the distribution of parks and forest cover in each subprefecture, as well as the types of parks, were obtained from official data from the City Hall of Sao Paulo. The remote sensing (RS) analysis and geographic information system (GIS) were divided into two stages: (i) processing of orbital surface temperature images (2000 and 2020) and (ii) processing of vegetation cover integrated in GIS. Land surface temperature (LST) images were acquired through Javascript routines from the Google Earth Engine Cloud Computing Platform (GEE; https://earthengine.google.com, accessed on 1 April 2023). The data on vegetation cover, urban expansion between 1920 and 1950, and land cover data were acquired, respectively, from the internet sites Geosampa (http://geosampa.prefeitura.sp.gov.br/, accessed on 1 April 2023), Datageo (http://datageo.ambiente.sp.gov.br/, accessed on 1 April 2023) and MapBiomas (https://mapbiomas.org/, accessed on 1 April 2023).
LST is the result of products MOD11A1.006 and MYD11A1.006 from the MODIS sensor, respectively from Terra and Aqua satellites [35]. The daily acquired images composed a single image of the average 22 years with pixel values (digital numbers) converted into land surface temperature values (LST °C), according to Equation (1) [36]:
LST °C = (DN * 0.02) − 273.15
For the identification of the surface heat island (SHI), as well as the comparison of thermal patterns over the years, the surface temperature values (LST) of a given location (image pixel) was standardized [37] in relation to the average surface temperature (LSTmean) of the entire study area and observation period (2000–2020), as well as their respective standard deviation (LSTstd) (Equation (2)):
SHI = (LSTpixel − LSTmean)/LSTstd
This method allows the identification of anomalies relative to the average of a given region, in addition to enabling the verification of areas with higher or lower temperature in relation to this average, in the observed period [38].

3. Results

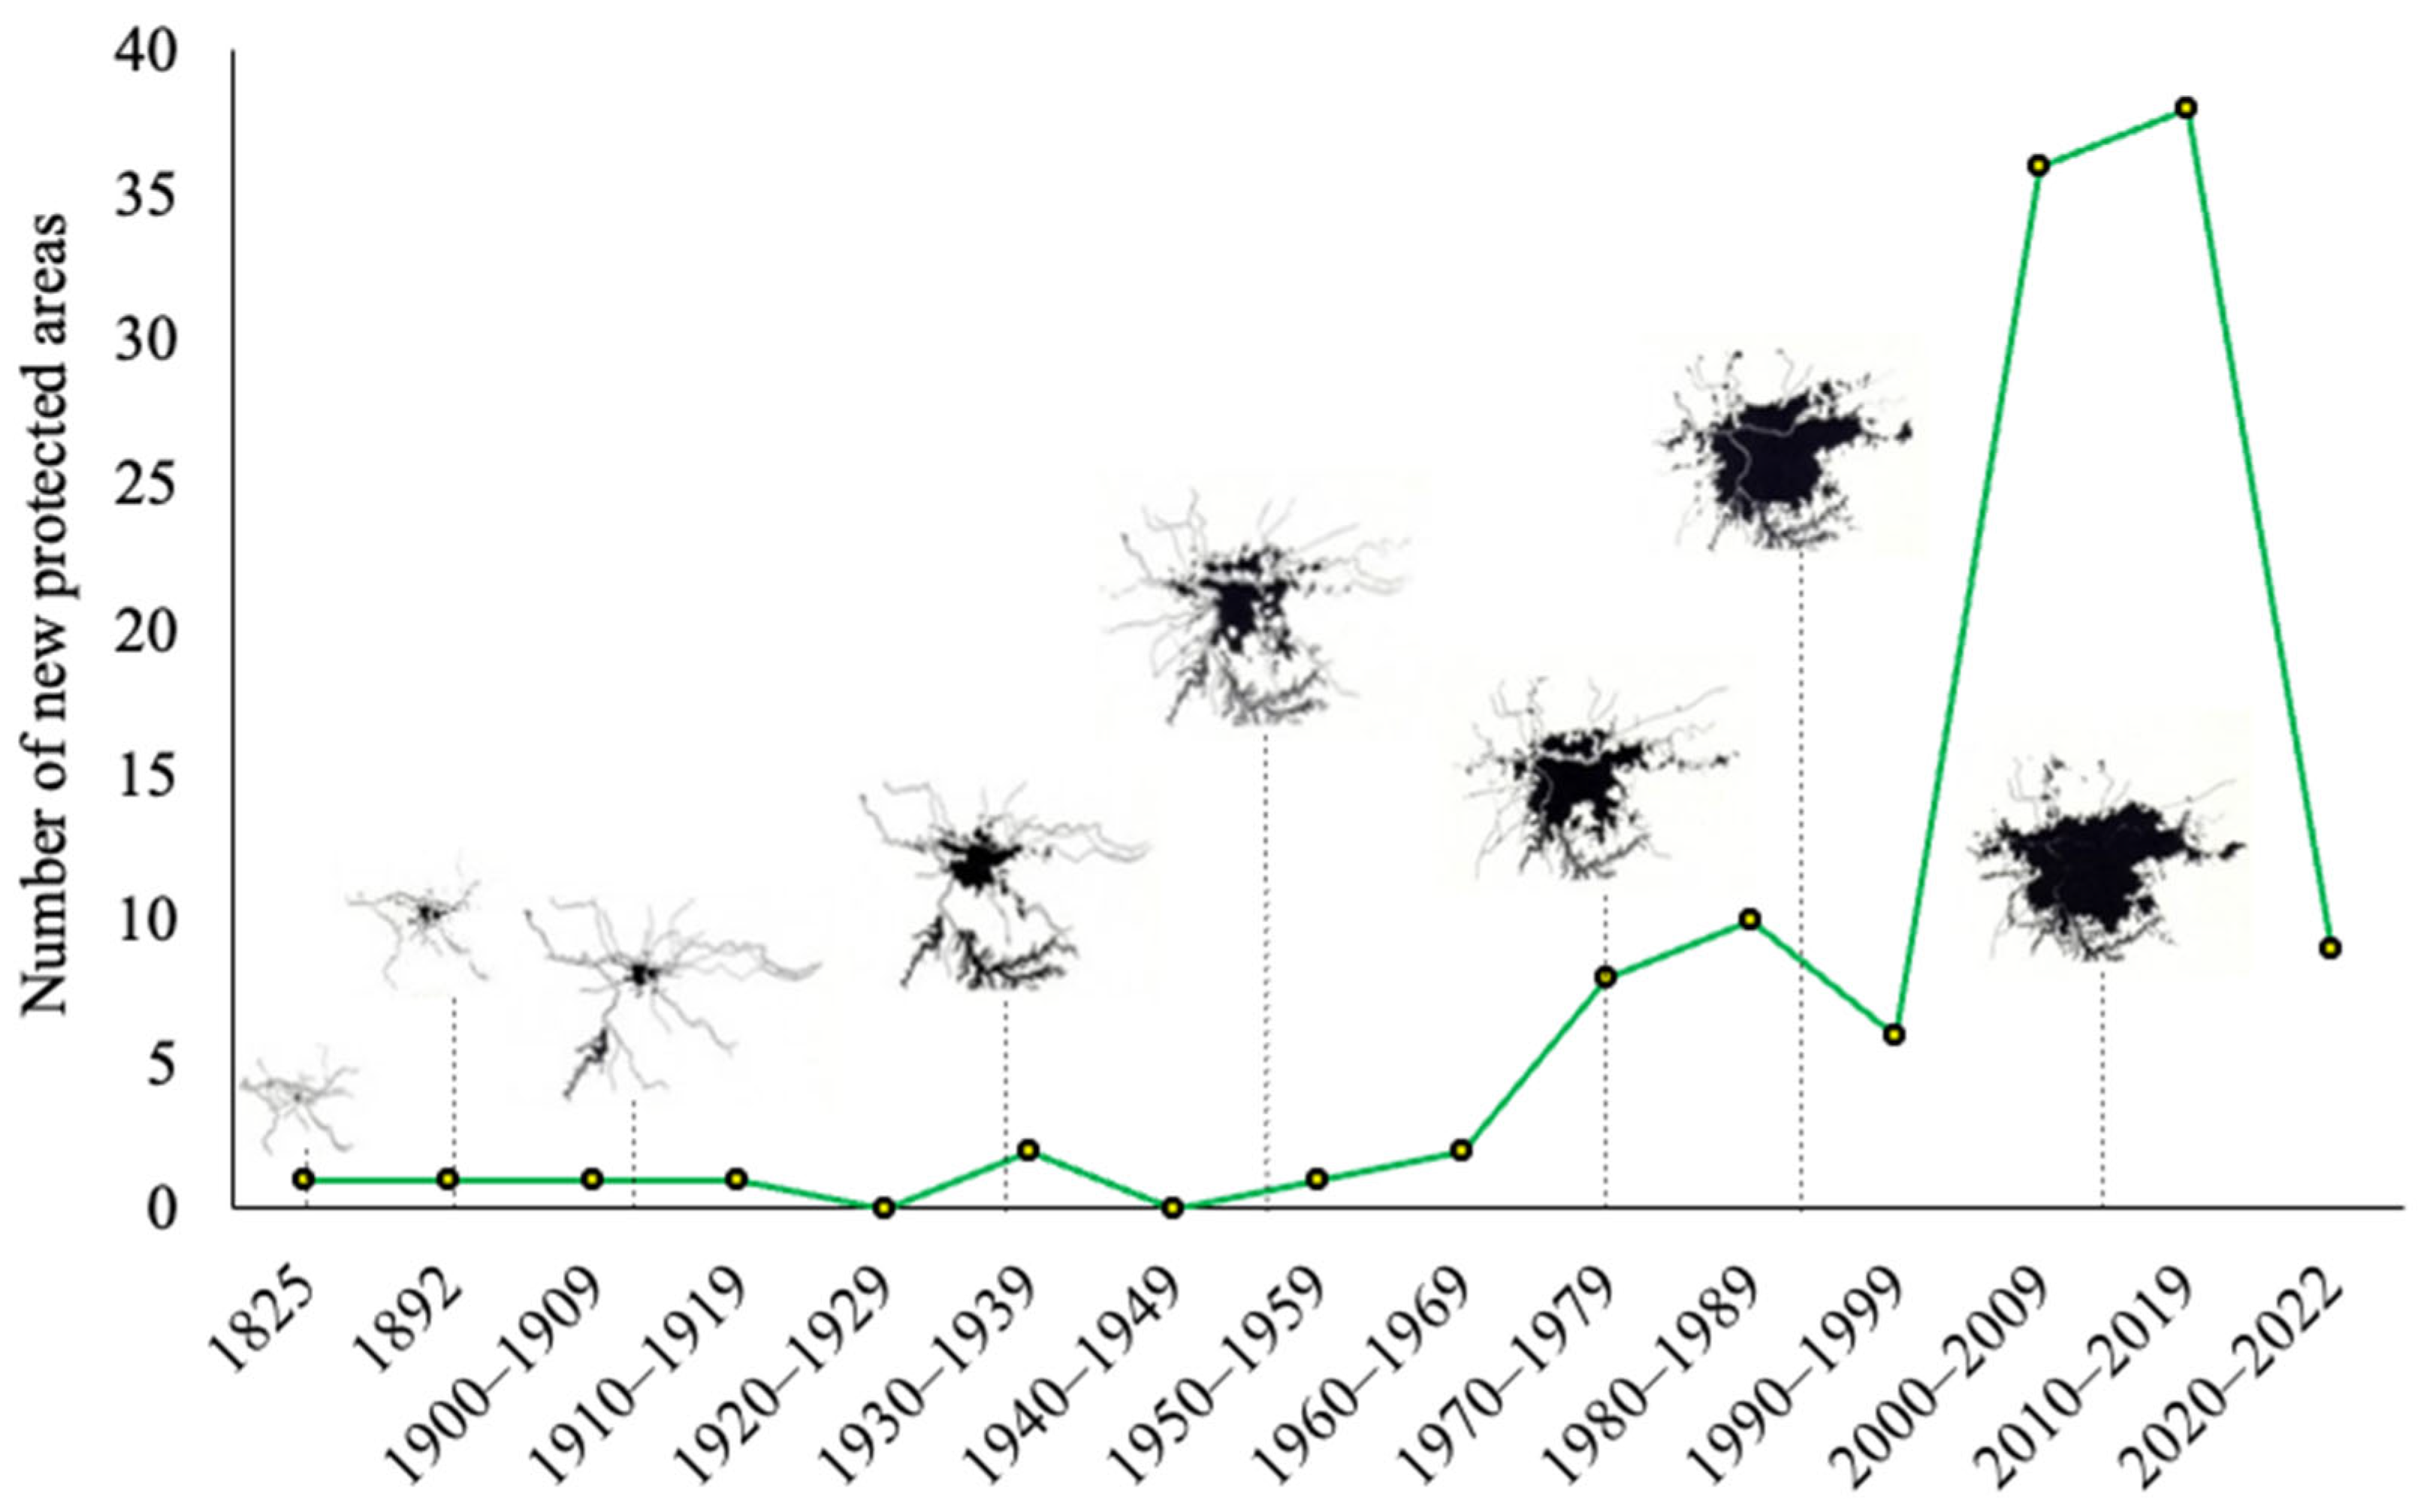
3.1. Historical and Spatial Evolution of Urban Forests into Municipal Protected Areas of Sao Paulo

The city of Sao Paulo grew rapidly throughout the 20th century; however, the increase in officially protected areas did not occur like urban development. It should be noted, however, that from the beginning of the last century to the mid-1960s, the city of Sao Paulo officially created only one protected area (PA) per decade, with the exception of the 1930s, when two PAs were inaugurated, i.e., Park da Aclimacao and Park do Guarapiranga. In the 1970s, public management created ten new official PAs, with only eight in the following decade. Although this number dropped to five new official PAs in the 1990s, it is noteworthy that at the end of the century there was a greater concern to make more official parks in the city of Sao Paulo. Figure 2 shows the number of PAs inaugurated in the city over the years, from 1825 to mid-2022, at the end of the present data collection.

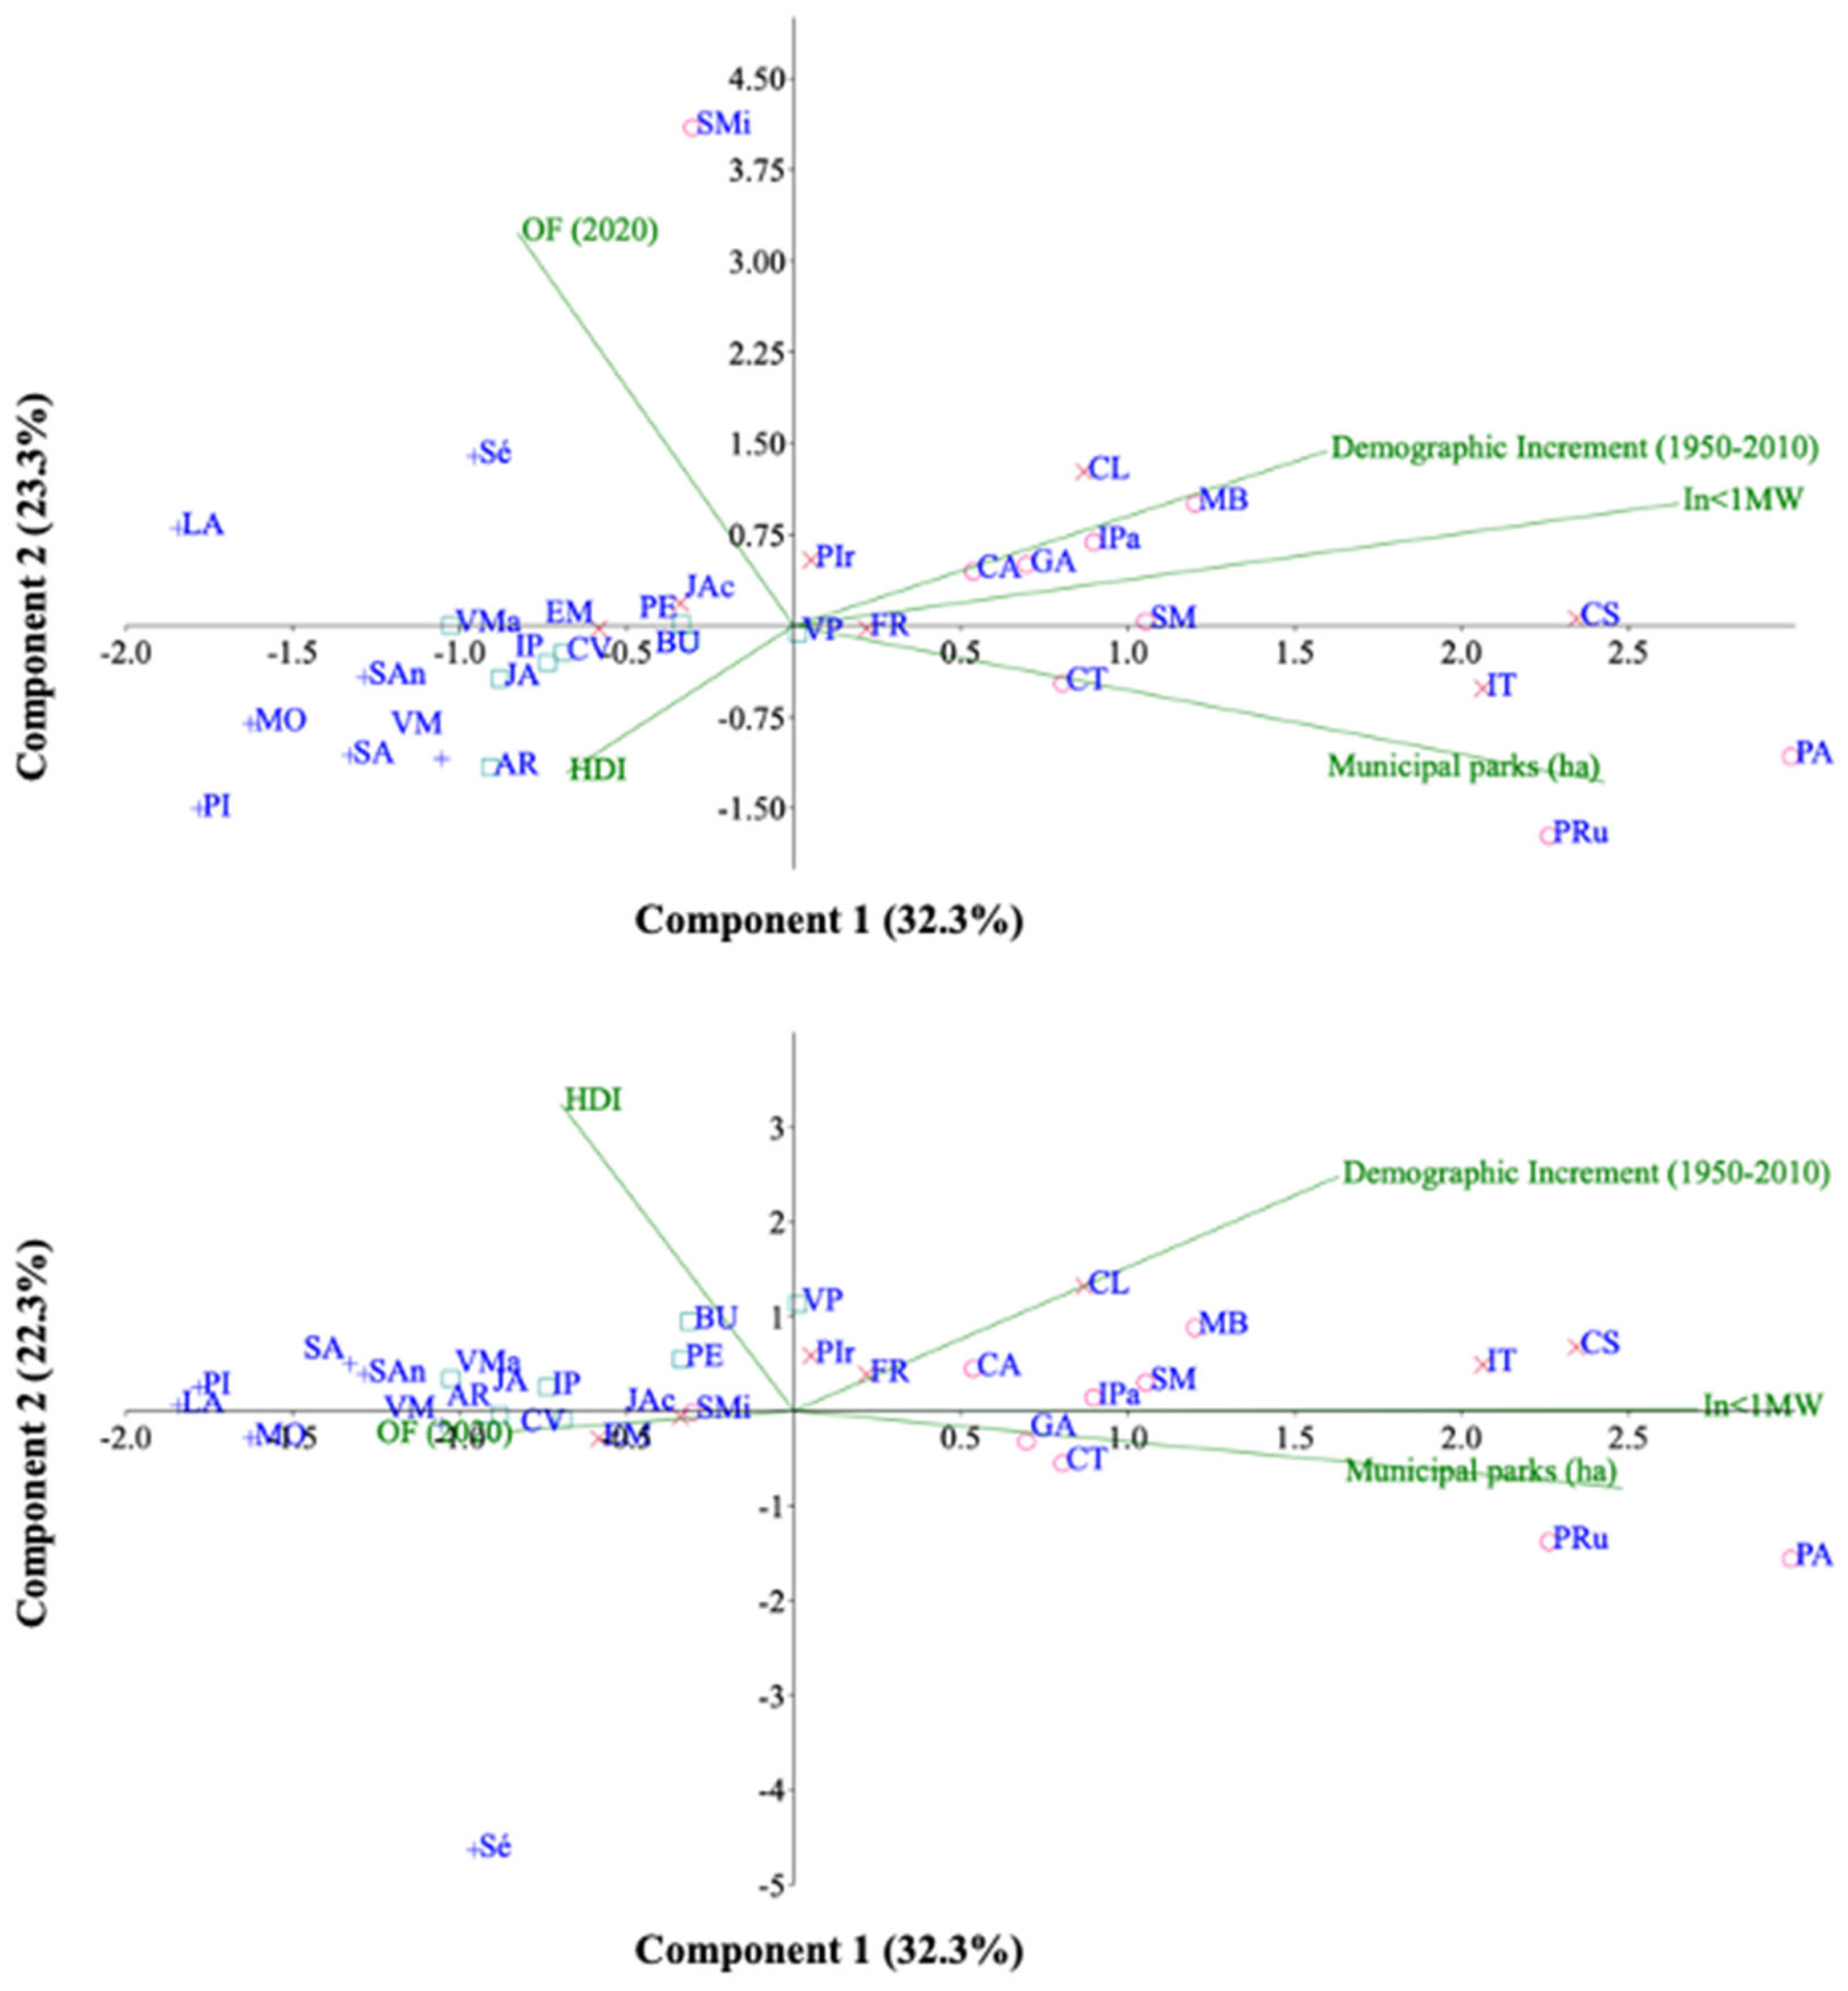
3.2. Urban Demographic Explosion and Socio-Environmental Indices in São Paulo

During the 1950s and 2010, several peripheral neighborhoods experienced explosive growth. This was the case of the subprefecture of Campo Limpo, which faced a demographic increase of 594,402 new inhabitants during this period, followed by the subprefecture of Capela do Socorro (588,347 new inhabitants), M’Boi Mirim (552,403 new inhabitants), Itaquera (508,602 new inhabitants) Vila Prudente/Sapopemba (434,534 new inhabitants) and Pirituba (406,087 new inhabitants). The subprefecture of Cidade Tiradentes jumped from 599 inhabitants in 1950 to 210,902 inhabitants in 2010 [26].
Among the subprefectures with an increase of more than 300,000 inhabitants between the 1950 and 2010 censuses, Itaquera, Vila Prudente and Sao Miguel had the worst human development index (HDI) values and smallest number of green areas officialized by the City Hall (Table 1).
The subprefectures of Lapa and Pinheiros had the highest socioeconomic level and have the most wooded streets in the territory of Sao Paulo [19]. Coincidentally, both subprefectures belong to those with the lowest demographic growth between the years 1950 and 2010, along with Se, Mooca, Parelheiros and Perus. The other subprefectures presented an intense population growth in the second half of the last century and beginning of this millennium. Marked by the demographic explosion, the subprefectures predominantly located on the outskirts of the city and mainly in the east zone were (and still are) those with the lowest HDI values.
Data from the demographic increase between the years 1950 and 2010 showed that a large part of the population that earns up to a monthly minimum wage lives in areas of occurrence of floods, low HDI and low coverage of official municipal parks. The principal component analysis (PCA) showed that 78% of the data variability could be explained by these three factors. Figure 3 shows the formation of four clear groupings based on the axis with the greatest explanation (Axis 1—32.3%).
These analyses showed that demographic growth and low income were associated with the sample units referring to the most peripheral subprefectures of the city and with lower HDI values. The sample unit of Perus strongly influenced the axis of the area of municipal parks, since this subprefecture hosts Park Anhanguera, whose total area is approximately 925 ha.

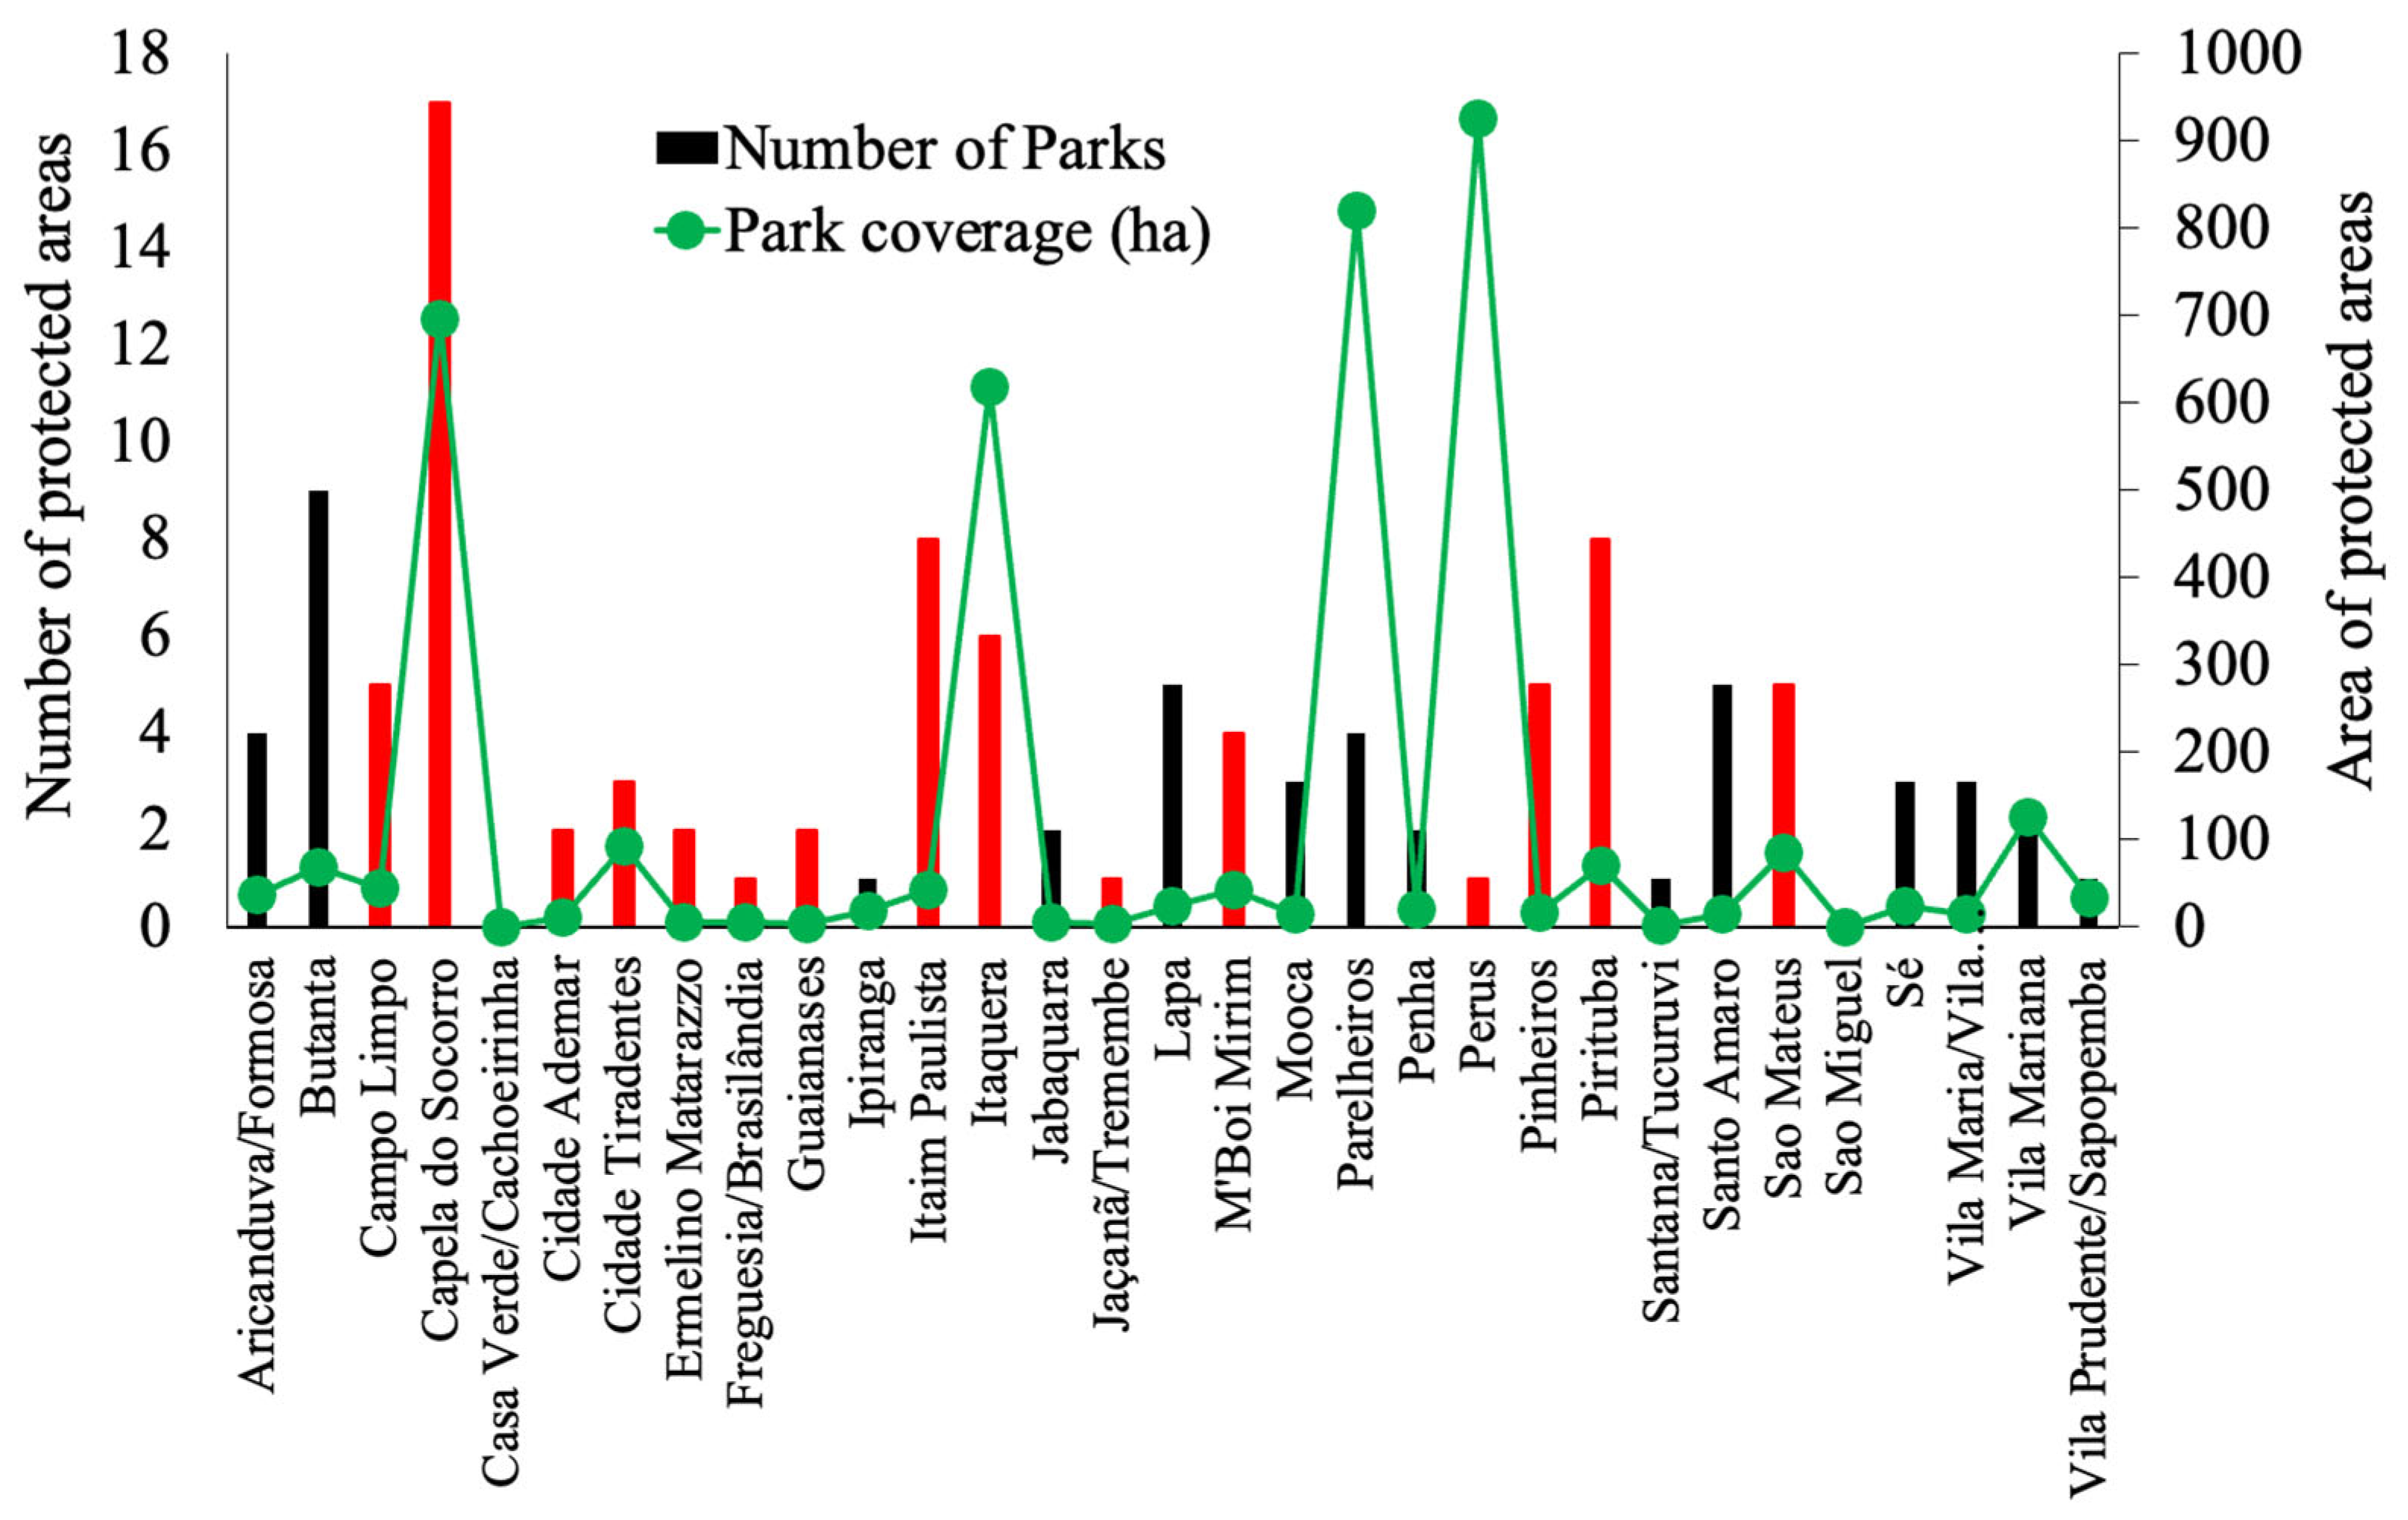
3.3. Distribution of Protected Areas in the Territory, Types of Parks and Ecosystem Services

The distribution of PAs in the city of Sao Paulo is quite heterogeneous. Across the subprefectures, the absolute number of official parks varies greatly. Only three subprefectures have high values of green coverage, i.e., Itaquera, Perus and Parelheiros, which highlights that although some subprefectures have a high number of PAs, the green coverage offering ecosystem services still seems to be insufficient for some demographic contexts. The subprefecture of Itaim Paulista, for example, has eight municipal parks and less than 30 ha of green area covering the region. This subprefecture has the third-worst HDI in the city and the third position in the ranking of population earning up to one minimum wage per month, besides facing serious challenges with floods.
The subprefecture of Capela do Socorro is in a similar situation, however, with 13 parks officialized by the City Hall and less than 10 ha of urban forest cover. This territory was the second-most populated in recent decades and also has one of the worst HDI in the city (Figure 4).
Among the main types of parks in the city, urban parks are the most representative ones, accounting for 62.8% of all units. Water parks represent 18.7% of the total municipal PAs. The other types of parks (conservation, natural, waterfront, wildlife reserve and socio-environmental basis) are the least representative in quantity, although they are very important for multiple uses and ecosystem services (Table 2).
Regarding ecosystem services, it is possible to observe in Figure 5a that the regions with the highest surface temperature values (>2 °C) are those with the lowest percentages of urban forests (80–100%). However, the areas with the highest density of forest fragments are those with SHI values below 0.5 °C, considering the evaluated period. Figure 5b shows a strong correlation between the supply of green areas and thermal comfort along the subprefectures analyzed. In European, Asian and North American countries, several authors have associated the expansion of urban green areas with environmental comfort in cities. Among the various aspects inherent to this attenuation, evapotranspiration processes and the shading of the tree canopy itself play a role in thermal mitigation in urban centers [16,39,40].
Originally, the Metropolitan Region of São Paulo (MRSP) was mainly characterized by forest formations of the Atlantic forest biome, specifically by the dense ombrophylous forest, which occupied approximately 731,262 ha (92% of the territory). The other part of MRSP was covered by savannah and accounted for 63,289 ha (8% of the territory) [41] (Figure 6a).
Figure 6b shows the evolution of use and occupation of the MRSP on two deforestation fronts: the first referring to the urban area of the city of Sao Paulo up to the 1920s, and the other from the 1950s to the present (2020). The latter was guided by the process of industrialization and urbanization due to the formal real estate market heating and by large projects for structuring land use, such as the expansion of the airport, the metropolitan corridor, and the northern section of the Metropolitan Road Ring [42].

3.4. Political Stability and Budget Transfers for the Creation of a Protected Area

Some factors are key to the success of the conservation and expansion of urban forests. In the megacity of Sao Paulo, political stability seemed to be a key component in increasing the number of protected areas. This may come from the continuity of a systemic project for the city’s environment, which facilitates political dialogue and influence with stakeholders.
In 2010, SGE had an annual budget of approximately BRL 293,000,000.00 (~USD 57,007,218.30) with 76 parks to manage, while in 2016 the same secretariat obtained an annual budget of approximately BRL 169,000,000.00 (USD 32,881,296.50) to manage more than 100 parks (Figure 7). This value has become even more challenging in recent years, when the total number of parks in the city has increased and budget revenue has changed very little.
There is also a possible influence of this change of secretaries on the amounts settled by the secretariat. For example, in the short period of time between 2013 and 2015, two secretaries took over the position at SGE and the liquidated amount went from approximately BRL 177,000,000.00 (USD 34,437,807.60) to BRL 101,000,000.00 (USD 19,650,952.40) in the following management, that is, a reduction of 42.9% (Figure 7). This fact shows the little relevance that still exists in the priorities of municipal public management with the secretariat and the environmental problem.

4. Discussion

4.1. History of the Increase in PAs, Socio-Environmental Aspects and Ecosystem Services

The environmental development of the city of Sao Paulo occurred in a disorganized and unfair way, with some areas of the city concentrating greater wealth and others being marked by high poverty and a lack of green areas. The intense rural exodus occurred mainly in the second half of the 20th century brought to the city of Sao Paulo a series of rural inhabitants who, upon arriving in the big city, appropriated public lands [43]. These squatters occupied lands and formed districts without basic sanitation conditions and with other deficiencies in urban infrastructure. The latest official demographic data on the Brazilian territory indicated that, in 2010, more than 84% of the population was urban, as opposed to approximately 31% in the 1940s. This scenario has undoubtedly been one of the biggest problems associated with the loss of green areas and increase in social contrasts in cities [44,45,46].
With a large investment in the construction and expansion of the urban fabric in the early 20th century, planners and municipal managers prioritized the construction of roads and buildings in Sao Paulo, thus generating more jobs, strengthening the economy and taking the city to a higher level of development [47].
The developmental mentality from the first half of the 20th century to the mid-1970s brought about a concern for the economic development of the city of Sao Paulo, leading to an exhaustive investment in gray infrastructure and expansion of the urban area [48]. At the beginning of the 21st century, 83 new PAs were created, 46 of them inaugurated between 2002 and 2010 and the other 37 between 2011 and 2022 (Figure 2).
It is estimated that from 1930 to 1980, the surface of the urbanized area increased from 150 to 1370 km2, with 15 municipal parks implemented in this period, totaling approximately 12 km2 of green areas, with 9.6 km2 belonging to a single park (Park Anhanguera) that at the time was quite far from the urban fabric. Consequently, it is evident that some environmental concerns were neglected and the officialization of PAs did not play a leading role in political priorities. Throughout the urban history of Sao Paulo, the formalization of municipal PAs occurred with emphasis only at the end of the 20th century.
This fact coincided with strong environmental movements in the 1990s, especially those organized by the United Nations (UN), e.g., Rio92. As a result of this environmental concern, in 1993, the city of Sao Paulo created the Municipal Secretariat for Green and the Environment. In the same year, the Municipal Council for the Environment and Sustainable Development (MCESD) was also created in the city, characterized as a consultative and deliberative body on issues of preservation, conservation and defense of the natural and built environment. This entity plays a fundamental role as it is composed by representatives of civil society and public management, so that society’s interests are considered as well as the guidelines established in the strategic master plan of the municipality.
These movements denote a greater concern of the public authorities with the city’s environmental issues in the last decade of the 20th century, a fact accompanied by more effective environmental legislation and public policies in the three spheres of power in Brazil. In this context, two very important public policies were the National System of Conservation Units (NSCU) and the City Statute (CS), both laws being sanctioned at the beginning of this century. The NSCU is a norm that allows the proper management and integration of conservation units throughout the national territory, providing a fresh look at conservation units, as well as their needs for the provision of environmental services. Still in this sense, the CS provided a remodeling in the elaboration of the strategic master plan for Brazilian municipalities. Based on this public policy, certain norms are advocated, and the fate of cities is managed by both the desires of civil society and the public authorities, emphasizing the social interest that regulates the use of urban property in favor of the collective welfare, security and citizens’ well-being, as well as environmental balance.
Such situations show that the economic concern that marked the urban development of the 20th century was not accompanied with the same rigor for socio-environmental concerns, since dealing with high population density, precarious conditions of basic sanitation and poor health conditions occurred in this period [49].
This evidences that intensely populated places in recent decades are predominantly located in the peripheral parts, far from the main offers of products and services in the city center, home to an economically disadvantaged population. In addition, several subprefectures in peripheral regions also have a low number of green areas occupied by municipal parks, thus depriving the poorest part of the population of the numerous ecosystem services offered by urban forests. The subprefectures of Perus and Parelheiros are exceptions to this rule, because although they are very populous and home to low-income populations, they have large municipal parks and a predominance of green areas.
Parelheiros, for example, is at the southern end of the city and its forest cover borders the largest ecological corridor of the Atlantic Forest. This region still has a high level of endemism and is one of the few areas of the biome with little anthropization. Thus, at these ends of the city, it is necessary to create PAs that, by force of law, protect the biodiversity and wildlife still remaining in the biome.
On the other hand, some peripheral areas of Sao Paulo used to be less wooded, present fewer public parks and suffer from problems associated with climate extremes. The subprefecture of Sao Miguel is one of the most populous in the entire territory and struggles with a lack of infrastructure. This is a highly vulnerable area in terms of adapting to climate change and, together with the subprefecture of Lapa, form areas that will have severe future challenges in terms of coping with the expected rainfall climatic extremes for this part of Brazil [15].
However, it should be noted that, like some sites in the subprefecture of Pinheiros, Lapa is close to floodplain areas of important tributary rivers that cross the city, with noble houses in a bohemian area of the city. These places have dense street trees [22] and belong to the part of the city where people with the highest socioeconomic levels live.
The multivariate analysis (PCA) carried out evidences that the territory of Sao Paulo presents a scenario of socio-environmental injustice marked by two main profiles: (i) a rich part with less demographic growth in recent decades and (ii) a poorer part with a recent population explosion. The socio-environmental inequality of Sao Paulo is marked by a set of subprefectures that have experienced demographic explosion in recent decades, and this same set of subprefectures is where most of the population earns up to one minimum wage per month. In addition, these same areas exhibit lower HDI values. The other set of subprefectures has a higher income per capita and higher HDI values and has been marked by a less pronounced demographic increase in recent decades.
Interestingly, the PCA also revealed that a few parts of the poor periphery of Sao Paulo are associated with a large amount of PAs. This is because the city assertively created parks at some geographic ends of the urban fabric, a fact that limits the gray expansion of the city and offers dignity and quality of life to a small part of the large economically vulnerable population. The metropolitan region of Sao Paulo is surrounded by a Biosphere Reserve, certified by UNESCO in 1994. This set of environmental protection and a governance system based on landscape prevents the expansion of the urban fabric and promotes greater organization in the territory in terms ecosystem services offered [50].
Historically, this uneven growth in the territory led to several episodes of environmental injustice, among them the water crisis in periods of long droughts—the years of 2014 and 2015 [51]. In addition, thermal effects of heat islands can bring numerous economic and social losses, especially those associated with public health. Some studies have shown a strong association between increased maximum temperature and suicides in different parts of the world, including data from the city of Sao Paulo [52,53].
The heterogeneous distribution of urban forests in the municipal territory makes some parts of the city exceed the expected average values for maximum temperature, a fact that can be mitigated with the expansion of the green infrastructure [2]. Urban parks can have multiple benefits. Besides offering conditions for human well-being and cultural ecosystem services, they can also mitigate the effects of heat islands [2]. In this sense, urban forests play a key role in comfort and thermal regulation that attenuates urban surface heat islands (SHI). In places where there is a lack of vegetation, there is an increase in SHI, which, associated with atmospheric pollution and poor air circulation in the urban environment, potentiates thermal discomfort and impairs the dispersion of inhalable particulate matter [2]. This may worsen health indicators, especially increasing the occurrence of cardiovascular, respiratory and renal diseases, diabetes, hypertension and even death, reflecting a heavy burden on public health [54,55].

4.2. Typologies and Coverage of Urban Forests, Climate Change and Political Stability

During urban development, some types of parks were created specifically to meet local needs. Although each typology presents its physical particularities, a general problem is the lack of a running management plan in the PAs. The absence of an adequate management plan for waterfront parks, for example, can compromise the use and occupation of the surroundings and seriously interfere with aspects of basic sanitation and water quality in the reservoirs. This burdens the public treasury with more expenses for the treatment of eutrophic water and public health [56,57,58].
In this sense, a lot has been discussed about the role of nature in adapting cities to future climate scenarios. Some climatic models predict a greater intensity of rainfall in the region of the city of Sao Paulo for the coming decades; hence, it is extremely necessary to use urban forests as instruments to adapt the city to such scenarios. Some cities in the global North have expanded the cover of urban forests and have observed positive results [59,60]. In places with a vast hydrographic network, such as Sao Paulo, it is suggested to increase the number of water and waterfront parks, as they may attenuate the impact of rain extremes [61].
The creation of a PA depends on the availability of areas for this type of land use. In Brazil, specifically in Sao Paulo, the origin of the area of a park can come from allotment, expropriation, from a municipal or state public land or even from a donation.
The largest park in the municipal PAs of Sao Paulo comes from allotments, which represents 43.9% of the total of the PAs’ origin. Expropriation is the second-highest occurrence, accounting for 28%, followed by public lands, with 10.3% of the PAs. The fact that public lands are remnant areas resulting from any urban intervention, their greatest occurrence is found in the expanded center of the city, that is, the place that normally has the greatest number of public works.
It is noteworthy that the SGE has prepared several inventories, studies and publications about municipal green areas and other environmental issues, e.g., environmental atlas, inventory of wild fauna and flora, municipal biodiversity inventory, catalogs of biodiversity indicators, among others. In terms of public policies, the secretariat recently prepared the Municipal Plan for the Atlantic Forest (PMMA, in Portuguese), the Municipal Plan for Protected and Green Areas and Open Spaces (PLANPAVEL, in Portuguese), the Municipal Plan for the Conservation and Recovery of Areas Providing Environmental Services (PMSA, in Portuguese) and the Municipal Plan for Urban Afforestation (PMAU, in Portuguese). Although these policies constitute an admirable effort on the part of public workers, the transformation of the space is still timidly perceived, especially in places where the poorest populations live. To face future climate change scenarios, the offer of green spaces in the city must be expanded so that these areas will be legally protected and will not suffer clandestine invasion (or another land use), thus enhancing environmental services and offering a healthier environment to the most vulnerable populations.
However, besides public policy making, political stability can be a key factor in the success of environmental planning. This becomes evident when analyzing the history of Sao Paulo SGE, with the respective changes of secretaries and financial budgets for the sector.
Between 2005 and 2012, financial resources increased by 33.9% and 61 new PAs were created. This period was marked by a strong political stability, being the longest period of a single secretary at the head of the SGE, which probably gave the manager more autonomy to claim budgetary resources compatible with the secretariat’s expenses. In recent years this has been observed once again. Since 2017, the SGE has had the same secretary up to 2022, which has again contributed to an increase in the number of municipal PAs and also a substantial increase in the annual budgeted and settled amounts (Figure 7).
The change of the political party at the head of the Sao Paulo City Hall in 2012 resulted in the change of managers of the various municipal departments, a fact that probably interfered in the planning and execution of projects in progress for the municipal green infrastructure. From this period until the year 2017, eight secretaries were at the head of the SGE (around 1.4 secretaries per year). This characterizes a period of political instability, where the number of PAs remained unchanged and the annual budgeted amount decreased 27.2% over time. As opposed to this pattern, from 2017 up to 2022, only one secretary was at the head of SGE again, and this political stability coincided with an increase in the number of PAs and an unprecedented increase in the annual budgeted amount (77%). In addition to good relationships and perennial projects, political stability can be indirectly associated with more trusting relationships on the part of the private sector [62].
These values show that the public system of management of green areas is on its way to collapse, thus compromising the quality of environmental services in the city of Sao Paulo. Unless there is an intervention or a new model for thinking about the city’s green areas, urban biodiversity and all the foundations advocated in the various planning instruments and environmental control of the municipality may succumb to the concepts of elaboration of linear budgetary pieces, i.e., transfers of budget funds to all departments should be discussed and rethought according to the current and future priorities of the city.
It should be noted that in 2010 there was a discrepancy between the budgeted and paid amounts. This fact is due to an agenda of priorities of the municipal executive power in using complementary funds destined to the different sectors in accordance with the economic priorities of each government.
Comparing the fund transfers to the SGE with other municipal secretariats, a reversal of priorities can be seen in the face of the needs and benefits that modern society demands, with the provision of environmental services being a central issue in the discussion of sustainable cities around the world [63].
The budget prediction for the city of Sao Paulo indicated a total of BRL 95,822,951,303.00 (~USD 18,643,685,682.00) for the year 2023. Out of this total, BRL 17,125,837,769.00 (~USD 3,332,069,531.00) was allocated to the health secretariat (17.87%), BRL 98,156,109,158.00 (~USD 1,586,884,284.00) was allocated to the transport sector (8.51%), BRL 728,552,039.00 (~USD 141,749,915.00) was allocated to sports and leisure (0.76%) and only BRL 572,777.5US85.101 (~USD 85.101) assigned to the environmental sector (0.59%) [64].
While recognizing the indisputable role of the budget allocation to the health or transport secretariats, it is fundamental to consider the importance of improving the environmental system of the city, as it directly contributes to these other areas. Several authors have already demonstrated a relationship between visiting green areas and having better health conditions, whether physical or mental [65,66,67]. In this way, the prevention of health problems can be cheaper than the remedy of diseases in the population. The effect of thermal inversions and heat islands is directly related to the increase in cases of hospitalization for respiratory problems [68,69]. In many cases, the most vulnerable and debilitated people cannot withstand severe temperature variations, and the simple fact of promoting more green spaces in the city can cause climate mitigation by reducing the effect of air temperature variation. Such measures should be more debated between public authorities, civil society and academia, so that not only the transfer of budgetary funds, but also strategies to care for the population can be priorities among executive branch secretariats.
In addition, there are already some models in European and Asian cities where connectivity between protected areas encourages citizens to exchange the most polluting and individual modes of transport for bicycles, accompanied by benefits and institutional policies that favor those who choose to cycle to get around in urban areas [70,71]. Although this change in cultural pattern may take decades to happen in a topographically irregular city, initial measures must be considered and taken in order to produce a more sustainable future from an economic and environmental point of view.
An alternative to finance the expansion of urban protected areas, minimizing public management costs, especially in a situation of low annual budget, is to expand public–private partnerships (PPP). Some models of this type of partnership have been proposed by authors from different continents [72,73,74]. In summary, PPPs are strong candidates to place cities with severe social and economic challenges to reach the goals proposed in the 2030 Agenda, especially in the perspective of the Sustainable Development Goal (SDG) 11—Sustainable Cities and Communities. In this sense, PPPs can be a viable alternative to meet the challenges of urban infrastructure, i.e., expansion, qualification and management of protected areas that can offer conditions of a healthy environment to the citizens, although there may be different interpretations for this situation [75].
In addition, the concession of urban parks to the private sector has been a way for the Sao Paulo City Hall to reduce costs and maintain some control over the city’s green infrastructure. Although public opinion differs regarding parts of this management model, the financial contribution given the scarce budget of the environment secretariat can be significant in the medium and long term. A way to reduce this conflict is to bring civil society closer to the management and pay more attention to the needs and desires of the citizens, even when, in some cases, they diverge from the interests of public management.
Therefore, it becomes important to take the theoretical discussion on financial planning and transfers of budgetary funds to the environment secretariat to strategic planning instruments. Thinking about expanding green areas and idealizing a strengthened green infrastructure in the city can be an intelligent strategy to avoid future environmental problems and to ensure the dignity and well-being of the population. Although the debate on political stability also occurs in other fields of knowledge (e.g., education), we present, in a pioneering way, the discussion of political stability as an instrument for expanding and promoting green infrastructure in the city of Sao Paulo.

5. Conclusions and Policy Remarks

The results of this study point to some challenges in the management of protected areas in the megacity of Sao Paulo. The results showed little evolution in the environmental management of green areas until the mid-1970s, which contrasts with the demographic explosion in the poor outskirts of the territory.
Most of the subprefectures located in the outskirts of the megacity have a historically and current vulnerable socioeconomic situation, with low HDI values. This demonstrates that many small- and medium-sized cities in countries with economic challenges must strategically plan the environmental design of cities, since urban forests are urban adaptation equipment against extreme weather events.
Corroborating this, the areas presented in this manuscript are places with the highest occurrence of natural disasters, e.g., floods. Although the city of Sao Paulo shows a lot of effort in the elaboration of public policies and urban sustainability indicators, effective actions for socio-environmental transformation are needed. In this sense, expanding the number of public–private partnerships could be an efficient alternative to strengthen territorial planning in Sao Paulo. This could guarantee greater economic security in the implementation of existing policies, which are extremely necessary in adapting the city to face future climate scenarios.
It should be noted that some types of parks are more efficient than others. While some typologies have a strong aptitude to serve as an economic vector and social lever, others contribute to water security of the human population and to the city’s flood control. However, it must be considered that tree density is a key management to seek greater thermal comfort and carbon stock, providing more efficient environmental services and thus offering a healthier and more sustainable environment in the megacity. This is more evident in subprefectures that have a low amount of green coverage.
Although it is extremely challenging to propose landscape transformations in a disorderly built environment that houses an economically vulnerable population, strategies must be sought to expand green infrastructure in some extremely gray areas of the city, either with incentives for the creation of green roofs (where possible) or with an intense expansion of green areas in the immediate vicinity of these (gray) urban hotspots.
As greater political stability was associated with the success in expanding PAs in the territory, it is recommended that future public administrations support medium- and long-term proposals, giving continuity to the projects started, even if past administrations have belonged to different political parties. Thus, longer-term leadership at the head of the public office can bring more benefits to the provision of environmental services and adaptation of the city, as such stability confers more autonomy and competence in obtaining financial resources. In addition, it is suggested that a broad review be carried out concerning financial resources transferred to the environment secretariat of Sao Paulo, so that the maintenance and creation of PAs can be promoted with dignity and efficiency, with emphasis on the collective priorities of the citizens.

Author Contributions

Conceptualization, M.L.F., C.T.K. and W.M.S.; methodology, M.L.F., W.M.S. and A.T.d.S.F.; validation, M.L.F. and C.T.K.; formal analysis, M.L.F., W.M.S. and A.T.d.S.F.; investigation, M.L.F. and W.M.S.; resources, M.L.F. and W.M.S.; data curation, M.L.F., W.M.S. and A.T.d.S.F.; writing—original draft preparation, M.L.F., W.M.S. and C.T.K.; writing—review and editing, M.L.F., C.T.K. and A.T.d.S.F.; supervision, M.L.F. and C.T.K.; project administration, M.L.F.; funding acquisition, M.L.F. and C.T.K. All authors have read and agreed to the published version of the manuscript.

Funding

This research was funded by the Brazilian National Council for Scientific and Techno-logical Development—CNPq (Productivity Scholarship in Technological Development and Inno-vative Extension), under the number 306244/2020-9, and also by the Sao Paulo Research Founda-tion—FAPESP, grant number 2019/24325-2.

Institutional Review Board Statement

Not applicable.

Informed Consent Statement

Not applicable.

Data Availability Statement

All data and sources were provided throughout the manuscript.

Conflicts of Interest

The authors declare no conflict of interest.

References

  1. Martins, A.P.G.; Ribeiro, A.P.; Ferreira, M.L.; Martins, M.A.G.; Negri, E.M.; Scapin, M.A.; Lafortezza, R. Infraestrutura verde para monitorar e minimizar os impactos da poluição atmosférica. Estud. Avançados 2021, 35, 31–57. [Google Scholar] [CrossRef]
  2. Ribeiro, A.P.; Bollmann, H.A.; de Oliveira, A.; Rakauskas, F.; Cortese TT, P.; Rodrigues MS, C.; Ferreira, M.L. The role of tree landscape to reduce effects of urban heat islands: A study in two Brazilian cities. Trees 2021, 37, 17–30. [Google Scholar] [CrossRef]
  3. Nowak, D.J.; Hirabayashi, S.; Bodine, A.; Greenfield, E. Tree and forest effects on air quality and human health in the United States. Environ. Pollut. 2014, 193, 119–129. [Google Scholar] [CrossRef] [PubMed] [Green Version]
  4. Ramon, M.; Ribeiro, A.P.; Theophilo CY, S.; Moreira, E.G.; de Camargo, P.B.; de Bragança Pereira, C.A.; Ferreira, M.L. Assessment of four urban forest as environmental indicator of air quality: A study in a brazilian megacity. Urban Ecosyst. 2022, 26, 197–207. [Google Scholar] [CrossRef]
  5. Ferreira, M.L.; Barbosa, M.F.; Gomes EP, C.; do Nascimento AP, B.; de Luca, E.F.; da Silva, K.G.; Lafortezza, R. Ecological implications of twentieth century reforestation programs for the urban forests of São Paulo, Brazil: A study based on litterfall and nutrient cycling. Ecol. Process. 2021, 10, 27. [Google Scholar] [CrossRef]
  6. Pereira MA, G.; Domingos, M.; da Silva, E.A.; Aragaki, S.; Ramon, M.; de Camargo, P.B.; Ferreira, M.L. Isotopic composition (δ13C and δ15N) in the soil-plant system of subtropical urban forests. Sci. Total Environ. 2022, 851, 158052. [Google Scholar] [CrossRef]
  7. Łaszkiewicz, E.; Czembrowski, P.; Kronenberg, J. Can proximity to urban green spaces be considered a luxury? Classifying a non-tradable good with the use of hedonic pricing method. Ecol. Econ. 2019, 161, 237–247. [Google Scholar] [CrossRef]
  8. Dell’Anna, F.; Bravi, M.; Bottero, M. Urban Green infrastructures: How much did they affect property prices in Singapore? Urban For. Urban Green. 2022, 68, 127475. [Google Scholar] [CrossRef]
  9. Oliveira, N.C.; Albuquerque, J.F.; Silva MW, N.; Dalmas, F.B.; Portes, L.A. Green areas as promoters of health, leisure and physical activity: A systematic review. Rev. Gestão Ambient. Sustentabilidade 2022, 11, 22938. [Google Scholar] [CrossRef]
  10. Santos, S.R.; Ferreira, M.L.; Francos, M.S.; Benini, S.M.; Tavares, A.R.; do Nascimento, A.P.B. Multipurpose plants in home gardens of Guarulhos (São Paulo State, Brazil): From biodiversity conservation to public health. Rev. Gestão Ambient. Sustentabilidade 2022, 11, 22939. [Google Scholar] [CrossRef]
  11. Viezzer, J.; Schmidt MA, R.; dos Reis AR, N.; Freiman, F.P.; de Moraes, E.N.; Biondi, D. Restoration of urban forests to reduce flood susceptibility: A starting point. Int. J. Disaster Risk Reduct. 2022, 74, 102944. [Google Scholar] [CrossRef]
  12. Bennedetti, L.V.; de Almeida Sinisgalli, P.A.; Ferreira, M.L.; Lemes de Oliveira, F. Challenges to Promote Sustainability in Urban Agriculture Models: A Review. Int. J. Environ. Res. Public Health 2023, 20, 2110. [Google Scholar] [CrossRef]
  13. Park, H.; Kramer, M.; Rhemtulla, J.M.; Konijnendijk, C.C. Urban food systems that involve trees in Northern America and Europe: A scoping review. Urban For. Urban Green. 2019, 45, 126360. [Google Scholar] [CrossRef]
  14. Esperon-Rodriguez, M.; Baumgartner, J.B.; Beaumont, L.J.; Lenoir, J.; Nipperess, D.; Power, S.A.; Gallagher, R.V. Climate-change risk analysis for global urban forests. bioRxiv 2021. [Google Scholar] [CrossRef]
  15. IPCC. Climate Change 2022: Impacts, Adaptation, and Vulnerability. In Contribution of Working Group II to the Sixth Assessment Report of the Intergovernmental Panel on Climate Change; Pörtner, H.-O., Roberts, D.C., Tignor, M., Poloczanska, E.S., Mintenbeck, K., Alegría, A., Craig, M., Langsdorf, S., Löschke, S., Möller, V., et al., Eds.; Cambridge University Press: Cambridge, UK; New York, NY, USA, 2022; p. 3056. [Google Scholar]
  16. Yang, Y.; Song, F.; Ma, J.; Wei, Z.; Song, L.; Cao, W. Spatial and temporal variation of heat islands in the main urban area of Zhengzhou under the two-way influence of urbanization and urban forestry. PLoS ONE 2022, 17, e0272626. [Google Scholar] [CrossRef]
  17. Souza TV, S.B.; Thapa, B.; Rodrigues CG, D.O.; Imori, D. Economic impacts of tourism in protected areas of Brazil. J. Sustain. Tour. 2019, 27, 735–749. [Google Scholar]
  18. González-Bustamante, B. Ministerial stability during presidential approval crises: The moderating effect of ministers’ attributes on dismissals in Brazil and Chile. Br. J. Politics Int. Relat. 2022, 16, 13691481221124850. [Google Scholar] [CrossRef]
  19. Anderies, J.M.; Janssen, M.A. Robustness of social-ecological systems: Implications for public policy. Policy Stud. J. 2013, 41, 513–536. [Google Scholar] [CrossRef] [Green Version]
  20. Pant, L.P.; Adhikari, B.; Bhattarai, K.K. Adaptive transition for transformations to sustainability in developing countries. Curr. Opin. Environ. Sustain. 2015, 14, 206–212. [Google Scholar] [CrossRef]
  21. UN United Nation. World Population Prospects. 2018. Available online: https://population.un.org/wpp/ (accessed on 27 March 2023).
  22. Paulo, S. Secretaria Municipal do Verde e do Meio Ambiente/Coordenação de Planejamento Ambiental. Mapeamento Digital da Cobertura Vegetal do Município de São Paulo. Relatório Final/Coordenação: OLIVEIRA, Vivian Prado de; SVMA: São Paulo, Brazil, 2020. Available online: https://www.prefeitura.sp.gov.br/cidade/secretarias/upload/meio_ambiente/RelCobVeg2020_vFINAL_compressed(1).pdf (accessed on 13 February 2023).
  23. IBGE—Instituto Brasileiro de Geografia e Estatística. Available online: https://www.ibge.gov.br/cidades-e-estados/sp/sao-paulo.html (accessed on 10 February 2023).
  24. Astell-Burt, T.; Navakatikyan, M.; Eckermann, S.; Hackett, M.; Feng, X. Is urban green space associated with lower mental healthcare expenditure? Soc. Sci. Med. 2022, 292, 114503. [Google Scholar] [CrossRef]
  25. Kraas, F.; Mertins, G. Megacities and global change. In Megacities: Our Global Urban Future; Springer: Berlin/Heidelberg, Germany, 2014; pp. 1–6. [Google Scholar]
  26. Rolim, G.D.; Camargo, M.B.; Lania, D.G.; Moraes, J.F. Classificação climática de Köppen e de Thornthwaite e sua aplicabilidade na determinação de zonas agroclimáticas para o estado de São Paulo. Bragantia 2007, 66, 711–720. [Google Scholar] [CrossRef] [Green Version]
  27. Valverde, M.C.; de Oliveira, C.A.; Brambila, R. O padrão de chuvas na região do ABC Paulista: Os extremos e seus impactos. Rev. Bras. Climatol. 2018, 22, 165–187. [Google Scholar] [CrossRef] [Green Version]
  28. Schutzer, J.G. Análise estratégica do relevo e planejamento territorial urbano: Compartimentos ambientais estruturantes na macrometrópole de São Paulo. Rev. Labverde 2012, 5, 12–36. [Google Scholar] [CrossRef] [Green Version]
  29. Pereira, R.G.; Teixeira SS, S. A paisagem urbana de São Paulo: Análise a partir do uso de geotecnologias. Rev. Bras. Geogr. Física 2017, 10, 1084–1097. [Google Scholar]
  30. Paulo, S. Demographic History of the Municipality of São Paulo/Histórico Demográfico do Município de São Paulo. 2023. Available online: http://smul.prefeitura.sp.gov.br/historico_demografico/tabelas.php. (accessed on 15 February 2023).
  31. Takiya, H. Atlas Ambiental do Município de São Paulo. Fase I: Diagnóstico e bases para a definição de políticas públicas para as áreas verdes no Município de São Paulo. Prefeitura do Município de São Paulo/Environmental Atlas of the Municipality of São Paulo. Phase I: Diagnosis and bases for the definition of public policies for green areas in the municipality of São Paulo. City Hall Munic. São Paulo 2002, 1, 1–198. [Google Scholar]
  32. SVMA. Publications of the Secretariat of Green and Environment of São Paulo. 2023. Available online: https://www.prefeitura.sp.gov.br/cidade/secretarias/meio_ambiente/publicacoes_svma/index.php?p=3351 (accessed on 22 February 2023).
  33. PNUD. Desenvolvimento Humano e IDH. 2023. Available online: https://www.undp.org/pt/brazil/o-que-%C3%A9-o-idhm (accessed on 6 May 2023).
  34. Hammer, O.; Harper DA, T.; Ryan, P.D. PAST: Paleontological Statistics Software Package for Education and Data Analysis; Paleontological Museum, University of Oslo: Oslo, Norway, 2022. [Google Scholar]
  35. Justice, C.O.; Townshend JR, G.; Vermote, E.F.; Masuoka, E.; Wolfe, R.E.; Saleous, N.; Morisette, J.T. An overview of MODIS Land data processing and product status. Remote Sens. Environ. 2002, 83, 3–15. [Google Scholar] [CrossRef]
  36. Wan, Z. MODIS Collection-6 LST Products Users’ Guide; ERI, University of California: Santa Barbara, CA, USA, 2019. Available online: https://landweb.modaps.eosdis.nasa.gov/QA_WWW/forPage/user_guide/061/MOD11_C61_UsersGuide_revSudipta_revPete_Final.pdf (accessed on 4 April 2023).
  37. Alcoforado, M.J.; Andrade, H.; Lopes, A.; Vasconcelos, J. Application of climatic guidelines to urban planning: The example of Lisbon (Portugal). Landsc. Urban Plan. 2009, 90, 56–65. [Google Scholar] [CrossRef]
  38. Shimomura, A.R.P.; Ferreira, A.T.d.S. Local climate zone classification adapted for mapping agricultural areas in metropolitan areas. In Abstracts; Faculdade de Arquitetura e Urbanismo, Universidade de São Paulo: New York, NY, USA, 2018; Available online: https://ams.confex.com/ams/ICUC10/meetingapp.cgi/Paper/342180 (accessed on 27 March 2023).
  39. Zhang, X.; Wang, D.; Hao, H.; Zhang, F.; Hu, Y. Effects of land use/cover changes and urban forest configuration on urban heat islands in a loess hilly region: Case study based on Yan’an City, China. Int. J. Environ. Res. Public Health 2017, 14, 840. [Google Scholar] [CrossRef] [Green Version]
  40. Nastran, M.; Kobal, M.; Eler, K. Urban heat islands in relation to green land use in European cities. Urban For. Urban Green. 2019, 37, 33–41. [Google Scholar] [CrossRef] [Green Version]
  41. Baitello, J.B.; Aguiar, O.T.; Pastore, J.A.; Arzolla, F.A.R.D.P. Parque Estadual do Juquery: Refúgio de cerrado no domínio atlântico. IF Sér. Reg. 2013, 50, 1–46. [Google Scholar]
  42. Iacovini, R.F.G. Rodoanel Mário Covas: Actors, Arenas and Processes. Ph.D. Thesis, University of São Paulo, São Paulo, Brazil, 2013. Available online: https://www.teses.usp.br/teses/disponiveis/16/16139/tde-02072013-172900/en.php (accessed on 27 March 2023).
  43. Buhaug, H.; Urdal, H. An urbanization bomb? Population growth and social disorder in cities. Glob. Environ. Chang. 2013, 23, 1–10. [Google Scholar] [CrossRef]
  44. Inouye CE, N.; de Sousa, W.C., Jr.; De Freitas, D.M.; Simões, E. Modelling the spatial dynamics of urban growth and land use changes in the north coast of São Paulo, Brazil. Ocean. Coast. Manag. 2015, 108, 147–157. [Google Scholar] [CrossRef]
  45. de Espindola, G.M.; da Costa Carneiro, E.L.; Façanha, A.C. Four decades of urban sprawl and population growth in Teresina, Brazil. Appl. Geogr. 2017, 79, 73–83. [Google Scholar] [CrossRef]
  46. Correia Filho WL, F.; de Oliveira-Júnior, J.F.; dos Santos CT, B.; Batista, B.A.; de Barros Santiago, D.; da Silva Junior, C.A.; Freire, F.M. The influence of urban expansion in the socio-economic, demographic, and environmental indicators in the City of Arapiraca-Alagoas, Brazil. Remote Sens. Appl. Soc. Environ. 2022, 25, 100662. [Google Scholar] [CrossRef]
  47. Oliva, J.T.; Fonseca, F.P. O “modelo São Paulo”: Uma descompactação antiurbanidade na gênese da metrópole. Rev. Inst. Estud. Bras. 2016, 20–56. [Google Scholar] [CrossRef]
  48. Pereira, L.B. Development and Crisis in Brazil, 1930–1983, 1st ed.; Routledge: New York, NY, USA, 2019. [Google Scholar]
  49. Semensatto, D.; Labuto, G.; Zorzal-Almeida, S.; McRae, D.V. Spatio-temporal changes in water quality in the Guarapiranga reservoir (São Paulo, Brazil): Insights from a long-term monitoring data series. Environ. Monit. Assess. 2021, 193, 380. [Google Scholar] [CrossRef]
  50. Metzger, J.P.; Fidelman, P.; Sattler, C.; Schroter, B.; Maron, M.; Eigenbrod, F.; Rhodes, J.R. Connecting governance interventions to ecosystem services provision: A social-ecological network approach. People Nat. 2020, 3, 266–280. [Google Scholar] [CrossRef]
  51. Amaral, M.H.; Benites-Lazaro, L.L.; de Almeida Sinisgalli, P.A.; da Fonseca Alves, H.P.; Giatti, L.L. Environmental injustices on green and blue infrastructure: Urban nexus in a macrometropolitan territory. J. Clean. Prod. 2021, 289, 125829. [Google Scholar] [CrossRef]
  52. Kim, Y.; Kim, H.; Gasparrini, A.; Armstrong, B.; Honda, Y.; Chung, Y.; Hashizume, M. Suicide and ambient temperature: A multi-country multi-city study. Environ. Health Perspect. 2019, 127, 117007. [Google Scholar] [CrossRef]
  53. Zhao, Q.; Guo, Y.; Ye, T.; Gasparrini, A.; Tong, S.; Overcenco, A.; Li, S. Global, regional, and national burden of mortality associated with non-optimal ambient temperatures from 2000 to 2019: A three-stage modelling study. Lancet Planet. Health 2021, 5, e415–e425. [Google Scholar] [CrossRef] [PubMed]
  54. Huang, D.; Xu, J.; Zhang, S. Valuing the health risks of particulate air pollution in the Pearl River Delta, China. Environ. Sci. Policy 2012, 15, 38–47. [Google Scholar] [CrossRef]
  55. Liu, W.T.; Ma, C.M.; Liu, I.J.; Han, B.C.; Chuang, H.C.; Chuang, K.J. Effects of commuting mode on air pollution exposure and cardiovascular health among young adults in Taipei, Taiwan. Int. J. Hyg. Environ. Health 2015, 218, 319–323. [Google Scholar] [CrossRef] [PubMed]
  56. Fontana, L.; Albuquerque AL, S.; Brenner, M.; Bonotto, D.M.; Sabaris, T.P.; Pires, M.A.; Bicudo, D.C. The eutrophication history of a tropical water supply reservoir in Brazil. J. Paleolimnol. 2014, 51, 29–43. [Google Scholar] [CrossRef]
  57. Brito, F.M.; Miraglia SG, E.K.; Semensatto, D. Ecosystem services of the Guarapiranga Reservoir watershed (São Paulo, Brazil): Value of water supply and implications for management strategies. Int. J. Urban Sustain. Dev. 2018, 10, 49–59. [Google Scholar] [CrossRef]
  58. Schoen, M.E.; Xue, X.; Wood, A.; Hawkins, T.R.; Garland, J.; Ashbolt, N.J. Cost, energy, global warming, eutrophication and local human health impacts of community water and sanitation service options. Water Res. 2017, 109, 186–195. [Google Scholar] [CrossRef]
  59. Webber, M.K.; Samaras, C. A review of decision making under deep uncertainty applications using green infrastructure for flood management. Earth’s Future 2022, 10, e2021EF002322. [Google Scholar] [CrossRef]
  60. Štrbac, S.; Kašanin-Grubin, M.; Pezo, L.; Stojić, N.; Lončar, B.; Ćurčić, L.; Pucarević, M. Green Infrastructure Designed through Nature-Based Solutions for Sustainable Urban Development. Int. J. Environ. Res. Public Health 2023, 20, 1102. [Google Scholar] [CrossRef]
  61. Sun, Y.; Saha, S.; Tost, H.; Kong, X.; Xu, C. Literature Review Reveals a Global Access Inequity to Urban Green Spaces. Sustainability 2022, 14, 1062. [Google Scholar] [CrossRef]
  62. Owojori, O.M.; Okoro, C. The Private Sector Role as a Key Supporting Stakeholder towards Circular Economy in the Built Environment: A Scientometric and Content Analysis. Buildings 2022, 12, 695. [Google Scholar] [CrossRef]
  63. Wolch, J.R.; Byrne, J.; Newell, J.P. Urban green space, public health, and environmental justice: The challenge of making cities ‘just green enough’. Landsc. Urban Plan. 2014, 125, 234–244. [Google Scholar] [CrossRef] [Green Version]
  64. Paulo, S. City Will Have a Budget of BRL 95.8 Billion and Investments of BRL 11.5 Billion in 2023/Cidade Terá Orçamento de R$ 95,8 Bilhões e Investimentos de R$ 11,5 BILHÕES em 2023. Available online: https://www.capital.sp.gov.br/noticia/cidade-tera-orcamento-de-r-95-8-bilhoes-e-investimentos-de-r-11-5-bilhoes-em-2023 (accessed on 18 March 2023).
  65. Alcock, I.; White, M.P.; Wheeler, B.W.; Fleming, L.E.; Depledge, M.H. Longitudinal effects on mental health of moving to greener and less green urban areas. Environ. Sci. Technol. 2014, 48, 1247–1255. [Google Scholar] [CrossRef] [Green Version]
  66. Seltenrich, N. Just what the doctor ordered: Using parks to improve children’s health. Environ. Health Perspect. 2015, 123, 254–299. [Google Scholar] [CrossRef] [Green Version]
  67. Ekkel, E.D.; de Vries, S. Nearby green space and human health: Evaluating accessibility metrics. Landsc. Urban Plan. 2017, 157, 214–220. [Google Scholar] [CrossRef]
  68. Sun, S.; Cao, W.; Mason, T.G.; Ran, J.; Qiu, H.; Li, J.; Tian, L. Increased susceptibility to heat for respiratory hospitalizations in Hong Kong. Sci. Total Environ. 2019, 666, 197–204. [Google Scholar] [CrossRef]
  69. Burkart, K.; Khan MM, H.; Schneider, A.; Breitner, S.; Langner, M.; Kraemer, A.; Endlicher, W. The effects of season and meteorology on human mortality in tropical climates: A systematic review. Trans. R. Soc. Trop. Med. Hyg. 2014, 108, 393–401. [Google Scholar] [CrossRef] [Green Version]
  70. Vandermeulen, V.; Verspecht, A.; Vermeire, B.; Van Huylenbroeck, G.; Gellynck, X. The use of economic valuation to create public support for green infrastructure investments in urban areas. Landsc. Urban Plan. 2011, 103, 198–206. [Google Scholar] [CrossRef]
  71. Byrne, J.A.; Lo, A.Y.; Jianjun, Y. Residents’ understanding of the role of green infrastructure for climate change adaptation in Hangzhou, China. Landsc. Urban Plan. 2015, 138, 132–143. [Google Scholar] [CrossRef] [Green Version]
  72. Chin, J.T. The shifting role of public–private partnerships in vacant property redevelopment. Land Use Policy 2021, 105, 105430. [Google Scholar] [CrossRef]
  73. Fell, T.; Mattsson, J. The role of public-private partnerships in housing as a potential contributor to sustainable cities and communities: A systematic review. Sustainability 2021, 13, 7783. [Google Scholar] [CrossRef]
  74. Adjetey, L.D.; Takyi, S.A.; Asibey, M.O.; Amponsah, O. The fate of urban green spaces: Assessment of the ownership, availability and conditions of parks in Accra, Ghana. Urban For. Urban Green. 2023, 82, 127897. [Google Scholar] [CrossRef]
  75. Hodge, G.A.; Greve, C. On public–private partnership performance: A contemporary review. Public Work. Manag. Policy 2017, 22, 55–78. [Google Scholar] [CrossRef]
Figure 1. Distribution of subprefectures in the territory of the municipality of Sao Paulo. AD—Cidade Ademar; AF—Aricanduva-Formosa-Carrão; BT—Butantã; CL—Campo Limpo; CS—Capela Do Socorro; CT—Cidade Tiradentes; CV—Casa Verde-Cachoeirinha; EM—Ermelino Matarazzo; FO—Freguesia-Brasilândia; GU—Guaianases; IP—Ipiranga; IQ—Itaquera; IT—Itaim Paulista; JA—Jabaquara; JT—Jaçanã-Tremembé; LA—Lapa; MB—M Boi Mirim; MO—Mooca; PA—Parelheiros; PE—Penha; PI—Pinheiros; PJ—Pirituba-Jaraguá; PR—Perus; SA—Santo Amaro; SB—Sapopemba; SE—Sé; SM—São Mateus; SMi—São Miguel; ST—Santana-Tucuruvi; VM—Vila Mariana; VMa—Vila Maria-Vila Guilherme; VP—Vila Prudente.
Sustainability 15 10092 g001
Figure 2. Number of protected areas over time and the evolution of the urban area of the city of Sao Paulo over the 20th and 21st centuries.
Sustainability 15 10092 g002
Figure 3. Principal component analysis based on demographic increment data between 1950 and 2010 (DI), income per capita lower than one minimum wage (In < 1MW), occurrences of floods (OF; absolute number in 2020), human development index (HDI) and municipal parks in ha (MP) in the subprefectures of Sao Paulo. Cidade Ademar (CA), Guaianases (GA), Itaim Paulista (IPa), São Mateus (SM), Cidade Tiradentes (CT), Perus (PRu), M’Boi Mirim (MB), Parelheiros (PA), São Miguel (SMi), Campo Limpo (CL), Capela do Socorro (CS), Itaquera (IT), Freguesia (FR), Pitituba (PIr), Jaçana (JAc), Ermelino Matarazzo (EM), Vila Prudente (VP), Penha (PE), Butanta (BU), Jabaquara (JAB), Casa Verde (CV), Vila Maria (VMa), Ipiranga (IP), Aricanduva (AR), Vila Mariana (VM), Santo Amaro (AS), Pinheiros (PI), Mooca (MO), Santana (SAn), Lapa (LA), Sé (Sé).
Sustainability 15 10092 g003
Figure 4. Association between protected areas and total coverage of green areas in each subprefecture. In red: subprefectures with more than 20% of the population earning up to one minimum wage per month. In black: subprefectures with 20% of the population receiving up to one minimum wage monthly. The green line represents the green coverage area of municipal parks.
Sustainability 15 10092 g004
Figure 5. Relationship between forest cover and thermal comfort in the subprefectures of Sao Paulo. In (a) surface heat island (SHI, °C) derived from land surface temperature (LST, °C) images in the city of Sao Paulo; In (b) relationship between the percentage of area without vegetation and the surface heat island (SHI, °C) for the city of Sao Paulo.
Sustainability 15 10092 g005
Figure 6. Change in land use in the metropolitan region of Sao Paulo. In (a) map of the original vegetation cover of the MRSP (modified from ATLAS SIMBIOTA, 2009); in (b) urban evolution of the MRSP (modified from Emplasa 1920 and 1950). Data sources: Geographic and Cartographic Institute of Sao Paulo: (http://www.igc.sp.gov.br/, accessed on 1 April 2023); MapBiomas 2020: (https://mapbiomas.org/, accessed on 1 April 2023).
Sustainability 15 10092 g006
Figure 7. Ratio between the number of parks created (green bars), budgeted and settled annual values (blue and red lines) in the SGE between the years 2003 and 2022. In yellow background, the periods in which the SGE had only one secretary.
Sustainability 15 10092 g007
Table 1. Socioenvironmental data of the subprefectures of Sao Paulo: occurrences of flooding (OF) attended (absolute nº in 2020), income per capita lower than one minimum wage (In < 1MW), demographic increase between 1950 and 2010 (DI), human development index (HDI) and municipal Parks in ha (MP) in the subprefectures of Sao Paulo.
SubprefectureOF In < 1MWDI (1950–2010)HDIMP (ha)
Aricanduva/Formosa 1113.30155.270.8237.09
Butanta 2814.00403.850.8668.70
Campo Limpo 31428.60594.400.7843.90
Capela do Socorro 3925.60588.350.75695.40
Casa Verde/Cachoeirinha 4918.90210.710.800.00
Cidade Ademar 3831.50390.580.7611.40
Cidade Tiradentes 1038.20210.900.7192.90
Ermelino Matarazzo 11122.20188.470.785.50
Freguesia/Brasilandia 4425.20370.430.764.90
Guaianases 1940.90261.800.713.52
Ipiranga 3814.00273.190.8218.20
Itaim Paulista 11038.70360.410.7343.00
Itaquera 1325.70508.600.76618.40
Jabaquara 3815.80196.930.824.60
Jacana/Tremembe 41123.30256.750.772.40
Lapa 2309.30143.500.9124.10
M’Boi Mirim 3934.10552.400.7242.30
Mooca 1108.8081.090.8713.90
Parelheiros 3251.50137.680.68819.30
Penha 1816.30369.640.8019.10
Perus 4133.30141.250.73925.60
Pinheiros 232.50120.740.9415.40
Pirituba 41321.30406.090.7969.30
Santana/Tucuruvi 4107.40245.530.872.10
Santo Amaro 345.90218.990.9115.04
Sao Mateus 1234.90397.210.7385.40
Sao Miguel 15534.90357.430.740.00
Se 5186.6080.160.0023.40
Vila Maria/Vila Guilherme 41515.50218.100.8914.90
Vila Mariana 333.00227.200.79125.50
Vila Prudente/Sapopemba 1619.60434.530.8732.72
Superscript number—Regions: 1—East, 2—West, 3—South, 4—North, 5—Center [26].
Table 2. Absolute and relative values of PA typologies in Sao Paulo.
TipologyAbsolute Number (n)Relative Number (%)
Urban Park7462.8
Water Park2218.7
Conservation Park54.2
Municipal Natural Park54.2
Socio-environmental basis Park10.8
Waterfront Park108.5
Wildlife reserve10.8
Disclaimer/Publisher’s Note: The statements, opinions and data contained in all publications are solely those of the individual author(s) and contributor(s) and not of MDPI and/or the editor(s). MDPI and/or the editor(s) disclaim responsibility for any injury to people or property resulting from any ideas, methods, instructions or products referred to in the content.

