
Spatial-Temporal Evolution and Driving Mechanism of Urban Land Use Efficiency Based on T-DEA Model: A Case Study of Anhui Province, China
Abstract
1. Introduction
2. Data
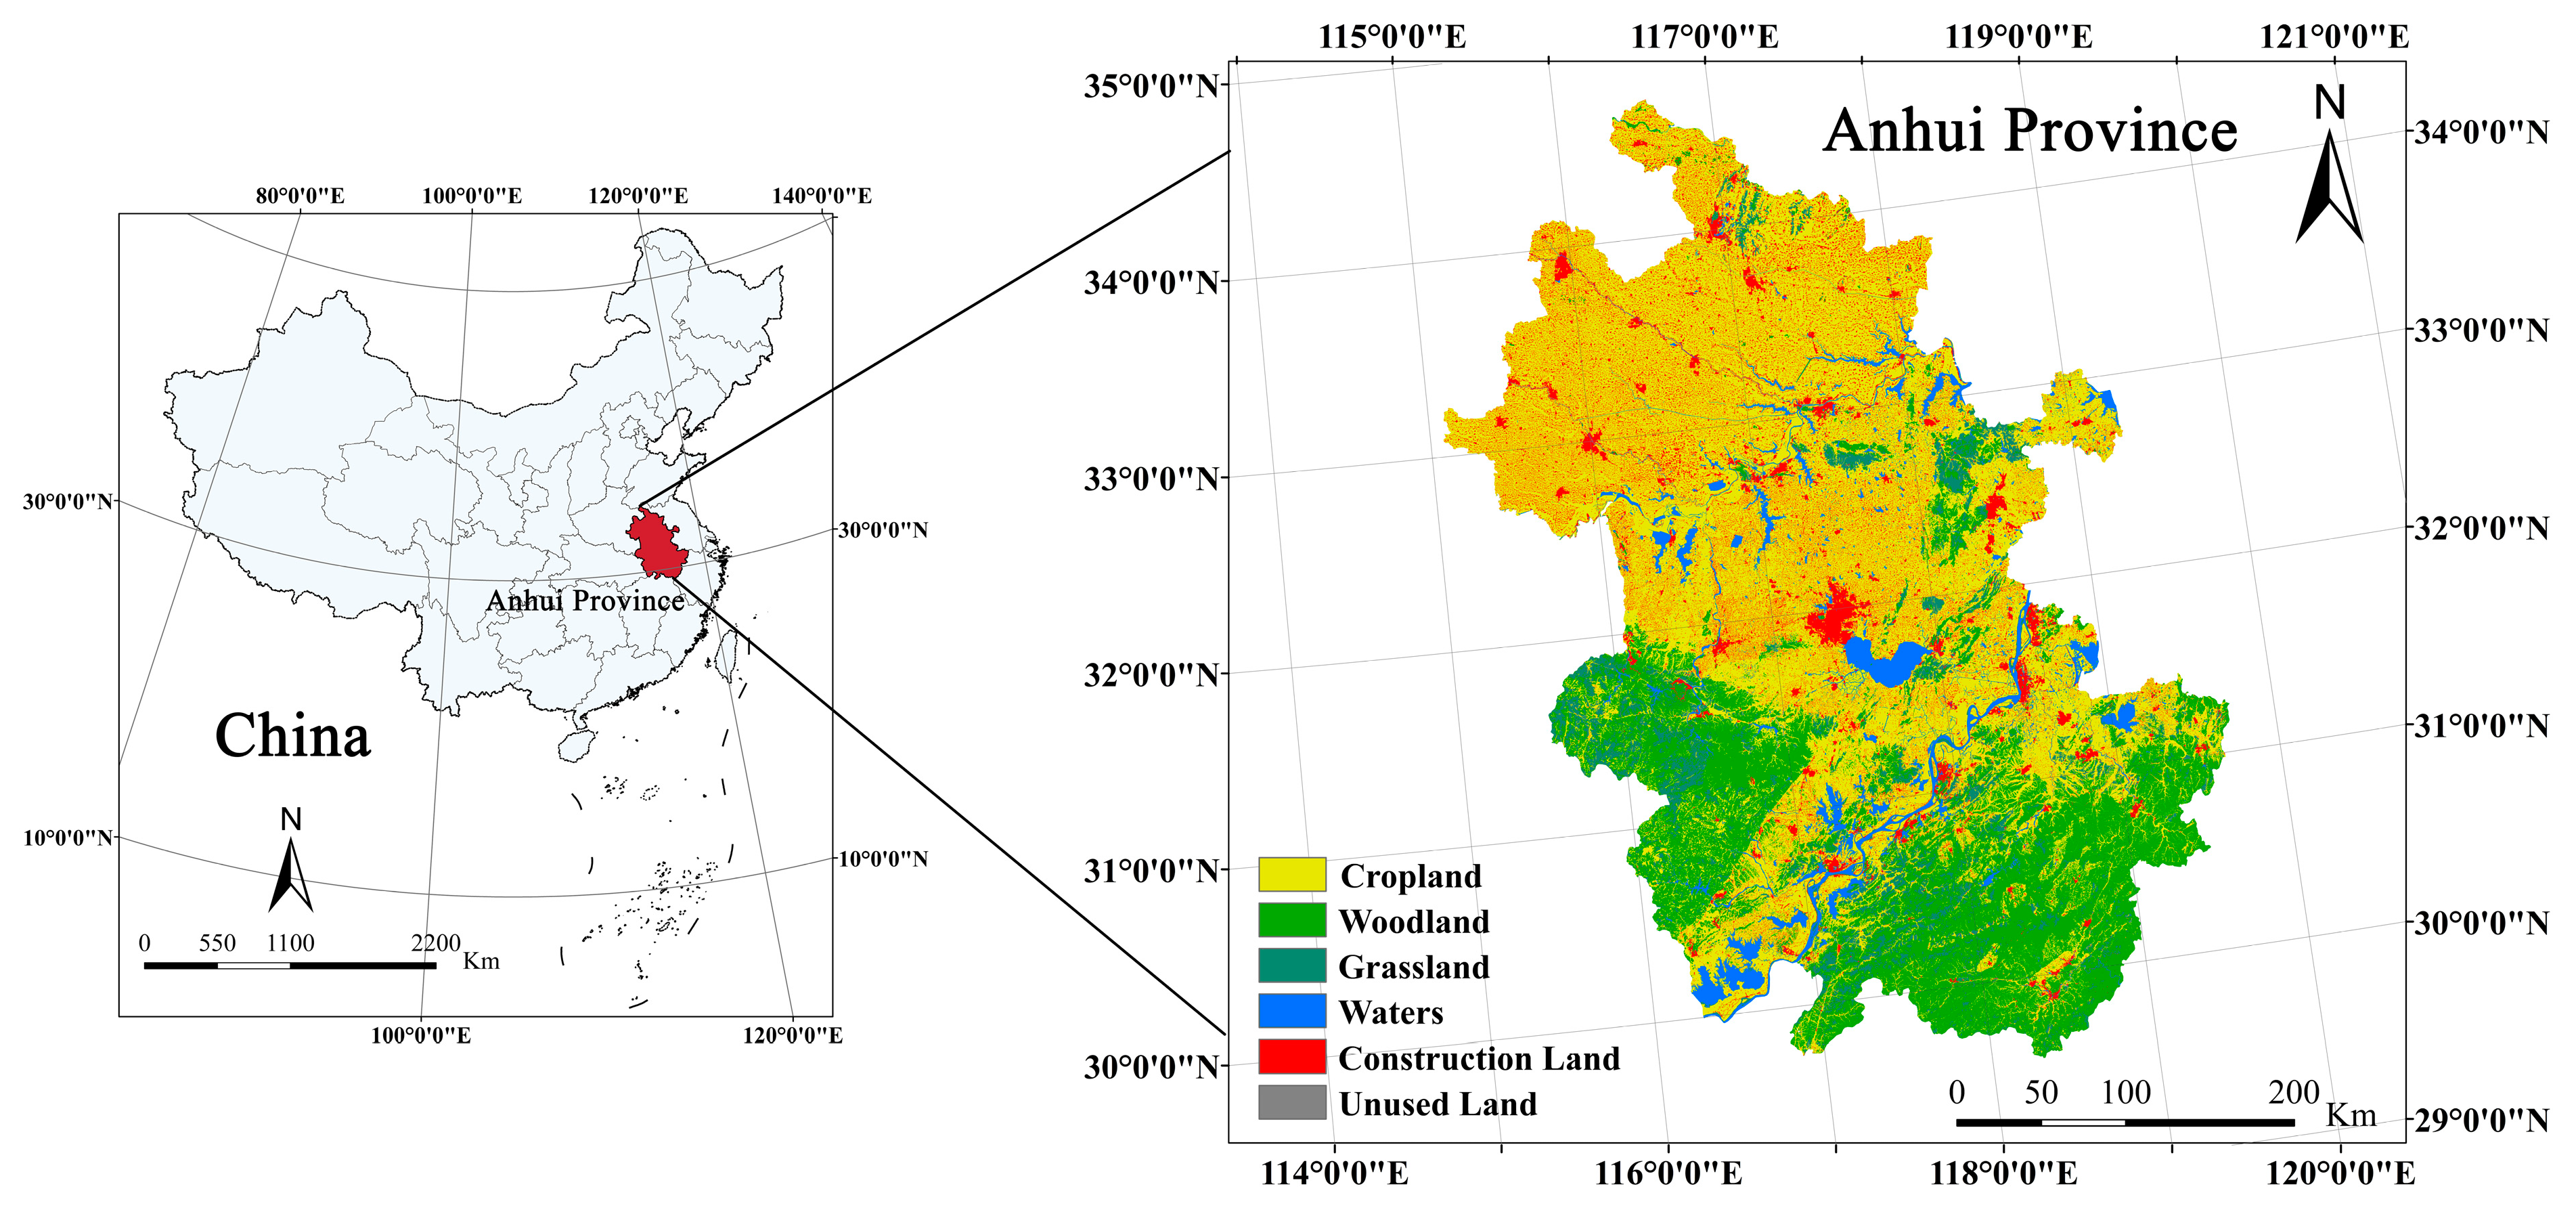
2.1. Area of Study
2.2. Data Sources
3. Materials and Methods
3.1. ULUE Calculation
3.1.1. Three-Stage Dea Model
3.1.2. Index Selection
3.1.3. Selection of Environmental Indicators
3.2. Kernel Density Estimation
3.3. Gravity Center Model
3.4. Geographical Detector
3.4.1. Geographical Detector Model
3.4.2. Selection of Driving Factors of Land Use Efficiency
4. Results
4.1. Results of ULUE
4.1.1. First Stage of DEA Results
4.1.2. Second-Stage SFA Regression Results
4.1.3. The Third Stage DEA Results
4.2. The Temporal Evolution of ULUE
4.2.1. ULUE Timing Evolution
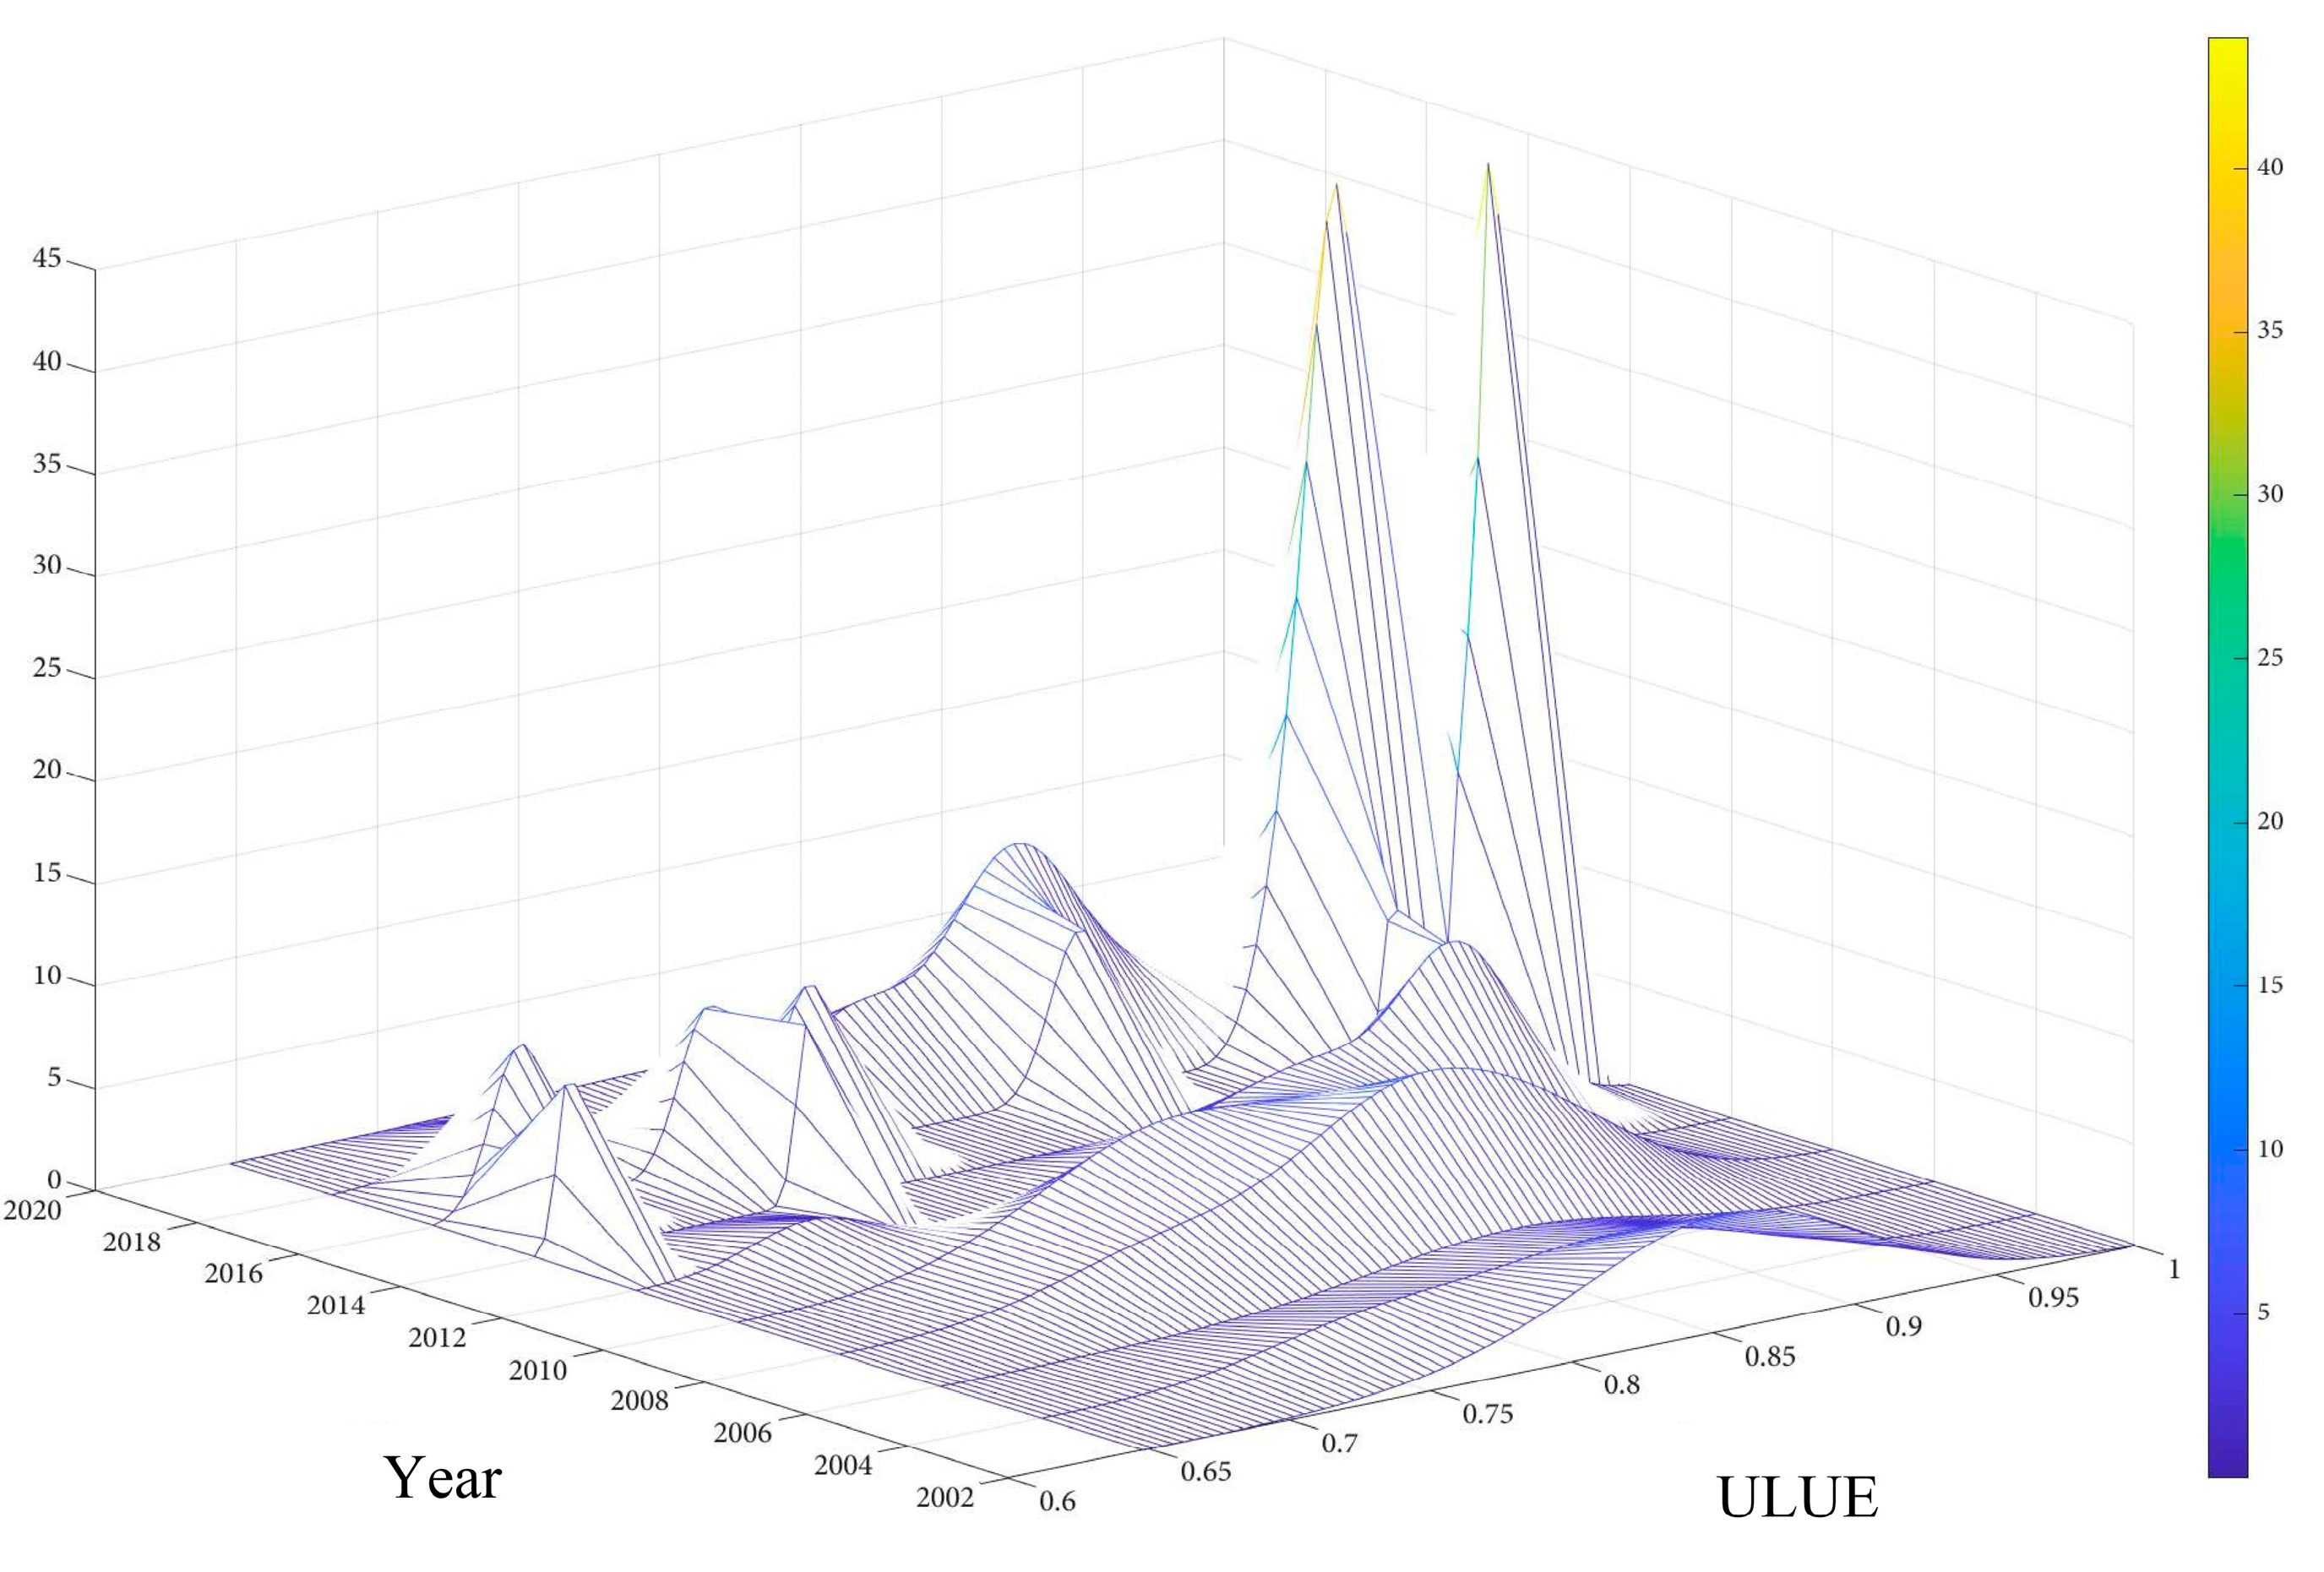
4.2.2. ULUE Kernel Density Estimation
4.3. Spatial Evolution of ULUE
4.4. Driving Factors of ULUE
4.4.1. Detection of Single Driving Factor
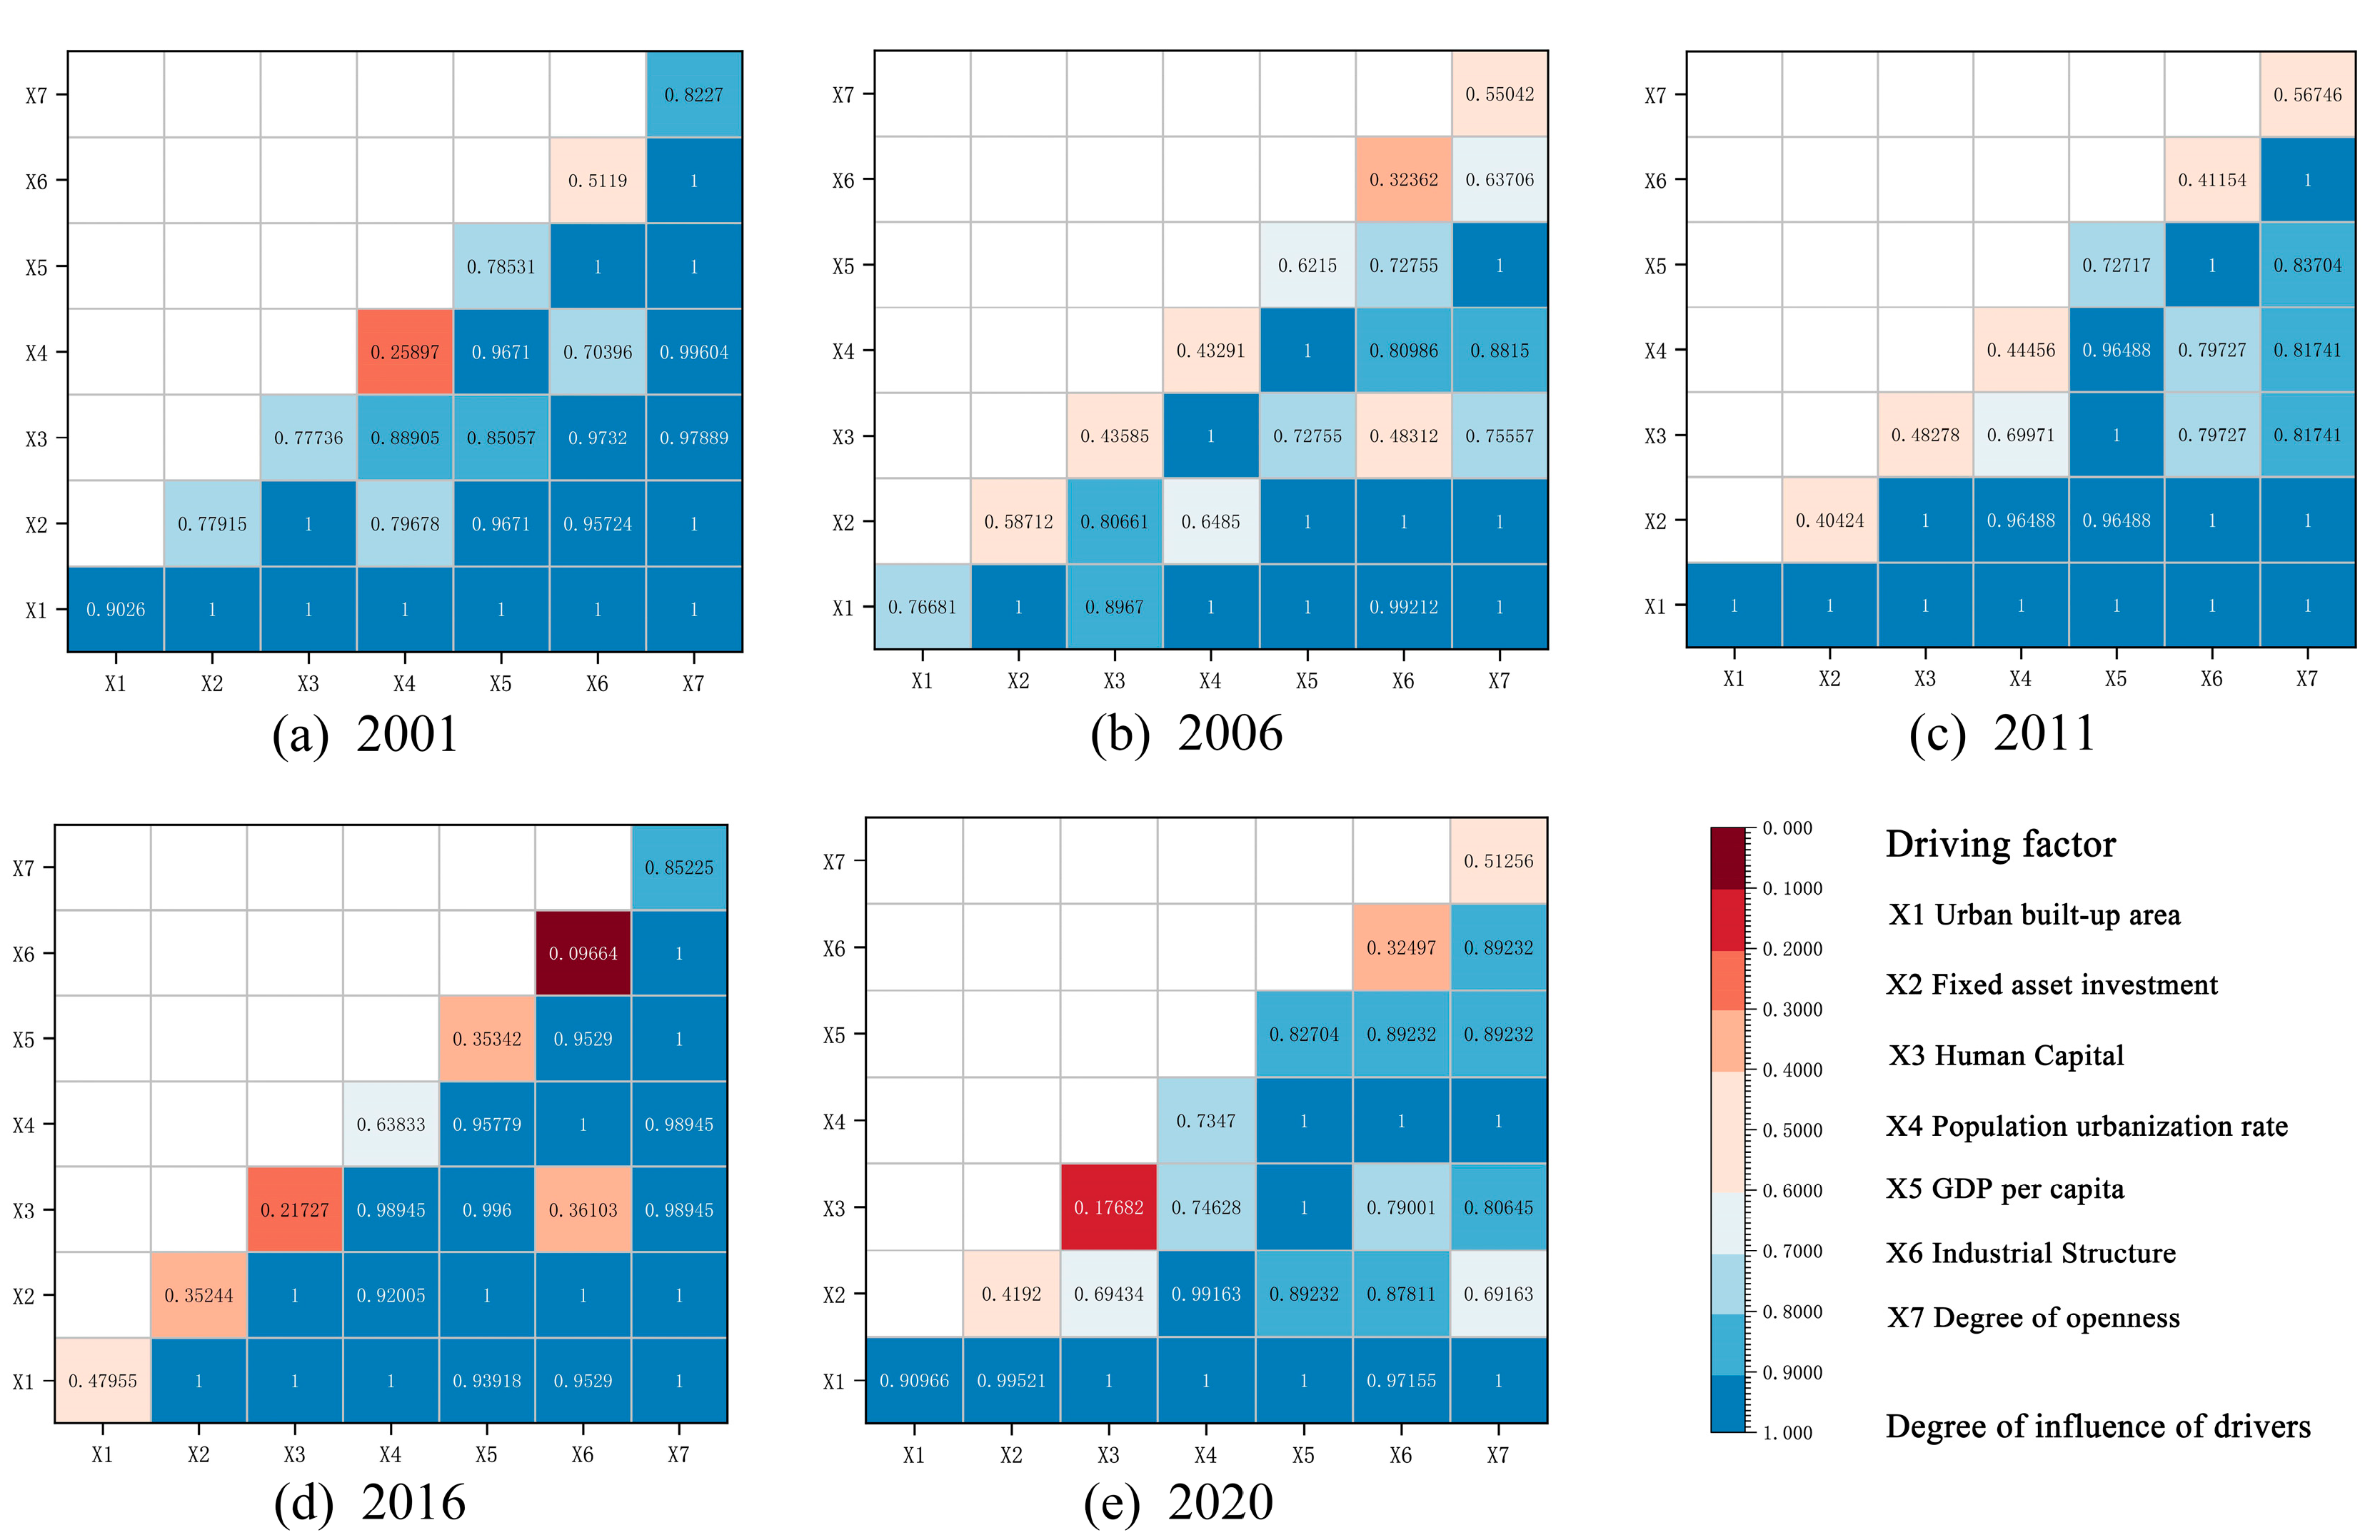
4.4.2. Double Drive Due to Interaction Detection
5. Discussion
6. Conclusions
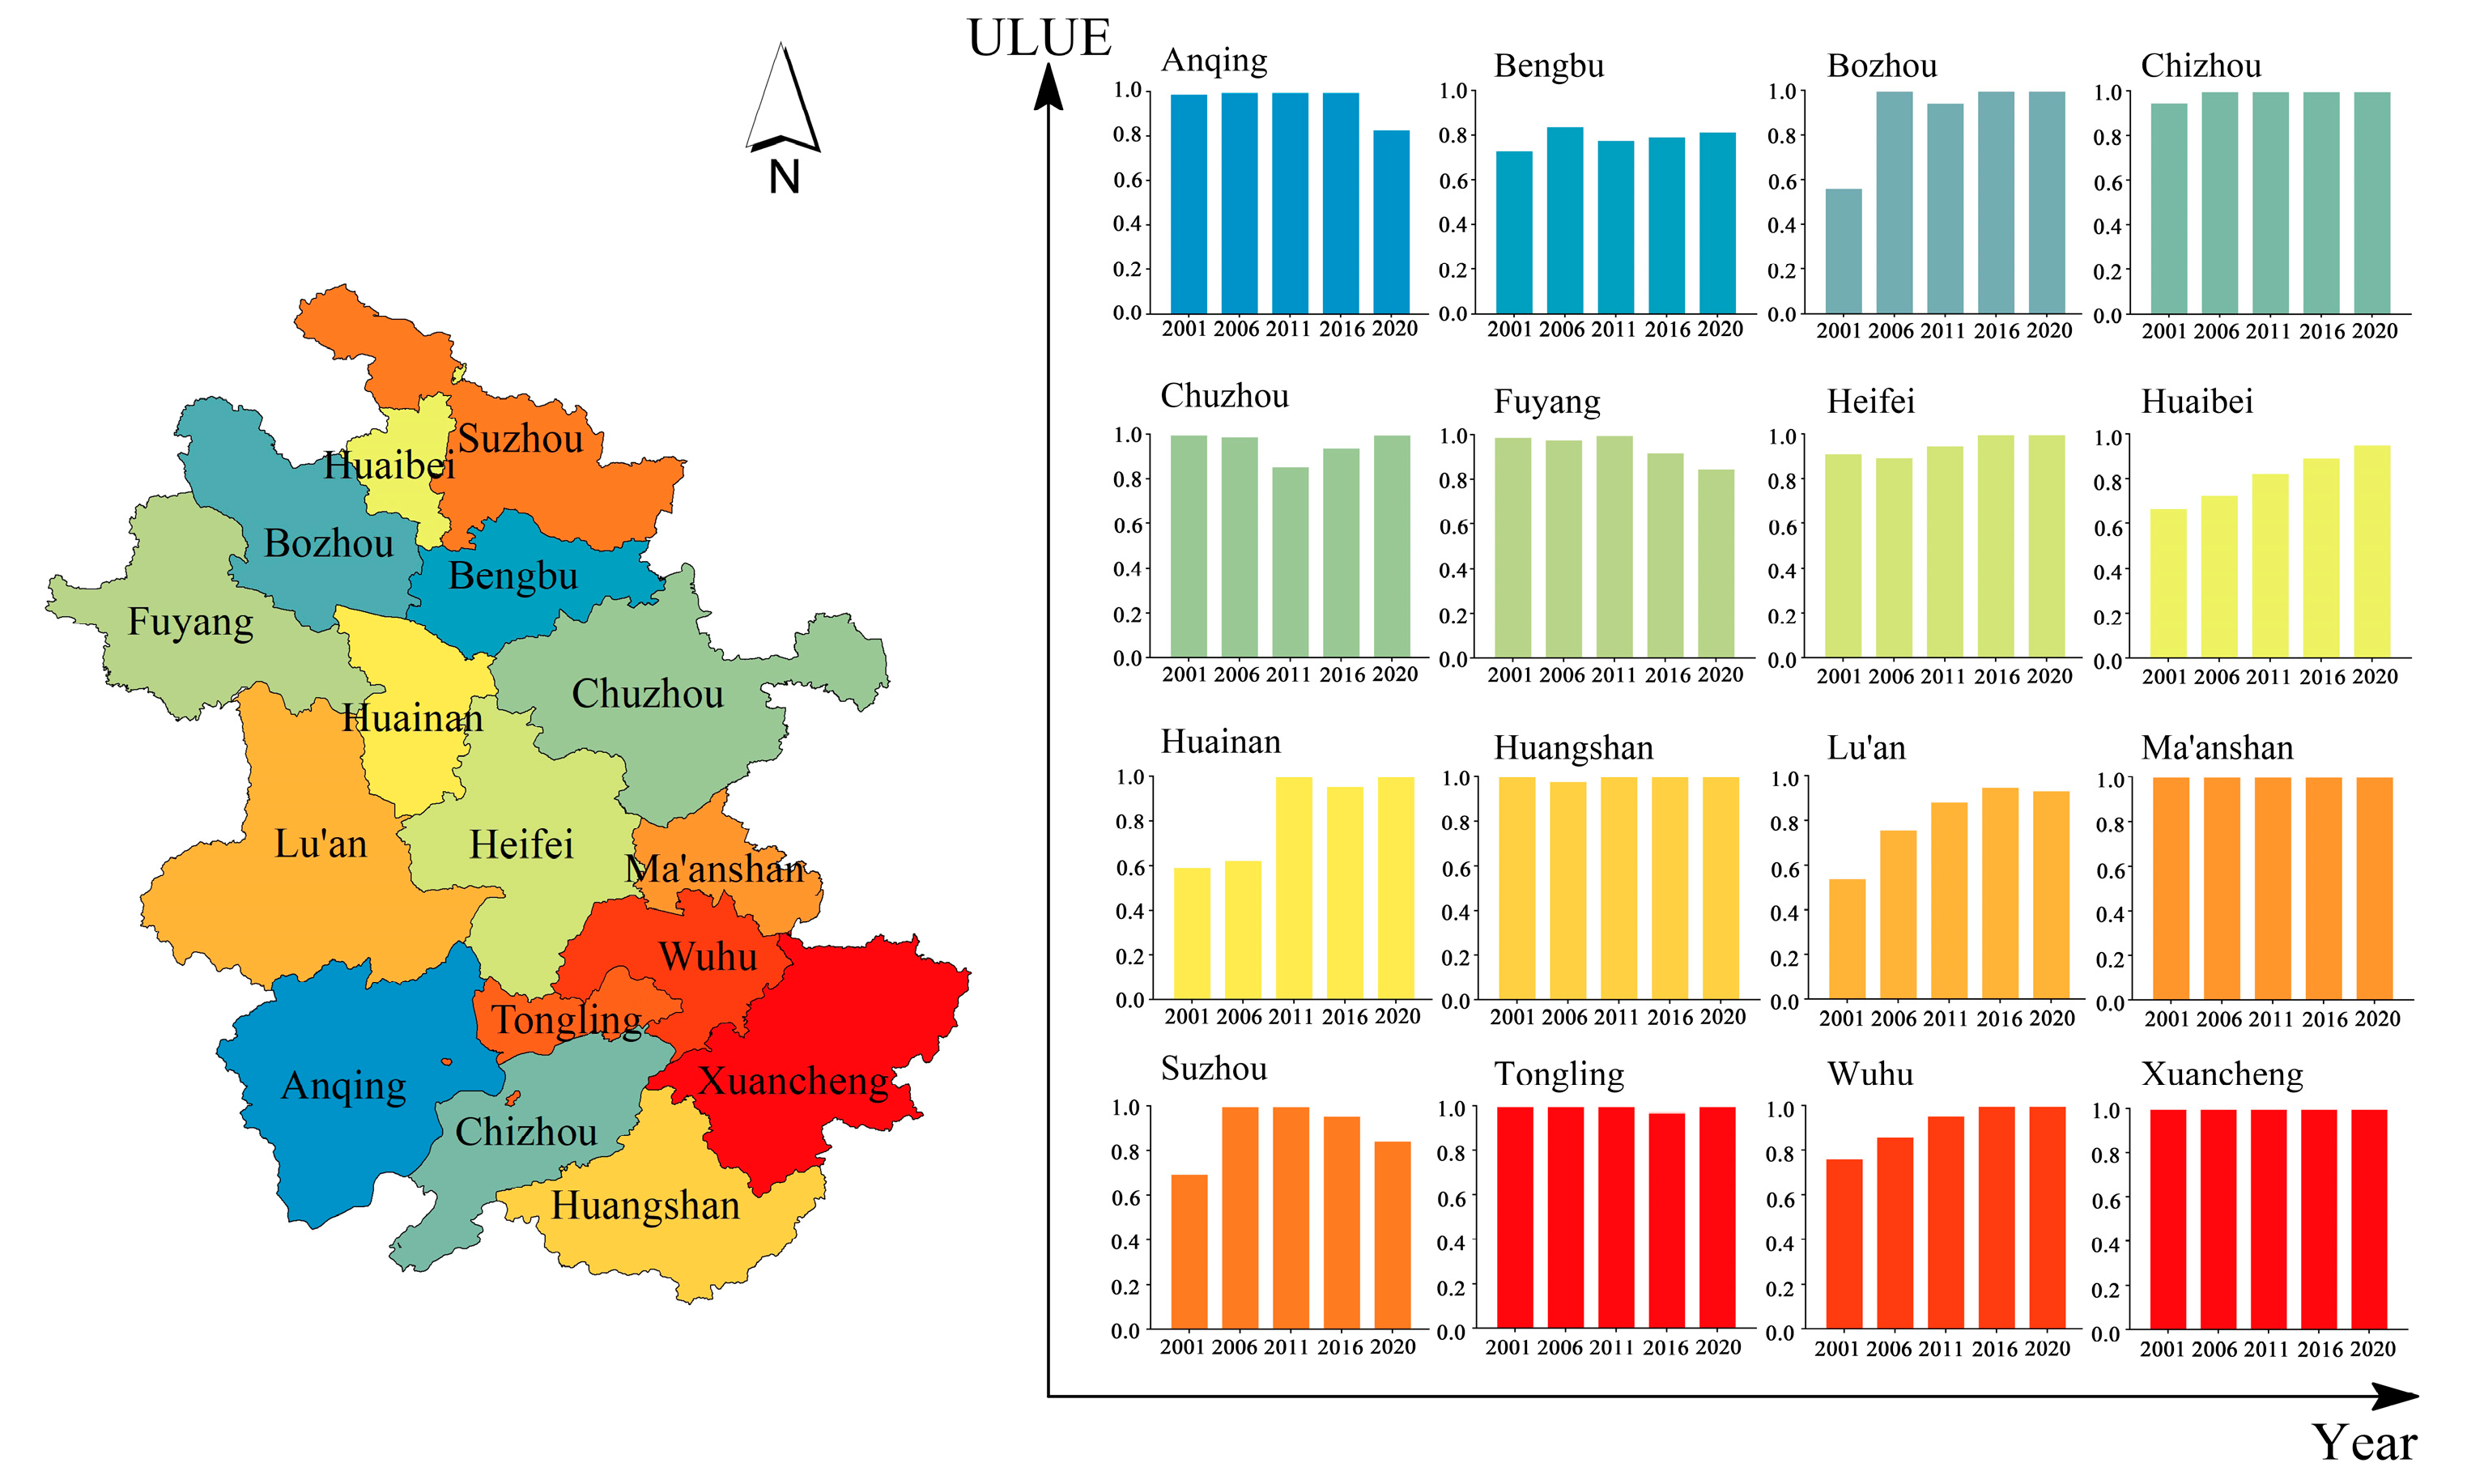
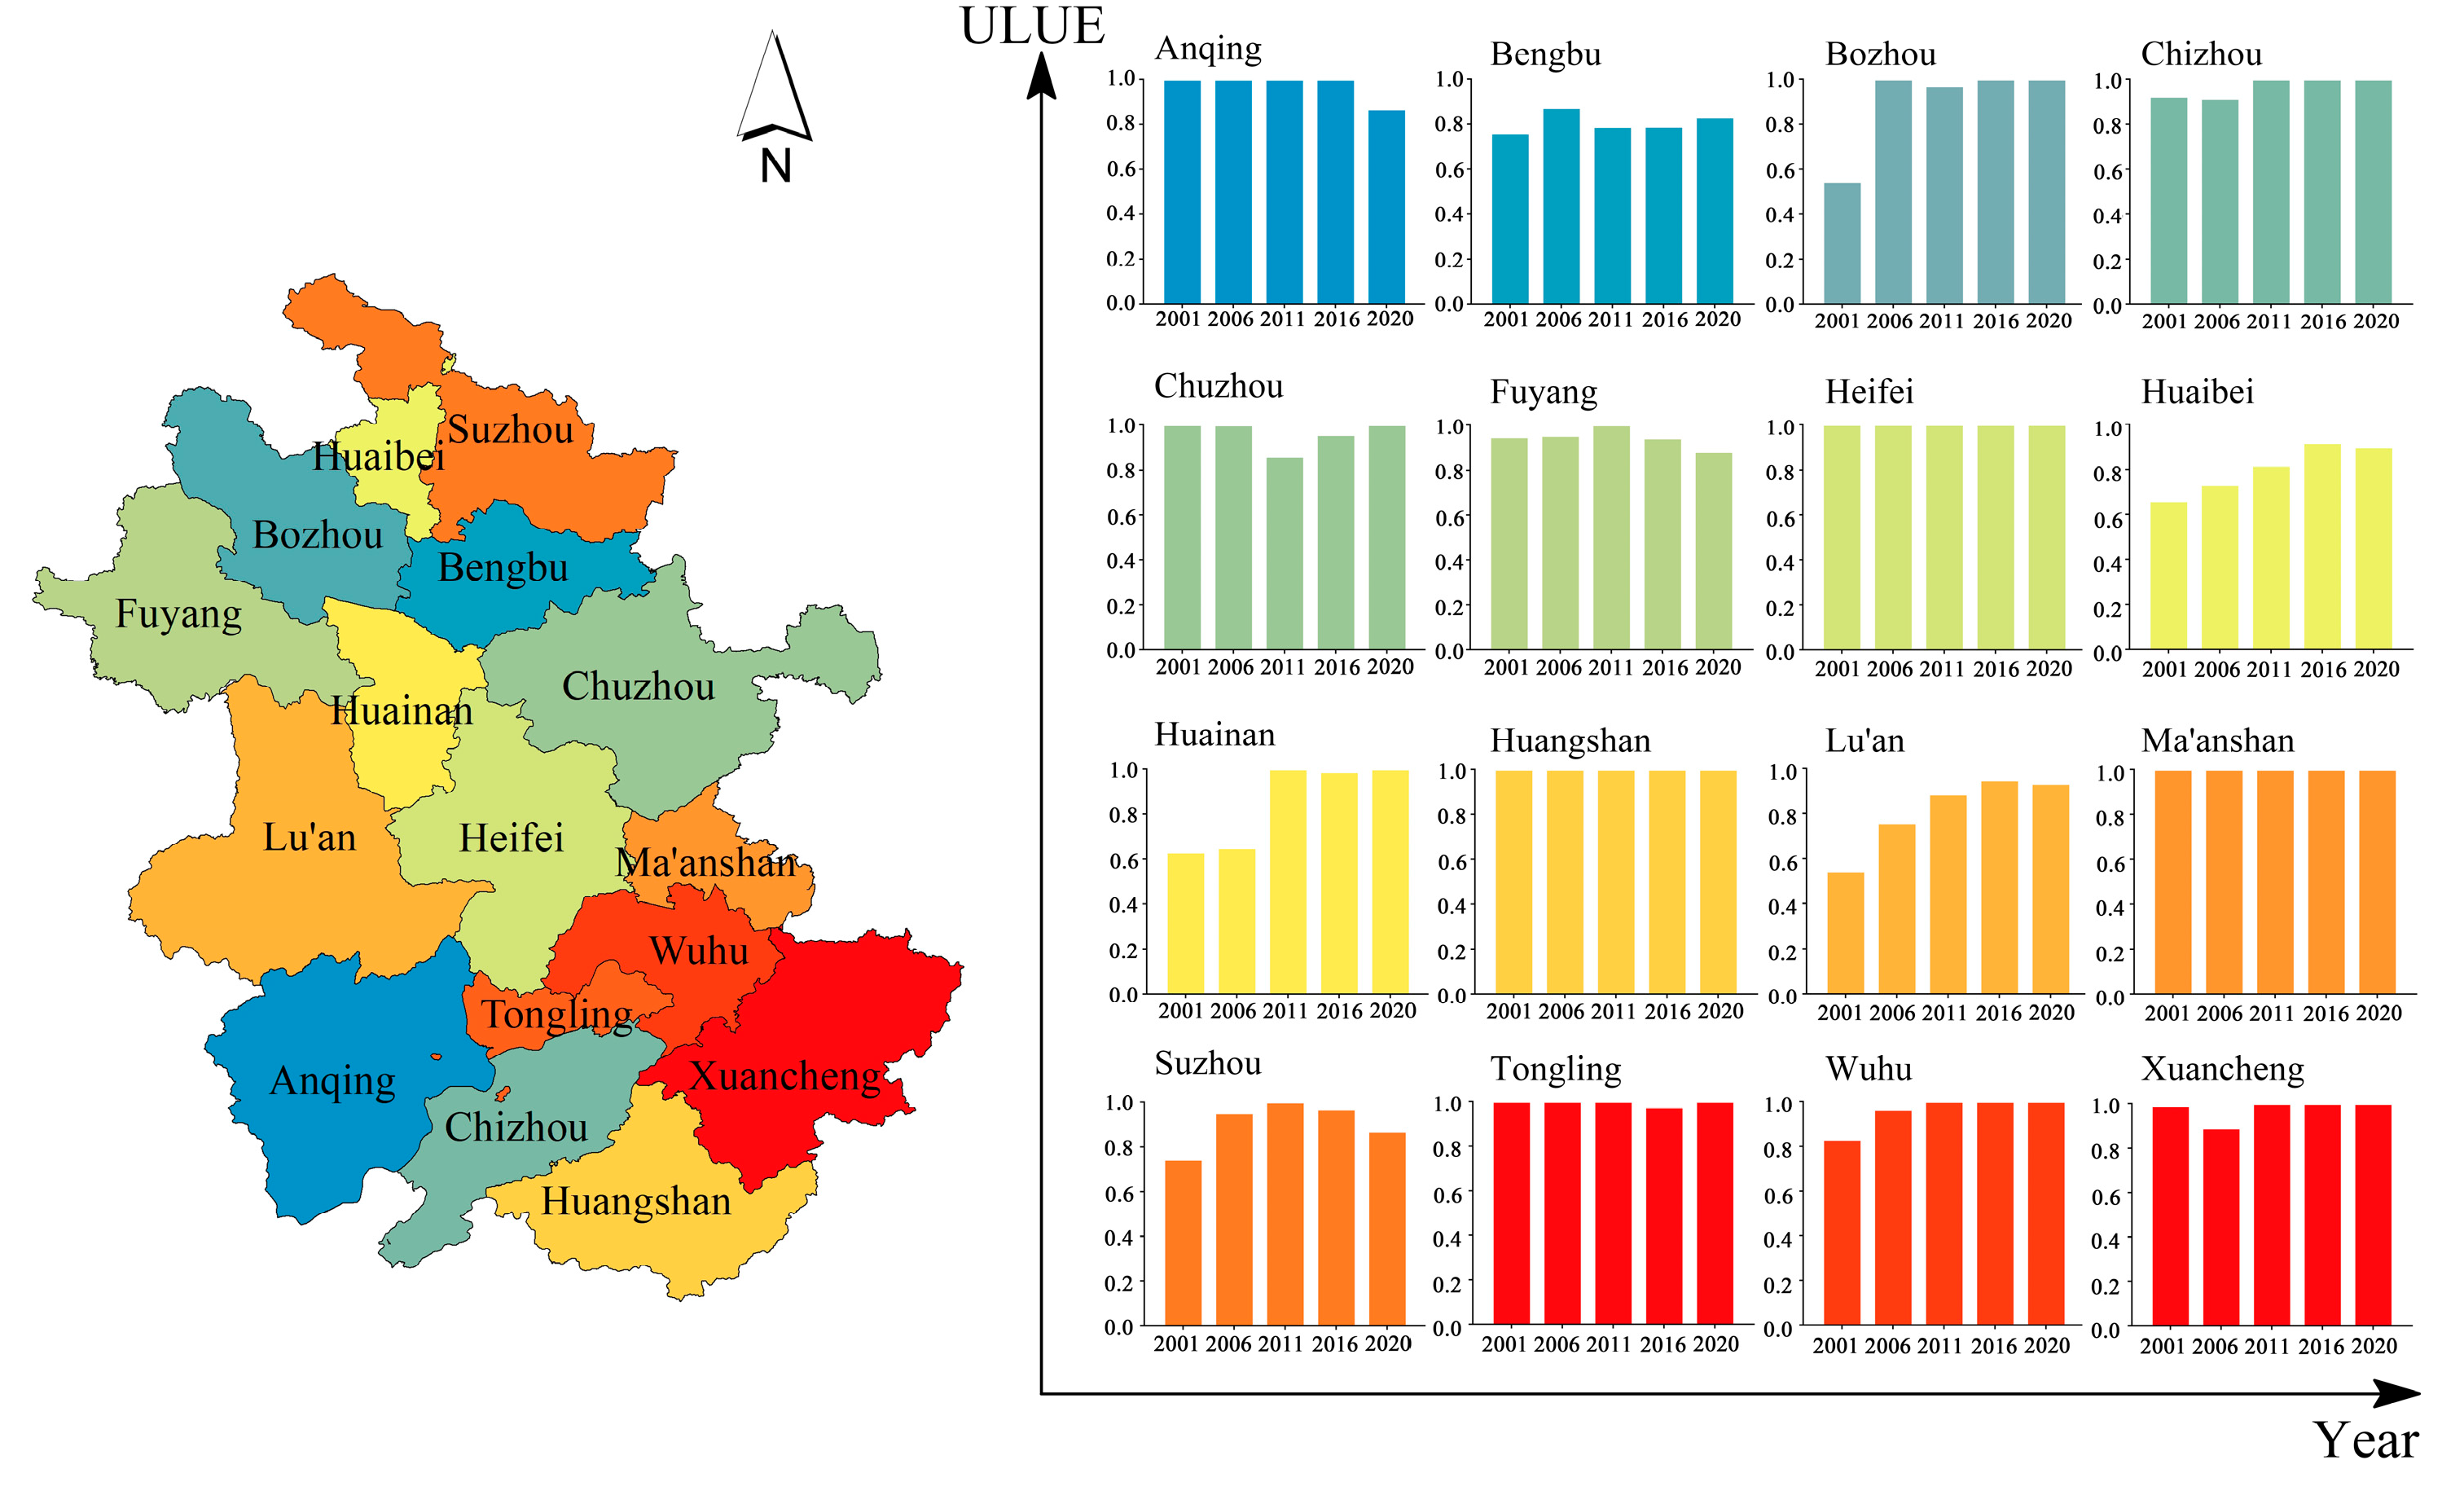
- From the results of urban land use efficiency, the overall level of ULUE in Anhui Province is high, but the gap between the different cities remains large. Compared to the results of the third stage, the ULUE values of most cities in the first stage changed significantly. To ensure the accuracy of the results, it is necessary to ensure that each city has the same external environment and luck conditions.
- From the perspective of a time-series evolution, ULUE generally shows a nonlinear growth trend over time, which is consistent with the economic and social development of Anhui Province. However, at the same time of growth, there is also a trend of a ‘ULUE gap’ and multilevel differentiation.
- From the perspective of spatial and temporal evolution, the center of gravity of the ULUE space moves slowly, and the moving distance remains small. The migration rate and distance of the efficiency center of gravity in the north–south direction are far greater than those in the east–west direction, which is related to the current situation and economic development of Anhui Province.
- From the perspective of the driving factors, the combined influence of any two driving factors is greater than that of a single factor. However, from the analysis of single and double factors, the urban built-up area and the degree of opening to the outside world are the key controlling factors affecting the ULUE value; however, these two main controlling factors have obvious duality and complexity.
Author Contributions
Funding
Institutional Review Board Statement
Informed Consent Statement
Data Availability Statement
Conflicts of Interest
References
- Collas, L.; Green, R.E.; Ross, A.; Wastell, J.H.; Balmford, A. Urban development, land sharing and land sparing: The importance of considering restoration. J. Appl. Ecol. 2017, 54, 1865–1873. [Google Scholar] [CrossRef]
- Chen, W.X.; Cheshmehzangi, A.; Mangi, E.; Heath, T. Implementations of China’s New-Type Urbanisation: A Comparative Analysis between Targets and Practices of Key Elements’ Policies. Sustainability 2022, 14, 6341. [Google Scholar] [CrossRef]
- Cheng, M.; Wu, S.; Zeng, C.; Yu, X.; Wang, J. Can economic growth and urban greenness achieve positive synergies during rapid urbanization in China? Ecol. Indic. 2023, 150, 110250. [Google Scholar] [CrossRef]
- Wang, Z.; Liang, L.; Sun, Z.; Wang, X. Spatiotemporal differentiation and the factors influencing urbanization and ecological environment synergistic effects within the Beijing-Tianjin-Hebei urban agglomeration. J. Environ. Manag. 2019, 243, 227–239. [Google Scholar] [CrossRef] [PubMed]
- Liu, Y.; Li, J.; Yang, Y. Strategic adjustment of land use policy under the economic transformation. Land Use Policy 2018, 74, 5–14. [Google Scholar] [CrossRef]
- Xiao, Y.; Zhong, J.; Zhang, Q.; Xiang, X.; Huang, H. Exploring the coupling coordination and key factors between urbanization and land use efficiency in ecologically sensitive areas: A case study of the Loess Plateau, China. Sustain. Cities Soc. 2022, 86, 104148. [Google Scholar] [CrossRef]
- Yang, B.; Zhang, Z.; Wu, H. Detection and attribution of changes in agricultural eco-efficiency within rapid urbanized areas: A case study in the Urban agglomeration in the middle Reaches of Yangtze River, China. Ecol. Indic. 2022, 144, 109533. [Google Scholar] [CrossRef]
- Koroso, N.H.; Lengoiboni, M.; Zevenbergen, J.A. Urbanization and urban land use efficiency: Evidence from regional and Addis Ababa satellite cities, Ethiopia. Habitat Int. 2021, 117, 102437. [Google Scholar] [CrossRef]
- Schiavina, M.; Melchiorri, M.; Freire, S.; Florio, P.; Ehrlich, D.; Tommasi, P.; Pesaresi, M.; Kemper, T. Land use efficiency of functional urban areas: Global pattern and evolution of development trajectories. Habitat Int. 2022, 123, 102543. [Google Scholar] [CrossRef]
- Chakraborty, S.; Maity, I.; Dadashpoor, H.; Novotnẏ, J.; Banerji, S. Building in or out? Examining urban expansion patterns and land use efficiency across the global sample of 466 cities with million+ inhabitants. Habitat Int. 2022, 120, 102503. [Google Scholar] [CrossRef]
- Marquard, E.; Bartke, S.; Font, J.G.I.; Humer, A.; Jonkman, A.; Jürgenson, E.; Marot, N.; Poelmans, L.; Repe, B.; Rybski, R. Land Consumption and Land Take: Enhancing Conceptual Clarity for Evaluating Spatial Governance in the EU Context. Sustainability 2020, 12, 8269. [Google Scholar] [CrossRef]
- Hall, C.A.S.; Vargas, J.-R.; Saenz, O.; Ravenscroft, W.; Ko, J.-Y. Chapter 4—Data on Sustainability in Costa Rica: Time series analysis of population, land use, economics, energy, and efficiency. In Quantifying Sustainable Development; Hall, C.A.S., Perez, C.L., Leclerc, G., Eds.; Academic Press: San Diego, CA, USA, 2000; pp. 91–120. [Google Scholar]
- Lewis, G.M.; Brabec, E. Regional land pattern assessment: Development of a resource efficiency measurement method. Landsc. Urban Plan. 2005, 72, 281–296. [Google Scholar] [CrossRef]
- Song, Y.; Yeung, G.; Zhu, D.; Xu, Y.; Zhang, L. Efficiency of urban land use in China’s resource-based cities, 2000–2018. Land Use Policy 2022, 115, 106009. [Google Scholar] [CrossRef]
- Zhu, X.; Li, Y.; Zhang, P.; Wei, Y.; Zheng, X.; Xie, L. Temporal–spatial characteristics of urban land use efficiency of China’s 35mega cities based on DEA: Decomposing technology and scale efficiency. Land Use Policy 2019, 88, 104083. [Google Scholar] [CrossRef]
- Weiss, D.J.; Nelson, A.; Gibson, H.S.; Temperley, W.; Peedell, S.; Lieber, A. A global map of travel time to cities to assess inequalities in accessibility in 2015. Nature 2018, 553, 333–336. [Google Scholar] [CrossRef]
- Mudau, N.; Mwaniki, D.; Tsoeleng, L.; Mashalane, M.; Beguy, D.; Ndugwa, R. Assessment of SDG Indicator 11.3.1 and Urban Growth Trends of Major and Small Cities in South Africa. Sustainability 2020, 12, 7063. [Google Scholar] [CrossRef]
- Xu, H.; Song, Y.; Tian, Y. Simulation of land-use pattern evolution in hilly mountainous areas of north China: A case study in Jincheng. Land Use Policy 2022, 112, 105826. [Google Scholar] [CrossRef]
- Liu, Y.; Zou, L.; Wang, Y. Spatial-temporal characteristics and influencing factors of agricultural eco-efficiency in China in recent 40 years. Land Use Policy 2020, 97, 104794. [Google Scholar] [CrossRef]
- Tang, Y.; Wang, K.; Ji, X.; Xu, H.; Xiao, Y. Assessment and spatial-temporal evolution analysis of urban land use efficiency under green development orientation: Case of the Yangtze River delta urban agglomerations. Land 2021, 10, 715. [Google Scholar] [CrossRef]
- Wang, Y.; Chen, F.; Wei, F.; Yang, M.; Gu, X.; Sun, Q.; Wang, X. Spatial and temporal characteristics and evolutionary prediction of urban health development efficiency in China: Based on super-efficiency SBM model and spatial Markov chain model. Ecol. Indic. 2023, 147, 109985. [Google Scholar] [CrossRef]
- Liao, X.; Fang, C.; Shu, T.; Ren, Y. Spatiotemporal impacts of urban structure upon urban land-use efficiency: Evidence from 280 cities in China. Habitat Int. 2023, 131, 102727. [Google Scholar] [CrossRef]
- Fried, H.O.; Lovell, C.A.K.; Schmidt, S.S.; Yaisawarng, S. Accounting for environmental effects and statistical noise in data envelopment analysis. J. Product. Anal. 2002, 17, 157–174. [Google Scholar] [CrossRef]
- Philip, E. Coupling Sustainable Development Goal 11.3.1 with current planning tools: City of Hamilton, Canada. Hydrol. Sci. J. 2021, 66, 1124–1131. [Google Scholar] [CrossRef]
- Nicolau, R.; David, J.; Caetano, M.; Pereira, J. Ratio of Land Consumption Rate to Population Growth Rate—Analysis of Different Formulations Applied to Mainland Portugal. ISPRS Int. J. Geo-Inf. 2019, 8, 10. [Google Scholar] [CrossRef]
- Jiang, H. Spatial–temporal differences of industrial land use efficiency and its influencing factors for China’s central region: Analyzed by SBM model. Environ. Technol. Innov. 2021, 22, 101489. [Google Scholar] [CrossRef]
- Yao, M.; Zhang, Y. Evaluation and optimization of urban land-use efficiency: A case study in Sichuan Province of China. Sustainability 2021, 13, 1771. [Google Scholar] [CrossRef]
- Zitti, M.; Ferrara, C.; Perini, L.; Carlucci, M.; Salvati, L. Long-Term Urban Growth and Land Use Efficiency in Southern Europe: Implications for Sustainable Land Management. Sustainability 2015, 7, 3359–3385. [Google Scholar] [CrossRef]
- Liu, Y. Introduction to land use and rural sustainability in China. Land Use Policy 2018, 74, 1–4. [Google Scholar] [CrossRef]
- Lu, X.; Chen, D.; Kuang, B.; Zhang, C.; Cheng, C. Is high-tech zone a policy trap or a growth drive? Insights from the perspective of urban land use efficiency. Land Use Policy 2020, 95, 104583. [Google Scholar] [CrossRef]
- Dong, Y.; Jin, G.; Deng, X. Dynamic interactive effects of urban land-use efficiency, industrial transformation, and carbon emissions. J. Clean. Prod. 2020, 270, 122547. [Google Scholar] [CrossRef]
- Liu, F.; Wang, C.; Zhang, Y.; Zhou, S.; Yang, Y.; Wu, X.; Hu, F.; Liu, C. Data-driven analysis and evaluation of regional agriculture for high quality development of Anhui Province in the Yangtze River delta. Environ. Sci. Pollut. Res. 2022, 29, 22490–22503. [Google Scholar] [CrossRef]
- Sun, S.H.; Zhang, N.N.; Liu, J.B. Study on the rural revitalization and urban-rural integration efficiency in Anhui Province based on game cross-efficiency DEA Model. Comput. Intell. Neurosci. 2022, 2022, 7373435. [Google Scholar] [CrossRef] [PubMed]
- Wang, L.J.; Li, H.; Shi, C. Urban land-use efficiency, spatial spillover, and determinants in China. Acta Geogr. Sin. 2015, 70, 1788–1799. [Google Scholar]
- Yao, S.; Wu, G.S. Research on the efficiency of green agricultural science and technology innovation resource allocation based on a Three-Stage DEA Model-a case study of Anhui Province, China. Int. J. Environ. Res. Public Health 2022, 19, 13683. [Google Scholar] [CrossRef] [PubMed]
- Jia, B.; Wya, B.; Xqa, B.; Xq, C.; Li, M. Coupling coordination degree for urban green growth between public demand and government supply in urban agglomeration: A case study from China-sciencedirect. J. Environ. Manag. 2021, 304, 114209. [Google Scholar] [CrossRef]
- Chen, Z.; Li, X.; Xia, X. Temporal-spatial pattern and driving factors of cultivated land use transition at country level in Shaanxi province, China. Environ. Monit. Assess. 2022, 194, 365. [Google Scholar] [CrossRef]
- Cui, X.; Huang, S.; Liu, C.; Zhou, T.; Shan, L.; Zhang, F.; Chen, M.; Li, F.; Vries, W. Applying SBM-GPA model to explore urban land use efficiency considering ecological development in China. Land 2021, 10, 912. [Google Scholar] [CrossRef]
- Feng, Y.G.; Peng, Y.; Deng, Z.B.; Wang, J. Spatial-temporal variation of cultivated land’s utilization efficiency in China based on the dual perspective of non-point source pollution and carbon emission. China Popul. Resour. Environ. 2015, 25, 18–25. [Google Scholar]
- Ke, N.; Lu, X.H.; Kuang, B.; Han, J. Regional differences and influencing factors of green and low-carbon utilization of cultivated land under the carbon neutrality target in China. China Land Sci. 2021, 35, 67–76. [Google Scholar]
- Li, C.M.; Hu, J.J. Analysis of spatial and temporal differences and influencing factors of urban land use efficiency based on DEA:a case study of 9 cities in Jilin Province. Resour. Environ. Yangtze Basin 2020, 29, 678–686. [Google Scholar]
- Yang, K.; WEN, Q.; Zhong, T.Y. Assessment of urban land use efficiency in the Yangtze River economic belt. Resour. Sci. 2018, 40, 2048–2059. [Google Scholar]
- Zhang, R.T.; Jiao, H.F. Spatial-temporal pattern differentiation and its mechanism analysis of using efficiency for provincial cultivated land in China. Trans. Chin. Soc. Agric. Eng. 2015, 31, 277–287. [Google Scholar]
- Azad, A.; Wang, X. Land use change ontology and traffic prediction through recurrent neural networks: A case study in Calgary, Canada. ISPRS Int. J. Geo-Inf. 2021, 10, 358. [Google Scholar] [CrossRef]
- Wu, C.; Wei, Y.D.; Huang, X.; Chen, B. Economic transition, spatial development and urban land use efficiency in the Yangtze River Delta, China. Habitat Int. 2017, 63, 67–78. [Google Scholar] [CrossRef]
- Li, J.; Lewis, J.; Rowland, J.; Tappan, G.; Tieszen, L. Evaluation of land performance in Senegal using multi-temporal NDVI and rainfall series. J. Arid. Environ. 2004, 59, 463–480. [Google Scholar] [CrossRef]
- Liang, L.; Chen, M.; Luo, X.; Xian, Y. Changes pattern in the population and economic gravity centers since the Reform and Opening up in China: The widening gaps between the South and North. J. Clean. Prod. 2021, 310, 127379. [Google Scholar] [CrossRef]
- Li, L.; Dong, J.; Zhang, J.F. Regional difference and formation mechanism of urban land use efficiency in the Yangtze River economic belt. Resour. Environ. Yangtze Basin 2018, 27, 1665–1675. [Google Scholar]
- Zhang, G. Spatial-temporal responses of ecosystem services to land use transformation driven by rapid urbanization: A case study of Hubei Province, China. Int. J. Environ. Res. Public Health 2022, 19, 178. [Google Scholar] [CrossRef]
- Gao, J.B.; Xie, W.Q.; Han, Y.; Zhang, Y.Y.; Chen, J.H. The evolutionary trend and the coupling relation of gravity center moving of county-level population distribution, economical development and grain production during 1990–2013 in Henan Province. Sci. Geogr. Sin. 2018, 38, 919–926. [Google Scholar]
- Liao, J.; Yu, C.; Feng, Z.; Zhao, H.; Ma, X. Spatial differentiation characteristics and driving factors of agricultural eco-efficiency in Chinese Provinces from the perspective of ecosystem services. J. Clean. Prod. 2020, 288, 125466. [Google Scholar] [CrossRef]
- Wang, J.F.; Xu, C.D. Geodetectors: Principles and perspectives. Acta Geogr. Sin. 2017, 72, 19. [Google Scholar]
- Yang, B.; Wang, Z.; Zou, L.; Zou, L.; Zhang, H. Exploring the eco-efficiency of cultivated land utilization and its influencing factors in China′s Yangtze River economic belt, 2001–2018. J. Environ. Manag. 2021, 294, 112939. [Google Scholar] [CrossRef] [PubMed]
- Attardi, R.; Cerreta, M.; Sannicandro, V.; Torre, C.M. Non-compensatory composite indicators for the evaluation of urban planning policy: The Land-Use Policy Efficiency Index (LUPEI). Eur. J. Oper. Res. 2018, 264, 491–507. [Google Scholar] [CrossRef]
- Halleux, J.-M.; Marcinczak, S.; van der Krabben, E. The adaptive efficiency of land use planning measured by the control of urban sprawl. The cases of the Netherlands, Belgium and Poland. Land Use Policy 2012, 29, 887–898. [Google Scholar] [CrossRef]
- Sivam, A. Constraints affecting the efficiency of the urban residential land market in developing countries: A case study of India. Habitat Int. 2002, 26, 523–537. [Google Scholar] [CrossRef]
- Chen, Q.; Zheng, L.; Wang, Y.; Wu, D.; Li, J. A comparative study on urban land use eco-efficiency of Yangtze and Yellow rivers in China: From the perspective of spatiotemporal heterogeneity, spatial transition and driving factors. Ecol. Indic. 2023, 151, 110331. [Google Scholar] [CrossRef]


| Data | Data Description | Data Sources |
|---|---|---|
| Administrative division data | Anhui provincial boundary vector data | Resource Environmental Science and Data Center (https://www.resdc.cn/ accessed on 17 November 2021) |
| Socio-economic data | GDP per capita, investment in fixed assets, local fiscal revenue, etc. | Anhui Statistical Yearbook (2002–2021) (http://tjj.ah.gov.cn/ssah/qwfbjd/tjnj/ accessed on 17 November 2021) |
| Land use data | Built-up area, built-up area green rate, park green area, etc. | China Urban Statistical Yearbook (2002–2021) (http://www.stats.gov.cn/tjsj/ndsj/ accessed on 17 November 2021) |
| Factor | Index Types | Specific Indicators | Unit |
|---|---|---|---|
| Input index | Land resource input | Urban built-up area | km2 |
| Capital input | Fixed investment | Million CNY | |
| Labor input | Number of employees in secondary and tertiary industries | Million people | |
| Output indicator | Economic output | The value of second and tertiary industries | Billion CNY |
| Social output | Local fiscal revenue | Million CNY | |
| Ecological environment output | The green coverage rate of built district | % |
| Index Types | Specific Indicators | Unit |
|---|---|---|
| Urban traffic conditions | Per capita urban road area | m2 |
| Degree of opening to the outside world | Total export-import volume | Million United States Dollar (USD) |
| Driving Factors | Specific Indicators/Units | Variable Code |
|---|---|---|
| City size | Urban built-up area/km2 | X1 |
| Economic capital | Investment in fixed assets/Million CNY | X2 |
| Human capital | Total number of people employed in secondary and tertiary sectors/Million people | X3 |
| Level of urban development | Population urbanisation rate/% | X4 |
| GDP per capita/CNY/person | X5 | |
| Industrial structure | Tertiary sector to GDP ratio/% | X6 |
| Degree of external openness | Actual amount of foreign investment utilised/Million USD | X7 |
| Year | Slack Variables | Per Capita Urban Road Area | Total Export-Import Volume |
|---|---|---|---|
| 2001 | Urban built-up area | 0.0613 | 0.00001 |
| Fixed investment | 2100.5752 | 0.01448 | |
| Number of employees in secondary and tertiary industries | −1.46 | 0.00005 | |
| 2006 | Urban built-up area | 2.1108 | 0.00005 |
| Fixed investment | 10,337.9200 | 0.06297 | |
| Number of employees in secondary and tertiary industries | −0.6972 | 0.00003 | |
| 2011 | Urban built-up area | −0.0070 | 0.00001 |
| Fixed investment | −7547.0386 | 0.17256 | |
| Number of employees in secondary and tertiary industries | 2.0930 | −0.00002 | |
| 2016 | Urban built-up area | −0.2888 | −0.00001 |
| Fixed investment | −16,893.7300 | 0.16635 | |
| Number of employees in secondary and tertiary industries | 1.6806 | 0.00003 | |
| 2020 | Urban built-up area | 0.0414 | −0.00001 |
| Fixed investment | −6889.7430 | −0.37872 | |
| Number of employees in secondary and tertiary industries | 0.8622 | 0.00001 |
| Year | X1 | X2 | X3 | X4 | X5 | X6 | X7 |
|---|---|---|---|---|---|---|---|
| 2001 | 0.8908 | 0.7679 | 0.3741 | 0.4112 | 0.7784 | 0.4354 | 0.8254 |
| 2006 | 0.7668 | 0.5871 | 0.4359 | 0.4329 | 0.6215 | 0.3236 | 0.5504 |
| 2011 | 1.0000 | 0.4042 | 0.4828 | 0.4446 | 0.7272 | 0.4115 | 0.5675 |
| 2016 | 0.4795 | 0.3524 | 0.2173 | 0.6383 | 0.3534 | 0.0966 | 0.8522 |
| 2020 | 0.9097 | 0.4192 | 0.1768 | 0.7347 | 0.8270 | 0.3250 | 0.5126 |
Disclaimer/Publisher’s Note: The statements, opinions and data contained in all publications are solely those of the individual author(s) and contributor(s) and not of MDPI and/or the editor(s). MDPI and/or the editor(s) disclaim responsibility for any injury to people or property resulting from any ideas, methods, instructions or products referred to in the content. |
© 2023 by the authors. Licensee MDPI, Basel, Switzerland. This article is an open access article distributed under the terms and conditions of the Creative Commons Attribution (CC BY) license (https://creativecommons.org/licenses/by/4.0/).
Share and Cite
Ma, M.; Liu, Y.; Wang, B.; Yan, X.; Li, H. Spatial-Temporal Evolution and Driving Mechanism of Urban Land Use Efficiency Based on T-DEA Model: A Case Study of Anhui Province, China. Sustainability 2023, 15, 10087. https://doi.org/10.3390/su151310087
Ma M, Liu Y, Wang B, Yan X, Li H. Spatial-Temporal Evolution and Driving Mechanism of Urban Land Use Efficiency Based on T-DEA Model: A Case Study of Anhui Province, China. Sustainability. 2023; 15(13):10087. https://doi.org/10.3390/su151310087
Chicago/Turabian StyleMa, Ming, Yuge Liu, Bingyi Wang, Xinyu Yan, and Haotian Li. 2023. "Spatial-Temporal Evolution and Driving Mechanism of Urban Land Use Efficiency Based on T-DEA Model: A Case Study of Anhui Province, China" Sustainability 15, no. 13: 10087. https://doi.org/10.3390/su151310087
APA StyleMa, M., Liu, Y., Wang, B., Yan, X., & Li, H. (2023). Spatial-Temporal Evolution and Driving Mechanism of Urban Land Use Efficiency Based on T-DEA Model: A Case Study of Anhui Province, China. Sustainability, 15(13), 10087. https://doi.org/10.3390/su151310087