

Research on the Evaluation and Spatial–Temporal Evolution of Safe and Resilient Cities Based on Catastrophe Theory—A Case Study of Ten Regions in Western China

Abstract
1. Introduction
2. Literature Review
2.1. Related Research on Urban Resilience
2.2. Related Research on Urban-Safety Resilience
2.3. Methods, Scales, and Gaps in Current Urban-Safety Resilience
3. Methodology
3.1. Urban-Safety Resilience
3.1.1. Concept and Connotation
3.1.2. Principles for Constructing the Indicator System
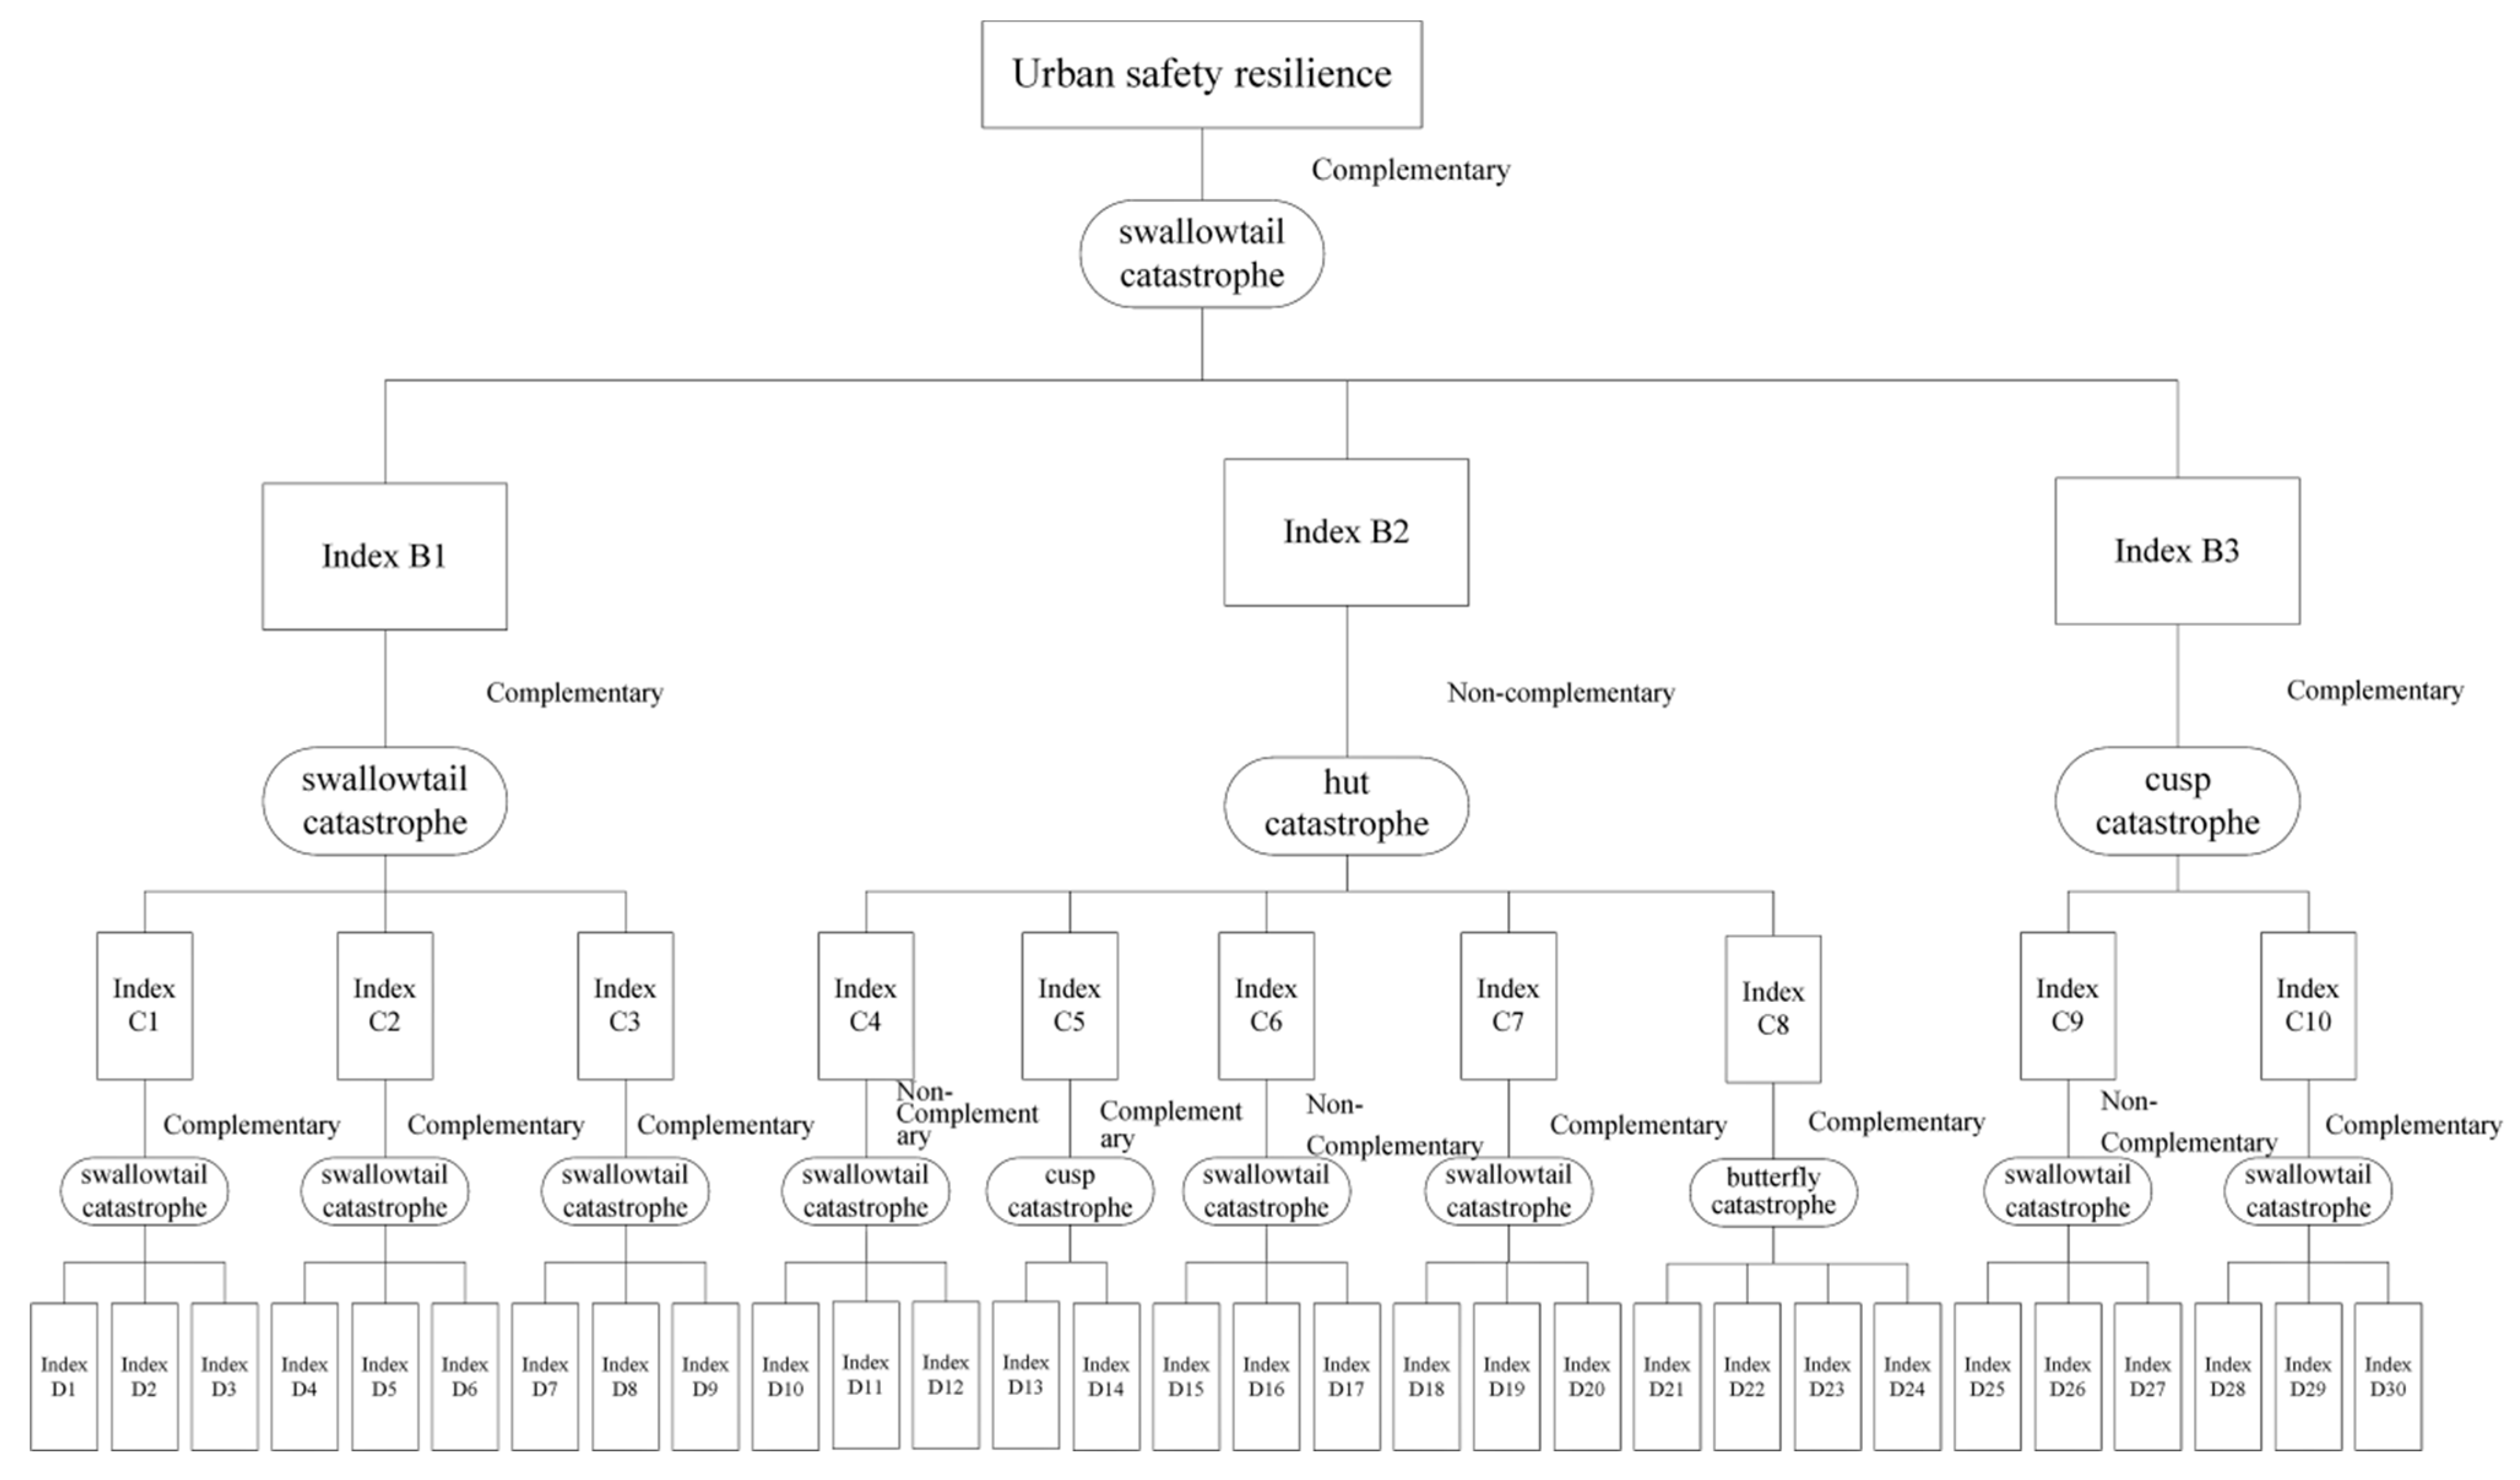
3.1.3. Establishment of an Urban-Safety-Resilience-Index System
3.1.4. Study Area and Time
3.2. Catastrophe-Progression Method
3.3. Spatial Statistical Theory
4. Results
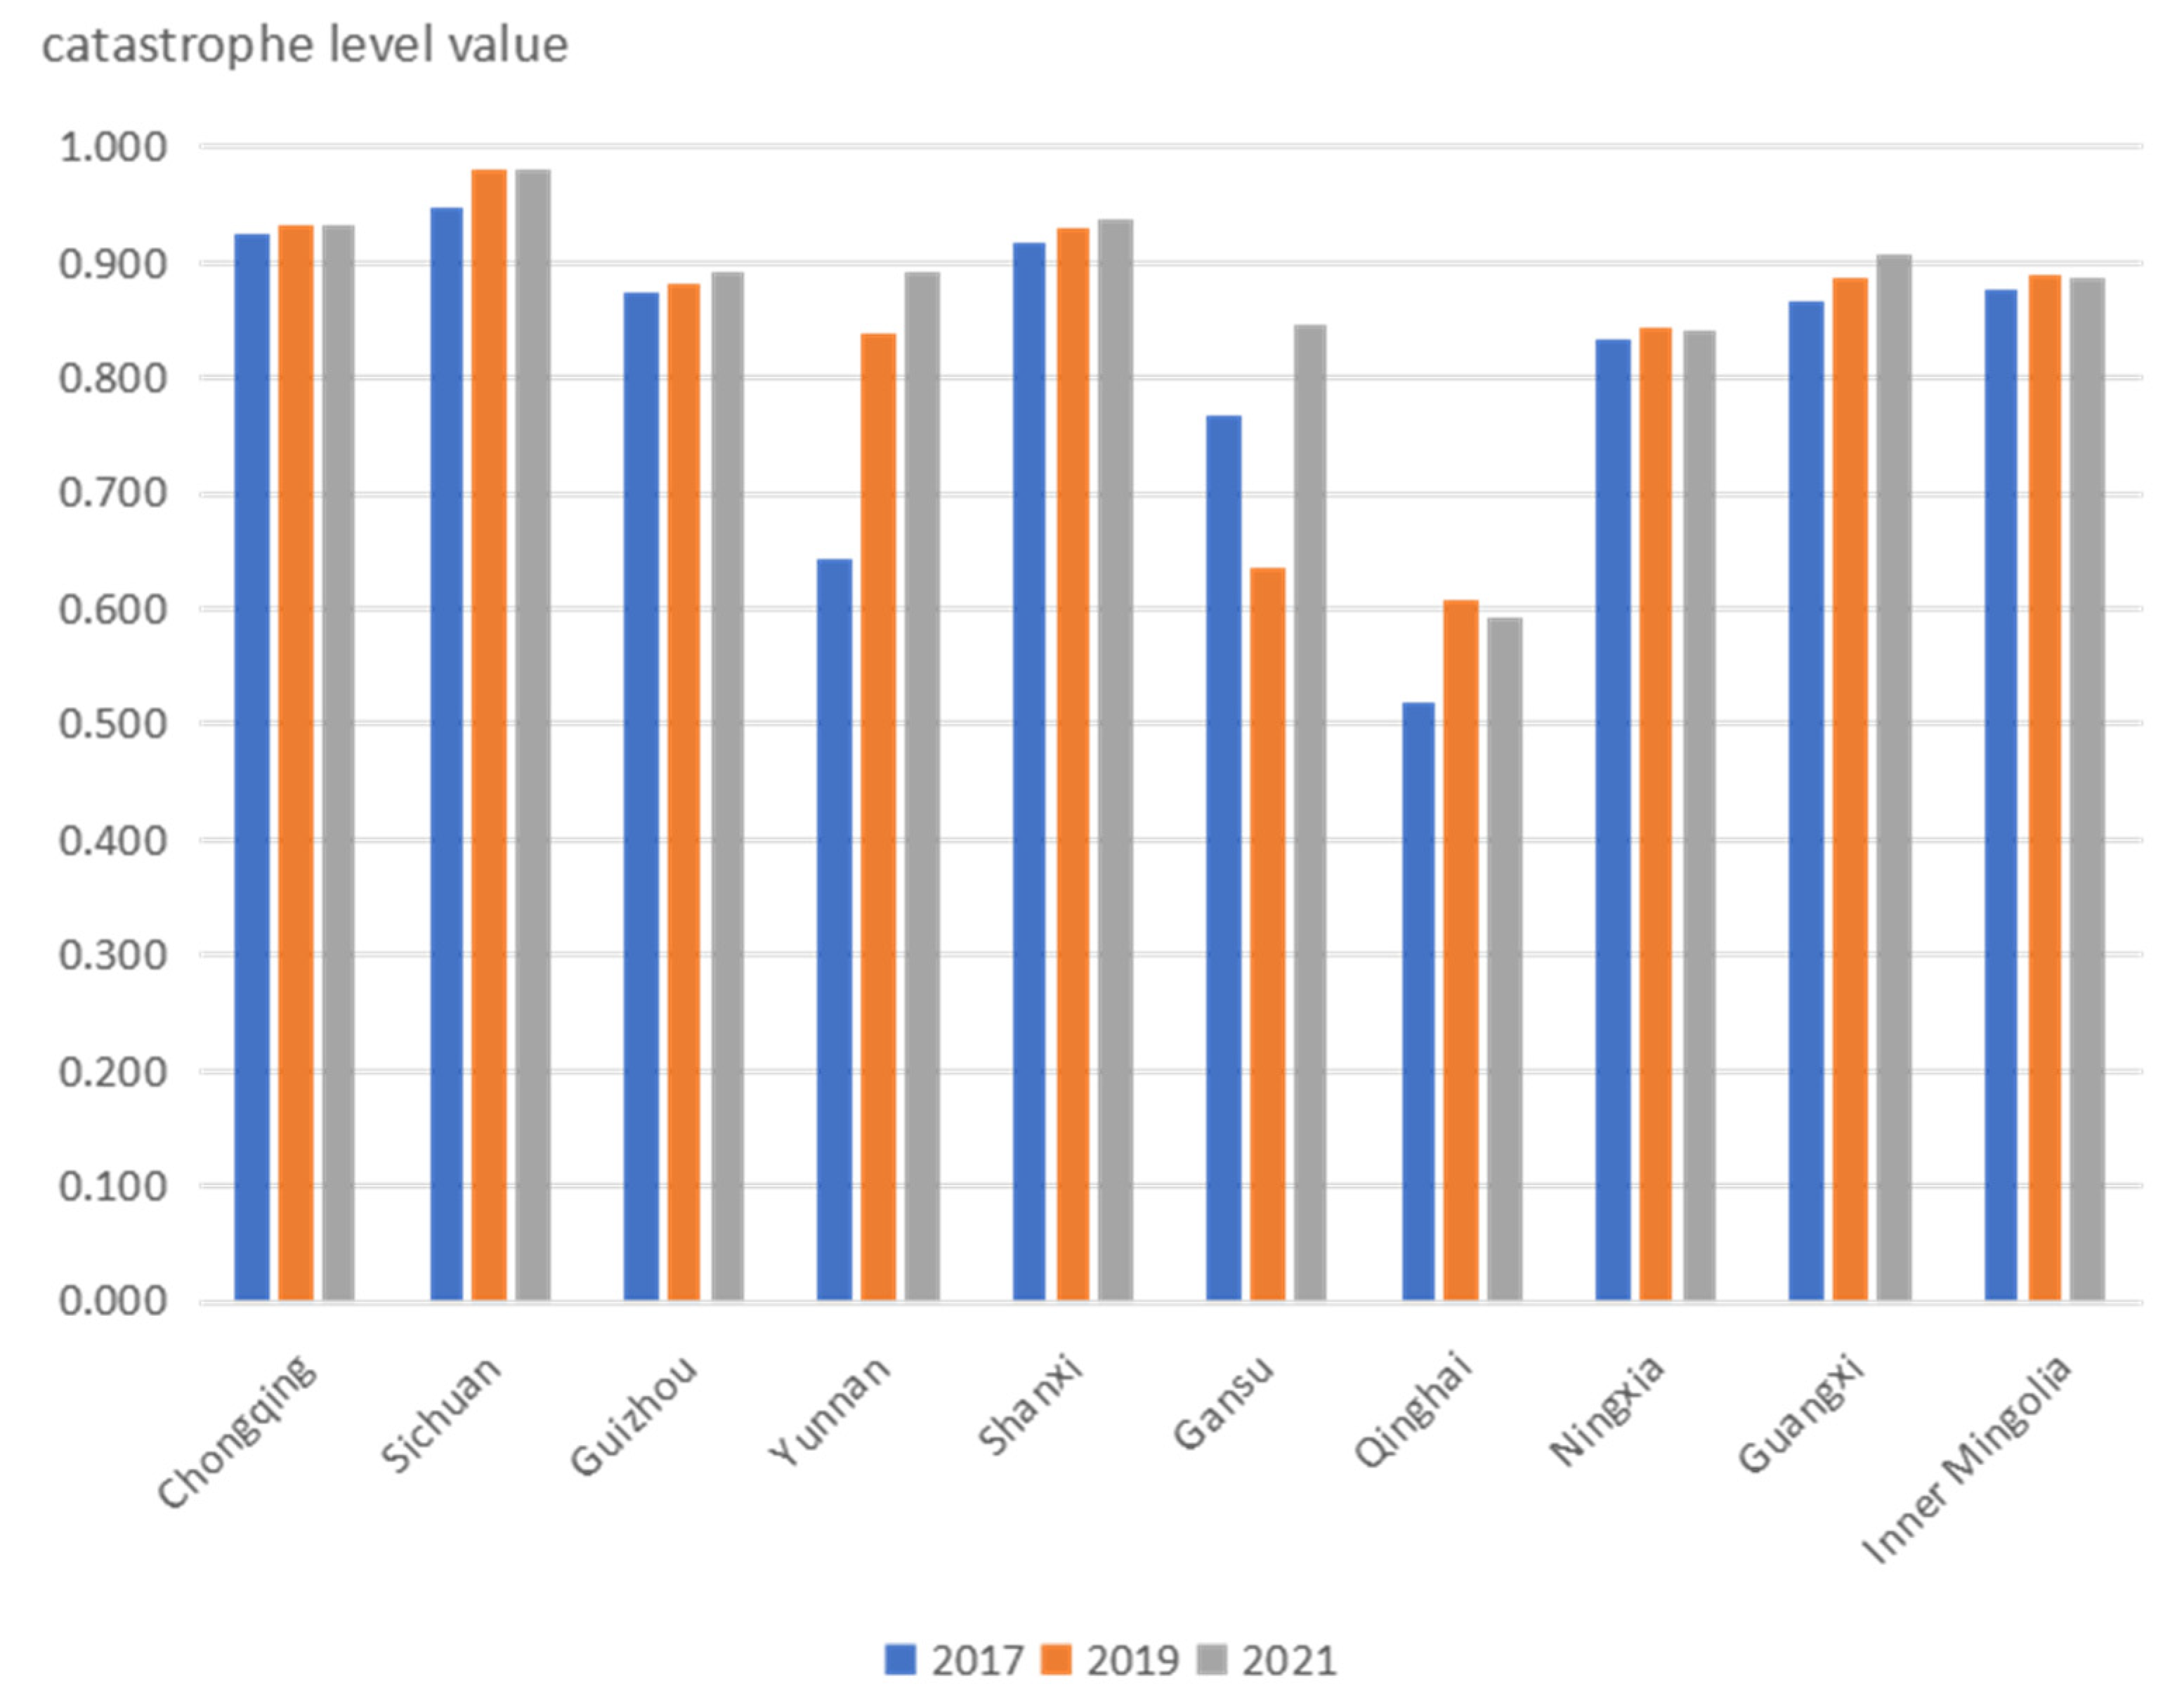
4.1. Evaluation Results
4.2. Spatial Evolution Analysis of Urban-Safety Resilience
4.2.1. Analysis of the Spatial Distribution
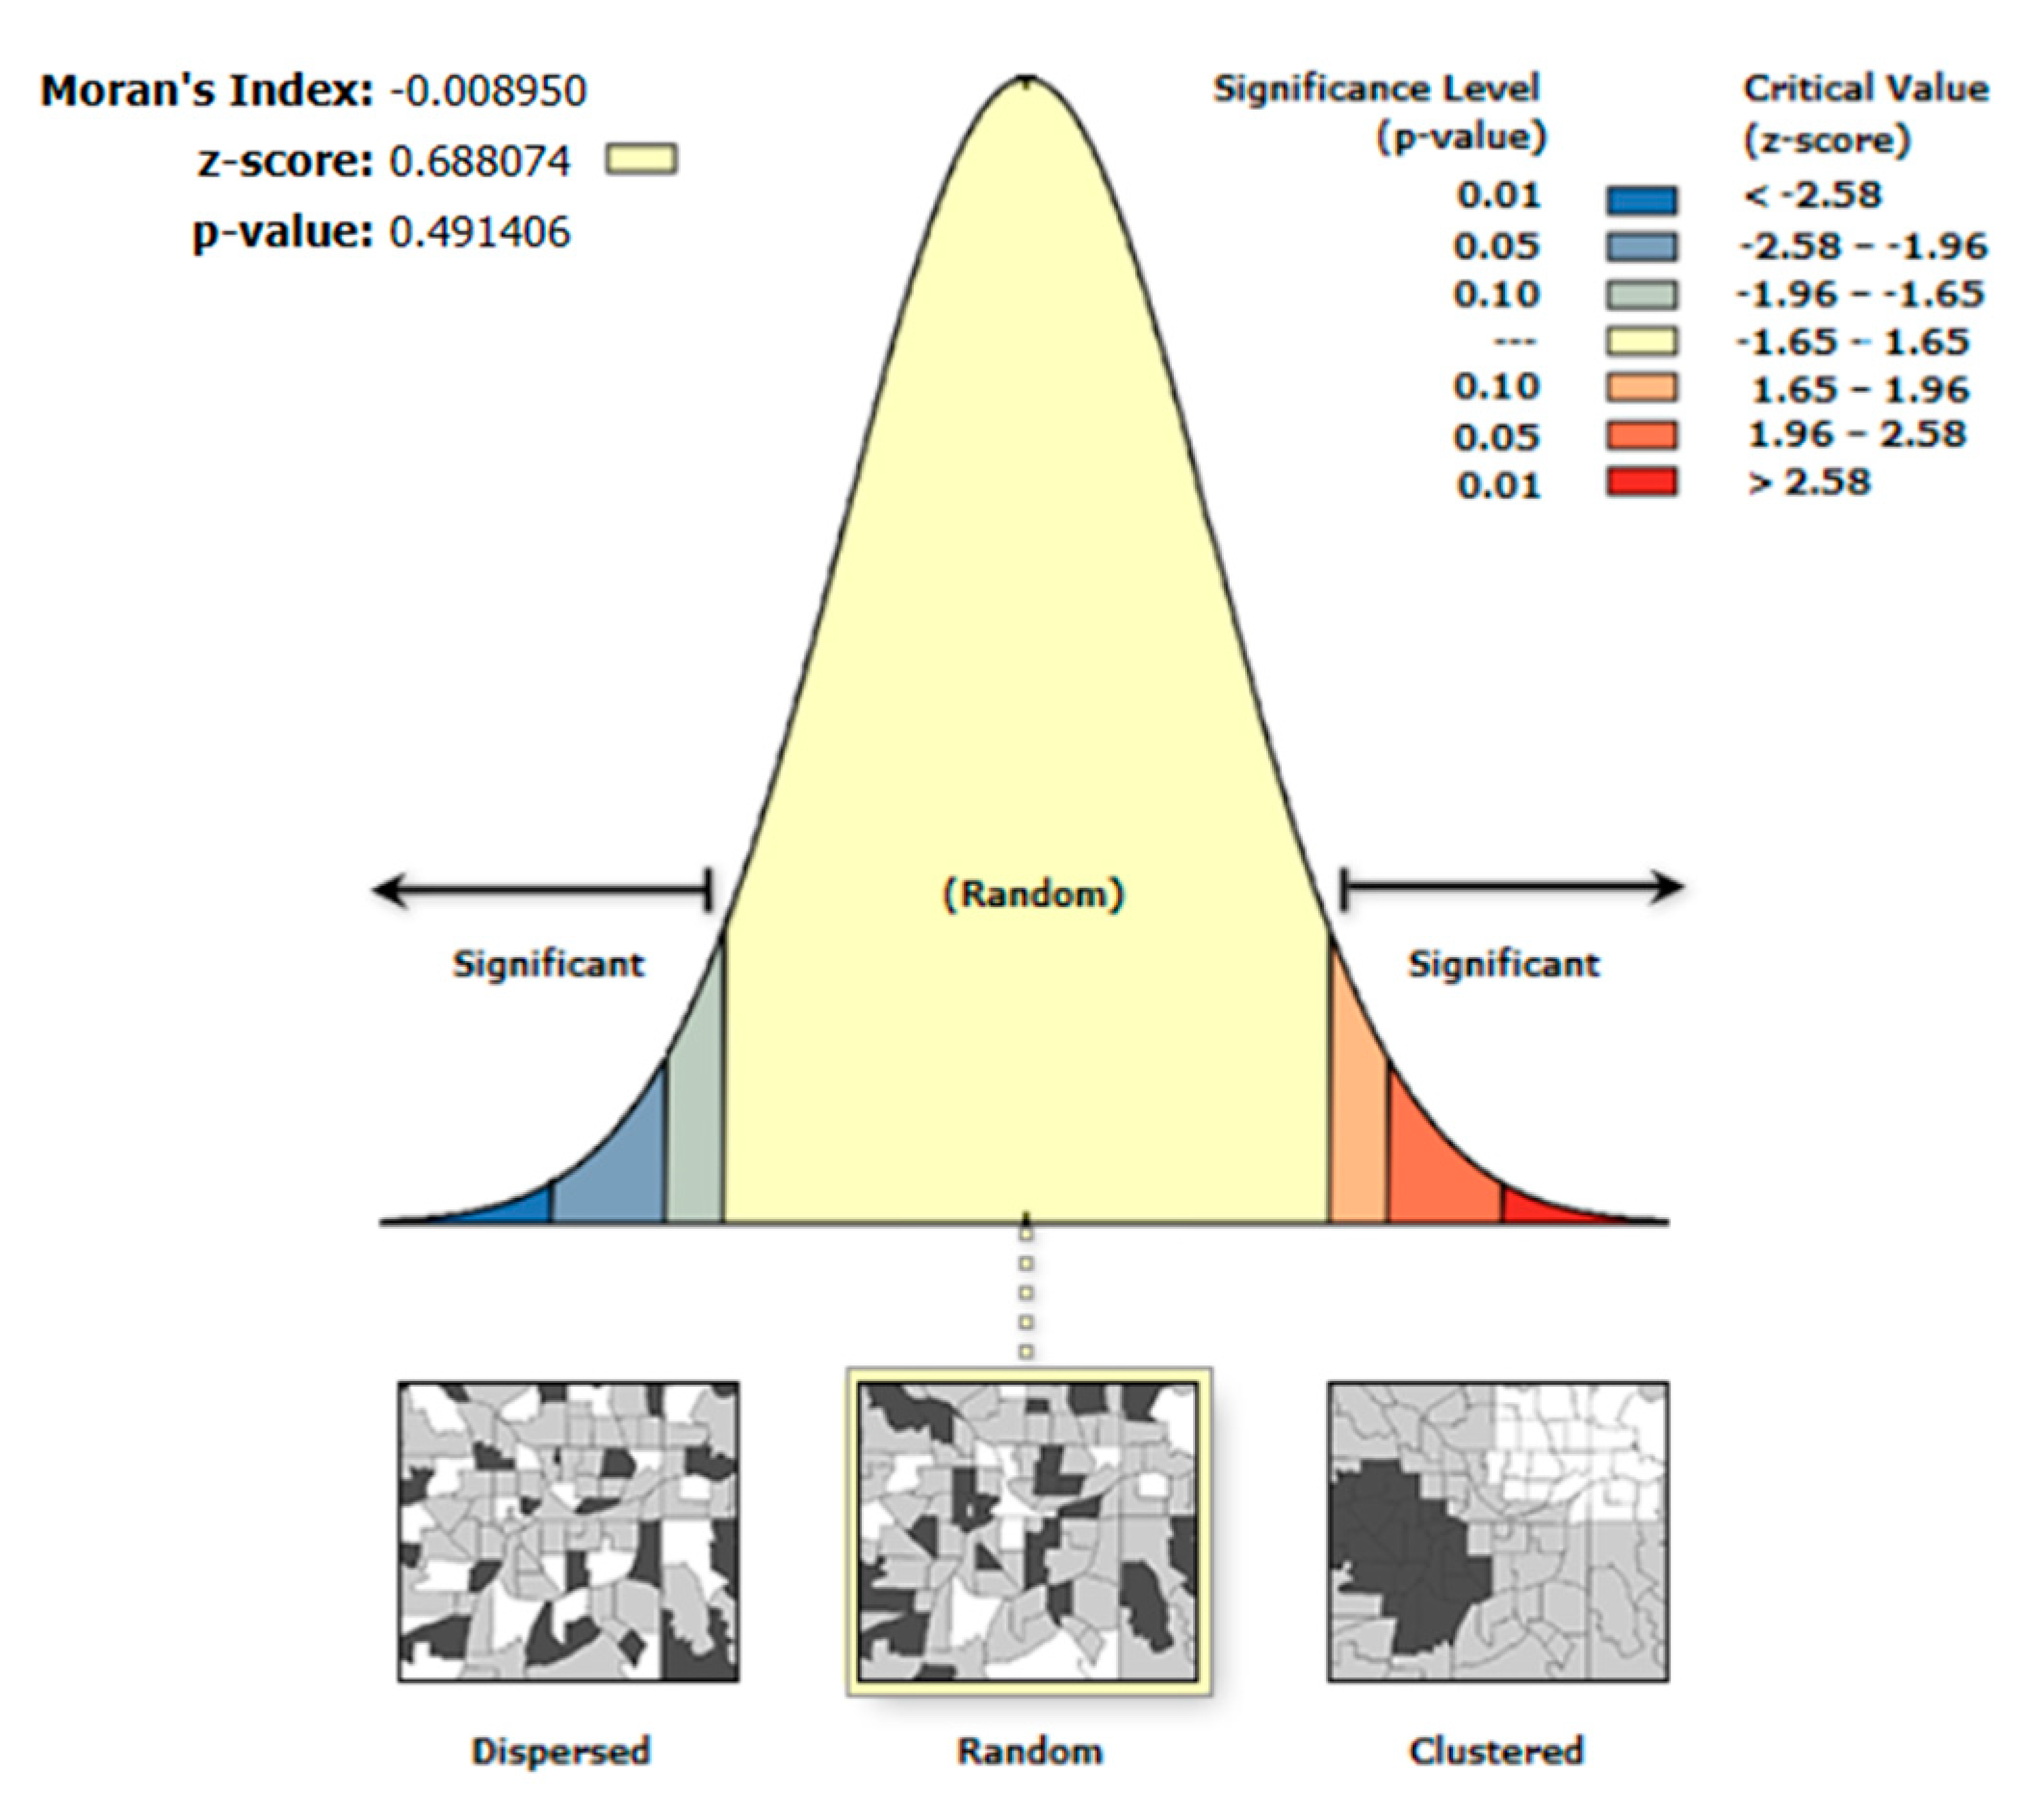
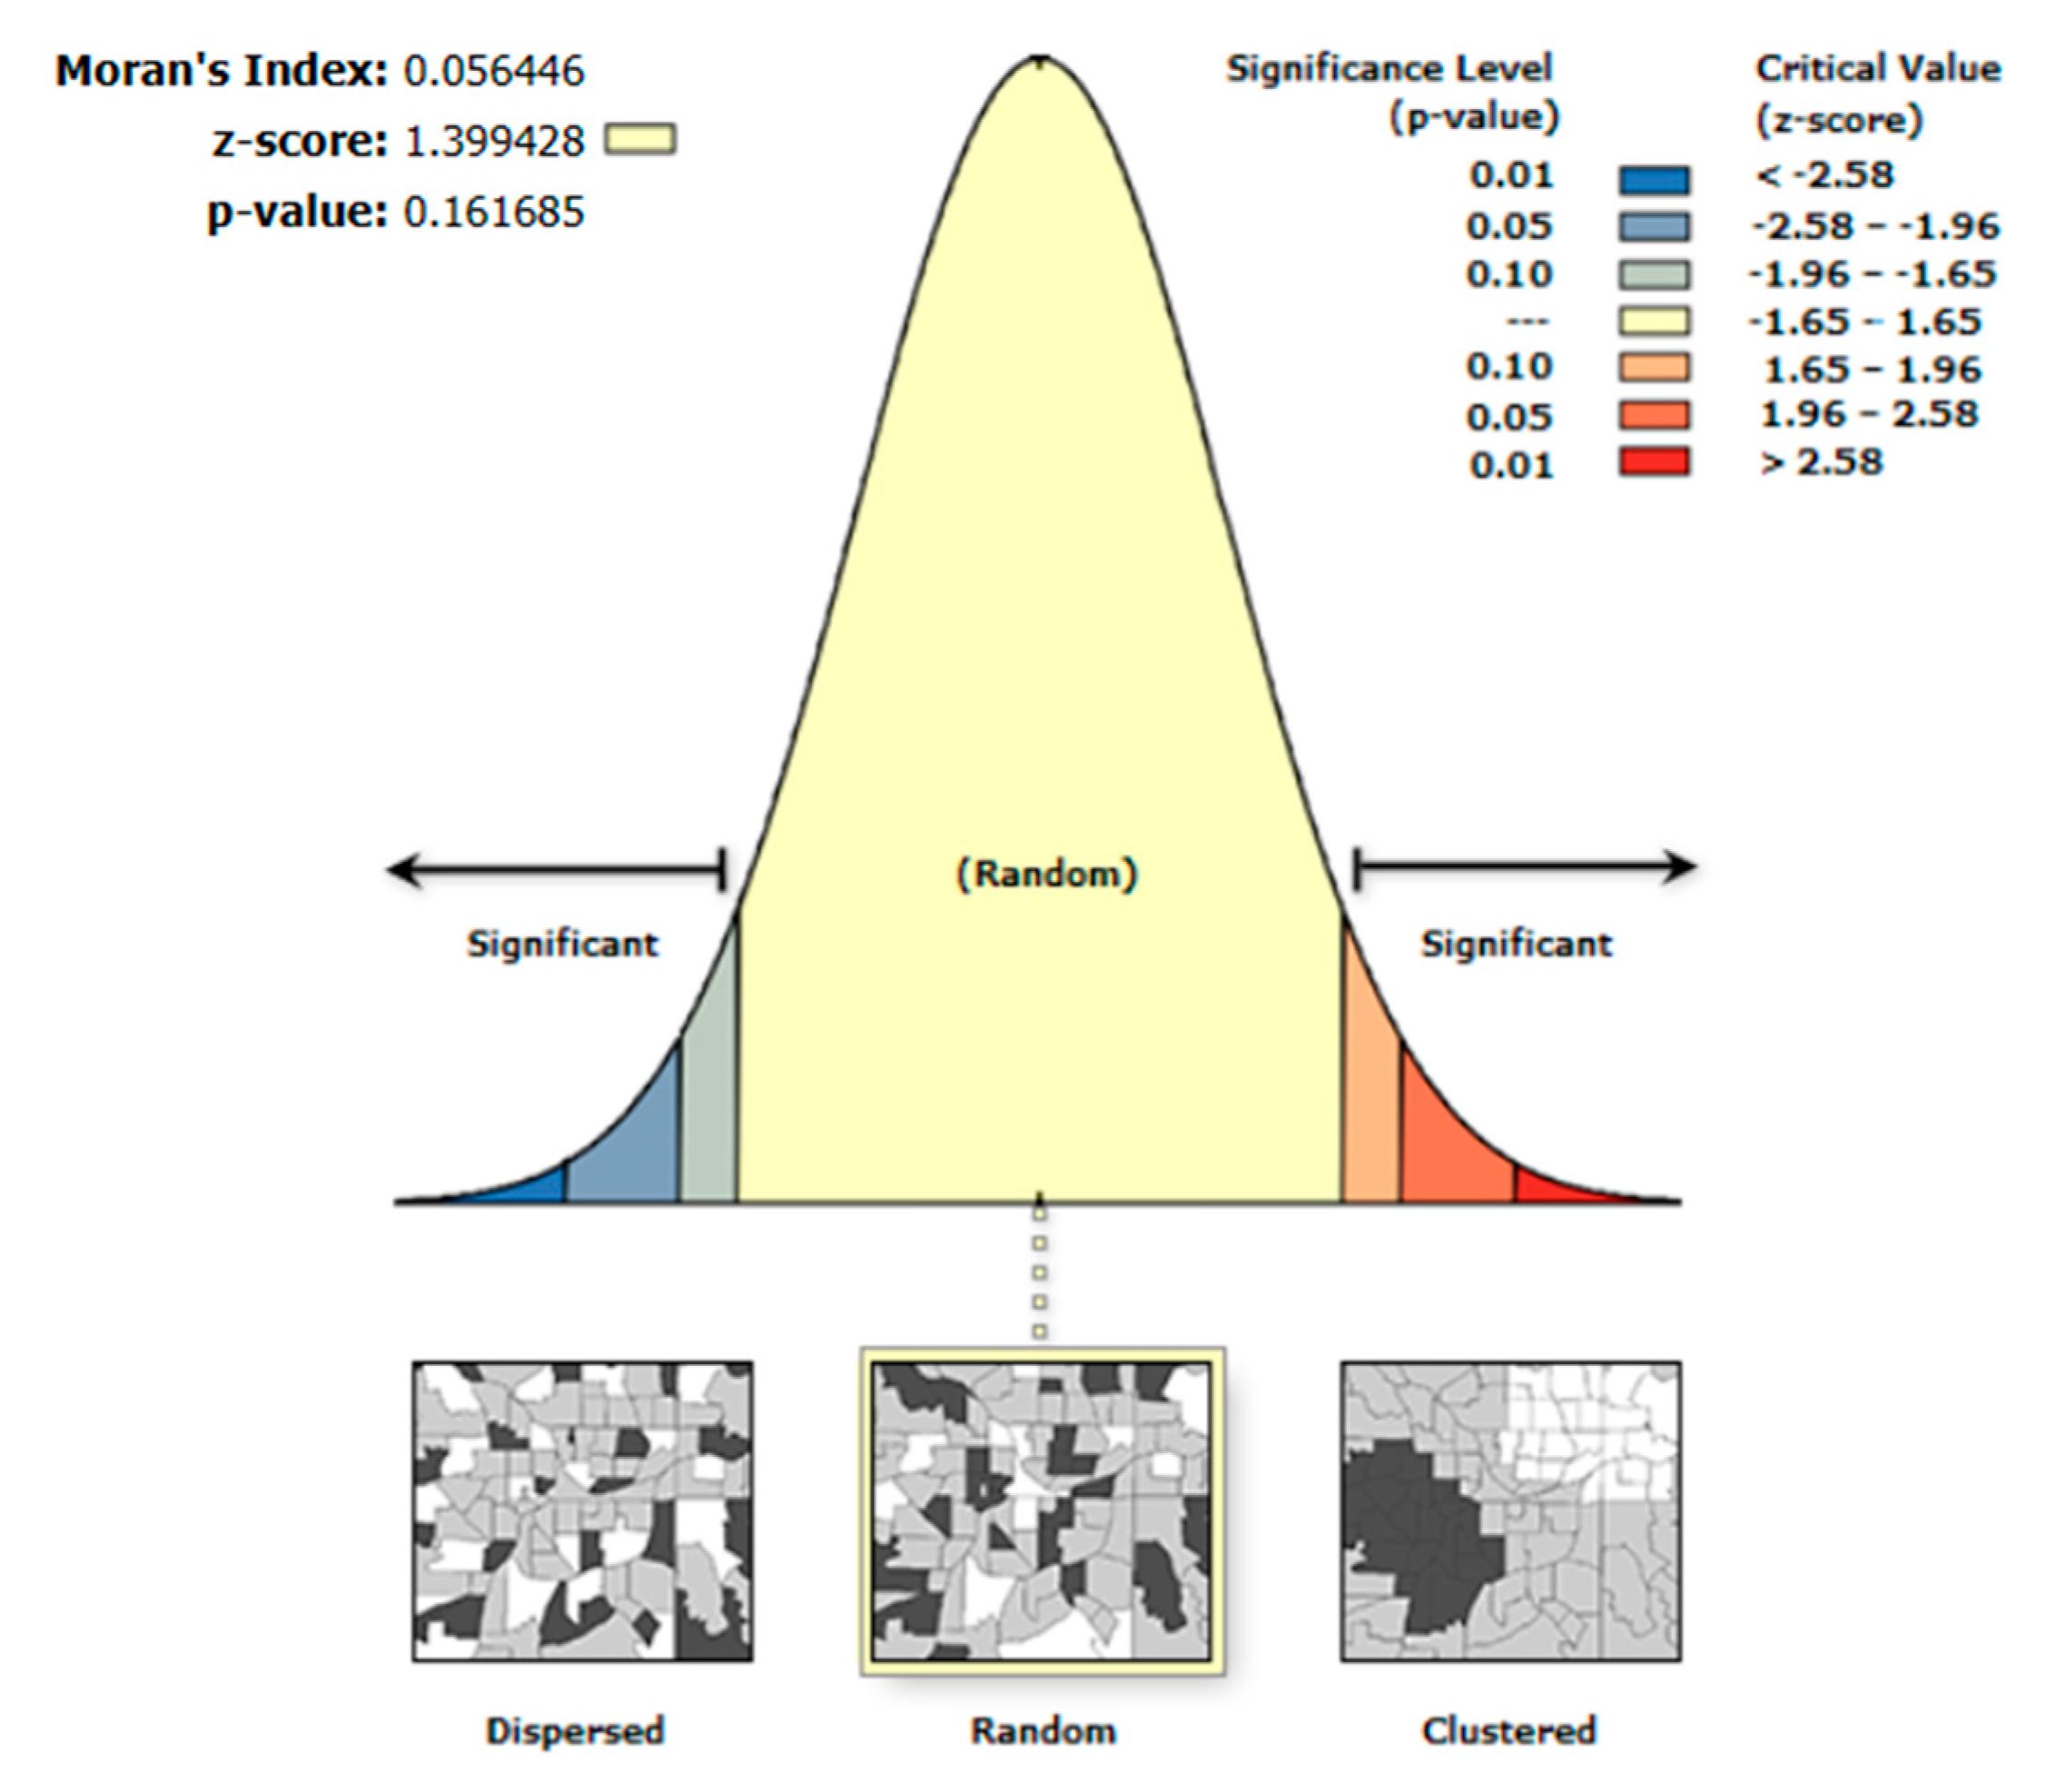
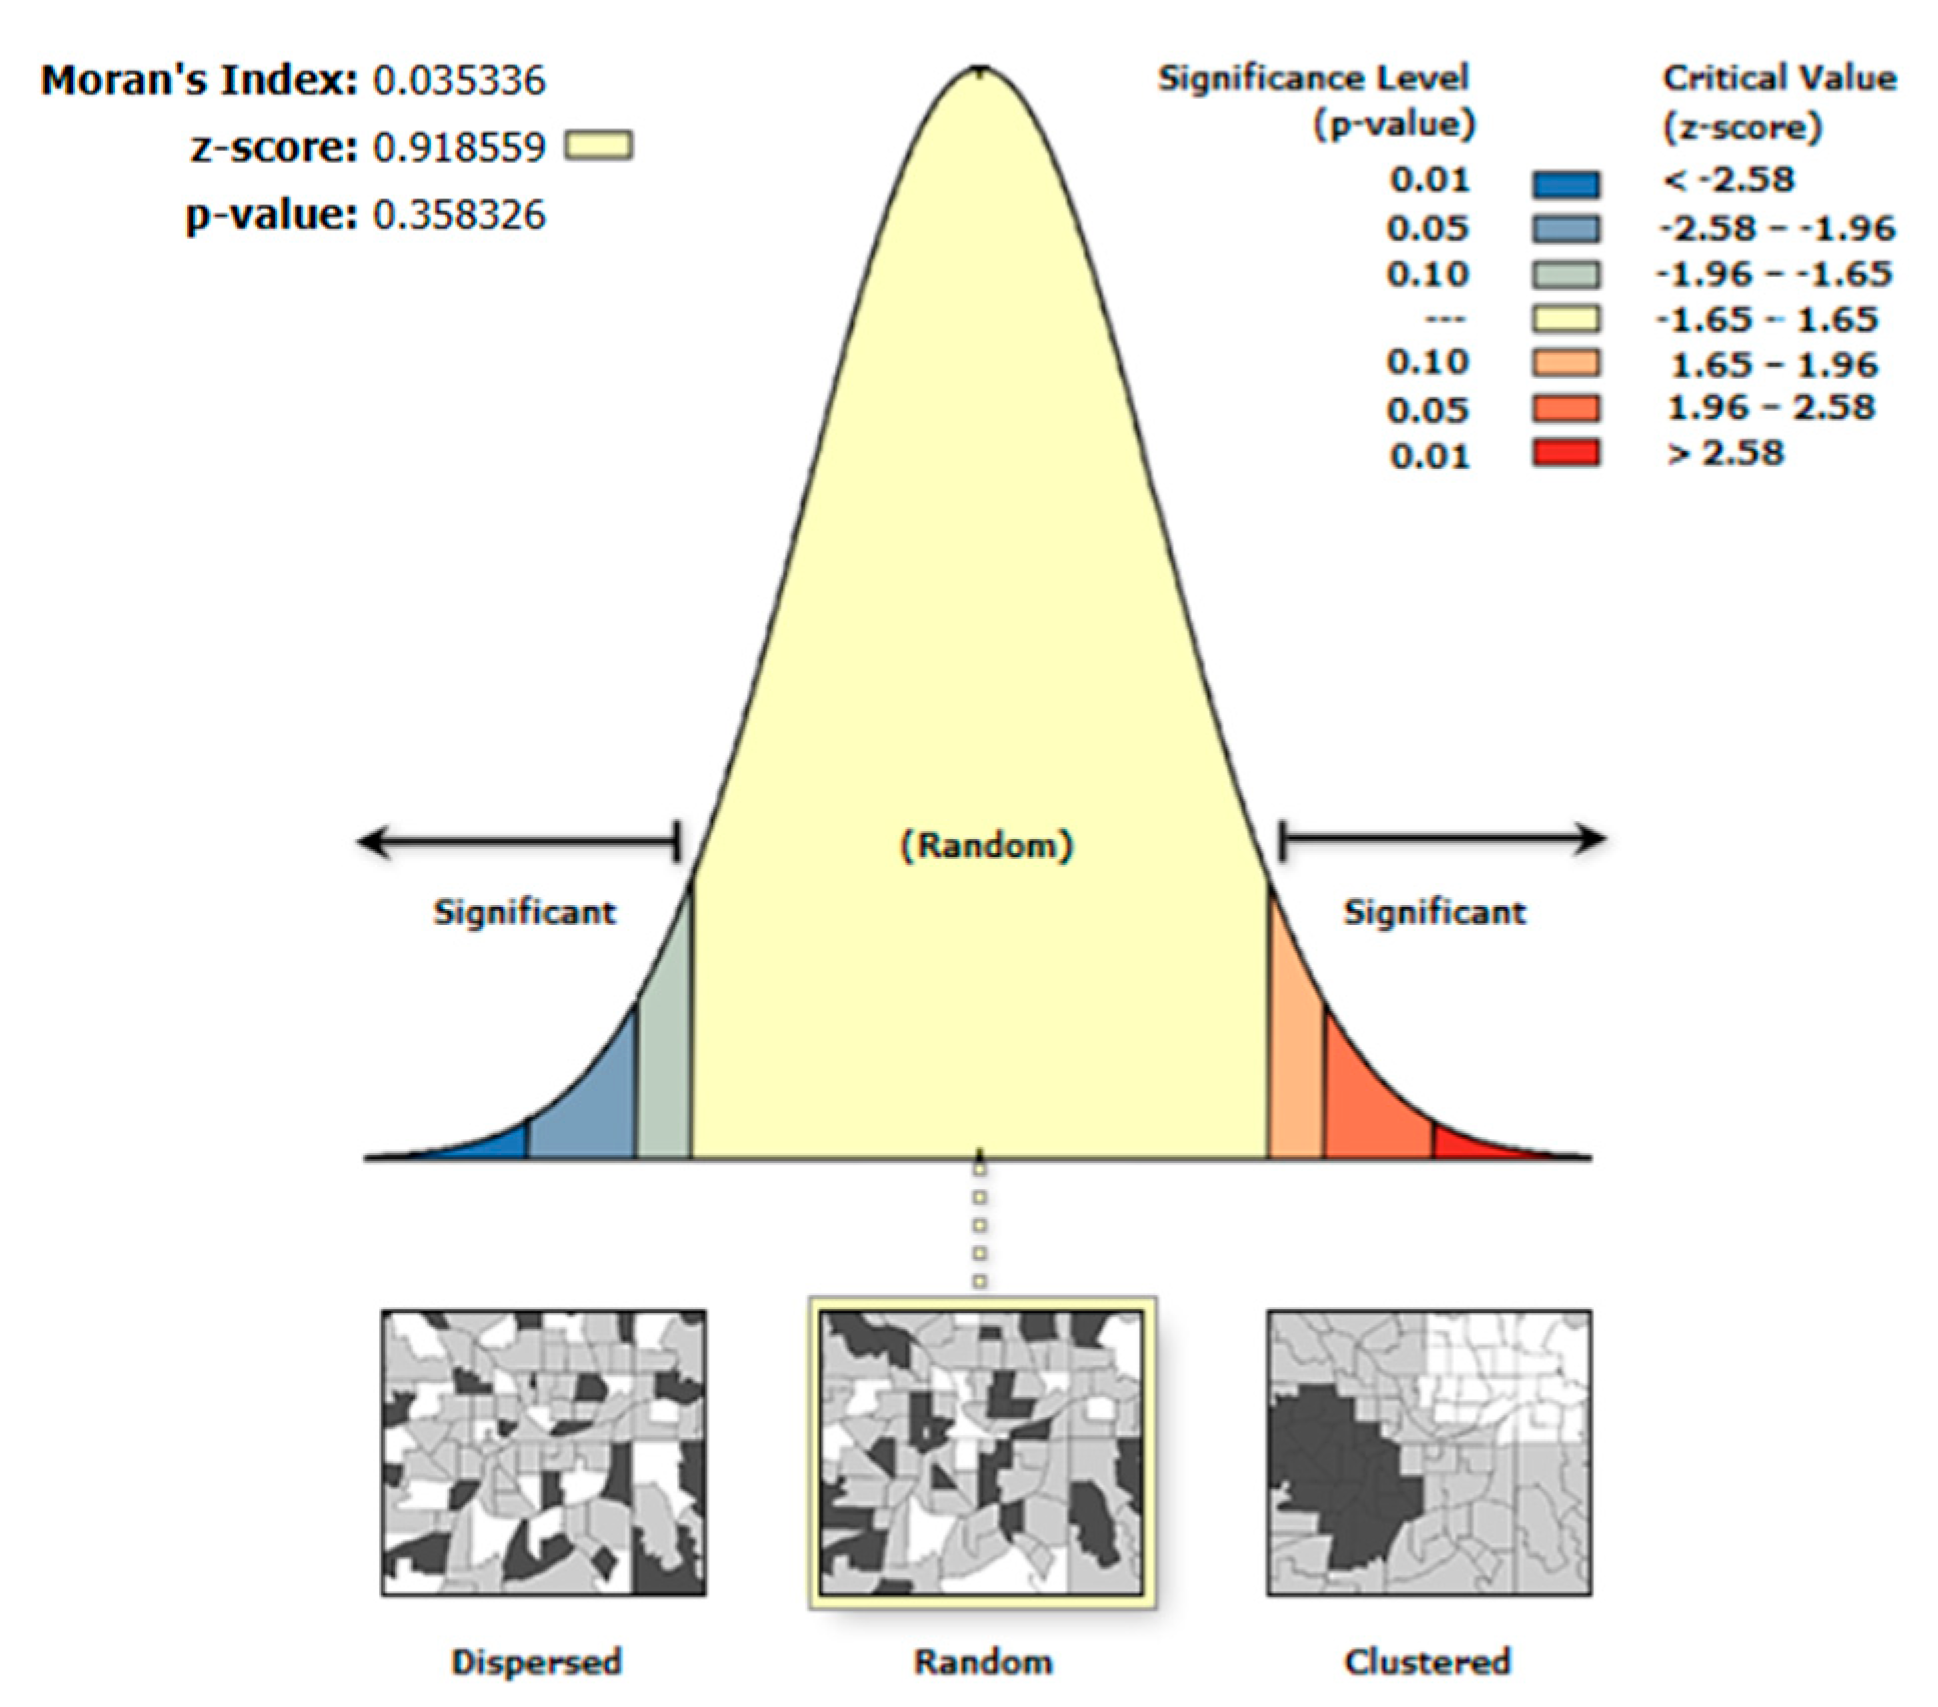
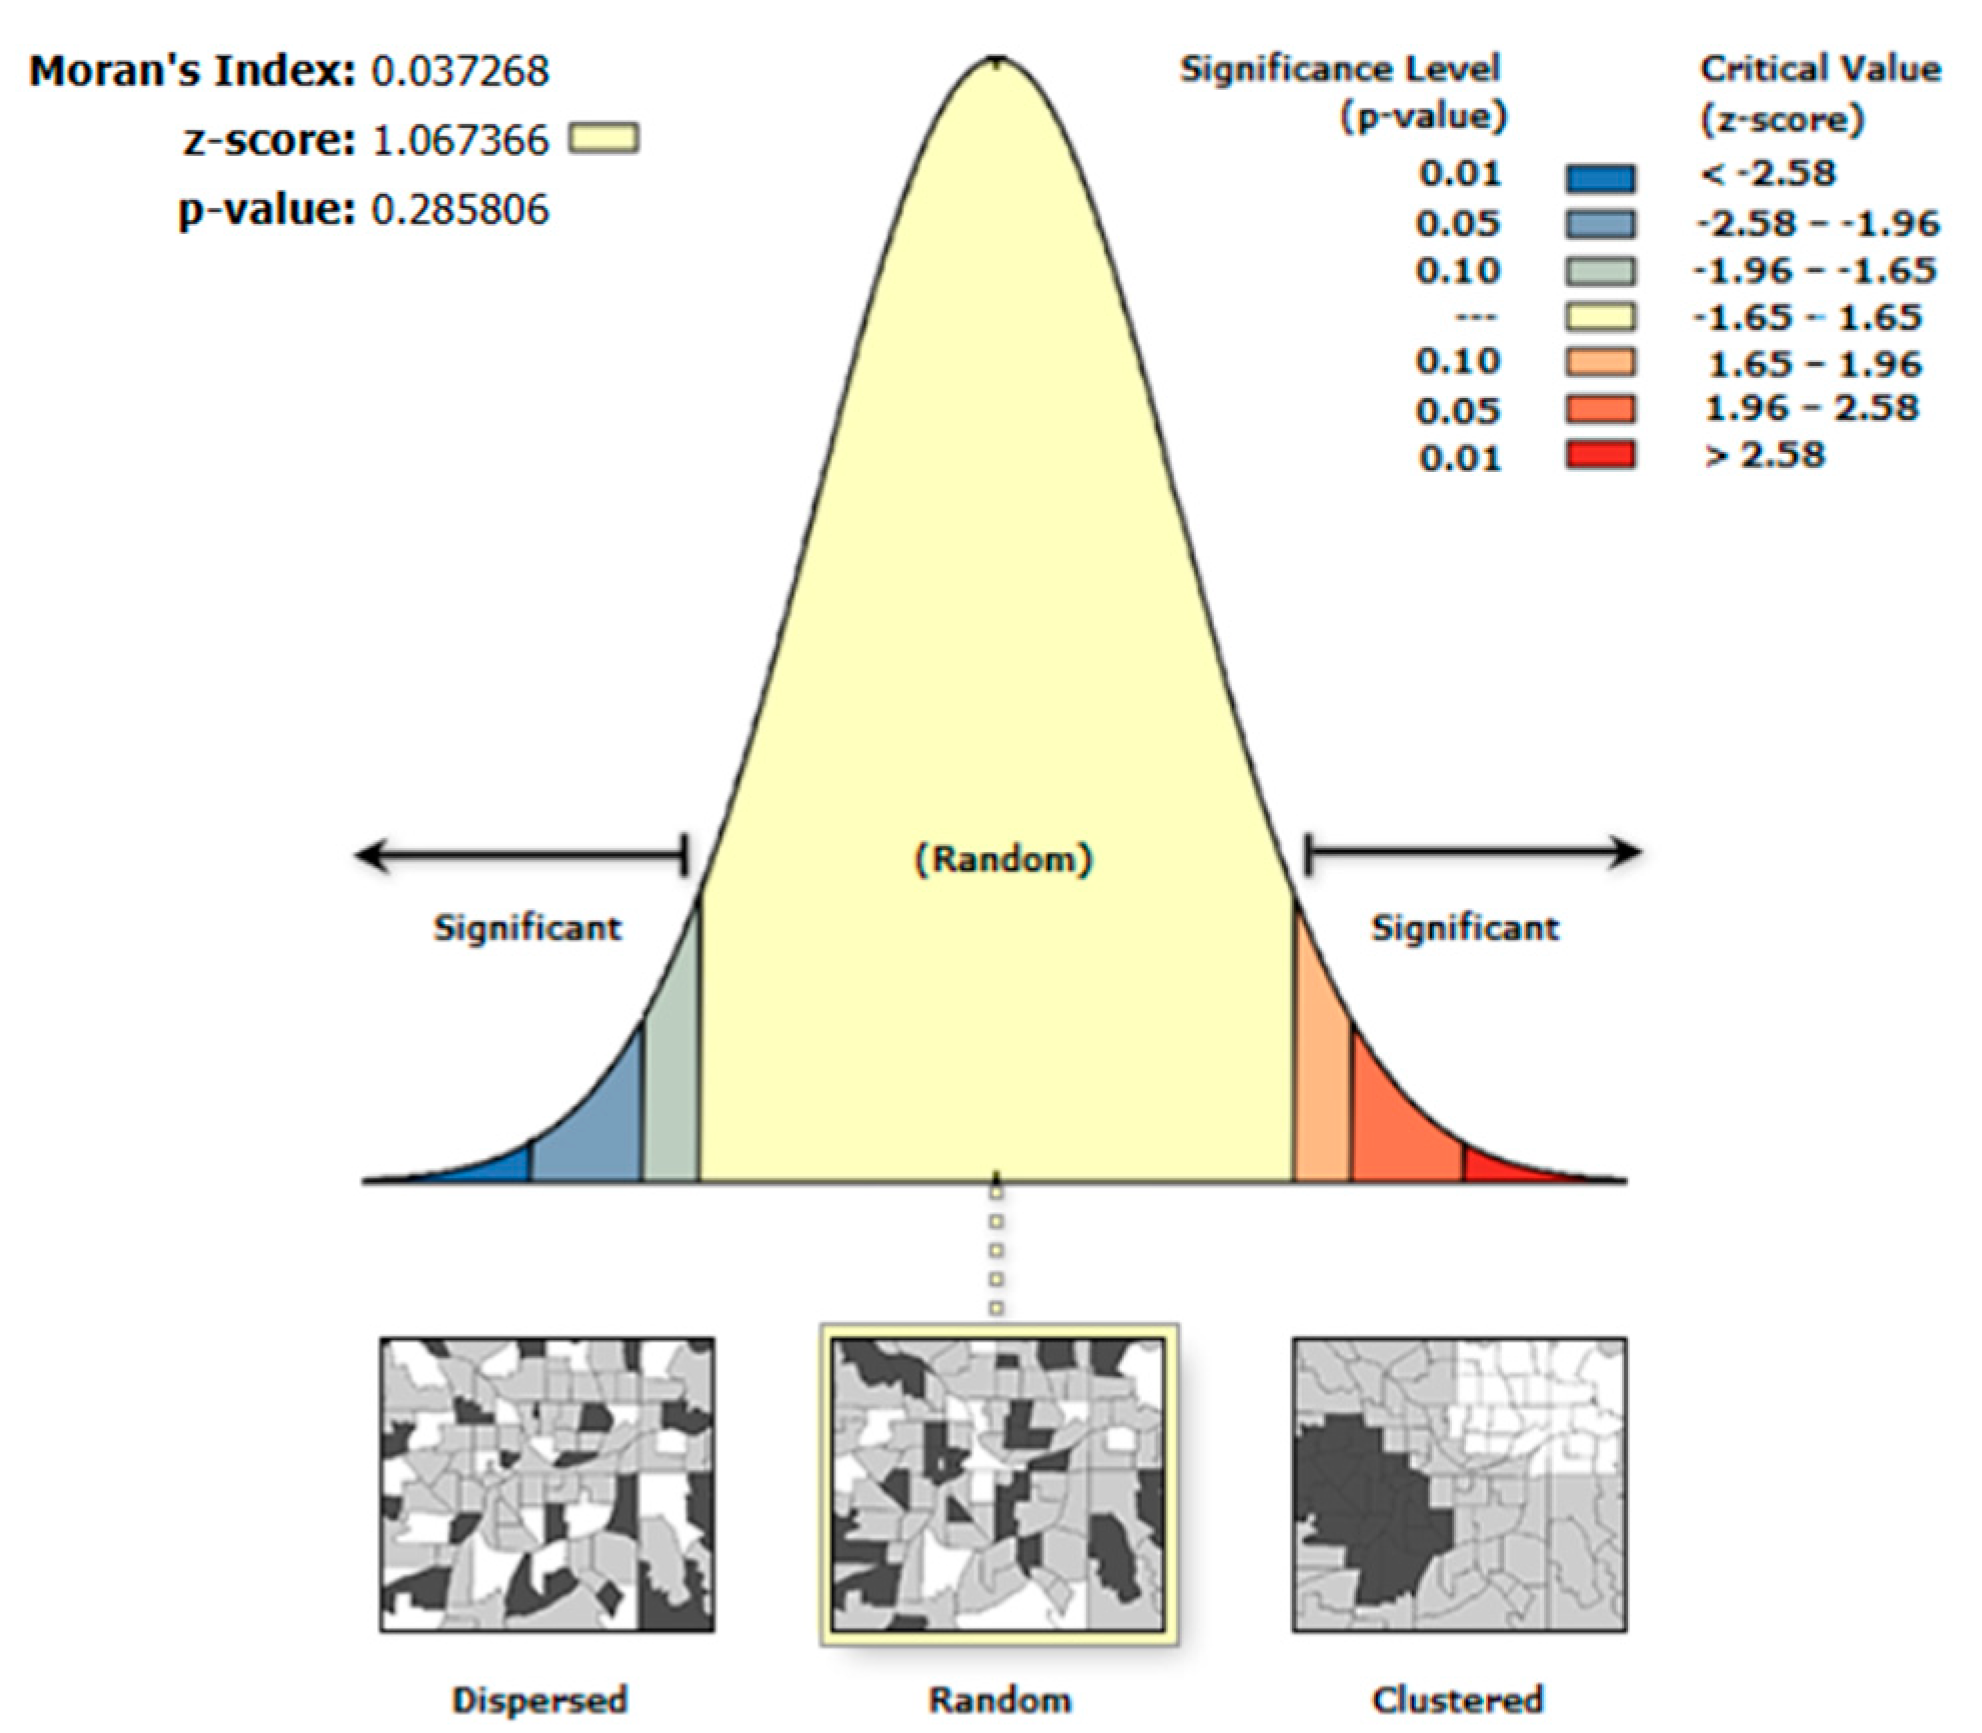
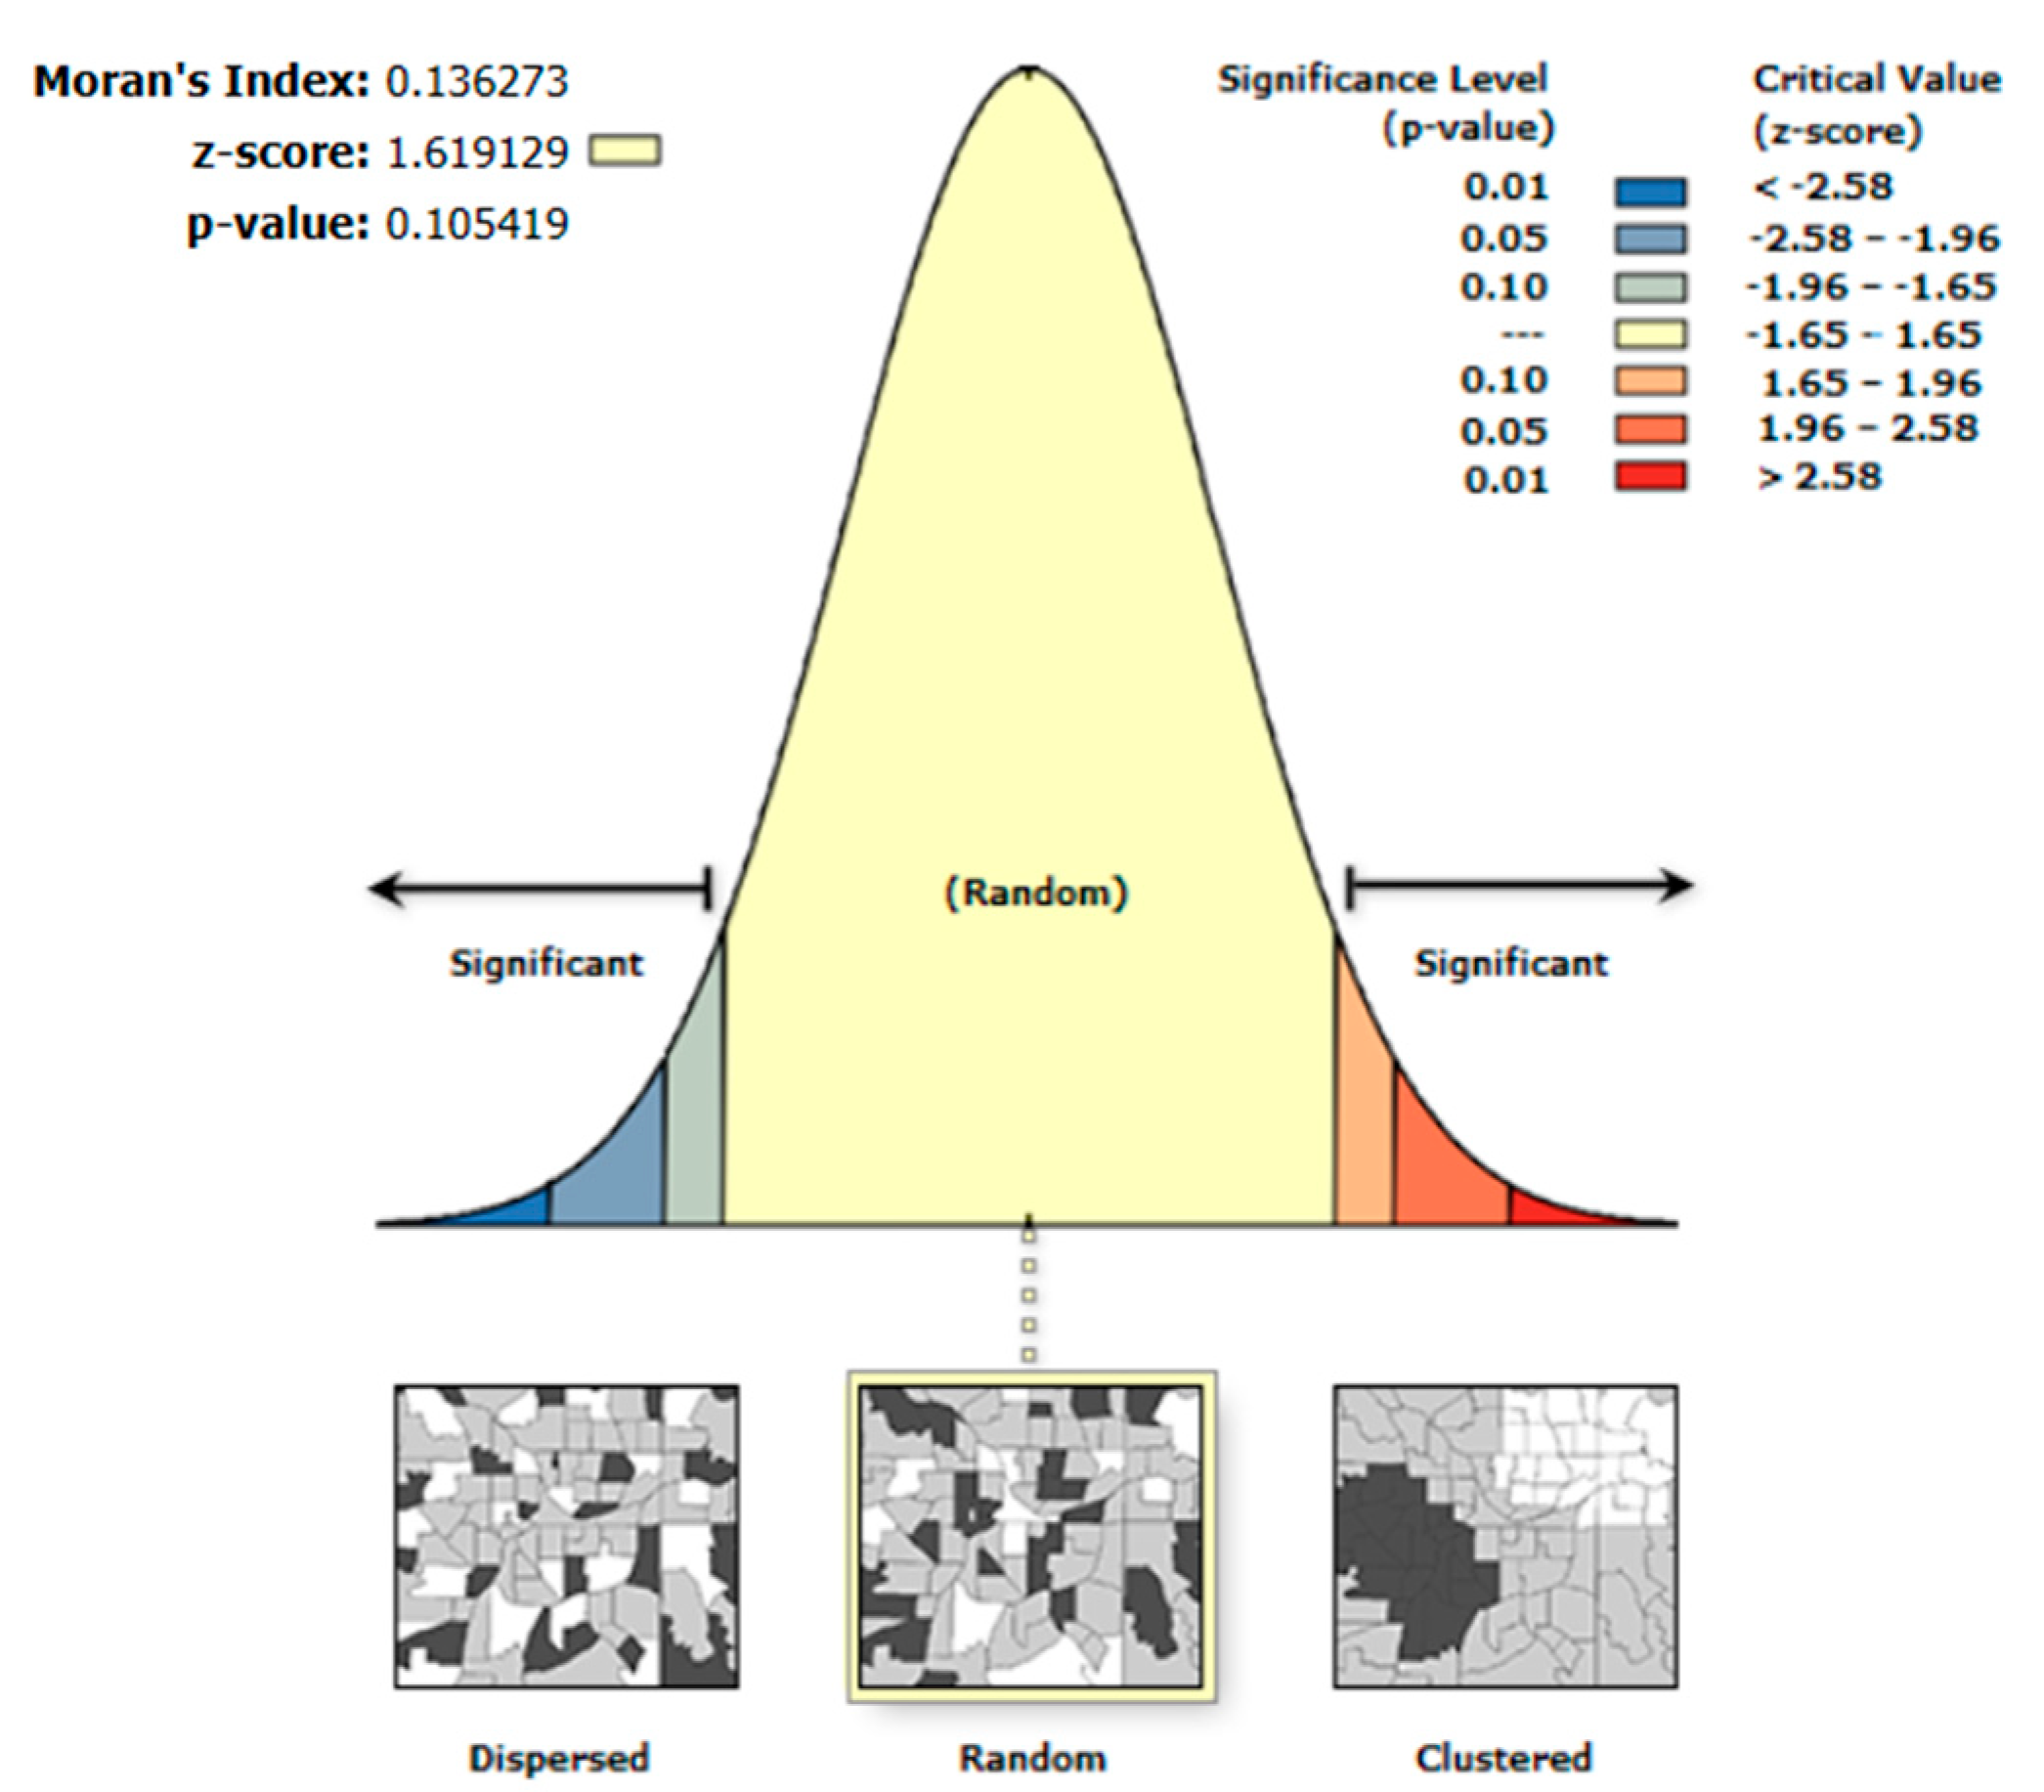
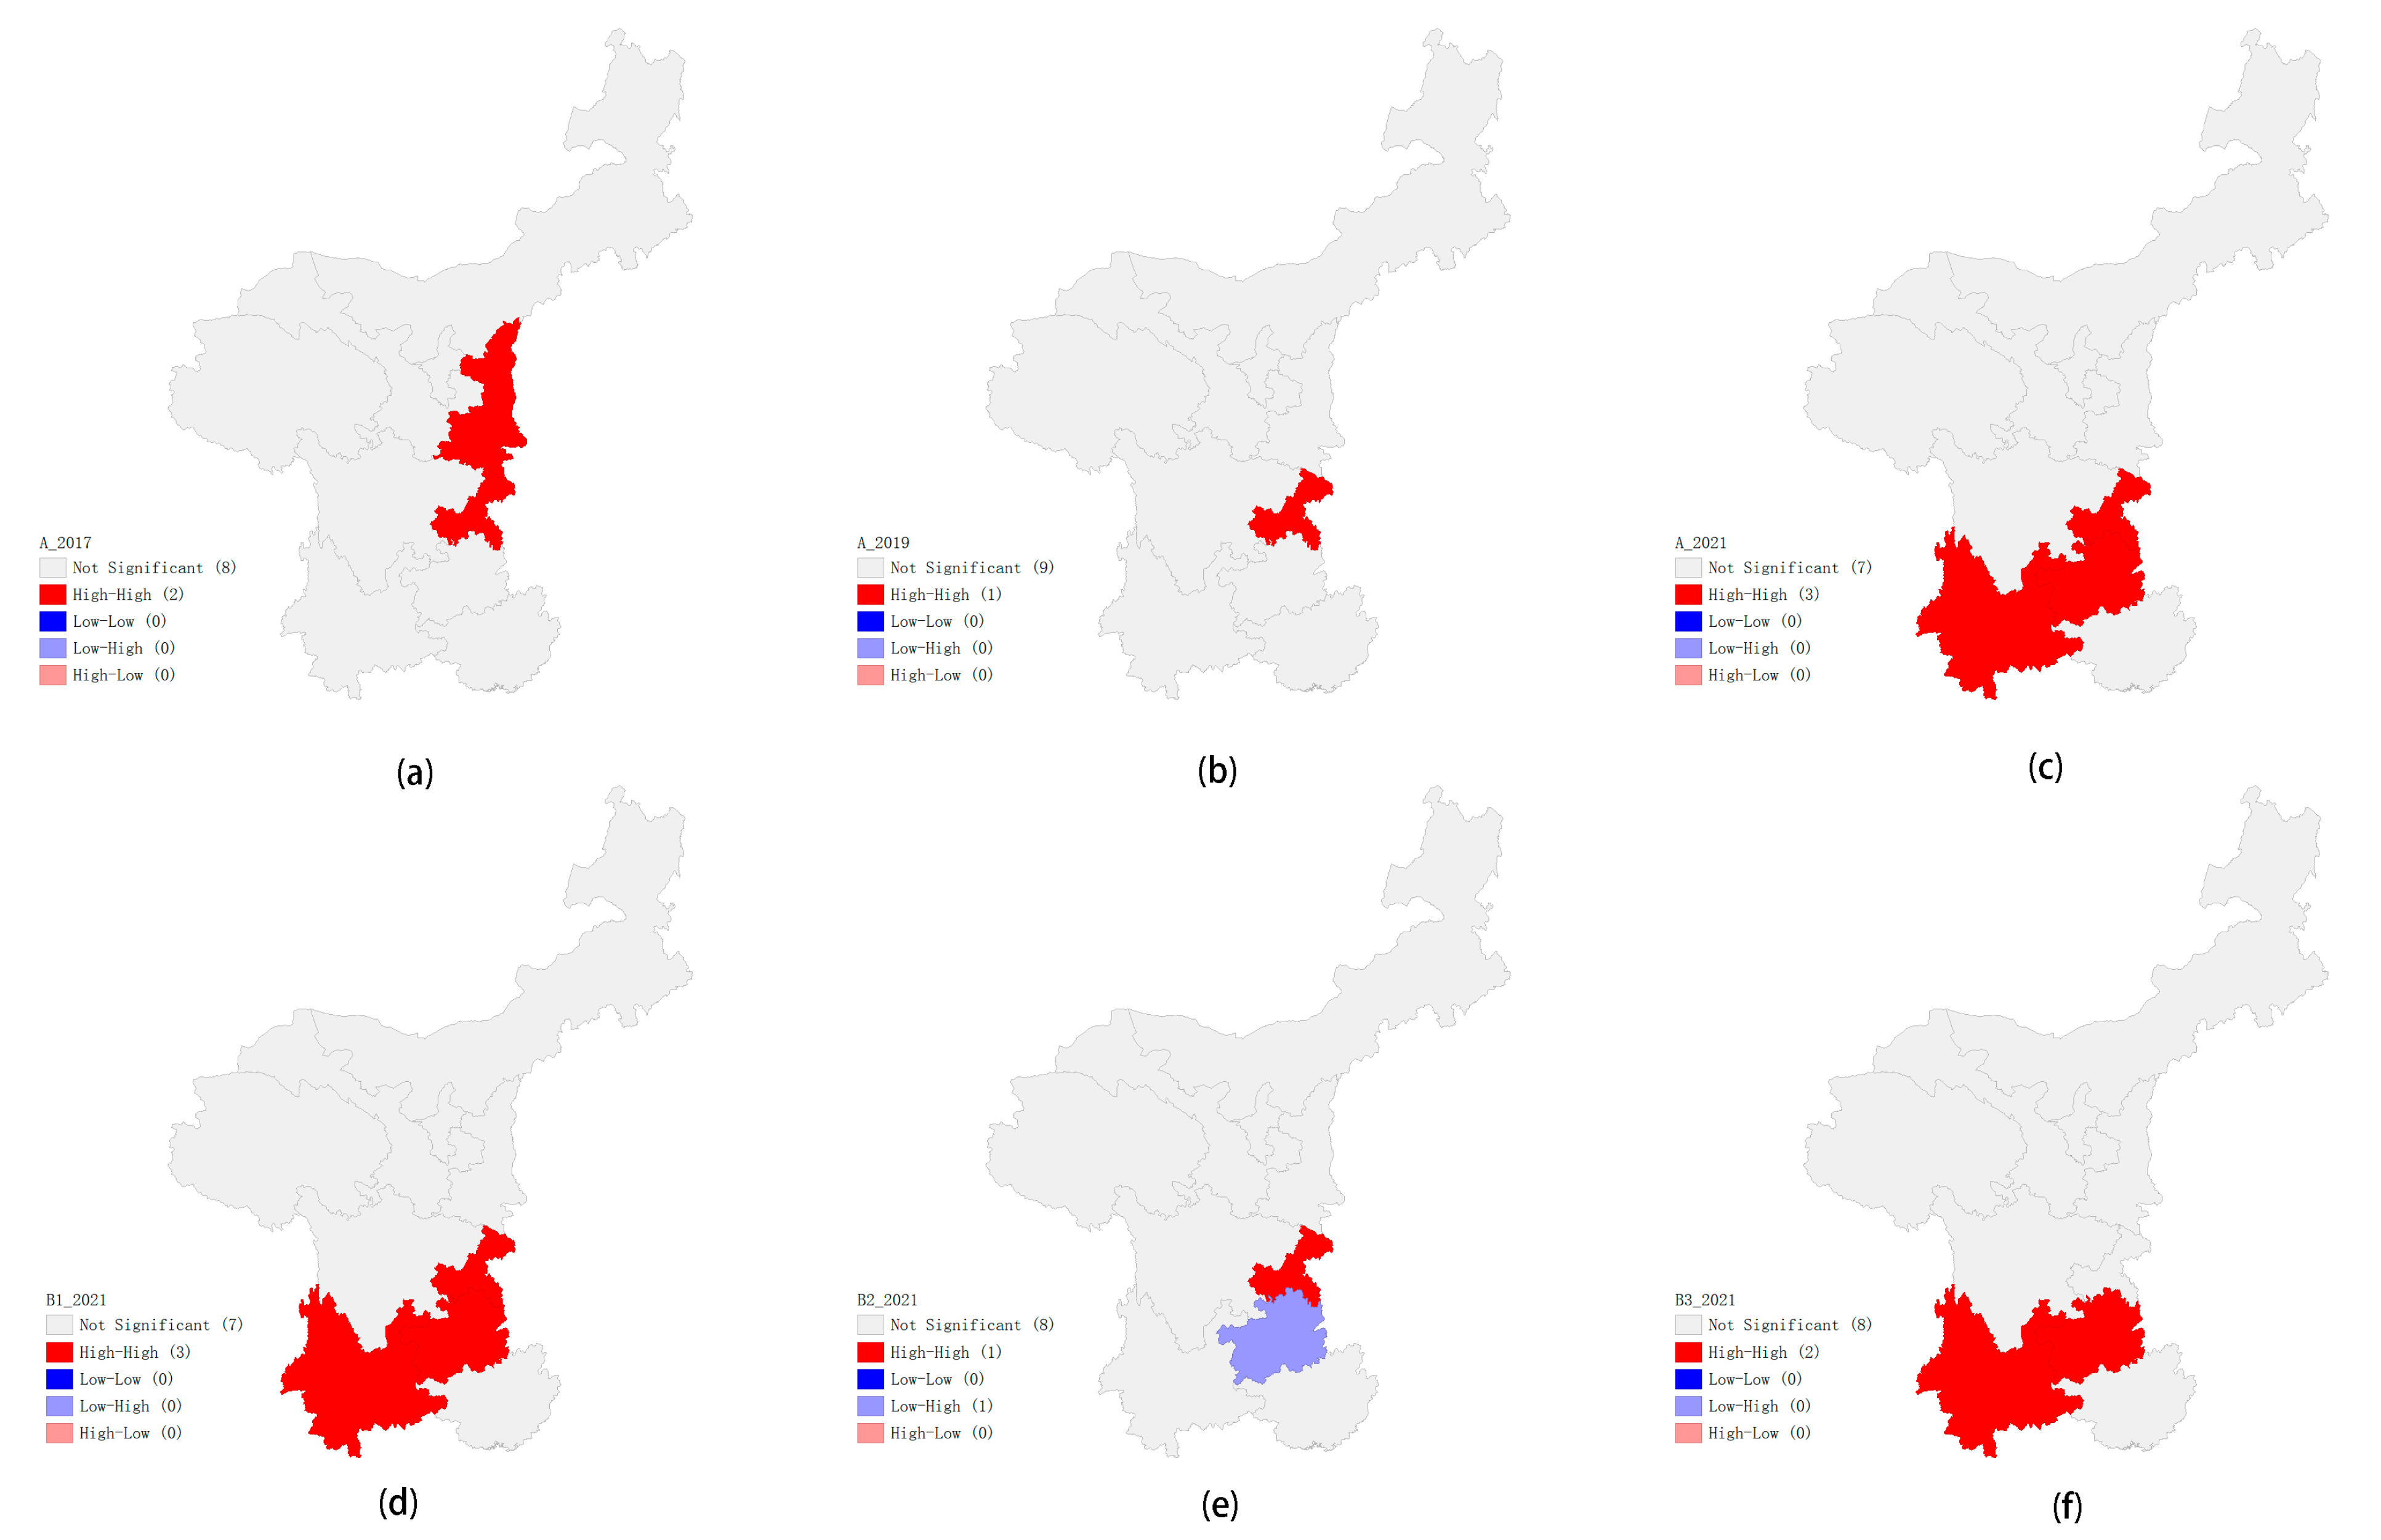
4.2.2. Spatial Correlation Analysis
4.3. Analysis of Results
5. Conclusions and Recommendations
Author Contributions
Funding
Institutional Review Board Statement
Informed Consent Statement
Data Availability Statement
Conflicts of Interest
Appendix A

| Tertiary Indicators | Unit | Indicator Description | Indicator Type |
|---|---|---|---|
| The resident-population density in built-up areas | 10,000 people/km2 | The ratio of the number of the resident population in the built-up zone to the area of the built-up zone, calculated as the number of the resident population in the built-up zone/area of the built-up zone | Positive |
| Level of basic medical insurance for urban workers | 10,000 people | Refers to the number of people who participate in corresponding basic medical insurance for urban workers according to the relevant national regulations | Positive |
| Percentage of transient population | % | The number of transient urban population as a percentage of the total urban population, calculated as the number of urban transient population/(total urban resident population + number of transient urban population) × 100% | Reverse |
| Percentage of the population with disabilities | % | The number of people with disabilities as a percentage of the total urban resident population, calculated as the number of people with disabilities in the urban resident population/total urban resident population × 100% | Reverse |
| Level of urban-health-technology talent pool | people | Refers to the number of health technicians per 10,000 residents in the city | Positive |
| Number of hospitals | Block/100 km2 | Refers to the ratio of the number of hospitals to the total area of the city’s administrative zone; calculated as the number of hospitals/total area of the city’s administrative zone | Positive |
| Social-organization-unit level | size | Refers to the number of social organization units in the city in a certain period | Positive |
| Personal-accident-insurance income | CNY 10,000 | Refers to the income from urban personal accident insurance in a certain period | Positive |
| Urban commercial insurance income | CNY 10,000 | Refers to the city’s commercial insurance revenue for a certain period | Positive |
| Number of people covered by work-injury insurance | 10,000 people | Refers to the number of persons insured against work injuries at the end of the year in a certain period | Positive |
| Land-development intensity | % | The ratio of urban-construction-land area to the total area of the urban administrative zone, calculated as urban-construction-land area/total area of urban administrative zone × 100% | Positive |
| The proportion of land area in security-vulnerable areas | % | Refers to the weak-security land area as a percentage of the built-up-zone construction-land area, calculated as weak-security-area land area/built-up-zone construction-land area × 100% | Reverse |
| Number of employees in construction-industry enterprises | 10,000 people | Refers to the number of construction enterprises employed in the city in a certain period. | Positive |
| Road-network density | % | The ratio of the road area of the municipal district to the total resident population of the municipal district, calculated as the road area of the municipal district/the total resident population of the municipal district × 100% | Positive |
| Road length per 10,000 people | km/10,000 people | The length of roads per 10,000 residents in a city, calculated as the length of roads/total resident population in a city | Positive |
| Level of urban traffic-lighting facilities | Marigold | Refers to the number of street lightis in the city in a certain period. | Positive |
| Cell-phone penetration rate | size/100 people | Refers to the average number of cell phones per 100 people in the total population of the administrative area. | Positive |
| Number of fixed-broadband households | 10,000 households | Refers to the number of households with fixed broadband in a city over a certain period. | Positive |
| Level of gas-supply facilities | Kilometers | Refers to the lengths of urban natural-gas pipelines in a certain period. | Positive |
| Level of seismic-monitoring facilities | Block/10,000 km2 | Refers to the ratio of the number of seismic stations to the total area of the urban administrative zone, calculated as the number of seismic stations/total area of the urban administrative zone (10,000 square kilometers) | Positive |
| Public coverage of meteorological disaster monitoring and forecasting early-warning information | pcs/100 km2 | Refers to the ratio of automatic weather stations to the total area of the administrative zone of the city, calculated as automatic weather stations/total area of the administrative area of the city (hundred square kilometers) | Positive |
| Urban intelligent-pipe-network density | /km | Refers to the ratio of the length of fiber-optic cable lines to the total area of the administrative zone of the city; calculated as the length of fiber-optic cable lines/total area of the administrative zone of the city | Positive |
| Shelter area per capita | m2/people | The ratio of urban emergency-shelter area to total urban resident population. calculated as urban emergency-shelter area (square meters)/total urban resident population (people) | Positive |
| Storage area of disaster-relief-reserve institutions per 10,000 people | m2/10,000 people | Refers to the ratio of the area of the emergency-supplies reserve to the total resident population of the city (10,000 people), calculated as the area of the emergency-supplies reserve (square meters)/total resident population of the city (10,000 people) | Positive |
| Number of beds in medical and health institutions per 10,000 people | pcs/10,000 people | The ratio of the number of beds in various medical and health institutions to the total urban resident population (10,000 people), calculated as the number of beds in various medical and health institutions/total urban resident population | Positive |
| Greenery coverage | % | Refers to the percentage of the total area covered by greenery in the built-up area of the city. | Positive |
| The disaster-related-death rate per million population | % | Refers to the ratio of annual disaster-related deaths to the total urban resident population (million), calculated as annual disaster-related deaths/total urban resident population (million) × 100% | Reverse |
| Annual direct economic losses due to disasters as a percentage of regional GDP | % | Refers to the ratio of annual direct economic losses due to disaster to regional GDP, calculated as annual direct economic losses due to disaster/regional GDP × 100% | Reverse |
| The mortality rate of class A and B statutory infectious diseases | The ratio of the number of deaths from class A and B infectious diseases to the total urban resident population (100,000 people), calculated as the number of deaths from class A and B infectious diseases/total urban resident population | Reverse | |
| The fire-death rate per 10,000 people | % | Refers to the annual number of fire deaths as a percentage of the total urban resident population (10,000 people), calculated as the annual number of fire deaths/total urban resident population × 100% | Reverse |
| Incidence of criminal cases per 10,000 people | The ratio of the annual number of criminal cases to the total urban resident population (10,000 people), calculated as the annual number of criminal cases/total urban resident population | Reverse | |
| Percentage of people affected in a year | % | The ratio of the annual disaster population to the total resident population of the city, calculated as annual disaster population/total resident population of the city × 100% | Reverse |
| Public-aecurity financial expenditure | CNY 100 million | Refers to the city’s public-safety financial expenditure in a certain period | Positive |
| Healthcare financial expenditure | CNY 100 million | Refers to the financial expenditure on urban healthcare in a certain period | Positive |
| Transportation financial expenditure | CNY 100 million | Refers to the financial expenditure on urban transportation in a certain period | Positive |
Appendix B
| Data Name | Unit | Chongqing | Sichuan | Guizhou | Yunnan | Shaanxi | Gansu | Qinghai | Ningxia | Guangxi | Inner Mongolia |
|---|---|---|---|---|---|---|---|---|---|---|---|
| The total area of the urban built-up zone | km2 | 1423 | 2832 | 986 | 1142 | 1287 | 869 | 200 | 458 | 1414 | 1269 |
| Number of permanent residents in the built-up zone | 10,000 people | 1121.62 | 2065.83 | 624.66 | 857.69 | 1000.46 | 532.31 | 175.08 | 233.50 | 896.60 | 670.09 |
| The population of urban workers with basic medical insurance | 10,000 people | 640.30 | 1526.40 | 410.40 | 491.30 | 619.80 | 320.20 | 94.00 | 123.50 | 556.70 | 495.10 |
| Number of temporary urban residents | 10,000 people | 504.31 | 569.72 | 128.82 | 131.50 | 98.79 | 150.67 | 23.36 | 71.04 | 252.16 | 236.20 |
| The total urban resident population | 10,000 people | 2489.92 | 4127.32 | 1371.70 | 1658.18 | 1740.14 | 895.88 | 226.85 | 341.37 | 2392.78 | 982.27 |
| Number of urban health technicians per 10,000 people | people | 79 | 85 | 156 | 146 | 116 | 87 | 220 | 106 | 91 | 130 |
| Number of hospitals | size | 749 | 2219 | 1270 | 1252 | 1150 | 526 | 212 | 209 | 589 | 720 |
| Social organization units | size | 16,824 | 42,282 | 12,700 | 23,184 | 24,725 | 27,079 | 5291 | 6548 | 24,567 | 15,116 |
| Life-insurance-premium income | CNY 100 million | 560.13 | 1441.28 | 210.05 | 357.52 | 654.8 | 254.06 | 46.86 | 109.25 | 369.13 | 390.23 |
| City commercial-insurance revenue | CNY 100 million | 744.00 | 1937.64 | 389.31 | 612.66 | 869.01 | 366.38 | 80.20 | 165.29 | 565.11 | 570.06 |
| Number of worker-compensation-insurance participants at the end of the year | 10,000 people | 504.61 | 876.04 | 332.48 | 383.67 | 459.35 | 198.58 | 64.85 | 90.35 | 388.79 | 307.76 |
| City area | km2 | 7440 | 8359 | 3184 | 3157 | 2621 | 1591 | 688 | 2159 | 5789 | 4885 |
| The total area of the city’s administrative zone | km2 | 43,263.10 | 82,433.06 | 34,176.60 | 84,818.32 | 49,054.71 | 87,442.07 | 166,331.50 | 23,697.42 | 68,539.76 | 147,077.45 |
| Area of land in areas with weak security (industrial land + logistics and storage land) | km2 | 275.57 | 521.67 | 183.18 | 159.08 | 173.12 | 201.72 | 26.65 | 56.08 | 272.93 | 209.66 |
| Construction-industry employees | 10,000 people | 224.79 | 352.83 | 77.64 | 152.72 | 137.98 | 56.88 | 11 | 12.42 | 126.15 | 27.7 |
| Road area in the city | 10,000 m2 | 19,015 | 33,979 | 8930 | 11,856 | 17,538 | 10,678 | 2753 | 6545 | 19,821 | 21,277 |
| City street lighting | size | 584,172 | 1,344,947 | 584,172 | 500,123 | 500,123 | 318,333 | 131,213 | 247,589 | 695,594 | 584,422 |
| Number of households withfixed broadband | 10,000 households | 661.40 | 1430.30 | 436.70 | 694.20 | 662.20 | 380.00 | 105.90 | 140.60 | 671.80 | 390.50 |
| Cell-phone-penetration rate | size/100 people | 106.49 | 92.67 | 97.36 | 88.08 | 110.04 | 96.22 | 102.09 | 116.16 | 89.77 | 112.36 |
| Length of natural-gas pipeline | km | 22,320 | 49,338 | 6414 | 5947 | 16,567 | 3140 | 2244 | 6279 | 5513 | 9680 |
| Total number of seismic stations | size | 10 | 112 | 7 | 250 | 93 | 100 | 39 | 17 | 81 | 67 |
| Number of automatic weather-station sites | size | 1997 | 4753 | 2948 | 3414 | 1537 | 2159 | 437 | 893 | 2399 | 1688 |
| Fiber-optic cable-line length | 10,000 km | 93.07 | 250.61 | 86.62 | 108.85 | 108.67 | 72.59 | 21.04 | 19.86 | 109.35 | 98.56 |
| Urban emergency-shelter area | km2 | 113.77 | 346.50 | 110.27 | 134.62 | 289.58 | 131.07 | 35.66 | 58.81 | 156.19 | 151.71 |
| Disaster-relief-reserve-agency storage area | km2 | 30.99 | 70.86 | 27.94 | 36.51 | 27.14 | 30.37 | 13.42 | 13.50 | 52.48 | 48.26 |
| Number of beds in various types of medical and health institution | 10,000 sheets | 76.93 | 79.48 | 144.13 | 114.25 | 87.05 | 78.18 | 175.28 | 81.04 | 63.53 | 105.13 |
| Greening coverage of built-up areas | % | 40.32 | 40.00 | 37.01 | 38.87 | 39.88 | 33.28 | 32.55 | 40.41 | 39.12 | 40.22 |
| Annual disaster-related deaths | People | 52 | 186 | 68 | 110 | 69 | 22 | 17 | 0 | 92 | 18 |
| Annual direct economic losses due to disasters | CNY 100 million | 24.50 | 153.90 | 57.60 | 76.60 | 162.90 | 105.10 | 17.40 | 12.00 | 99.00 | 126.50 |
| Gross city product | CNY 100 million | 20,066.30 | 37,905.10 | 13,605.40 | 18,486.00 | 21,473.50 | 7336.70 | 2465.10 | 3200.30 | 17,790.70 | 14,898.10 |
| Number of people affected in the city | 10,000 people | 163.87 | 218.41 | 253.80 | 291.16 | 399.12 | 321.54 | 110.17 | 138.48 | 180.81 | 466.86 |
| Public-security financial rxpenditure | CNY 100 million | 235.91 | 471.42 | 268.09 | 343.26 | 241.82 | 170.38 | 90.04 | 64.59 | 283.17 | 250.09 |
| Healthcare financial expenditure | CNY 100 million | 353.79 | 831.46 | 436.21 | 546.99 | 418.27 | 289.24 | 125.21 | 97.98 | 512.31 | 323.48 |
| Transportation financial expenditure | CNY 100 million | 287.97 | 526.68 | 336.91 | 511.24 | 304.03 | 285.75 | 95.38 | 100.82 | 244.09 | 344.38 |
| Data Name | Unit | Chongqing | Sichuan | Guizhou | Yunnan | Shaanxi | Gansu | Qinghai | Ningxia | Guangxi | Inner Mongolia |
|---|---|---|---|---|---|---|---|---|---|---|---|
| The total area of the urban built-up zone | km2 | 1515.41 | 3054.31 | 1085.52 | 1217.60 | 1357.51 | 875.72 | 215.19 | 489.05 | 1542.78 | 1269.74 |
| Number of permanent residents in the built-up zone | 10,000 people | 1185.60 | 2214.03 | 681.49 | 890.89 | 1159.30 | 535.73 | 180.19 | 223.96 | 930.87 | 678.97 |
| The population of urban workers with basic medical insurance | 10,000 people | 720.60 | 1778.10 | 462.00 | 528.00 | 712.90 | 344.30 | 103.70 | 141.10 | 620.50 | 530.70 |
| Number of temporary urban residents | 10,000 people | 478.10 | 550.99 | 155.34 | 173.47 | 131.87 | 136.32 | 19.46 | 70.10 | 312.21 | 256.68 |
| The total urban resident population | 10,000 people | 2566.51 | 4171.90 | 1459.73 | 1720.00 | 1988.31 | 909.54 | 232.58 | 345.31 | 2417.75 | 998.07 |
| Number of urban health technicians per 10,000 people | people | 93 | 95 | 94 | 138 | 110 | 102 | 133 | 111 | 94 | 144 |
| Number of hospitals | size | 846 | 2417 | 1340 | 1376 | 1208 | 719 | 220 | 219 | 678 | 794 |
| Social-organization units | size | 17,553 | 44,932 | 13,753 | 23,640 | 30,548 | 24,644 | 6084 | 6083 | 27,118 | 16,998 |
| Life-insurance-premium income | CNY 100 million | 696.24 | 1635.33 | 265.85 | 445.07 | 816.25 | 306.34 | 56.68 | 129.51 | 448.14 | 516.86 |
| City commercial-insurance revenue | CNY 100 million | 916.46 | 2148.66 | 489.26 | 742.10 | 1033.49 | 444.32 | 98.44 | 197.67 | 664.92 | 729.82 |
| Number of worker-compensation-insurance participants at the end of the year | 10,000 people | 661.67 | 1177.14 | 408.51 | 438.51 | 577.42 | 244.10 | 73.99 | 119.58 | 442.23 | 338.24 |
| City area | km2 | 7660 | 8610 | 3651 | 3204 | 2431 | 1978 | 696 | 952 | 5814 | 5082 |
| The total area of the city’s administrative zone | km2 | 43,263.52 | 85,091.09 | 36,217.91 | 87,343.65 | 53,039.80 | 88,539.17 | 197,504.60 | 22,201.63 | 70,298.38 | 148,649.07 |
| Area of land in areas of weak security (industrial land plus logistics and storage land) | km2 | 294.09 | 558.56 | 200.1 | 162.29 | 207.83 | 242.03 | 31.28 | 59.3 | 253.11 | 198.61 |
| Construction-industry employees | 10,000 people | 216.18 | 351.36 | 80 | 141.54 | 145.21 | 50.85 | 8.1 | 11.25 | 141.94 | 20.52 |
| Road area in the city | 10,000 m2 | 22,160 | 42,936 | 11,786 | 15,050 | 21,039 | 12,450 | 3797 | 7625 | 26,726 | 21,571 |
| City-street lighting | size | 775,469 | 1,550,215 | 626,167 | 623,986 | 824,590 | 354,166 | 146,458 | 238,104 | 654,416 | 576,538 |
| Number of households withfixed broadband | 10,000 households | 920.40 | 1830.70 | 715.60 | 783.90 | 878.20 | 548.70 | 130.30 | 204.90 | 845.90 | 594.80 |
| Cell-phone penetration rate | size/100 people | 117.75 | 112.76 | 111.78 | 100.10 | 119.72 | 103.92 | 110.73 | 119.24 | 103.38 | 118.59 |
| Length of natural-gas pipelines | km | 23,613 | 57,055 | 7816 | 7904 | 21,514 | 3817 | 2500 | 6906 | 8456 | 10,145 |
| Total number of seismic stations | size | 48 | 113 | 21 | 262 | 98 | 101 | 39 | 15 | 83 | 67 |
| Number of automatic weather-station sites | size | 1805 | 5079 | 3026 | 2583 | 1575 | 1575 | 527 | 866 | 2303 | 1658 |
| Fiber-optic cable-line length | 10,000 km | 120.18 | 332.86 | 115.09 | 200.29 | 153.21 | 88.78 | 32.49 | 24.02 | 175.85 | 130.99 |
| Urban emergency-shelter area | km2 | 126.67 | 380.67 | 105.37 | 168.92 | 228.07 | 113.59 | 39.74 | 82.11 | 248.61 | 151.06 |
| Disaster-relief-reserve-agency storage area | km2 | 31.46 | 76.17 | 37.78 | 35.57 | 33.27 | 41.56 | 16.79 | 13.87 | 46.65 | 51.28 |
| Number of beds in various types of medical and health institution | 10,000 sheets | 87.85 | 86.02 | 81.61 | 104.14 | 80.46 | 90.81 | 105.52 | 79.31 | 66.12 | 113.87 |
| Greening coverage of built-up areas | % | 41.82 | 41.85 | 39.42 | 39.73 | 39.32 | 36.03 | 35.21 | 41.34 | 40.76 | 40.52 |
| Annual disaster-related deaths | People | 27 | 159 | 76 | 70 | 52 | 22 | 9 | 3 | 104 | 8 |
| Annual direct economic losses due to disasters | CNY 100 million | 19.60 | 340.90 | 47.00 | 102.10 | 58.80 | 46.50 | 14.30 | 2.90 | 100.50 | 46.80 |
| Gross city product | CNY 100 million | 23,605.77 | 46,363.80 | 16,769.34 | 23,223.75 | 25,793.17 | 8718.30 | 2941.10 | 3748.48 | 21,237.14 | 17,212.53 |
| Number of people affected in the city | 10,000 people | 145.90 | 487.60 | 277.20 | 949.40 | 458.80 | 224.50 | 86.90 | 14.60 | 356.00 | 220.70 |
| Public-security financial expenditure | CNY 100 million | 268.66 | 525.64 | 280.06 | 382.83 | 285.90 | 191.29 | 89.57 | 66.74 | 312.18 | 249.06 |
| Healthcare financial expenditure | CNY 100 million | 383.26 | 943.27 | 534.78 | 608.50 | 466.29 | 326.41 | 148.23 | 106.49 | 565.29 | 322.18 |
| Transportation financial expenditure | CNY 100 million | 292.35 | 687.83 | 347.79 | 542.81 | 283.94 | 360.35 | 172.6 | 88.87 | 219.49 | 403.38 |
| Data Name | Unit | Chongqing | Sichuan | Guizhou | Yunnan | Shaanxi | Gansu | Qinghai | Ningxia | Guangxi | Inner Mongolia |
|---|---|---|---|---|---|---|---|---|---|---|---|
| The total area of the urban built-up zone | km2 | 1645 | 3367 | 1187 | 1252 | 1527 | 928 | 249 | 495 | 1679 | 1271 |
| Number of permanent residents in the built-up zone | 10,000 people | 1322.63 | 2514.51 | 726.22 | 771.19 | 1255.46 | 528.60 | 191.22 | 230.65 | 1027.68 | 682.13 |
| The population of urban workers with basic medical insurance | 10,000 people | 795.90 | 1945.80 | 479.40 | 569.20 | 783.80 | 372.30 | 114.80 | 159.60 | 714.80 | 564.70 |
| Number of temporary urban residents | 10,000 people | 429.54 | 864.43 | 184.76 | 193.73 | 179.90 | 181.82 | 19.27 | 68.31 | 345.08 | 276.07 |
| The total urban resident population | 10,000 people | 2649.83 | 4545.90 | 1651.81 | 1802.95 | 2132.88 | 901.43 | 297.88 | 439.87 | 2677.08 | 914.01 |
| Number of urban health technicians per 10,000 people | people | 77 | 100 | 102 | 120 | 102 | 111 | 125 | 104 | 103 | 116 |
| Number of hospitals | size | 858 | 2481 | 1449 | 1405 | 1270 | 699 | 222 | 213 | 803 | 806 |
| Social-organization units | size | 18,561 | 45,535 | 14,742 | 23,011 | 31,210 | 21,554 | 5997 | 5070 | 29,485 | 17,288 |
| Life-insurance-premium income | CNY 100 million | 751.75 | 1647.57 | 281.6 | 428.13 | 797.66 | 359.33 | 62.03 | 145.79 | 539.37 | 440.18 |
| City commercial-insurance revenue | CNY 100 million | 965.50 | 2204.91 | 496.26 | 690.20 | 1052.37 | 490.32 | 106.89 | 211.14 | 780.60 | 645.56 |
| Number of worker-compensation-insurance participants at the end of the year | 10,000 people | 765.73 | 1472.06 | 529.94 | 541.91 | 629.61 | 278.74 | 95.93 | 143.79 | 551.31 | 338.22 |
| City area | km2 | 7781 | 9314 | 4049 | 3304 | 2619 | 2022 | 739 | 956 | 5306 | 4566 |
| The total area of the city’s administrative zone | km2 | 43,263.52 | 92,234.06 | 41,808.54 | 91,678.06 | 56,687.11 | 89,281.63 | 203,423.45 | 21,889.03 | 78,641.38 | 148,694.54 |
| Area of land in areas of weak security (industrial land + logistics and storage land) | km2 | 358.01 | 616.55 | 183.47 | 170.32 | 202.2 | 245.27 | 36.61 | 58.83 | 283.21 | 158.24 |
| Construction-industry employees | 10,000 people | 205.54 | 364.57 | 71.58 | 120.21 | 129.83 | 46.01 | 6.01 | 11.09 | 118.51 | 15.49 |
| Road area in the city | 10,000 m2 | 26,320 | 56,342 | 20,027 | 18,536 | 24,556 | 15,074 | 4133 | 8193 | 32,100 | 23,057 |
| City-street lighting | size | 899,100 | 2,166,500 | 820,600 | 761,700 | 852,900 | 434,900 | 152,600 | 248,100 | 831,100 | 622,300 |
| Number of households withfixed broadband | 10,000 households | 984.30 | 2013.90 | 815.20 | 989.40 | 1213.60 | 661.30 | 152.10 | 246.90 | 1043.90 | 701.50 |
| Cell-phone penetration rate | size/100 people | 116.77 | 111.55 | 110.85 | 107.58 | 120.83 | 110.23 | 114.56 | 119.46 | 109.42 | 125.71 |
| Length of natural-gas pipeline | km | 242,66 | 75,350 | 9938 | 9760 | 28,700 | 4625 | 4666 | 7566 | 12,985 | 11,891 |
| Total number of seismic stations | size | 57 | 417 | 28 | 798 | 245 | 460 | 119 | 89 | 135 | 148 |
| Number of automatic weather-station sites | size | 1805 | 5472 | 2722 | 2711 | 1952 | 1478 | 549 | 861 | 2484 | 1727 |
| Fiber-optic cable-line length | 10,000 km | 141.53 | 374.80 | 134.61 | 237.13 | 179.57 | 104.26 | 37.00 | 29.38 | 243.05 | 157.78 |
| Urban emergency-shelter area | km2 | 127.39 | 410.36 | 103.25 | 153.43 | 211.91 | 117.05 | 44.25 | 91.81 | 285.74 | 177.88 |
| Disaster-relief-reserve-agency storage area | km2 | 36.62 | 85.97 | 30.57 | 41.44 | 32.33 | 41.99 | 13.47 | 10.05 | 51.79 | 34.58 |
| Number of beds in various types of medical and health institution | 10,000 sheets | 71.03 | 87 | 90.73 | 86.17 | 83.5 | 85.8 | 90.64 | 67.9 | 73.91 | 88.28 |
| Greening coverage of built-up areas | % | 42.60 | 43.10 | 41.80 | 42.50 | 41.80 | 36.30 | 34.80 | 42.00 | 40.20 | 42.00 |
| Annual disaster-related deaths | People | 19 | 31 | 5 | 38 | 56 | 1 | 13 | 2 | 7 | 23 |
| Annual direct economic losses due to disasters | CNY 100 million | 29.80 | 248.70 | 30.20 | 104.90 | 317.30 | 67.30 | 45.70 | 13.70 | 22.80 | 76.40 |
| Gross city product | CNY 100 million | 27,894.00 | 53,850.80 | 19,586.40 | 27,146.80 | 29,801.00 | 10,243.30 | 3346.60 | 4522.30 | 24,740.90 | 20,514.20 |
| Number of people affected in the city | 10,000 people | 140.00 | 714.30 | 244.60 | 791.50 | 834.50 | 389.10 | 49.50 | 132.20 | 261.10 | 232.10 |
| Public-security financial expenditure | CNY 100 million | 273.20 | 531.89 | 274.27 | 375.60 | 289.72 | 193.55 | 93.90 | 63.95 | 288.38 | 249.79 |
| Healthcare financial expenditure | CNY 100 million | 427.72 | 1044.14 | 542.07 | 725.99 | 565.72 | 390.38 | 176.33 | 110.72 | 613.75 | 362.73 |
| Transportation financial expenditure | CNY 100 million | 277.44 | 717.35 | 336.45 | 601.4 | 325.83 | 287.29 | 189.44 | 84.35 | 335.51 | 345.99 |
Appendix C
| Indicators | Unit | Chongqing | Sichuan | Guizhou | Yunnan | Shaanxi | Gansu | Qinghai | Ningxia | Guangxi | Inner Mongolia |
|---|---|---|---|---|---|---|---|---|---|---|---|
| The resident population density in built-up areas | 10,000 people/km2 | 0.79 | 0.73 | 0.63 | 0.75 | 0.78 | 0.61 | 0.88 | 0.51 | 0.63 | 0.53 |
| Level of basic medical insurance for urban workers | 10,000 people | 640.3 | 1526.4 | 410.4 | 491.3 | 619.8 | 320.2 | 94 | 123.5 | 556.7 | 495.1 |
| Percentage of transient population | % | 16.84 | 12.13 | 8.59 | 7.35 | 5.37 | 14.40 | 9.34 | 17.23 | 9.53 | 19.38 |
| Level of urban-health-technology talent pool | People | 79 | 85 | 156 | 146 | 116 | 87 | 220 | 106 | 91 | 130 |
| Number of hospitals | Block/100 km2 | 1.73 | 2.69 | 3.72 | 1.48 | 2.34 | 0.60 | 0.13 | 0.88 | 0.86 | 0.49 |
| Social-organization-unit level | size | 16,824 | 42,282 | 12,700 | 23,184 | 24,725 | 27,079 | 5291 | 6548 | 24,567 | 15,116 |
| Personal accident insurance income | CNY 100 million | 560.13 | 1441.28 | 210.05 | 357.52 | 654.8 | 254.06 | 46.86 | 109.25 | 369.13 | 390.23 |
| Urban commercial insurance income | CNY 100 million | 744 | 1937.64 | 389.31 | 612.66 | 869.01 | 366.38 | 80.2 | 165.29 | 565.11 | 570.06 |
| Number of people covered by work-injury insurance | 10,000 people | 504.61 | 876.04 | 332.48 | 383.67 | 459.35 | 198.58 | 64.85 | 90.35 | 388.79 | 307.76 |
| Land-development intensity | % | 17.20 | 10.14 | 9.32 | 3.72 | 5.34 | 1.82 | 0.41 | 9.11 | 8.45 | 3.32 |
| The proportion of land area in security-vulnerable zones | % | 19.37 | 18.42 | 18.58 | 13.93 | 13.45 | 23.21 | 13.33 | 12.24 | 19.30 | 16.52 |
| Number of employees in construction-industry enterprises | 10,000 people | 224.79 | 352.83 | 77.64 | 152.72 | 137.98 | 56.88 | 11 | 12.42 | 126.15 | 27.7 |
| Road-network density | % | 43.95 | 41.22 | 26.13 | 13.98 | 35.75 | 12.21 | 1.66 | 27.62 | 28.92 | 14.47 |
| Level of urban traffic-lighting facilities | Size | 584,172 | 1,344,947 | 584,172 | 500,123 | 500,123 | 318,333 | 131,213 | 247,589 | 695,594 | 584,422 |
| Cell-phone penetration rate | Department/100 people | 106.49 | 92.67 | 97.36 | 88.08 | 110.04 | 96.22 | 102.09 | 116.16 | 89.77 | 112.36 |
| Number of fixed-broadband households | 10,000 households | 661.4 | 1430.3 | 436.7 | 694.2 | 662.2 | 380 | 105.9 | 140.6 | 671.8 | 390.5 |
| Level of gas-supply facilities | km | 22,320 | 49,338 | 6414 | 5947 | 16,567 | 3140 | 2244 | 6279 | 5513 | 9680 |
| Level of seismic-monitoring facilities | Block/10,000 km2 | 2.31 | 13.59 | 2.05 | 29.47 | 18.96 | 11.44 | 2.34 | 7.17 | 11.82 | 4.56 |
| Public coverage of meteorological disaster monitoring and forecasting early-warning information | pcs/100 km2 | 4.62 | 5.77 | 8.63 | 4.03 | 3.13 | 2.47 | 0.26 | 3.77 | 3.50 | 1.15 |
| Urban intelligent-pipe-network density | /km | 21.51 | 30.40 | 25.34 | 12.83 | 22.15 | 8.30 | 1.26 | 8.38 | 15.95 | 6.70 |
| Shelter area per capita | m2/people | 4.57 | 8.40 | 8.04 | 8.12 | 16.64 | 14.63 | 15.72 | 17.23 | 6.53 | 15.44 |
| Storage area of disaster-relief-reserve institutions per 10,000 people | m2/10,000 people | 12,446.18 | 17,168.53 | 20,368.89 | 22,018.12 | 15,596.45 | 33,899.63 | 59,158.03 | 39,546.53 | 21,932.65 | 49,131.09 |
| Number of beds in medical and health institutions per 10,000 people | Size/10,000 people | 76.93 | 79.48 | 144.13 | 114.25 | 87.05 | 78.18 | 175.28 | 81.04 | 63.53 | 105.13 |
| Greenery coverage | % | 40.32 | 40.00 | 37.01 | 38.87 | 39.88 | 33.28 | 32.55 | 40.41 | 39.12 | 40.22 |
| The disaster-related death rate per million population | % | 0.02 | 0.05 | 0.05 | 0.07 | 0.04 | 0.02 | 0.07 | 0.00 | 0.04 | 0.02 |
| Annual direct economic losses due to disasters as a percentage of regional GDP | % | 0.12 | 0.41 | 0.42 | 0.41 | 0.76 | 1.43 | 0.71 | 0.37 | 0.56 | 0.85 |
| Percentage of people affected in a year | % | 6.58 | 5.29 | 18.50 | 17.56 | 22.94 | 35.89 | 48.57 | 40.57 | 7.56 | 47.53 |
| Public-security financial expenditure | CNY 100 million | 235.91 | 471.42 | 268.09 | 343.26 | 241.82 | 170.38 | 90.04 | 64.59 | 283.17 | 250.09 |
| Healthcare financial expenditure | CNY 100 million | 353.79 | 526.68 | 336.91 | 511.24 | 304.03 | 285.75 | 95.38 | 100.82 | 244.09 | 344.38 |
| Transportation financial expenditure | CNY 100 million | 287.97 | 218.41 | 253.80 | 291.16 | 399.12 | 321.54 | 110.17 | 138.48 | 180.81 | 466.86 |
| Indicators | Unit | Chongqing | Sichuan | Guizhou | Yunnan | Shaanxi | Gansu | Qinghai | Ningxia | Guangxi | Inner Mongolia |
|---|---|---|---|---|---|---|---|---|---|---|---|
| The resident population density in built-up areas | 10,000 people/km2 | 0.78 | 0.72 | 0.63 | 0.73 | 0.85 | 0.61 | 0.84 | 0.46 | 0.60 | 0.53 |
| Level of basic medical insurance for urban workers | 10,000 people | 720.6 | 1778.1 | 462 | 528 | 712.9 | 344.3 | 103.7 | 141.1 | 620.5 | 530.7 |
| Percentage of transient population | % | 15.70 | 11.67 | 9.62 | 9.16 | 6.22 | 13.03 | 7.72 | 16.87 | 11.44 | 20.46 |
| Level of urban-health-technology talent pool | People | 93 | 95 | 94 | 138 | 110 | 102 | 133 | 111 | 94 | 144 |
| Number of hospitals | Block/100 km2 | 1.96 | 2.84 | 3.70 | 1.58 | 2.28 | 0.81 | 0.11 | 0.99 | 0.96 | 0.53 |
| Social-organization-unit level | size | 17,553 | 44,932 | 13,753 | 23,640 | 30,548 | 24,644 | 6084 | 6083 | 27,118 | 16,998 |
| Personal accident insurance income | CNY 100 million | 696.24 | 1635.33 | 265.85 | 445.07 | 816.25 | 306.34 | 56.68 | 129.51 | 448.14 | 516.86 |
| Urban commercial insurance income | CNY 100 million | 916.46 | 2148.66 | 489.26 | 742.1 | 1033.49 | 444.32 | 98.44 | 197.67 | 664.92 | 729.82 |
| Number of people covered by work-injury insurance | 10,000 people | 661.67 | 1177.14 | 408.51 | 438.51 | 577.42 | 244.1 | 73.99 | 119.58 | 442.23 | 338.24 |
| Land-development intensity | % | 17.71 | 10.12 | 10.08 | 3.67 | 4.58 | 2.23 | 0.35 | 4.29 | 8.27 | 3.42 |
| The proportion of land area in security-vulnerable zones | % | 19.41 | 18.29 | 18.43 | 13.33 | 15.31 | 27.64 | 14.54 | 12.13 | 16.41 | 15.64 |
| Number of employees in construction-industry enterprises | 10,000 people | 216.18 | 351.36 | 80 | 141.54 | 145.21 | 50.85 | 8.1 | 11.25 | 141.94 | 20.52 |
| Road-network density | % | 51.22 | 50.46 | 32.54 | 17.23 | 39.67 | 14.06 | 1.92 | 34.34 | 38.02 | 14.51 |
| Level of urban traffic-lighting facilities | Size | 775,469 | 1,550,215 | 626,167 | 623,986 | 824,590 | 354,166 | 146,458 | 238,104 | 654,416 | 576,538 |
| Cell-phone penetration rate | Department/100 people | 117.75 | 112.76 | 111.78 | 100.1 | 119.72 | 103.92 | 110.73 | 119.24 | 103.38 | 118.59 |
| Number of fixed-broadband households | 10,000 households | 920.4 | 1830.7 | 715.6 | 783.9 | 878.2 | 548.7 | 130.3 | 204.9 | 845.9 | 594.8 |
| Level of gas-supply facilities | km | 23,613 | 57,055 | 7816 | 7904 | 21,514 | 3817 | 2500 | 6906 | 8456 | 10,145 |
| Level of seismic-monitoring facilities | Block/10,000 km2 | 11.09 | 13.28 | 5.80 | 30.00 | 18.48 | 11.41 | 1.97 | 6.76 | 11.81 | 4.51 |
| Public coverage of meteorological disaster monitoring and forecasting early-warning information | pcs/100 km2 | 4.17 | 5.97 | 8.35 | 2.96 | 2.97 | 1.78 | 0.27 | 3.90 | 3.28 | 1.12 |
| Urban intelligent-pipe-network density | /km | 27.78 | 39.12 | 31.78 | 22.93 | 28.89 | 10.03 | 1.65 | 10.82 | 25.01 | 8.81 |
| Shelter area per capita | m2/people | 4.94 | 9.12 | 7.22 | 9.82 | 11.47 | 12.49 | 17.09 | 23.78 | 10.28 | 15.14 |
| Storage area of disaster-relief-reserve institutions per 10,000 people | m2/10,000 people | 12,257.89 | 18,257.87 | 25,881.50 | 20,680.23 | 16,732.80 | 45,693.43 | 72190.21 | 40,166.81 | 19,294.80 | 51,379.16 |
| Number of beds in medical and health institutions per 10,000 people | Size/10,000 people | 87.85 | 86.02 | 81.61 | 104.14 | 80.46 | 90.81 | 105.52 | 79.31 | 66.12 | 113.87 |
| Greenery coverage | % | 41.82 | 41.85 | 39.42 | 39.73 | 39.32 | 36.03 | 35.21 | 41.34 | 40.76 | 40.52 |
| The disaster-related death rate per million population | % | 0.01 | 0.04 | 0.05 | 0.04 | 0.03 | 0.02 | 0.04 | 0.01 | 0.04 | 0.01 |
| Annual direct economic losses due to disasters as a percentage of regional GDP | % | 0.08 | 0.74 | 0.28 | 0.44 | 0.23 | 0.53 | 0.49 | 0.08 | 0.47 | 0.27 |
| Percentage of people affected in a year | % | 5.68 | 11.69 | 18.99 | 55.20 | 23.07 | 24.68 | 37.36 | 4.23 | 14.72 | 22.11 |
| Public-security financial expenditure | CNY 100 million | 268.66 | 525.64 | 280.06 | 382.83 | 285.9 | 191.29 | 89.57 | 66.74 | 312.18 | 249.06 |
| Healthcare financial expenditure | CNY 100 million | 383.26 | 687.83 | 347.79 | 542.81 | 283.94 | 360.35 | 172.6 | 88.87 | 219.49 | 403.38 |
| Transportation financial expenditure | CNY 100 million | 292.35 | 487.60 | 277.20 | 949.40 | 458.80 | 224.50 | 86.90 | 14.60 | 356.00 | 220.70 |
| Indicators | Unit | Chongqing | Sichuan | Guizhou | Yunnan | Shaanxi | Gansu | Qinghai | Ningxia | Guangxi | Inner Mongolia |
|---|---|---|---|---|---|---|---|---|---|---|---|
| The resident population density in built-up areas | 10,000 people/km2 | 0.80 | 0.75 | 0.61 | 0.62 | 0.82 | 0.57 | 0.77 | 0.47 | 0.61 | 0.54 |
| Level of basic medical insurance for urban workers | 10,000 people | 795.9 | 1945.8 | 479.4 | 569.2 | 783.8 | 372.3 | 114.8 | 159.6 | 714.8 | 564.7 |
| Percentage of transient population | % | 13.95 | 15.98 | 10.06 | 9.70 | 7.78 | 16.78 | 6.08 | 13.44 | 11.42 | 23.20 |
| Level of urban-health-technology talent pool | People | 77 | 100 | 102 | 120 | 102 | 111 | 125 | 104 | 103 | 116 |
| Number of hospitals | Block/100 km2 | 1.98 | 2.69 | 3.47 | 1.53 | 2.24 | 0.78 | 0.11 | 0.97 | 1.02 | 0.54 |
| Social-organization-unit level | size | 18,561 | 45,535 | 14,742 | 23,011 | 31,210 | 21,554 | 5997 | 5070 | 29,485 | 17,288 |
| Personal accident insurance income | CNY 100 million | 751.75 | 1647.57 | 281.6 | 428.13 | 797.66 | 359.33 | 62.03 | 145.79 | 539.37 | 440.18 |
| Urban commercial insurance income | CNY 100 million | 965.5 | 2204.91 | 496.26 | 690.2 | 1052.37 | 490.32 | 106.89 | 211.14 | 780.6 | 645.56 |
| Number of people covered by work-injury insurance | 10,000 people | 765.73 | 1472.06 | 529.94 | 541.91 | 629.61 | 278.74 | 95.93 | 143.79 | 551.31 | 338.22 |
| Land-development intensity | % | 17.99 | 10.10 | 9.68 | 3.60 | 4.62 | 2.26 | 0.36 | 4.37 | 6.75 | 3.07 |
| The proportion of land area in security-vulnerable zones | % | 21.76 | 18.31 | 15.46 | 13.60 | 13.24 | 26.43 | 14.70 | 11.88 | 16.87 | 12.45 |
| Number of employees in construction-industry enterprises | 10,000 people | 205.54 | 364.57 | 71.58 | 120.21 | 129.83 | 46.01 | 6.01 | 11.09 | 118.51 | 15.49 |
| Road-network density | % | 60.84 | 61.09 | 47.90 | 20.22 | 43.32 | 16.88 | 2.03 | 37.43 | 40.82 | 15.51 |
| Level of urban traffic-lighting facilities | Size | 899,100 | 2,166,500 | 820,600 | 761,700 | 852,900 | 434,900 | 152,600 | 248,100 | 831,100 | 622,300 |
| Cell-phone penetration rate | Department/100 people | 116.77 | 111.55 | 110.85 | 107.58 | 120.83 | 110.23 | 114.56 | 119.46 | 109.42 | 125.71 |
| Number of fixed-broadband households | 10,000 households | 984.3 | 2013.9 | 815.2 | 989.4 | 1213.6 | 661.3 | 152.1 | 246.9 | 1043.9 | 701.5 |
| Level of gas-supply facilities | km | 24,266 | 75,350 | 9938 | 9760 | 28,700 | 4625 | 4666 | 7566 | 12,985 | 11,891 |
| Level of seismic-monitoring facilities | Block/10,000 km2 | 13.18 | 45.21 | 6.70 | 87.04 | 43.22 | 51.52 | 5.85 | 40.66 | 17.17 | 9.95 |
| Public coverage of meteorological disaster monitoring and forecasting early-warning information | pcs/100 km2 | 4.17 | 5.93 | 6.51 | 2.96 | 3.44 | 1.66 | 0.27 | 3.93 | 3.16 | 1.16 |
| Urban intelligent-pipe-network density | /km | 327,134.73 | 406,357.48 | 321,967.71 | 25,8655.12 | 316,773.95 | 116,776.54 | 18,188.66 | 134,222.48 | 309,061.21 | 106,110.15 |
| Shelter area per capita | m2/people | 4.81 | 9.03 | 6.25 | 8.51 | 9.94 | 12.98 | 14.85 | 20.87 | 10.67 | 19.46 |
| Storage area of disaster-relief-reserve institutions per 10,000 people | m2/10,000 people | 13,819.75 | 18,911.55 | 18,506.97 | 22,984.55 | 15,157.91 | 46,581.54 | 45,219.55 | 22,847.66 | 19,345.71 | 37,833.28 |
| Number of beds in medical and health institutions for 10,000 people | Size/10,000 people | 71.03 | 87.00 | 90.73 | 86.17 | 83.50 | 85.80 | 90.64 | 67.90 | 73.91 | 88.28 |
| Greenery coverage | % | 42.60 | 43.10 | 41.80 | 42.50 | 41.80 | 36.30 | 34.80 | 42.00 | 40.20 | 42.00 |
| The disaster-related death rate per million population | % | 0.01 | 0.01 | 0.00 | 0.02 | 0.03 | 0.00 | 0.04 | 0.00 | 0.00 | 0.03 |
| Annual direct economic losses due to disasters as a percentage of regional GDP | % | 0.11 | 0.46 | 0.15 | 0.39 | 1.06 | 0.66 | 1.37 | 0.30 | 0.09 | 0.37 |
| Percentage of people affected in a year | % | 5.28 | 15.71 | 14.81 | 43.90 | 39.13 | 43.16 | 16.62 | 30.05 | 9.75 | 25.39 |
| Public-security financial expenditure | CNY 100 million | 273.2 | 531.89 | 274.27 | 375.6 | 289.72 | 193.55 | 93.9 | 63.95 | 288.38 | 249.79 |
| Healthcare financial expenditure | CNY 100 million | 427.72 | 717.35 | 336.45 | 601.4 | 325.83 | 287.29 | 189.44 | 84.35 | 335.51 | 345.99 |
| Transportation financial expenditure | CNY 100 million | 277.44 | 714.30 | 244.60 | 791.50 | 834.50 | 389.10 | 49.50 | 132.20 | 261.10 | 232.10 |
Appendix D
| Indicators | Catastrophe-Level Values | |||||||||
|---|---|---|---|---|---|---|---|---|---|---|
| Chongqing | Sichuan | Guizhou | Yunnan | Shaanxi | Gansu | Qinghai | Ningxia | Guangxi | Inner Mongolia | |
| The resident population density in built-up areas | 0.790 | 0.649 | 0.418 | 0.701 | 0.764 | 0.367 | 1.000 | 0.120 | 0.419 | 0.164 |
| Level of basic medical insurance for urban workers | 0.295 | 0.774 | 0.171 | 0.215 | 0.284 | 0.122 | 0.000 | 0.016 | 0.250 | 0.217 |
| Percentage of transient population | 0.357 | 0.621 | 0.820 | 0.889 | 1.000 | 0.494 | 0.778 | 0.335 | 0.767 | 0.214 |
| Level of urban-health-technology talent pool | 0.014 | 0.056 | 0.552 | 0.483 | 0.273 | 0.070 | 1.000 | 0.203 | 0.098 | 0.371 |
| Number of hospitals | 0.450 | 0.716 | 1.000 | 0.379 | 0.620 | 0.137 | 0.005 | 0.214 | 0.208 | 0.105 |
| Social-organization-unit level | 0.290 | 0.920 | 0.189 | 0.448 | 0.486 | 0.544 | 0.005 | 0.037 | 0.482 | 0.248 |
| Personal accident insurance income | 0.321 | 0.871 | 0.102 | 0.194 | 0.380 | 0.129 | 0.000 | 0.039 | 0.201 | 0.215 |
| Urban commercial insurance income | 0.312 | 0.874 | 0.145 | 0.251 | 0.371 | 0.135 | 0.000 | 0.040 | 0.228 | 0.231 |
| Number of people covered by work-injury insurance | 0.313 | 0.576 | 0.190 | 0.227 | 0.280 | 0.095 | 0.000 | 0.018 | 0.230 | 0.173 |
| Land-development intensity | 0.955 | 0.555 | 0.508 | 0.191 | 0.283 | 0.083 | 0.003 | 0.497 | 0.459 | 0.168 |
| The proportion of land area in security-vulnerable zones | 0.525 | 0.585 | 0.575 | 0.870 | 0.901 | 0.281 | 0.909 | 0.977 | 0.529 | 0.706 |
| Number of employees in construction-industry enterprises | 0.610 | 0.967 | 0.200 | 0.409 | 0.368 | 0.142 | 0.014 | 0.018 | 0.335 | 0.060 |
| Road-network density | 0.712 | 0.666 | 0.412 | 0.207 | 0.574 | 0.178 | 0.000 | 0.437 | 0.459 | 0.216 |
| Level of urban traffic-lighting facilities | 0.223 | 0.596 | 0.223 | 0.181 | 0.181 | 0.092 | 0.000 | 0.057 | 0.277 | 0.223 |
| Cell-phone penetration rate | 0.489 | 0.122 | 0.247 | 0.000 | 0.584 | 0.216 | 0.372 | 0.746 | 0.045 | 0.645 |
| Number of fixed-broadband households | 0.291 | 0.694 | 0.173 | 0.308 | 0.292 | 0.144 | 0.000 | 0.018 | 0.297 | 0.149 |
| Level of gas-supply facilities | 0.275 | 0.644 | 0.057 | 0.051 | 0.196 | 0.012 | 0.000 | 0.055 | 0.045 | 0.102 |
| Level of seismic-monitoring facilities | 0.004 | 0.137 | 0.001 | 0.323 | 0.200 | 0.111 | 0.004 | 0.061 | 0.116 | 0.030 |
| Public coverage of meteorological disaster monitoring and forecasting early-warning information | 0.521 | 0.658 | 1.000 | 0.450 | 0.343 | 0.264 | 0.000 | 0.419 | 0.387 | 0.106 |
| Urban intelligent-pipe-network density | 0.514 | 0.740 | 0.612 | 0.294 | 0.531 | 0.179 | 0.000 | 0.181 | 0.373 | 0.138 |
| Shelter area per capita | 0.000 | 0.199 | 0.181 | 0.185 | 0.628 | 0.524 | 0.580 | 0.659 | 0.102 | 0.566 |
| Storage area of disaster-relief-reserve institutions per 10,000 people | 0.003 | 0.082 | 0.135 | 0.163 | 0.056 | 0.361 | 0.783 | 0.455 | 0.161 | 0.615 |
| Number of beds in medical and health institutions per 10,000 people | 0.120 | 0.143 | 0.721 | 0.454 | 0.210 | 0.131 | 1.000 | 0.157 | 0.000 | 0.372 |
| Greenery coverage | 0.736 | 0.706 | 0.423 | 0.599 | 0.695 | 0.069 | 0.000 | 0.745 | 0.623 | 0.727 |
| The disaster-related death rate per million population | 0.721 | 0.399 | 0.338 | 0.115 | 0.471 | 0.672 | 0.000 | 1.000 | 0.487 | 0.755 |
| Annual direct economic losses due to disasters as a percentage of regional GDP | 0.967 | 0.757 | 0.745 | 0.751 | 0.497 | 0.000 | 0.536 | 0.780 | 0.646 | 0.431 |
| Percentage of people affected in a year | 0.954 | 0.979 | 0.720 | 0.738 | 0.633 | 0.379 | 0.130 | 0.287 | 0.935 | 0.150 |
| Public-security financial expenditure | 0.367 | 0.871 | 0.436 | 0.597 | 0.380 | 0.227 | 0.056 | 0.001 | 0.468 | 0.398 |
| Healthcare financial expenditure | 0.314 | 0.870 | 0.410 | 0.539 | 0.389 | 0.239 | 0.048 | 0.016 | 0.498 | 0.278 |
| Transportation financial expenditure | 0.304 | 0.608 | 0.366 | 0.588 | 0.324 | 0.301 | 0.058 | 0.065 | 0.248 | 0.376 |
| Indicators | Catastrophe-Level Values | |||||||||
|---|---|---|---|---|---|---|---|---|---|---|
| Chongqing | Sichuan | Guizhou | Yunnan | Shaanxi | Gansu | Qinghai | Ningxia | Guangxi | Inner Mongolia | |
| The resident population density in built-up areas | 0.770 | 0.626 | 0.409 | 0.650 | 0.939 | 0.361 | 0.915 | 0.000 | 0.337 | 0.169 |
| Level of basic medical insurance for urban workers | 0.338 | 0.909 | 0.199 | 0.234 | 0.334 | 0.135 | 0.005 | 0.025 | 0.284 | 0.236 |
| Percentage of transient population | 0.404 | 0.628 | 0.740 | 0.796 | 0.965 | 0.572 | 0.853 | 0.348 | 0.684 | 0.179 |
| Level of urban-health-technology talent pool | 0.112 | 0.126 | 0.119 | 0.427 | 0.231 | 0.175 | 0.392 | 0.238 | 0.119 | 0.469 |
| Number of hospitals | 0.513 | 0.757 | 0.996 | 0.408 | 0.602 | 0.194 | 0.000 | 0.244 | 0.236 | 0.117 |
| Social-organization-unit level | 0.308 | 0.985 | 0.215 | 0.459 | 0.630 | 0.484 | 0.025 | 0.025 | 0.545 | 0.295 |
| Personal accident insurance income | 0.406 | 0.992 | 0.137 | 0.249 | 0.481 | 0.162 | 0.006 | 0.052 | 0.251 | 0.294 |
| Urban commercial insurance income | 0.394 | 0.974 | 0.193 | 0.312 | 0.449 | 0.171 | 0.009 | 0.055 | 0.275 | 0.306 |
| Number of people covered by work-injury insurance | 0.424 | 0.790 | 0.244 | 0.266 | 0.364 | 0.127 | 0.006 | 0.039 | 0.268 | 0.194 |
| Land-development intensity | 0.984 | 0.554 | 0.552 | 0.188 | 0.240 | 0.107 | 0.000 | 0.223 | 0.449 | 0.174 |
| The proportion of land area in security-vulnerable zones | 0.523 | 0.594 | 0.584 | 0.908 | 0.783 | 0.000 | 0.832 | 0.985 | 0.713 | 0.762 |
| Number of employees in construction-industry enterprises | 0.586 | 0.963 | 0.206 | 0.378 | 0.388 | 0.125 | 0.006 | 0.015 | 0.379 | 0.040 |
| Road-network density | 0.834 | 0.821 | 0.520 | 0.262 | 0.640 | 0.209 | 0.004 | 0.550 | 0.612 | 0.216 |
| Level of urban traffic-lighting facilities | 0.317 | 0.697 | 0.243 | 0.242 | 0.341 | 0.110 | 0.007 | 0.053 | 0.257 | 0.219 |
| Cell-phone penetration rate | 0.788 | 0.656 | 0.630 | 0.319 | 0.841 | 0.421 | 0.602 | 0.828 | 0.407 | 0.811 |
| Number of fixed-broadband households | 0.427 | 0.904 | 0.320 | 0.355 | 0.405 | 0.232 | 0.013 | 0.052 | 0.388 | 0.256 |
| Level of gas-supply facilities | 0.292 | 0.750 | 0.076 | 0.077 | 0.264 | 0.022 | 0.004 | 0.064 | 0.085 | 0.108 |
| Level of seismic-monitoring facilities | 0.107 | 0.133 | 0.045 | 0.329 | 0.194 | 0.111 | 0.000 | 0.056 | 0.116 | 0.030 |
| Public coverage of meteorological disaster monitoring and forecasting early-warning information | 0.467 | 0.682 | 0.967 | 0.323 | 0.324 | 0.181 | 0.001 | 0.435 | 0.361 | 0.103 |
| Urban intelligent-pipe-network density | 0.673 | 0.962 | 0.775 | 0.550 | 0.702 | 0.223 | 0.010 | 0.243 | 0.603 | 0.192 |
| Shelter area per capita | 0.019 | 0.237 | 0.138 | 0.273 | 0.359 | 0.412 | 0.652 | 1.000 | 0.297 | 0.550 |
| Storage area of disaster-relief-reserve institutions per 10,000 people | 0.000 | 0.100 | 0.227 | 0.141 | 0.075 | 0.558 | 1.000 | 0.466 | 0.117 | 0.653 |
| Number of beds in medical and health institutions per 10,000 people | 0.218 | 0.201 | 0.162 | 0.363 | 0.151 | 0.244 | 0.376 | 0.141 | 0.023 | 0.450 |
| Greenery coverage | 0.877 | 0.877 | 0.649 | 0.678 | 0.640 | 0.327 | 0.251 | 0.829 | 0.782 | 0.754 |
| The disaster-related death rate per million population | 0.860 | 0.491 | 0.305 | 0.457 | 0.651 | 0.677 | 0.484 | 0.884 | 0.426 | 0.893 |
| Annual direct economic losses due to disasters as a percentage of regional GDP | 0.996 | 0.515 | 0.850 | 0.733 | 0.889 | 0.664 | 0.698 | 1.000 | 0.708 | 0.856 |
| Percentage of people affected in a year | 0.971 | 0.854 | 0.710 | 0.000 | 0.630 | 0.599 | 0.350 | 1.000 | 0.794 | 0.649 |
| Public-security financial expenditure | 0.437 | 0.987 | 0.462 | 0.681 | 0.474 | 0.272 | 0.055 | 0.006 | 0.530 | 0.396 |
| Healthcare financial expenditure | 0.348 | 1.000 | 0.524 | 0.610 | 0.445 | 0.282 | 0.074 | 0.026 | 0.560 | 0.277 |
| Transportation financial expenditure | 0.309 | 0.813 | 0.380 | 0.628 | 0.299 | 0.396 | 0.157 | 0.050 | 0.217 | 0.451 |
| Indicators | Catastrophe-Level Values | |||||||||
|---|---|---|---|---|---|---|---|---|---|---|
| Chongqing | Sichuan | Guizhou | Yunnan | Shaanxi | Gansu | Qinghai | Ningxia | Guangxi | Inner Mongolia | |
| The resident population density in built-up areas | 0.828 | 0.690 | 0.365 | 0.375 | 0.872 | 0.264 | 0.741 | 0.014 | 0.366 | 0.185 |
| Level of basic medical insurance for urban workers | 0.379 | 1.000 | 0.208 | 0.257 | 0.373 | 0.150 | 0.011 | 0.035 | 0.335 | 0.254 |
| Percentage of transient population | 0.519 | 0.405 | 0.737 | 0.757 | 0.865 | 0.360 | 0.961 | 0.547 | 0.661 | 0.000 |
| Level of urban-health-technology talent pool | 0.000 | 0.161 | 0.175 | 0.301 | 0.175 | 0.238 | 0.336 | 0.189 | 0.182 | 0.273 |
| Number of hospitals | 0.520 | 0.716 | 0.931 | 0.395 | 0.591 | 0.187 | 0.000 | 0.240 | 0.253 | 0.120 |
| Social-organization-unit level | 0.333 | 1.000 | 0.239 | 0.443 | 0.646 | 0.407 | 0.023 | 0.000 | 0.603 | 0.302 |
| Personal accident insurance income | 0.440 | 1.000 | 0.147 | 0.238 | 0.469 | 0.195 | 0.009 | 0.062 | 0.308 | 0.246 |
| Urban commercial insurance income | 0.417 | 1.000 | 0.196 | 0.287 | 0.458 | 0.193 | 0.013 | 0.062 | 0.330 | 0.266 |
| Number of people covered by work-injury insurance | 0.498 | 1.000 | 0.331 | 0.339 | 0.401 | 0.152 | 0.022 | 0.056 | 0.346 | 0.194 |
| Land-development intensity | 1.000 | 0.553 | 0.529 | 0.184 | 0.242 | 0.108 | 0.001 | 0.228 | 0.363 | 0.154 |
| The proportion of land area in security-vulnerable zones | 0.373 | 0.592 | 0.773 | 0.891 | 0.914 | 0.077 | 0.821 | 1.000 | 0.684 | 0.964 |
| Number of employees in construction-industry enterprises | 0.556 | 1.000 | 0.183 | 0.318 | 0.345 | 0.112 | 0.000 | 0.014 | 0.314 | 0.026 |
| Road-network density | 0.996 | 1.000 | 0.778 | 0.312 | 0.701 | 0.256 | 0.006 | 0.602 | 0.659 | 0.233 |
| Level of urban traffic -ighting facilities | 0.377 | 1.000 | 0.339 | 0.310 | 0.355 | 0.149 | 0.011 | 0.057 | 0.344 | 0.241 |
| Cell-phone penetration rate | 0.762 | 0.624 | 0.605 | 0.518 | 0.870 | 0.589 | 0.704 | 0.834 | 0.567 | 1.000 |
| Number of fixed-broadband households | 0.460 | 1.000 | 0.372 | 0.463 | 0.581 | 0.291 | 0.024 | 0.074 | 0.492 | 0.312 |
| Level of gas-supply facilities | 0.301 | 1.000 | 0.105 | 0.103 | 0.362 | 0.033 | 0.033 | 0.073 | 0.147 | 0.132 |
| Level of seismic-monitoring facilities | 0.132 | 0.508 | 0.056 | 1.000 | 0.485 | 0.582 | 0.046 | 0.455 | 0.179 | 0.094 |
| Public coverage of meteorological disaster monitoring and forecasting early-warning information | 0.467 | 0.678 | 0.747 | 0.322 | 0.380 | 0.167 | 0.001 | 0.439 | 0.346 | 0.107 |
| Urban intelligent-pipe-network density | 0.799 | 1.000 | 0.786 | 0.625 | 0.772 | 0.264 | 0.014 | 0.309 | 0.753 | 0.237 |
| Shelter area per capita | 0.012 | 0.232 | 0.088 | 0.205 | 0.279 | 0.438 | 0.535 | 0.849 | 0.318 | 0.775 |
| Storage area of disaster-relief-reserve institutions per 10,000 people | 0.026 | 0.111 | 0.104 | 0.179 | 0.048 | 0.573 | 0.550 | 0.177 | 0.118 | 0.427 |
| Number of beds in medical and health institutions per 10,000 people | 0.067 | 0.210 | 0.243 | 0.203 | 0.179 | 0.199 | 0.243 | 0.039 | 0.093 | 0.221 |
| Greenery coverage | 0.953 | 1.000 | 0.877 | 0.943 | 0.877 | 0.355 | 0.213 | 0.896 | 0.725 | 0.896 |
| The disaster-related death rate per million population | 0.904 | 0.909 | 0.960 | 0.719 | 0.650 | 0.985 | 0.418 | 0.939 | 0.965 | 0.664 |
| Annual direct economic losses due to disasters as a percentage of regional GDP | 0.978 | 0.716 | 0.943 | 0.772 | 0.271 | 0.572 | 0.049 | 0.834 | 0.989 | 0.782 |
| Percentage of people affected in a year | 0.979 | 0.775 | 0.792 | 0.222 | 0.315 | 0.236 | 0.757 | 0.493 | 0.892 | 0.585 |
| Public-security financial expenditure | 0.447 | 1.000 | 0.449 | 0.666 | 0.482 | 0.277 | 0.064 | 0.000 | 0.480 | 0.397 |
| Healthcare financial expenditure | 0.400 | 0.737 | 0.294 | 0.602 | 0.281 | 0.236 | 0.122 | 0.000 | 0.292 | 0.305 |
| Transportation financial expenditure | 0.290 | 0.847 | 0.249 | 0.945 | 1.000 | 0.433 | 0.000 | 0.105 | 0.270 | 0.233 |
References
- Liu, J.G.; Dietz, T.; Carpenter, S.R.; Alberti, M. Complexity of coupled human and natural systems. Science 2007, 317, 1513–1516. [Google Scholar] [CrossRef]
- Spaans, M.; Waterhout, B. Building up resilience in cities worldwide—Rotterdam as participant in the 100 Resilient Cities Programme. Cities 2017, 61, 109–116. [Google Scholar] [CrossRef]
- Meerow, S.; Newell, J.P. Resilience and Complexity A Bibliometric Review and Prospects for Industrial Ecology. J. Ind. Ecol. 2015, 19, 236–251. [Google Scholar] [CrossRef]
- Meerow, S.; Newell, J.P. Defining urban resilience:A review. Landlscape Urban Plan. 2016, 147, 38–49. [Google Scholar] [CrossRef]
- Bai, M.H.; Liu, Q. Evaluating Urban Fire Risk Based on Entropy-Cloud Model Method Considering Urban Safety Resilience. Fire 2023, 6, 62. [Google Scholar] [CrossRef]
- Fan, W. Modernizing Public Safety Governance with the Construction of a Safe and Resilient City. People’s Forum-Acad. Front. 2022, Z1, 14–24. [Google Scholar] [CrossRef]
- Zobel, C.W.; Baghersad, M. Analytically comparing disaster resilience across multiple dimensions. Socio-Econ. Plan. Sci. 2020, 69, 100678. [Google Scholar] [CrossRef]
- Zhang, S.S.; Ma, X.Y.; Cui, Q. Spatial-temporal Dynamic Evolution of Urban Resilience and Its Influencing Factors in China. Stat. Decis. 2023, 39, 110–115. [Google Scholar]
- Kan, T.Y. Research on Supply-Side Structural Reform Based on Division of Labor Theory. Master’s Thesis, University of Science and Technology of Hunan, Xiangtan, China, 2020. [Google Scholar]
- Jin, L. Must pay attention to disaster prevention and mitigation in western China. Theor. Perspect. 2001, 18–19. [Google Scholar] [CrossRef]
- Krimsky, S.; Golding, D. Social Theories of Risk; Greenwood Pub Group: Boston, MA, USA, 1992; pp. 27–28. [Google Scholar]
- Brugmann, J. Financing the resilient city. Environ. Urban. 2011, 24, 215–232. [Google Scholar] [CrossRef]
- Cariolet, J.M.; Vuillet, M.; Diab, Y. Mapping urban resilience to disasters—A review. Sustain. Cities Soc. 2019, 51, 101746. [Google Scholar] [CrossRef]
- Asadzadeh, A.; Kotter, T.; Salehi, P. Operationalizing a concept: The systematic review of composite indicator building for measuring community disaster resilience. Int. J. Disaster Risk Reduct. 2017, 25, 147–162. [Google Scholar] [CrossRef]
- Marana, P.; Eden, C.; Eriksson, H.; Grimes, C.; Hernantes, J.; Howick, S.; Labaka, L.; Latinos, V.; Lindner, R.; Majchrzak, T.A.; et al. Towards a resilience management guideline—Cities as a starting point for societal resilience. Sustain. Cities Soc. 2019, 48, 101531. [Google Scholar] [CrossRef]
- Lu, H.; Zhang, C.; Jiao, L.D. Analysis on the spatial-temporal evolution of urban agglomeration resilience: A case study in Chengdu-Chongqing Urban Agglomeration, China. Int. J. Disaster Risk Reduct. 2022, 79, 103167. [Google Scholar] [CrossRef]
- Ma, F.; Wang, Z.H.; Sun, Q.P. Spatial–Temporal Evolution of Urban Resilience and Its Influencing Factors: Evidence from the Guanzhong Plain Urban Agglomeration. Sustainability 2020, 12, 2593. [Google Scholar] [CrossRef]
- Ma, X.F.; Chen, X.H.; Du, Y. Evaluation of Urban Spatial Resilience and Its Influencing Factors: Case Study of the Harbin–Changchun Urban Agglomeration in China. Sustainability 2022, 14, 2899. [Google Scholar] [CrossRef]
- Liu, L.; Luo, Y.; Pei, J.J. Temporal and Spatial Differentiation in Urban Resilience and Its Influencing Factors in Henan Province. Sustainability 2021, 13, 12460. [Google Scholar] [CrossRef]
- Shi, Y.J.; Zhai, G.F.; Xu, L.H.; Lu, Y.W. Assessment methods of urban system resiliense: From the perspective of complex adaptive system theory. Cities 2021, 112, 103141. [Google Scholar] [CrossRef]
- Atrachali, M.; Ghafory-Ashtianny, M.; Amini-Hosseini, K.; Arian-Moghaddam, S. Toward quantification of seismic resilience in Iran: Developing an integrated indicator system. Int. J. Disaster Risk Reduct. 2019, 39, 101231. [Google Scholar] [CrossRef]
- Moghadas, M.; Asadzadeh, A.; Vafeidis, A.; Fekete, A. A multi-criteria approach for assessing urban flood resilience in Tehran, Iran. Int. J. Disaster Risk Reduct. 2019, 35, 101069. [Google Scholar] [CrossRef]
- Manyena, B.; Machingura, F.; O’Keefe, P. Disaster Resilience Integrated Framework for Transformation (DRIFT): A new approach to theorising and operationalising resilience. World Dev. 2019, 123, 104587. [Google Scholar] [CrossRef]
- Campbell, K.A.; Laurien, F.; Keating, A.; Hochrainer-Stigler, S. First insights from the Flood Resilience Measurement Tool: A large-scale community flood resilience analysis. Int. J. Disaster Risk Reduct. 2019, 40, 101257. [Google Scholar] [CrossRef]
- Lee, H.C.; Chen, H.E.Y. Implementing the Sendai Framework for disaster risk reduction 2015–2030: Disaster governance strategies for persons with disabilities in Taiwan. Int. J. Disaster Risk Reduct. 2019, 41, 101284. [Google Scholar] [CrossRef]
- Huang, L.; Wu, C.; Wang, B. Modeling on shaping and assessment of system safety resilience. China Prod. Saf. Sci. Technol. 2016, 12, 15–21. [Google Scholar]
- Fang, Y.D.; Wang, W.; Zhang, Z. Strategies for Disaster Prevention and Mitigation in Safety and Resilient Cities. China Eng. Sci. 2023, 25, 1–9. [Google Scholar] [CrossRef]
- Wu, B.H.; Chen, A. Framework of the evaluation model resilient cities. Sci. Technol. Her. 2018, 36, 94–99. [Google Scholar]
- Wang, Q. Research on Resilient Cities under the Impact of Public Health Security. Contemp. Econ. 2023, 40, 3–8. [Google Scholar]
- Hu, Y.T.; Xiao, C.H. An analysis of the dilemma and path of safe and resilient city construction in China. Leadersh. Sci. 2022, 12, 137–139. [Google Scholar] [CrossRef]
- Chen, C.K.; Chen, Y.Q.; Shi, B.; Xu, T. Urban resilience assessment model under rainfall and flooding scenarios. Chin. J. Saf. Sci. 2018, 28, 1–6. [Google Scholar] [CrossRef]
- Guo, Y.Y.; Luo, F.Z.; Zhong, X.R. Study on Urban Safety Resilience Assessment Based on Entropy Weight-Normal Cloud Model. Disaster Sci. 2021, 36, 168–174. [Google Scholar]
- Xu, Z.F.; Tian, J.F.; Zhang, J. Urban resilience evaluation system and optimization strategy from perspective of disaster prevention. Chin. J. Saf. Sci. 2019, 29, 1–7. [Google Scholar]
- Zhang, H.M.; Sha, J.M. RS and GlS based study on fragirity of ecological environment in Fuzhou City. J. Nat. Hazards 2007, 16, 133–137. [Google Scholar]
- Pang, S.; Liu, K.; Ji, W.H. Ecological vulnerability evaluation of Yan’an city. Arid. Zone Resour. Environ. 2011, 25, 63–66. [Google Scholar]
- Ge, L.L.; Yi, L.X. Evaluation index design for social disaster vulnerability in China. Safety 2011, 32, 1–4. [Google Scholar]
- Zhao, G.J.; Zhang, W.X. Coastal zone socio-economic vulnerability study. Stat. Decis. Mak. 2006, 12–14. [Google Scholar] [CrossRef]
- Su, F.; Zhang, P.Y. Research on the Vulnerability of Mining Cities’ Social System—A Case Study of Fuxin City. Geogr. Res. Dev. 2009, 28, 71–74+89. [Google Scholar]
- Na, W.; Liu, J.S. Research on the vulnerability and the evaluation of the human-earth system in mining cities. Urban Issues 2007, 7, 43–48. [Google Scholar]
- Li, B.; Dong, L.J.; Han, Z.L. Vulnerability and sustainable development model of coal-mining cities in Northeast China. Geogr. Res. 2010, 29, 361–372. [Google Scholar]
- Liu, H.; Cheng, Z.C.; Wang, D. Study on Evaluation Index System of Urban Fire Resilience Northeast China. Disaster Sci. 2023, 38, 25–30. [Google Scholar]
- Tao, X.D. Mega-city Resilience Building: Experience and Insights from New York, USA. Urban Plan. 2023, 1–8. Available online: http://kns.cnki.net/kcms/detail/11.2378.TU.20221124.1626.006.html (accessed on 6 May 2023).
- Du, J.Y.; Tang, X.C.; Xu, J.G. Study on urgency assessment of urban resilience promotion—A case study of typhoon disasters in the Pearl River Delta region. J. Nat. Hazards 2020, 29, 88–98. [Google Scholar]
- Tian, J.; Zeng, H.P.; Zeng, J. Planning Method of Coastal City Rain Flood Disaster Prevention and Control Based on the Concept of Intelligence—Resilience. West. J. Habitat Humanit. 2022, 37, 66–72. [Google Scholar]
- Chen, X.S.; Quan, R.S. A spatiotemporal analysis of urban resilience to the COVID-19 pandemic in the Yangtze River Delta. Nat. Hazards 2021, 106, 829–854. [Google Scholar] [CrossRef]
- Zhu, S.Y.; Li, D.Z.; Feng, H.B. Is smart city resilient? Evidence from China. Sustain. Cities Soc. 2019, 50, 101636. [Google Scholar] [CrossRef]
- GB/T 40947-2021; Guide for Safety and Resilient City Evaluation. Available online: https://kns.cnki.net/kcms2/article/abstract?v=kxaUMs6x7-5KB1kF296ShrYo_9ZoYIWW4VfT4bfQP25xUu13oQ_hU2RwTRYiCsQ_VNQi9Kn-nzyEl9Z_ZFIEZw%3d%3d&uniplatform=NZKPT (accessed on 2 March 2023).
- Liu, W.; Song, Z.Y. Review of studies on the resilience of urban critical infrastructure networks. Reliab. Eng. Syst. Saf. 2019, 193, 106617. [Google Scholar] [CrossRef]
- Sharifi, A.; Khavarian-Garmsir, A.R. The COVID-19 pandemic: Impacts on cities and major lessons for urban planning, design, and management. Sci. Total Environ. 2020, 749, 142391. [Google Scholar] [CrossRef]
- Li, X.; Zhou, L.; Jia, T. Analysis of urban spatial risk factors under the “New Crown” Epidemic: Taking Wuhan as an example. Urban Plan. 2021, 45, 78–86. [Google Scholar]
- Ribeiro, P.J.G.; Gonçalves, L.A.P.J. Urban resilience: A conceptual framework. Sustain. Cities Soc. 2019, 50, 101625. [Google Scholar] [CrossRef]
- Li, J.; Wang, J.L. Growing-season vegetation coverage patterns and driving factors in the China-Myanmar Economic Corridor based on Google Earth Engine and geographic detector. Ecol. Indic. 2022, 136, 108620. [Google Scholar] [CrossRef]
- Yang, J.H.; Wang, S.S.; Liu, Y.F. 70 Years of China: Analysis on the Trend of Population Aging. China Popul. Sci. 2019, 4, 30–42+126. [Google Scholar]
- Sun, Y.Q.; Chen, H.J. Whether Urban-Rural Population Structure Difference Hinders Urban-Rural Economic Integration. Shanghai Econ. Res. 2021, 8, 60–71. [Google Scholar] [CrossRef]
- Zhang, W.W.; Xu, X.H.; Chen, X.H. Social vulnerability assessment of earthquake disaster based on the catastrophe progression method: A Sichuan Province case study. Int. J. Disaster Risk Reduct. 2017, 24, 361–372. [Google Scholar] [CrossRef]
- Ci, T.J.; Liu, X.Y. An interval number multi-attribute decision attribute value normalization method based on decision maker preferences. Stat. Decis. 2015, 3, 36–38. [Google Scholar] [CrossRef]
- Likas, A.; Vlassis, N.; Verbeek, J.J. The global k-means clustering algorithm. J. Pattern Recognit. 2003, 36, 451–461. [Google Scholar] [CrossRef]
- Wang, Q.; Feng, Z.Y.; Wang, Q. Review of K-Means clustering algorithm. Electron. Des. Eng. 2012, 20, 21–24. [Google Scholar]
- Jain, A.K. Data clustering: 50 years beyond K-Means. Pattern Recognit. Lett. 2010, 31, 651–666. [Google Scholar] [CrossRef]
- Lu, G.N.; Chen, M. Reflections and speculations on the progress in Geographic Information Systems (GIS): A geographic perspective. Int. J. Geogr. Inf. Sci. 2018, 33, 346–367. [Google Scholar] [CrossRef]
- Zhu, J.X.; Wu, P.; Chen, M.C. Automatically Processing IFC Clipping Representation for BIM and GIS Integration at the Process Level. Appl. Sci. 2020, 10, 2009. [Google Scholar] [CrossRef]
- Wang, S.K. Several Types of Weights Matrix and Their Extended Logic. J. Quant. Econ. 2013, 30, 57–63. [Google Scholar]
- Moran, P.A.P. Notes on continuous stochastic phenomena. Biometrika 1950, 37, 17–23. [Google Scholar] [CrossRef]
- Bivand, R.S.; Wong, D.W.S. Comparing implementations of global and local indicators of spatial association. Test 2018, 27, 716–748. [Google Scholar] [CrossRef]
- Wang, J.M.; Ouyang, J.M.; Zhang, M. Spatial distribution characteristics of soil and vegetation in a reclaimed area in an opencast coalmine. Catena 2020, 195, 104773. [Google Scholar] [CrossRef]
- Feng, J.H.; Zhang, L.L. Coordination degree between new urbanization and ecological environment in Shaanxi Province. J. Ecol. 2022, 42, 4617–4629. [Google Scholar]
- Deng, C.X. Research on Disaster Mitigation Ability in Agriculture and Animal Husbandry Communities Based on Scenario Analysis; Lanzhou University: Lanzhou, China, 2021. [Google Scholar] [CrossRef]
- Ma, X.L. Construction of emergency rescue network system in Gansu Province based on concept of resilient city. Smart Cities 2022, 8, 44–46. [Google Scholar] [CrossRef]
- Cai, S.H.; Gu, C.; Zhang, Z.J. Research on the Coordinated Development of Population-Resources-Environment-Economy in Western China from the Perspective of Space-Time Evolution. Eco-economy 2022, 38, 168–175. [Google Scholar]


| General Goal | Tier 1 Indicators | Tier 2 Indicators | Tier 3 Indicators |
|---|---|---|---|
| Urban-safety resilience (A) | The resilience of urban-personnel safety (B1) | Basic population attributes (C1) | The resident-population density in built-up areas (D1) |
| Level of basic medical insurance for urban workers (D2) | |||
| Percentage of transient population (D3) | |||
| Social participation preparation (C2) | Level of urban-health-technology talent pool (D4) | ||
| Number of hospitals (D5) | |||
| Social-organization-unit level (D6) | |||
| Sense of security and security culture (C3) | Personal-accident-insurance income (D7) | ||
| Urban commercial-insurance income (D8) | |||
| Number of employees involved in work-related-injury-insurance coverage (D9) | |||
| The resilience of urban-facility safety (B2) | Construction (C4) | Land-development intensity (D10) | |
| The proportion of land area in security-vulnerable areas (D11) | |||
| Number of employees in construction-industry enterprises (D12) | |||
| Traffic facilities (C5) | Road-network density (D13) | ||
| Level of urban traffic-lighting facilities (D14) | |||
| Lifeline project amenities (C6) | Cell-phone penetration rate (D15) | ||
| Number of fixed-broadband households (D16) | |||
| Level of gas-supply facilities (D17) | |||
| Monitoring and warning facilities (C7) | Level of seismic-monitoring facilities (D18) | ||
| The public reach of meteorological hazard monitoring and anticipation of early alert messages (D19) | |||
| Urban intelligent-pipe-network density (D20) | |||
| Emergency-security facilities (C8) | Shelter area per capita (D21) | ||
| Storage area of disaster-relief-reserve institutions per 10,000 people (D22) | |||
| Number of beds in healthcare facilities for 10,000 people (D23) | |||
| Greenery coverage (D24) | |||
| The resilience of urban-management safety (B3) | Risk-control level (C9) | The hazard-related mortality rate per million population (D25) | |
| Annual direct financial damage resulting from catastrophes as a percentage of area GDP (D26) | |||
| Annual percentage of people affected (D27) | |||
| Support-security input (C10) | Public-security financial expenditure (D28) Healthcare financial expenditure (D29) | ||
| Transportation financial expenditure (D30) |
| Evaluation Methodology | Advantages | Disadvantages | Scope of Application |
|---|---|---|---|
| Fuzzy integrated evaluation | Explicit and systematic results that translate qualitative metrics into quantitative metrics | Insufficient use of the volatility of the change in its evaluation results when the affiliation degree changes, mainly because of the considerable subjectivity in the evaluation process | The nature of the influential parameters and the difficulty in quantifying the assessment of the activity |
| Hierarchical analysis | Translation of qualitative metrics into quantitative metrics | Failure to consider the interplay between different levels of decision-making or the same level | No cross-talk between factors and between levels |
| ANP-network analysis | Superior flexibility, considering both the factors and the dependencies between the superordinate factors of each factor | More cumbersome to use in complex decision-making processes | Less computationally intensive and relatively deterministic risk-evaluation problem |
| Object element model | Flexible indicators, simple process, more systematic and refined results | The hand must be a relatively definite value | Multiple phases of evaluation of numerous evaluation objects identified by indicators |
| Monte Carlo | Errors and problems are independent of the number of dimensions; problems with statistical properties can be solved directly; Issues of a continuous nature do not need to discretize | Inability to fully reflect the interactions between project risk factors Deterministic problems need to transform into stochastic problems | Evaluation questions are relatively simple and defined |
| Catastrophe progression | It can be used to analyze indicator systems with complex influencing factors that produce unclear catastrophe points; Not overly dependent on weights | Due to its model characteristics, the definition of the risk level interval is more complicated | Study of systems with complex internal structures or unknown mechanisms of interaction of internal factors |
| Catastrophe Type | Status Variable | Control Variable | Potential Function | Normalized Formula |
|---|---|---|---|---|
| cusp catastrophe | 1 | 2 | ||
| swallowtail catastrophe | 1 | 3 | ||
| butterfly catastrophe | 1 | 4 | ||
| hut catastrophe | 1 | 5 |
| Upper-Level Indicators | Indicators | Indicator Ranking of the Same Higher-Level Indicators |
|---|---|---|
| Basic population attributes (C1) | The resident population’s density in built-up areas (D1) | 3 |
| Level of basic medical insurance for urban workers (D2) | 1 | |
| Percentage of transient population (D3) | 2 | |
| Social-participation preparation (C2) | Level of urban-health-technology talent pool (D4) | 1 |
| Number of hospitals (D5) | 3 | |
| Social-organization-unit level (D6) | 2 | |
| Sense of security and security culture (C3) | Personal-accident-insurance income (D7) | 3 |
| Urban-commercial-insurance income (D8) | 1 | |
| Number of employees involved in work-related-injury-insurance coverage (D9) | 2 | |
| Construction (C4) | Land-development intensity (D10) | 2 |
| The proportion of land area in security-vulnerable areas (D11) | 1 | |
| Number of employees in construction-industry enterprises (D12) | 3 | |
| Traffic facilities (C5) | Road-network density (D13) | 1 |
| Level of urban-traffic-lighting facilities (D14) | 2 | |
| Lifeline-project amenities (C6) | Cell-phone penetration rate (D15) | 3 |
| Number of fixed-broadband households (D16) | 2 | |
| Level of gas-supply facilities (D17) | 1 | |
| Monitoring and warning facilities (C7) | Level of seismic-monitoring facilities (D18) | 3 |
| The public reach of meteorological hazard monitoring and anticipation of early alert messages (D19) | 2 | |
| Urban intelligent-pipe-network density (D20) | 1 | |
| Emergency security facilities (C8) | Shelter area per capita (D21) | 1 |
| Storage area of disaster-relief-reserve institutions per 10,000 people (D22) | 2 | |
| Number of beds in healthcare facilities for 10,000 people (D23) | 3 | |
| Greenery coverage (D24) | 4 | |
| Risk-control level (C9) | The hazard-related mortality rate per million population (D25) | 3 |
| Annual direct financial damage resulting from catastrophes as a percentage of area GDP (D26) | 2 | |
| Annual percentage of people affected (D27) | 1 | |
| Support-security input (C10) | Public-security financial expenditure (D28) Healthcare financial expenditure (D29) | 1 |
| Transportation financial expenditure (D30) | 2 | |
| The resilience of urban-personnel safety (B1) | Basic population attributes (C1) | 1 |
| Social-participation preparation (C2) | 3 | |
| Sense of security and security culture (C3) | 2 | |
| The resilience of urban-facility safety (B2) | Construction (C4) | 3 |
| Traffic facilities (C5) | 2 | |
| Lifeline-project amenities (C6) | 1 | |
| Monitoring and warning facilities (C7) | 4 | |
| Emergency security facilities (C8) | 5 | |
| The resilience of urban-management safety (B3) | Risk-control level (C9) | 2 |
| Support-security input (C10) | 1 | |
| Urban-safety resilience (A) | The resilience of urban-personnel safety (B1) | 2 |
| The resilience of urban-facility safety (B2) | 1 | |
| The resilience of urban-management safety (B3) | 3 |
| Indicator Levels | Hierarchical Internal Metrics | Internal Relations |
|---|---|---|
| Tier 1 Indicators | B1, B2, B3 | Complementary |
| Tier 2 indicators | C1, C2, C3 | Complementary |
| C4, C5, C6, C7, C8 | Non-complementary | |
| C9, C10 | Complementary | |
| Tier 3 indicators | D1, D2, D3 | Complementary |
| D4, D5, D6 | Complementary | |
| D7, D8, D9 | Complementary | |
| D10, D11, D12 | Non-complementary | |
| D13, D14 | Complementary | |
| D15, D16, D17 | Non-complementary | |
| D18, D19, D20 | Complementary | |
| D21, D22, D23, D24 | Complementary | |
| D25, D26, D27 | Non-complementary | |
| D28, D29, D30 | Complementary |
| Spatial Matrix Type | Spatial Matrix Relationship |
|---|---|
| Rook-contiguity type | It is generally used to construct a spatial matrix with the help of the spatial relationship between two factors, that have joint edges. |
| Queen-contiguity type | It is generally used to construct a spatial matrix using the spatial relationship between two factors that have typical edges or common points. |
| K-nearest-neighbors type | Generally, the spatial matrix is constructed by using the distance between two elements after fixing the number of adjacent elements. |
| Threshold-distance type | It is generally used to construct a spatial matrix regarding the distance between two elements. |
| 2017 | 2019 | 2021 | ||||||
|---|---|---|---|---|---|---|---|---|
| Region | Evaluation Results | Resilience Level | Region | Evaluation Results | Resilience Level | Region | Evaluation Results | Resilience Level |
| Chongqing | 0.925 | High | Chongqing | 0.932 | High | Chongqing | 0.933 | High |
| Sichuan | 0.947 | High | Sichuan | 0.980 | High | Sichuan | 0.981 | High |
| Guizhou | 0.873 | Relatively high | Guizhou | 0.882 | Relatively high | Guizhou | 0.893 | Relatively high |
| Yunnan | 0.642 | Relatively low | Yunnan | 0.837 | Relatively high | Yunnan | 0.891 | Relatively high |
| Shaanxi | 0.917 | High | Shaanxi | 0.930 | High | Shaanxi | 0.938 | High |
| Gansu | 0.767 | Moderate | Gansu | 0.635 | Relatively low | Gansu | 0.845 | Relatively high |
| Qinghai | 0.519 | Low | Qinghai | 0.608 | Relatively low | Qinghai | 0.594 | Relatively low |
| Ningxia | 0.833 | Relatively high | Ningxia | 0.843 | Relatively high | Ningxia | 0.841 | Relatively high |
| Guangxi | 0.867 | Relatively high | Guangxi | 0.887 | Relatively high | Guangxi | 0.907 | High |
| Inner Mongolia | 0.876 | Relatively high | Inner Mongolia | 0.889 | Relatively high | Inner Mongolia | 0.887 | Relatively high |
| Object of Evaluation | 2017 Urban-Safety Resilience | 2019 Urban-Safety Resilience | 2021 Urban-Safety Resilience | 2021 Urban-Personnel-Safety Resilience | 2021 Urban-Facility-Safety Resilience | 2021 Urban-Management-Safety Resilience | |
|---|---|---|---|---|---|---|---|
| Region | |||||||
| Chongqing | H-H | H-H | H-H | H-H | H-H | H-H | |
| Sichuan | H-L | H-L | H-L | H-H | H-L | H-L | |
| Guizhou | H-H | H-H | H-H | H-H | L-H | H-H | |
| Yunnan | L-H | L-H | L-H | H-H | L-H | H-H | |
| Shaanxi | H-H | H-H | H-H | H-L | H-H | H-H | |
| Gansu | L-H | L-H | L-L | L-L | L-L | L-L | |
| Qinghai | L-H | L-L | L-H | L-H | L-H | L-H | |
| Ningxia | H-H | H-L | L-H | L-L | L-H | L-H | |
| Guangxi | H-L | H-H | H-H | H-H | H-L | H-H | |
| Inner Mongolia | H-H | H-L | H-H | L-L | H-L | H-L | |
| Object of Evaluation | 2017 UrbanSafety Resilience | 2019 Urban-Safety Resilience | 2021 Urban-Safety Resilience | 2021 Urban-Personnel-Safety Resilience | 2021 Urban-Facility-Safety Resilience | 2021 Urban-Management-Safety Resilience | |
|---|---|---|---|---|---|---|---|
| Region | |||||||
| Chongqing | Relatively significant | Relatively significant | Relatively significant | Relatively significant | Relatively significant | Insignificant | |
| Sichuan | Insignificant | Insignificant | Insignificant | Insignificant | Insignificant | Insignificant | |
| Guizhou | Insignificant | Insignificant | Insignificant | Relatively significant | Relatively significant | Relatively significant | |
| Yunnan | Insignificant | Insignificant | Insignificant | Relatively significant | Insignificant | Relatively significant | |
| Shaanxi | Relatively significant | Insignificant | Insignificant | Insignificant | Insignificant | Insignificant | |
| Gansu | Insignificant | Insignificant | Insignificant | Insignificant | Insignificant | Insignificant | |
| Qinghai | Insignificant | Insignificant | Insignificant | Insignificant | Insignificant | Insignificant | |
| Ningxia | Insignificant | Insignificant | Insignificant | Insignificant | Insignificant | Insignificant | |
| Guangxi | Insignificant | Insignificant | Insignificant | Insignificant | Insignificant | Insignificant | |
| Inner Mongolia | Insignificant | Insignificant | Insignificant | Insignificant | Insignificant | Insignificant | |
Disclaimer/Publisher’s Note: The statements, opinions and data contained in all publications are solely those of the individual author(s) and contributor(s) and not of MDPI and/or the editor(s). MDPI and/or the editor(s) disclaim responsibility for any injury to people or property resulting from any ideas, methods, instructions or products referred to in the content. |
© 2023 by the authors. Licensee MDPI, Basel, Switzerland. This article is an open access article distributed under the terms and conditions of the Creative Commons Attribution (CC BY) license (https://creativecommons.org/licenses/by/4.0/).
Share and Cite
Xiang, Y.; Chen, Y.; Su, Y.; Chen, Z.; Meng, J. Research on the Evaluation and Spatial–Temporal Evolution of Safe and Resilient Cities Based on Catastrophe Theory—A Case Study of Ten Regions in Western China. Sustainability 2023, 15, 9698. https://doi.org/10.3390/su15129698
Xiang Y, Chen Y, Su Y, Chen Z, Meng J. Research on the Evaluation and Spatial–Temporal Evolution of Safe and Resilient Cities Based on Catastrophe Theory—A Case Study of Ten Regions in Western China. Sustainability. 2023; 15(12):9698. https://doi.org/10.3390/su15129698
Chicago/Turabian StyleXiang, Yong, Yonghua Chen, Yangyang Su, Zeyou Chen, and Junna Meng. 2023. "Research on the Evaluation and Spatial–Temporal Evolution of Safe and Resilient Cities Based on Catastrophe Theory—A Case Study of Ten Regions in Western China" Sustainability 15, no. 12: 9698. https://doi.org/10.3390/su15129698
APA StyleXiang, Y., Chen, Y., Su, Y., Chen, Z., & Meng, J. (2023). Research on the Evaluation and Spatial–Temporal Evolution of Safe and Resilient Cities Based on Catastrophe Theory—A Case Study of Ten Regions in Western China. Sustainability, 15(12), 9698. https://doi.org/10.3390/su15129698