Article

Assessment of the Improvement of Public Transport in Hillside Cities Considering the Impact of Topography on Walking Choices

1
Institutes of Innovation for Future Society, Nagoya University, Nagoya 4648601, Japan
2
Localist Co., Ltd., Yokohama 2408501, Japan
3
Graduate School of Frontier Sciences, The University of Tokyo, Tokyo 1138656, Japan
*
Author to whom correspondence should be addressed.
Sustainability 2023, 15(12), 9571; https://doi.org/10.3390/su15129571
Submission received: 14 April 2023 / Revised: 20 May 2023 / Accepted: 12 June 2023 / Published: 14 June 2023

Abstract

:
This study examines the benefits of considering topography in the implementation of public transport systems and improving mobility in a hillside district in Yokohama, Japan. It studies the relationship between the improvement and the actual use of the service. A multinomial logit model that incorporates topography is developed to describe mode choice. Based on this model, utility-based accessibilities, which include topographical impact, are calculated, and the improvement resulting from the new service is analysed. The correlation between the improvement and the user’s log is also examined to verify their relationship and the impact of topographical factors, which are compared with and without the new service. The mode choice model revealed that topography had a negative impact on walking and bus egress trips, with a 1-m increase in topography corresponded to a 9.54-m walk. The utility-based accessibility approach accurately illustrated the impact of topography. The improvement of accessibility positively correlated with service use, which is further enhanced when considering the topography. These results demonstrate the impact of implementing the new service, highlight the importance of considering topography in hillside cities, and underscore the significance of the utility-based accessibility approach as a relevant methodology.

1. Introduction

Many urban districts and cities have hillside topographies, which increases the physical burden of walking and cycling on the public. The physical commitment required for these activities can be described using the metabolic equivalent of task (MET) values, which are calculated as the ratio of oxygen needed for an activity and the resting metabolic rate [1]. According to a METs compendium, physical commitment increases during uphill walking when compared to walking on flat terrain [2]. Another study found that energy consumption was minimal in moderate downhills and increased as the grade steepened [3].
Several studies suggested that this burden decreased the attractiveness of walking and cycling. For example, interview surveys of the citizens of Granada and Valencia, Spain [4], and the elderly in Oslo, Norway, have identified topography as a limiting factor for walking [5]. A best–worst scaling survey conducted in Port Alegre, Brazil, revealed a similar trend regarding the ideal walking environment [6]. On the other hand, a similar survey in a different city in Brazil showed the opposite result. The topography is an incentive rather than a barrier there, suggesting the citizens are accustomed to steep slopes [7]. A walkability assessment with the parameter of the number of contour lines in Sydney has clarified the significant negative impacts of topography on pedestrian counts [8].
Regarding the walkability assessment, a case study in Kenya has proposed the methodology of applying metabolic energy cost functions by terrain while not verified with behaviour [9].
Despite these findings, concrete methodologies for incorporating topography into transport planning based on scientific evidence have yet to be established. Such methodologies are essential, particularly for planning public transport systems that improve the mobility environment in hillside cities.
Studies on the impact of topography on travel behaviour are necessary for developing effective methodologies for transport planning. Previous studies had approached this topic from various perspectives, including route, destination, and mode choice.
In terms of the route choice, several studies focused on cycling. Stated preference data [10], revealed preference data on shared-cycle GPS data in Hamilton, Canada [11], and citizen’s cycling GPS data in Portland, US [12], revealed the negative impacts of topography on the daily cycling route choice. Similarly, a stated preference survey in Boston, US, comparing two route alternatives, one hilly and one flat, determined that the latter was more attractive for walking [13]. At the same time, a GPS survey in Brisbane revealed that cyclists choose steep streets to avoid high traffic. Although it contradicts Portland’s result [12], it would result from cyclists’ priority on topography and the heavy traffic [14].
Regarding the destination choice, research conducted in Portland, US, discovered that the average slopes of destination zones acted as obstacles to walk trips [15]. However, the literature on this topic remains scarce.
As for the mode choice, studies examined the impact of topography from both the mode-share and individual-choice perspectives. One study found that a 1% increase in slope induced a 10% decrease in the walk share [16], while another found that a 10% increase in the slope index resulted in an 8.95% decrease in the cycle share [17]. Travel data in The Netherlands [18] and other studies using spatial lag models [19] support the notion that topography negatively affects the cycling mode share.
A discrete choice modelling study in North Carolina, US, found that topography negatively impacted walking mode choice behaviour [20]. A case study in Hiroshima, Japan, demonstrated that topography had a positive impact on the utility of personal mobility vehicles as an alternative to walking for the elderly [21]. In addition, studies based on revealed trip data provided evidence for topography’s negative impact on cycling, such as in Vancouver, Canada [22], Denmark [23], and Barcelona, Spain [24]. Cervero and Duncan also clarified the impact of topography on walking and, particularly, cycling, using trip data from the San Francisco Bay Area [25]. Hilly environments also affect the behaviour of children and teenagers. Taking terrain into account has improved the mode choice model of the young in Dresden, and changes in topography harm the cycling choice [26].
Finally, a noteworthy study illustrated utility-based accessibility for walking and cycling, including the topographical factor, in a Japanese suburban area, albeit without including public transport services [27].
Despite the existing research and findings, areas requiring further exploration remain. Assessing public transport service is crucial for improving the mobility environment in hillside cities, as altering the topography itself is generally challenging. However, the literature has few studies which incorporate public transport service levels or which verify practices for enhancing the mobility environment in hillside cities through improved public transport services.
This study focused on a public transport-improvement project in a Japanese suburban hillside city and assessed the accessibility enhancement resulting from the project implementation, while considering the impact of topography on walking behaviour. Based on the results, the study examined the relationship between the accessibility improvements and the use of public transport.
Examining the impact of topography on the walking behaviour will support previous research findings. The novelty of this study lies in two characteristics: its consideration of public transport service levels and its practical verification of transportation improvement projects. These unique features should contribute to the development of methodologies that consider topography in transport planning, both as a case study and as a planning-process proposal. This study mainly aims to clarify topographical impacts rather than to provide methodological proposals. On the other hand, the results shall contribute to future methodological updates, given that few plans or studies currently include topography in travel behaviour analyses.

2. Methods

This study focuses on modelling discrete travel behaviour and measuring utility-based accessibility to describe travel mode choice mechanisms in a hillside city while considering topographical factors. Figure 1 illustrates the structure of the study.
The target area is the Tomioka district, a suburban hillside residential area in Yokohama, Japan. Although bus services connect the train station and the neighbourhood, they are limited in certain areas due to various reasons, including the steep road environment (Figure 2).
In September 2018, a paper-based questionnaire survey was conducted with the residents of the town. The survey collected data on the respondents’ travel logs, including origin–destination, travel mode, and transfer points of each linked trip on a day, as well as some personal attributes, including address, age, and car ownership (Appendix A). The survey targeted all households in the district that could be posted and requested one or two individuals over 15 years old in each household to answer. The questionnaire was mailed to 6628 households and answered by 2093 individuals from 1357 households.
Using the travel data collected, a multinomial logit model was developed to reveal the travel mode-choice mechanisms that determined the railway feeder trips aimed at heading back home. It is reasonable to target these trips as the railway station is located at the bottom of the valley, and, thus, most feeder trips originating from there are uphill.
The multinomial logit model shall be the reasonable methodology as one of the discrete choice modelling methods since this study targets the mode choice mechanism of not so many independent alternatives and aims to clarify topography’s impacts with the comparison with other effecting parameters.
Out of the 4603 linked trip data collected, 435 were those of return trips in which people used the train and deboarded at the Tomioka district station. Table 1 presents the mode share of the feeder trips from the station. The top four modes accounted for 96.1% of trips, and travels by these modes were independent between inbound and outbound trips as they did not require the travellers’ own devices. Therefore, the choice set in this model was limited to the following travel modes: walk, bus, pickup, and taxi.
In the multinomial logit model, the probability P n ( i ) of an individual n choosing an alternative i from the choice set with J alternatives with a scale parameter μ is described by:
P n i = exp ( μ V i ) j = 1 J exp ( μ V j ) , i = 1 J
Parameters in the utility function are defined for each alternative, as indicated in Table 2. Those consists of topography, personal attributes, and fundamental travel costs, including travel time or distance, and fare. To compare with topographical parameter by applying the same unit, travel time cost is applied as a distance for walking ( β 4 ). The topographical param is the difference in uphill elevation ( β 5 ). It was applied for walk and bus, as the bus trip also requires egress walking from bus stops after deboarding. The ratio of the parameter to the travel time ( β 6 ) is used to explain the egress time, to ensure independence from the travel time parameter ( β 7 ). Topography impacts behaviour as a physical burden. Given that, this study applies age as a personal attribute describing walkability ( β 9 ). Section 3.1 provides detailed information on the model and its results.
As the model fixes the trip origin at the railway station, the log sum values of this travel mode-choice model describe the utility-based accessibility of each area in the town from the train station. Such a utility-based approach was deemed suitable for this study because the methodology could reflect the behaviour mechanisms subject to several factors and alternatives. Section 3.2 presents the calculations of these accessibility values for each mode in the model choice set.
Since 2018, a railway company in the Tomioka district has been conducting a new mobility service experiment aimed at using vehicles smaller than buses to provide additional public transport service to steep areas where bus services are limited. This study focused on data obtained from the experiment conducted in 2021 and analyses the mode-choice modelling results to evaluate the improvement of utility-based accessibility resulting from the new service. Section 3.2 provides details on this evaluation.
The experiment maintained a passenger log that documented the number of passengers, their location, and the time of their boarding and alighting. Notably, the log recorded each boarding and alighting event and not the origin–destination pairs of each trip. However, some origin–destination pairs can be identified if there is only one passenger.
After eliminating the GPS errors, the log contained 3148 records, of which 499 trips had their origin–destination pairs identified. Extremely short trips (less than 1 min) and long trips (more than 30 min, which is longer than the round-trip duration) were excluded from the analysis. This study defined a trip from the station as a trip with an in-vehicle duration of less than 1 min from the station. A total of 250 trips were identified as originating from the station, and the number of passengers alighting at each grid was calculated for accessibility assessment.
Section 3.3 examines the correlation and resulting relationship between these records and accessibility improvements owing to the implementation of the new service. The analyses in this study were performed in two methods, either including or excluding the topographical factors. This comparison provided a deeper insight into how travel behaviour could be more accurately described when considering topography.
The programming language R was used for the models and calculations, and the Geographic Information System (GIS) ArcGIS Pro 3.0.3 was used for the geographical analyses unless otherwise noted.

3. Results

3.1. Topographic Impacts on Travel Mode Choice

This section aims to clarify the impact of topography on travel mode choice by developing a multinomial logit model.

3.1.1. Developing Model Inputs

The travel mode-choice model in this section assumes the origin to be the train station, to utilize the results in the accessibility measurement. Its structure and parameters are as described in the methodology (Table 2). The inputs were calculated as follows, and consequently, 407 trips with all the variables available were selected.
In relation to walking, the age data were obtained from the questionnaire travel survey. The walking distance was calculated as the shortest path between each origin–destination pair using the GIS. To improve the shortest path search, this study manually added paths only for pedestrians, with the digital road map (DRM) data by Esri-Japan as the base. Additionally, elevation was inserted for each node using the Japanese 5-m mesh digital elevation map, which allows the shortest path analysis to calculate the cumulative difference in uphill elevation along each path simultaneously.
To calculate the bus service level, the bus stop where passengers deboard must be known. This study assumed that travellers used the bus stop closest to their house. The location of the nearest stop was calculated using the distance matrix analysis on the GIS, using the same network data as the calculation for walking. The travel survey collected information on bus users’ stops through 104 answers. Among them, 78.8% corresponded to the estimated bus-stop location, which indicated the validity of this assumption.
The vehicle travel time and fare were obtained from the operating company’s information. The local municipality has been offering subscription bus tickets at low prices for the elderly over 70 years old. The bus fare for pass holders was inputted as free as their marginal cost was zero. Out of 407 trips, 101 were made by pass holders.
The walking distance and difference in elevation for egress trips were calculated in the same way as that for walking.
Based on previous research, this study assumed a walking speed of 80 m/min [28,29]. With this assumption and the walking distance, the travel time for walking could be calculated, and the total travel time could be obtained by adding the in-vehicle travel time and the ratio of egress time to the overall travel time.
For pickup trips, the travel time was determined using the shortest path analysis with DRM data. The travel cost for pickup was calculated based on the oil cost, average gasoline price (154 JPY/L) in September 2018 in Yokohama reported by the Statistics Bureau of the Ministry of Internal Affairs and Communications, Japan, and the average fuel consumption of vehicles sold in Japan in 2018 (22.0 km/L) by the Ministry of Land, Infrastructure, Transport and Tourism. Oil costs were calculated for both in-bound and out-bound routes as pickup travel requires a trip to pick up the traveller. This study assumes that the pickup alternative was available only to travellers in households with cars and multiple members, making it unavailable to all other travellers. Of the 407 trips, the pickup alternative was available for 295.
For taxis, the travel time was the same as pickup, and the fare followed the official rule of 730 JPY for the first 2 km and an additional 90 JPY for every 293 m.
Table 3 provides fundamental statistics for the inputs used in this study.

3.1.2. Parameter Estimation Results

Multinomial logit models of mode choice were developed using R-language by applying the utility functions and inputs. For comparison, this study developed two models: one including the topographical factor (Model-T), and the other one excluding it (Model-F). Table 4 presents the estimated parameter values for both models.
Both models are significant with respect to the log-likelihood ratio, hit rate, significance level of each parameter, and the logicality of positive and negative signs of parameters.
The results indicate that the topographical parameter significantly impacts walking and egress of bus trips as a barrier. The topographical parameter improves the model’s hit rate. For modes that include the topographical factor in Model-T, the hit rate increases from 68.5% to 90.7% for walking and 46.2% to 76.4% for buses.
The ratio of parameter β 4 and β 5 ( β 5 / β 4 ) in Model-T is 9.54, indicating that a 1-m difference in elevation corresponds to a 9.54-m flat walking distance.

3.2. Assessing Utility-Based Accessibility Index

The log sum values of the developed mode choice model can be used to describe the accessibility of each mode from the train station, where the model fixes the origin. The utility-based accessibility A C C k i of travel mode i to area k can be computed applying the developed utility function V i of the mode i , as shown in (2). When different travel modes are available, the accessibility A C C k to the area k by those modes can be calculated using (3).
A C C k i = ln ( exp V i )
A C C k = ln i = 1 J exp ( V i )
The accessibility index was calculated for each 50-m square grid in the entire survey area, using the same methodology for input data as in Section 3.1.1. Two assumptions were made in the calculation: First, the traveller is 75 years old and does not have a subscription pass for the bus, targeting the elderly who are especially vulnerable to mobility issues; Second, the subscription pass is not available for the new mobility service during the period of evaluation, enabling an assessment of the service on an even ground.
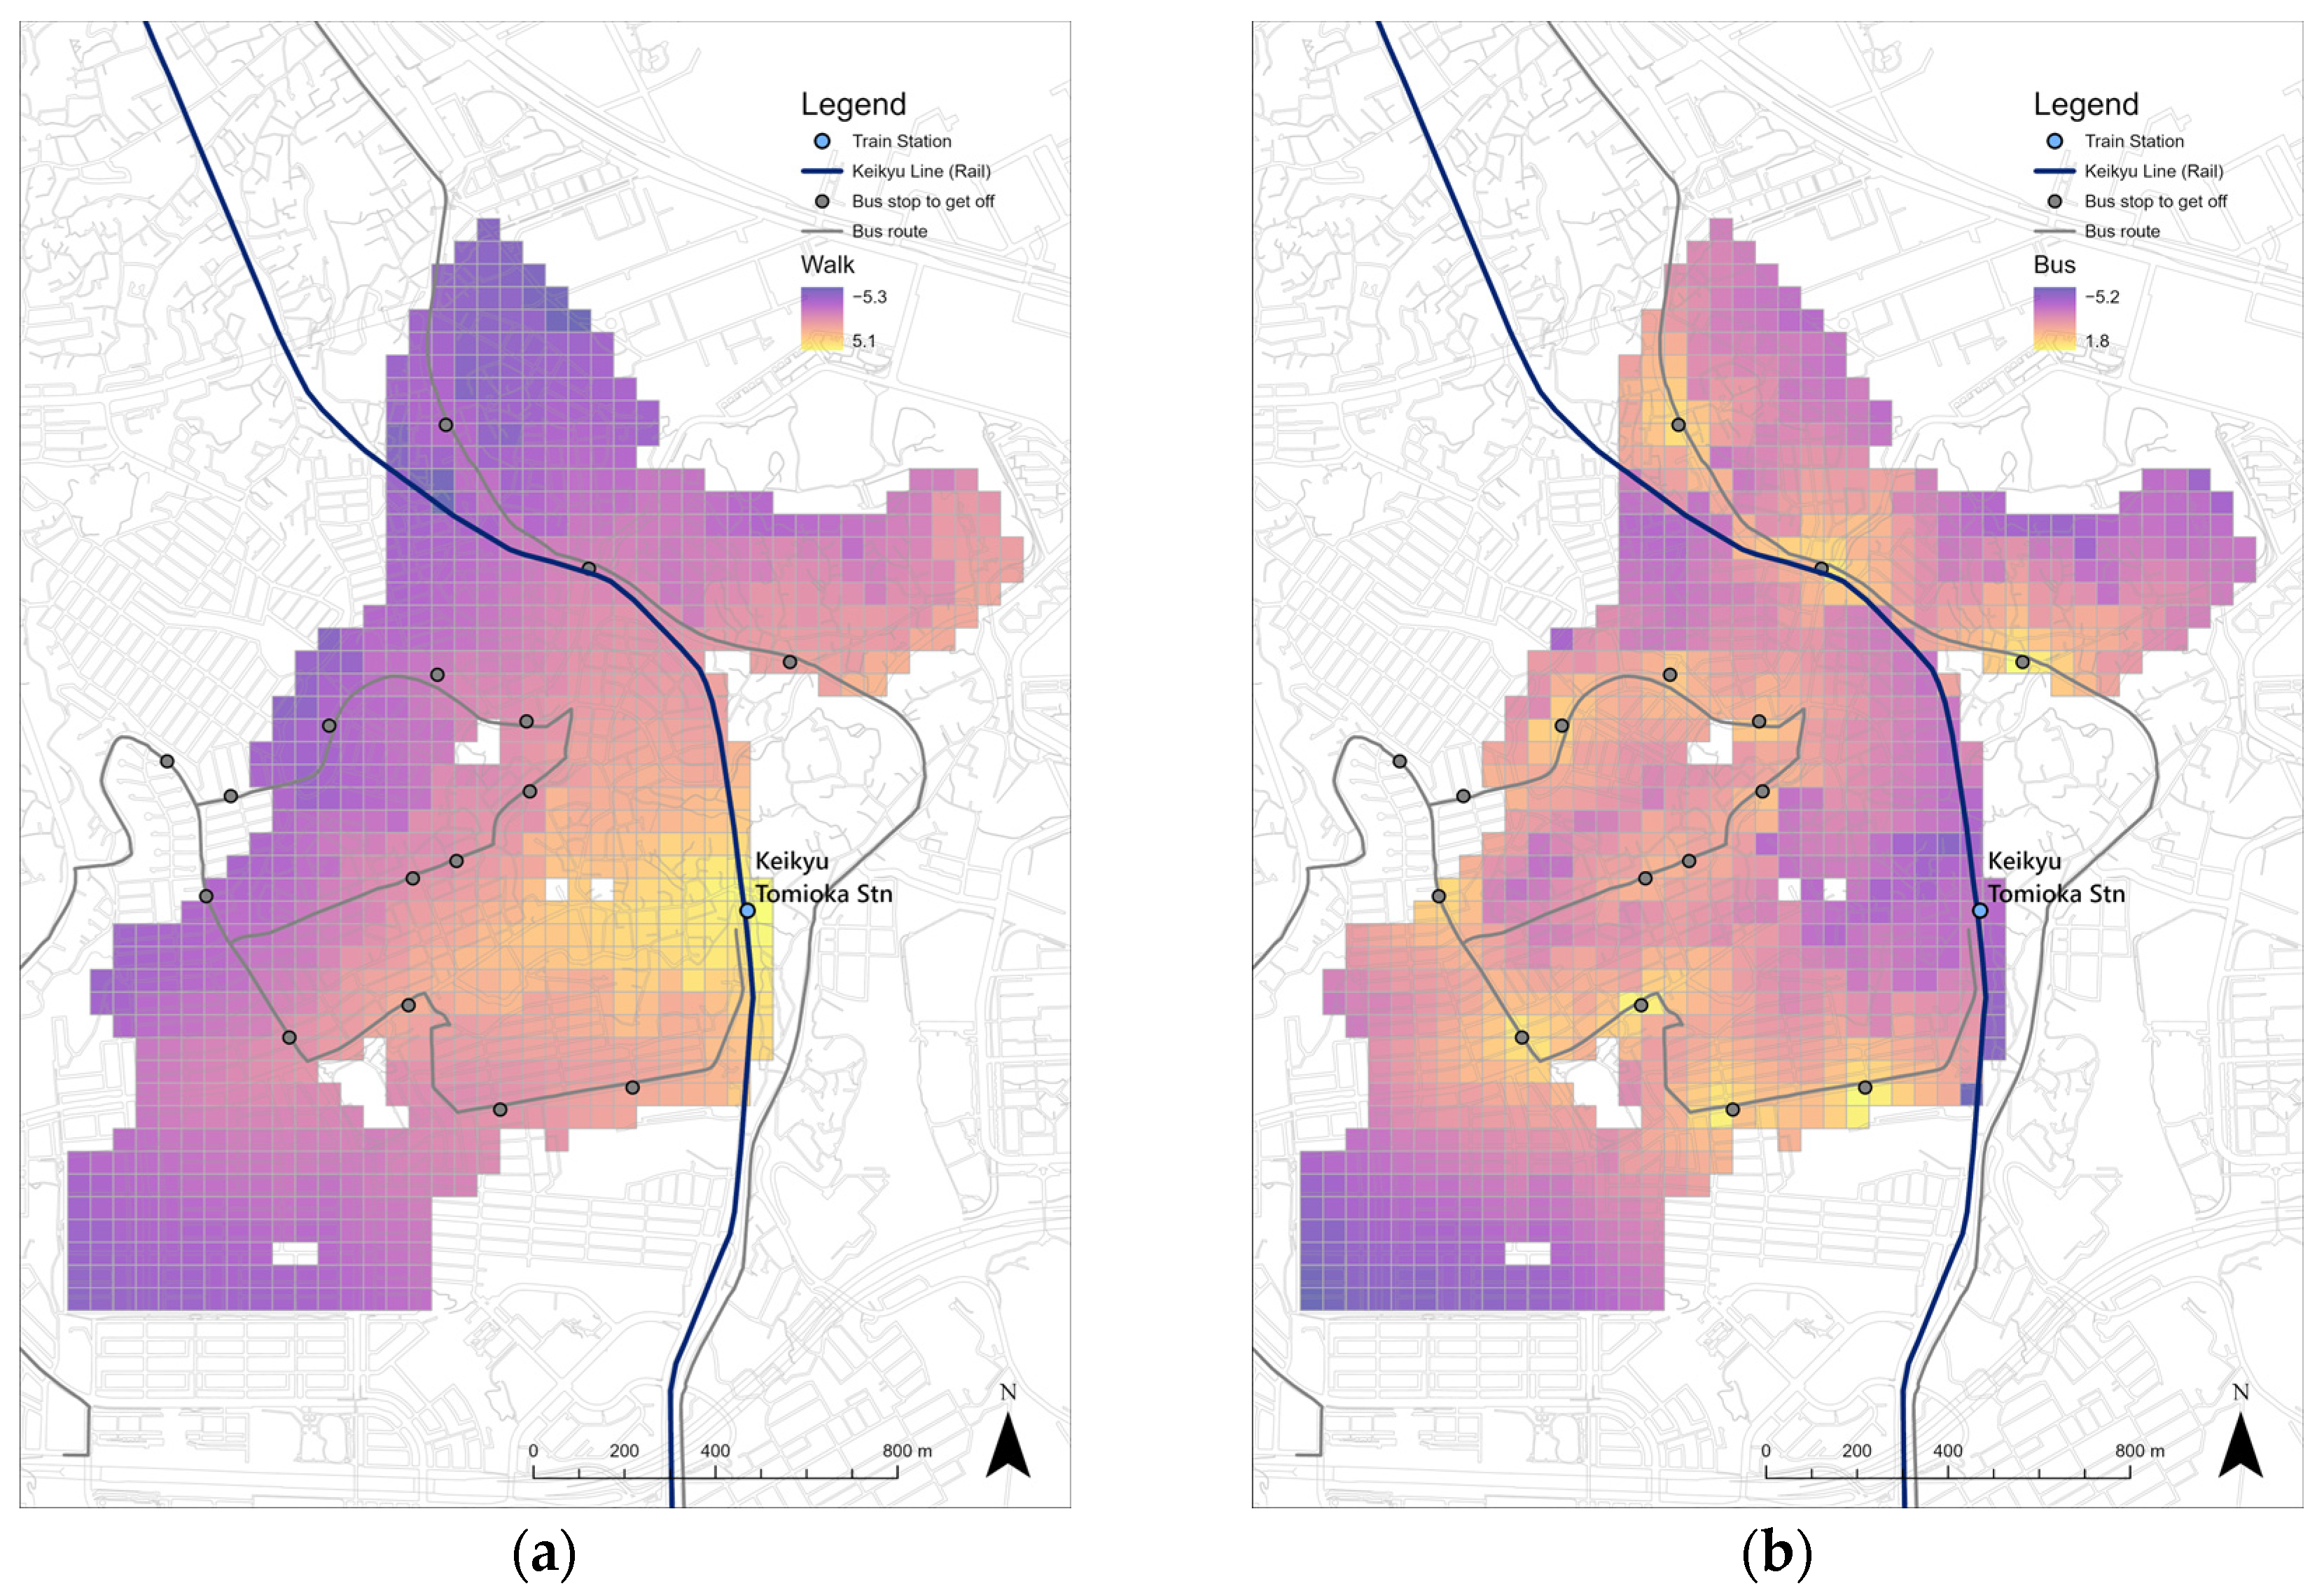
Figure 3 illustrates the accessibility values of each grid from the station based on the mode choice model, including the topographical factor (Model-T). Figure 3a shows the values by walking, while Figure 3b shows the values by bus.
Accessibility by walking does not form concentric circles from the station, and decreases more rapidly in the north–south direction than in the east–west direction. This trend accurately reflects the valley terrain that runs in the east–west direction in the district. Figure 3b provides a clear explanation for the higher accessibility around bus stops, even in grids farther away from the station.
This study implemented a new mobility service that provides an additional travel mode alternative for each grid. The service follows a fixed route and schedule, similar to the bus service. Therefore, it is reasonable to apply the bus utility function to assess the new mobility service, although the model does not include that choice set.
The fare for the new mobility service is 200 JPY, which is almost the same as the bus fare. Unlike the conventional bus, the new mobility service allows passengers to get on or off anywhere on the route. To reflect this characteristic, virtual stops were placed every 10 m on the route. The accessibility calculation methodology for each grid remains the same as in Section 3.1.1. To compare the accessibility of each grid by the bus and the new mobility service, the accessibility for each grid was calculated based on the utility functions of both modes. The traveller in a grid would choose the new mobility service if its accessibility was higher than that of the bus, and vice versa. The methodology for calculating the accessibility for each grid fully followed that for bus accessibility.
Figure 4 illustrates the accessibility of each grid after implementing the new mobility service. Figure 4a shows the result of accessibility by walking, bus, or the new mobility service. Figure 4b depicts the difference in accessibility by implementation, which is the result of comparing Figure 3b and Figure 4a.

3.3. Relationship between Accessibility Improvements and Use of New Service

In this section, the relationship between the accessibility improvement by the new mobility service and the number of passengers deboarding there is verified. Table 5 presents the correlation coefficient of these variables, comparing the results based on the mode-choice model with (Model-T) and without (Model-F) topography. Coefficients were calculated with both the accessibility by the new mobility service and increase by implementation. Additionally, all travel logs and identified origin–destination pairs were applied as the usage data of deboarding passengers. Table 6 shows the distribution of how many travel logs were recorded in each assessment grid.
All results on correlations were significant at the level of 1% or less. The correlations between the accessibility value and the number of passengers were between 0.20 and 0.23, which suggest a marginal positive relationship. However, this value was lower when considering topography. We concluded that accessibility itself does not consider other modes, including walking, which is impacted more severely by topography.
Meanwhile, relationships between the accessibility increase and the number of passengers were more robust when considering the topographical impacts. This result is reasonable considering the utility of walking and conventional bus services.

4. Discussion

The study’s findings were summarized in Section 3. The mode choice model, which incorporates topographical factors, indicates that the elevation difference negatively impacts walking, including egress walking from bus stops, which, in turn, affects bus utility. These findings support those obtained in previous studies [16,17,18,19,20,21].
An analysis of the relationship between walking distance and elevation difference showed that a 1-m increase in elevation led to a 9.54-m increase in the walking distance. This result, which had not been described in previous studies, is a useful piece of evidence that encourages the consideration of topography in practical transportation planning. However, because this value is based on a single case study, similar analyses are needed to confirm its generality.
The log sum values of the mode-choice utility functions quantify the accessibility distribution for each mode based on the behavioural mechanisms, including the impact of topography. This model enables the discussion of countermeasures to improve the mobility environment in hillside cities by applying public-transport utility functions, instead of changing the topography, which is generally difficult. This is one of the novel contributions of this study compared to previous studies that have assessed mobility environments in hillside cities including only walking or cycling [27].
Furthermore, this study focuses on the implementation of a new public transport project aimed at improving mobility. As described in Section 3.2, the mode-choice model and its log-sum values enabled the assessment of accessibility improvements resulting from the implementation of the new mobility service. The analysis reveals a positive correlation between accessibility improvements and the number of passengers, suggesting that the new service will provide efficient mobility to people who previously had limited accessibility.
The correlation is even stronger when comparing the results with and without topographical factors, thus emphasizing the importance of considering topography when assessing mobility environments in hillside cities.

5. Conclusions

This study aimed to evaluate the effectiveness of a new public transport service in a hillside city and the impact of topography on travel behaviour. The travel mode choice model developed for railway feeder trips demonstrated the negative impact of topography on walking and bus choices, which can be attributed to the increase in the walking distance by 9.54 m corresponding to every 1-m increment in elevation change.
The model provided utility-based accessibility data for each area in the district and enabled the assessment of accessibility improvement with the implementation of the new mobility service. Analyses of user logs revealed a positive correlation between the utilization of the new service and the accessibility improvements. This correlation was found to be stronger when considering topography.
Although this study has produced valuable findings, it has two limitations: one related to the methodology and the other to data.
First, this study employed a bus utility function to describe the new mobility service, as both provide similar solutions. While the difference between the two is that the new service allows passengers to board or deboard anywhere along the route, the use of densely placed virtual stops enabled us to describe it within the same model. However, this methodology may have limitations if the new service were substantially different from the conventional travel modes which the model can accommodate.
The second limitation pertains to the absence of personal attributes, like residence location, and age, in the user’s log of the new service. Due to this limitation, the evaluations in this study had to be performed based on where the passengers deboarded, rather than on their final destination, as should be done ideally.
In addition, further studies in other districts or projects shall help ensure this study’s generality, especially for results with specific values, such as the equivalent walking distance to a 1-m increase in elevation.
Despite these limitations, this study has delivered useful conclusions about the impact of topography on travel behaviour and the effectiveness of a new public transport service in a hillside city. The results and discussions presented here should contribute to the development of transport planning methodologies for hillside cities. By verifying a project in practice and developing a process to assess topography in analyses and planning, this study provides a valuable foundation for future research in this area.

Author Contributions

Conceptualization, G.H.; methodology, G.H. and R.A.; software, G.H.; validation, R.A. and T.M.; formal analysis, G.H.; investigation, G.H. and R.A.; resources, R.A.; data curation, G.H. and R.A.; writing—original draft preparation, G.H.; writing—review and editing, R.A., T.M. and F.N.; visualization, G.H.; supervision, T.M. and F.N.; project administration, R.A.; funding acquisition, G.H., R.A. and F.N. All authors have read and agreed to the published version of the manuscript.

Funding

This study was funded by JSPS through the KAKENHI, Grants-in-Aid for Scientific Research program (Grant No. 21J14695) and JST through the Center of Innovation (COI) program (Grant No. JPMJCE1318).

Institutional Review Board Statement

Regarding our questionnaire survey, it is too difficult to identify individuals on the dataset, and respondents always have the right to stop answering. In this context, our survey does not require ethical approval under the Japanese Act, the guideline of the organization that has organized it, and the Declaration of Helsinki.

Informed Consent Statement

Not applicable.

Data Availability Statement

The travel data and the user’s log are not publicly available due to privacy reasons and intellectual property rights held by the private company that owns the data.

Acknowledgments

The authors are grateful to Keikyu Corporation, the railway company serving the target district, for providing the travel data and the user’s log.

Conflicts of Interest

The authors declare no conflict of interest.

Appendix A

The travel survey is a paper-based questionnaire encompassing various inquiries. Notably, this study only employs a few of them. The travel-related questions included in the survey are as follows: the frequency of travel, frequency of travel to each station, travel mode, and a detailed log of travel undertaken in a day. The travel log survey requires the respondent to furnish information about each linked trip taken on the day, up to a maximum of four trips. Information required includes the date, origin and destination of each trip, the modes of primal and feeder travel used, the travel purpose, and the specific station or bus stop where the respondent boarded or deboarded. Personal attributes of the respondents were also collected, including household size, car or bicycle ownership, possession of a driver’s license and a subscription bus ticket, sex, age, length of time for which the respondent has been residing at current address, and walking difficulties. Additionally, an open-ended question was included to gather the respondents’ opinions.

References

  1. Jette, M.; Sidney, K.; Blumchen, G. Metabolic Equivalents (METs) in Exercise Testing, Exercise Prescription, and Evaluation of Functional-Capacity. Clin. Cardiol. 1990, 13, 555–565. [Google Scholar] [CrossRef] [PubMed]
  2. Ainsworth, B.E.; Haskell, W.L.; Herrmann, S.D.; Meckes, N.; Bassett, D.R.; Tudor-Locke, C.; Greer, J.L.; Vezina, J.; Whitt-Glover, M.C.; Leon, A.S. 2011 Compendium of Physical Activities: A Second Update of Codes and MET Values. Med. Sci. Sport. Exerc. 2011, 43, 1575–1581. [Google Scholar] [CrossRef] [PubMed] [Green Version]
  3. Minetti, A.E.; Moia, C.; Roi, G.S.; Susta, D.; Ferretti, G. Energy cost of walking and running at extreme uphill and downhill slopes. J. Appl. Physiol. 2002, 93, 1039–1046. [Google Scholar] [CrossRef] [PubMed] [Green Version]
  4. Ferrer, S.; Ruiz, T. The impact of the built environment on the decision to walk for short trips: Evidence from two Spanish cities. Transp. Policy 2018, 67, 111–120. [Google Scholar] [CrossRef]
  5. Nordbakke, S. Capabilities for mobility among urban older women: Barriers, strategies and options. J. Transp. Geogr. 2013, 26, 166–174. [Google Scholar] [CrossRef]
  6. Larranaga, A.M.; Arellana, J.; Rizzi, L.I.; Strambi, O.; Cybis, H.B.B. Using best-worst scaling to identify barriers to walkability: A study of Porto Alegre, Brazil. Transportation 2019, 46, 2347–2379. [Google Scholar] [CrossRef]
  7. Ruiz-Padillo, A.; Oestreich, L.; Torres, T.B.; Rhoden, P.S.; Larranaga, A.M.; Cybis, H.B. Weighted assessment of barriers to walking in small cities: A Brazilian case. Transp. Res. Part D-Transp. Environ. 2022, 109, 103392. [Google Scholar] [CrossRef]
  8. Rahman, A. A GIS-based, microscale walkability assessment integrating the local topography. J. Transp. Geogr. 2022, 103, 103405. [Google Scholar] [CrossRef]
  9. Paez, A.; Anjum, Z.; Dickson-Anderson, S.E.; Schuster-Wallace, C.J.; Ramos, B.M.; Higgins, C.D. Comparing distance, time, and metabolic energy cost functions for walking accessibility in infrastructure-poor regions. J. Transp. Geogr. 2020, 82, 11. [Google Scholar] [CrossRef]
  10. Stinson, M.A.; Bhat, C.R.; Trb. Commuter bicyclist route choice—Analysis using a stated preference survey. Transp. Res. Rec. 2003, 1828, 107–115. [Google Scholar] [CrossRef]
  11. Lu, W.; Scott, D.M.; Dalumpines, R. Understanding bike share cyclist route choice using GPS data: Comparing dominant routes and shortest paths. J. Transp. Geogr. 2018, 71, 172–181. [Google Scholar] [CrossRef]
  12. Broach, J.; Dill, J.; Gliebe, J. Where do cyclists ride? A route choice model developed with revealed preference GPS data. Transp. Res. Part A-Policy Pract. 2012, 46, 1730–1740. [Google Scholar] [CrossRef]
  13. Guo, Z. Does the pedestrian environment affect the utility of walking? A case of path choice in downtown Boston. Transp. Res. Part D-Transp. Environ. 2009, 14, 343–352. [Google Scholar] [CrossRef]
  14. Halefom, T.H.; Pullar, D.; Pojani, D.; Asamoah, E.F. How much traffic stress can cyclists endure? Case Stud. Transp. Policy 2022, 10, 2251–2261. [Google Scholar] [CrossRef]
  15. Clifton, K.J.; Singleton, P.A.; Muhs, C.D.; Schneider, R.J. Development of destination choice models for pedestrian travel. Transp. Res. Part A-Policy Pract. 2016, 94, 255–265. [Google Scholar] [CrossRef]
  16. Meeder, M.; Aebi, T.; Weidmann, U. The influence of slope on walking activity and the pedestrian modal share. Transp. Res. Procedia 2017, 27, 141–147. [Google Scholar] [CrossRef]
  17. Parkin, J.; Wardman, M.; Page, M. Estimation of the determinants of bicycle mode share for the journey to work using census data. Transportation 2008, 35, 93–109. [Google Scholar] [CrossRef] [Green Version]
  18. Rietveld, P.; Daniel, V. Determinants of bicycle use: Do municipal policies matter? Transp. Res. Part A-Policy Pract. 2004, 38, 531–550. [Google Scholar] [CrossRef]
  19. Vandenbulcke, G.; Dujardin, C.; Thomas, I.; de Geus, B.; Degraeuwe, B.; Meeusen, R.; Panis, L.I. Cycle commuting in Belgium: Spatial determinants and ‘re-cycling’ strategies. Transp. Res. Part A-Policy Pract. 2011, 45, 118–137. [Google Scholar] [CrossRef] [Green Version]
  20. Rodriguez, D.A.; Joo, J. The relationship between non-motorized mode choice and the local physical environment. Transp. Res. Part D-Transp. Environ. 2004, 9, 151–173. [Google Scholar] [CrossRef]
  21. Nguyen, T.A.H.; Chikaraishi, M.; Seya, H.; Fujiwara, A.; Zhang, J.Y. Elderly’s heterogeneous responses to topographical factors in travel mode choice within a hilly neighborhood: An analysis based on combined GPS and paper-based surveys. Eur. J. Transp. Infrastruct. Res. 2017, 17, 411–424. [Google Scholar]
  22. Winters, M.; Brauer, M.; Setton, E.M.; Teschke, K. Built Environment Influences on Healthy Transportation Choices: Bicycling versus Driving. J. Urban Health-Bull. N. Y. Acad. Med. 2010, 87, 969–993. [Google Scholar] [CrossRef] [Green Version]
  23. Nielsen, T.A.S.; Olafsson, A.S.; Carstensen, T.A.; Skov-Petersen, H. Environmental correlates of cycling: Evaluating urban form and location effects based on Danish micro-data. Transp. Res. Part D-Transp. Environ. 2013, 22, 40–44. [Google Scholar] [CrossRef]
  24. Braun, L.M.; Rodriguez, D.A.; Cole-Hunter, T.; Ambros, A.; Donaire-Gonzalez, D.; Jerrett, M.; Mendez, M.A.; Nieuwenhuijsen, M.J.; de Nazelle, A. Short-term planning and policy interventions to promote cycling in urban centers: Findings from a commute mode choice analysis in Barcelona, Spain. Transp. Res. Part A-Policy Pract. 2016, 89, 164–183. [Google Scholar] [CrossRef] [Green Version]
  25. Cervero, R.; Duncan, M. Walking, bicycling, and urban landscapes: Evidence from the San Francisco Bay area. Am. J. Public Health 2003, 93, 1478–1483. [Google Scholar] [CrossRef]
  26. Muller, S.; Mejia-Dorantes, L.; Kersten, E. Analysis of active school transportation in hilly urban environments: A case study of Dresden. J. Transp. Geogr. 2020, 88, 102872. [Google Scholar] [CrossRef]
  27. Terayama, K.; Odani, M.; Iwasaki, K. Study on Evaluation of Convenience of Access to the Nearest Railway Station by Residents in Housing Development Areas in the Suburbs of Kobe City in Japan-Using Utility-Based Accessibility Measures. J. East. Asia Soc. Transp. Stud. 2015, 11, 379–391. [Google Scholar] [CrossRef]
  28. Kidokoro, T.; Peterson, S.J.; Reimer, H.K.; Tomkinson, G.R. Walking speed and balance both improved in older Japanese adults between 1998 and 2018. J. Exerc. Sci. Fit. 2021, 19, 204–208. [Google Scholar] [CrossRef] [PubMed]
  29. Obuchi, S.P.; Kawai, H.; Murakawa, K. Reference value on daily living walking parameters among Japanese adults. Geriatr. Gerontol. Int. 2020, 20, 664–669. [Google Scholar] [CrossRef]
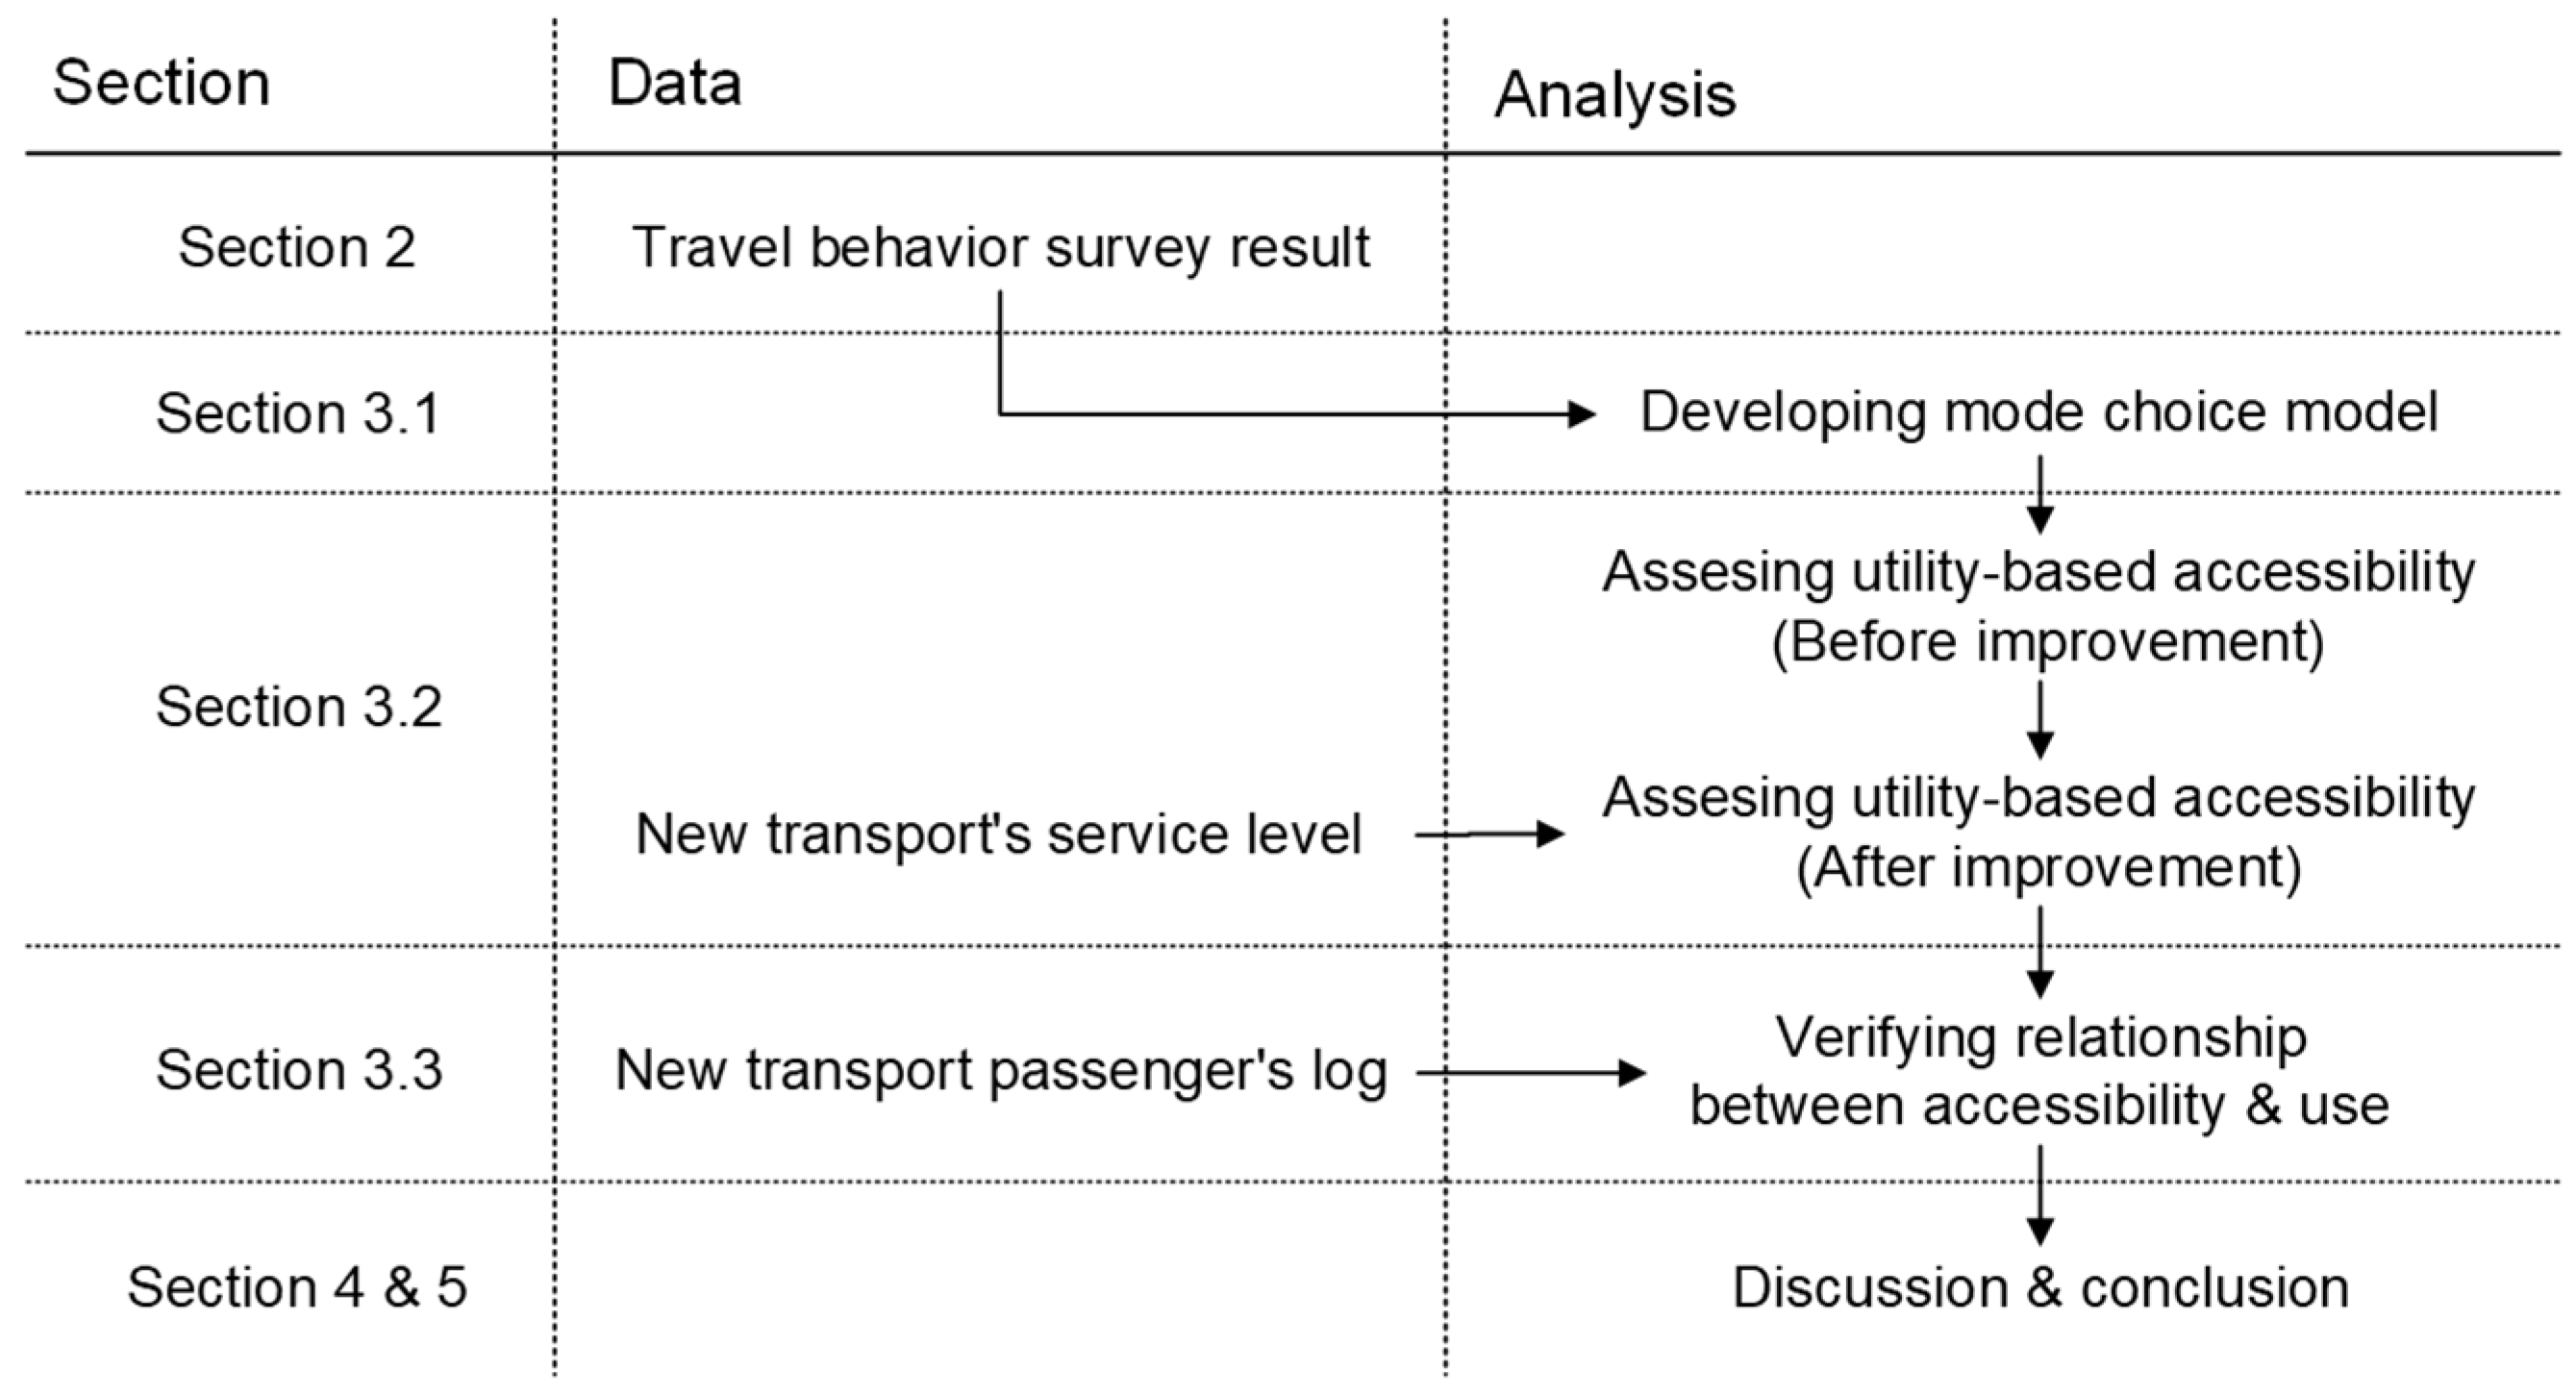
Figure 1. Structure of the study.
Sustainability 15 09571 g001
Figure 2. Outline of the area of study in Tomioka district, Yokohama, Japan.
Sustainability 15 09571 g002
Figure 3. Assessment results of utility-based accessibility from the train station: (a) accessibility by walking; (b) accessibility by bus.
Sustainability 15 09571 g003
Figure 4. Assessment results of utility-based accessibility from the train station: (a) accessibility by walking, bus, or the new mobility service after implementing the latter; (b) difference in accessibility after implementing the new mobility service.
Sustainability 15 09571 g004
Table 1. Travel mode share of railway feeder trips.
Travel ModeNumber of TripsMode Share (%)Cumulative Percentage (%)
Walk26160.060.0
Bus11025.385.3
Pickup (by others)276.291.5
Taxi204.696.1
Motorcycle92.198.2
Bicycle61.499.5
Drive20.5100.0
Table 2. Utility function parameters.
ParameterUnitWalkBusPickupTaxi
Constant- β 1 β 2 β 3 -
Walking distanceMeter β 4 ---
Uphill elevation differenceMeter β 5 β 5 --
Ratio of egress to travel time-- β 6 --
Travel timeMinute- β 7 β 7 β 7
Fare, costJPY- β 8 β 8 β 8
Age- β 9 ---
Table 3. Fundamental statistics of model inputs.
VariableUnitMeanMinMaxSD
Walking distanceMeter9171591765332
Ratio of egress to travel time-0.320.000.800.17
Travel time (Bus)Minute10.52.119.04.0
Trave time (Pickup/Taxi)Minute4.30.17.31.5
Difference in elevation (walk)Meter42.119220.2
Difference in elevation (bus egress)Meter5.00305.3
Fare (Bus)JPY144.0020083.4
Fare (Taxi)JPY730.07308206.3
Cost (Pickup)JPY14.00305.6
AgeYear61.0159517.1
Table 4. Estimated parameters of mode choice models.
β ParameterUnitModel-TModel-F
β 1 Constant-9.540 ***8.892 ***
β 2 Constant-4.556 ***4.193 ***
β 3 Constant-6.602 ***6.216 ***
β 4 Walking distanceMeter−0.004 ***−0.005 ***
β 5 Uphill elevation differenceMeter−0.035 ***-
β 6 Ratio of egress to travel time-−4.536 ***−4.976 ***
β 7 Travel timeMinute−0.217 ***−0.164 ***
β 8 Fare, costJPY−0.010 ***−0.010 ***
β 9 AgeYear−0.058 ***−0.056 ***
Adjusted log-likelihood ratio 0.530.52
Hit rate 77.4%55.5%
Significance levels: *** <0.1%.
Table 5. Correlation coefficient between accessibility and passengers’ use.
Number of Passengers Getting OffAccessibility by the New ServiceWith Topography
(Model-T)
Without Topography(Model-F)
All logAccessibility itself0.20 ***0.23 **
Difference in value0.36 ***0.24 ***
Origin–destination identifiedAccessibility itself0.20 ***0.22 ***
Difference in value0.36 ***0.24 ***
Significance level: *** <0.1%, ** <1%.
Table 6. Users’ log distribution of the new service.
DataMeanMinMaxSD
All travel logs5.4706610.2
Travel logs identified origin-destination pair1.330142.66
Disclaimer/Publisher’s Note: The statements, opinions and data contained in all publications are solely those of the individual author(s) and contributor(s) and not of MDPI and/or the editor(s). MDPI and/or the editor(s) disclaim responsibility for any injury to people or property resulting from any ideas, methods, instructions or products referred to in the content.