Article

Interconnection between the Dynamic of Growing Renewable Energy Production and the Level of CO2 Emissions: A Multistage Approach for Modeling

1
Faculty of Management, Lublin University of Technology, 20-618 Lublin, Poland
2
Department of Marketing, Sumy State University, 40007 Sumy, Ukraine
3
Economic Cybernetics Department, Sumy State University, 40007 Sumy, Ukraine
4
Faculty of Public Administration and Business, WSEI University, 20-209 Lublin, Poland
5
Faculty of Economics and Management, West Ukrainian National University, 46027 Ternopil, Ukraine
*
Author to whom correspondence should be addressed.
Sustainability 2023, 15(12), 9473; https://doi.org/10.3390/su15129473
Submission received: 25 May 2023 / Revised: 7 June 2023 / Accepted: 11 June 2023 / Published: 13 June 2023
(This article belongs to the Special Issue Security Issues in the Research and Application of Renewable Energy)

Abstract

:
The global reduction of carbon dioxide emissions is one of the critical priorities for implementing the Sustainable Development Goals by 2030 and the Paris Agreement 2015. Therefore, it stimulates and increases the ability of countries to implement green imperatives in policies to force the anthropogenic environment, reduce use of fossil fuels, and simultaneously develop alternative energy. Thus, it is crucial to understand the impact of renewable energy development on the dynamic of CO2 pollution. Countries can increase or decrease the development of renewable energy depending on the effectiveness of its impact on the level of CO2 pollution. This paper aims to analyze the influence of the growth dynamics of renewable energy production in countries on CO2 emissions. The article uses Ward’s method to test the research hypothesis. Empirical results allowed us to conclude the interdependence of renewable energy production and CO2 emissions. The results indicate a strong relationship between the level of renewable energy production and carbon emissions in countries. For the global development of renewable energy technologies, governments must understand their impact on changing the scale of environmental pollution and expand the awareness of state leadership, the business sector, and society.

1. Introduction

Combating global climate change has long since become mainstream in most developed countries. The problem of global warming caused by carbon dioxide (CO2) emissions was reflected in 2015 when 196 countries joined the consensus document “Paris Agreement”, which implements various measures to reduce CO2 emissions from 2020 [1,2]. Global warming is primarily associated with increased concentration of CO2 in the environment due to burning fossil natural resources (oil, coal, and gas). In recent decades, the scientific community has been actively developing new and improving current practices for implementing the 2030 Agenda for Sustainable Development. Previous studies have shown that using a wide range of approaches and tools stimulates the implementation of sustainable management practices. In particular, it is adequate to work in the following fields and areas: study of the impact of regulatory and direct restrictions on the pollution dynamics [3]; assessment of the influence of indicators of the national economy on the environmental protection processes [4,5]; study of prerequisites for improving the energy security of countries [6,7]; introduction of green financial instruments [8]; application of specific restrictions on the development of economic sectors of countries [9]; development of new and improvement of existing energy technologies, use of intelligent networks [10,11,12]; analysis of green taxation [13,14]; research of social, economic, technological, ecological, and social scenarios of the sustainable growth [15,16]; implementation of environmental management [17,18]; research on the development of alternative energy [19,20,21]; analysis of green competitiveness at the level of countries and individual companies [22,23]; study of the features of the functioning of the circular economy [24,25]; assessment of energy gaps and efficiency of the energy sector [26,27].
The acceleration of relevant processes is followed in the global business environment. According to Bloomberg [28], in 2020, USD 501.5 billion was invested in the transition technologies of the energy decarbonization of the economy in the United States, which is a record amount compared to the previous 10-year period when funding was USD 303.5 billion in renewable sources energy In addition, the dynamics of the implementation of decarbonization market instruments by countries and the increase in the share of renewable energy production worldwide indicate a steady trend of their spread. Thus, the percentage of RES in the energy balance in 2021 is Sweden—69%, Denmark—78%, Latvia—63%, Slovenia—33%, Estonia—47%, and Germany—41% [29,30,31]. Implementing alternative energy has several indisputable advantages: inexhaustibility of resources, safety for the environment, economic benefit, autonomy, a long period of operation, formation of a positive image, stability, and the possibility of earning. However, not all countries have actively joined the implementation of alternative energy. Thus, it is quite essential to determine how introducing renewable energy sources affects the reduction of CO2 emissions, which in the future can become an appropriate stimulus for activating the decarbonization processes of countries.
Thus, it is relevant from this perspective to assess the effectiveness of the implementation of renewable energy projects from the point of view of their impact on the decarbonization of national economies and ensuring the sustainable development of countries. The object of the study is 112 countries. Despite the strong background in analyzing the theoretical framework of decarbonization processes and assessment of renewable energy development [32,33,34,35,36,37,38], the conclusions need to consider the influence of renewable energy production on the reduction of CO2 emission.
The paper contains a literature review, which analyzes the development of renewable energy and its link with CO2 emission dynamics; materials and methods, which explains the methodology used in the paper; results, giving the representation of the findings; a discussion part with an analysis of the obtained findings and previous research; and a conclusion, clarifying the critical paper’s outcomes, regulatory recommendations, limitations, and future directions for study.

2. Literature Review

The literature review results allow us to emphasize the significant alternative energy impact on climate change mitigation, particularly the impact on the CO2 emission dynamic. The authors [39] used the Fuzzy DEMATEL model for the assessment of CO2 emission and for outlining the significance of global economy decarbonization for seven emerging countries. They concluded that carbon emissions are a distressing global environmental problem and result from accelerating fossil fuel use. At the same time, renewable energy implementation can be an important method for the decarbonization of energy sectors and economies. At the same time, the scholars [40] justified the implementation of recent fiscal instruments, such as green bonds, for supporting investment processes in renewable energy development. The calculations for China’s economy significantly facilitate green investment and reduce CO2 pollution. They also accented the necessity of renewable expansion for China’s economy and the global economic sector for stimulating SDG 2030 implementation. Barbar et al. [41] underscored that the success of decarbonization efforts depends directly on alternative technology development. Based on the scenario approach, they assessed electric vehicles and a power systems implementation. Adebayo et al. [42] empirically justified the interconnection between CO2 emissions and implementing fiscal tools for investing in sustainable energy technologies. They noticed that green investments could reduce CO2 emissions while the acceleration of economic development intensifies it. In the frame of implementation of SDG 2030, the scholars in [43] provided a systematic analysis of the nexus between clean energy spreading, environmental sustainability actions, and ecological quality. The study realized that the E-7 economies point to the interdependence of financial and renewables development and environmental pollution. Tang et al. [44] showed that an effective regulatory system and well-developed state institutions reduce the negative environmental impacts. Using the CS-ARDL approach, they described the moderate economic development in Asia with regard to carbon dioxide reduction. Rogala et al. [45] chose Polish biogas potential as a system that can stabilize alternative energy. They also emphasized its core significance in decreasing CO2 emissions. The results of calculations for Malaysia proved that promoting renewable energy initiatives can reduce absolute carbon emissions by 20 per cent. The authors emphasized the necessity to implement several state incentives for the green energy sector, particularly the decarbonization of electricity production. Scientists in [46] studied the impact of renewable energy production on developing the circular economy for 193 countries. Using panel data with various effects, they proved that alternative electricity production provides so-called adjusted savings in the form of reduced forest depletion. At the same time, the study [47] examined the interconnection between 25 EU Member States’ economic growth, carbon emissions, total energy consumption, and investments indicators. They proved such interdependences’ causality and outlined the positive correlation between GDP growth, pollution, and energy consumption increase. The authors [48] examined the United States’ second-largest CO2-emitting economy as it plans to reduce its environmental challenges and contribute to achieving the Sustainable Development Goals 2030. They explored the transition to renewable energy and environmental innovations that will accelerate the decarbonization of the US economy. Using the ARDL approach, the authors illustrated the co-integration of the investigated variables in the long-term and short-term perspective and also emphasized that the transition to renewable energy reduces carbon emissions. Zhang [49] investigated the interconnection between energy transition processes and implementing environmental innovations with environmental sustainability. The article examined the ten most populous Asian countries in the context of the impact of renewable energy production and consumption, the development of ecological innovations, and the development of scientific research on the scale of CO2 pollution. The results showed that industrialization processes significantly increase CO2 emissions. Interesting is the study of the authors in [50], who the development of the stock market as a driver of the promotion of renewable energy on CO2 emissions. Empirical findings indicate that foreign direct investment is an essential financial instrument stimulating energy conservation. The authors [51] examined the asymmetric and long-term effects of the UK energy sector’s impact on environmental degradation. Using the nonlinear autoregressive distribution model, they evaluated energy efficiency change scenarios. The study results indicated that the increase in productivity in the energy sector and introducing renewable energy sources contributed to reducing carbon emissions, but there is a gap in the scientific approaches to investigate the interconnection between the development of renewable energy production in countries and the level of carbon emissions.
The analysis of the existing practice of studying the impact of renewable energy is nonsystematic. In general, scientists evaluate the impact of green innovations and the implementation of separate environmental projects on changes in the quality of the environment and, in particular, CO2 emissions. Such studies are conducted for some countries, groups, or regions. Thus, it is relevant to assess the impact of renewable energy development on the decarbonization of national economies. The paper aims to substantiate and empirically confirm the connection between the sustainable increase of renewable energy production in countries and the level of CO2 emissions.

3. Materials and Methods

Evaluation of the efficiency of using renewable energy indicators in 112 countries is proposed to be carried out within five stages.

3.1. Formation of a Sample of Indicators

The first stage is devoted to forming the input sample of renewable energy indicators and indicators that determine this economic sector’s regulatory and legal field of operation.
To evaluate the effectiveness of renewable energy indicators, renewable energy consumption indicators for 112 countries were used, recorded by the World Bank’s sustainable energy database based on the data of the SE4ALL global tracking system and the International Energy Agency [52]. The regulatory and legal indicators were formed based on the reports of the RISE International Agency, which is engaged in the formation of a database and research of regulatory sustainable energy indicators in the countries of the world [53]. This makes it possible to compare the national policies and legal frameworks of sustainable energy in different countries [54,55].
Therefore, the input sample of the study is statistical data, namely [52,53,54,55,56]:
K1—consumption of renewable energy;
K2—production of solar energy;
K3—an indicator of the total output of renewable energy;
M4—legislation background for renewable energy promotion;
M5—the potential for the expansion of renewable energy;
M6—incentive mechanisms and organizational support for renewable energy;
M7—financial instruments and regulatory incentives.
Each of the indicators M4–M7 is already aggregated and is measured on a 100-point scale (0 is the worst and 100 is the best value of the indicator). Information about the input data is given in Table 1.

3.2. Checking the Density and Directions of Relationships between the Studied Indicators

Descriptive analysis using the tools of descriptive statistics was used to form a statistically significant characteristic space of indicators of renewable energy consumption, solar energy production, total renewable energy production, a legal framework for renewable energy, planning for the expansion of renewable energy, incentive mechanisms and organizational support for renewable energy, financial instruments, and regulatory incentives [57].
Spearman’s coefficient is used to assess the density and directions of relationships between the studied indicators [58]:
ρ = 1 6 n ( n 1 ) ( n + 1 ) i = 1 n ( R i S i ) 2 ,
where n is the number of data points; Ri is the rank being observed for the one indicator from researching data K1–K3, M4–M7; Si—the rank of another indicator from analyzing data, ρ ϵ [−1; 1].

3.3. Justification of the Expediency of Using Clustering Methods

To identify the degree of influence on the results of the clustering and distribution of countries into classes based on similar “behavior” in terms of the use of renewable energy indicators (renewable energy consumption, solar energy production, total renewable energy production) and regulatory and legal indicators (a legal framework for renewable energy, planning for the expansion of renewable energy, incentive mechanisms and organizational support for renewable energy, financial instruments, and regulatory incentives) it is advisable to implement the fourth stage with the use of discriminant analysis. To obtain the optimal value of the number of clusters, the Sturges formula was applied [59]:
k = 1 + 3.322 l g N 7.8
where N—number of study countries.
Cluster analysis was carried out using three methods:
(1)
Ward’s method [60] (hierarchical type of clustering, two clusters will be closest if, in the case of their merging, the increase in the total variance is minimized) (Formula (2));
(2)
The k-means method [61];
(3)
The “farthest neighbor” method [59,60,61,62] (performs clustering based on the maximum distance between objects, considers diverse pairs, and avoids chain problems) using Statgraphics 19 software.
V I = i j ( x i j x ¯ j I ) 2 ,
where I—the number of clusters, i—country’s number ( i = 1 , , n I ¯ ) , n I —the number of countries in I cluster, j—the number of the indicator ( j = 1 , , l ¯ ) , and l —the number of indicators included in each country.
Applying this approach will make it possible to compare the clustering results with each other and choose the optimal method for further evaluation of the efficiency of renewable energy indicators in each class.

3.4. Checking the Distribution Quality into Clusters (Classes) of Countries Using Canonical Discriminant Functions

The theory and essence of the algorithm for constructing canonical discriminant functions are similar to the methods and goals of the main components in factor analysis: the development of canonical discriminant procedures and their subsequent implementation are carried out by creating functions ordered by significance, similar to the main components of factor analysis [63]. The average discriminant function values for different clusters, which differ most significantly from each other, determine the choice of the first discriminant function. The second discriminant function is chosen similarly, but so that there is no correlation with the first. The third feature should be different from the first two. Thus, the first three to five discriminant functions (main) contain all the information about the difference between clusters (classes) [64]. Methods of variance analysis estimate differences between types based on the quantitative values of a particular indicator. According to their content, the discriminant functions are some aggregated (generalizing) variables, consisting of linear combinations of initial features, in the space where the differences between the classes are most clearly visible. The coefficients of linear combinations are determined from the condition of the maxima of a specific function, which characterizes the differences between categories [65].
In the general case, it is possible to consider y as some variable, for example, one of the m initial features of xj. It is necessary to determine its overall average value μ and middle group up-average values in each class. To detect differences between classes, it is required to calculate the sums of square deviations of variances (3) and (4) (total S S y , intergroup S S e and intragroup S S u ) and determine the values of numerical characteristics (5):
S S y = S S e + S S u
p = 1 k q = 1 h p ( y p q μ ) 2 = p = 1 k q = 1 h p ( y p q u p ) 2 + p = 1 k q = 1 h p ( u p μ ) 2
Depending on the values of the numerical characteristics (5), conclusions are made about the discriminant analysis results: the larger the importance of these statistics, the more influential the discriminator is in the feature (index) y [66]:
η 2 = S S u S S y , λ = S S u S S e , F = λ n k k 1
where η 2 —correlation relation; F—Fisher’s variance ratio; n—total number of observations.
To determine Fisher’s dispersion ratio, there are special tables where quantiles F 0.05 and F 0.01 are given for each pair of degrees of freedom, then the indicator y is a bad discriminator (it is impossible to draw reliable conclusions about the differences between classes based on its value). A good discriminator indicates which condition is fulfilled: F < F 0.01 ( k 1 , n k ) .
The correlation ratio η 2 = λ 1 + λ varies from 0 to 1. The value 0 indicates that the feature y is not a discriminator. Value 1—feature y is an ideal (most powerful) discriminator.

3.5. Determination of the Efficiency of Renewable Energy Generation Sources

Using discriminant analysis will reveal the degree of influence of the signs of renewable energy on the results of the clustering of the countries. Data coverage analysis will be conducted using Frontier Analyst 4.1 software. The evaluation will be carried out using the data envelopment analysis (DEA) analysis methodology of the input-oriented CCR model (named after scientists Charnes, Cooper, and Rhodes), which allows seeking optimal meaning for inputs) [67,68].
Efficiency is determined from the point of view of minimizing CO2 emission values. The main models of DAE analysis are the direct and dual CCR model focused on input data (6) (Charnes, Cooper, Rhodes model), the direct and dual input-oriented VCC model (7), and the binary aggregate Var-Multi model (8) (Table 2).
Let us consider the Formulas (6)–(8), where xi are entrance indicators, the overall amount of which is r; yj—initial data points, the total amount of which is equal to s; vi, uj—input and output weighted coefficients, respectively, and a0—constant term (constant value, constant meaning).
Therefore, the CCR model was used to assess the effectiveness of countries’ activities in the use of renewable energy sources [68]:
e 0 = i = 1 r v i x i 0 j = 1 r u j y j 0 m i n
When the minimization conditions are met (10):
i = 1 r v i x i m j = 1 s u j y j m 1 ; m = 1 , 2 , , n ; u j 0 ; j = 1 , 2 , , s ; v i 0 ;   i = 1 , 2 , , r
where e0—the value of the efficiency of the evaluated indicator; n—the number of items to be compared; r—the number of input characters; s—the number of initial parameters; xi0—an expression of the i-th input characteristic of the item under examination; yj0—meaning of the j-th output parameter of the studied element; x i m —the term of the i-th input parameter of the m-th component from i = 1, …, r and m = 1, …, n; y j m —the expression of the j-th output parameter of the m-th element from i = 1, …, r and m = 1, …, n; v i —the weight for input parameter i from i = 1, …, r; u j —the weight of the output variable j with j = 1, …, s.
The following indicators were selected as key indicators for analyzing the efficiency of the development of renewable energy sources: the volume of electricity production from renewable sources, the volume of solar electricity production, and CO2 carbon dioxide emissions [68,69,70]. The data were generated from analytical reports of the World Bank.

4. Results

To determine the quality and statistical significance of the input space of renewable energy indicators within the first stage of the study, a descriptive multivariate analysis procedure was applied using Statgraphics 19 software. The results of numerical characteristics are shown in Table 3.
The value of the coefficient of variation exceeds 5%, which indicates the statistical significance of the indicators of renewable energy, which form the input sample of data on political instability. The reader should also pay attention to the indicators for which the values of the standardized coefficients of asymmetry and kurtosis are outside the range (−2; 2), because depending on the purpose of their use, for example, the development of econometric models and the application of specific methods of multivariate statistical analysis of the interpretation of the obtained results, they may not satisfy the relevant tests. Thus, if the values of the standardized skewness and kurtosis coefficients are outside the range (−2; 2), then a transformation such as LOG(Y), SQRT(Y), or 1/Y is recommended to make the variables more normal; however, it is also possible to use the built-in function for standardization in the appropriate software. The authors used a built-in function for standardization in Software Statgraphics 19 for cluster analysis.
Conducting a correlation analysis to investigate the denseness and focus of relationships between the studied pairs of indicators is advisable.
The results of Spearman’s pairwise rank correlations are represented in Table 4, which, unlike Pearson’s pairwise correlations, are more sustainable and less sensitive to outliers.
The results presented in Table 4 indicate that indicators M5 (renewable energy expansion potential) and M6 (incentives and regulatory support for renewable energy) have a high directly proportional density of interconnection, which is 70.17%. For other pairs of variables, as directly proportional, there is an inversely proportional connection at an average level, which increases within (45–60%), and the density of interconnection at a low level (9–15%) or levels below the average (20–40%).
Thus, for example, between indicator K1 (consumption of renewable energy) and indicator K3 (total production of renewable energy), the density correlation is at the level of 52%, which corresponds to the average level; between indicator K1 (consumption of renewable energy) and M4 (the legal basis for renewable energy), correlation is 23%; between indicator K2 (solar energy production) and M4 (legislation background for renewable energy promotion)—20%; between indicator K2 (solar energy production) and M5 (renewable energy expansion potential)—32%; between indicator K2 (solar energy production) and M6 (incentives and regulatory support for renewable energy)—37%; between indicator K2 (solar energy production) and M7 (financial instruments and regulatory incentives)—34%; between indicator M4 (legal framework for renewable energy) and M5 (renewable expansion potential energy)—54%; between indicator M4 (legislation background for renewable energy promotion) and M6 (incentive mechanisms and organizational support for renewable energy)—47%; between indicator M4 (legislation background for renewable energy promotion) and M7 (attributes of financial and regulatory incentives)—41%; between indicator M5 (renewable energy expansion planning) and M7 (financial instruments and regulatory incentives)—49%; M6 (incentive mechanisms and organizational support for renewable energy) and M7 (attributes of financial and regulatory incentives)—63%. The indicated correlation pairs of variables have a significance level (p-value) below 0.05, which indicates the statistical significance of a nonzero correlation at a confidence level of 95.0%.
The results of the study of the division of countries into clusters (classes) as a basis for evaluating the efficiency of the use of renewable energy sources, carried out using three methods, are presented in Table 5.
In addition, the optimal number of clusters was proven using the agglomeration protocol (Figure 1). The absence of specific jumps between the diagram points allows us to state that the selected number of clusters for the set of observations is correct.
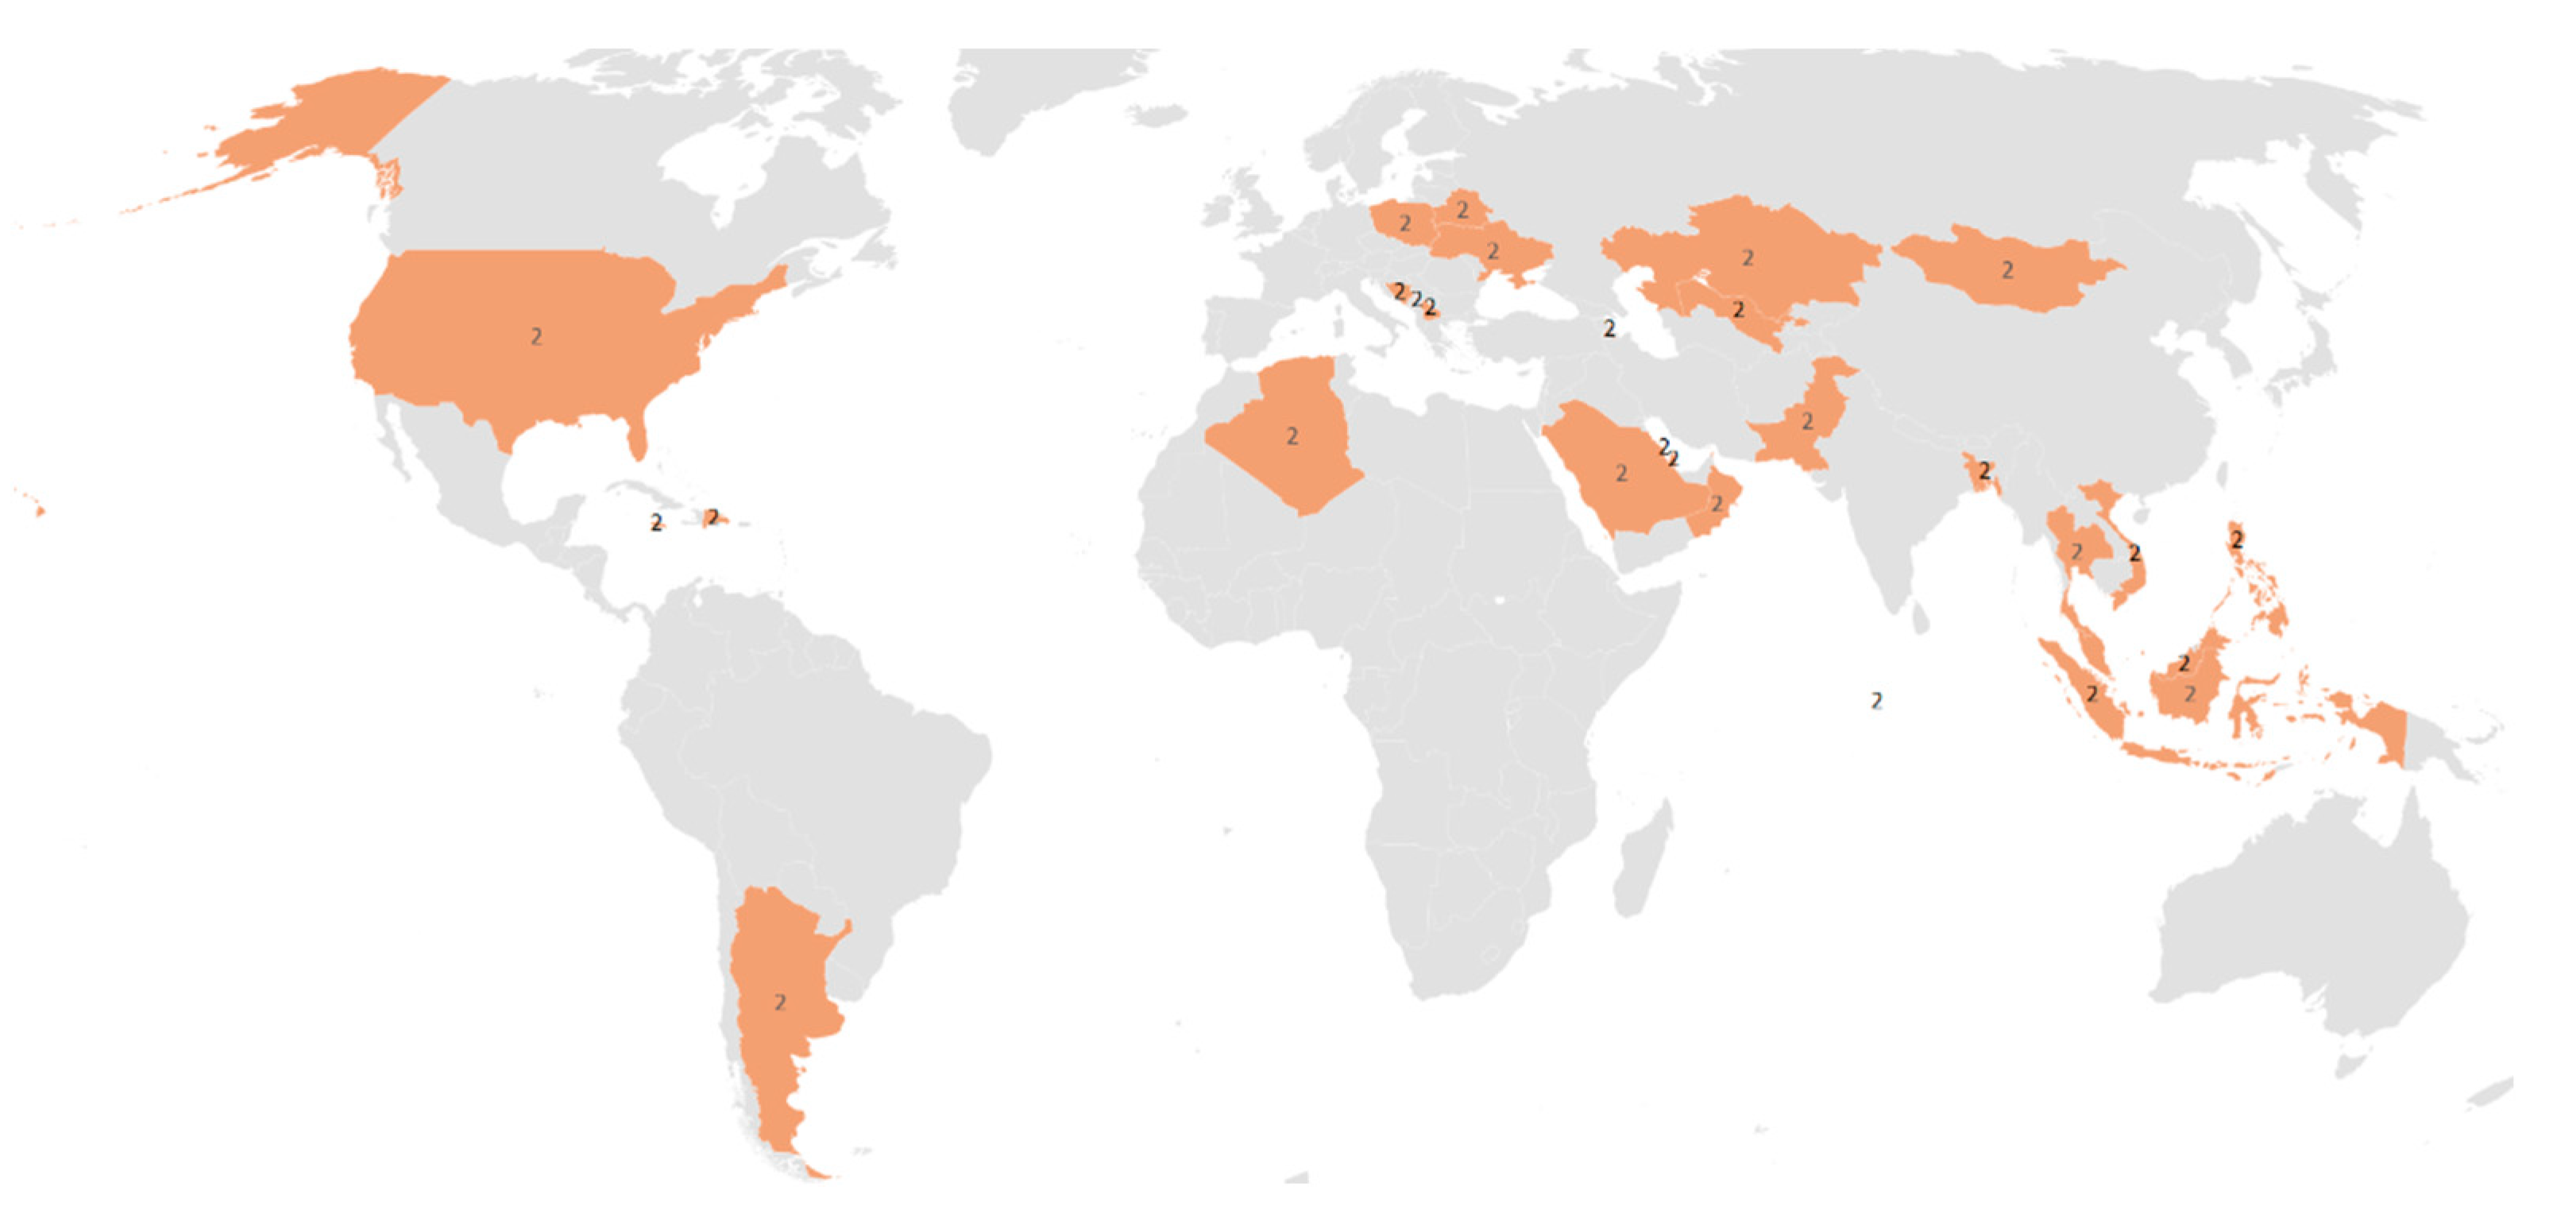
The first cluster includes ten countries: Afghanistan, Albania, the Central African Republic, Guatemala, Madagascar, Nepal, Paraguay, Sierra Leone, Sudan, and Tajikistan. The second cluster includes 28 countries—Algeria, Argentina, Azerbaijan, Bahrain, Bangladesh, Belarus, Bosnia and Herzegovina, Dominican Republic, Indonesia, Jamaica, Kazakhstan, Kosovo, Malaysia, Maldives, Mongolia, North Macedonia, Oman, Pakistan, Philippines, Poland, Qatar, Saudi Arabia, Singapore, Thailand, Ukraine, United States, Uzbekistan, and Vietnam. Cluster 3 includes 18 countries: Angola, Benin, Colombia, Costa Rica, Croatia, Liberia, Mali, Montenegro, New Zealand, Nicaragua, Niger, Nigeria, Panama, Peru, Romania, Sri Lanka, Togo, and Zimbabwe. Cluster 4 consists of 23 countries, namely: Armenia, Belgium, Bulgaria, Denmark, Finland, France, Germany, India, Israel, Lebanon, Mexico, Morocco, Netherlands, Portugal, Rwanda, Serbia, Slovak Republic, South Africa, Switzerland, Tunisia, Turkey, United Arab Emirates, and United Kingdom. Cluster 5 unites eight countries: Australia, Chile, El Salvador, Greece, Hungary, Italy, Jordan, and Spain. Cluster 6 comprises 11 countries: Brazil, Canada, Chad, Ethiopia, Kenya, Malawi, Sweden, Tanzania, Uganda, Uruguay, and Zambia. Cluster 7 includes 11 countries: Burkina Faso, Burundi, Cambodia, Eritrea, Haiti, Mozambique, Myanmar, Papua New Guinea, Somalia, South Sudan, and Turkmenistan. The last, eighth cluster contains three countries: Mauritania, Senegal, and Vanuatu.
For example, the geographical distribution of countries for cluster 2 according to Ward’s method is shown in Figure 2.
According to the clustering by the k-means method using the Euclidean squared distance metric, the results are given in Table 6.
It should be noted that the results of the distribution by the k-means method significantly depend on the initial element and the final element, and step k; in addition, the lack of the possibility to construct a graph of the agglomeration scheme forces us to abandon the use of the obtained results in further research.
Table 7 shows the cluster analysis by the “farthest neighbor” method (full binding) using the Euclidean squared distance metric.
When examining the agglomeration protocol (Figure 3) using the “farthest neighbor” method, the visible gaps indicate the irrelevance of the chosen strategy.
Thus, Ward’s method aims to minimize the total within-cluster variance when merging clusters, and it is beneficial when the goal is to create compact, homogeneous clusters with low within-cluster variability, which is proposed in the article. In addition, Ward’s method is based on the concept of variance analysis, where the objective is to maintain the structure of the original data as much as possible. It tends to produce clusters with relatively balanced sizes and can handle different cluster shapes. Of course, this method also has a drawback: sensitivity to outliers. Ward’s approach is sensitive to outliers or noise in the data, aiming to minimize the within-cluster variance. Outliers can significantly affect the clustering results and potentially lead to suboptimal cluster assignments, but the previously conducted descriptive analysis using the construction of box and whisker plots showed no outliers for the included sample of data (Figure 4), except for two indicators—production of solar energy and legislation background for renewable energy promotion. However, these values indicating the emissions are logically argued, based on the geographical location of the countries and the features of the regulatory and legal framework regarding its frequency of change in terms of the features of the use of renewable energy.
To evaluate the performance of countries in terms of the efficiency of renewable energy use, it is proposed to use the clustering results obtained by Ward’s method.
The methodology of discriminant analysis, which makes it possible to evaluate the quality of the clustering performed, is given and implemented with the Statgraphics 19 toolkit.
The results of the obtained discriminant functions are shown in Table 8.
Thus, Table 8 shows the values of the coefficients of the discriminant functions that form eight linear combinations from the input feature space.
Based on the calculation of the sum of the standardized coefficients of the discriminant functions, the value of the influence of each variable on the formation of clusters was obtained: K1 has a power of impact on the construction of groups of 0.93963; in turn, K2—0.173742; K3—0.065653; M4—0.092959; M5—1.2315; M6—0.878213; M7 is 0.541515. From the obtained estimates, it is clearly seen that K1 indicators of renewable energy consumption and M4 indicators of legislation background for renewable energy promotion for renewable energy have the most significant influence on the formation of clusters. Other indicators have a much smaller impact on the construction of groups. Therefore, countries were divided into clusters according to the characteristics of renewable energy consumption indicators.
For example, the model of the first discriminant function appears as follows:
F 1 = 0.447294 · K 1 + 0.177813 · K 2 0.290784 · K 3 + 0.535412 · M 4 + 0.3987 · M 5 + 0.418919 · M 6 + 0.261849 · M 7
However, it is sufficient to use the first five discriminant functions to identify the degree of influence of the given indicators of the input feature space (Table 9).
The absolute value of the coefficient reflects the importance of each indicator. A more excellent value will significantly impact this indicator in forming clusters.
Thus, renewable energy indicators were used across 112 countries to construct discriminant functions. They were divided into eight clusters. Five of the seven discriminant parts have an effective rate (p-value is lower than 0.05%, indicating statistically significant discriminant functions at the 95.0% confidence level). The value of the lambda Wilks statistic in functions 1–2 (Table 9) is the closest to zero, and the closer the value is to zero, the better the quality of the discriminative functions.
Therefore, it is advisable to use the results of linear combinations of the first five discriminant functions for further deeper and more detailed analysis of the prospects for the development of renewable energy, as they allow us to determine which indicators of the character input space are the most important for dividing countries into clusters. Thus, by using the absolute value of the coefficients in Table 9, one can determine how the independent variables are used to differentiate between groups; the greater its value, the more outstanding the indicator’s contribution to the classification results.
The study of the effectiveness of the functioning of renewable energy at the level of national economies based on data envelopment analysis (DEA) is based on methods of multiple-criteria optimization modeling [71,72]. The following 11 countries were chosen to analyze the sixth cluster at the authors’ discretion: Brazil, Canada, Chad, Ethiopia, Kenya, Malawi, Sweden, Tanzania, Uganda, Uruguay, and Zambia. Indicators for data envelopment analysis were chosen as the following indicators: volumes of electricity production from renewable sources (TWh·h) (output indicator), volumes of solar electricity production (TWh·h) (output indicator), and emissions of carbon dioxide CO2 (kt) for 2019 (input indicator).
Table 10 presents the initial data for evaluating the effectiveness of the use of renewable energy sources.
The results of data coverage analysis using the Frontier Analyst Application for CO2 emissions, renewable electricity generation, and solar electricity generation revealed that the reference countries are Sweden and Uruguay (they have 100% efficiency compared to other countries). Other countries received the following indicators of the efficiency of the use of renewable energy: Brazil—45.58%, Canada—27.2%, Chad—0.16%, Ethiopia—27.3%, Kenya—16.24%, Malawi—53.28%, Tanzania—11.17%, Uganda—34.7%, and Zambia—54.94%
The marginal efficiency graph (Figure 5) shows the gap between countries.
The analysis results indicate that only two of the twelve countries studied are efficient; that is, the production of renewable energy and their CO2 emissions are in relative balance. However, the rest of the countries participating in the study cannot ensure such efficiency; for this, they need to increase the production of renewable energy or reduce CO2 emissions.
Thus, according to the results of the analysis, Chad should reduce CO2 emissions to 99.84%, that is, from 2250 to 3.7; for Tanzania, it is advisable to reduce CO2 emissions by 88.83%, that is, from 12,450 to 1390.71; for Kenya, the CO2 reduction potential is 83.76%, that is, from 22,280 to 3618.17; for Canada reduction of CO2 emissions is 72.8%, that is, from 580,210.02 to 157,789.28; for Ethiopia, reducing CO2 emissions is 72.7%, that is, from 18,360 to 5011.49; for Uganda, the reduction of CO2 emissions is 65.3%, that is, from 5860 to 2033.48; the potential for Brazil to reduce CO2 emissions is 54.42%, that is, from 434,299.99 to 197,968.98; Malawi must work to reduce CO2 emissions by 46.72%, that is, from 1450 to 772.62; reduction of CO2 emissions for Zambia to optimally reduce is by 45.06%, that is, from 6800 to 3735.98.

5. Discussion

The paper’s analysis and calculations confirmed the hypothesis that there is a connection between the growth of renewable energy production and the reduction of CO2 at the level of national economies. The evaluation results indicate a strong interconnection between the level of renewable energy production and countries’ carbon emissions. This is different to the existing studies in evaluating the results of the implementation of renewable energy on the national economic level. Thus, a study [73] assessed the role that renewable energy assumes in the context of global and national “sustainable” energy strategies, i.e., strategies aimed at solving climate change demands and guaranteeing energy security. The authors of [74,75] identified key challenges facing renewable energy and suggested ways to overcome these barriers. The authors of [76,77] mapped the potential of national economies for adaptation to global goals of sustainable development and carbon emission reduction by applying an assessment system based on indicators of economic status, dependence on coal, and contribution to climate change. The studies [78,79] demonstrated an inverse relationship between CO2 emissions and national financial performance and positioned green growth as a determinant for further economic development. In addition, the authors analyzed the effect of bioeconomy sectors on the indicators of the national economy, particularly the GDP [80]. They concluded that in the long term, all bioeconomy sectors contribute equally and significantly to the national economy.

6. Conclusions

Evaluation of the effectiveness of the development of clean energy technology was conducted within the framework of a multistage approach, which included the following stages: formation of a sample of indicators; checking the density and directions of relationships between the studied indicators; substantiation of the expediency of using clustering methods; checking the quality of distribution into clusters of countries using canonical discriminant functions; evaluation of the efficiency of the use of renewable energy sources. The evaluation results indicate that only two countries out of the twelve studied are efficient; their renewable energy production and CO2 emissions are in relative balance. The approach applied in the paper made it possible to compare the clustering results with each other and choose the optimal method for further evaluation of the efficiency of renewable energy indicators in each class.
Deep decarbonization of the energy sector requires a lot of policy measures and efforts to accelerate the deployment of renewable energy sources. Decarbonization of the economy should be one of the priorities for sustainable development. No one-size-fits-all approach can achieve CO2 reduction goals. For the decarbonization of the energy sector, a combination of energy efficiency measures and renewable energy policy is inevitable. Renewable energy offers a powerful energy resource for the economy but requires a comprehensive and innovative approach, a combination of regulatory guidelines and socioeconomic measures.
Considering the paper’s results, the following suggestions can be provided to facilitate the decarbonization of the energy sector and promote renewable energy implementation:
  • Regulation of the “green tariff” system. To a large extent, introducing green tariffs encourages society to develop renewable energy sources.
  • Determining and providing more ambitious goals in the field of alternative energy. Global crises and military actions push the world economy to abandon fossil fuels faster. Countries should review draft national action plans to develop renewable energy and improve their goals.
  • Formation of the legislative framework for stimulating the development of small renewable energy generation. Supporting small renewable energy producers will help communities become more energy-independent, but for this to become possible, an adequate legislative framework is necessary. It is also essential to define specific deadlines for adopting the legislative framework and develop documents based on the fundamental principles and provisions under the 4th Energy Package.
  • Reducing risks for investors. “Green tariff” is not the only way to support small producers. For example, the “green auctions” mechanism guarantees investors that the state will buy electricity produced by their stations, even before the stations’ construction, while guarantees under the “green tariff” could be obtained only after construction. Therefore, when planning the project, the investor will be sure that he will be able to sell the energy after completing the work. In addition, this mechanism does not offer a fixed price for electricity, as was the case with the tariff. On the contrary, the cost of electricity will be determined by auction, so the state will also benefit by buying energy from those who offer it more favorably. Such a mechanism will attract more foreign investors and give them confidence.
  • Involvement of communities in the process of forming goals and making decisions. Communities should actively participate in developing strategic documents in the energy sector. The needs of communities should be the foundation for defining national goals because they will be realized in the future. The effectiveness of achieving the plans depends on the request and powers of the municipalities. The energy security of communities and individual energy independence should be a priority on the energy agenda. This can be achieved by developing a decentralized small generation, where citizens are the leading direct energy producers and beneficiaries of the energy transition.
  • Implementation of the system of guarantees of the origin of electricity. Countries must achieve the planned indicators of decarbonization of electric energy released into the network. Guarantees of Origin is an electronic document that provides consumers with information about the source of electricity and is also a support tool for renewable energy producers. They will help consumers monitor exactly what electricity they consume. Ideally, consumers should be interested in the sources of the electricity they use.
The shortcoming of the proposed approach is the conditional countries’ division into groups, which is why it was proposed to compare the outcomes of the cluster analysis comprehensively.
Recent studies [42,46,47] emphasized that countries’ decarbonization is a complicated process, which is determined by a set of factors (green culture and awareness, green financing, green management, etc.), and which can accelerate the process of the green transition and, as a result, CO2 reduction. Thus, it should be considered in future research. In addition, follow-up studies will be topical in investigating the influence of implementing separate renewable technologies (wind, hydro, tidal, geothermal energy, biomass, etc.) on developing the carbon-free energy sector.

Author Contributions

Conceptualization, Ł.S., O.C., V.K. and S.D.; methodology, M.G., V.K., O.D. and S.L.; formal analysis, O.C., V.K., Ł.S. and S.L.; investigation, Ł.S., M.G., O.D. and O.C.; writing—original draft preparation, O.C., V.K., S.L. and S.D.; writing—review and editing, Ł.S., O.D. and M.G.; visualization, O.D., Ł.S. and M.G. All authors have read and agreed to the published version of the manuscript.

Funding

This research was funded by grants from the Ministry of Education and Science of Ukraine: Innovative energy transformations for sustainable development and national security: smart technologies and environmental responsibility (grant number 0122U000788); Economic-mathematical modelling and Technologies of cross-border energy security management in the conditions of military actions and post-war reconstruction (grant number 0123U101920).

Institutional Review Board Statement

Not applicable.

Informed Consent Statement

Not applicable.

Data Availability Statement

Not applicable.

Acknowledgments

The authors are grateful to the anonymous referees for their helpful comments and constructive suggestions.

Conflicts of Interest

The authors declare no conflict of interest.

References

  1. Ievdokymov, V.; Oliinyk, O.; Ksendzuk, V.; Sergiienko, L. Circular economy as an alternative environment oriented economic concept for Ukraine. Ekonomista 2018, 3, 347–362. Available online: https://ekonomista.pte.pl/Circular-Economy-as-an-Alternative-Environment-Oriented-Economic-Concept-for-Ukraine,155532,0,2.html (accessed on 5 April 2023).
  2. Kryshtanovych, M.; Dragan, I.; Grytsyshen, D.; Sergiienko, L.; Baranovska, T. The Public and Environmental Aspect of Restoring Sustainable Regional Development in the Face of the Negative Impact of Military Actions on the Territory of the Country. Int. J. Sustain. Dev. Plan. 2022, 17, 1645–1651. [Google Scholar] [CrossRef]
  3. Kolosok, S.; Bilan, Y.; Vasylieva, T.; Wojciechowski, A.; Morawski, M. A Scoping Review of Renewable Energy, Sustainability and the Environment. Energies 2021, 14, 4490. [Google Scholar] [CrossRef]
  4. Lyulyov, O.; Paliienko, M.; Prasol, L.; Vasylieva, T.; Kubatko, O.; Kubatko, V. Determinants of shadow economy in transition countries: Economic and environmental aspects. Int. J. Glob. Energy Issues 2021, 43, 166–182. Available online: http://www.inderscience.com/ijgei (accessed on 5 April 2023). [CrossRef]
  5. Sedmíková, E.; Vasylieva, T.; Tiutiunyk, I.; Navickas, M. Energy consumption in assessment of shadow economy. Eur. J. Interdiscip. Stud. 2021, 13, 47–64. [Google Scholar]
  6. Lahouirich, M.W.; El Amri, A.; Oulfarsi, S.; Sahib Eddine, A.; El Bayed Sakalli, H.; Boutti, R. From financial performance to sustainable development: A great evolution and an endless debate. Financ. Mark. Inst. Risks 2022, 6, 68–79. [Google Scholar] [CrossRef]
  7. Bardy, R.; Rubens, A. Weighing Externalities of Economic Recovery Projects: An Alternative to Green Taxonomies that is Fairer and more Realistic. Bus. Ethics Leadersh. 2022, 6, 23–34. [Google Scholar] [CrossRef]
  8. Vasilyeva, T.; Samusevych, Y.; Babenko, V.; Bestuzheva, S.; Bondarenko, S.; Nesterenko, I. Environmental Taxation: Role in Promotion of the Pro-Environmental Behaviour. WSEAS Trans. Bus. Econ. 2023, 20, 410–427. [Google Scholar] [CrossRef]
  9. Vasilyeva, T.; Kuzmenko, O.; Kuryłowicz, M.; Letunovska, N. Neural network modeling of the economic and social development trajectory transformation due to quarantine restrictions during COVID-19. Econ. Sociol. 2021, 14, 313–330. [Google Scholar] [CrossRef]
  10. Vakulenko, I.; Saher, L.; Lyulyov, O.; Pimonenko, T. A systematic literature review of smart grids. E3S Web Conf. 2021, 250, 08006. [Google Scholar] [CrossRef]
  11. Lyulyov, O.; Vakulenko, I.; Pimonenko, T.; Kwilinski, A.; Dzwigol, H.; Dzwigol-Barosz, M. Comprehensive Assessment of Smart Grids: Is There a Universal Approach? Energies 2021, 14, 3497. [Google Scholar] [CrossRef]
  12. Kwilinski, A.; Lyulyov, O.; Dzwigol, H.; Vakulenko, I.; Pimonenko, T. Integrative Smart Grids’ Assessment System. Energies 2022, 15, 545. [Google Scholar] [CrossRef]
  13. Vysochyna, A.; Samusevych, Y.; Starchenko, L. Convergence trends of environmental taxation in European countries. E3S Web Conf. 2020, 202, 03031. [Google Scholar] [CrossRef]
  14. Lyeonov, S.; Pimonenko, T.; Chygryn, O.; Reznik, O.; Gaynulina, R. Green brand as a marketing instrument: Principle, features and parameters. Int. J. Glob. Energy Issues 2021, 43, 147–165. [Google Scholar] [CrossRef]
  15. Artyukhova, N.; Tiutiunyk, I.; Bogacki, S.; Wołowiec, T.; Dluhopolskyi, O.; Kovalenko, Y. Scenario Modeling of Energy Policies for Sustainable Development. Energies 2022, 15, 7711. [Google Scholar] [CrossRef]
  16. Djalilov, K. A Contingent Resource-Based Perspective on Corporate Social Responsibility and Competitive Advantage: A Focus on Transition Countries. Bus. Ethics Leadersh. 2022, 6, 92–108. [Google Scholar] [CrossRef]
  17. Oyewo, T.; Olarewaju, O.M.; Cloete, M.B.; Adenuga, O.T. Environmental costs estimation and mathematical model of marginal social cost: A case study of coal power plants. Environ. Econ. 2021, 12, 90–102. [Google Scholar] [CrossRef]
  18. Khalatur, S.; Dubovych, O. Financial Engineering of Green Finance as an Element of Environmental Innovation Management. Mark. Manag. Innov. 2022, 1, 232–246. [Google Scholar] [CrossRef]
  19. Kuzior, A.; Staszek, M. Energy Management in the Railway Industry: A Case Study of Rail Freight Carrier in Poland. Energies 2021, 14, 6875. [Google Scholar] [CrossRef]
  20. Kuzior, A.; Lobanova, A.; Kalashnikova, L. Green Energy in Ukraine: State, Public Demands, and Trends. Energies 2021, 14, 7745. [Google Scholar] [CrossRef]
  21. Vakulenko, I.; Lieonov, H. Renewable Energy and Health: Bibliometric Review of Non-Medical Research. Health Econ. Manag. Rev. 2022, 3, 44–53. [Google Scholar] [CrossRef]
  22. Chen, Y.; Kwilinski, A.; Chygryn, O.; Lyulyov, O.; Pimonenko, T. The Green Competitiveness of Enterprises: Justifying the Quality Criteria of Digital Marketing Communication Channels. Sustainability 2021, 13, 13679. [Google Scholar] [CrossRef]
  23. Hakhverdyan, D.; Shahinyan, M. Competitiveness, innovation and productivity of the country. Mark. Manag. Innov. 2022, 1, 108–123. [Google Scholar] [CrossRef]
  24. Polyakov, M.; Khanin, I.; Bilozubenko, V.; Korneyev, M.; Shevchenko, G. Factors of uneven progress of the European Union countries towards a circular economy. Probl. Perspect. Manag. 2021, 19, 332–344. [Google Scholar] [CrossRef]
  25. Ricci, E.C. An Integrated Assessment of Super & Smart Grids. Fondazione Eni Enrico Mattei (FEEM). 2013. Available online: http://www.jstor.org/stable/resrep00986 (accessed on 5 April 2023).
  26. Vasylieva, T.; Pavlyk, V.; Bilan, Y.; Mentel, G.; Rabe, M. Assessment of Energy Efficiency Gaps: The Case for Ukraine. Energies 2021, 14, 1323. [Google Scholar] [CrossRef]
  27. Dluhopolskyi, O.; Brych, V.; Borysiak, O.; Fedirko, M.; Dziubanovska, N. Modeling the environmental and economic effect of value added created in the energy service market. Polityka Energetyczna—Energy Policy J. 2021, 24, 153–168. [Google Scholar] [CrossRef]
  28. Henze, V. Energy Transition Investment Hit $500 Billion in 2020—For First Time. BloombergNEF 2021. Available online: https://about.bnef.com/blog/energy-transition-investment-hit-500-billion-in-2020-for-first-time (accessed on 5 April 2023).
  29. World Bank. Carbon Pricing Dashboard. 2022. Available online: https://carbonpricingdashboard.worldbank.org/map_data (accessed on 5 April 2023).
  30. Economic Truth: Special Project “Economy without Emissions”. Ekonomichna Pravda 2021. Available online: https://www.epravda.com.ua/projects/ekonomika-bez-vykydiv/2021/03/31/672462 (accessed on 5 April 2023).
  31. Our World in Data. Energy Data Explorer 2021. Available online: https://ourworldindata.org/explorers (accessed on 5 April 2023).
  32. Koilo, V.; Grytten, O.H.; Emblemsvag, J. The interplay between technological innovation, energy efficiency, and economic growth: Evidence from 30 European countries. Probl. Perspect. Manag. 2022, 20, 448–464. [Google Scholar] [CrossRef]
  33. Koilo, V. Energy efficiency and green solutions in sustainable development: Evidence from the Norwegian maritime industry. Probl. Perspect. Manag. 2020, 18, 289–302. [Google Scholar] [CrossRef]
  34. Matvieieva, Y.; Sulym, V.; Rosokhata, A.; Jasnikowski, A. Influence of Waste Incineration and Obtaining Energy from it to the Public Health for Certain Territories: A Bibliometric and Substantive Study. Health Econ. Manag. Rev. 2023, 4, 71–80. [Google Scholar] [CrossRef]
  35. Makarenko, I.; Bilan, Y.; Streimikiene, D.; Rybina, L. Investments support for Sustainable Development Goal 7: Research gaps in the context of post-COVID-19 recovery. Investig. Manag. Financ. Innov. 2023, 20, 151–173. [Google Scholar] [CrossRef]
  36. Oe, H.; Yamaoka, Y.; Duda, K. How to Sustain Businesses in the Post-COVID-19 Era: A Focus on Innovation, Sustainability and Leadership. Bus. Ethics Leadersh. 2022, 6, 1–9. [Google Scholar] [CrossRef]
  37. Naumenkova, S.; Mishchenko, V.; Mishchenko, S. Key energy indicators for sustainable development goals in Ukraine. Probl. Perspect. Manag. 2022, 20, 379–395. [Google Scholar] [CrossRef]
  38. El Dessouky, N.F. Pragmatic model for sustainable energy policy: Networking between the government and key players in Bahrain. Probl. Perspect. Manag. 2021, 19, 387–396. [Google Scholar] [CrossRef]
  39. Dinçer, H.; Yüksel, S.; Mikhaylov, A.; Muyeen, S.; Chang, T.; Barykin, S.; Kalinina, O. CO2 emissions integrated fuzzy model: A case of seven emerging economies. Energy Rep. 2023, 9, 5741–5751. [Google Scholar] [CrossRef]
  40. Feng, Y.; Xiao, Z.; Zhou, J.; Ni, G. Asymmetrically examining the impact of green finance and renewable energy consumption on environmental degradation and renewable energy investment: The impact of the COVID-19 outbreak on the Chinese economy. Energy Rep. 2023, 9, 5458–5472. [Google Scholar] [CrossRef]
  41. Barbar, M.; Mallapragada, D.S.; Stoner, R.J. Impact of demand growth on decarbonizing India’s electricity sector and the role for energy storage. Energy Clim. Chang. 2023, 4, 100098. [Google Scholar] [CrossRef]
  42. Adebayo, T.S.; Uhunamure, S.E.; Shale, K. A time-varying approach to the nexus between environmental related technologies, renewable energy consumption and environmental sustainability in South Africa. Sci. Rep. 2023, 13, 4860. [Google Scholar] [CrossRef]
  43. Ali, K.; Jianguo, D.; Kirikkaleli, D. How do energy resources and financial development cause environmental sustainability? Energy Rep. 2023, 9, 4036–4048. [Google Scholar] [CrossRef]
  44. Tang, Q.; Shahla, R.; Leyla, A.; Sevinj, H. Moderating role of carbon emission and institutional stability on renewable energy across developing countries. Renew. Energy 2023, 209, 413–419. [Google Scholar] [CrossRef]
  45. Rogala, Z.; Stanclik, M.; Łuszkiewicz, D.; Malecha, Z. Perspectives for the Use of Biogas and Biomethane in the Context of the Green Energy Transformation on the Example of an EU Country. Energies 2023, 16, 1911. [Google Scholar] [CrossRef]
  46. Laureti, L.; Massaro, A.; Costantiello, A.; Leogrande, A. The Impact of Renewable Electricity Output on Sustainability in the Context of Circular Economy: A Global Perspective. Sustainability 2023, 15, 2160. [Google Scholar] [CrossRef]
  47. Androniceanu, A.; Georgescu, I. The Impact of CO2 Emissions and Energy Consumption on Economic Growth: A Panel Data Analysis. Energies 2023, 16, 1342. [Google Scholar] [CrossRef]
  48. Zhang, M.; Abbasi, K.R.; Inuwa, N.; Sinisi, C.I.; Alvarado, R.; Ozturk, I. Does economic policy uncertainty, energy transition and ecological innovation affect environmental degradation in the United States? Econ. Res.-Ekon. Istraz. 2023, 36, 2177698. [Google Scholar] [CrossRef]
  49. Zhang, Y. The Impact of Energy Transition and Eco-Innovation on Environmental Sustainability: A Solution for Sustainable Cities and Communities of Top Ten Asian Countries. Eng. Econ. 2023, 34, 32–45. [Google Scholar] [CrossRef]
  50. Sahin, B.S.; Arzova, S.B. Does financial development support renewable energy or carbon emissions a panel data analysis on emerging countries? Int. J. Sustain. Econ. 2023, 1, 93–117. [Google Scholar] [CrossRef]
  51. Kirikkaleli, D.; Sowah, J.K.; Addai, K. The asymmetric and long-run effect of energy productivity on environmental degradation in the United Kingdom. Energy Environ. 2023, 30, 37691–37705. [Google Scholar] [CrossRef]
  52. World Bank. Renewable Energy Consumption 2019. Available online: https://data.worldbank.org/indicator/EG.FEC.RNEW.ZS (accessed on 5 April 2023).
  53. RISE. Normative Indicators of Sustainable Energy. 2020. Available online: https://rise.esmap.org/indicators (accessed on 5 April 2023).
  54. Wołowiec, T.; Kolosok, S.; Vasylieva, T.; Artyukhov, A.; Skowron, Ł.; Dluhopolskyi, O.; Sergiienko, L. Sustainable Governance, Energy Security, and Energy Losses of Europe in Turbulent Times. Energies 2022, 15, 8857. [Google Scholar] [CrossRef]
  55. Ziabina, Y.; Kwilinski, A.; Lyulyov, O.; Pimonenko, T.; Us, Y. Convergence of Energy Policies between the EU and Ukraine under the Green Deal Policy. Energies 2023, 16, 998. [Google Scholar] [CrossRef]
  56. Global Energy Market Data 2022. Available online: https://montelgroup.com/services (accessed on 5 April 2023).
  57. Tu, Y.-X.; Kubatko, O.; Piven, V.; Sotnyk, I.; Kurbatova, T. Determinants of Renewable Energy Development: Evidence from the EU Countries. Energies 2022, 15, 7093. [Google Scholar] [CrossRef]
  58. Hauke, J.; Kossowski, T. Comparison of Values of Pearson’s and Spearman’s Correlation Coefficients on the Same Sets of Data. Quaest. Geogr. 2011, 30, 87–93. [Google Scholar] [CrossRef] [Green Version]
  59. Parker, S.P. Sturges Rule. In McGraw-Hill Dictionary of Scientific & Technical Terms, 6th ed.; McGraw-Hill: New York, NY, USA, 2003; Available online: https://encyclopedia2.thefreedictionary.com/Sturges+rule (accessed on 5 April 2023).
  60. Park, Y.-S.; Chon, T.-S.; Kwak, I.-S.; Lek, S. Hierarchical community classification and assessment of aquatic ecosystems using artificial neural networks. Sci. Total. Environ. 2004, 327, 105–122. [Google Scholar] [CrossRef] [PubMed]
  61. Steinhaus, H. Sur la division des corps materials en parties. Bull. Acad. Polon. Sci. 1956, IV, 801–804. [Google Scholar]
  62. Fred, A.L.; Jain, A.K. Combining multiple clusterings using evidence accumulation. IEEE Trans. Pattern Anal. Mach. Intell. 2005, 27, 835–850. [Google Scholar] [CrossRef] [PubMed]
  63. Cohen, J.; Cohen, P. Applied Multiple Regression/Correlation Analysis for the Behavioral Sciences, 3rd ed.; Routledge: Milton Park, UK, 2002. [Google Scholar] [CrossRef]
  64. Statistics Solutions. Discriminant Analysis. 2022. Available online: https://www.statisticssolutions.com/discriminant-analysis (accessed on 5 April 2023).
  65. Ponomarenko, V.; Maliarets, L. Multidimensional Analysis of Socio-Economic Systems: A Study Guide; KNEU: Kharkiv, Ukraine, 2009; 384p, Available online: http://repository.hneu.edu.ua/handle/123456789/3113 (accessed on 5 April 2023).
  66. Scholarly Community Encyclopedia. CCR Model (DEA). 2021. Available online: https://encyclopedia.pub/entry (accessed on 5 April 2023).
  67. Atici, K.B.; Podinovski, V.V. Using data envelopment analysis for the assessment of technical efficiency of units with different specialisations: An application to agriculture. Omega 2015, 54, 72–83. [Google Scholar] [CrossRef] [Green Version]
  68. Coelli, T.J.; Prasada Rao, D.S.; O’Donnell, C.J.; Battese, G.E. An Introduction to Efficiency and Productivity Analysis; Springer: New York, NY, USA, 2005; pp. 1–349. [Google Scholar] [CrossRef]
  69. Habib, A.M. Does the efficiency of working capital management and environmental, social, and governance performance affect a firm’s value? Evidence from the United States. Financ. Mark. Inst. Risks 2022, 6, 18–25. [Google Scholar] [CrossRef]
  70. Fasoranti, M.M.; Alimi, R.S.; Ofonyelu, C.C. Effect of prepaid meters on the household expenditure on electricity consumption in Ondo state. Socioecon. Chall. 2022, 6, 86–96. [Google Scholar] [CrossRef]
  71. Emmerich, M.; Deutz, A. Multicriteria Optimization and Decision Making: Principles, Algorithms and Case Studies. LIACS. Available online: https://liacs.leidenuniv.nl/~emmerichmtm/modapage/MCOReaderEmmeirchDeutz2017.pdf (accessed on 5 April 2023).
  72. World Bank. CO2 Emissions (kt) 2019. Available online: https://data.worldbank.org/indicator/EN.ATM.CO2E.KT (accessed on 5 April 2023).
  73. Andrews, J.; Shabani, B. The role of hydrogen in a global sustainable energy strategy. WIREs Energy Environ. 2014, 3, 474–489. [Google Scholar] [CrossRef]
  74. Samusevych, Y.; Vysochyna, A.; Vasylieva, T.; Lyeonov, S.; Pokhylko, S. Environmental, energy and economic security: Assessment and interaction. E3S Web Conf. 2021, 234, 00012. [Google Scholar] [CrossRef]
  75. Sotnyk, I.; Kurbatova, T.; Kubatko, O.; Prokopenko, O.; Prause, G.; Kovalenko, Y.; Trypolska, G.; Pysmenna, U. Energy Security Assessment of Emerging Economies under Global and Local Challenges. Energies 2021, 14, 5860. [Google Scholar] [CrossRef]
  76. Svobodova, K.; Owen, J.; Harris, J.; Worden, S. Complexities and contradictions in the global energy transition: A re-evaluation of country-level factors and dependencies. Appl. Energy 2020, 265, 114778. [Google Scholar] [CrossRef]
  77. Fadel, S.; Rouaski, K.; Zakane, A.Z.A.; Djerboua, A. Estimating Climate Influence of The Potential COVID-19 Pandemic Spreading in Algeria. Socioecon. Chall. 2022, 6, 24–40. [Google Scholar] [CrossRef]
  78. Oussama, M.H.Z.; Ibtissem, G. The role of economic diplomacy in the promotion of non-hydrocarbon exports in Algeria. Socioecon. Chall. 2022, 6, 97–105. [Google Scholar] [CrossRef]
  79. Aliyeva, A. Post-Oil Period in Azerbaijan: Economic Transformations, Anti-Inflation Policy and Innovations Management. Mark. Manag. Innov. 2022, 2, 268–283. [Google Scholar] [CrossRef]
  80. Wen, X.; Quacoe, D.; Quacoe, D.; Appiah, K.; Danso, B.A. Analysis on Bioeconomy’s Contribution to GDP: Evidence from Japan. Sustainability 2019, 11, 712. [Google Scholar] [CrossRef] [Green Version]
Figure 1. Results of the evaluation of agglomeration intervals: confirmation of the optimal number of clusters by Ward’s method. Source: built using Statgraphics 19.
Sustainability 15 09473 g001
Figure 2. Map of the cluster distribution of countries for cluster 2 according to Ward’s method. Source: constructed by the authors using Excel.
Sustainability 15 09473 g002
Figure 3. Scheme of agglomeration according to the “farthest neighbor” method. Source: built using Statgraphics 19.
Sustainability 15 09473 g003
Figure 4. Box and whisker plots of the research indicators. Source: built using Statgraphics 19.
Sustainability 15 09473 g004
Figure 5. Graph of the marginal efficiency. Source: built using Frontier Analyst Application.
Sustainability 15 09473 g005
Table 1. Information about the input data.
Indicator/CharacteristicsData SourcesExplanationMeasurement UnitsExpected Linkages
K1World bank [52]Renewable energy consumption% of total final energy consumptionThe indicator has a direct relationship with K2 and K3
K2Our world in data [31]Share of electricity production from solar% share of totalThe indicator affects K3
K3Our world in data [56]Share of electricity production from renewable% share of totalOstentatious is a generalization of the total RES production and affects K1
M4Regulatory indicators for sustainable energy [53]Legal framework for renewable energy100-point scaleThe indicator demonstrates the country’s position relative to the field of renewable energy, affects K2 and K3
M5Regulatory indicators for sustainable energy [53]Planning for renewable energy expansion100-point scaleThe indicator reflecting the ability to develop affects K2 and K3
M6Regulatory indicators for sustainable energy [53]Incentives and regulatory support for renewable energy100-point scaleAssesses the level of legal protection related to energy, affects K2 and K3
M7Regulatory indicators for sustainable energy [53]Attributes of financial and regulatory incentives100-point scaleAssesses the transparency of the development of renewable energy affects K2 and K3
Source: the authors.
Table 2. General models of DAE analysis.
Functional Presentation of the Model
j = 1 s u j y j 0 m a x   i f   i = 1 r v i x i = 1 , u j , v i 0 (6)
j = 1 s u j y j 0 + a 0 m a x   i f   i = 1 r v i x i = 1 , u j , v i 0 (7)
j = 1 s u j l o g ( y j 0 ) i = 1 r v i l o g ( x i 0 ) m a x   i f   i = 1 r v i x i = 1 , u j , v i 0 (8)
Source: constructed by the authors using [66,67].
Table 3. Descriptive statistics of renewable energy indicators.
Descriptive
Characteristic
Meaning of Descriptive Parameters
K1K2K3M4M5M6M7
Count112112112112112112112
Average35.6762.05036.55779.46463.33550.43845.667
Median26.3751.07528.54080.00067.54850
5% Trimmed mean34.6401.73135.07581.82564.51450.486145.2824
5% Winsorized mean35.4451.94336.47379.64363.81350.43845.354
Variance831.2766.725977.858500.611583.734783.511830.023
Standard deviation28.8322.59331.27122.37424.16127.99128.810
Coefficient of variation, %80.82%126.52%85.54%28.16%0.3810.5550.631
Gini coefficient0.4560.6200.4820.1420.2150.3200.363
Standard error2.7240.2452.9552.1142.2832.6452.722
5% Winsorized sigma31.1772.45634.16023.95625.02330.07031.038
Mean absolute deviation24.8821.92826.66515.47519.54023.67124.661
MAD18.741.0523.282014.33523.50025.000
Sbi30.8621.81232.59121.26824.51029.00030.137
Minimum0000000
Maximum95.0314.29100100100100100
Range95.0314.29100100100100100
Lower quartile10.7150.16510.11580483025
Upper quartile60.4252.9961.1100807567
Interquartile range49.712.82550.98520324542
1/6 sextile8.170.044.4460361917
5/6 sextile76.43.9470.63100898275
Intersextile range68.233.966.1940536358
Skewness0.5641.9940.623−1.362−0.59680.0652060.195505
Stnd. skewness2.4368.6162.692−5.883−2.57850.2817230.84468
Kurtosis−1.0504.890−0.8651.702−0.2077−0.9992−1.01138
Stnd. kurtosis−2.26810.563−1.8683.677−0.4488−2.15852−2.18483
Sum3995.72229.564094.3989007093.5156495114.67
Sum of squares234,8231216.99258,221762,800514,061371,891325,703
Source: built using Statgraphics 19.
Table 4. Spearman’s rank correlations.
K1K2K3M4M5M6M7
K1 −0.09420.5282−0.2375−0.1001−0.0901−0.1422
0.32080.00000.01230.29150.34240.1340
K2−0.0942 0.10870.20970.32910.37860.3438
0.3208 0.25230.02710.00050.00010.0003
K30.52820.1087 −0.00610.13490.09790.0404
0.00000.2523 0.94900.15520.30220.6702
M4−0.23750.2097−0.0061 0.54520.47440.4154
0.01230.02710.9490 0.00000.00000.0000
M5−0.10010.32910.13490.5452 0.70170.4967
0.29150.00050.15520.0000 0.00000.0000
M6−0.09010.37860.09790.47440.7017 0.6389
0.34240.00010.30220.00000.0000 0.0000
M7−0.14220.34380.04040.41540.49670.6389
0.13400.00030.67020.00000.00000.0000
Source: built using Statgraphics 19.
Table 5. Clustering of countries according to Ward’s method.
Cluster The Number of Countries in the ClusterPercentage
1108.93
22825.00
31816.07
42320.54
587.14
6119.82
7119.82
832.68
Source: built using Statgraphics 18.
Table 6. Cluster distribution of countries by the k-means method.
ClusterThe Number of Countries in the ClusterPercentage
165.36
265.36
32522.32
41412.50
51816.07
61816.07
71311.61
81210.71
Source: built using Statgraphics 19.
Table 7. Cluster distribution of countries by the “farthest neighbor” method.
ClusterThe Number of Countries in the ClusterPercentage
11412.50
21210.71
33329.46
42421.43
565.36
6108.93
71210.71
810.89
Source: built using Statgraphics 19.
Table 8. Standardized coefficients of discriminant functions.
F1F2F3F4F5F6F7Sum of F1–F5
K1−0.4472940.3276730.3842740.2975890.377388−0.1152310.5684880.93963
K20.177813−0.7924760.6225150.1236380.04225180.04947160.02822980.173742
K3−0.2907840.3938240.594677−0.371049−0.2610150.186145−0.4940860.065653
M40.5354120.1209290.204042−0.687822−0.0796015−0.1392430.4645740.092959
M50.3987−0.0281953−0.1605210.1617830.8597330.45279−0.2917581.2315
M60.4189190.3125530.1578060.255723−0.266788−0.857358−0.1508980.878213
M70.2618490.387078−0.04580570.394562−0.4561680.6587330.2351650.541515
Source: built using Statgraphics 19. Note: F1–F7 are discriminant functions.
Table 9. Statistical characteristics of discriminant functions.
Discriminant FunctionEigenvalueRelative PercentageCanonical CorrelationWilks’ LambdaXi SquareDFp-Value
F15.7205354.150.922610.00813059498.0547490.0000
F22.2676621.470.833050.0546418300.8699360.0000
F31.6844315.950.792140.178551178.3183250.0000
F40.5996085.680.612250.47930776.1154160.0000
F50.2372872.250.437930.76670327.495490.0012
F60.0509110.480.220100.9486315.458140.2434
F70.003082590.030.055440.9969270.318610.5725
Source: built using Statgraphics 19.
Table 10. Initial data for the analysis of the efficiency of energy use from renewable sources.
CountryCO2 Emissions
(kt)
Electricity from Renewable Sources (TWh)Electricity from the Sun (TWh)
Brazil434,300515.43816.654579
Canada580,210429.0334.079798
Chad22500.010
Ethiopia18,36014.140.02
Kenya22,2809.890.09
Malawi14501.370.05
Sweden35,00098.753010.663
Tanzania12,4502.970.09
Uganda58605.270.07
Uruguay649013.90.42
Zambia68009.810.12
Source: built on the basis of [55,56,57,58,59,60,61,62,63,64,65,66,67,68].
Disclaimer/Publisher’s Note: The statements, opinions and data contained in all publications are solely those of the individual author(s) and contributor(s) and not of MDPI and/or the editor(s). MDPI and/or the editor(s) disclaim responsibility for any injury to people or property resulting from any ideas, methods, instructions or products referred to in the content.

