Article

Evaluating the Technical, Economic, and Environmental Performance of Solar Water Heating System for Residential Applications–Comparison of Two Different Working Fluids (Water and Glycol)

by
Ephraim Bonah Agyekum
1,*,
Tahir Khan
2 and
Nimay Chandra Giri
3
1
Department of Nuclear and Renewable Energy, Ural Federal University Named after the First President of Russia Boris Yeltsin, Mira 19 St., 620002 Ekaterinburg, Russia
2
College of Electrical Engineering, Zhejiang University, Hangzhou 310027, China
3
Department of Electronics and Communication Engineering, Centurion University of Technology and Management, Jatni 752050, Odisha, India
*
Author to whom correspondence should be addressed.
Sustainability 2023, 15(19), 14555; https://doi.org/10.3390/su151914555
Submission received: 1 September 2023 / Revised: 27 September 2023 / Accepted: 6 October 2023 / Published: 7 October 2023
(This article belongs to the Special Issue Security Issues in the Research and Application of Renewable Energy)

Abstract

:
The use of solar water heaters (SWH) in both residential and commercial facilities is one of the possible ways to reduce electricity bills and the release of greenhouse gases (GHG). This study assessed the technical, economic, and environmental performance of a SWH system at six different locations in China (i.e., Lhasa, Lauchang, Wuhan, Kashi, Yumen, and Harbin). A comparison between two different working fluids (i.e., water and glycol) were modeled in the System Advisor Model in all six cities. A sensitivity analysis was conducted on some key technical and economic parameters to assess the impact of such parameters on the performance of SWH systems in the country. According to the results, Lhasa recorded the highest capacity factor of 11% and 10.70% using water and glycol as the working fluid, respectively. Lhasa was identified as the best location among the studied locations due to its high solar irradiation. The optimization study indicates that the optimum azimuth for China is 190°. It was also found that a 25% reduction in the outlet set temperature of the water can reduce the capacity factor from 11% to about 9.2%. Using the SWH as simulated in this study can reduce carbon dioxide emissions from 1252.87–2014.85 kg per year to 138.20–330.23 kg per year; the extent of reduction depends on the location of the SWHS, and the solar energy available at the area. Net electricity bill savings of $156–296 could be obtained if SWH systems were installed and used at the studied locations.

1. Introduction

Countries have been decarbonizing their energy sector in recent years to mitigate climate change through renewable energies, to achieve a sustainable supply of energy. Renewable energies such as solar and wind can be used for the production of clean energy for electricity and heating applications [1,2]. They are projected to be energy sources that will play a major impact in the world’s quest to decarbonize the so-called hard-to-abate areas, where the extension of electricity is difficult [3,4,5,6]. A recent report by the Intergovernmental Panel on Climate Change (IPCC) indicates that if the world does not intensify its efforts in decarbonizing the various sectors, there will be serious changes in the world’s climate that will lead to catastrophic consequences for both humans and the environment [7].
Heating applications alone make up over half of the world’s final energy consumption. Fossil fuels currently provide about three-quarters of the world’s total energy use for heating, i.e., 129 exajoules. Solar thermal systems in Europe are estimated to have the potential to meet about 50% of their entire heating demand by 2030, taking into account reductions in demand through energy conservation measures. This means that there is a great potential to meet the requirements of thermal load through the use of solar thermal technologies. The solar water heating system (SWHS) has been found to be the most environmentally and economically friendly technology in that regard; this is due to the free nature of their source of energy [8,9].
Commercial and residential buildings are responsible for 45.3% and 54.7% of the building sector’s total energy consumption, respectively. However, renewable energy (RE) provides just about 9% of the building sector’s energy, whiles fossil fuels provide the rest. Water and space heating constitute the highest consumption of energy in the building sector [10,11]. The SWHS can be employed in water preheating before the water enters a conventional water heating system, which can lead to a significant reduction in the use of fossil fuels and its concomitant emissions that lead to pollution of the environment. The SWHS classically offers a significant percentage of the energy demand, and an auxiliary backup system is normally needed to meet the total demand for energy. There are two major SWH types: these are the Evacuated Tube Collector Solar Water Heaters and the Flat-Plate Collector Solar Water Heaters [12,13,14].
Several studies have, thus, assessed the potential of implementing SWHS at both the residential and industrial levels. A study by [15] assessed the technical and environmental performance of an evacuated and a flat-plate SWHS in 45 different locations in Turkey. They employed the TSOL and GAMS software to simulate and rank the outcome of their study, respectively. The obtained results from their study indicate that the evacuated tube SWHS was superior in terms of performance compared to that of the flat-plate SWHS for all the study areas. The flat-plate SWHS technology produced a total of 133 MW of heat, which translated into some 68.4 tons of avoided emissions, whilst that of the vacuum tube SWHS generated a total of 229 MW of heat leading to 93.4 tons of avoided emissions. Benli [16] assessed the potential of using SWHS in Turkey at six different locations. Two types of SWH collectors were evaluated and the study identified that the galvanized sheet absorber has a higher viability. The study further observed that the SWHs could suffer from a lack of purchasing power in northern and eastern Turkey and could also be affected by weather conditions. In another study by Fayaz et al. [17], the authors employed the F-chart approach to estimate the thermal and economic performance of an evacuated tube SWHS. According to their results, a life cycle savings of 5200 RM was recorded due to the use of the SWH system.
Furthermore, Raza et al. [18] evaluated the viability of an SWHS in seven cities in India. They assessed the equity payback, solar fraction, tilted and horizontal angles and the greenhouse gas emission reductions of the system. The payback for the system ranged 5–15 years depending on the location. Muthuraman et al. [19] modified the geometry of the flow tube of the solar water collector to a spiral and curved shape to improve the performance of the system. They assessed the impact of mass flow rate on the flow pipes in relation to the temperature of its surface for the different configurations of the tubes. The results according to their study indicated that the straight tube produced a maximum efficiency of 58%, whilst that of the spiral and curved tubes recorded 69% and 62%, respectively. A study by [20] analyzed the viability of an evacuated tube SWHS for a meat factory. The outcome of the study revealed that the SWHS could be profitable in a number of European countries. It disclosed that the price of energy in each country and the nature of the energy supply industry in the various countries significantly impact the size of the solar installations. A profit of EUR 1.1 per EUR 1 invested can be obtained from an industry with an energy demand of about 85,000 kWh/year if the investment is made in areas with high solar irradiation, with a 9-year payback period. Similarly, [10] evaluated the potential of SWHS for the state of Michigan; the System Advisor Model (SAM) software package was used for the analysis for 26 different locations within the study area. The outcome of their study suggests that the SWHS would be suitable for normal household water use, with an 8-year payback period depending on the weather situation at the location. Yilmaz [21] also employed the SAM model to assess the viability of an SWHS in Turkey. The study assessed the optimal orientation using the yearly meteorological data. The hot water consumption on a daily basis was calculated. The reduction in the initial cost of the system as well as the period for payback was found to be 7.5% and 1.5 years, respectively.
Finally, Khedher et al. [22] experimentally assessed the performance of a flat-plate solar collector (FPSC) system under the climatic conditions of the Hail city in Saudia Arabia. The authors assessed the efficiency curves of the FPSC system for different flow rates. The outcome of their study suggests that the thermal efficiency of the SWH system is highly affected by the flow rate. The highest collector efficiency occurred under a flow rate of 2.5 L/min, which was found to be the optimum flow rate. The study of [23] experimentally assessed a modified V-corrugated zinc SWH collector integrated with an insulator, i.e., aluminum foil and a plywood at the rear side. The outcome of their study indicated that the flow rate of 240 Lph recorded the maximum energy efficiency of 50%. Odoi-Yorke et al. [24] analyzed the technical and economic viability of SWH systems for hotels in Ghana using the RETScreen software. Solar fractions of 61.2% and 78.5% were recorded for Kumasi and Wa, respectively. Positive net present values were observed at all studied locations. Ibrahim et al. [25] used the TSOL modeling software to evaluate the feasibility of installing SWH systems in hotels in Egypt. The results suggest that the installation of SWH systems in the study area could save close to 6720 kg of CO2 yearly, which translates into some USD 6120 savings. In another study by [26], the authors employed the RETScreen software to evaluate the technical, environmental, and economic performance of a residential SWH system in India. It was found that the implementation of the SWH system in the study areas could save 739 tCO2 of GHG emissions. A mean simple payback period of 7–10 years was obtained depending on the area of study. In another study by [27], the authors employed the TSOL software to evaluate the technical and economic performance of the flat-plate and evacuated tube SWH systems in Gilgit-Baltistan (GB) of Pakistan. The outcome of their study found the evacuated tube to be the best technology for the studied locations. The evacuated tube collector recorded an energy efficiency of 40%, solar fraction of 75%, payback period of 6.6 years, and avoided CO2 emissions of 676 kg at Gilgit. However, in Skardu, the same technology recorded an efficiency of 36%, a solar fraction of 84%, payback period of 4.6 years, and 756 kg of avoided CO2 emissions. Gilani et al. [28] analyzed the techno-economic performance of a compound parabolic collector (CPC) in SWH systems in the northern hemisphere. The CPC system proved to be more efficient than the FPSC in the consumption of auxiliary power. In Shambat at Sudan, the rate of the annual auxiliary heating reduced by a maximum of 27%, whilst the lowest of 5% occurred in Chongqing in China. The study of [29] assessed the solar water heating potential for a 100-bed hospital facility in the Palestinian Territories. The FPSC and the evacuated tube collector systems were considered in their analysis. A solar fraction of 51.4% and payback period of 5.52 years were recorded by the FPSC system. The evacuated tube collector, however, recorded a solar fraction of 57.9% and a simple payback period of 5.2 years. The evacuated tube collector system was, therefore, recommended for the study area.
China, according to research, is the number one investor in RE globally, including solar energy. The country is vital in the transitioning to low-carbon energy: it is the world’s highest energy user and also the highest total emitter of CO2 [30]. China’s CO2 emissions and energy usage has over the past three decades increased rapidly due to its economic development. China’s per capita emissions for carbon dioxide keep increasing as compared to countries in the European Union [30,31], and this is projected to remain same for at least the next 10–20 years [30]. Despite China’s huge investment in the solar energy industry, the contribution of solar thermal energy for space heating has been very little, even though the country shares about 75.8% of the entire world’s solar-collector installation [32]. China currently is confronted with the task of reducing its greenhouse gas (GHG) emissions caused by coal burning for heating purposes. Coal consumption for space heating in the China is estimated to be around 400 million tons of standard coal equivalent annually, of which bulk coal constituted approximately 200 million tons of standard coal equivalent, comprising coal for low-efficiency small boilers [33].
It is, therefore, important to employ sustainable and clean energy to replace bulk coal for heating purposes in the country to help reduce the emissions of GHG in the country. Solar thermal energy has a huge potential for the sector and could play a major role in that regard. Several countries have adopted protection policies for cooling and heating: such policies are focused on small solar systems such as the SWHS for commercial and residential facilities. According to [15], close to 47 countries globally have developed some form of goals in relation to renewable cooling and heating development, and at least about 21 nations had some form of mandatory regulations in that regard.
A scan through the literature indicates that there is no comprehensive study that has assessed the technical, economic, and environmental performance of SWHS in China, and there is no study that identifies optimum parameters for the installation of such systems in the country. This study is the first of its kind in the country and is intended to provide the needed information for individuals and other stakeholders in their decision-making process towards investment in the sector. This study is also the first to compare the technical and economic performance of two different working fluids (i.e., water and glycol) under six different weather conditions in a single country. The selection of glycol for comparison purposes is due to its antifreeze properties; this means areas with very low temperatures could use it instead of water.
The remaining aspect of the paper is presented as follows: the materials and methods adopted for the modeling are presented in Section 2, and the findings are presented and discussed in Section 3. The final section, i.e., Section 4, presents the conclusions and policy implications for the development of the sector.

2. Materials and Methods

This study employed the SAM model version 2022.11.21 as the RE tool for modeling and analyzing the technical and economic performance of the SWHS. The SAM is developed by the National Renewable Energy Laboratory (NREL) and is used to model several forms of renewable energy systems, such as the solar PV system, geothermal power systems, wind power plants, biomass power plants, wave energy systems, and concentrated solar power plants, etc. SAM is basically designed for the prediction of the performance of renewable energy systems; as such, it helps to accelerate decision making in the industry. The software employs hour-by-hour estimations for its modeling. Studies such as [34,35,36,37,38,39] used the SAM model to study various energy systems in different countries. The SWHS in SAM is designed to assess both flat-plate collector and evacuated collector solar systems [10].

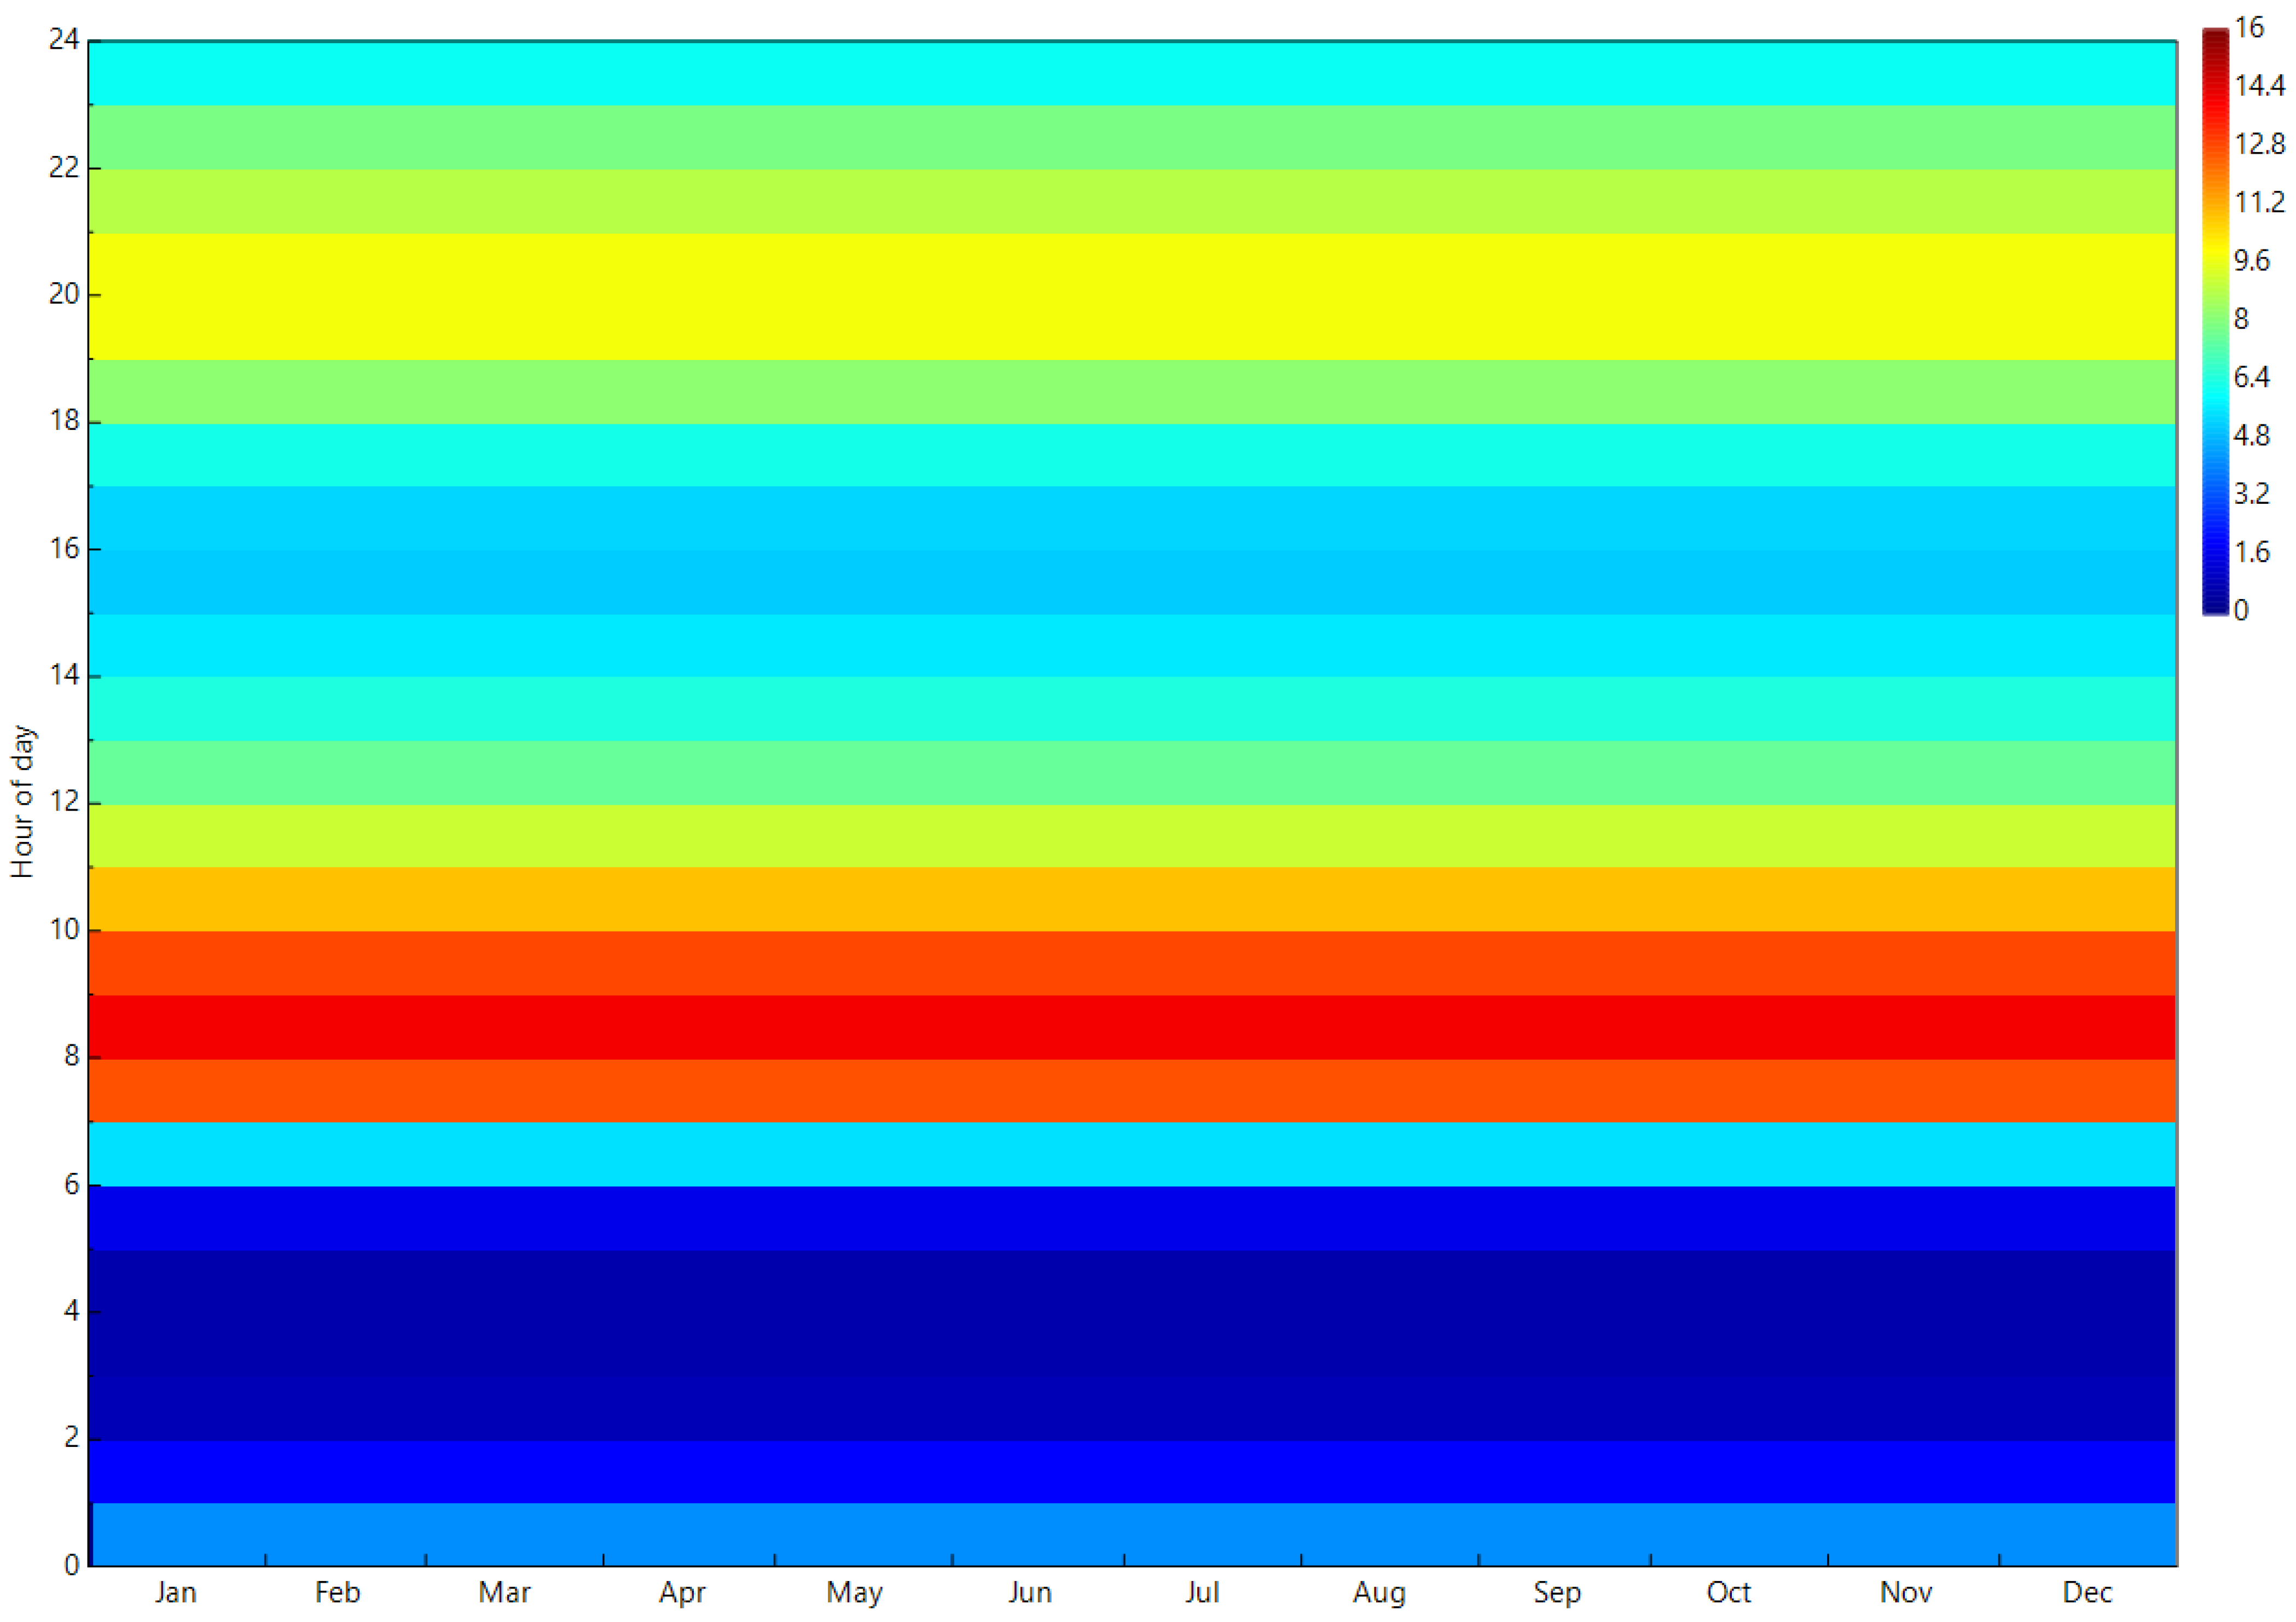
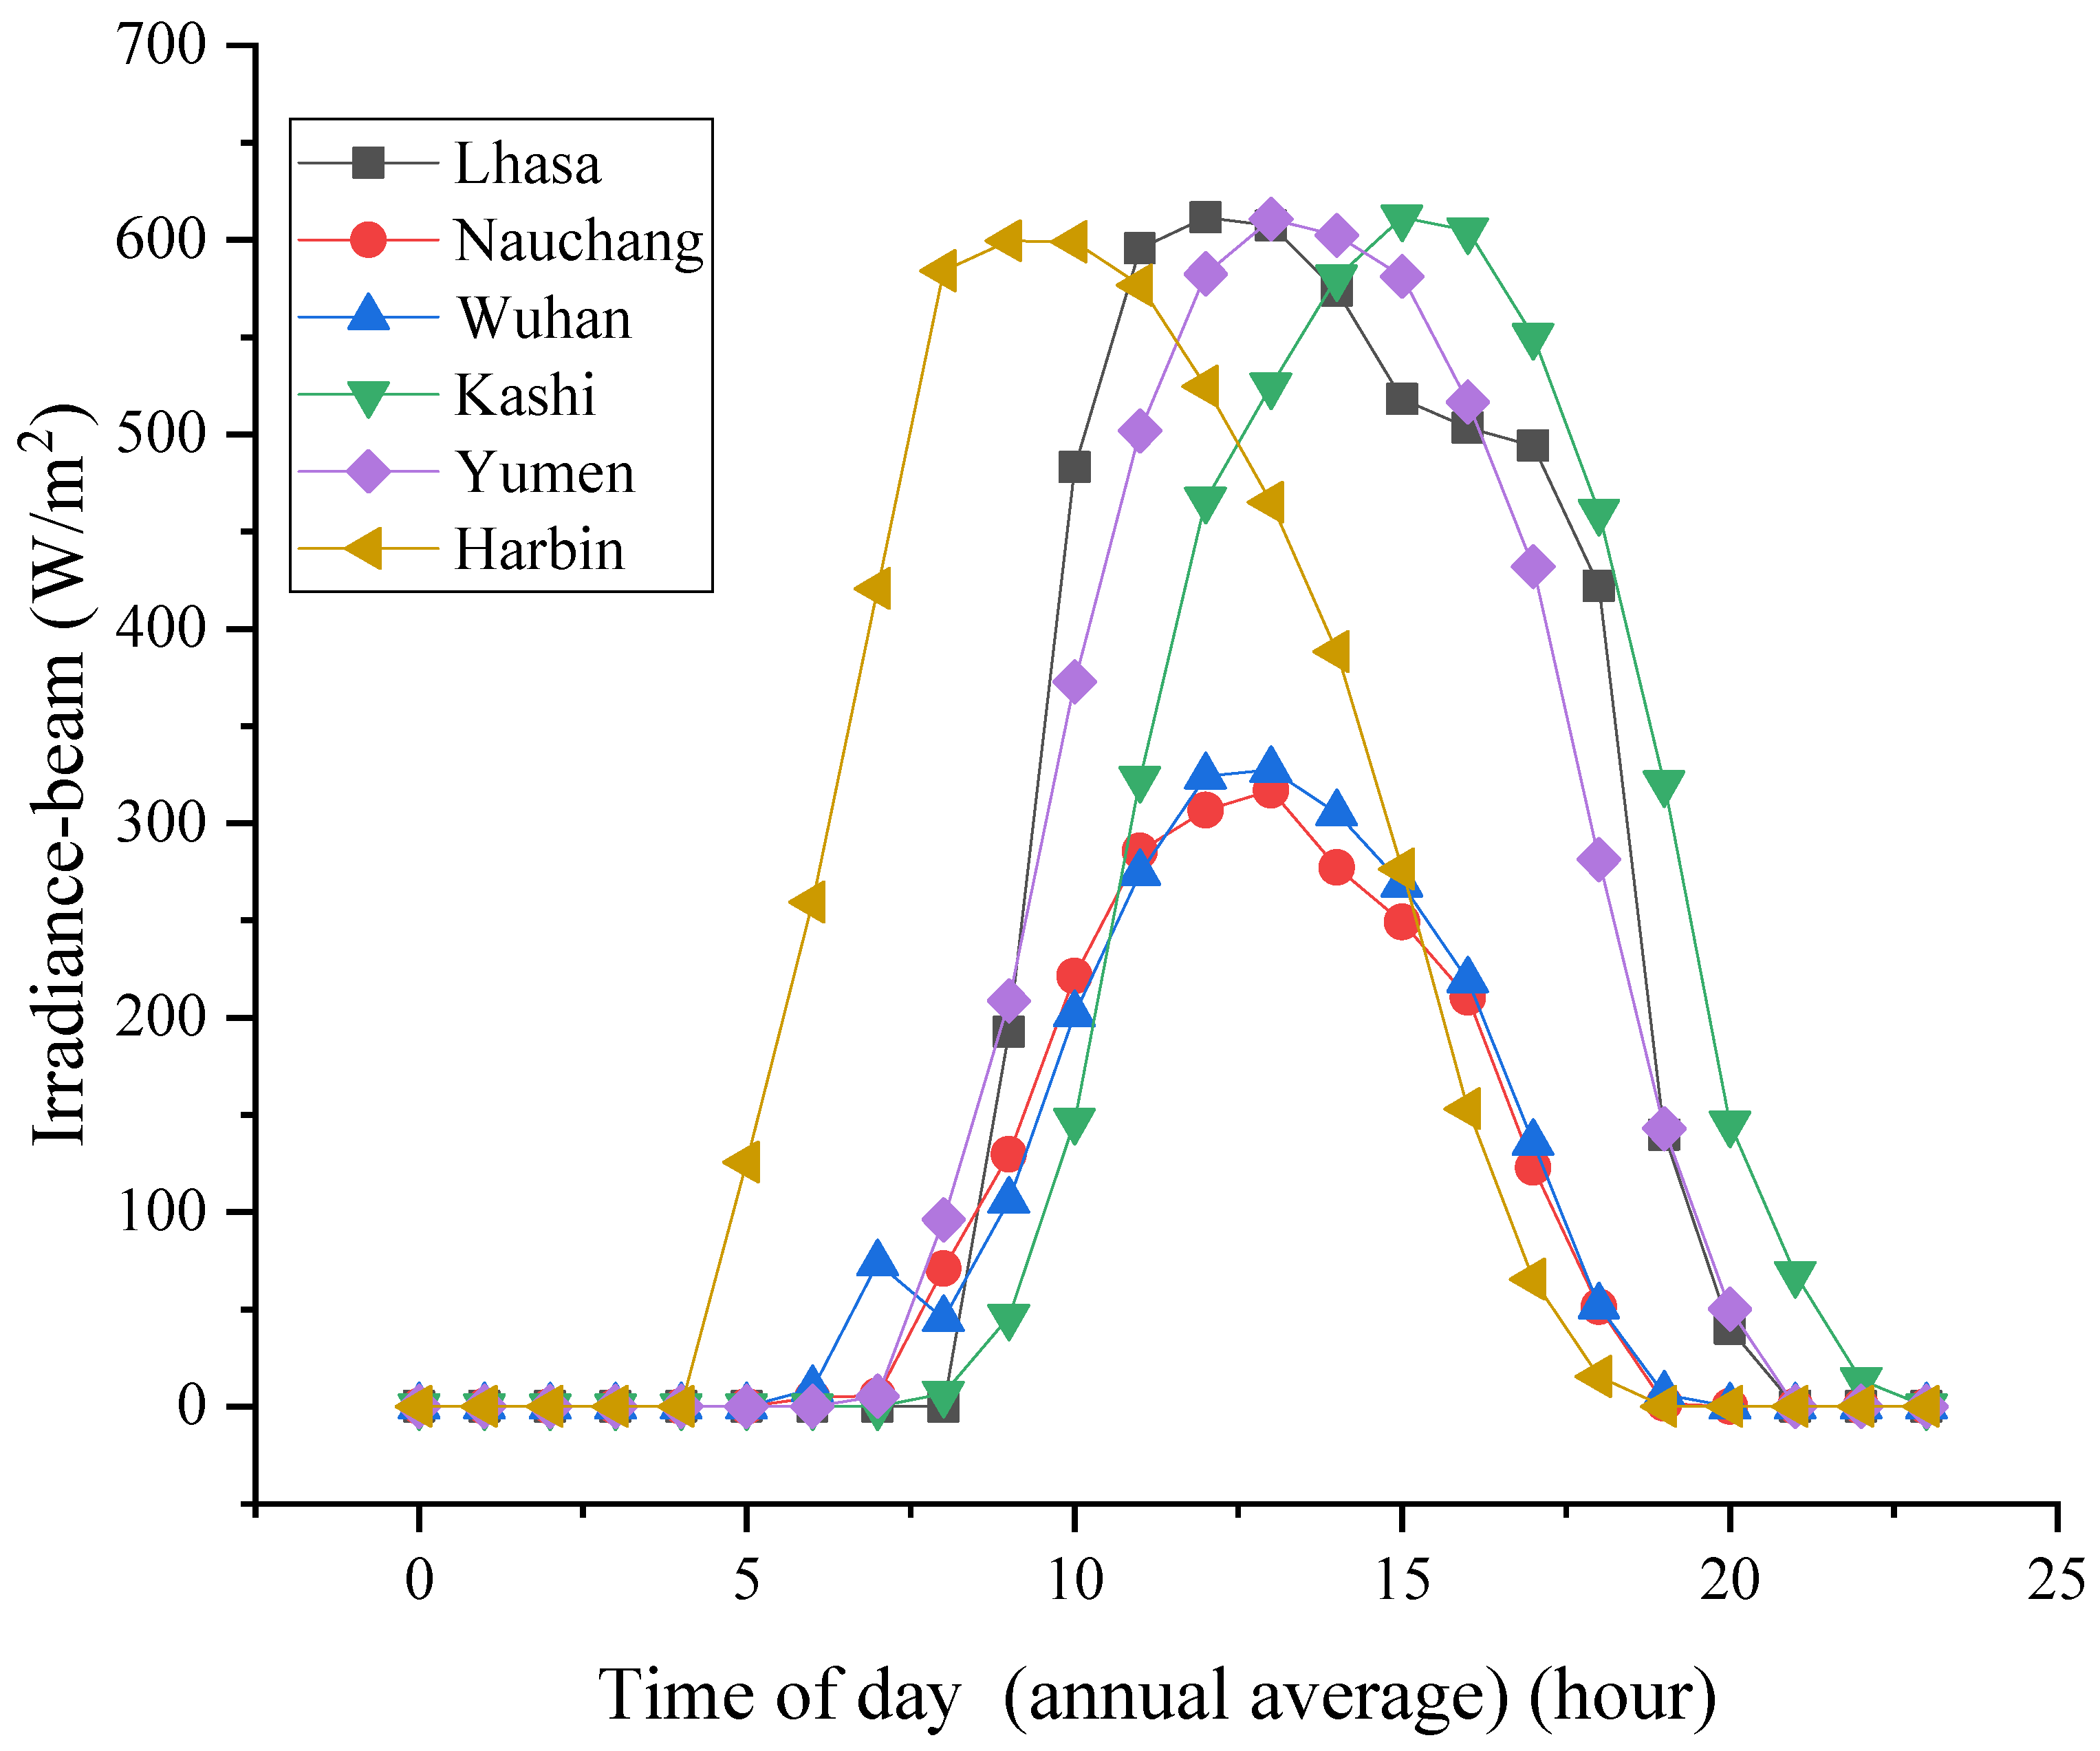
2.1. The Weather Characteristics of the Study Area

The weather data used for the study were obtained from the European Commission photovoltaic geographical information system (PVGIS). The study was conducted at 6 different locations in China; these locations were strategically selected across the country with different weather characteristics. It covers East, West, North, South, and Central China locations. The specific weather characteristics for each of the locations are presented in Table 1. The average hourly irradiance-beam for the 6 locations is shown in Figure 1.

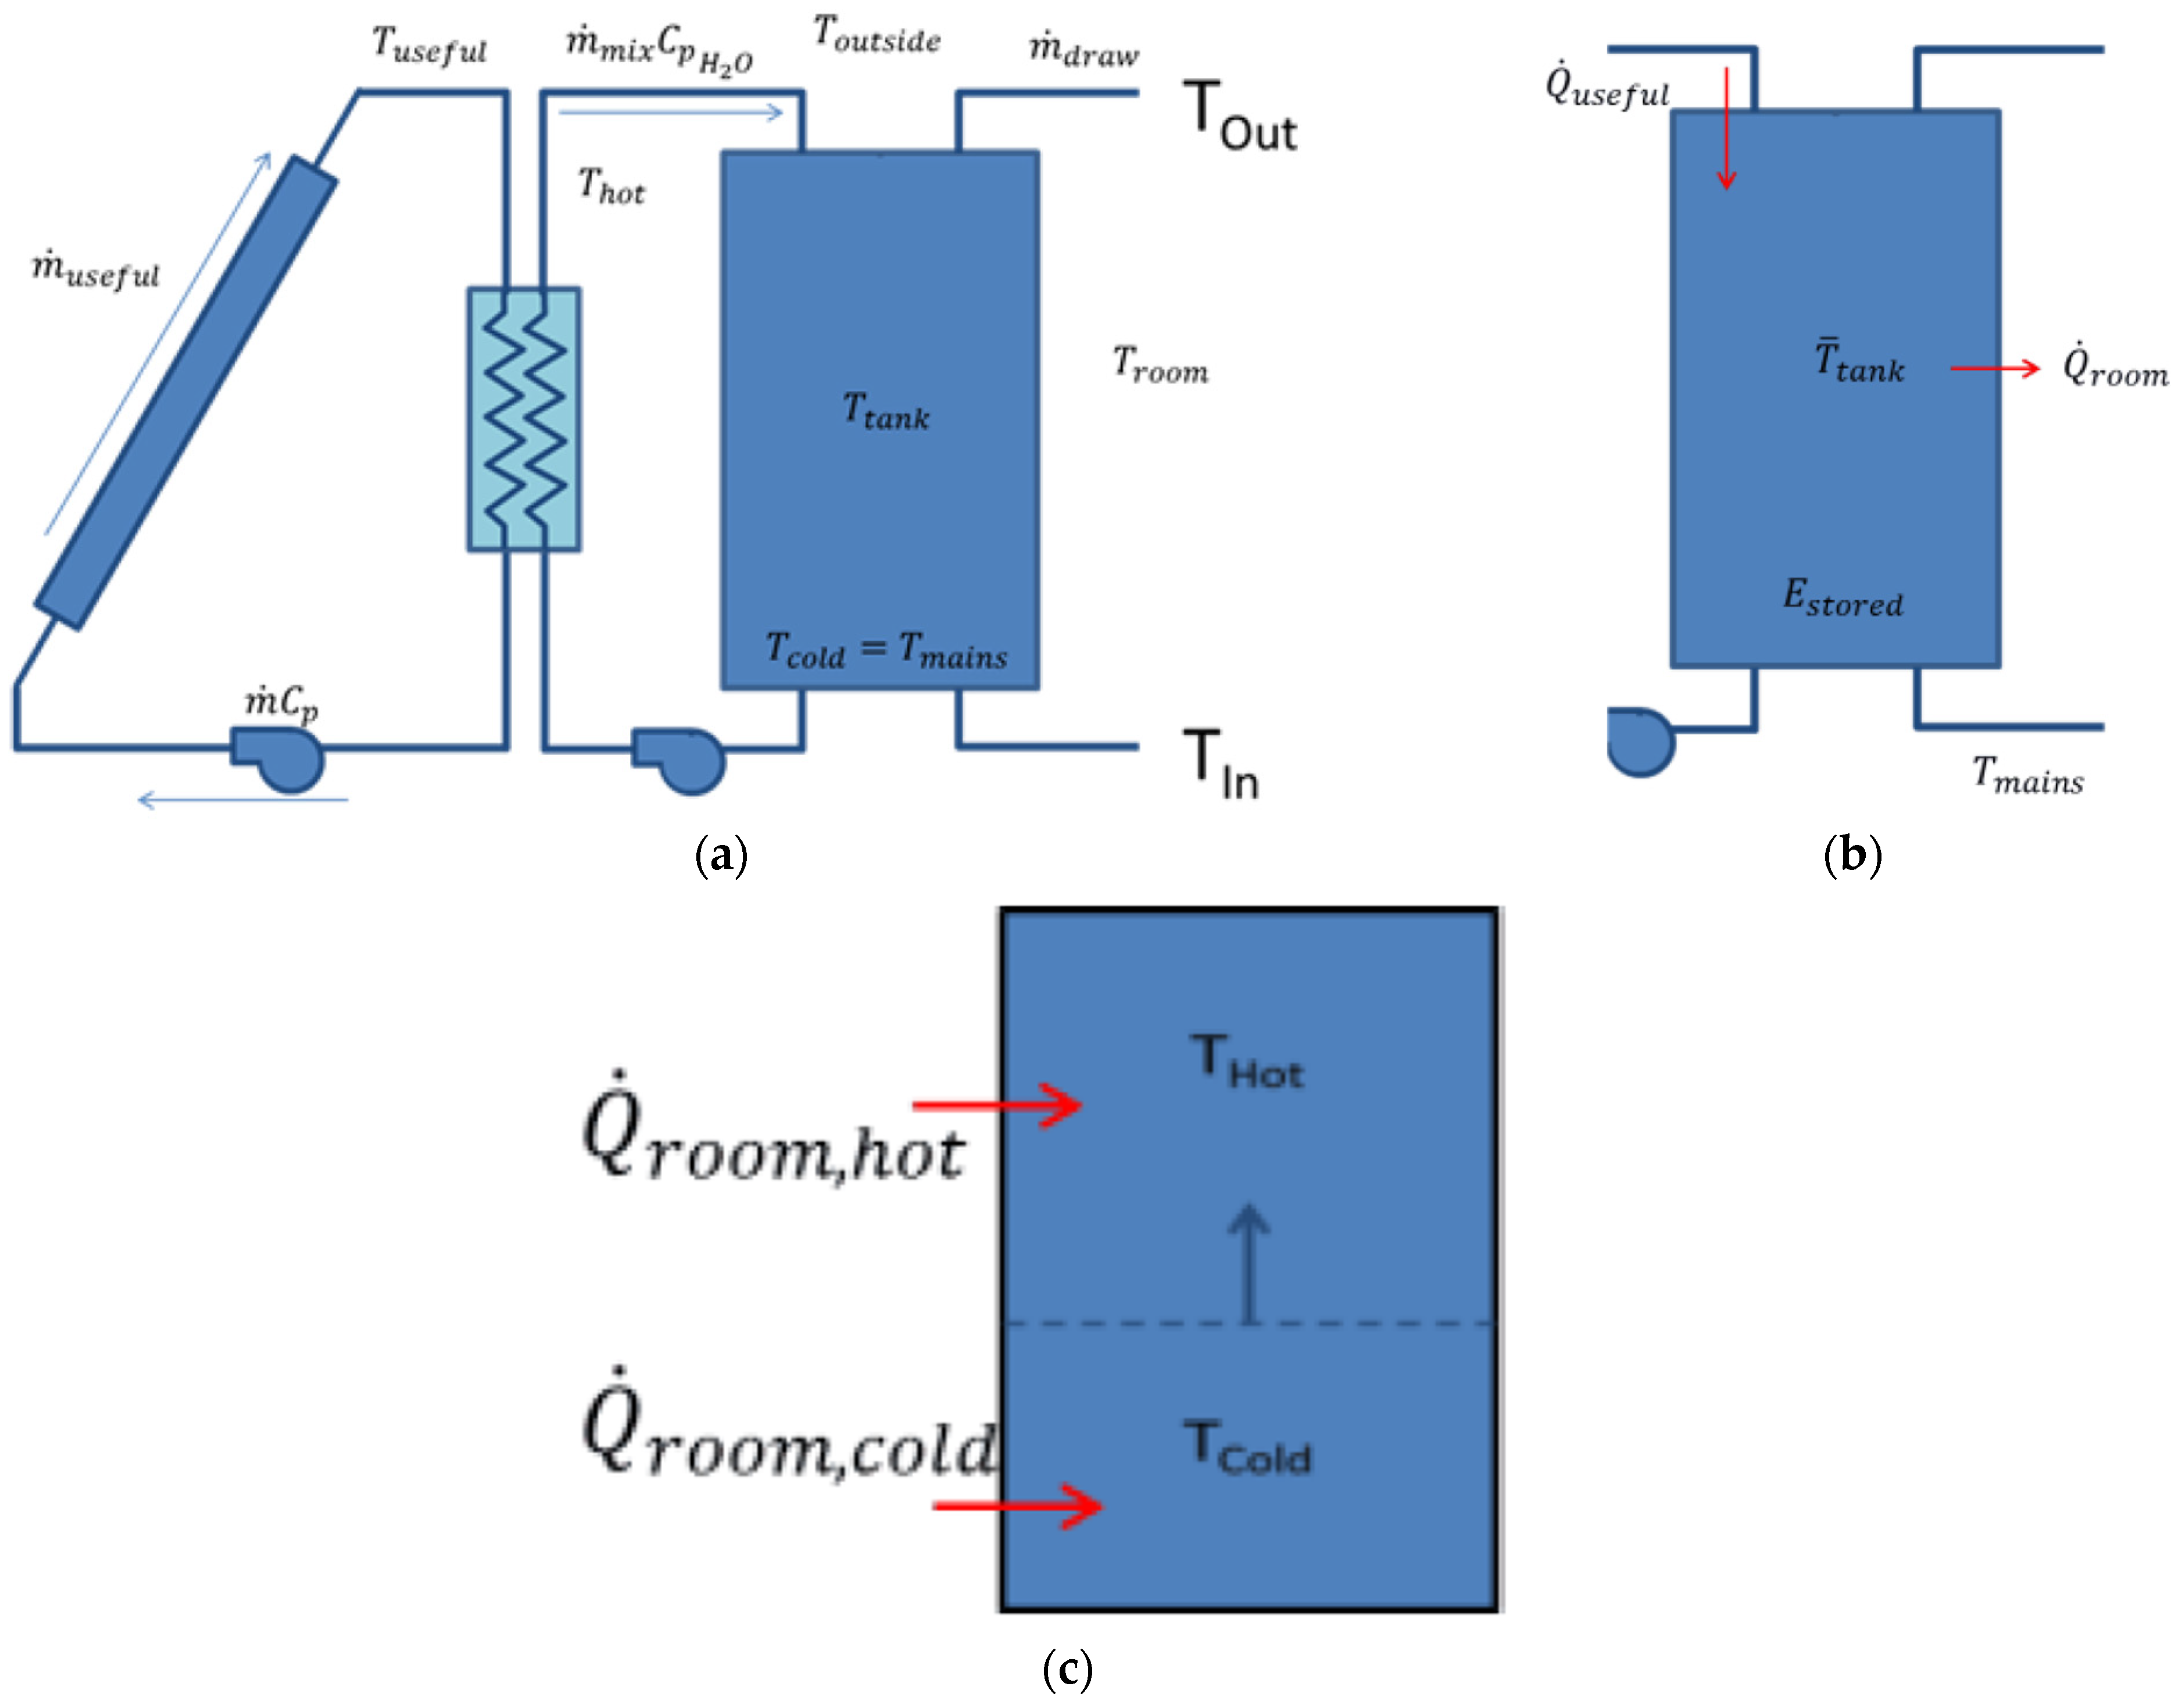
2.2. Modeling of SWHS in the SAM Model

A closed-loop flat-plate collector was modeled in this study; this model moves the solar energy from the working fluid to the water in an outside heat exchanger. This approach is mostly appropriate and employed in areas where freezing temperatures are experienced, since the working fluid of the collector can be another liquid other than water. Normally, the water coming from the solar tank is mostly used for the preheating of water in the auxiliary water tank, which decreases the quantity of heat required to deliver the water the set point needed by the user [40]. The energy savings of the control volume were calculated with the SAM model using the first law of thermodynamics Equation (1). The mathematical relations presented in this section were obtained from [21,40,41] unless otherwise cited differently.
d E c v d t = Q ˙ c v + m ˙ d r a w ( h m a i n s h W S T )
where the control volume is denoted by c v , the rate of heat transfer is represented with Q , the rate of energy change is also represented by d E d t , and m ˙ d r a w ( h m a i n s h W S T ) denotes the net rate of transfer of energy by mass which enters the water storage tank (WST) at the mains temperature, T m a i n s , which exits the WST at the mean tank temperature.
The control volume’s energy is equivalent to the water’s internal energy, which can be calculated using Equation (2).
E c v = ρ V W S T c p T W S T
where the water density is represented by ρ , the specific heat of the water is represented by c p , and the volume of the WST is denoted by V W S T .
In the course of the solar collection, it is assumed that the WST is uniform; Equation (1) is, therefore, reduced to Equation (3).
d T W S T d t = Q ˙ u s e f u l Q ˙ l o s s + m ˙ d r a w C p T W S T T m a i n s ρ V W S T C p
In this case, the heat lost to the ambient temperature T a from the WST is denoted by Q ˙ l o s s and the useful heat gain which is transmitted to the fluid in the collector is represented by Q ˙ u s e f u l
Q ˙ u s e f u l = F R A c I T K τ α τ α n U L T i n T a
Q ˙ l o s s = U W S T A W S T T W S T T a
The area of the collector is represented by A c , the heat removal factor for the collector is represented by F R , the incidence angle modifier is represented by K τ α , the incidence radiation on the surface of the tilted collector is denoted by I T , U L denotes the overall heat-loss coefficient for the collector, and the transmittance–absorbance product at normal incidence is represented by τ α n . The inlet temperature of the collector is represented by T i n , the WST surface area is denoted by A W S T , and the heat-loss coefficient is represented by U W S T .
The Perez method can be used to predict the incidence radiation on the tilted surface in Equation (4) as indicated in the book of [42], and this is the method that was used in this study. The IAM, which is the incidence angle modifier, is expressed mathematically as Equation (6).
K τ α = ( τ α ) τ α n = 1 + b 0 1 c o s θ 1
The angle of incidence is represented by θ , and the IAM coefficient is denoted by b 0 . Modifiers at angles ≤ 70° can be calculated using Equation (6).
The SWH system, as modeled in the SAM, was as presented in Figure 2a; the exact equation solved was based on whether there was the collection of useful solar energy or not. Figure 2b shows a diagram indicating when there was energy collection. The tank was assumed to be stratified into a cold and a hot node when there was no collection of useful solar energy, as illustrated in Figure 2c. Under the stratification conditions, the cold and hot water volumes will vary since the user will be drawing water for use. The volume of the cold water increases continuously whilst that of the hot water reduces till the collection of solar energy commences again. The following differential equations (i.e., Equations (7) and (8)) were, therefore, derived for the hot and cold node temperatures, respectively.
d T h o t d t = Q ˙ l o s s , h o t ρ V h o t C p
d T c o l d d t = Q ˙ g a i n , c o l d + m ˙ d r a w C p T m a i n s T c o l d ρ V c o l d C p
The main parameter for energy savings maximization is the solar fraction. It is the ratio of the quantity of solar energy collected by the water storage tank to the quantity required to supply the delivery temperature with auxiliary heater, and it is mathematically expressed in Equation (9):
f = Q ˙ s a v e d Q ˙ n e e d e d = m ˙ d r a w C p T s e t T m a i n s m ˙ d r a w C p T s e t T d e l i v e r e d m ˙ d r a w C p T s e t T m a i n s
where the delivery temperature provided by the water storage tank at the interested hour is denoted by T d e l i v e r e d , and the mean value of the delivery set temperature for household use is denoted by T s e t .
The capacity factor (CF) for the SWHS can be estimated using Equation (10). The power (kW) that is produced by the system was defined in this case as the power saved by the system for each time step, and it is mathematically presented in Equation (11) [40].
C F = n e t   a n n u a l   e n e r g y   ( k W h y r ) s y s t e m   c a p a c i t y   ( k W ) × 8760 ( h y r )  
where the net annual energy represents the annual total energy generated, the system capacity denotes the nameplate capacity of the modeled system, and the number of hours in one year is denoted by 8760.
G e n = Q a u x   o n l y Q a u x P p u m p
G e n was assumed to be greater than the load for every time step, however, since the SWH system cannot export power; the SAM takes Gen = load. The required electric power that the auxiliary heater will need to increase the water temperature from the solar storage tank to the set temperature is denoted by Q a u x (W) and it can be estimated using Equation (12). The P p u m p is the power of the pump.
Q a u x = m ˙ d r a w C p T s e t T d e l i v
where T d e l i v denotes the temperature of the water delivered from the solar tank. Since the heat from the sun is added to the water, T d e l i v > T m a i n s , then the power needed to bring the water to the desired or set temperature will be lower than the one needed to attain the needed set temperature in the absence of the SWH system. The electric power Q a u x , o n l y (W) required to heat the water in the absence of the SWH system can be calculated using the mathematical relation presented in Equation (13) [40].
Q a u x , o n l y = m ˙ d r a w C p T s e t T m a i n s
The annual power saved through the use of the SWH system can be evaluated using Equations (14)–(16).
P p u m p = P u m p p u m p   r a t e d   p o w e r / P u m p e f f i c i e n c y
For every time step
P s a v e d = P w i t h o u t   s o l a r P w i t h   s o l a r P p u m p
If P s a v e d > P l o a d ,
P s a v e d = P l o a d
A n n u a l p o w e r   s a v e d   = S u m ( P s a v e d )

2.3. System Used for the Assessment of the Glazed Flat-Plate SWH

The performance of the SWHS was conducted at 6 locations in China. The alternate-energy technology AE-56 glazed flat-plate collector module was used for the analysis. It has a serial number of 2002001G with an area of 5.18 m2. In this study, two different working fluids (i.e., glycol and water) were modeled to evaluate their technical and economic performances under the Chinese weather conditions. A tilt angle was selected based on the latitude of each study area. Data from the manufacturer state that the collector has an F R ( τ α ) of 0.691 and F R U L of 3.4 W/m2·°C. China’s residential average daily hot-water consumption is estimated to be about 163.270 kg/day [43], the value which was used in the modeling. The rated system size used for the analysis was 3.051 kW. The rest of the technical parameters employed for the modeling are provided in Table 2.

2.4. Financial Parameters for the Modeling

The nominal and real levelized cost of energy (LCOE) are estimated by the model. The inflation-adjusted value is the real (constant) LCOE, whereas the current dollar value is the nominal LCOE. The type of analysis being conducted determines the choice of LCOE that will be used. The use of the real LCOE may be right for analyses that are in the long term; this takes into consideration the several years of inflation over the lifetime of the project. However, in the case of the nominal (current) dollar, it may be suitable for analysis that cover the short term [44,45]. The cost of energy was expressed mathematically, as presented in Equation (17):
L C O E = C 0 + n = 1 N C n 1 + d n n = 1 N E n 1 + q n
where the annual costs in a year n are denoted by C n , the amount of the initial investment is represented by C 0 , and the produced energy by the system in year n is represented by E n . Similarly, the nominal discount and the real discount rates are represented by d and q , respectively, and N denote the analysis period in years.
The net present value (NPV) indicates how feasible a project will be economically; this includes both the cost and revenue (or savings for commercial and residential projects). Normally, a project is assumed to be viable economically when the NPV obtained is positive, and non-viable if the obtained NPV is negative. It is mathematically expressed as presented in Equation (18):
N P V = n = 0 N C 1 + D n
The study also assessed the payback period (PBP) for the two working fluids in the study areas. This is defined as the time (years) needed for the cash flow to equal the net capital cost in year zero. The mathematical relation for the payback period is shown in Equation (19):
P a y b a c k   p e r i o d = T 1 1 + i = 1 T 1 1 C I C O i C I C O T i
where the cash inflow is represented by C I , the cash outflow is denoted by C O , and T i is the project year i where i = T 0 + 1 T .
The average inflation rate in China is around 0.7% [46], with a sales tax rate of 13% [47]. China’s average household electricity price is also estimated to be around 0.081 USD/kWh [48]. An annual maintenance cost of 1% [10] was used in the financial analysis. The analysis period for the study was 25 years, with a 5% of the installed cost as the net salvage value. The cost of the collectors were taken to be $300 per meter squared [10]. A loan interest rate of 3.65% [49], the current rate in China, was used for the analysis.

3. Results and Discussion

The modeling outcome is presented in this section. It covers the technical, economic, and environmental aspects of the findings and a sensitivity analysis of some technical and economic parameters used.

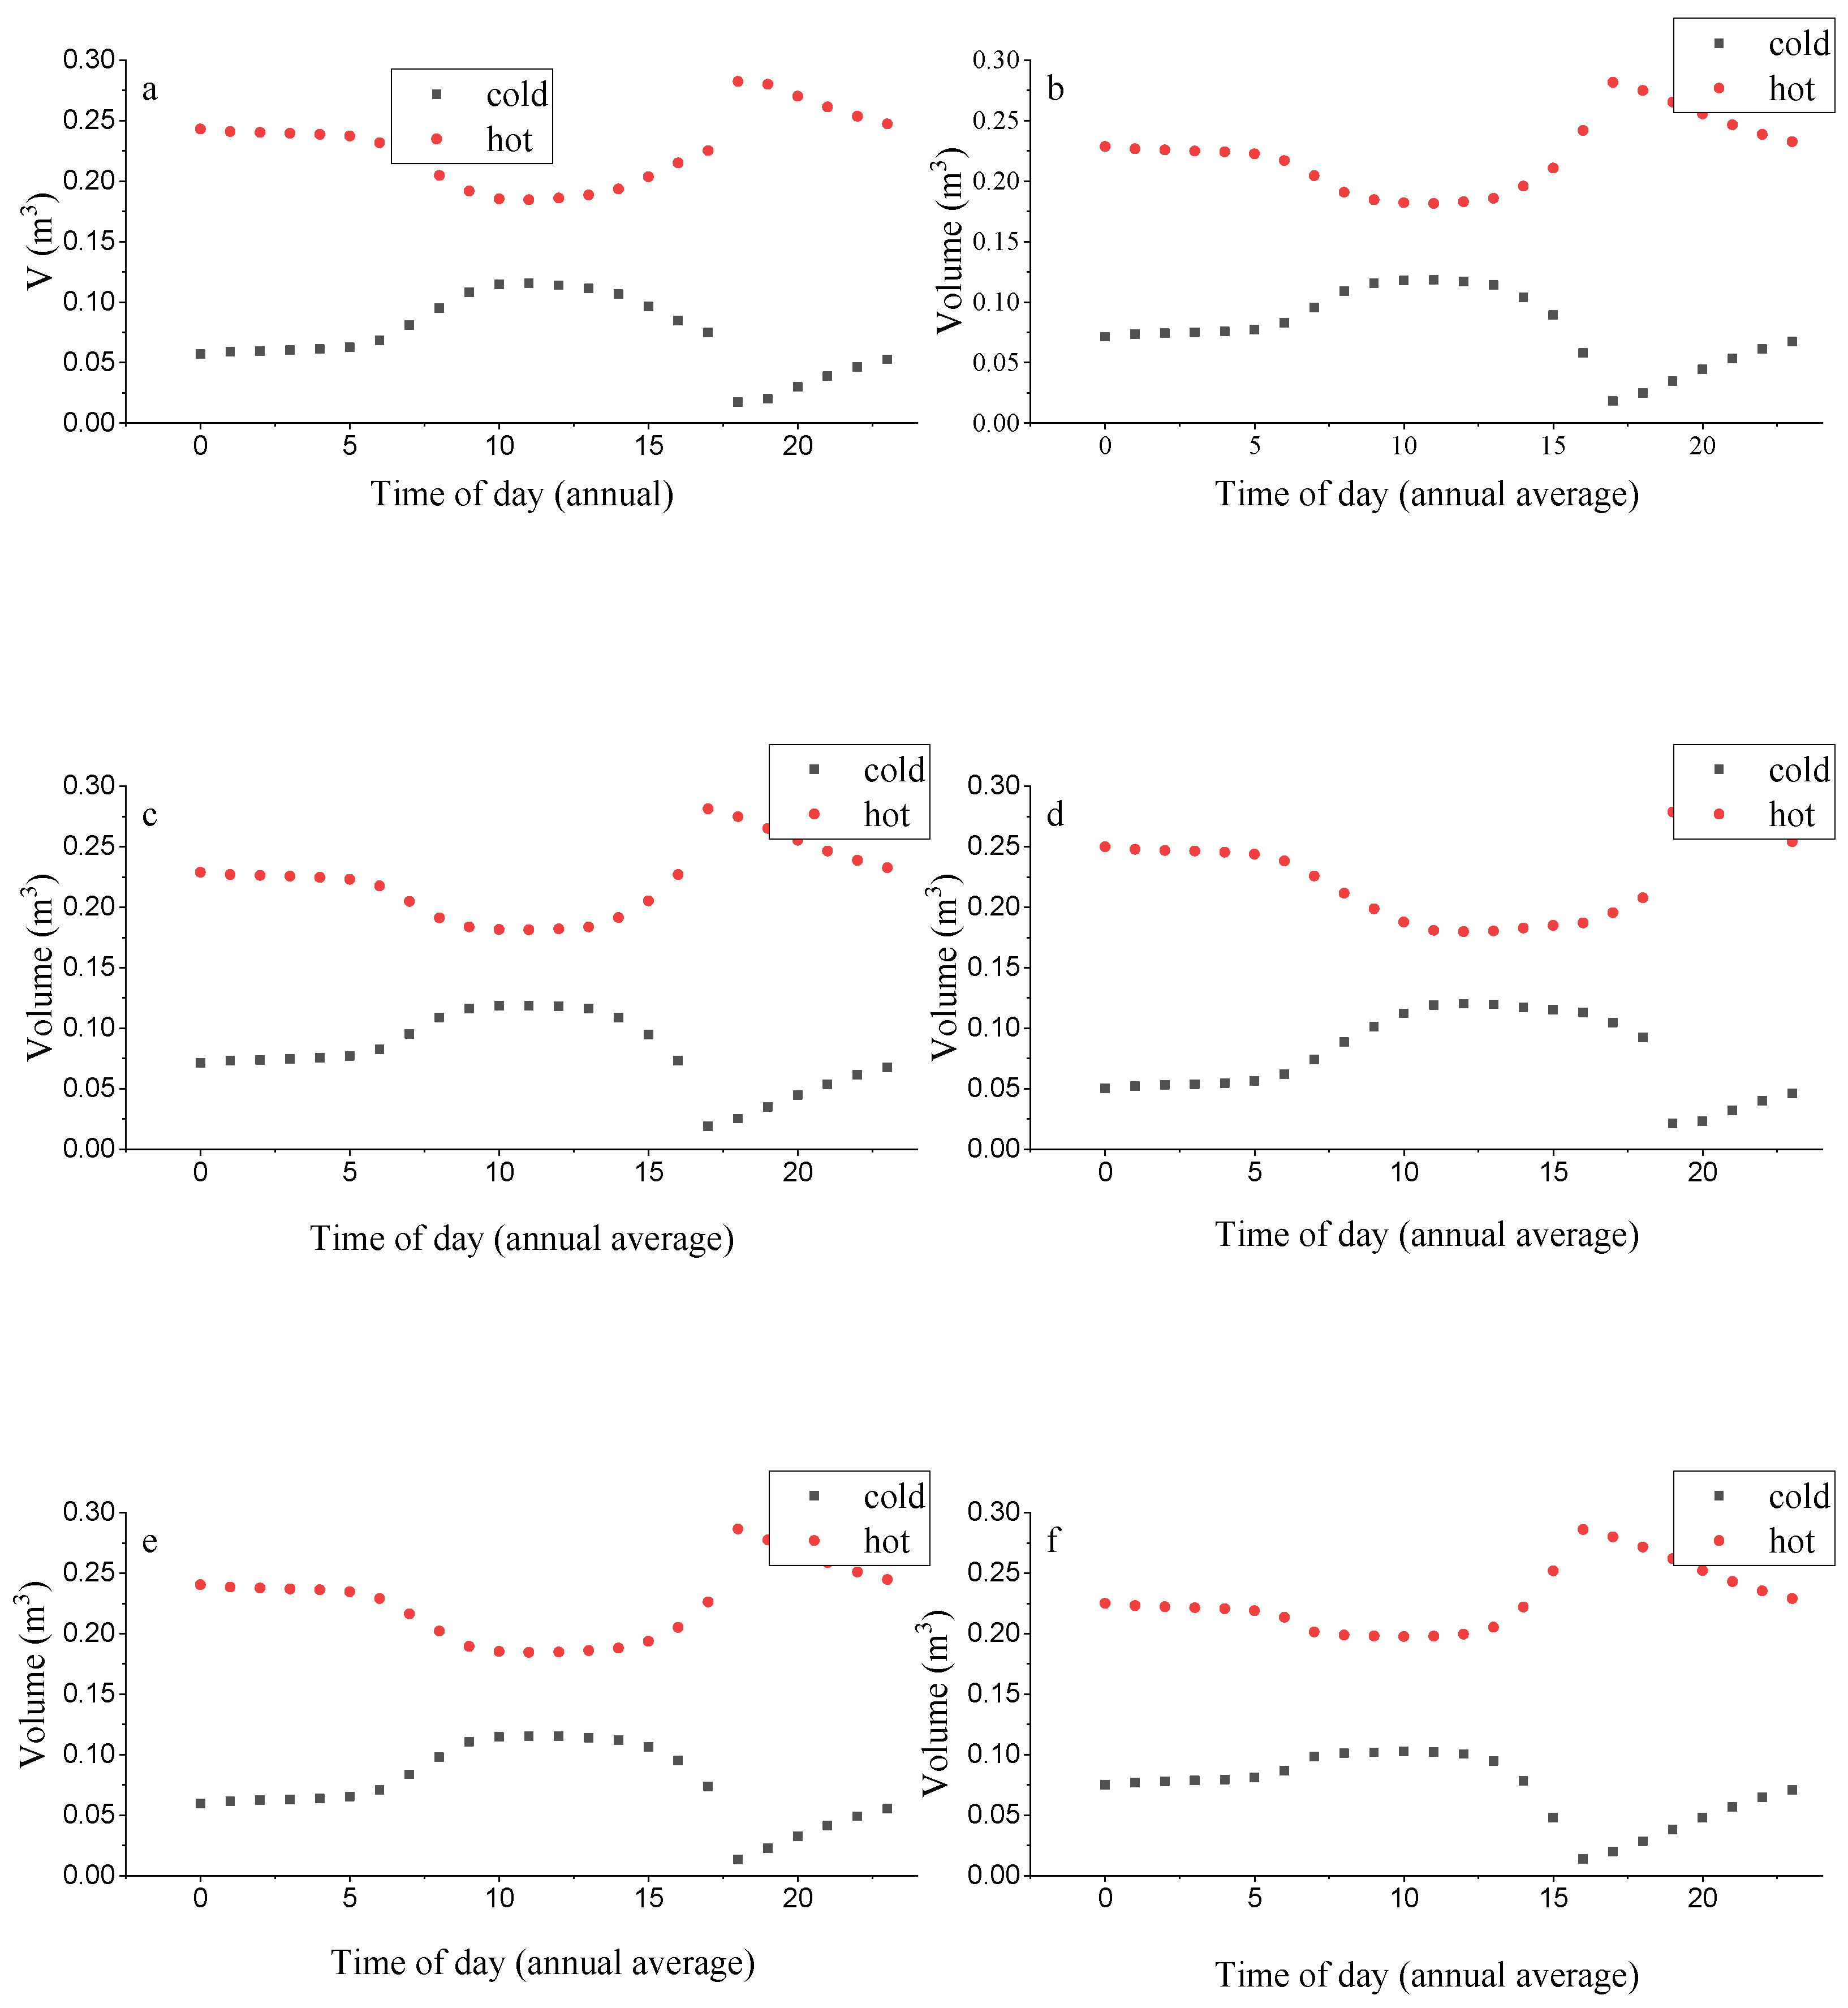
3.1. Technical Performance of the SWHS

The technical performances of the SWHS at the six different locations across China are presented in Table 3. It is clear from the results that the level of performance from the various systems is affected by the solar irradiation at the various locations. Lhasa recorded the highest CF of 11% using water as the working fluid, and 10.70% using glycol as the working fluid. Nauchang had the least CF due to the poor weather conditions that exist at that location; it also recorded the least solar fraction. Having the least solar fraction means that much more energy is needed from the back-up system to meet the hot-water demand of the household at that location. Therefore, Nauchang had the least energy saved per year both for the glycol and water systems. The reverse occurred at Lhasa, where the highest energy saved was expected to occur per year, i.e., about 2928 kWh of energy was expected to be saved per year at Lhasa using water as the working fluid. In the case of behind-the-meter projects, the annual AC energy (see Figure 3) forms the entire net energy that is sent to the load. It is this energy that is utilized to lower the annual electricity bill of the owner of the project. The highest energy sent to the load occurred between the period of 07:00–10:00; this is the period with the highest hot-water draws. The lack of solar energy during the night led to an increase in cold water, reducing the energy sent to the load. This, however, reversed in the morning when the collection of useful solar energy begins. The winter period in China begins between the period of November and March, and as indicated in Figure 3, the highest energy sent to the load occurred within that period, as more hot water was required during that period. The summer period had the least energy sent to the load.
It was observed that the effect of the two different working fluids on the performance of the SWHS was insignificant, as there was very little change in terms of the output performance of the system. This means that any of them can be used by an individual depending on the availability of the working fluid; water, however, was slightly on the higher side in terms of performance. It is, therefore, safe to recommend water as the optimal working fluid for SWHS at the various locations in China, especially at locations that have temperatures above the freezing point of water. Areas with temperatures below the freezing point can use glycol as a working fluid.
Since it has been established through this study that the impact of the working fluid (i.e., water and glycol) on the technical and economic performance of the SWHS at the various locations did not vary much, only that of using water as the working fluid was mostly used for further analysis going forward in this study. The volume of hot and cold water for the various locations over the day per annum is presented in Figure 4. The results of the study showed a similar trend at all locations, except that there were differences in the volumes of the hot and cold water throughout the period. The hours between 07:00 and 10:00 experienced a sharp decline in hot water and a rise in cold water due to hot-water draw within that period, as shown in Figure 5. An increase in the hot water started after 15:00 until it reached a peak around 16:00 and started to decline again due to the lack of solar energy and increase in hot-water draw during that period, leading to an increase in the volume of the cold water.

3.2. Economic Performance of the SWHS

The economic performances of SWHS modeled at the six locations are presented in Table 4. For the purposes of economic comparison in this study, the real LCOE was used, since this study is over the long term, i.e., 25-year period. The obtained real LCOE at the various locations suggests that the residential SWHS at Lhasa would be cheaper and more cost-effective compared to all the other locations. This confirms the earlier results presented under the technical performance section. The cost of energy at Nauchang would be almost twice the cost of energy at Lhasa; this is due to the poor weather conditions at Nauchang. The weather conditions at the other locations also had an effect on their economic outlooks. The next cost-effective location was Harbin, which recorded a real LCOE of 0.1273 USD/kWh. The net savings on electricity annually were projected to be between 11.4 and 21.7%, using the financial parameters as it currently prevails in the country and the various weather conditions. The highest net savings on electricity were expected to happen in Lhasa due to reasons ascribed earlier. The results also show that the only viable project would be one located in Lhasa with water as the working fluid. It is the only project that recorded a positive NPV of USD 52, with a simple payback period of 15.8 years. All the other projects at the various locations would record a negative NPV either with a longer simple payback period within the 25-year period, or without a simple payback period at all. It is important to note that even the project with glycol as its working fluid in Lhasa recorded a negative NPV. Those projects with no simple payback period suggest that such projects would require more time beyond the 25-year analysis period to probably break even. This makes such a project non-viable, since most such plants have a lifetime of 25 years.

3.3. Sensitivity Analysis of Key Performance Indicators

The effect of some key parameters on the performance of the SWHS at the various locations were assessed in this section.

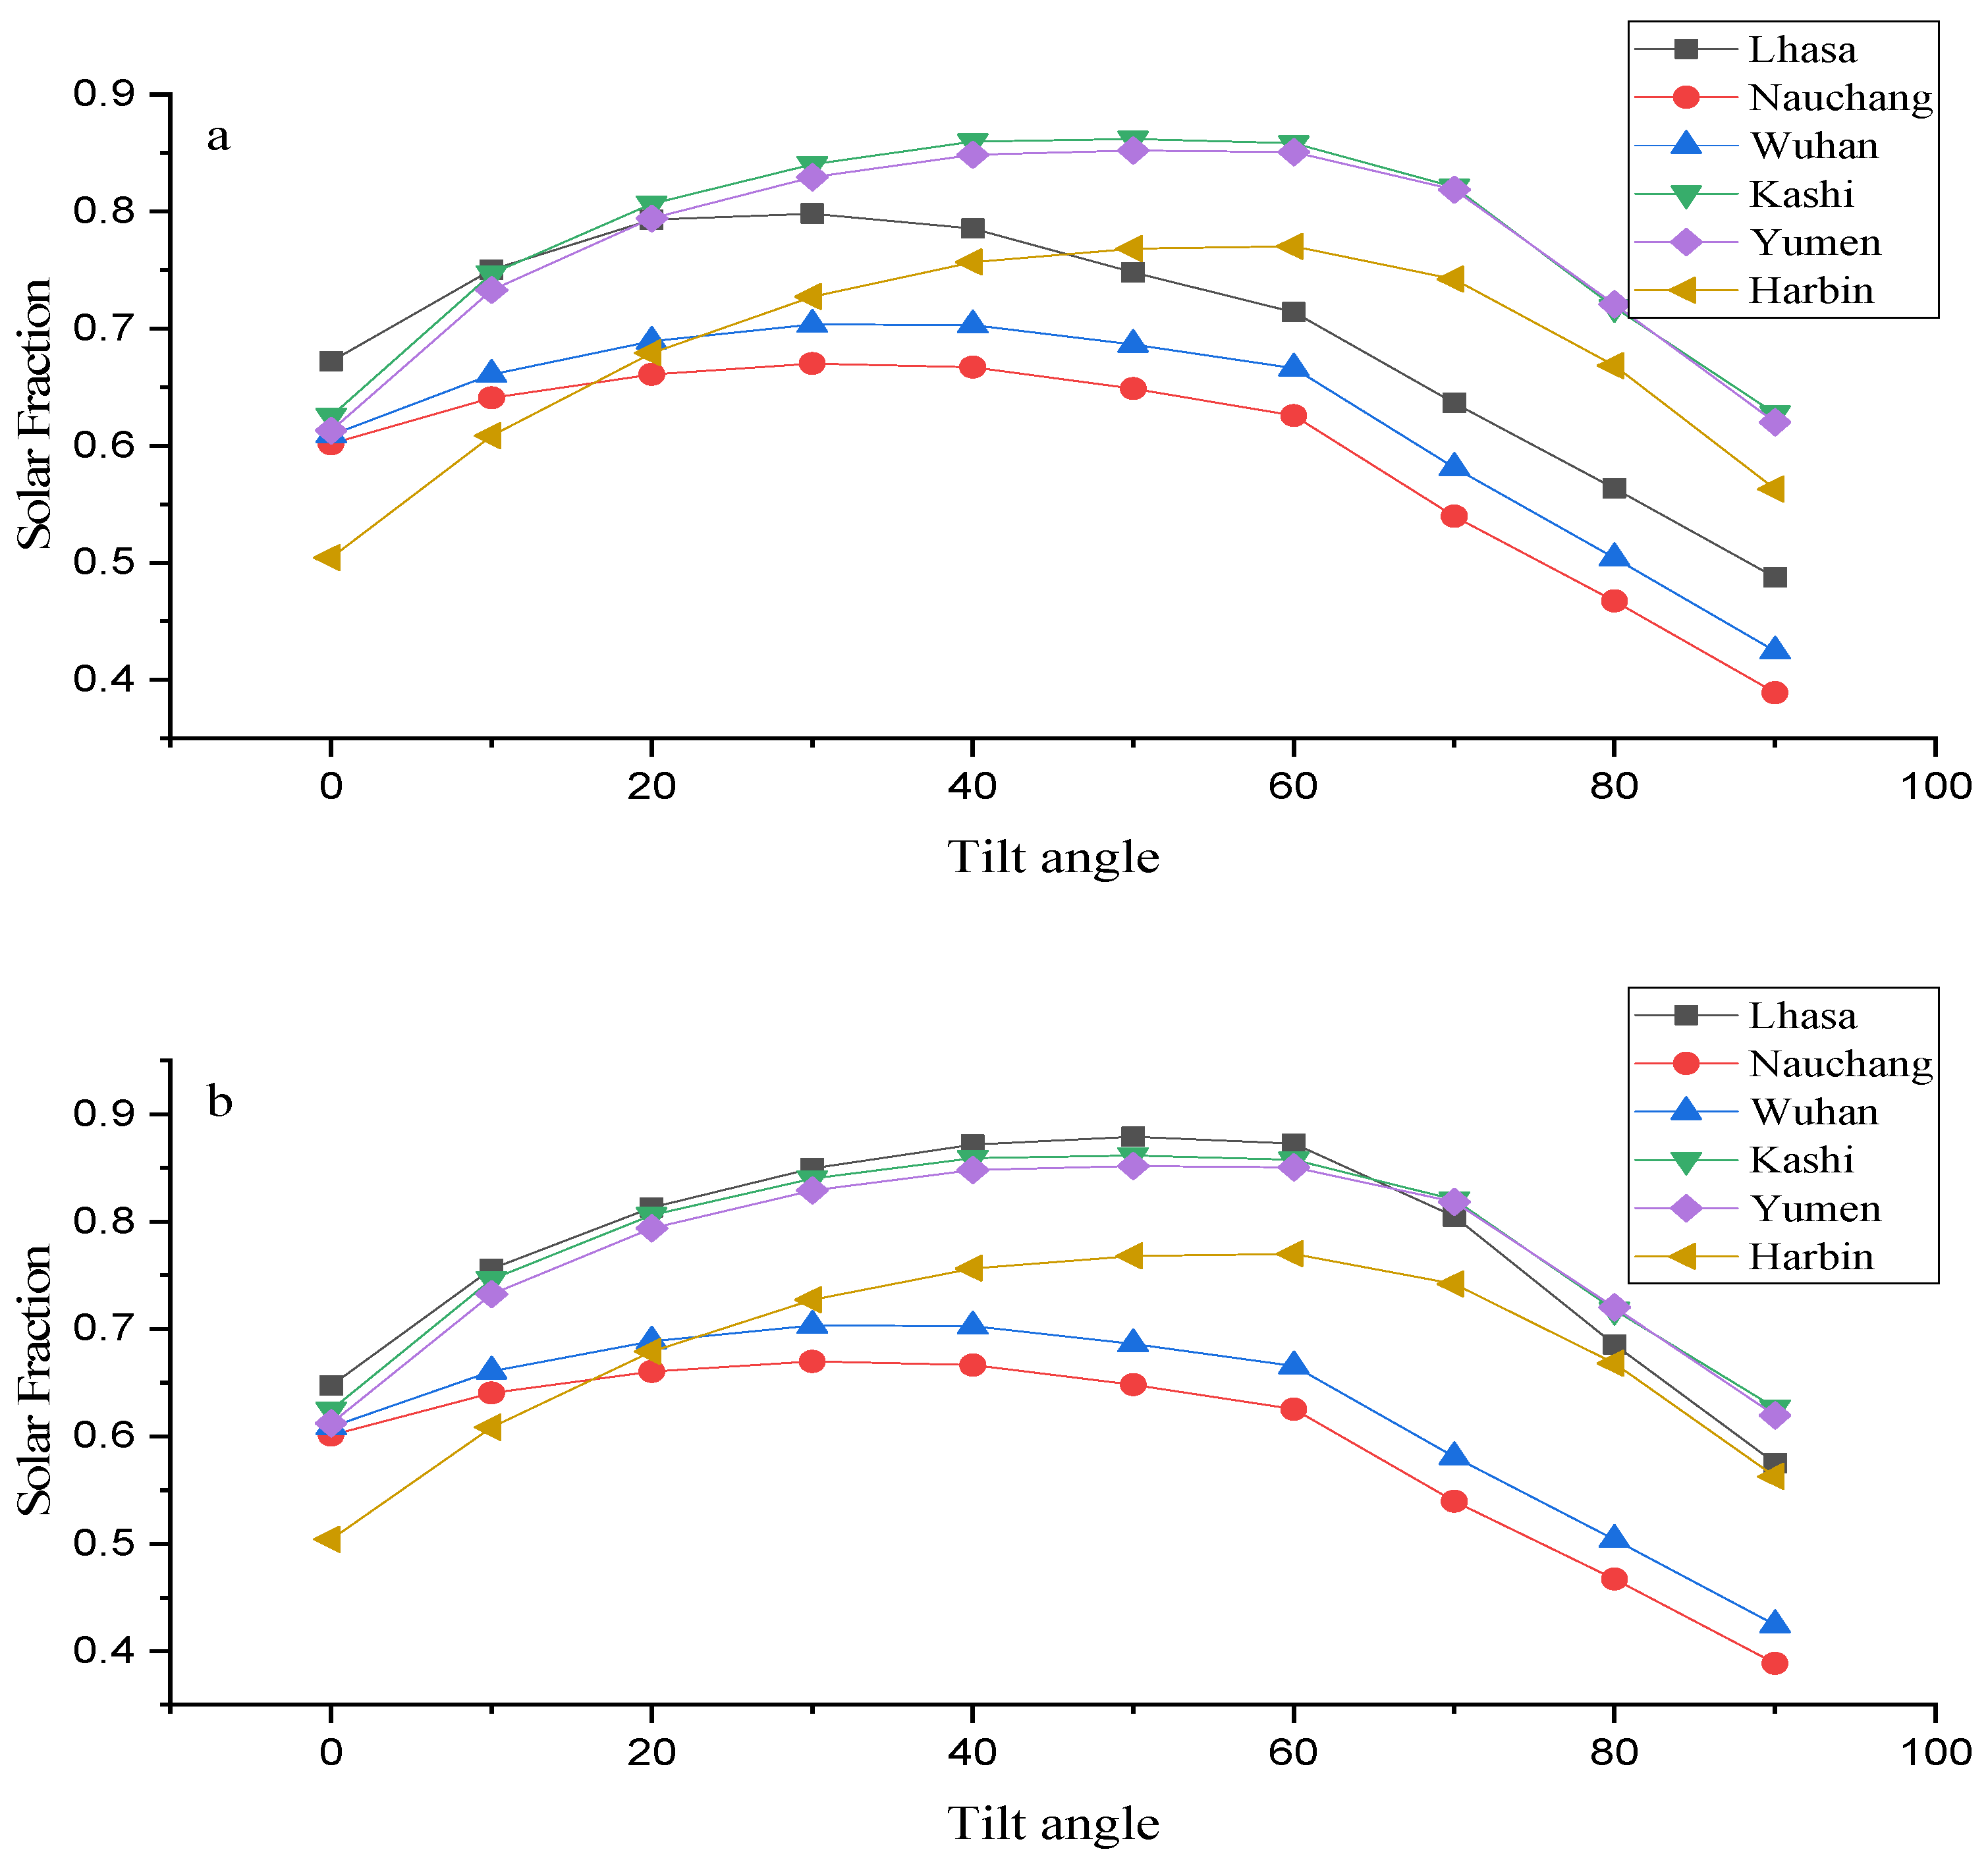
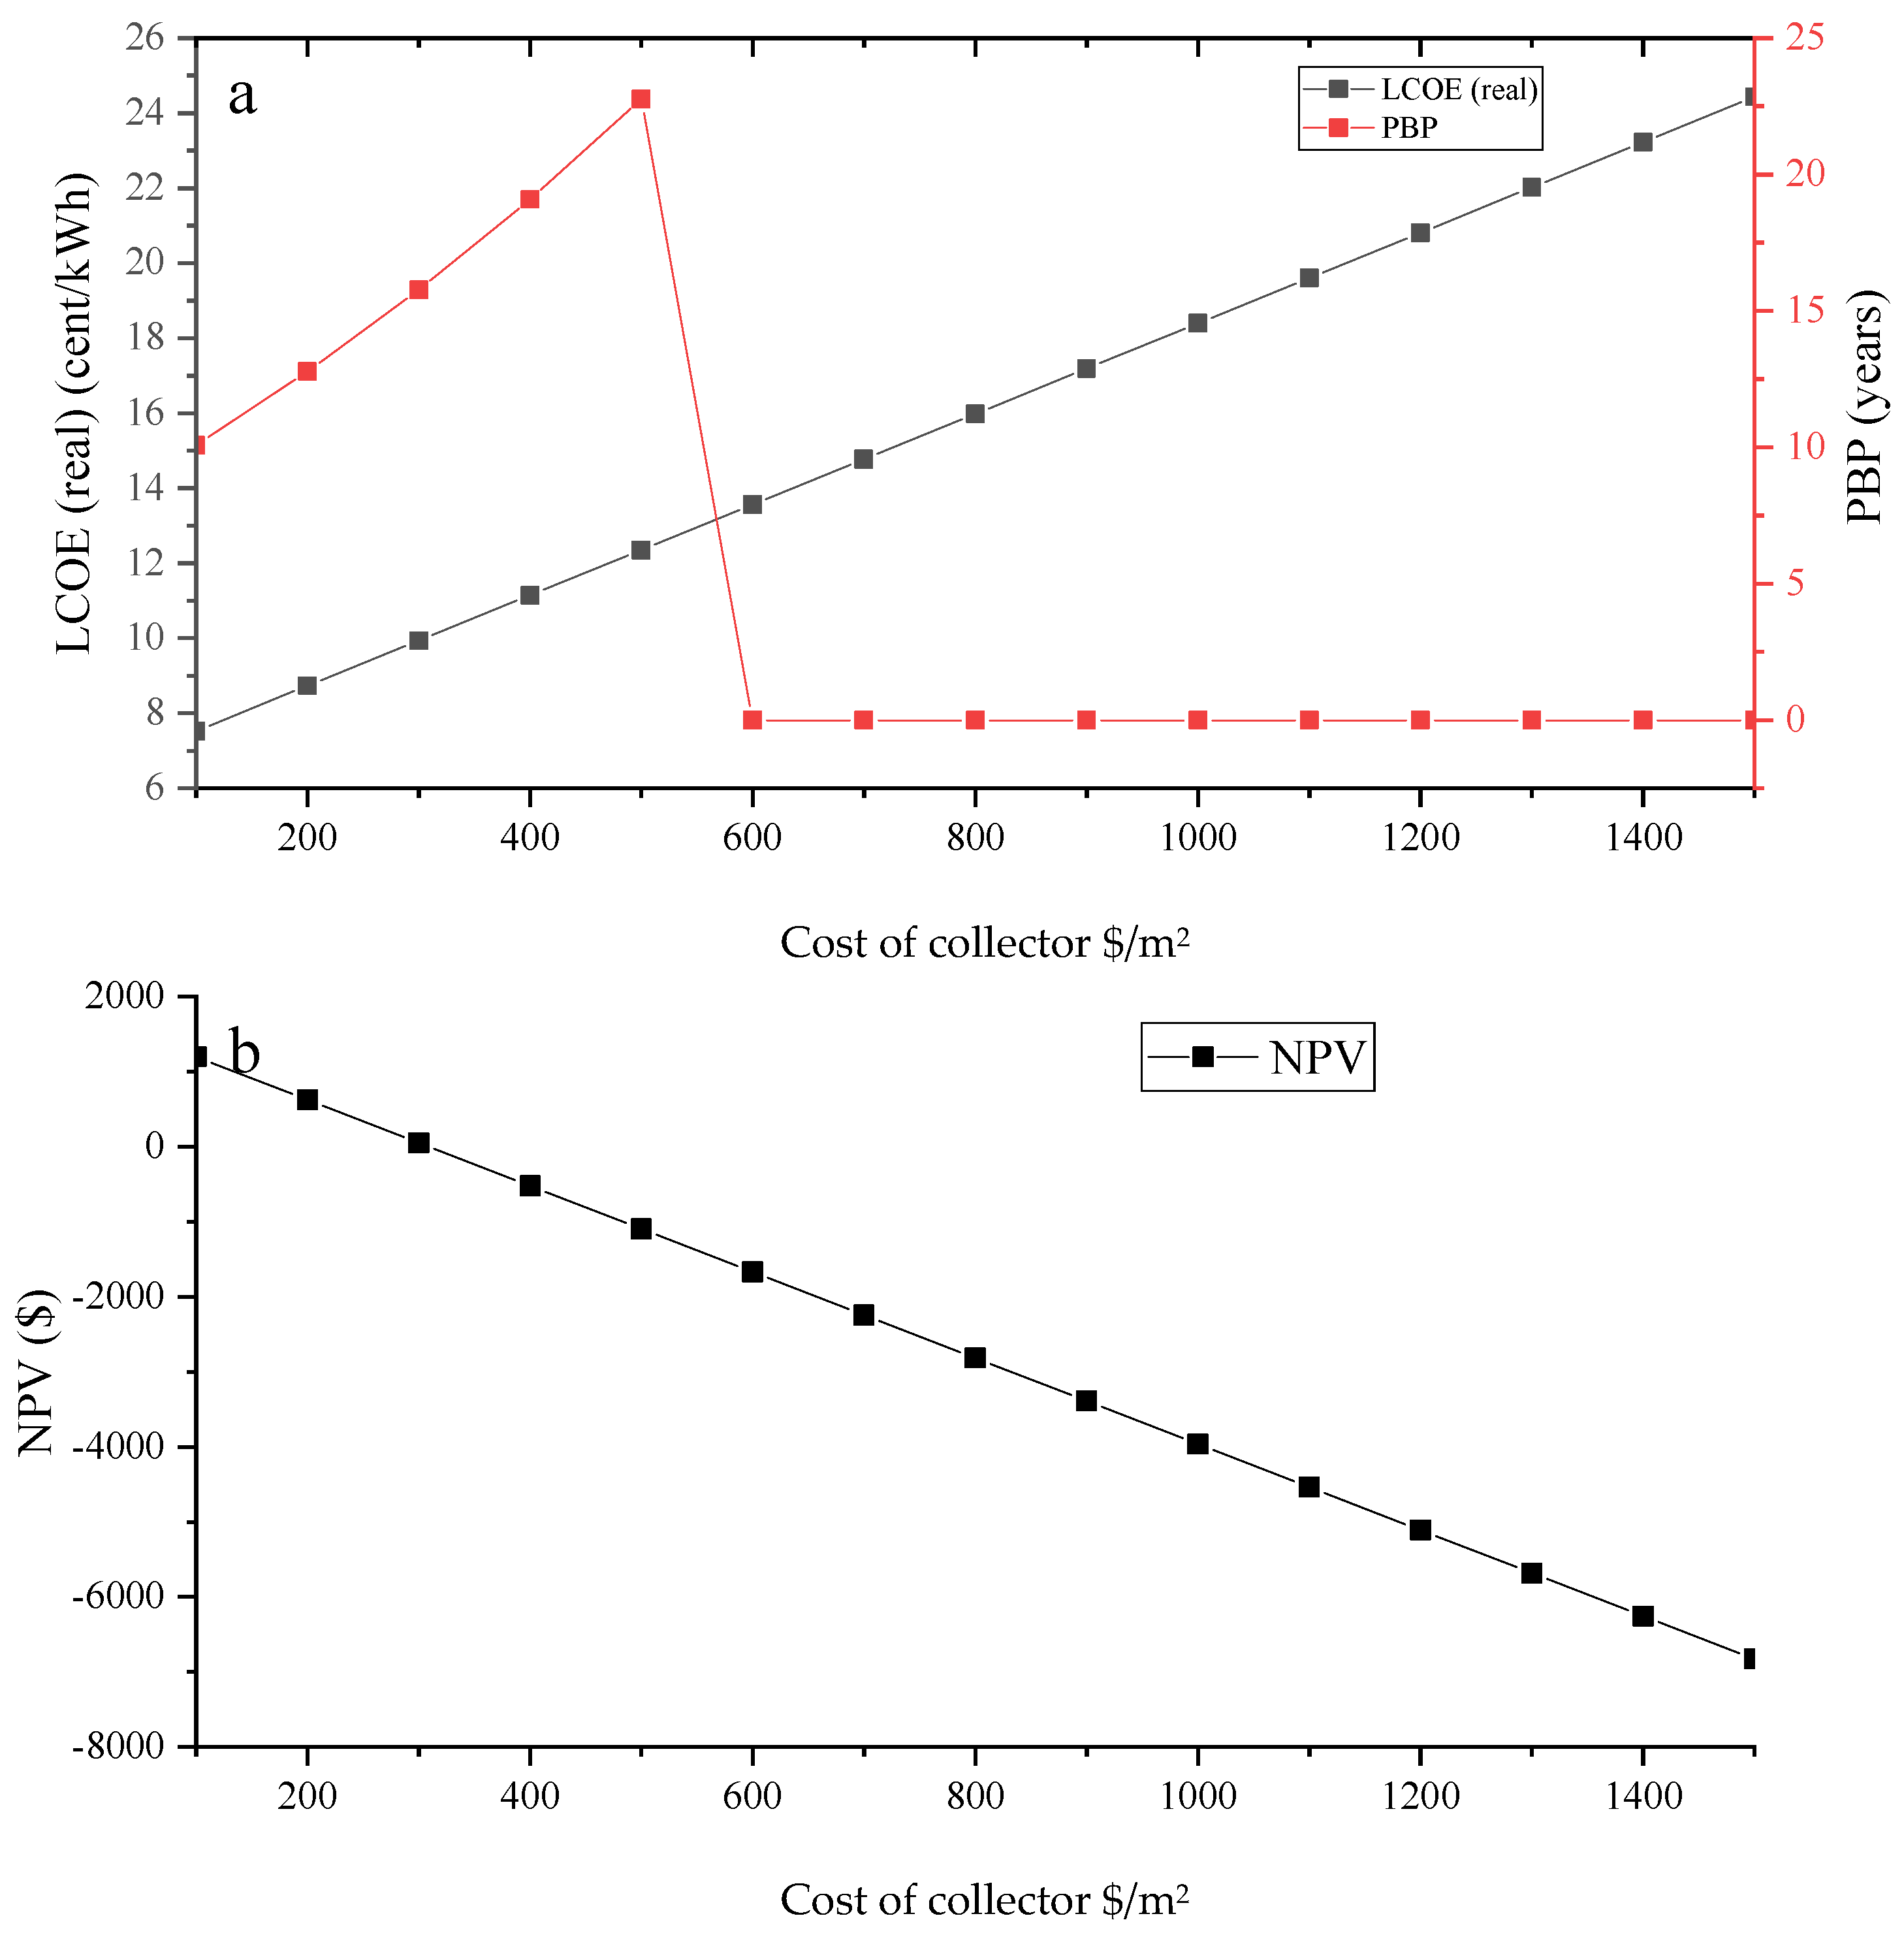
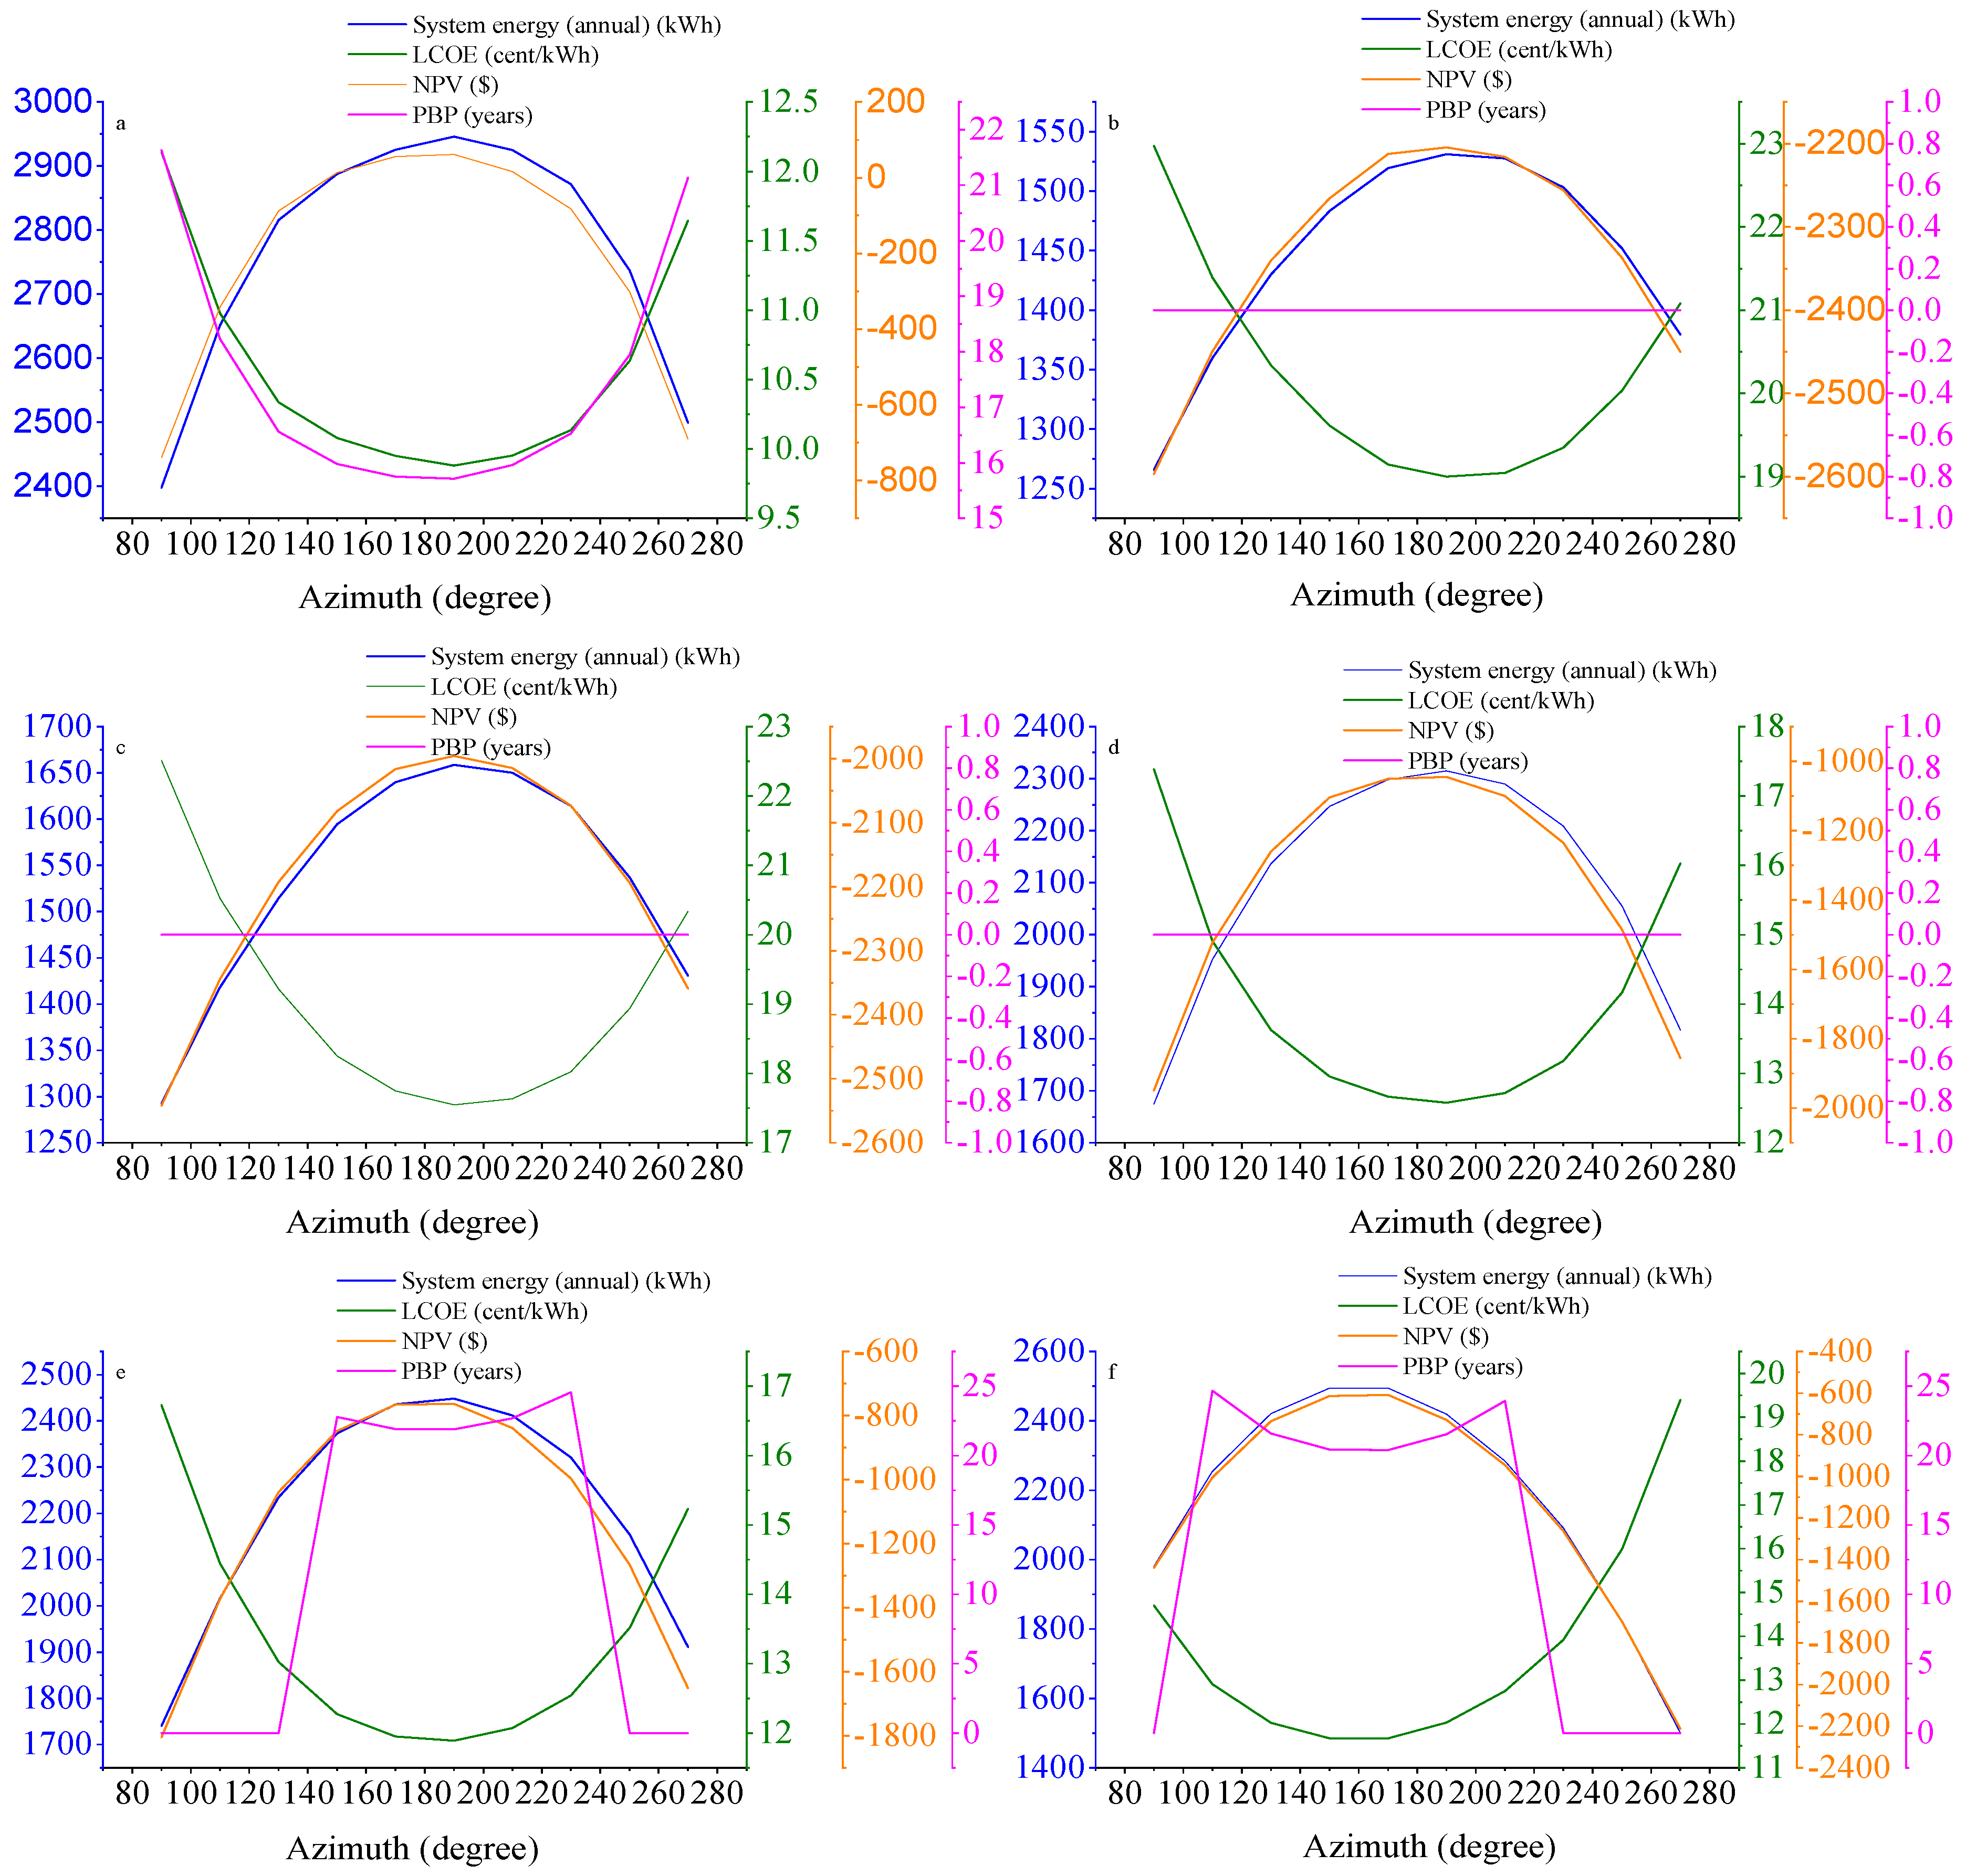
3.3.1. Sensitivity Analysis of the Tilt Angle and the Effect of the Cost of the Collector on the Economics of the SWHS

In this study, the latitudes for the various locations were used as the tilt angles during the initial analysis, as presented above. The optimum tilt angle is crucial for the performance of the SWHS, especially for flat-plate collectors as modeled in this study. An assessment of the impact of the tilt angle on the solar fraction of the SWHS is presented in Figure 6 for the various locations. It was observed that the solar fraction increased consistently until it reached the individual optimum tilt angle at the various locations, where the highest solar fraction at each site was obtained. The solar fraction started to reduce consistently after the optimum tilt angle. The results indicate that the optimum tilt angle that should be used at the various locations are the individual latitudes at the various locations; these are the angles that maximize the annual energy delivery of the SWH system. The differences between glycol and water were insignificant.
Since the cost of a collector may vary from one jurisdiction to another, and could also reduce with time, the impact of the cost of the collector on the economics of the SWHS, using water as the working fluid, is presented in Figure 7. The results indicate that the cost of the collector has a significant impact on the viability of the SWHS under Chinese weather conditions. A collector cost beyond 500 USD/m2 would render such a project economically ineffective. The PBP time can be reduced to as low as 15 years if the cost of the collector is reduced to USD 100 per meter squared, with an NPV of about USD 1000 per meter squared. This result is an indication that the Chinese government will have to put in the right financial support in the sector to provide incentives, or reduce the tax components in the cost build-up, in order to reduce the cost of collectors in the country and to make such investments by individuals profitable. This can help the government achieve its target of reducing its GHG emissions through the use of renewable energy technologies.

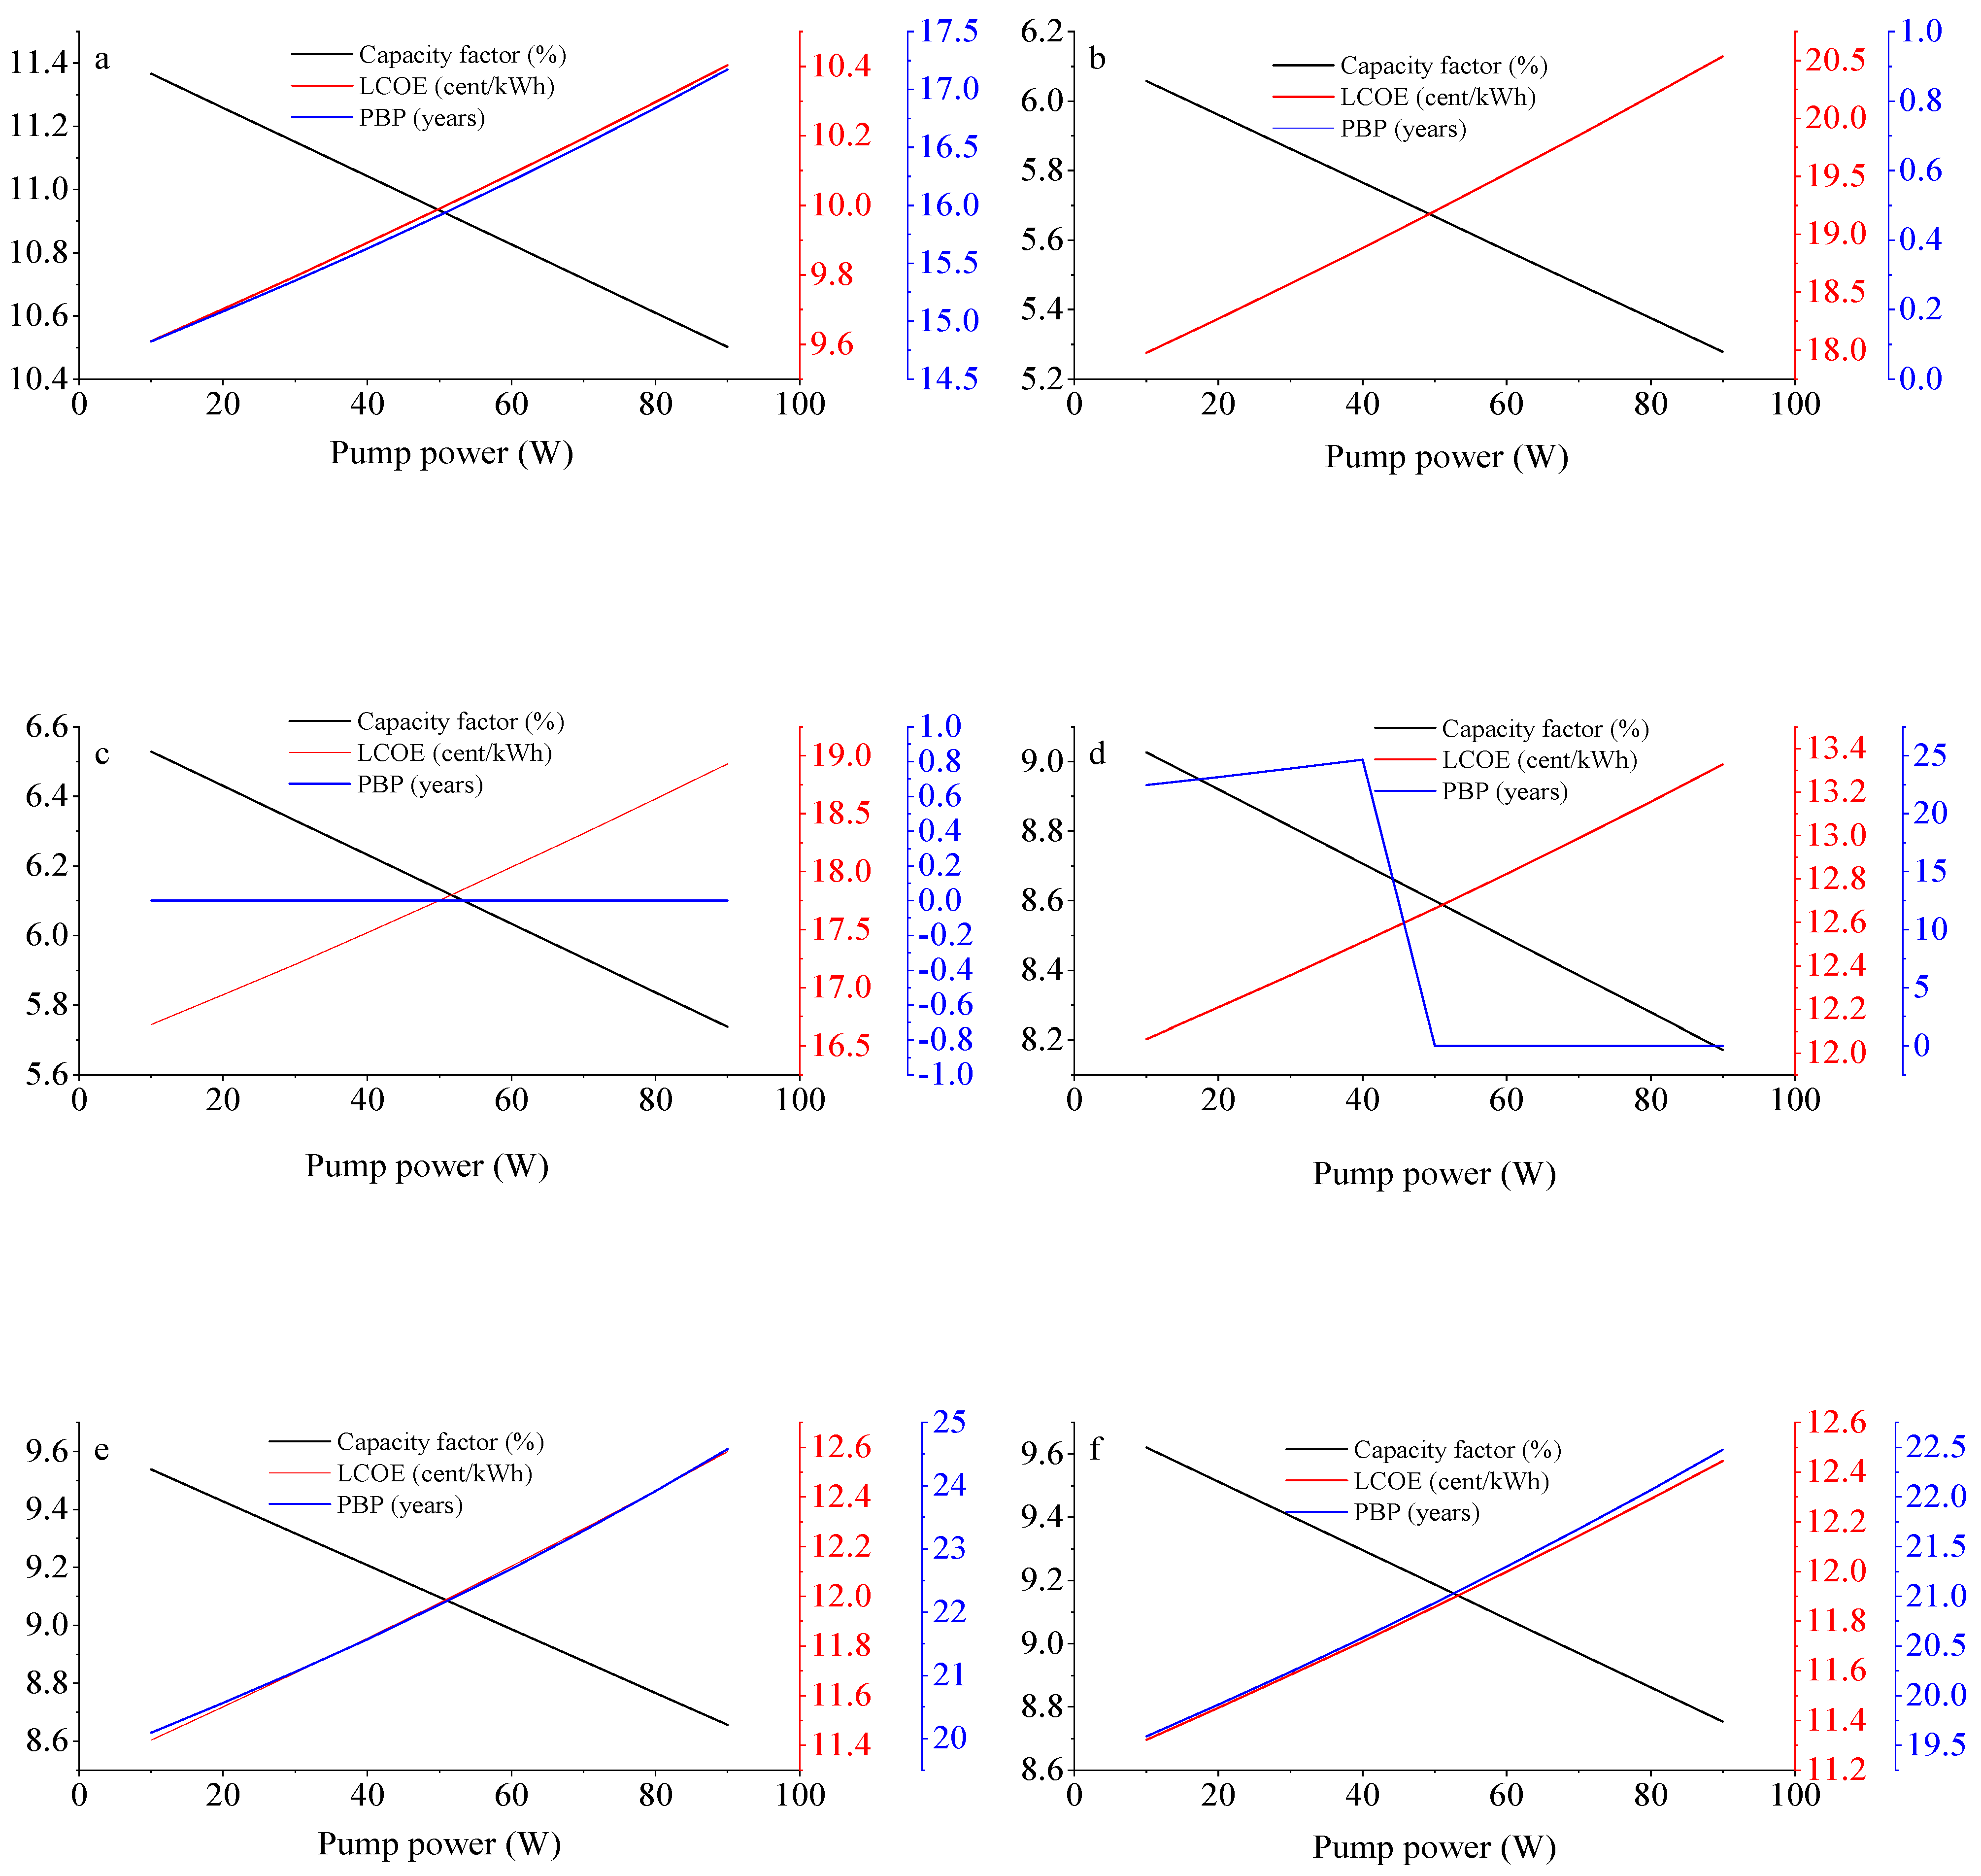
3.3.2. Effect of Pump Power on the Capacity Factor, LCOE and PBP

A pump with power of 45 W was used in the modeling; however, it was found that the power of the pump had a relatively slight effect on the economic performance of the SWHS at the various locations (see Figure 8). It had an increasing effect on the cost of energy and the PBP for some locations. For instance, 10 W of pump power could increase the LCOE (real) by about 1.18%. Similarly, an increase in 10 W of pump power could decrease the capacity factor of the system by 1.17%. Reducing the pump power could positively impact the PBP in some areas which did not have PBP, as shown in the earlier analysis presented in Table 3. Kashi, for instance, would have a PBP if the pump power were between 10 and 40 W; anything above 40 W would result in a PBP which could not be obtained within the 25-year period of the plant life as modeled in this work.
The impact of the azimuth on the technical and economic performance of the SWHS is presented in Figure 9. In the earlier analysis in this study, an azimuth of 180° was used at all six locations. However, the sensitivity analysis indicated that the optimum azimuth for China is 190°, although its impact on the SWHS is minimal relative to that of the 180°. The type of azimuth chosen for such a project would significantly impact the technical, economic, and environmental performance. Using an azimuth of 190° in Lhasa, for instance, would reduce the LCOE (real) to 0.0988 USD/kWh; with an annual energy of 2945.73 kWh, the NPV increased to USD 62.12 compared to the earlier USD 52 for an azimuth of 180°, and the PBP reduced to 15.71 years. Similarly, the LCOE (real) for Nauchang reduced slightly to 0.01899 USD/kWh using an azimuth of 190°, but its NPV remained below the zero mark, indicating non-viability of the project in terms of economics. Wuhan and Kashi also reacted similarly to Nauchang, with a slight reduction in the LCOE and a slight increase in the annual energy production of the system using an azimuth of 190°. However, Yumen and Harbin reacted differently in relation to their PBPs: an azimuth between 150° and 230° could provide a payback period within the project’s lifetime of 25 years, and the smallest PBP occurred at 190°.
It is important to note that the positive or negative behavior of each parameter, i.e., the LCOE, NPV, and PBP, will depend on the energy yield at a specific location. Hence, in order to maximize the heat gain of the SWH system annually, it will be important to position the SWH system at the right azimuth as identified in this study to increase the annual solar-radiation collection. This will lead to a reduction in the LCOE and the PBP, whilst the NPV will increase.

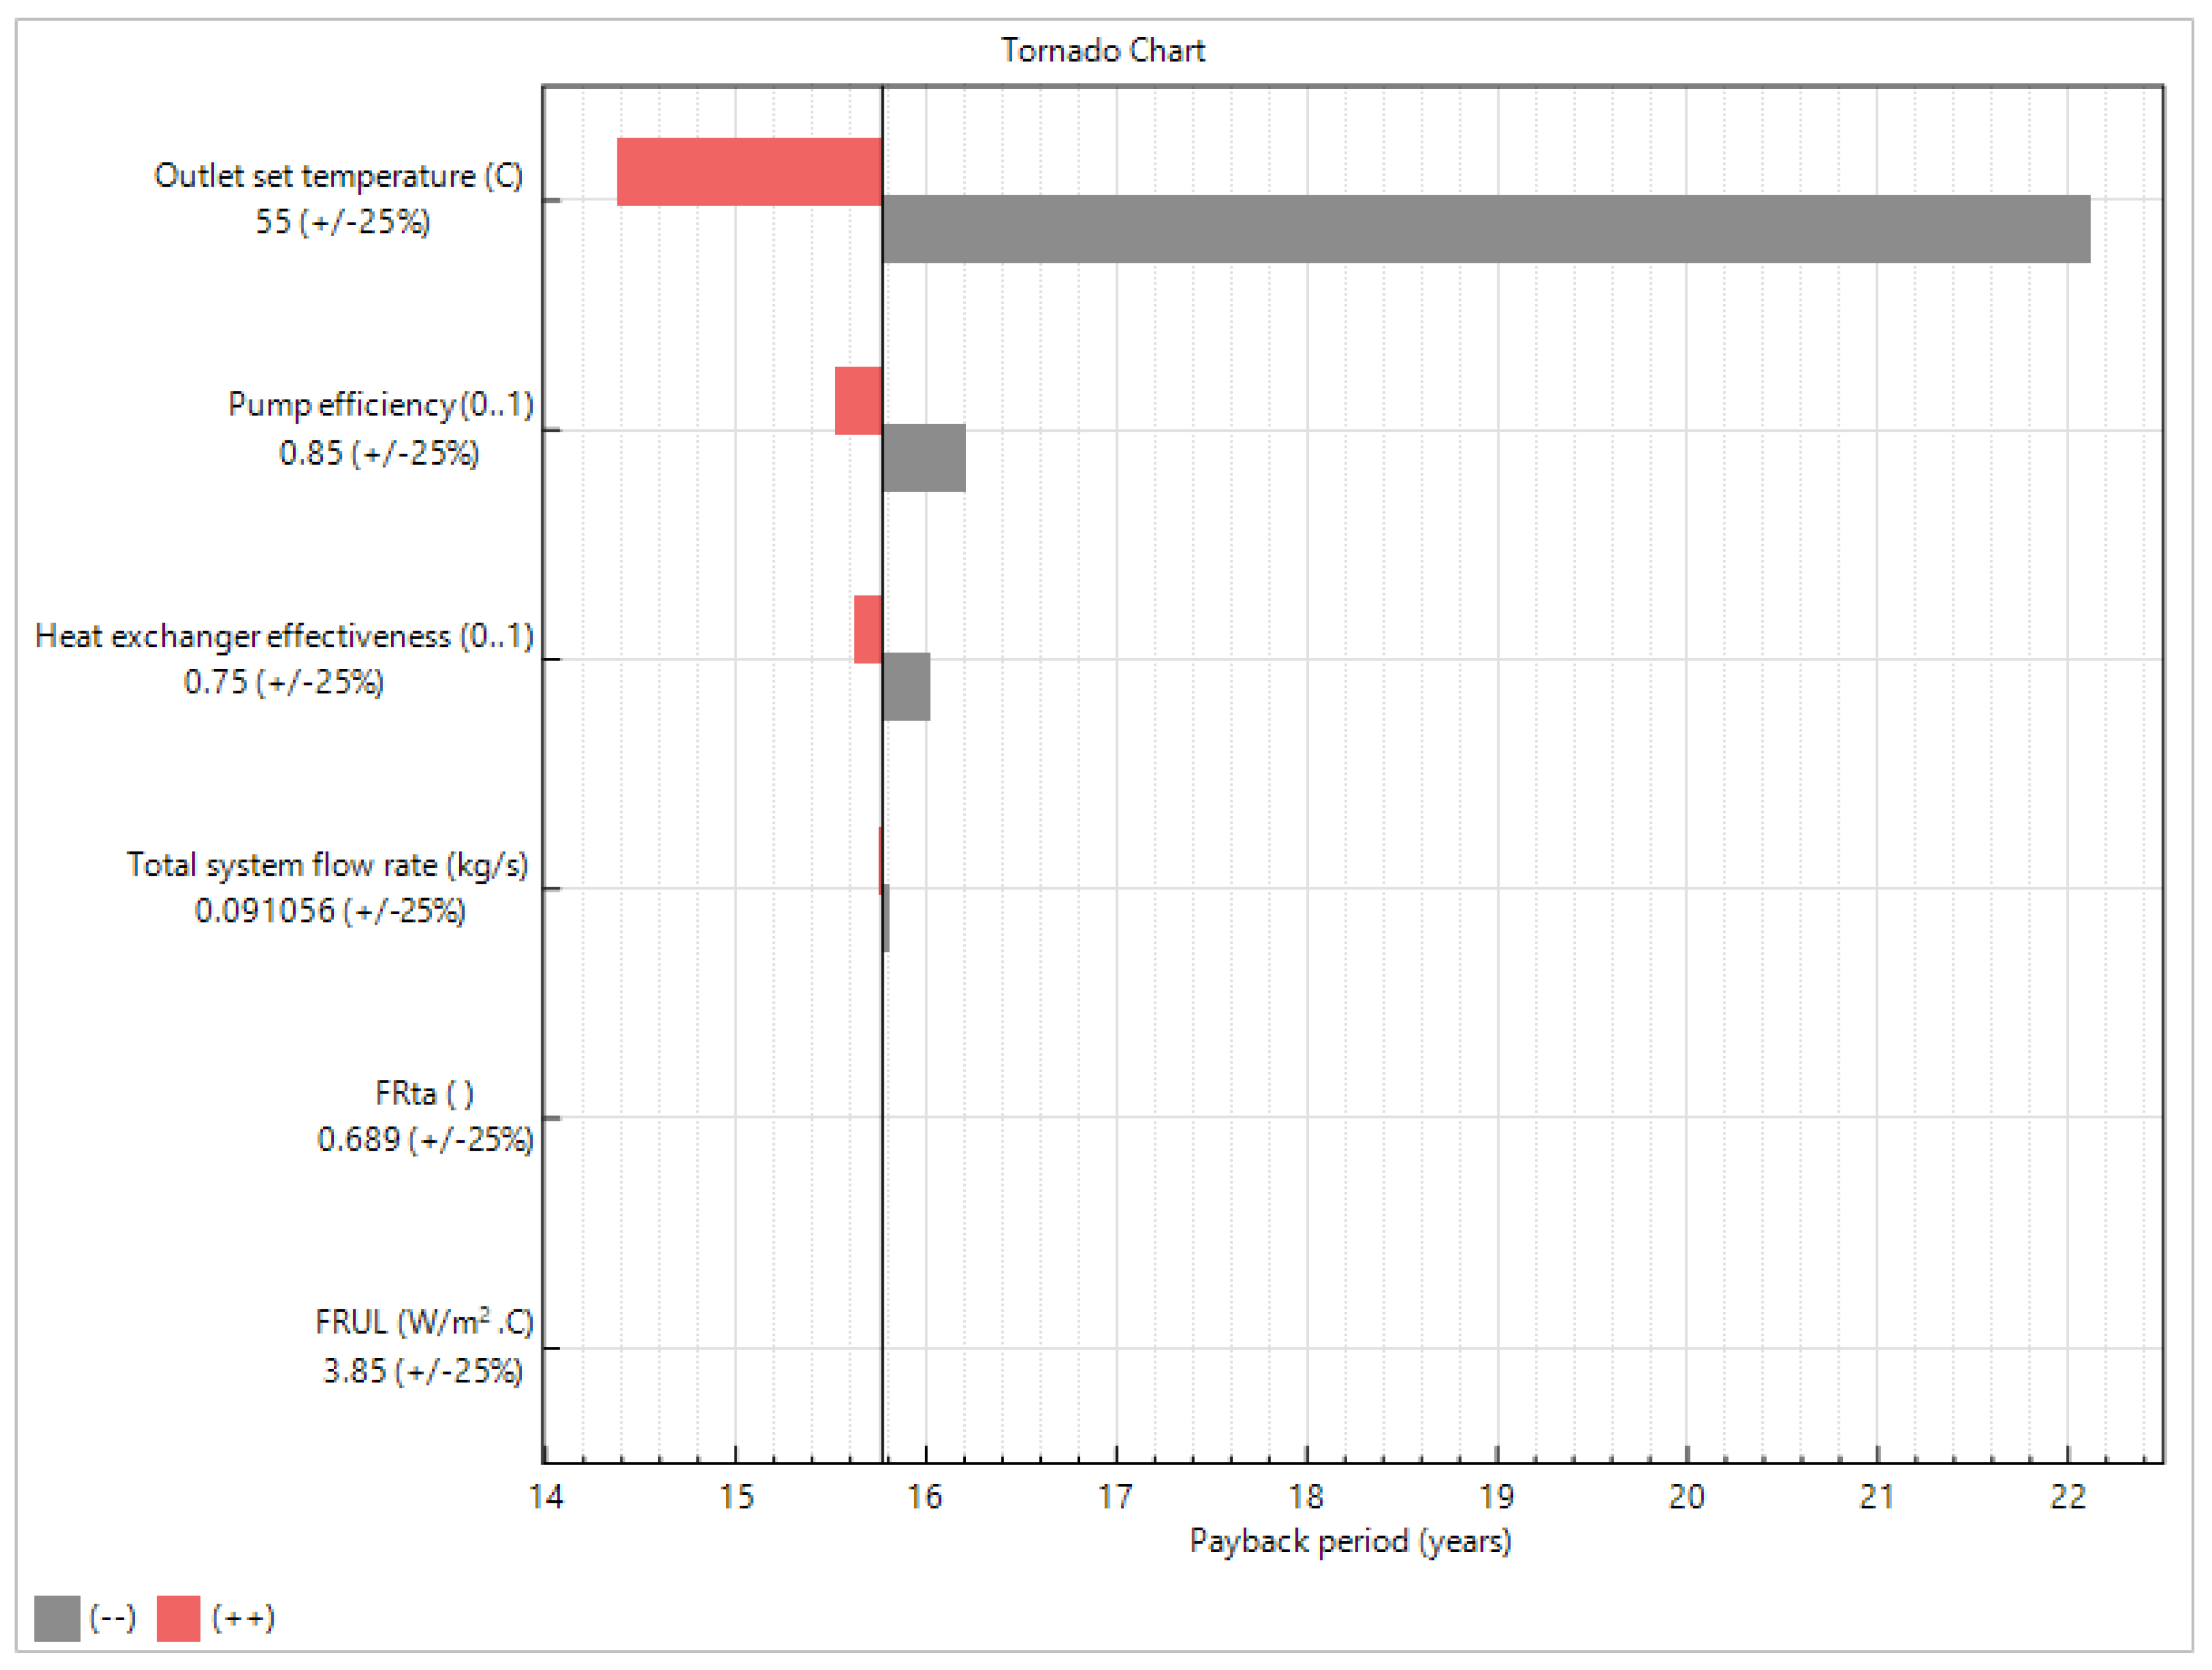
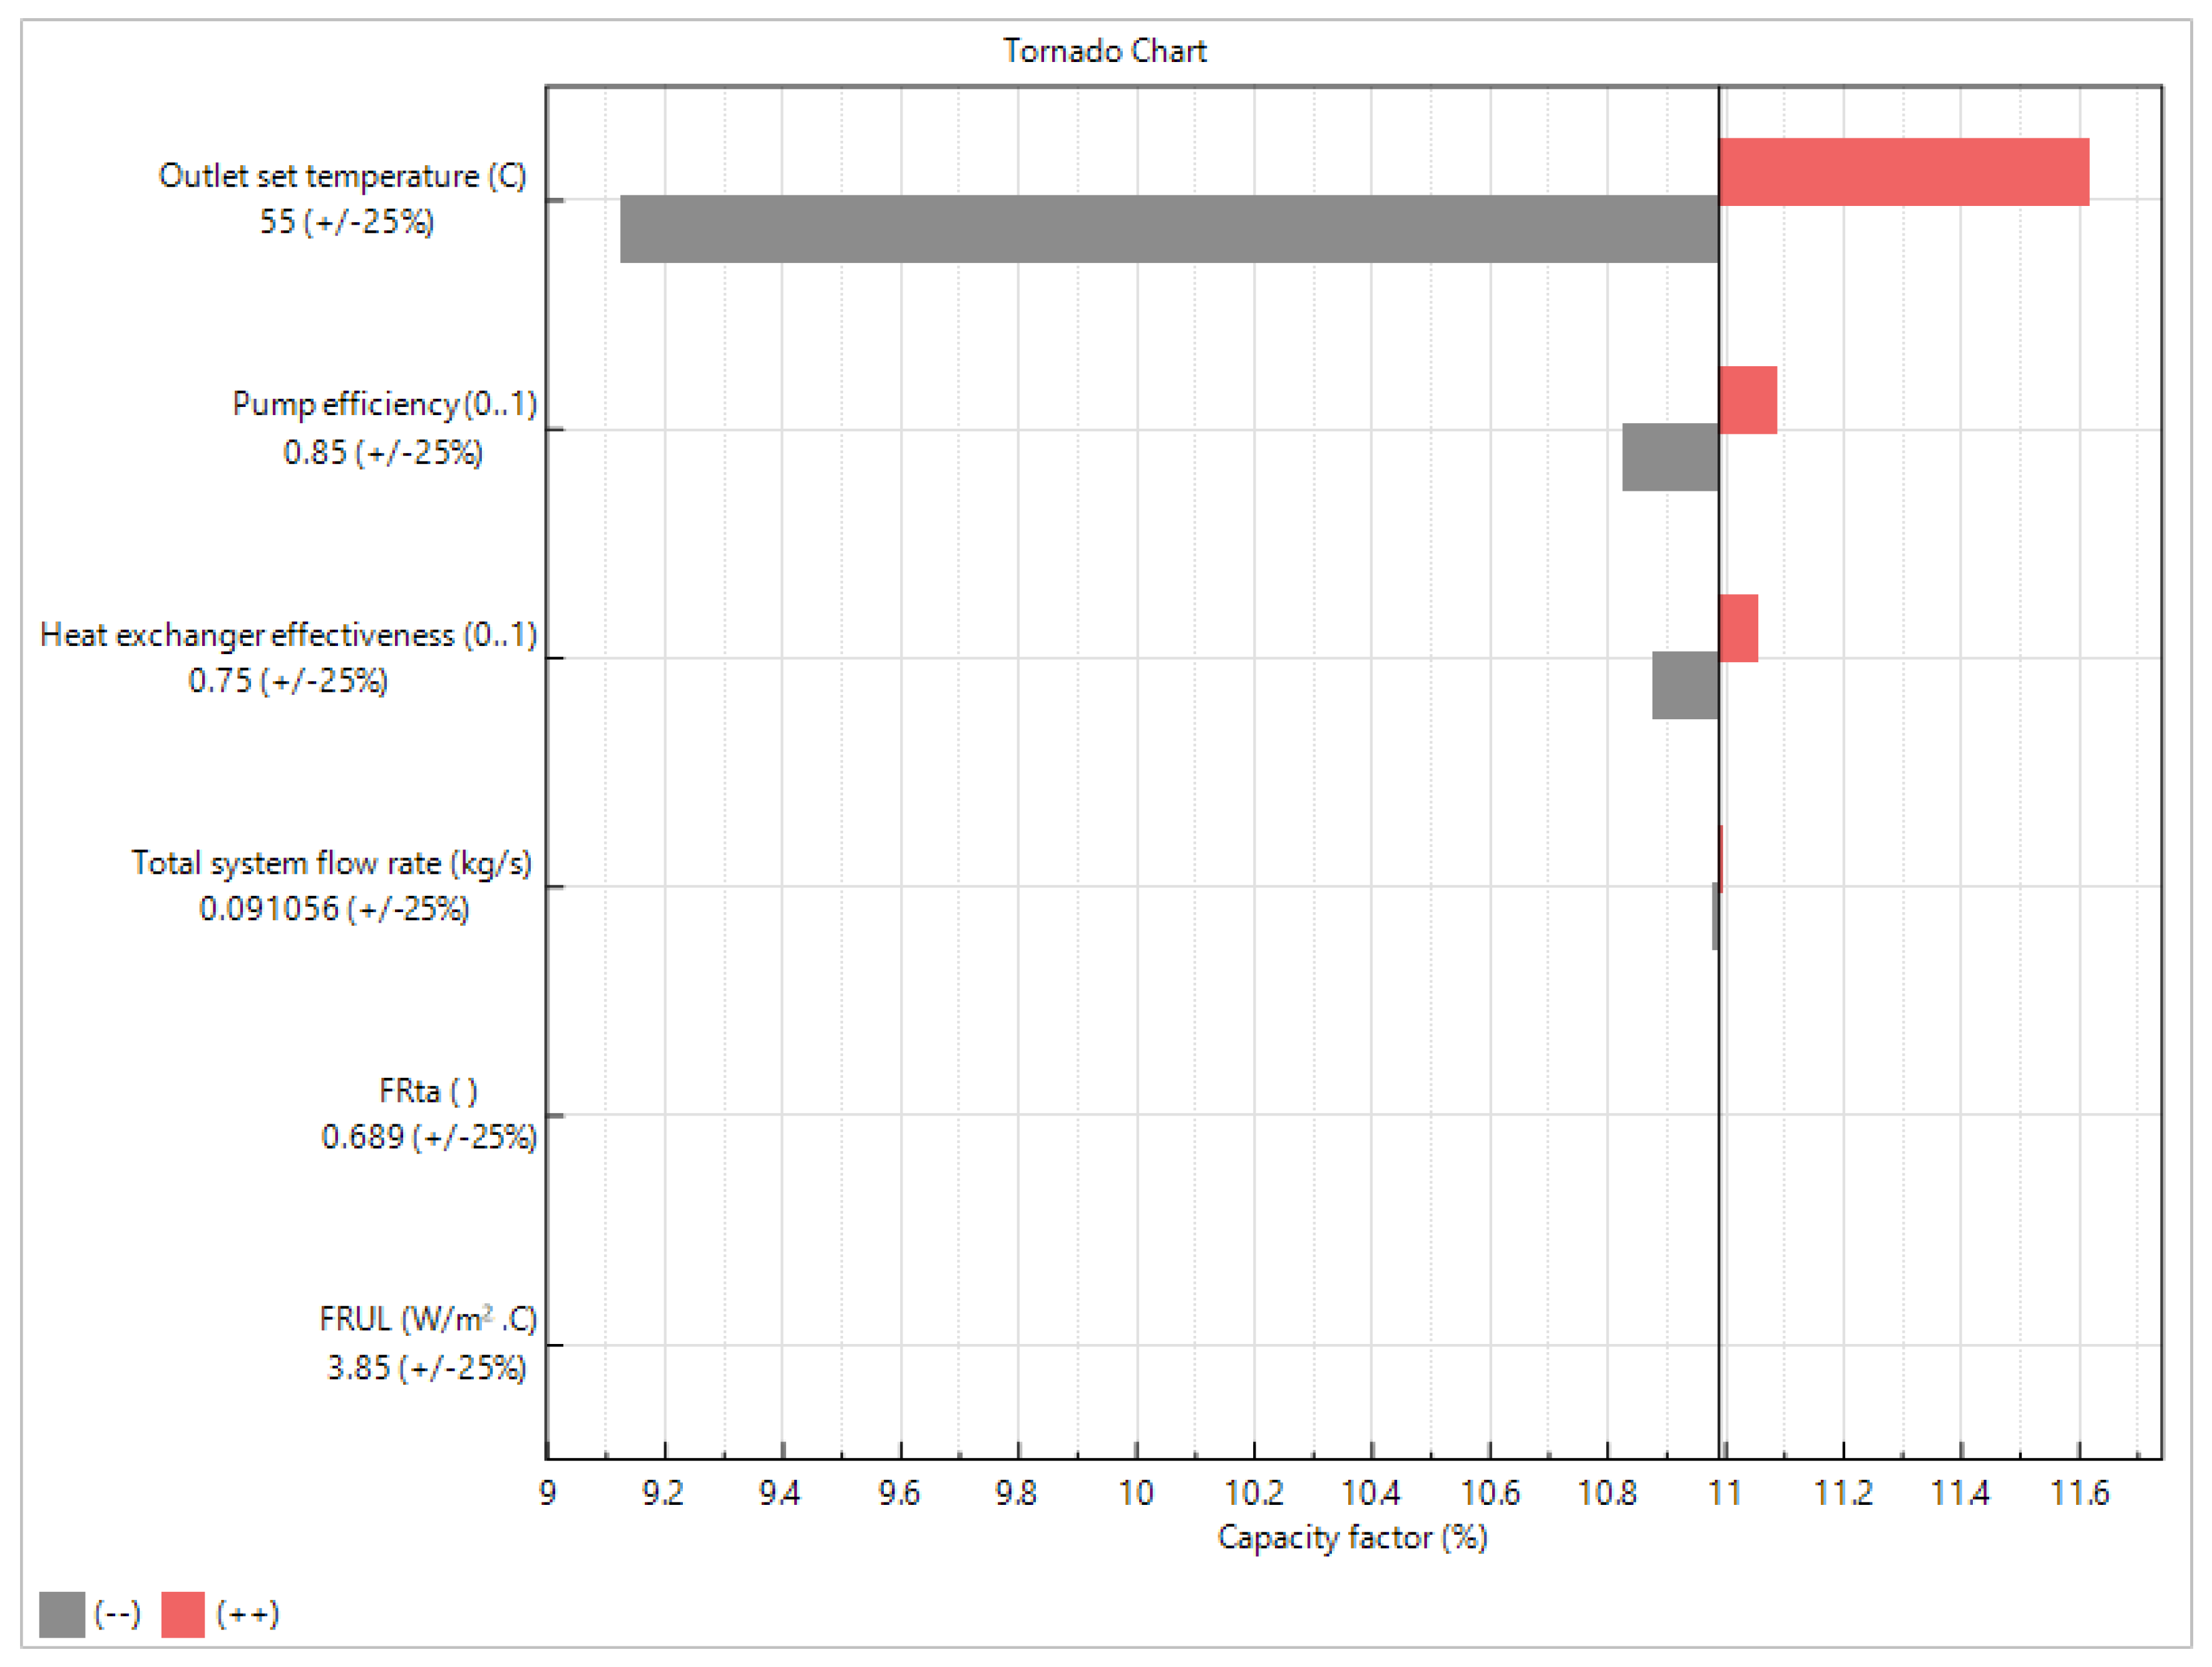
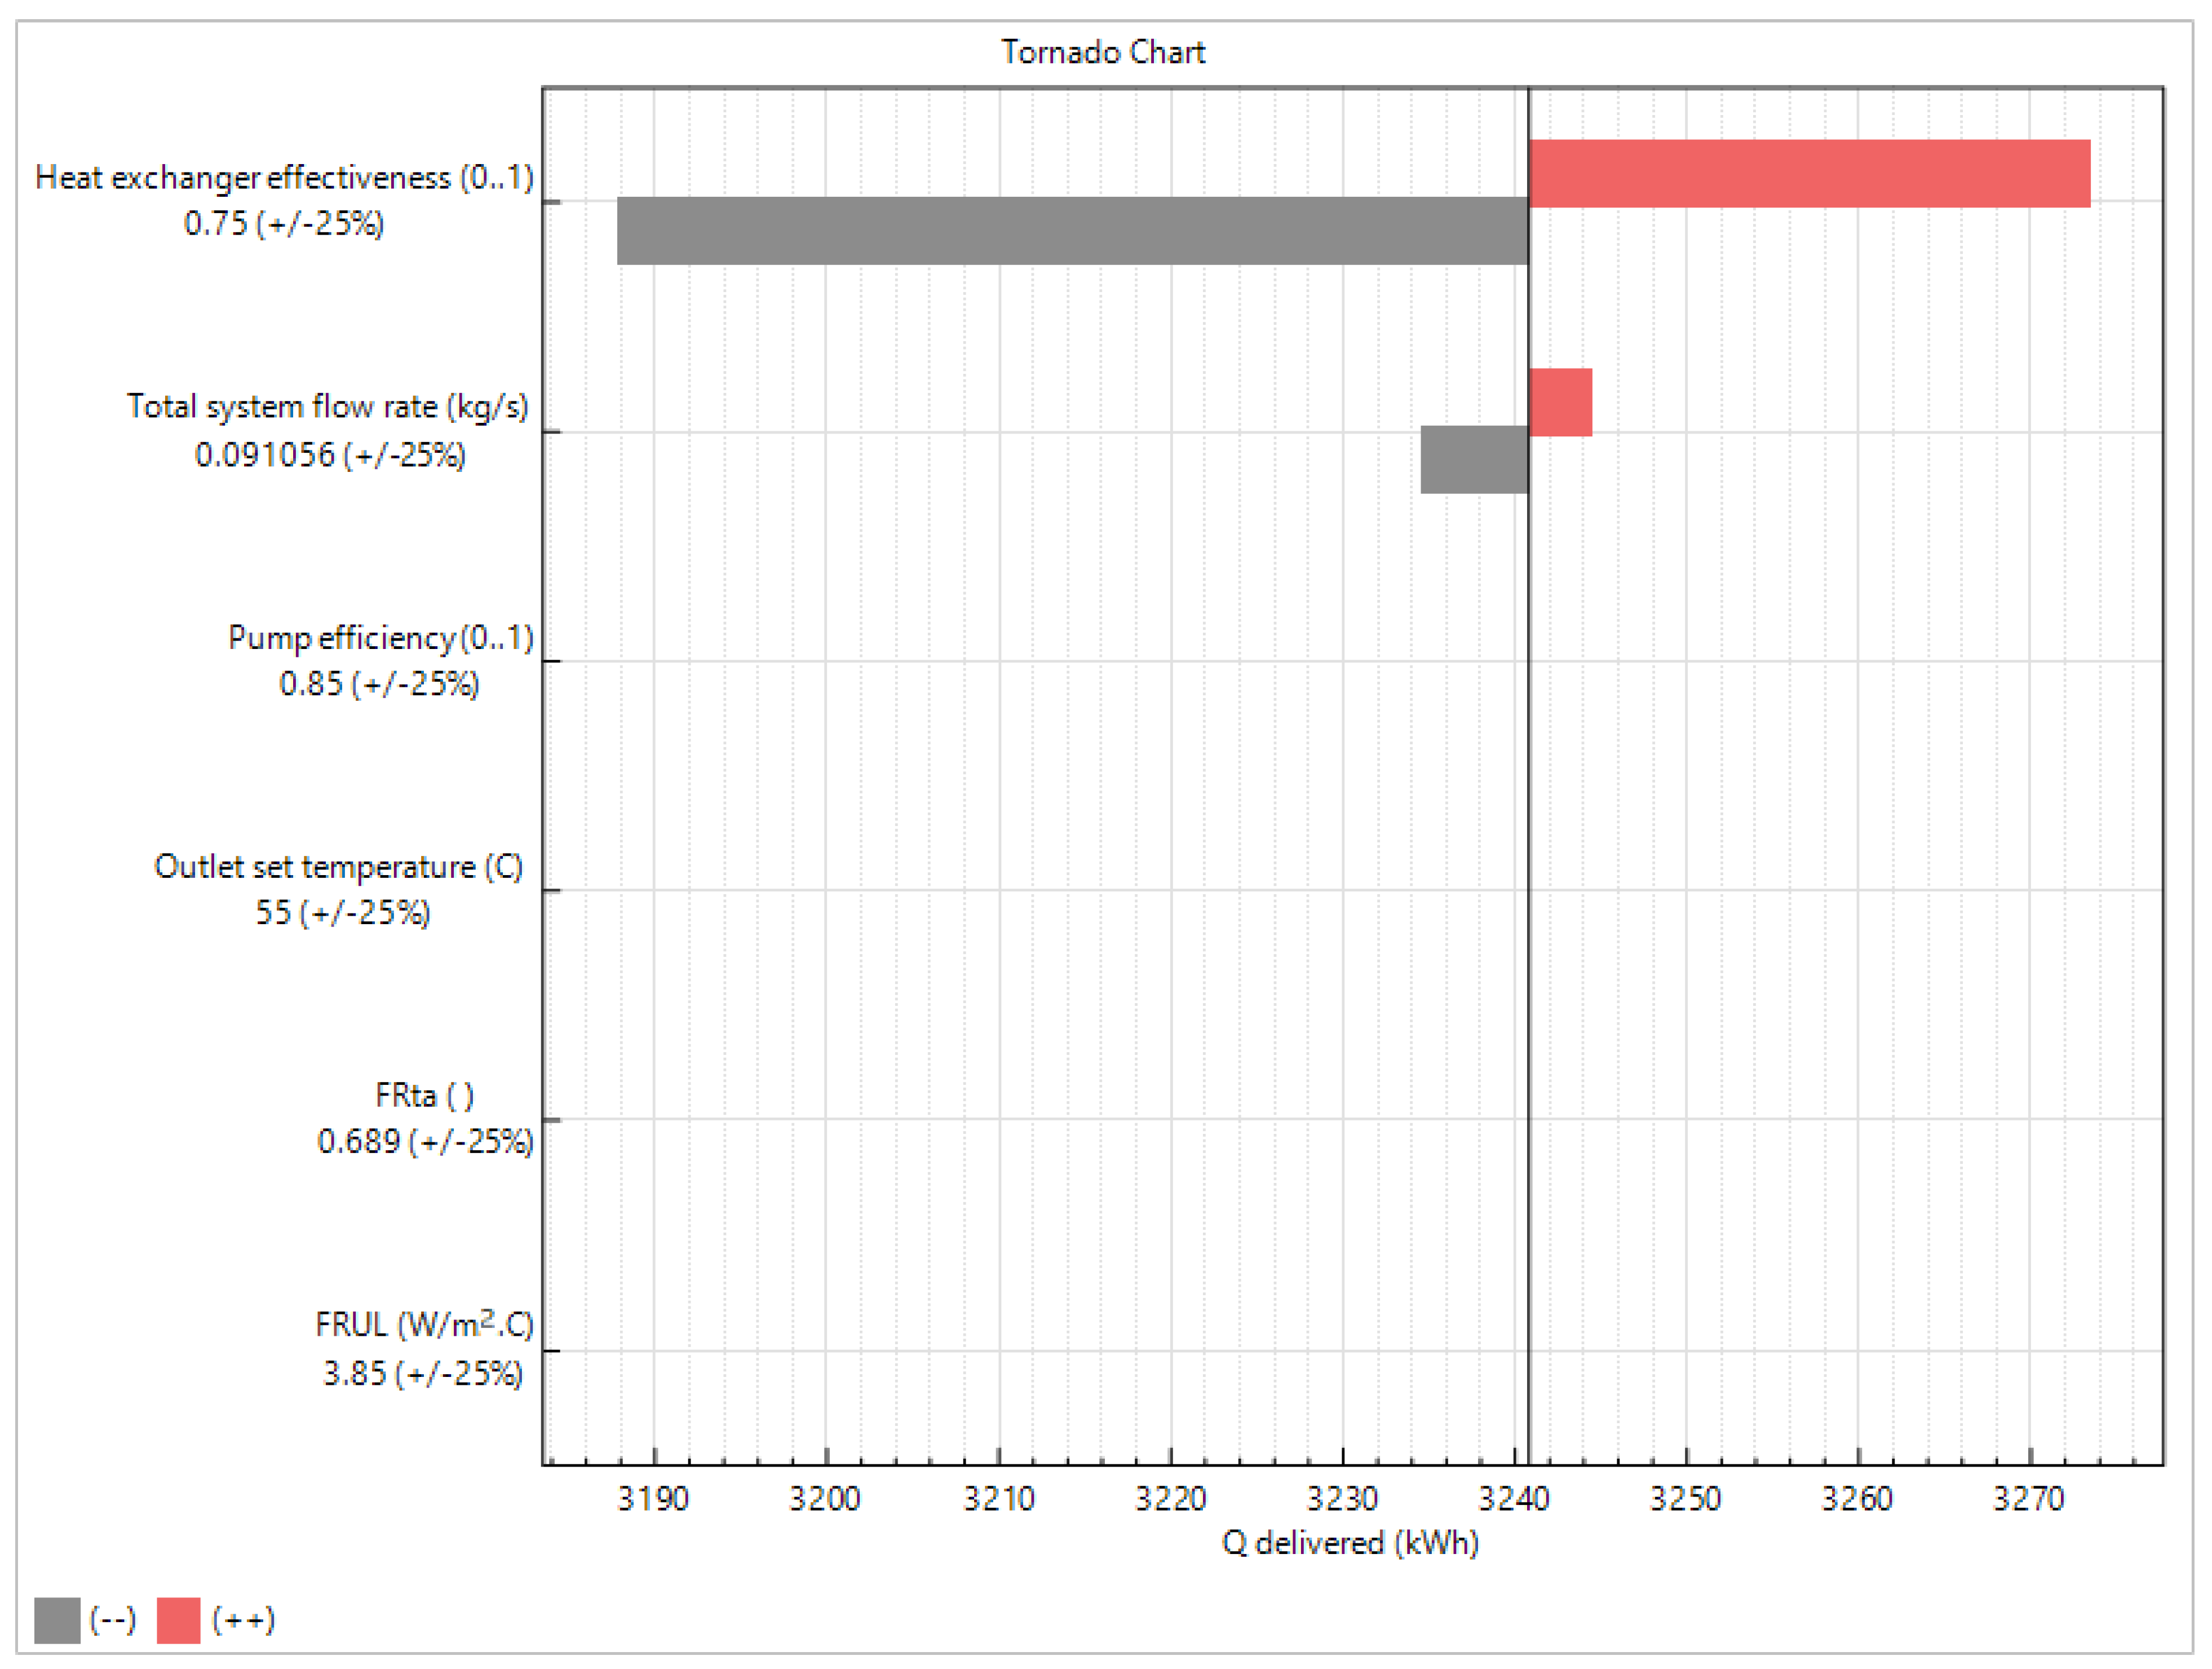
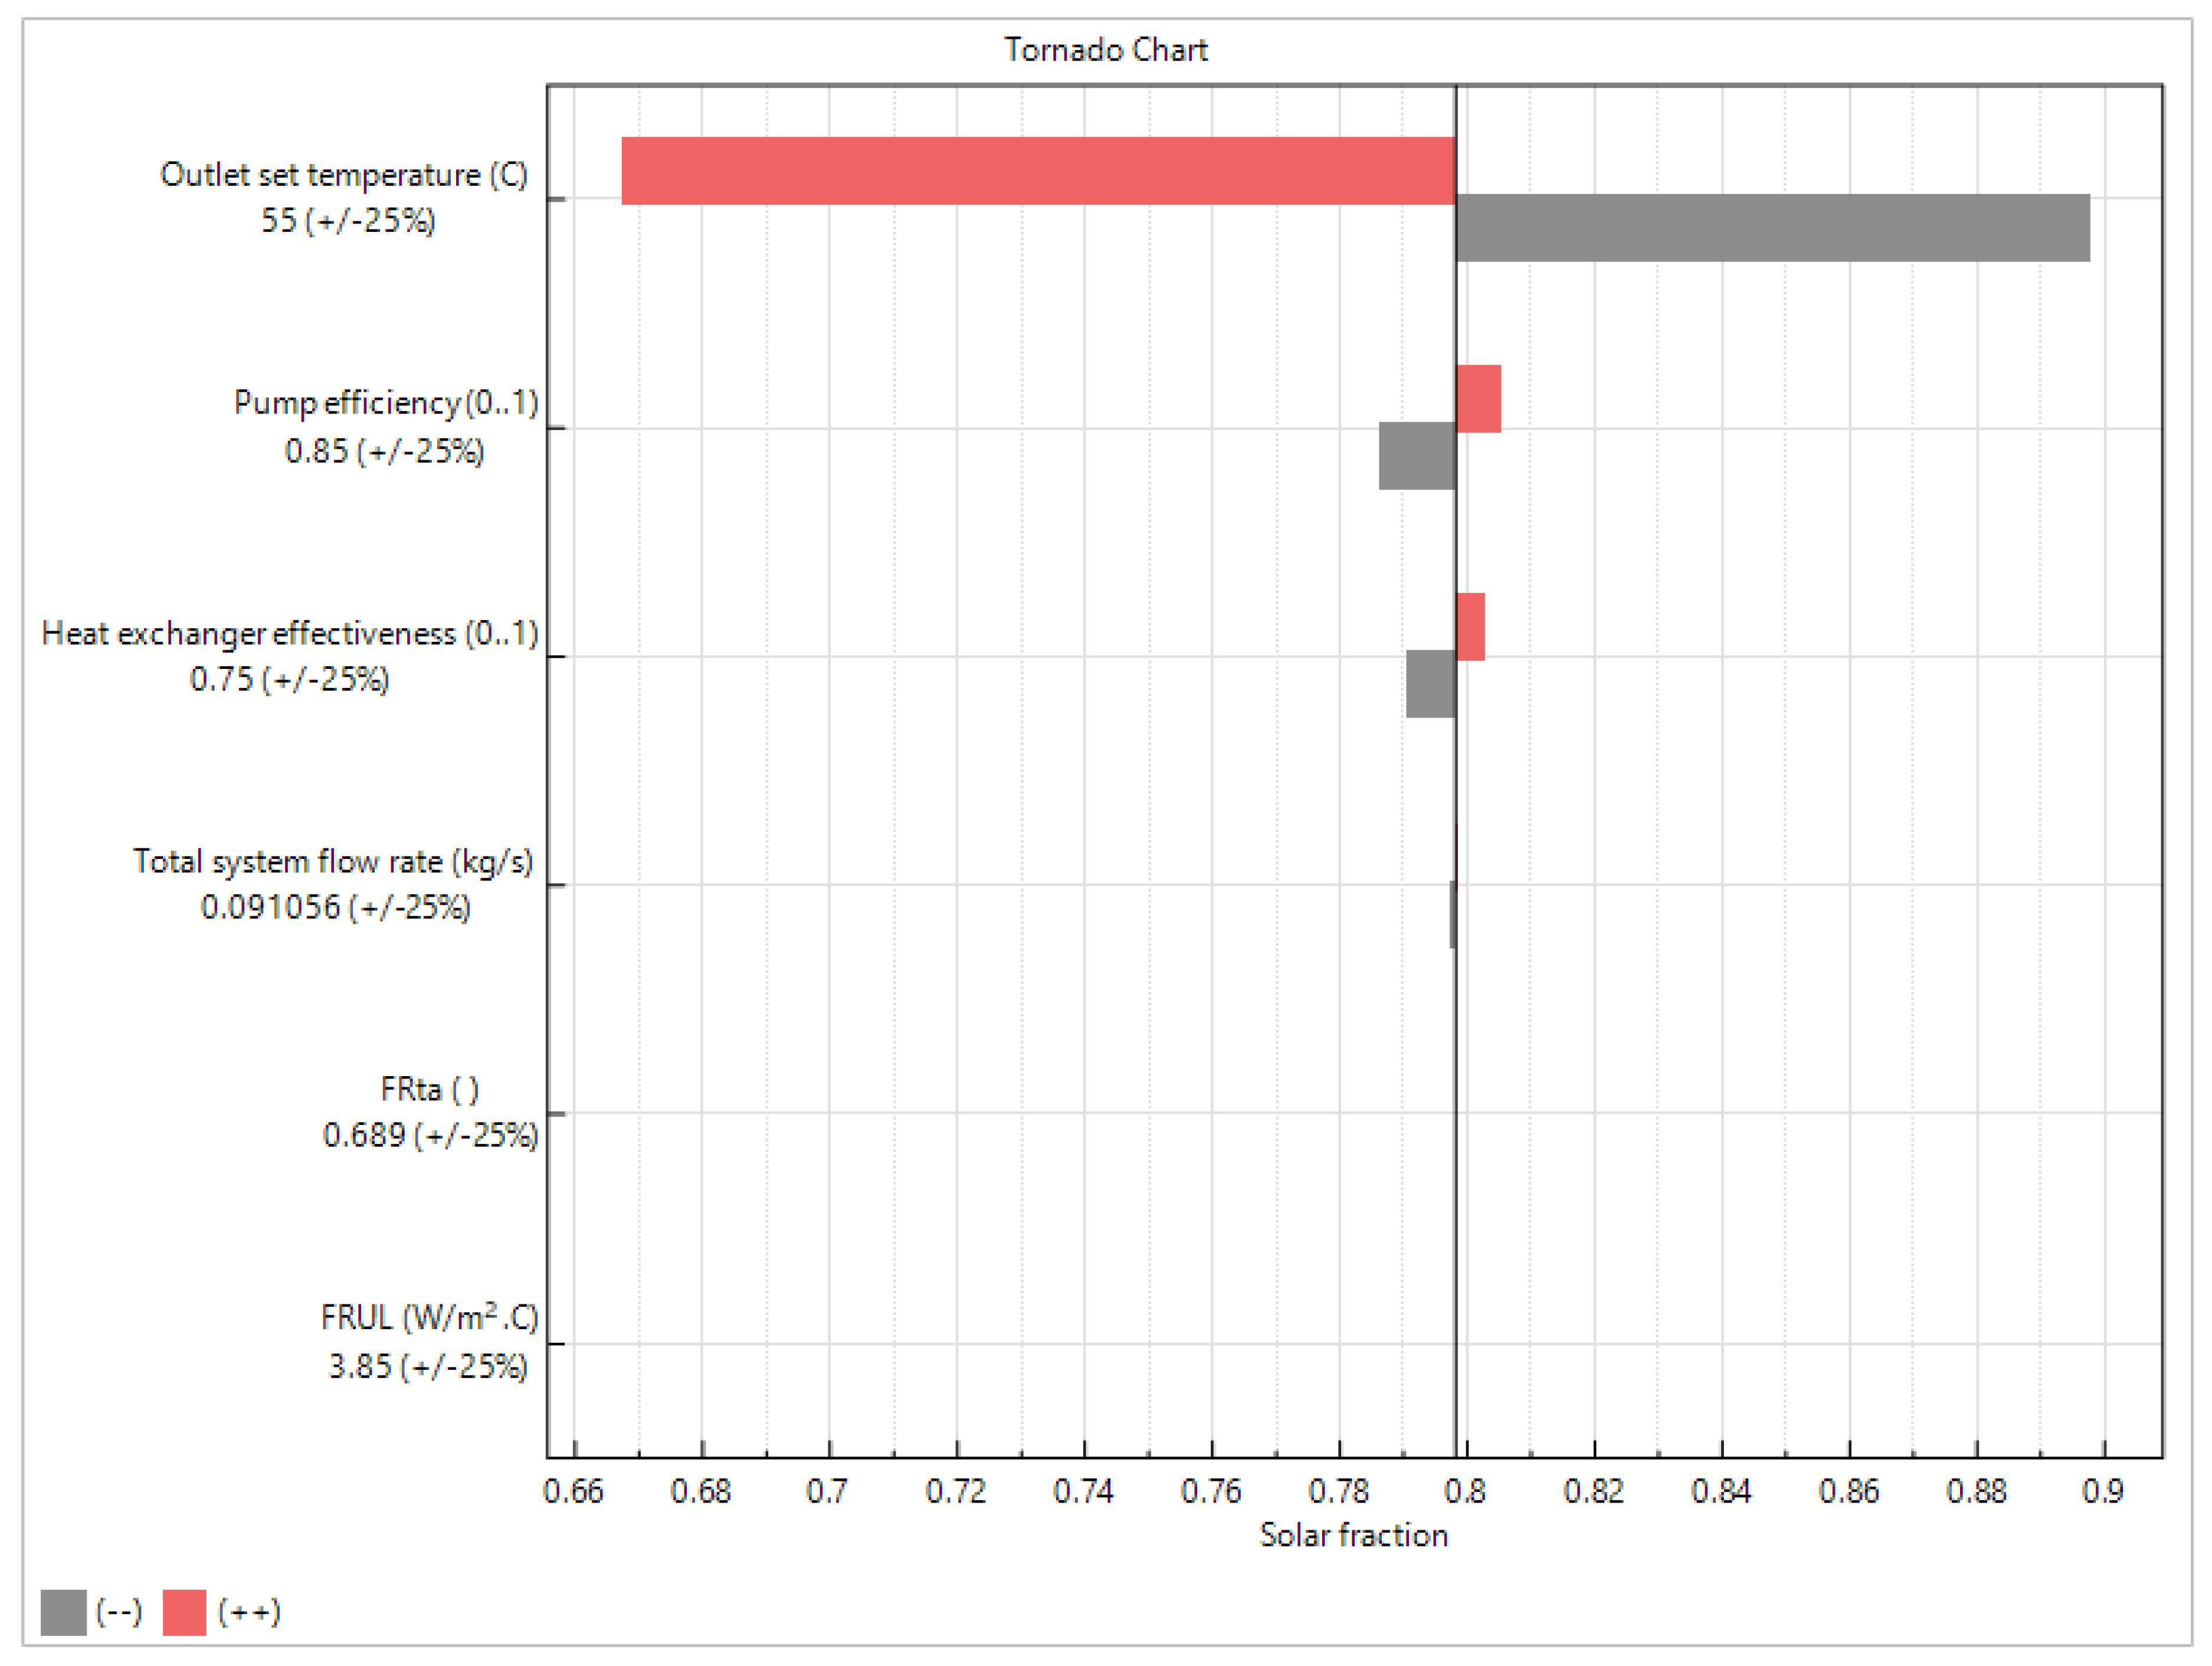
3.3.3. Parametric Study on the SWHS

Several factors affect the performance of an SWHS: the delivered solar energy to the working fluid, for instance, is dependent on factors such as the pump efficiency, outlet temperature, heat-exchange effectiveness, flow rate of the working fluid, thermal loss of the system FRUL, the overall solar heat gain FR (τα), etc. For this section, a parametric study was conducted on the SWHS at Lhasa, using water as the working fluid, to analyze their effect on the solar fraction, payback period, thermal power Q delivered, and capacity factor. This study was conducted in the Lhasa location alone, since there was very little difference among the results of the other communities. The results for the parametric study, considering an increase or decrease of 25% of the factors stated earlier in this section, are presented in Figure 10, Figure 11, Figure 12 and Figure 13. The results indicate that a 25% increase or decrease in the heat-exchanger effectiveness would have the greatest impact on the thermal power Q delivered by the SWHS at the outlet of the solar storage tank: reducing it by 25% could reduce it from 3250 kWh to 3190 kWh, whereas an increase by 25% could increase it to about 3274 kWh. The total system flow rate had the second highest impact on the Q delivered; the other parameters had a slight impact.
The impact of the heat-exchanger effectiveness, total system flow rate, pump efficiency, outlet set temperature, overall solar heat gain, and thermal loss of the system on the PBP is felt a lot in the changes in the outlet set temperature. The PBP can increase from 15.8 years to over 22 years with a 25% change in the outlet set temperature, which is quiet significant. The pump efficiency and heat-exchanger effectiveness followed, in that order, in terms of impact. The other factors had an insignificant impact on the PBP of the SWHS. Similarly, in the case of the solar fraction, the effect of the outlet set temperature was found to be very significant compared to the other parameters. Increasing the outlet set temperature by 25% can increase the solar fraction by some 11%, whilst a reduction can also lead to a decrease of about 16%, as shown in Figure 12.
The impact of changing the heat-exchanger effectiveness, total system flow rate, pump efficiency, outlet set temperature, overall solar heat gain, and thermal loss of the system on the capacity factor, as presented in Figure 13, reveals that a change in the outlet set temperature would cause the most significant change in the capacity factor of the SWHS. A 25% reduction in the outlet set temperature of the water can lead to a reduction in the capacity factor from 11% to about 9.2%. The pump efficiency, heat-exchanger effectiveness, and the total system flow rate followed, in that order, in terms of their impacts on the capacity factor. The rest of the parameters studied had an insignificant impact on the capacity factor.

3.4. Environmental Impact Assessment

The impact of using the SWHS on the environment is assessed in this section. The carbon intensity of generating electricity in China was estimated to be around 549.29 gCO2/kWh in 2021 [50]. Using this figure and the figures obtained from the modeling, it was estimated that using energy solely from the auxiliary system to meet the water heating requirements would lead to an annual CO2 emission of between 1252.87 and 2014.85 kg per year depending on the location of the SWHS. It can, however, be reduced to 138.20–330.23 kg per year, depending on the location of the SWHS, using a combination of the auxiliary system and the solar system. This is a significant reduction in CO2 emissions, which could contribute to the country’s GHG reduction targets.

4. Conclusions and Policy Implications

This study assessed the performance of a SWHS in China by comparing two different working fluids (i.e., water and glycol) in six locations nationwide. There has been, currently, no such study conducted in this manner, i.e., (on the identification of the optimum parameters for a SWHS) in China, and this study aimed to fill that research gap. The study estimated the technical, economic, and environmental performances of the SWHSs at all locations. This is intended to help to promote the use of the SWHS to assist in achieving the country’s GHG emissions targets. According to the results, Lhasa recorded the highest CF of 11% using water as the working fluid, and 10.70% using glycol as the working fluid, and was identified as the best location among the studied locations due to its high solar irradiation. The difference between the two working fluids (i.e., glycol and water) was found to be insignificant. Water was, however, found to be better in terms of performance. The cheapest LCOE and shortest PBP were found in Lhasa. The optimization results indicated that the optimum tilt angles that should be used at the various locations are the individual latitudes at the various locations. Furthermore, 10 W of pump power could increase the LCOE (real) by about 1.18%. The sensitivity analysis indicated that the optimum azimuth for China is 190°. The parametric results also indicate that a 25% increase or decrease in the heat-exchanger effectiveness will have the greatest impact on the thermal power Q delivered by the SWHS at the outlet of the solar storage tank; reducing it by 25% can reduce the thermal power from 3250 kWh to 3190 kWh, whereas an increase of 25% can increase it to about 3274 kWh. A 25% reduction in the outlet set temperature of the water can reduce the capacity factor from 11% to about 9.2%.
In terms of policy, it is clear from the results that both monetary and non-monetary measures have to be put in place by the Chinese government to make such investments by individuals viable. The government could provide financial incentives to individuals and companies that have an interest in incorporating them in their buildings. This could be in the form of subsidies to the cost of the collectors. The government could also direct funds into research and development that seeks to enhance the efficiency of the system to enhance its performance, even under low solar radiation. Individuals who use SWHS in their homes could also benefit from tax reductions or exemptions; this would motivate more people to use a SWHS in their homes. The government may also consider an introduction of mandatory installation policies across the country, especially in areas with high solar renewable energy resources.
The method employed in this study was only applied in China, but could also be used in any country to assess and compare the performances of a SWHS in terms of its technical, economic, and environmental performance. The findings presented in this work are key to the forward development of SWHS under Chinese weather conditions, as individuals and investors can rely on it for investment decisions.
Future research could also look at the impact of other working fluids on the performance of SWH systems in China. This could be a combination of various working fluids or a mixture of working fluids with nanoparticles.

Author Contributions

Conceptualization, E.B.A.; methodology, E.B.A.; software, E.B.A.; validation, E.B.A., T.K. and N.C.G.; formal analysis, E.B.A.; investigation, E.B.A.; resources, E.B.A., T.K. and N.C.G.; data curation, E.B.A., T.K. and N.C.G.; writing—original draft preparation, E.B.A.; writing—review and editing, E.B.A.; visualization, E.B.A.; supervision, E.B.A.; project administration, E.B.A.; funding acquisition, E.B.A. All authors have read and agreed to the published version of the manuscript.

Funding

This research received no external funding.

Institutional Review Board Statement

Not applicable.

Informed Consent Statement

Not applicable.

Data Availability Statement

The sources of the data used are presented in the paper.

Conflicts of Interest

The authors declare no conflict of interest.

Abbreviations and Nomenclature

CFCapacity Factor (%)
GGlobal incident solar radiation in W/m2
GHGGreenhouse Gases
IPCCIntergovernmental Panel on Climate Change
LCOELevelized cost of energy (USD/kWh)
PVGISPhotovoltaic Geographical Information System
NPVNet Present Value (USD)
NRELNational Renewable Energy Laboratory
RERenewable Energy
SAMSystem Advisor Model
SWHSSolar Water Heating System
WSTWater Storage Tank
C I Cash inflow (USD)
A W S T Surface area of WST, (m2)
A c Collector area (m2)
T a Ambient temperature (°C)
T i n Inlet temperature (°C)
K τ α Incidence angle modifier
T d e l i v e r e d Delivered temperature (°C)
U W S T Heat-loss coefficient of WST (W/m2·°C)
T W S T Mean tank temperature, (°C)
d Nominal discount (%)
C 0 Initial investment (USD)
C O Cash outflow (USD)
C n Annual costs (USD)
c v Control volume (m3)
c p Specific heat capacity of the working fluid (J/kg.°C)
E n Produced energy
V W S T Volume of WST
q Real discount
m ˙ Flow Rate (kg/s)
N Period of analysis (years)
hEnthalpy (J)
FRULThermal losses of solar collector in ((W/m2)/°C)
FR (τα)Conversion factor
Q a u x Auxiliary electrical power, W
Q ˙ u s e f u l Useful heat gain delivered, W
Q ˙ l o s s Heat loss from the WST, W
Subscripts
coldCold node
drawUser draw
usefulAdjusted for loss
hotHot node
mainsFrom supply water
ρ Density
i Project year
αShort-wave absorptivity of the collector
τTransmittance of cover

References

  1. Kolsi, L.; Al-Dahidi, S.; Kamel, S.; Aich, W.; Boubaker, S.; Ben Khedher, N. Prediction of Solar Energy Yield Based on Artificial Intelligence Techniques for the Ha’il Region, Saudi Arabia. Sustainability 2022, 15, 774. [Google Scholar] [CrossRef]
  2. Hasan, H.A.; Sherza, J.S.; Abed, A.M.; Togun, H.; Ben Khedher, N.; Sopian, K.; Mahdi, J.M.; Talebizadehsardari, P. Thermal and Flow Performance Analysis of a Concentrated Linear Fresnel Solar Collector with Transverse Ribs. Front. Chem. 2023, 10, 1074581. [Google Scholar] [CrossRef] [PubMed]
  3. Moritz, M.; Schönfisch, M.; Schulte, S. Estimating Global Production and Supply Costs for Green Hydrogen and Hydrogen-Based Green Energy Commodities. Int. J. Hydrog. Energy 2023, 48, 9139–9154. [Google Scholar] [CrossRef]
  4. Bedair, A.O.M.; Shehata, A.S.; Hamad, M.S.; Tawfik, A. Energy Performance Enhancement of PV System through Proposed Back Cooling Techniques and Natural Air Draft: An Experimental Study. Int. J. Green Energy 2023, in press. [Google Scholar] [CrossRef]
  5. Giri, N.C.; Mohanty, R.C. Agrivoltaic System: Experimental Analysis for Enhancing Land Productivity and Revenue of Farmers. Energy Sustain. Dev. 2022, 70, 54–61. [Google Scholar] [CrossRef]
  6. Huang, P. The Verticality of Policy Mixes for Sustainability Transitions: A Case Study of Solar Water Heating in China. Res. Policy 2019, 48, 103758. [Google Scholar] [CrossRef]
  7. Masson-Delmotte, V.; Zhai, P.; Pirani, A.; Connors, S.L.; Péan, C.; Berger, S.; Caud, N.; Chen, Y.; Goldfarb, L.; Gomis, M.I.; et al. (Eds.) Climate Change 2021: The Physical Science Basis. Contribution of Working Group I to the Sixth Assessment Report of the Intergovernmental Panel on Climate Change; Cambridge University Press: Cambridge, UK; New York, NY, USA, 2021. [Google Scholar]
  8. Endale, A. Analysis of Status, Potential and Economic Significance of Solar Water Heating System in Ethiopia. Renew. Energy 2019, 132, 1167–1176. [Google Scholar] [CrossRef]
  9. Koçak, B.; Fernandez, A.I.; Paksoy, H. Review on Sensible Thermal Energy Storage for Industrial Solar Applications and Sustainability Aspects. Sol. Energy 2020, 209, 135–169. [Google Scholar] [CrossRef]
  10. Jahangiri Mamouri, S.; Bénard, A. New Design Approach and Implementation of Solar Water Heaters: A Case Study in Michigan. Sol. Energy 2018, 162, 165–177. [Google Scholar] [CrossRef]
  11. Jahangiri, M.; Akinlabi, E.T.; Sichilalu, S.M. Assessment and Modeling of Household-Scale Solar Water Heater Application in Zambia: Technical, Environmental, and Energy Analysis. Int. J. Photoenergy 2021, 2021, 663033. [Google Scholar] [CrossRef]
  12. Jahangiri Mamouri, S.; Gholami Derami, H.; Ghiasi, M.; Shafii, M.B.; Shiee, Z. Experimental Investigation of the Effect of Using Thermosyphon Heat Pipes and Vacuum Glass on the Performance of Solar Still. Energy 2014, 75, 501–507. [Google Scholar] [CrossRef]
  13. Jafari Mosleh, H.; Jahangiri Mamouri, S.; Shafii, M.B.; Hakim Sima, A. A New Desalination System Using a Combination of Heat Pipe, Evacuated Tube and Parabolic Trough Collector. Energy Convers. Manag. 2015, 99, 141–150. [Google Scholar] [CrossRef]
  14. Şerban, A.; Bărbuţă-Mişu, N.; Ciucescu, N.; Paraschiv, S.; Paraschiv, S. Economic and Environmental Analysis of Investing in Solar Water Heating Systems. Sustainability 2016, 8, 1286. [Google Scholar]
  15. Siampour, L.; Vahdatpour, S.; Jahangiri, M.; Mostafaeipour, A.; Goli, A.; Shamsabadi, A.A.; Atabani, A. Techno-Enviro Assessment and Ranking of Turkey for Use of Home-Scale Solar Water Heaters. Sustain. Energy Technol. Assess. 2021, 43, 100948. [Google Scholar] [CrossRef]
  16. Benli, H. Potential Application of Solar Water Heaters for Hot Water Production in Turkey. Renew. Sustain. Energy Rev. 2016, 54, 99–109. [Google Scholar] [CrossRef]
  17. Fayaz, H.; Rahim, N.A.; Saidur, R.; Hasanuzzaman, M. Techno-Economıc Analysıs of Evacuated Tube Solar Water Heater Usıng F-Chart Method. IOP Conf. Ser. Mater. Sci. Eng. 2018, 358, 012016. [Google Scholar] [CrossRef]
  18. Raza, S.A.; Ahmad, S.S.; Ratlamwala, T.A.H.; Hussain, G.; Alkahtani, M. Techno-Economic Analysis of Glazed, Unglazed and Evacuated Tube Solar Water Heaters. Energies 2020, 13, 6261. [Google Scholar] [CrossRef]
  19. Muthuraman, U.; Shankar, R.; Nassa, V.K.; Karthick, A.; Malla, C.; Kumar, A.; Kumar, P.M.; Rahim, R.; Bharani, M. Energy and Economic Analysis of Curved, Straight, and Spiral Flow Flat-Plate Solar Water Collector. Int. J. Photoenergy 2021, 2021, 5547274. [Google Scholar] [CrossRef]
  20. García, J.L.; Porras-Prieto, C.J.; Benavente, R.M.; Gómez-Villarino, M.T.; Mazarrón, F.R. Profitability of a Solar Water Heating System with Evacuated Tube Collector in the Meat Industry. Renew. Energy 2019, 131, 966–976. [Google Scholar] [CrossRef]
  21. Yılmaz, İ.H. Residential Use of Solar Water Heating in Turkey: A Novel Thermo-Economic Optimization for Energy Savings, Cost Benefit and Ecology. J. Clean. Prod. 2018, 204, 511–524. [Google Scholar] [CrossRef]
  22. Khedher, N.B. Experimental Evaluation of a Flat Plate Solar Collector Under Hail City Climate. Eng. Technol. Appl. Sci. Res. 2018, 8, 2750–2754. [Google Scholar] [CrossRef]
  23. Pambudi, N.A.; Nanda, I.R.; Saputro, A.D. The Energy Efficiency of a Modified V-Corrugated Zinc Collector on the Performance of Solar Water Heater (SWH). Results Eng. 2023, 18, 101174. [Google Scholar] [CrossRef]
  24. Odoi-Yorke, F.; Akpahou, R.; Opoku, R.; Mensah, L.D. Technical, Financial, and Emissions Analyses of Solar Water Heating Systems for Supplying Sustainable Energy for Hotels in Ghana. Sol. Compass 2023, 7, 100051. [Google Scholar]
  25. Ibrahim, M.M.; El Berry, A.; Ashour, K. Experimental and theoretical study of smart energy management solar water heating system for outdoor swimming pool application in egypt. Front. Heat Mass Transf. 2022, 18, 9. [Google Scholar] [CrossRef]
  26. Singh, S.; Anand, A.; Shukla, A.; Sharma, A. Environmental, Technical and Financial Feasibility Study of Domestic Solar Water Heating System in India. Sustain. Energy Technol. Assess. 2021, 43, 100965. [Google Scholar] [CrossRef]
  27. Naveed Arif, M.; Waqas, A.; Ahmed Butt, F.; Mahmood, M.; Hussain Khoja, A.; Ali, M.; Ullah, K.; Mujtaba, M.A.; Kalam, M.A. Techno-Economic Assessment of Solar Water Heating Systems for Sustainable Tourism in Northern Pakistan. Alex. Eng. J. 2022, 61, 5485–5499. [Google Scholar] [CrossRef]
  28. Azad Gilani, H.; Hoseinzadeh, S. Techno-Economic Study of Compound Parabolic Collector in Solar Water Heating System in the Northern Hemisphere. Appl. Therm. Eng. 2021, 190, 116756. [Google Scholar] [CrossRef]
  29. Alsayed, M.F. Solar Water Heater Sizing and Economic Evaluation for Local Hospital. In Proceedings of the 2021 12th International Renewable Engineering Conference (IREC), Amman, Jordan, 14 April 2021; IEEE: New York, NY, USA, 2021; pp. 1–6. [Google Scholar]
  30. Urban, F.; Geall, S.; Wang, Y. Solar PV and Solar Water Heaters in China: Different Pathways to Low Carbon Energy. Renew. Sustain. Energy Rev. 2016, 64, 531–542. [Google Scholar] [CrossRef]
  31. World Bank Services, etc., Value Added (% of GDP). 2015. Available online: https://data.worldbank.org/indicator/NV.SRV.TOTL.ZS?locations=CN (accessed on 4 May 2023).
  32. IEA IEA SHC||Solar Heat Worldwide. Available online: https://www.iea-shc.org/solar-heat-worldwide (accessed on 26 April 2023).
  33. Huang, J.; Fan, J.; Furbo, S. Feasibility Study on Solar District Heating in China. Renew. Sustain. Energy Rev. 2019, 108, 53–64. [Google Scholar] [CrossRef]
  34. Aly, A.; Bernardos, A.; Fernandez-Peruchena, C.M.; Jensen, S.S.; Pedersen, A.B. Is Concentrated Solar Power (CSP) a Feasible Option for Sub-Saharan Africa?: Investigating the Techno-Economic Feasibility of CSP in Tanzania. Renew. Energy 2019, 135, 1224–1240. [Google Scholar] [CrossRef]
  35. Ezeanya, E.K.; Massiha, G.H.; Simon, W.E.; Raush, J.R.; Chambers, T.L. System Advisor Model (SAM) Simulation Modelling of a Concentrating Solar Thermal Power Plant with Comparison to Actual Performance Data. Cogent Eng. 2018, 5, 1524051. [Google Scholar] [CrossRef]
  36. Hamilton, W.T.; Neises, T.W. Dispatch Optimization of Electric Thermal Energy Storage within System Advisor Model. J. Energy Storage 2023, 61, 106786. [Google Scholar] [CrossRef]
  37. Hamilton, W.T.; Newman, A.M.; Wagner, M.J.; Braun, R.J. Off-Design Performance of Molten Salt-Driven Rankine Cycles and Its Impact on the Optimal Dispatch of Concentrating Solar Power Systems. Energy Convers. Manag. 2020, 220, 113025. [Google Scholar] [CrossRef]
  38. Gafurov, T.; Usaola, J.; Prodanovic, M. Modelling of Concentrating Solar Power Plant for Power System Reliability Studies. IET Renew. Power Gener. 2015, 9, 120–130. [Google Scholar] [CrossRef]
  39. Abdelhady, S.; Borello, D.; Shaban, A. Techno-Economic Assessment of Biomass Power Plant Fed with Rice Straw: Sensitivity and Parametric Analysis of the Performance and the LCOE. Renew. Energy 2018, 115, 1026–1034. [Google Scholar] [CrossRef]
  40. SAM Solar Water Heating—System Advisor Model—SAM. Available online: https://sam.nrel.gov/solar-water-heating.html (accessed on 24 April 2023).
  41. Yılmaz, İ.H. Optimization of an Integral Flat Plate Collector-Storage System for Domestic Solar Water Heating in Adana. Anadolu Univ. J. Sci. Technol. Appl. Sci. Eng. 2018, 19, 165–176. [Google Scholar] [CrossRef]
  42. Duffie, J.A.; Beckman, W.A. Solar Engineering of Thermal Processes; John Wiley & Sons: Hoboken, NJ, USA, 2013. [Google Scholar]
  43. CEIC Water Consumption: City: Daily per Capita: Residential: Beijing|Economic Indicators|CEIC. Available online: https://www.ceicdata.com/en/china/water-consumption-daily-per-capita-residential/cn-water-consumption-city-daily-per-capita-residential-beijing (accessed on 7 May 2023).
  44. Agyekum, E.B. Techno-Economic Comparative Analysis of Solar Photovoltaic Power Systems with and without Storage Systems in Three Different Climatic Regions, Ghana. Sustain. Energy Technol. Assess. 2021, 43, 100906. [Google Scholar] [CrossRef]
  45. Agyekum, E.B.; Velkin, V.I. Optimization and Techno-Economic Assessment of Concentrated Solar Power (CSP) in South-Western Africa: A Case Study on Ghana. Sustain. Energy Technol. Assess. 2020, 40, 100763. [Google Scholar] [CrossRef]
  46. Trading Economics China Inflation Rate—April 2023 Data—1986–2022 Historical—May Forecast. Available online: https://tradingeconomics.com/china/inflation-cpi (accessed on 7 May 2023).
  47. Trading Economics China Sales Tax Rate—VAT—2022 Data—2023 Forecast—2006–2021 Historical—Chart. Available online: https://tradingeconomics.com/china/sales-tax-rate (accessed on 7 May 2023).
  48. Global Petrol Prices China Electricity Prices. September 2022. Available online: https://www.globalpetrolprices.com/China/electricity_prices/ (accessed on 8 May 2023).
  49. Zhou, W.; Goh, B. China Keeps Lending Benchmarks Unchanged in March, as Expected. Reuters. 20 March 2023. Available online: https://www.reuters.com/world/china/china-keeps-lending-benchmarks-unchanged-march-expected-2023-03-20/ (accessed on 8 May 2023).
  50. Statista China: Power Generation Emission Intensity 2021. Available online: https://www.statista.com/statistics/1300419/power-generation-emission-intensity-china/ (accessed on 8 May 2023).
Figure 1. Hourly solar irradiance-beam (annual average) for the studied locations.
Sustainability 15 14555 g001
Figure 2. The modeled SWHS: (a) the whole SWHS modeled in SAM; (b) diagram indicating the collection of energy; and (c) stratified tank [40].
Sustainability 15 14555 g002
Figure 3. Annual AC energy generation (year 1) (kWh): (a) Lhasa, (b) Nauchang, (c) Wuhan, (d) Kashi, (e) Yumen, and (f) Harbin, using water as working fluid.
Sustainability 15 14555 g003
Figure 4. Hourly volume of cold and hot water using water as working fluid: (a) Lhasa, (b) Nauchang, (c) Wuhan, (d) Kashi, (e) Yumen, and (f) Harbin.
Sustainability 15 14555 g004
Figure 5. Hot-water draw (kg/h).
Sustainability 15 14555 g005
Figure 6. Impact of tilt angle on solar fraction: (a) water; (b) glycol.
Sustainability 15 14555 g006
Figure 7. Effect of the cost of collector per meter squared on the economic performance (a) real LCOE (b) NPV of the SWHS at Lhasa, using water as the working fluid.
Sustainability 15 14555 g007
Figure 8. Effect of pump power on the CF, LCOE (real), and PEP: (a) Lhasa, (b) Nauchang, (c) Wuhan, (d) Kashi, (e) Yumen, and (f) Harbin.
Sustainability 15 14555 g008
Figure 9. Effect of the azimuth on the performance of the SWHS: (a) Lhasa, (b) Nauchang, (c) Wuhan, (d) Kashi, (e) Yumen, and (f) Harbin.
Sustainability 15 14555 g009
Figure 10. Effect of varying the heat-exchanger effectiveness, total system flow rate, pump efficiency, outlet set temperature, overall solar heat gain, and thermal loss of the system on the Q delivered.
Sustainability 15 14555 g010
Figure 11. Effect of varying the heat-exchanger effectiveness, total system flow rate, pump efficiency, outlet set temperature, overall solar heat gain, and thermal loss of the system on the PBP.
Sustainability 15 14555 g011
Figure 12. Effect of varying the heat-exchanger effectiveness, total system flow rate, pump efficiency, outlet set temperature, overall solar heat gain, and thermal loss of the system on the solar fraction.
Sustainability 15 14555 g012
Figure 13. Effect of varying the heat-exchanger effectiveness, total system flow rate, pump efficiency, outlet set temperature, overall solar heat gain, and thermal loss of the system on the capacity factor.
Sustainability 15 14555 g013
Table 1. Weather data for the various locations.
LocationLatitude (Degrees)Longitude (Degrees)Global Horizontal (kWh/m2/day)Average Temperature (°C)Average Wind Speed (m/s)
Lhasa30.1591.395.01−1.301.10
Nauchang28.69115.853.6718.702.70
Wuhan30.59114.303.7017.802.70
Kashi39.3875.754.7512.802.10
Yumen40.2497.434.8310.003.70
Harbin45.79126.534.005.103.20
Table 2. Technical parameters used for the modeling.
ParameterValueRef.
Solar tank and heat exchanger
Solar tank volume (m3)0.3[40]
Outlet set temperature (°C)55SAM
Mechanical room temperature (°C)20SAM
Solar tank maximum water temperature (°C)99[10]
Piping and pump
Pipe diameter (m)0.019SAM
Pipe insulation conductivity (W/m·°C)0.03SAM
Pipe insulation thickness (m)0.006SAM
Total piping length (m)10[10,21]
Pump power (W)45[10]
Pump efficiency (%)85[10,40]
Table 3. Technical performance of the SWHS at the various locations.
MetricWater as Working FluidGlycol as Working Fluid
LhasaNauchangWuhanKashiYumenHarbinLhasaNauchangWuhanKashiYumenHarbin
Annual AC energy saved (year 1), kWh292815281652231324452469283915271651231124442468
Solar fraction (year 1)0.800.670.700.860.850.770.850.670.700.860.850.77
Aux with solar (year 1), kWh601.2635.9575.4251.6302.4624.5347.7636.6576.1252.6303.4625.1
Aux without solar (year 1), kWh3668.12280.92346.92692.92881.03225.13339.32280.92346.92692.92881.03225.1
CF, (year 1), %115.706.208.709.209.2010.705.706.208.609.109.20
Table 4. Economic performance of the SWHS.
MetricWater as Working FluidGlycol as Working Fluid
LhasaNauchangWuhanKashiYumenHarbinLhasaNauchangWuhanKashiYumenHarbin
LCOE nominal, cent/kWh10.7320.5619.0113.5912.8512.7311.0720.5719.0213.6012.8612.73
LCOE real, cent/kWh9.9419.0417.6112.5911.9011.7910.2519.0517.6212.5911.9111.79
Electricity bill without system (year 1), USD136613661366136613661366136613661366136613661366
Electricity bill with system (year 1), USD106912101197113711201113107812101197113711201113
Net savings with system (year 1), USD296156169229246253288156168229246253
NPV, USD52−2207−2006−1034−761−650−83−2210−2008−1037−764−653
Simple PBP, years15.8--- 21.820.816.5---21.920.8
Disclaimer/Publisher’s Note: The statements, opinions and data contained in all publications are solely those of the individual author(s) and contributor(s) and not of MDPI and/or the editor(s). MDPI and/or the editor(s) disclaim responsibility for any injury to people or property resulting from any ideas, methods, instructions or products referred to in the content.

