Abstract
The sustainable development of society depends on the reliable supply of electricity while keeping impacts on the environment to a minimum. A 951 MWe nuclear power plant in the semi-enclosed Nanwan Bay at the southern tip of Taiwan began operating in May 1984. Part of the bay is in Kenting National Park, which is known for its coral reefs and abundant marine life; thus, thermal pollution from the cooling water discharge is a great concern. Fortunately, the bay opens south to face the Luzon Strait, where the world’s strongest internal tides are generated. Because the bay is deep enough, internal waves bring up cold deep water and reduce the surface temperature by as much as 10 °C for a few hours every day. These internal waves and topographically generated upwelling also bring nutrients to the euphotic layer from the depths, but the upwelled waters quickly leave the bay along with the cooling water. As a result, a thermal plume with a temperature of 1 °C or higher than the ambient temperature only covers 1 km. By way of comparison, El Niño—Southern Oscillation- or Pacific Decadal Oscillation-related interannual variations in temperature are as high as 5 °C. The rapid turnover of the upwelled waters also helps to prevent heat released by the power plant from accumulating and diminishes the thermal stress, thus sustaining corals and other marine life forms. Typhoons, even hundreds of kilometers away, could also induce the upwelling of cold subsurface water. Consecutive typhoons have been observed to reduce the water surface temperature by up to 10 °C for two weeks or longer. Furthermore, the currents are such that the thermal plume flows out of the bay most of the time. All of these factors make the surface waters in the bay about 0.5 °C cooler than the waters outside of the bay, despite the operation of a nearby nuclear power plant.
1. Introduction
Energy and electricity are among the most important resources for the development of mankind, and there is a great need to develop agriculture, business, communication, education, healthcare and transportation sectors everywhere. The lack of access to electricity hinders sustainable economic and human development. As almost half of the world’s population lives in coastal regions, the large-scale construction of nuclear and thermal power plants in these regions, many in bays and estuaries, can solve the problem of energy shortage and sustain the economy to a certain degree. Bays and estuaries are known to be biologically productive but are also strongly influenced by human activities. The matter of concern here is the operation of nuclear power plants that need more cooling water than plants that use other fuels. Nuclear power plants are frequently located on the coast because of the almost unlimited supply of cooling water. Many are situated in bays or estuaries to protect the plants from strong waves. Naturally, thermal pollution is a necessary evil, especially in areas with limited circulation [1]. The IMCO/FAO/UNESCO/WMO/WHO/IAEA/UN/UNEP joint Group of Experts on Scientific Aspects of Marine Pollution defines marine pollution as follows [2]: “The introduction by man, directly, or indirectly, of substances or energy into the marine environment (including estuaries) resulting in such deleterious effects as harm to living resources, hazards to human health, a hindrance to marine activities including fishing, impairing the quality for the use of seawater and reduction of amenities”. The above deliberately includes energy and makes heat a pollutant.
In the era of global warming [3], temperatures are rising in tropical regions more than anywhere else [4]; thus, thermal pollution near tropical coastal power plants and how it might affect the sustainability of surrounding ecosystems are both particularly concerning. For instance, when discharged, heated water mixes into the seawater to generate a thermal plume. Most previous studies show that thermal discharge from coastal power plants harms the abundance and community structure of phytoplankton, zooplankton, macrobenthic animals, and swimming animals, as well as their habitats such as coral reefs. Rising seawater temperature could also decrease the concentration of dissolved oxygen and affect the metabolic rate of marine organisms. Furthermore, power plants typically generate chlorine-related compounds to their cooling water to decrease algal growth in the heat exchangers and pipes or tubes in the power plants. These toxic chemicals are discharged into the environment [5,6,7]. Without referring to the widespread radiotoxicity problem, this study explores the almost non-existent thermal pollution at a 951 MWe nuclear power plant located in a semi-enclosed bay at the southern tip of Taiwan (Figure 1). The results were compared with another semi-enclosed bay at almost the same latitude but on the other side of the Taiwan Strait (Figure 1). Daya Bay is experiencing thermal pollution, and many factors such as internal tides, topography, upwelling, stratification, and typhoons affect the distribution of thermal discharge. Since not all factors occur at the same time, in order to highlight the most prominent features, this study does not consider data obtained during the same time span.
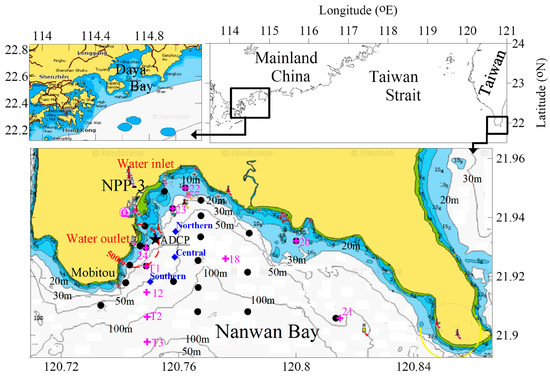
Figure 1.
Sampling stations.
2. Study Area and Methods
The main object of this study is the Third Nuclear Power Plant (marked as NPP3 in Figure 1) located on the northwestern coast of Nanwan Bay at about 121° E and 22° N where the Taiwan Strait, the South China Sea (SCS), and the West Philippine Sea (WPS) meet. The cooling water inlet is inside the power plant compound, but the thermal discharge outlet is a few kilometers south of the power plant. The bay has an area of about 38 km2, a steep bottom topography reaching 100 m in depth, and only small creeks with seasonal outflow. The bay is part of Kenting National Park and is home to extensive coral coverage and abundant marine life. The park attracts several million visitors each year, so the potential pollution emitted by the power plant is of great concern. The plant’s two reactors started began operating in May 1984 and May 1985, respectively, and the Environmental Impact Assessment (EIA) study began in July 1979. We took over the field surveys in July 1993. The hydrology team took CTD (conductivity, temperature, and depth) measurements every season using a Seabird SBE 19 at 19 stations with GPS positioning (shown as dots in Figure 1). A drifter equipped with a Pace Scientific Inc. XR5-T temperature logger (Mooresville, NC, USA) and a GPS was deployed at the cooling water outlet and followed to track the plume on the same day as the CTD deployments. The precision is 0.02 °C. A NorTek AS Aquadopp (NorTek, Vangkroken, Norway) current meter equipped with a temperature logger was used to continuously record the current at a water depth of 20 m, 500 m south of the outlet. In addition, temperature loggers (HOBO, Water Temp Pro v2; Tinytag, TG-4100) (HOBO, Woburn, MA, USA) were placed near the cooling water inlet (8 m in water depth), outlet (3 and 9 m in water depth), and in Moubitou (9 m in water depth).
The biogeochemical team took CTD measurements at ten stations with GPS positioning (shown as “+” in Figure 1) four times each year. In addition, we collected seawater samples at various depths at seven stations (St. 12, 18, 20, 21, 22, 23, and 24). We measured temperature and salinity using an Autosal 8400B salinometer (Sea-Bird Scientific, Bellevue, WA, USA) calibrated with the International Association of Physical Sciences of the Oceans standard seawater with a precision of ±0.004. Seawater samples were collected in a Niskin bottle (Ocean Scientific International, Avant, UK), subdivided into dark bottles, and stored in a cooler after being poisoned with HgCl2. Samples were analyzed in a laboratory. The dissolved oxygen was measured using Winkler titration with a precision of 0.5%. Nitrate (NO3) and nitrite (NO2) were measured using a cadmium reduction + azo dye colorimetric method with an OI Analytical FS 3100 Colorimeter at a precision of ±0.035 μmol/kg for NO3 and ±0.02 μmol/kg for NO2.
Phosphate (PO4) was measured using an ascorbic acid reduction–calorimetric method with a precision of 0.01 μmol/kg. Silicate (SiO2) was measured by the ascorbic acid/oxalate reduction–colorimetric method with a precision of ±0.1 μmol/kg. The colorimeter mentioned above was used for PO4 and SiO2 measurements. The nutrient standards were purchased from WAKO, Japan. Data reports are available at URL: https://npp3.nsysu.edu.tw (accessed on 30 May 2023).
3. Dynamics of the Study Area
Unlike the East China Sea (ECS), which has strong tidal dynamics that facilitate water exchanges in and out of a bay, the SCS has weak tidal dynamics. Therefore, thermal pollution from power plants in a bay surrounding the SCS is a concern, as tidal motion dispersion is weak [6]. Fortunately, strong internal tides are generated due to the ridges in the Luzon Strait, particularly during spring tides. These internal tides pump the subsurface cold waters to the surface, which then propagate towards the coast, following the bottom topography. It is an almost-daily event, particularly notable in summer when the stratification is strong because of the warm, light surface layer of water. These internal tides cause regular temperature decreases of 2–10 °C in Nanwan Bay within 12–24 h of generation in the Luzon Strait. Such events pump a significant amount of nutrients into the otherwise oligotrophic euphoric layer during the upward phase of the internal tide [8,9,10].
4. Results and Discussion
As an example of the internal tides, Figure 2 shows the continuous temperature records measured at 3 m and 9 m in water depth from the outlet and at 9 m away from Moubitou south of the power plant (Figure 1) between 6 May and 14 August 2021. There are low-frequency variations lasting a week or two, apparently related to the tidal movements, which are also shown in Figure 2. The water temperature sometimes reaches as high as 32 °C, which is far too high for the healthy growth of corals. Fortunately, there are daily temperature variations of a few °C; for a few hours every day, cold waters that temporarily cool the environment are pumped up by internal tides.
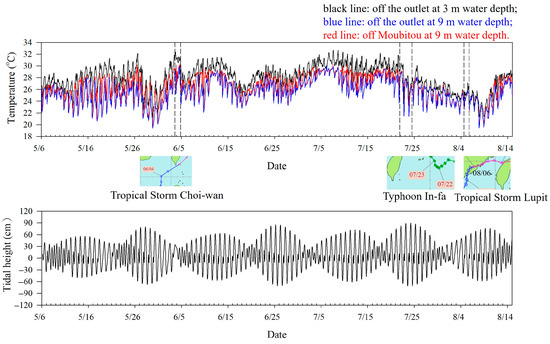
Figure 2.
Continuous temperature and tidal height records taken between 6 May and 14 August 2021. Tidal data were collected from https://www.cwb.gov.tw (accessed on 30 May 2023).
The temperatures at 3 m near the outlet can be around 2 °C higher than at 9 m, showing the influence of warmer, lighter thermal discharge. It is important to note that, at 9 m, the temperature near the outlet is almost always lower than that in Moubitou by up to 2 °C (Figure 2). The fluctuating effect caused by stratification likely causes a lower temperature near the outlet [11]. When the plume spreads near the surface, it entrains some subsurface water, thus lowering the temperature of the thermal plume. Low-temperature offshore subsurface waters must continuously flow onshore to replace the outflowing entrained water. As a result, beneath the plume near the outlet, the temperature is lower than it would have been otherwise, thus helping to relieve corals from thermal stress in summer [12].
The daily temperature decreases last a few hours and then return to the pre-internal tide value, except when typhoons are nearby. It has been reported that typhoons affect Nanwan Bay. During the period shown in Figure 2, the tropical storms, Choi-wan (around 5 June) and Lupit (around 23 July), as well as typhoon In-fa (around 5 August) occurred. The seawater temperature continuously dropped from a few days to at least two weeks following consecutive typhoons. In the case of In-fa and Lupit (Figure 2), the cumulative temperature drop was as high as 10 °C. Seemingly, storms pushed offshore waters towards the coast, causing the upwelling of cold, subsurface waters. Heavy rains after a storm also generate stratification and buoyancy, which helps bring up cold, subsurface waters [13]. Other distant oceanic phenomena, such as eddies and the meandering of the Kuroshio Current and its branches, could also replace the waters of Nanwan Bay, thus diminishing any local effects caused by the power plant.
Comparisons between temperatures at the background station 1500 m away from the outlet and temperatures at three stations (not shown in Figure 1) 500 m away from the outlet are shown in Figure 3. The local law dictates that temperatures at 500 m away from the outlet must not exceed 4 °C higher than those at the background stations. It is clear that the temperature difference was mostly less than 2 °C, although occasionally, it reached 3.5 °C. The average temperature increases were 0.75 and 0.82 °C north and east of the outlet (marked as Northern sta. and Central sta. in Figure 3), respectively. South of the outlet, the temperature was 1.2 °C higher than at the background station because of the prevailing southward flowing current, which is described later. Hydrological and drifter data indicate that a thermal plume with a temperature 1 °C higher than t the background station temperature extends for a maximum of 1 km from the outlet. Note that the temperatures at these three stations are occasionally lower than at the background station. This is perhaps because of the upwelled cold water induced by the entrainment.
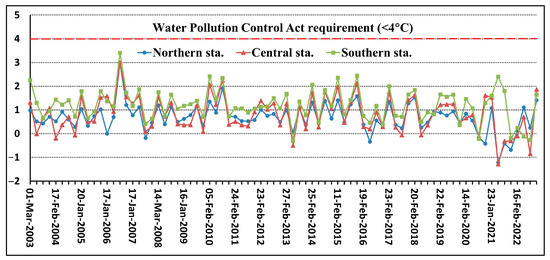
Figure 3.
Temperature difference between the temperatures at background stations 1500 m away and at three stations 500 m away from the outlet between 2003 and 2022. The temperatures were measured seasonally. According to the local Water Pollution Act, this temperature difference must be less than 4 °C.
Figure 4 shows the typical horizontal distribution of temperature, salinity, pH, DO, nitrate + nitrate, phosphate, and silicate at a water depth of 10 m in Nanwan Bay. An upwelling center of subsurface waters occurs in the middle of the bay, with a temperature of more than 1 °C below that close to the coast. Furthermore, higher salinity and nutrients but lower pH and DO, typical of subsurface waters in the tropical NW Pacific Ocean are also found near the upwelling center. Naturally, the upwelled waters replace and push surface waters offshore, carrying with them the thermal plume from the power plant. Partly due to its poor resolution, the thermal plume is not apparent in Figure 4. The waters near the outlet with a temperature above 28 °C shown in Figure 4 are 1.5 °C warmer than the water at the upwelling center but still cooler than waters in the eastern bay far from the nuclear power plant.
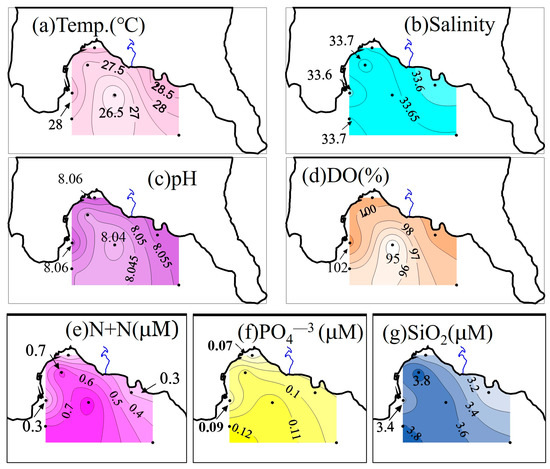
Figure 4.
Horizontal distribution of water temperature, salinity, pH, dissolved oxygen, nitrite + nitrate, phosphate, and silicate at a depth of 10 m in Nanwan Bay on 8 August 2013.
The potential temperature (theta) vs. salinity plot is frequently used to identify water masses, such as Kuroshio and the SCS waters [14]. In the upper water column, the WPS waters are generally more saline than the SCS water when compared at the same potential temperature. Figure 5 shows the typical theta/S plots for the WPS (broken line) and the SCS (thin line), with the former located to the right of the SCS curve. Additionally, plotted in Figure 5 are temperature and salinity data for all bottled samples collected between 1993 and 2022. Except for rare cases when coastal water reaches Nanwan Bay in winter following an extreme NE monsoon, our study area comprises only waters from the WPS and the SCS. Mixing waters from these two seas creates water with temperature and salinity located between the two trends, with a higher contribution to the WPS, as shown by data skewed to the right. Temperature and salinity data in our study area mostly lie between these two trends. Notably, during the cold phase of the Pacific Decadal Oscillation (PDO), waters in Nanwan Bay tend to contain fresher SCS water (Figure 5a), while during the warm PDO phase, they contain more saline WPS (Figure 5b).
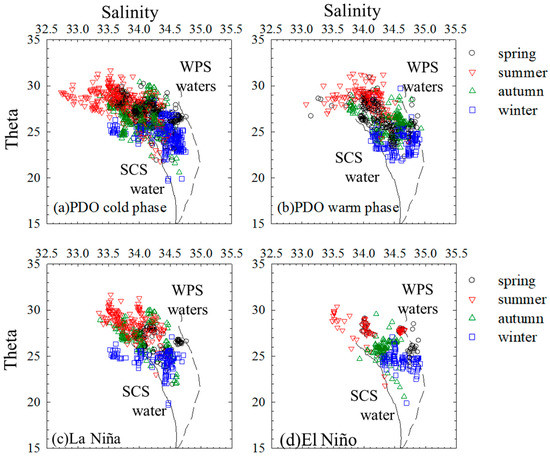
Figure 5.
Theta/salinity diagrams during (a) PDO cold phase and for (c) La Niña; (b) PDO warm phase and (d) El Niño.
The El Niño–Southern Oscillation (ENSO) phenomenon also affects the source of waters in Nanwan Bay, with more intrusion from the Kuroshio Current during El Niño when the salinity and temperature move significantly further to the right. In other words, waters in Nanwan Bay are closer to the typical potential temperature vs. salinity line of the Kuroshio Current. During a La Niña event, Kuroshio Current intrusion is reduced, and the salinity and temperature signature move to the left and become closer to the typical SCS line (Figure 5c,d). Furthermore, during an El Niño event, monsoons weaken, and basinwide upwelling in the SCS is reduced, thus raising the surface water temperature compared to the normal periods [15]. On the other hand, during a La Niña event, there are stronger monsoons, and upwelling in the SCS increases, lowering the surface temperature of the water.
Figure 6 shows the average temperature anomaly for the surface samples (excluding St. 24) and the Oceanic Niño Index; ONI) since 1986 (data before 1993 were collected from the study by Hung et al., 1993 [16]). The El Niño events with a positive ONI anomaly (shown in red in Figure 6a) generally correlate with cooler temperatures, as discussed above. On the other hand, during the La Niña years (negative ONI anomalies are shown in blue in Figure 6a), there were generally positive temperature anomalies, i.e., there is an inverse relationship between the ONI and the temperature anomaly. Based on this set of temperature records, the rate of temperature increase has been reported to be a highly statistically significant at 0.026 °C/yr (p = 0.004; 1986–2022; Table 1), compared with the global temperature increase of 0.018 °C/yr that occurred between 1981 and 2022 [17]. Giuliani et al. [18] reported an increase of 0.028 °C/yr between 1960 and 2011, similar to that reported by Bai et al. [19]: around 0.03 °C/yr between 2003 and 2014 in low-latitude Eurasian marginal seas. The results of this study are consistent with those values.
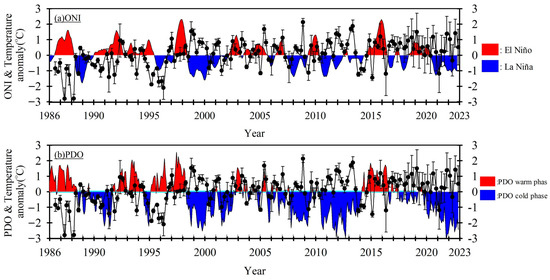
Figure 6.
Temperature anomaly (excluding St. 24) between July 1986 and November 2022.

Table 1.
Comparison of Characteristics of Nanwan Bay and Daya Bay.
We cannot evaluate whether the ENSO or the PDO correlates better with the temperature anomaly. However, during most phases, including the current PDO cold phase (negative values shown in blue; cooler than normal in the eastern North Pacific yet warmer than usual in the western North Pacific), there is generally a positive temperature anomaly (Figure 6b). In contrast, during the PDO warm phase (positive anomalies are shown in red in Figure 6b; warmer than normal in the eastern North Pacific but cooler than usual in the western North Pacific). Our temperature pattern agrees with the PDO signals in the western North Pacific Ocean. Note that the temperature fluctuations reach as high as 5 °C between El Niño and La Niña events or between PDO cold and warm phases. These temperature variabilities are several times larger than the temperature variations of the thermal plume in Nanwan Bay.
Statistically, the PDO correlates well with salinity anomalies in data collected from every season between 1986 and 2022 (Figure 7), except for summer data, where the correlation has a “p” value of 0.06. In other seasons, “p” values are 0.05 or lower. On interannual and longer timescales, a recent study [22] showed that the PDO’s potential impact should be considered when examining the inter-annual variability of flow patterns in the low-latitude northwest Pacific. An anomalous anticyclonic wind field appears over the Philippine Sea during a warm PDO phase. The southerly anomalous wind off the Philippines reduces the Kuroshio Current speed near Luzon. A slower-flowing Kuroshio Current means it can change direction more easily, causing increased salty Kuroshio Current intrusion into the SCS. In other words, Nanwan Bay, which connects the Kuroshio Current and the SCS is more affected by the Kuroshio, and its salinity increases, as shown in Figure 7.
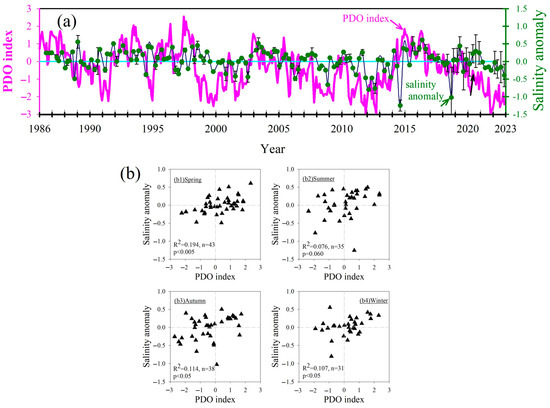
Figure 7.
Salinity anomalies between (a) July 1986 and November 2022 and (b) salinity anomaly vs. PDO in various seasons.
Across the Taiwan Strait and on almost the same latitude is Daya Bay (Figure 1; Table 1), with an area of about 600 km2. It is relatively shallow, with an average depth of only 11 m and a maximum of 21 m, compared to 120 m in Nanwan Bay. Nuclear power plants with two 844 MWe reactors began operating in August 1993 and February 1994, respectively [23]. In 1993, there was essentially no thermal pollution, and in 1994, a thermal plume with a temperature 5 °C higher than the ambient temperature occupied an area of only 0.01 km2. In 1999, this area increased to 0.08 km2, and seawater temperature 7 °C higher than the ambient temperature was recorded for the first time, occupying an area of 0.02 km2. In 2001, areas with temperatures 5 and 7 °C higher than the ambient temperature expanded to 0.55 and 0.07 km2, respectively. In 1999, a thermal plume with a temperature 1 °C higher than the ambient temperature extended as far as 10 km south of the plant (Tang et al. [24]; Table 1). This is comparable to findings for Nanwan Bay, where the temperature increase is much lower, and the thermal plume with a temperature 1 °C higher than the background extends only 1 km (Table 1). The rate of temperature increase recorded in Daya Bay between 1982 and 2004 was 0.079 °C/yr (p = 0.033), based on the data of Wang et al. [20], a much higher figure than that found in Nanwan Bay (0.026 °C/yr) with power units that were half the size.
In 2003, 2 × 950 + 2 × 1007 MWe nuclear reactors began operating, resulting in even more enormous thermal plumes, reaching 0.36 km2 for waters with temperatures higher than 7 °C higher than the ambient temperature. Unlike Nanwan Bay, where internal waves or upwelling can suck up subsurface waters 10 °C lower in temperature, there are no internal waves or upwelling in Daya Bay. Furthermore, because of the shallowness of the bay, the buoyant plume does not entrain any subsurface water that is more than a couple of degrees C cooler. The vase-like shape of Daya Bay, unlike the bowl-like shape of Nanwan Bay, also limits the exchange of water with the outside water. As a result, the heat in the thermal plume in Daya Bay is not dissipated quickly enough compared to Nanwan Bay.
Remote sensing images show that thermal plumes accumulate near nuclear power plants in Daya Bay [24,25,26]. On the other hand, the thermal plume in our study area frequently travels southwestward and leaves the bay. Figure 8 shows a rose diagram for currents measured between 24 December 2020 and 10 November 2022. On average, for almost two years, 57% of the time, the currents flow toward the southwest, i.e., leaving the bay. The second most dominant flow direction is toward the west–southwest, also leaving the bay. The northeastward currents, moving inside the bay, occur about as frequently as the south–southwest flowing currents. In short, most currents flow towards the open ocean, carrying with them the heat discharged by the nuclear power station.
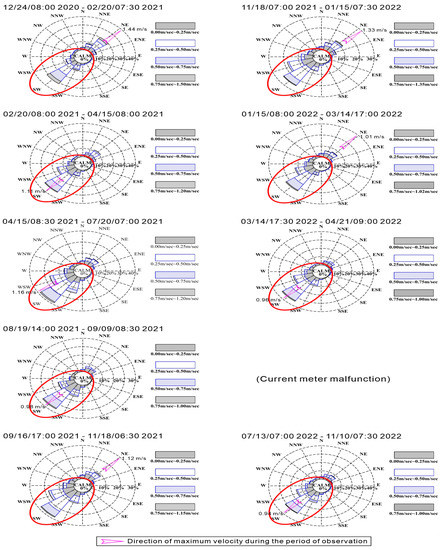
Figure 8.
Rose diagram for the velocity measured at a current meter station 500 m away from the outlet between 2021 and 2022. The current at the station consists of tidal and subtidal flows with a primary current direction towards the southwest (marked by red ovals).
The dynamics for the dominance of the southwestward flow is attributed to the cyclonic recirculation created by the eastward-flowing ebb current sweeping off the bowl-shaped embayment (Figure 1), resulting in the tidal currents mostly moving southwestward in the northwest of the bay during both ebb and flood tides [8]. We compared the temperatures recorded during the normal operation and maintenance of the nuclear power plants at Nanwan Bay (Table 2). No maintenance occurred in summer, but in the the other three seasons, the results are mixed, and the data have no anomalies except for those recorded at St. 24 near the outlet, where the average temperature of 28.7 °C during normal operation in autumn is 1.5 °C higher than the average temperature of 27.2 °C when the plants are under maintenance. During spring and winter, the average temperatures at St. 24 are 0.7 °C higher than those recording during maintenance periods. Note that autumn is the second busiest season for the NPP3; therefore, more heat is released during normal operation, causing s slightly larger difference between normal operation and under-maintenance operation compared with spring and winter.
Table 2.
Surface water temperature during normal operation and under maintenance.
5. Conclusions
Two reactors in the Third Nuclear Power Plant in the northwestern corner of Nanwan Bay at the southern tip of Taiwan started operation in 1984. The thermal plume with a temperature 1 °C higher than the background extends 1 km. This was compared with El Niño–Southern Oscillation- or Pacific Decadal Oscillation-related interannual variations in temperature of up to 5 °C. Nevertheless, because of the tropical/subtropical environment of the bay, the surface water temperature in summer exceeds 32 °C, which is too warm for many coral species. The bowl-shaped bay, however, opens to face the Luzon Strait, where the world’s strongest internal tides are generated. Because the bay has a sufficient maximum depth of 120 m, daily internal waves move into the bay, and during the uplifting phase of the internal wave, the surface temperature reduces by as much as 10 °C for a couple of hours every day. In the long term, the surface waters in the bay are about 0.5 °C cooler than the waters outside of the bay, despite the operation of the power plant. The cold water reduces thermal stress in corals caused by the warm waters, thus sustaining the coral reefs and marine life forms in the bay. Furthermore, the upwelled waters are rich in nutrients, which benefits phytoplankton and corals alike.
The large daily reduction in temperature can sometimes last for up to two weeks or longer when a typhoon passes through the region or comes within a distance of several hundreds of kilometers. As cold waters are frequently associated with higher nutrients, these waters nurture and help sustain the ecosystem in the bay. The upwelled waters, along with the thermal plume, leave the bay quickly to alleviate the thermal pollution in the bay. To conclude, because of the favorable topography, strong internal tides bring in cold, subsurface waters to prevent serious thermal pollution in Nanwan Bay.
Author Contributions
C.-T.C. organized the project and contributed to the field work, data analysis and writing of the manuscript. S.J., M.-H.C., L.-L.L. and J.-F.H. contributed to the field work, data analysis and writing of the manuscript. Y.-J.Y. contributed to the data analysis. All authors have read and agreed to the published version of the manuscript.
Funding
This research was funded by Taiwan Power Company (12Q210073-1), National Science and Technology Council (MOST 111-2611-M-110-017), and the Ministry of Education (Higher Education Sprout Program, 12C0902).
Data Availability Statement
Data reports are available at https://npp3.nsysu.edu.tw (30 May 2023) but access to the data bank needs to be approved. Contact C.T.A. Chen for details.
Acknowledgments
The authors would like to thank the Taiwan Power Company (12Q210073-1), the National Science and Technology Council (MOST 111-2611-M-110-017), and the Ministry of Education (Higher Education Sprout Program, 12C0902) of Taiwan for supporting this research.
Conflicts of Interest
The research was partially supported by the Taiwan Power Company which operates the nuclear power plants studied.
References
- Osterberg, C.L. Nuclear power wastes and the ocean. In Wastes in the Ocean; Duedall, I.W., Kester, D.R., Park, P.K., Ketchum, B.H., Eds.; Wiley: New York, NY, USA, 1985; Volume 4, pp. 127–162. [Google Scholar]
- GESAMP. Report of the Twelfth Session; World Health Organization: Geneva, Switzerland, 1981. [Google Scholar]
- IPCC. Sixth Assessment Report: Climate Change 2023; IPCC: Geneva, Switzerland, 2023. [Google Scholar]
- Chen, C.-T.A.; Yu, S.; Huang, T.-H.; Bai, Y.; He, X.; Lui, H.-K. Temperature and secchi disk depth increase more rapidly in the subpolar Bering/Okhotsk Seas than in the subtropical South China Sea. Water 2023, 15, 98. [Google Scholar] [CrossRef]
- Chen, C.-C.; Shiah, F.-K.; Lee, H.-J.; Li, K.-Y.; Meng, P.-J.; Kao, S.-J.; Tseng, Y.-F.; Chung, C.-L. Phytoplankton and bacterioplankton biomass, production and turnover in a semi-enclosed embayment with spring tide induced upwelling. Mar. Ecol. Prog. Ser. 2005, 304, 91–100. [Google Scholar] [CrossRef]
- Huang, F.; Lin, J.; Zheng, B. Effects of thermal discharge from coastal nuclear power plants and thermal power plants on the thermocline characteristics in sea areas with different tidal dynamics. Water 2019, 11, 2577. [Google Scholar] [CrossRef]
- Jiang, R.; Wang, Y.-S. Modeling the ecosystem response of the semi-closed Daya Bay to the thermal discharge from two nearby nuclear power plants. Ecotoxicology 2020, 29, 736–750. [Google Scholar] [CrossRef] [PubMed]
- Lee, H.-J.; Chao, S.-Y.; Fan, K.-L.; Wang, Y.-H.; Liang, N.-K. Tidally induced upwelling in a semi-enclosed basin: Nan Wan Bay. J. Oceanogr. 1997, 53, 467–480. [Google Scholar]
- Lee, H.-J.; Chao, S.-Y.; Liu, K.-K.; Huang, S.-J.; Gong, G.-C. Tidal effects on circulation in and near the East China Sea. Terr. Atmos. Ocean. Sci. 2014, 25, 231–254. [Google Scholar] [CrossRef]
- Hsu, P.C.; Lee, H.J.; Zheng, Q.; Lai, J.W.; Su, F.C.; Ho, C.R. Tide-Induced periodic sea surface temperature drops in the coral reef area of Nanwan Bay, southern Taiwan. J. Geophys. Res. Ocean. 2020, 125, e2019JC015226. [Google Scholar] [CrossRef]
- Zhang, J.; Cheng, L.; Wang, Y.; Jiang, C. The impact of tidal straining and advection on the stratification in a partially mixed estuary. Water 2023, 15, 339. [Google Scholar] [CrossRef]
- Tew, K.S.; Leu, M.-Y.; Wang, J.-T.; Chang, C.-M.; Chen, C.-C.; Meng, P.-J. A continuous, real-time water quality monitoring system for the coral reef ecosystems of Nanwan Bay, Southern Taiwan. Mar. Pollut. Bull. 2014, 85, 641–647. [Google Scholar] [CrossRef] [PubMed]
- Chen, C.-T.A.; Liu, C.-T.; Chuang, W.; Yang, Y.; Shiah, F.-K.; Tang, T.; Chung, S. Enhanced buoyancy and hence upwelling of subsurface Kuroshio waters after a typhoon in the southern East China Sea. J. Mar. Syst. 2003, 42, 65–79. [Google Scholar] [CrossRef]
- Chen, C.T.A. The Kuroshio intermediate water is the major source of nutrients on the East China Sea continental shelf. J Oceanol. Acta 1996, 19, 523–527. [Google Scholar]
- Chao, S.-Y.; Boicourt, W.C.; Wang, H.V. Three-layered circulation in reverse estuaries. Cont. Shelf Res. 1996, 16, 1379–1397. [Google Scholar] [CrossRef]
- Hung, T.C.; Jiang, Y.M.; Tan, T.H.; Chang, K.H.; Shao, K.C.; Huang, C.C.; Chu, T.C.; Fan, K.L.; Yeh, H.Y. Ecological Study of the Nuclear Power Plant, Southern TAIWAN. XIV, The Fourteen’s Annual Report (July 1992 to June 1993); Academia Sinica: Taipei, Taiwan, 1993; 136p. (In Chinese) [Google Scholar]
- NOAA National Centers for Environmental Information. State of the Climate: Global Climate Report for 2022. Available online: https://www.ncei.noaa.gov/access/monitoring/monthly-report/global/202213 (accessed on 18 January 2023).
- Giuliani, S.; Bellucci, L.G.; Nhon, D.H. The coast of Vietnam: Present status and future challenges for sustainable development. In World Seas: An Environmental Evaluation; Elsevier: Amsterdam, The Netherlands, 2019; pp. 415–435. [Google Scholar]
- Bai, Y.; He, X.; Yu, S.; Chen, C.-T.A. Changes in the ecological environment of the marginal seas along the Eurasian continent from 2003 to 2014. Sustainability 2018, 10, 635. [Google Scholar] [CrossRef]
- Wang, Y.-S.; Lou, Z.-P.; Sun, C.-C.; Sun, S. Ecological environment changes in Daya Bay, China, from 1982 to 2004. Mar. Pollut. Bull. 2008, 56, 1871–1879. [Google Scholar] [CrossRef] [PubMed]
- Wang, Y.-S. Effects of the operating nuclear power plant on marine ecology and environment-A case study of Daya Bay in China. In Nuclear Power–Deployment, Operation and Sustainability; InTech: Wellington, New Zealand, 2011; pp. 255–290. [Google Scholar] [CrossRef]
- Wu, C.-R. Interannual modulation of the Pacific Decadal Oscillation (PDO) on the low-latitude western North Pacific. Prog. Oceanogr. 2013, 110, 49–58. [Google Scholar] [CrossRef]
- Zhang, Z.; Wang, D.; Cheng, Y.; Gong, F. Long-term changes and factors that influence changes in thermal discharge from nuclear power plants in Daya Bay, China. Remote Sens. 2022, 14, 763. [Google Scholar] [CrossRef]
- Tang, D.; Kester, D.R.; Wang, Z.; Lian, J.; Kawamura, H. AVHRR satellite remote sensing and shipboard measurements of the thermal plume from the Daya Bay, nuclear power station, China. Remote Sens. Environ. 2003, 84, 506–515. [Google Scholar] [CrossRef]
- Yu, J.; Tang, D.; Yao, L.; Chen, P.; Jia, X.; Li, C. Long-term water temperature variations in Daya Bay, China using satellite and in situ observations. Terr. Atmos. Ocean. Sci. 2010, 21, 393–399. [Google Scholar] [CrossRef]
- Zhu, L.; Yin, S.; Wu, C.; Ma, W.; Hou, H.; Xu, J. Remote sensing monitoring of thermal discharge in Daya Bay nuclear power station based on HJ-1 infrared camera. In Proceedings of the Ocean Remote Sensing and Monitoring from Space, Beijing, China, 15–16 October 2014; pp. 182–187. [Google Scholar]
Disclaimer/Publisher’s Note: The statements, opinions and data contained in all publications are solely those of the individual author(s) and contributor(s) and not of MDPI and/or the editor(s). MDPI and/or the editor(s) disclaim responsibility for any injury to people or property resulting from any ideas, methods, instructions or products referred to in the content. |
© 2023 by the authors. Licensee MDPI, Basel, Switzerland. This article is an open access article distributed under the terms and conditions of the Creative Commons Attribution (CC BY) license (https://creativecommons.org/licenses/by/4.0/).