
Adaptive Estimation of Quasi-Empirical Proton Exchange Membrane Fuel Cell Models Based on Coot Bird Optimizer and Data Accumulation


Abstract
1. Introduction
- A novel adaptive CBO-based technique was developed for PEMFC modeling.
- The results of the CBO-based technique were compared to those of other state-of-the-art competitors, and the required statistical analysis was performed.
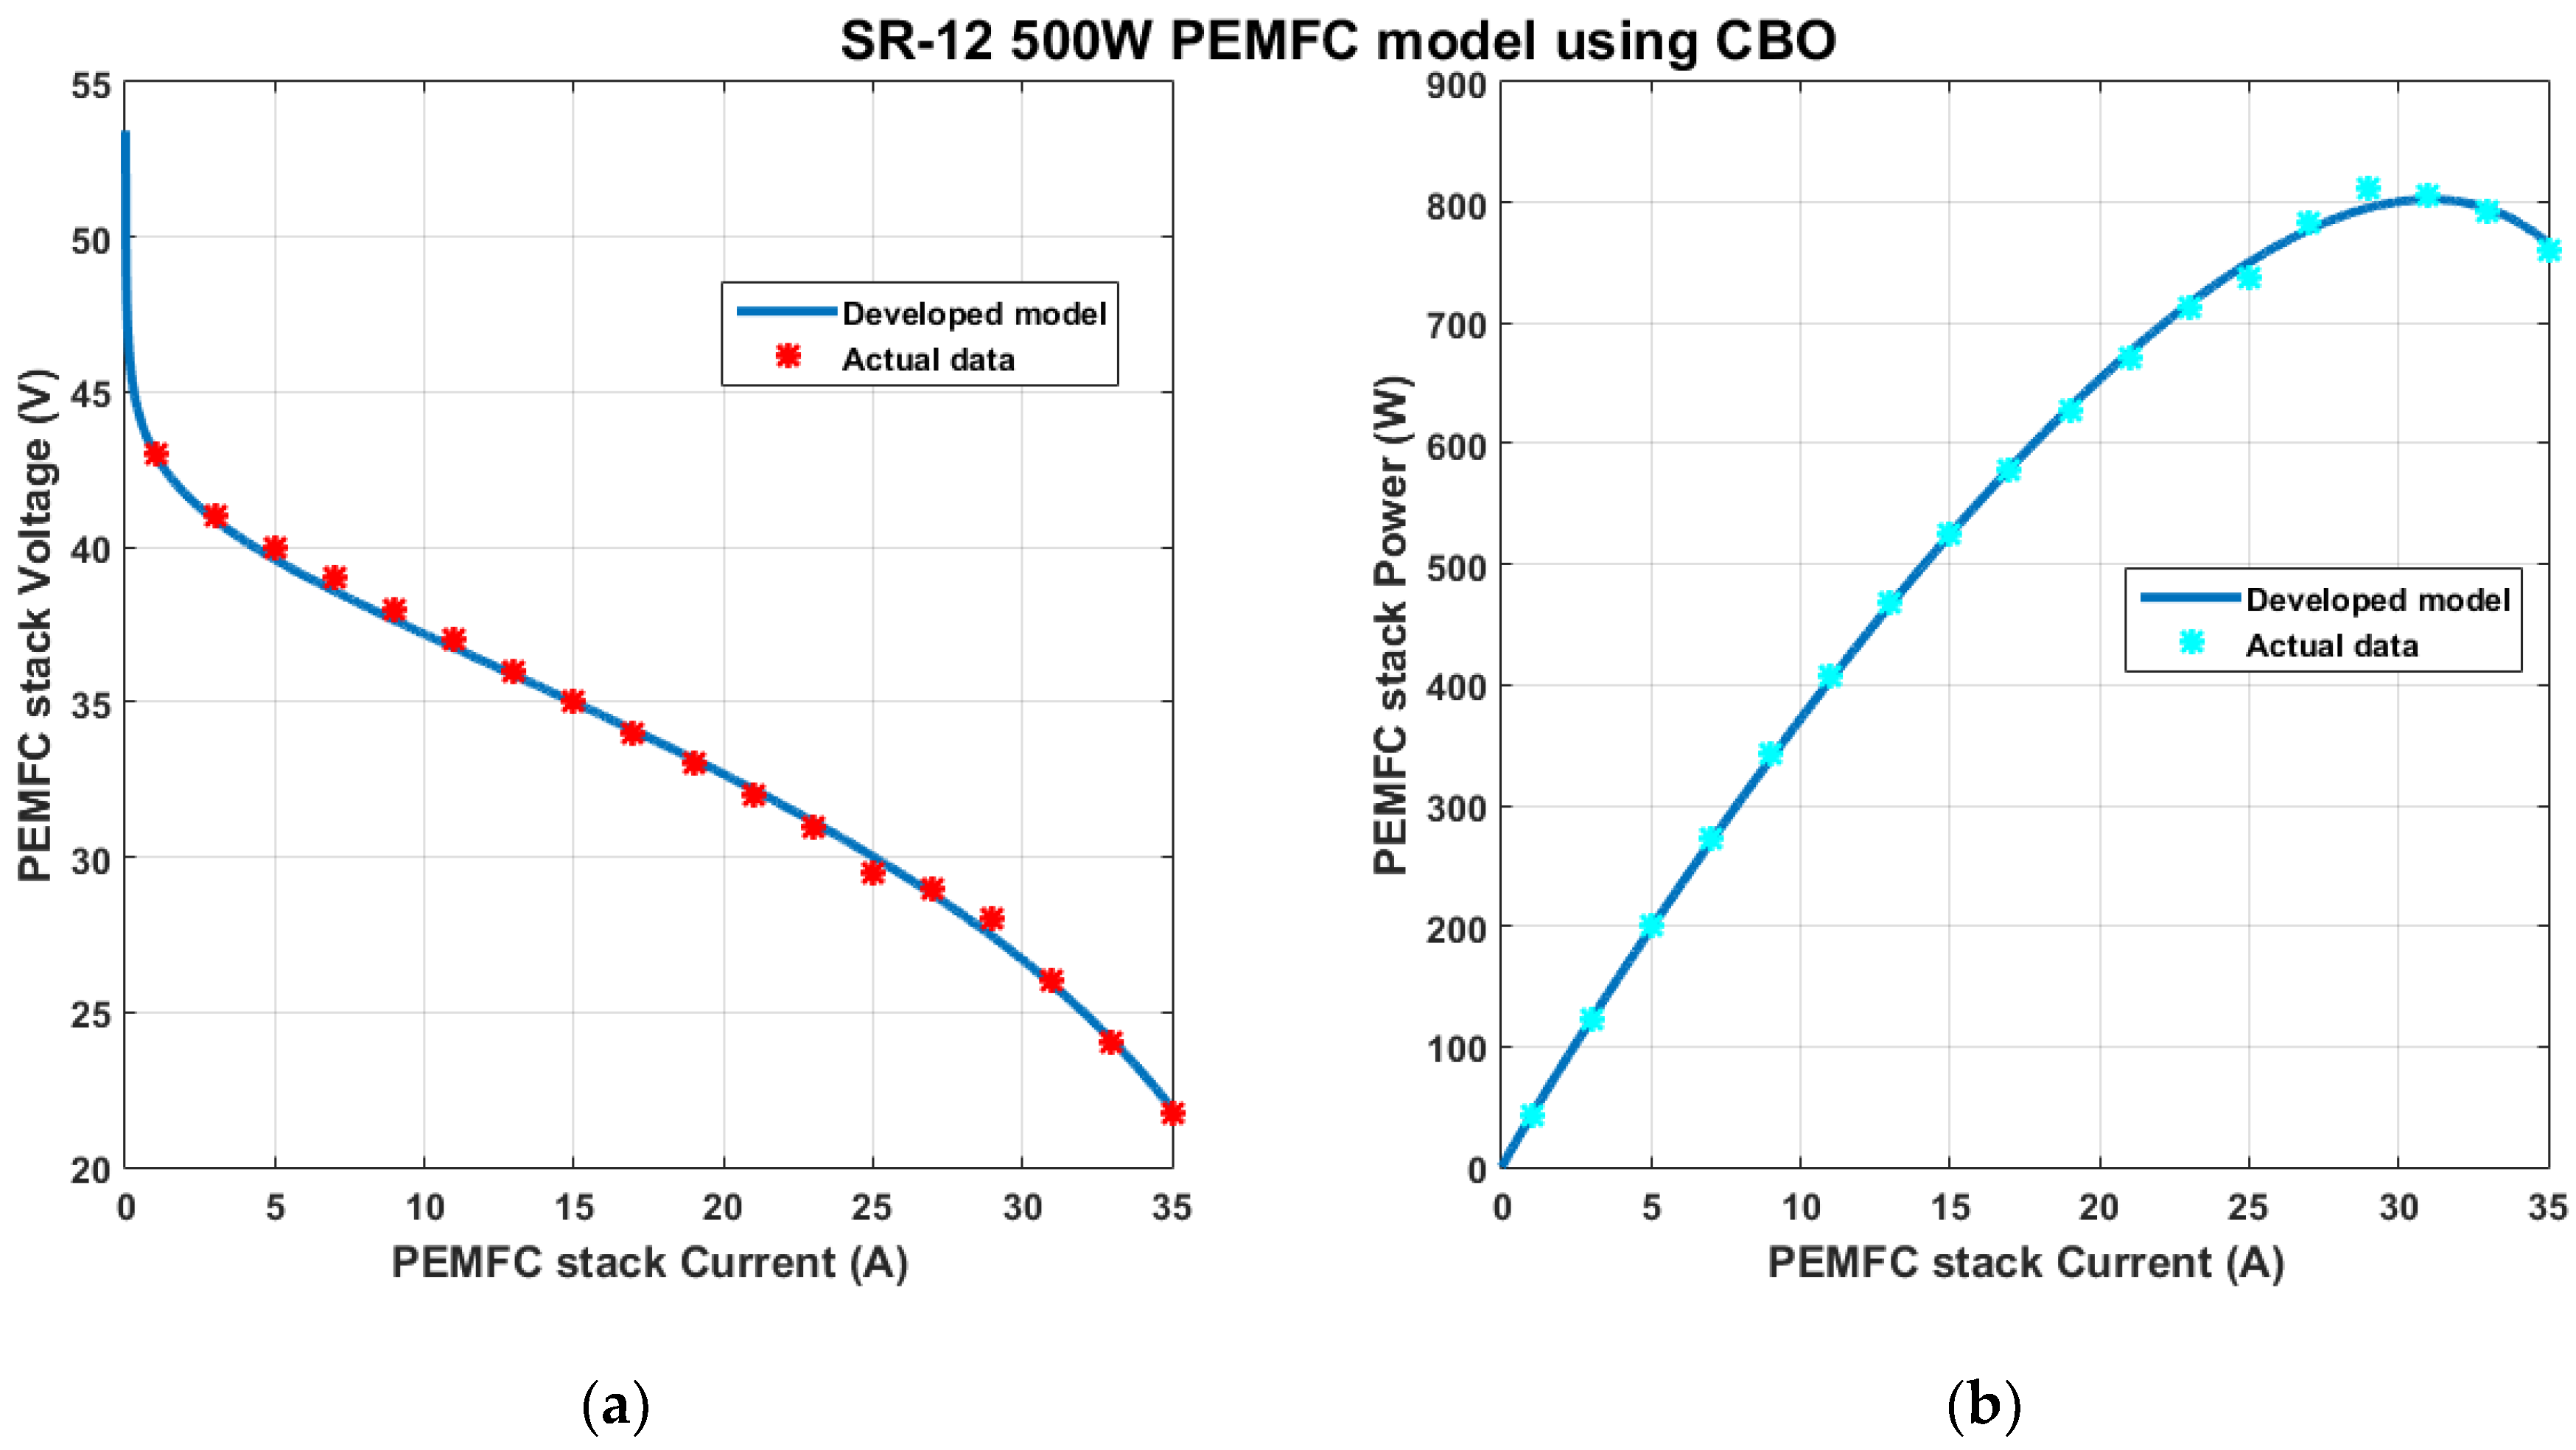
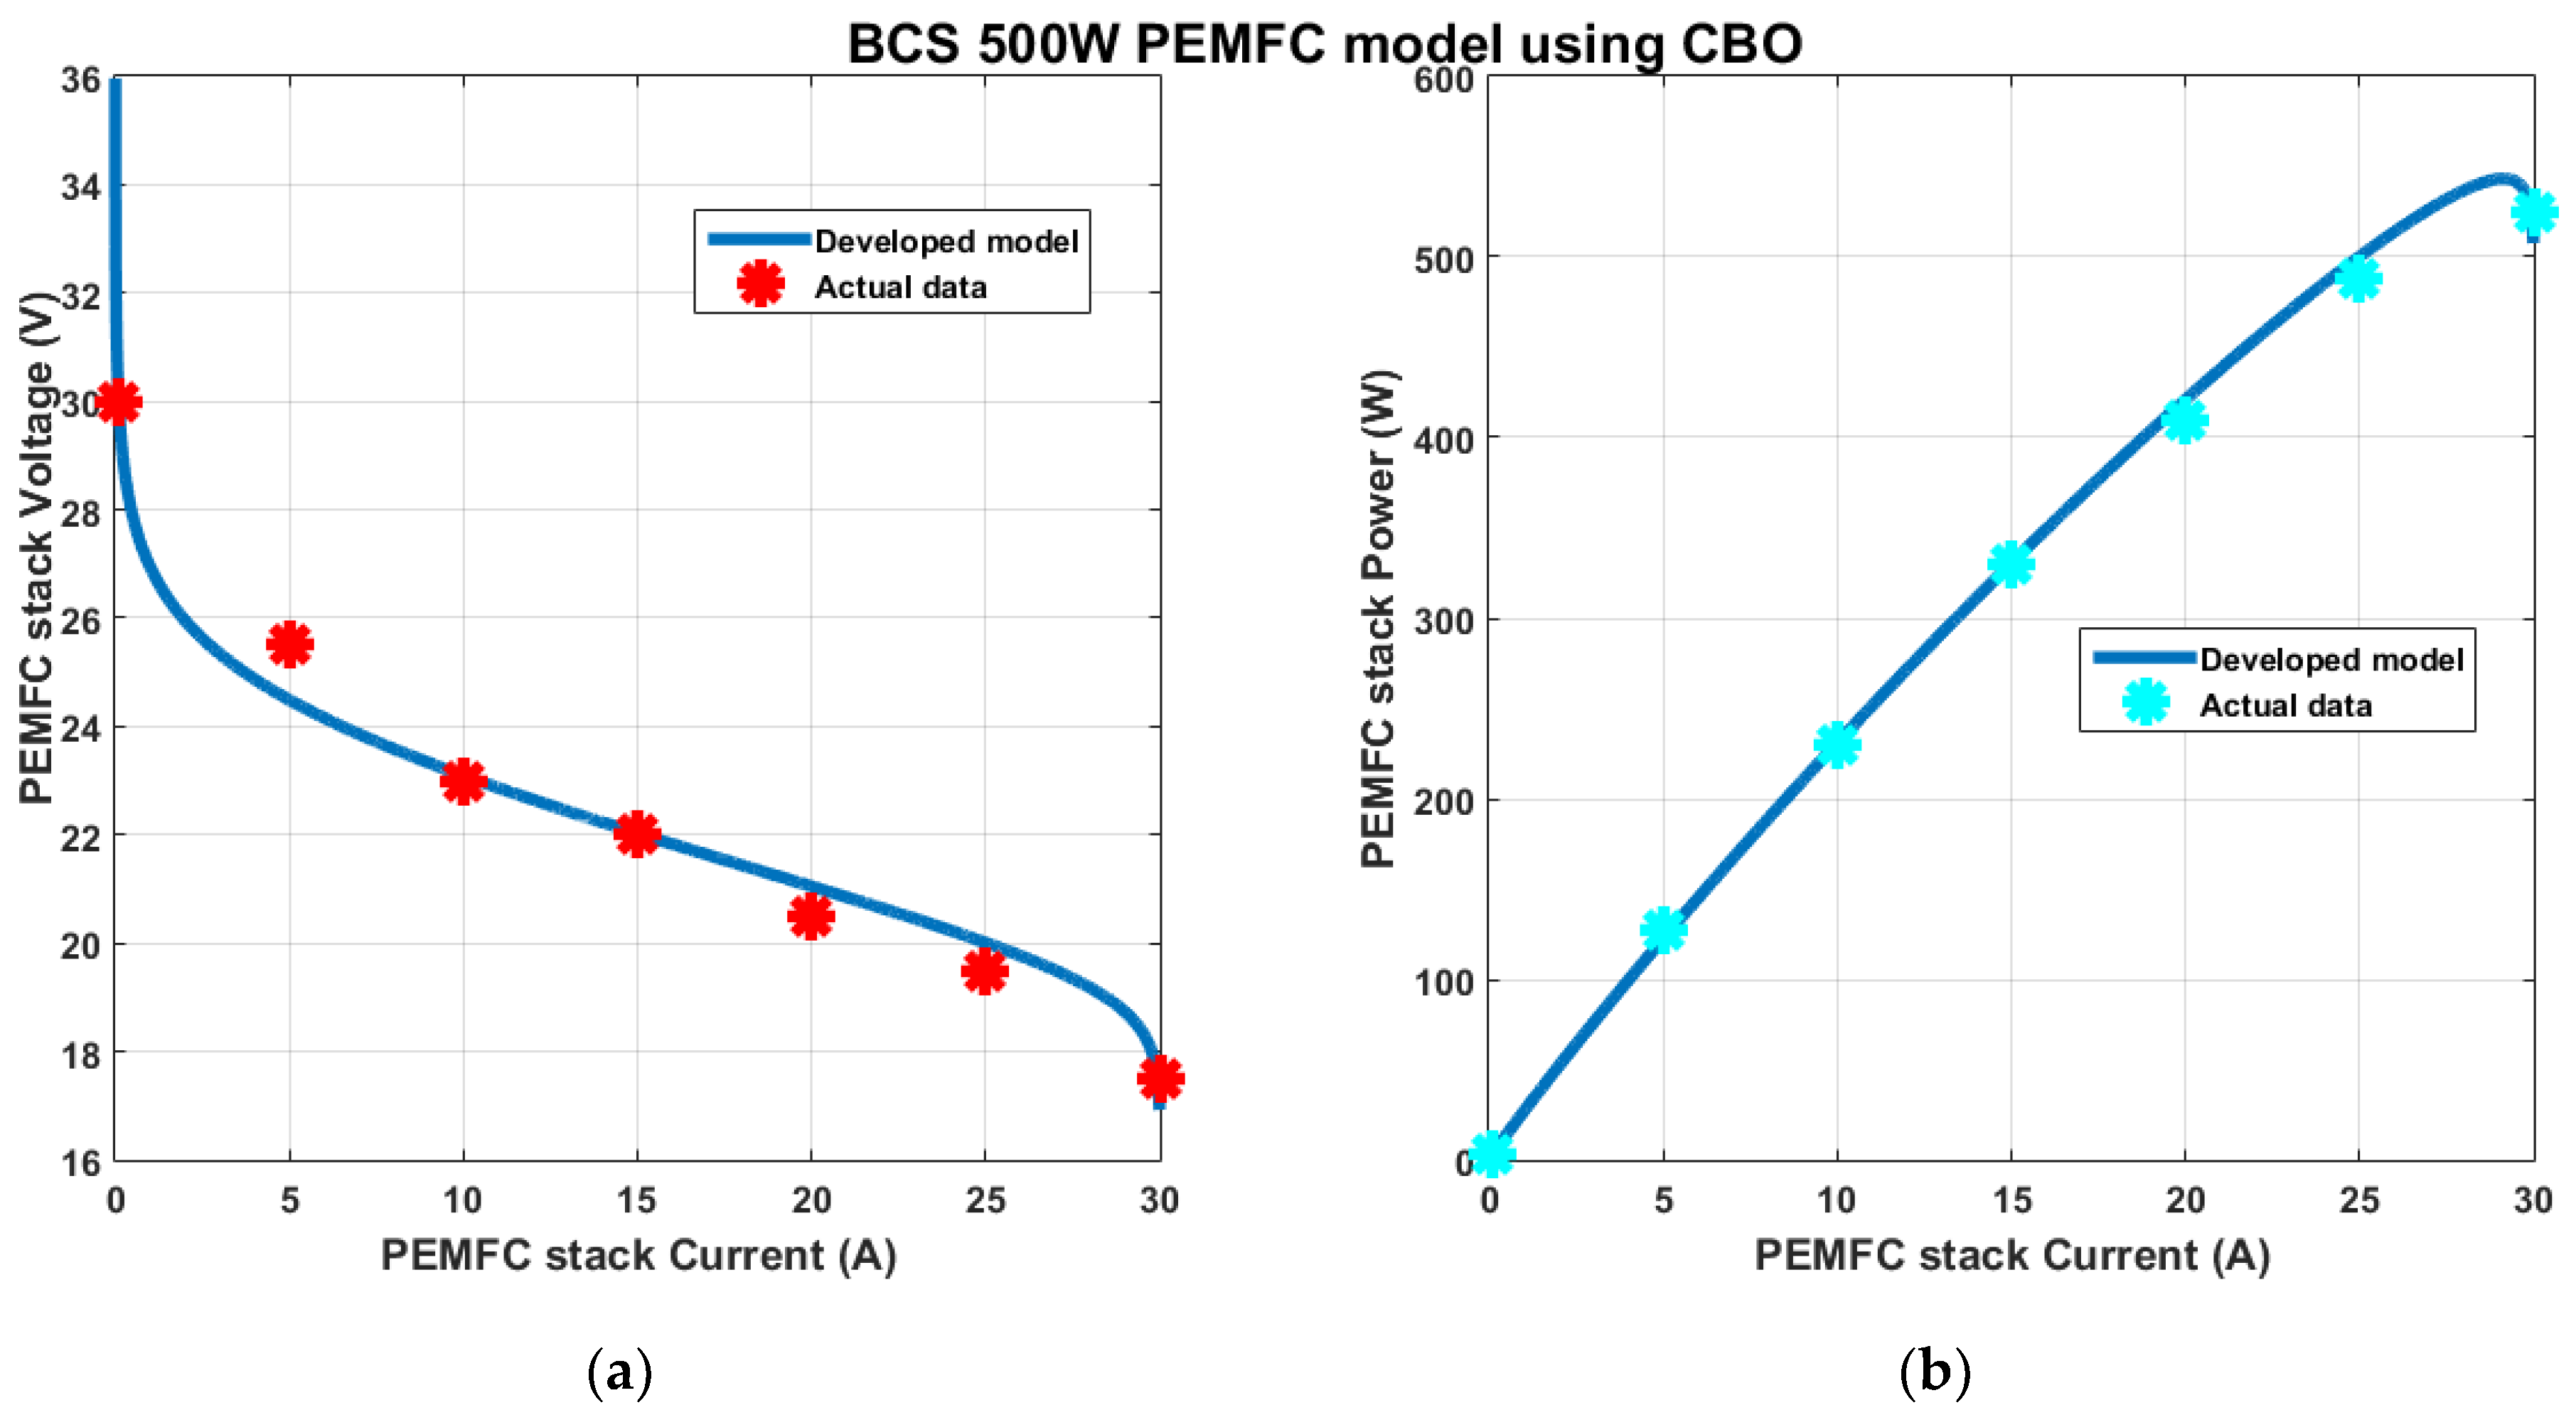
- The proposed technique was applied to model a variety of PEMFC devices under different operating conditions, namely the Ballard-Mark-V 5 kW, Nedstack-PS6 6 kW, 250 W PEMFC, Temasek 1 kW, SR-12-PEM 500 W, and BCS 500 W.
- The PEMFCs’ model parameters were accurately optimized for six PEMFC devices with minimum computational burden.
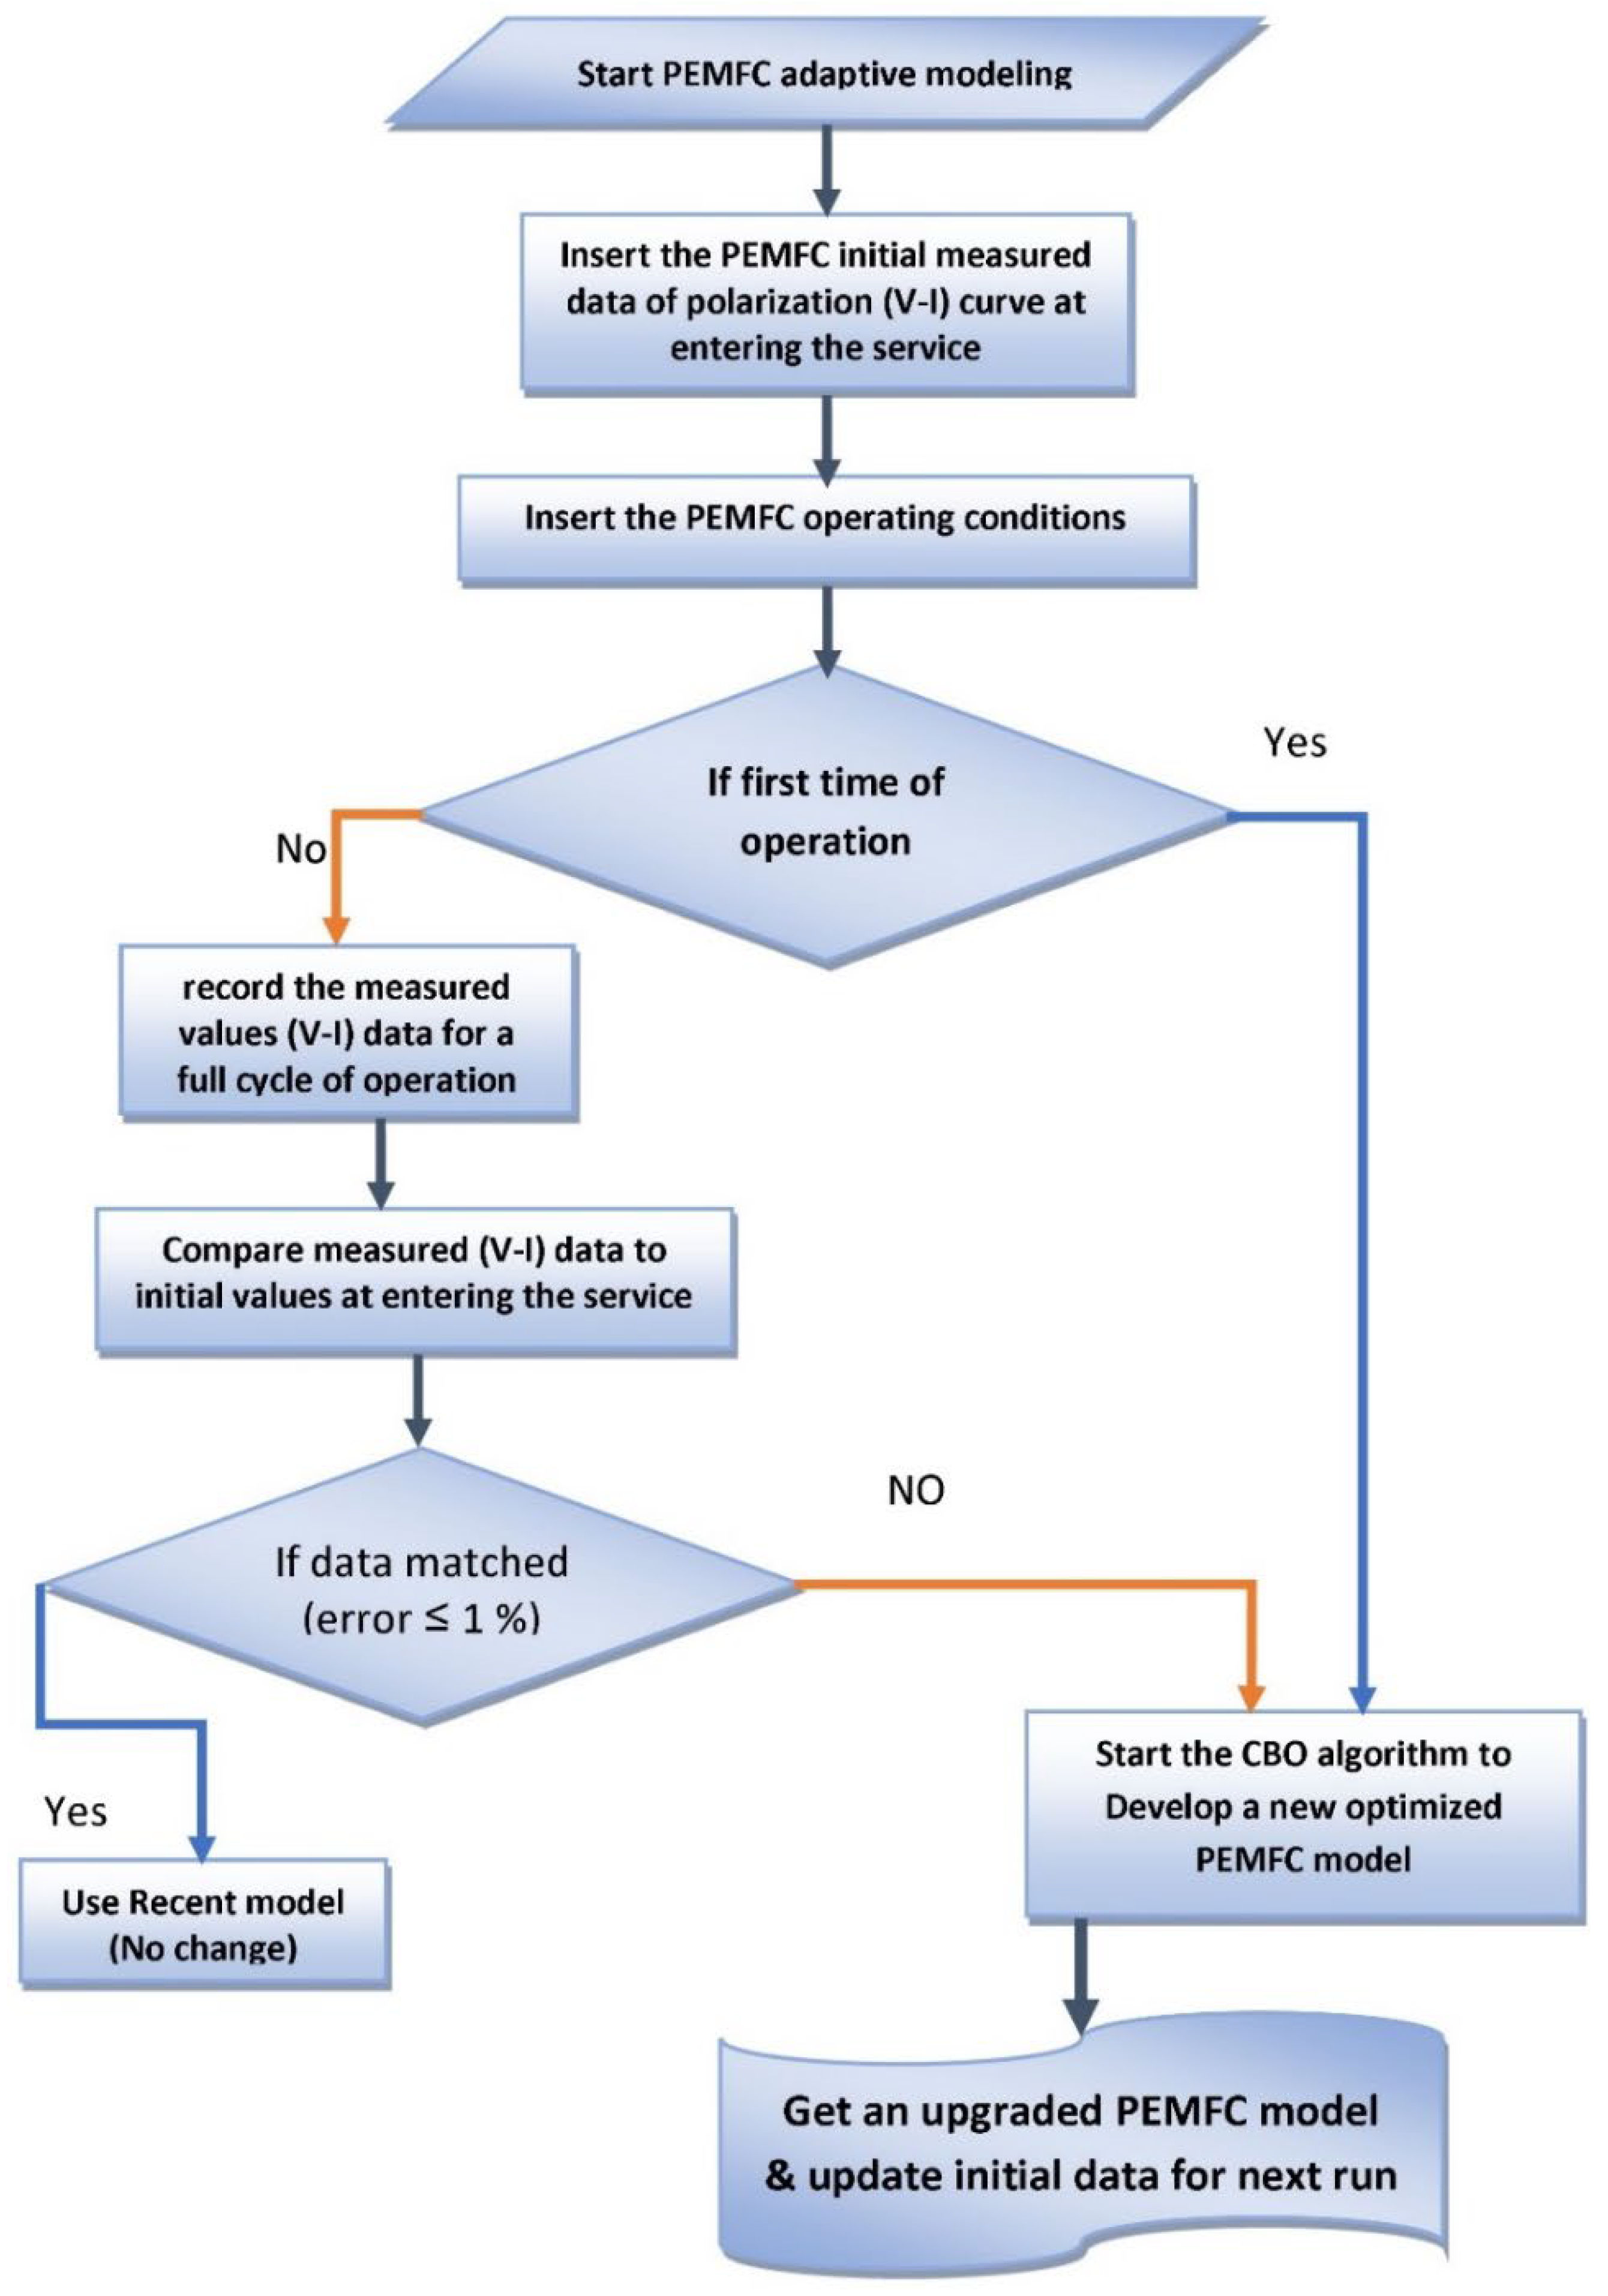
- The proposed adaptive modeling technique is capable of reflecting uncertainties in PEMFC performance due to degradation and changes in operating conditions.
2. Description of PEMFC Model
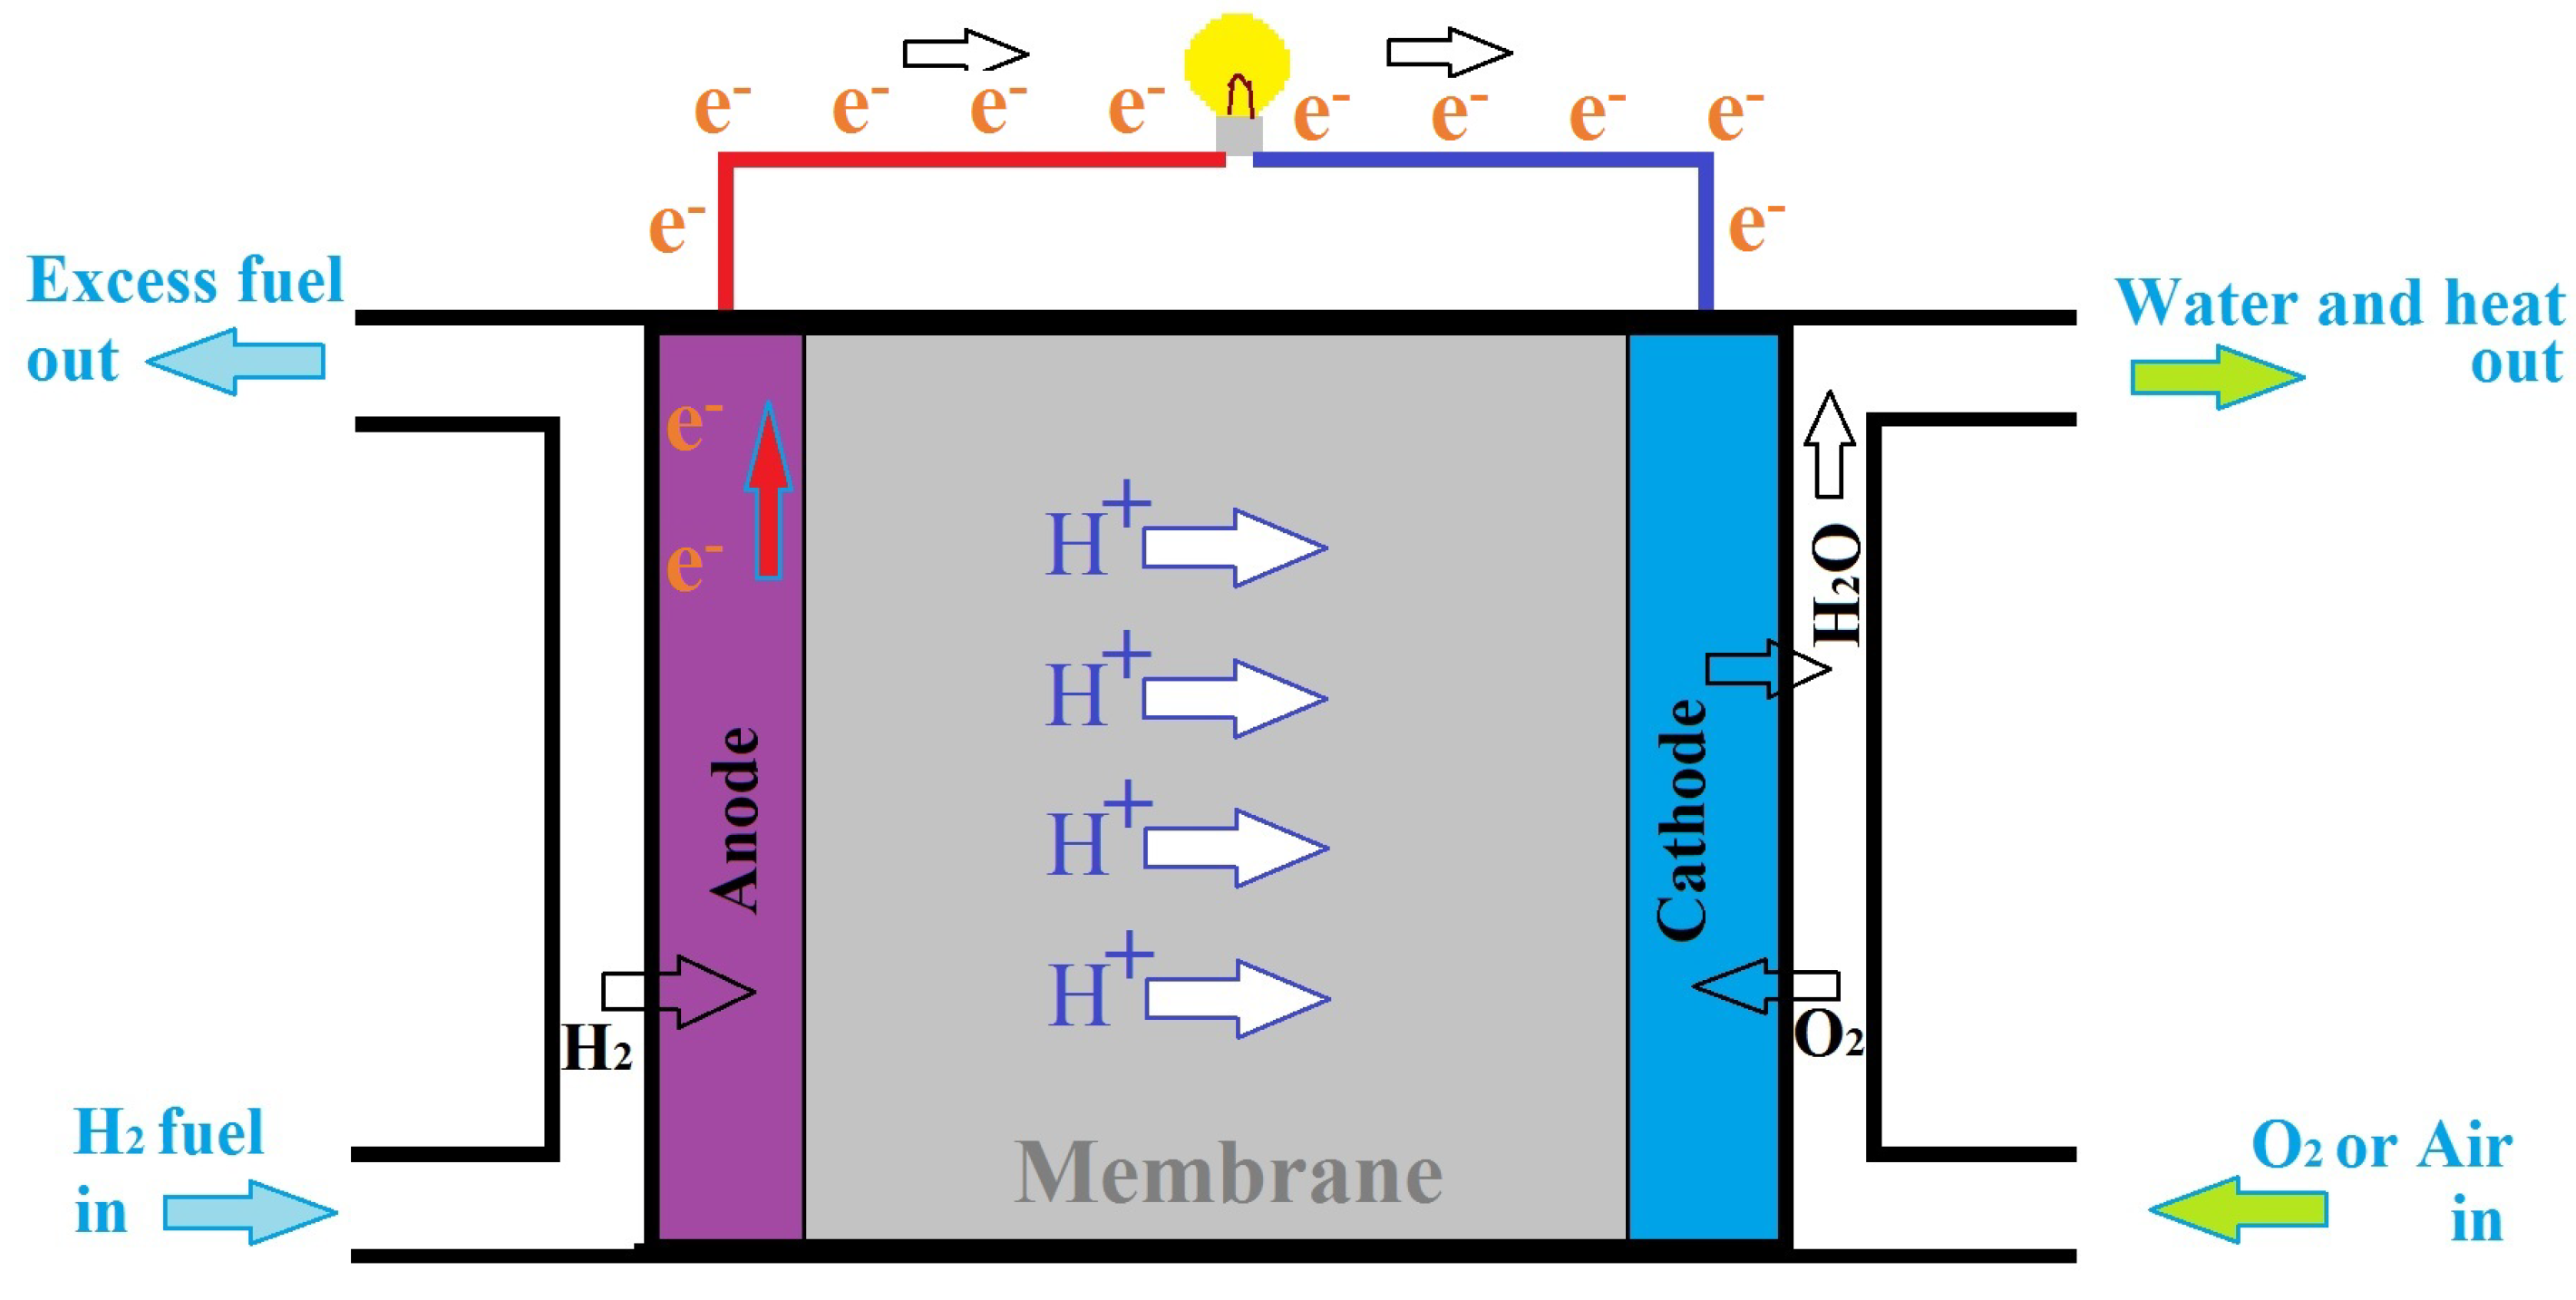
2.1. PEMFC Notion
2.2. PEMFC Quasi-Empirical Model
3. CBO Algorithm
3.1. CBO Inspiration
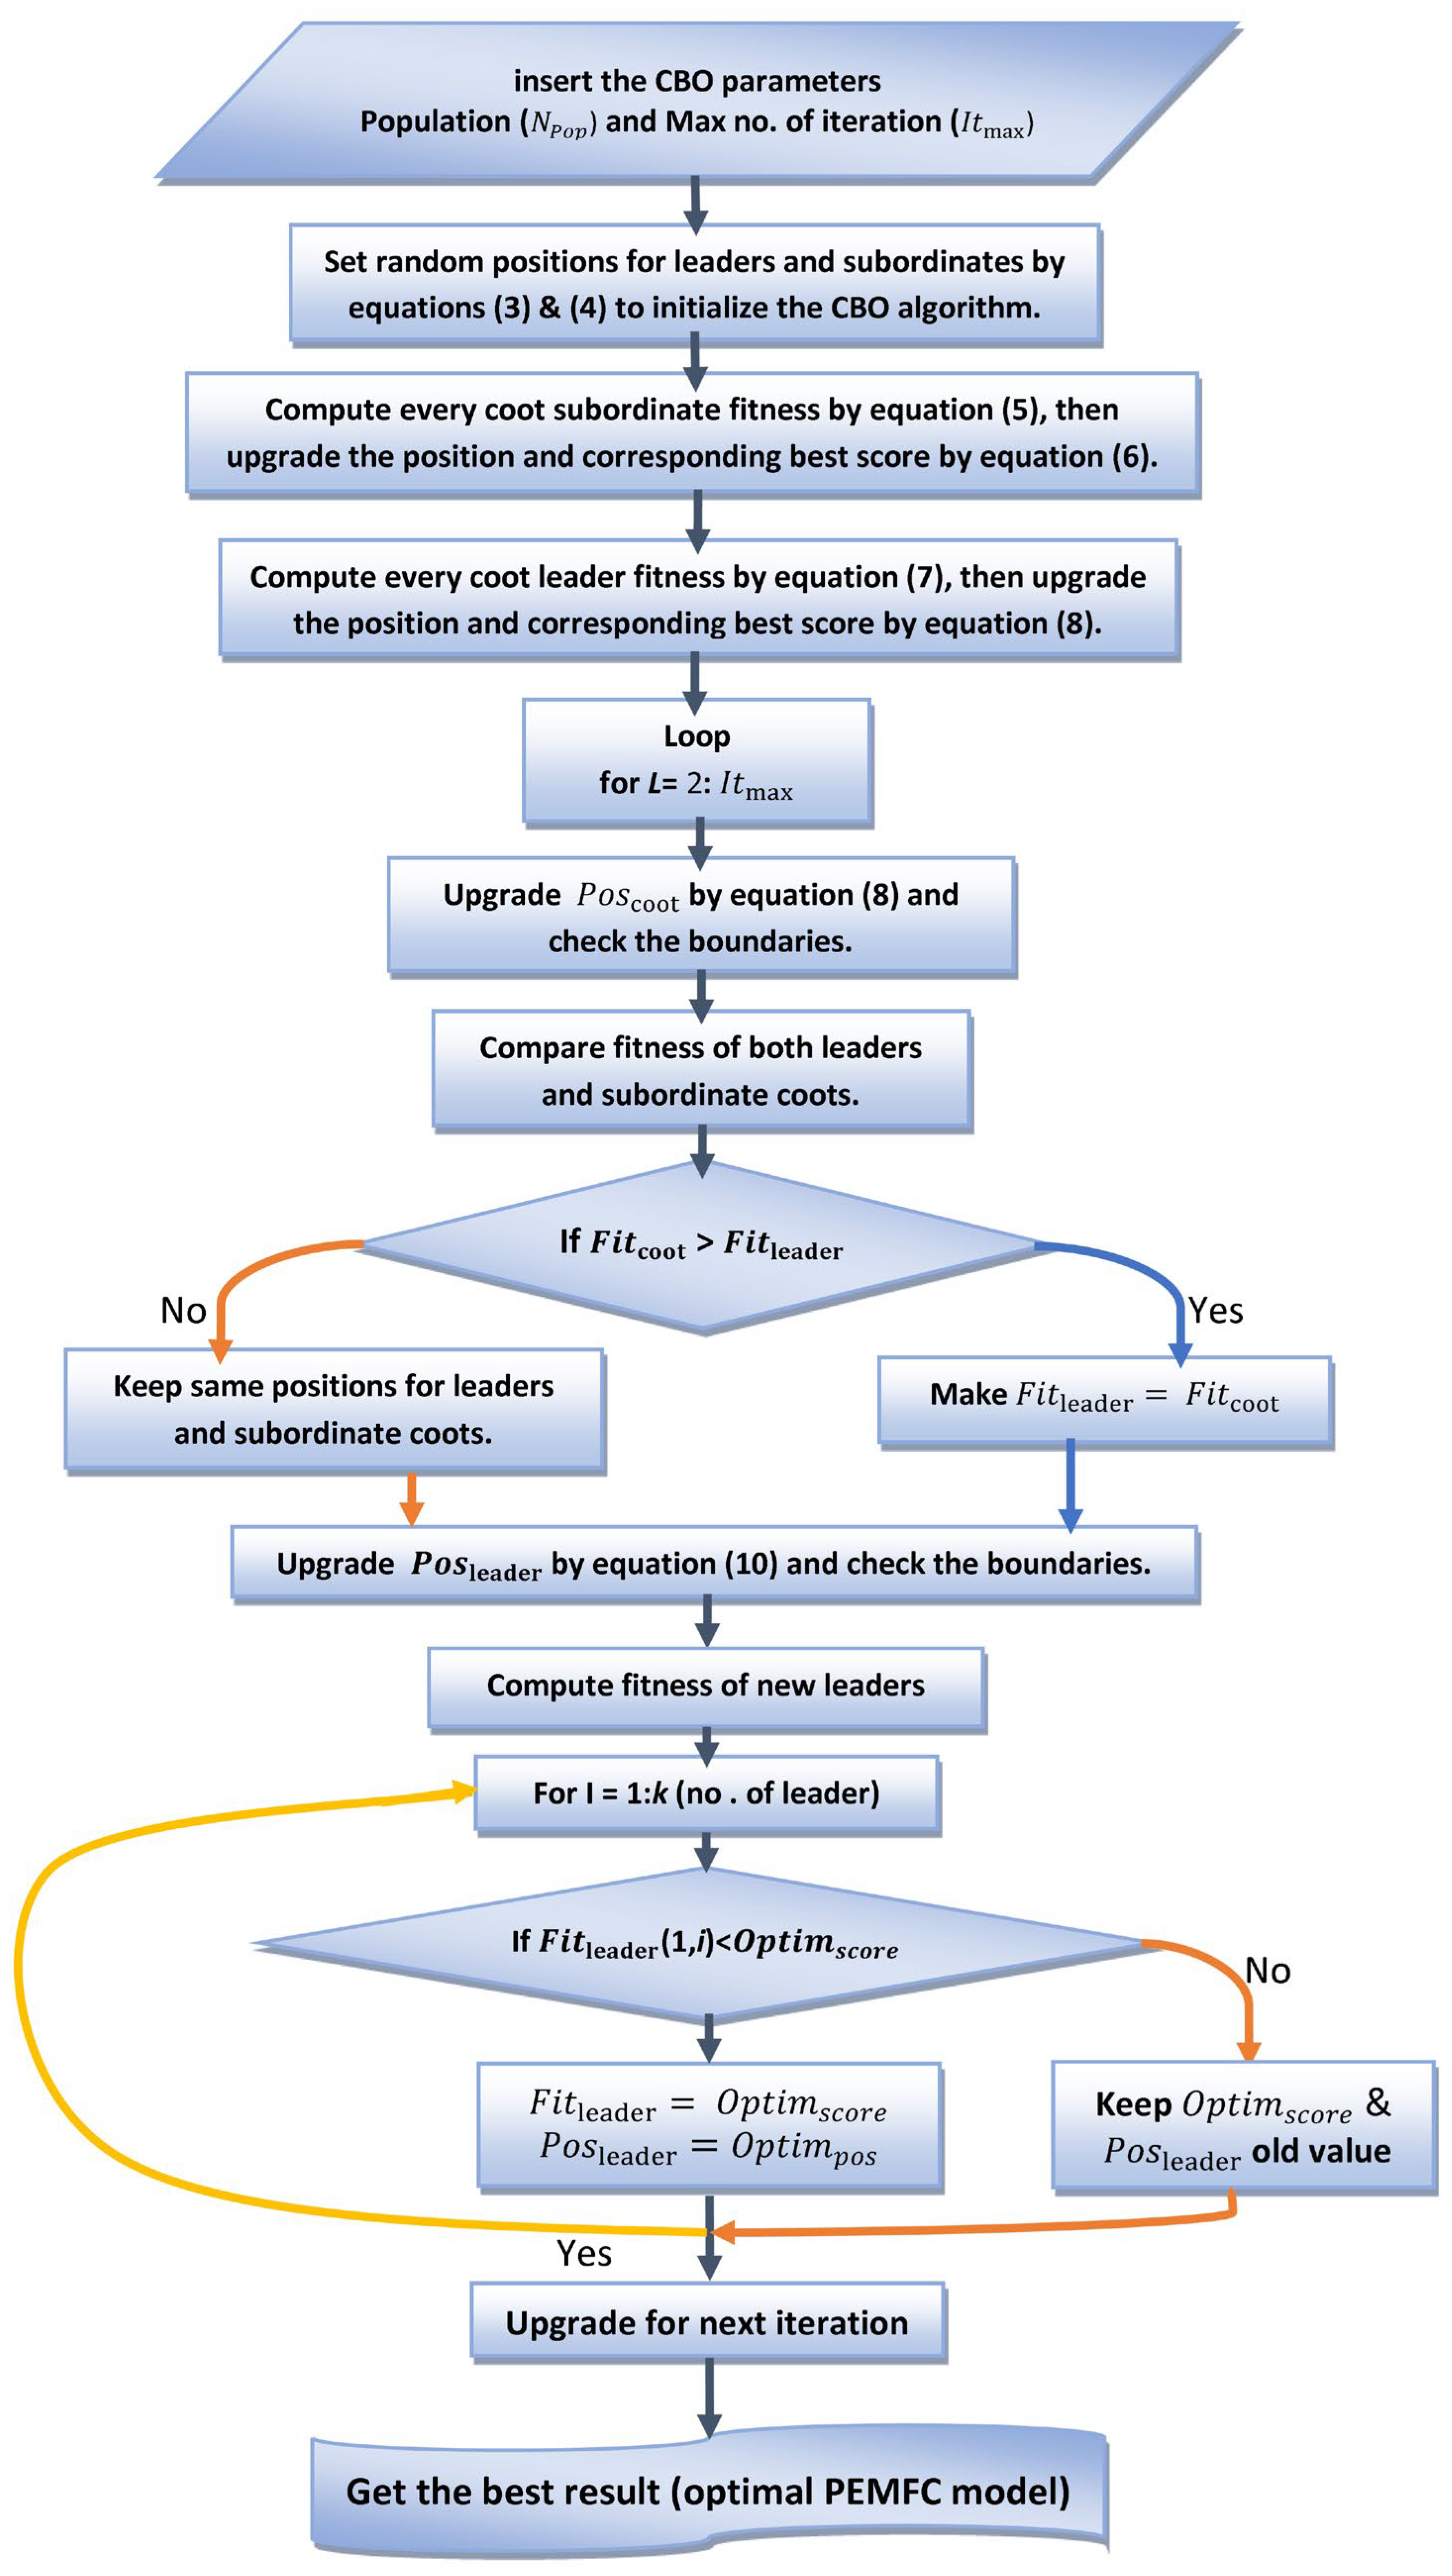
3.2. CBO Code
3.3. Objective Function Formulation
4. Cases Studies
5. Methodology and Result Discussions
6. Conclusions
Supplementary Materials
Author Contributions
Funding
Data Availability Statement
Conflicts of Interest
Nomenclature
| : | PEMFC output voltage | |
| : | Total number of cells in the PEMFC stack | |
| : | Nernst or reversible voltage | |
| : | PEMFC activation voltage | |
| : | PEMFC ohmic losses | |
| : | PEMFC concentration losses | |
| : | Partial pressure of hydrogen | |
| : | Partial pressure of oxygen | |
| : | Membrane water saturation pressure | |
| : | Operating temperature | |
| : | Relative humidity of vapor at anode | |
| : | Relative humidity of vapor at cathode | |
| : | PEMFC operating current | |
| : | PEMFC anode inlet pressure | |
| : | PEMFC cathode inlet pressure | |
| : | PEMFC membrane active area | |
| : | Parametric coefficients of the activation voltage of the PEMFC (i ϵ {1:4}) | |
| : | Concentration of oxygen | |
| : | Constant part of PEMFC membrane resistance | |
| : | Variable part membrane resistance | |
| : | PEMFC membrane saturation index | |
| : | Thickness of PEMFC membrane | |
| : | Specific membrane resistance | |
| : | Maximum current density | |
| : | Parametric coefficient | |
| : | Current density driven from the cell | |
| : | CBO total flock population | |
| : | CBO total number of flock leaders | |
| : | CBO total number of flock subordinate coots | |
| : | Initial random positions of coots | |
| : | Initial random positions of leaders | |
| : | Flock leaders’ positions | |
| : | Flock subordinate positions | |
| : | Problem upper boundary | |
| : | Problem lower boundary | |
| : | Fitness of each subordinate coot | |
| : | Fitness of each leader coot | |
| : | CBO fitness function of each coot | |
| : | Optimal score | |
| : | Optimal position | |
| : | Current iteration index | |
| : | Maximum number of iterations | |
| Optimization process objective function | ||
| : | Actual measured voltage of PEMFC stack | |
| : | Model-estimated voltage | |
| : | The number of data points of PEMFC characteristics |
References
- Kaur, G. PEM Fuel Cells: Fundamentals, Advanced Technologies, and Practical Application, 1st ed.; Elsevier: Amsterdam, The Netherlands, 2021; ISBN 9780128237083. [Google Scholar] [CrossRef]
- Dimitrova, Z.; Nader, W.B. PEM fuel cell as an auxiliary power unit for range extended hybrid electric vehicles. Energy 2022, 239, 121933. [Google Scholar] [CrossRef]
- Amphlett, J.C.; Baumert, R.M.; Mann, R.F.; Peppley, B.A.; Roberge, P.R.; Harris, T.J. Performance modeling of the Ballard mark-IV solid polymer electrolyte fuel cell. J. Electrochem. Soc. 1995, 142, 9–15. [Google Scholar] [CrossRef]
- Hoelzen, J.; Silberhorn, D.; Zill, T.; Bensmann, B.; Hanke-Rauschenbach, R. Hydrogen-powered aviation and its reliance on green hydrogen infrastructure—Review and research gaps. Int. J. Hydrogen Energy 2022, 47, 3108–3130. [Google Scholar] [CrossRef]
- Maden, T.; Şahin, M. Modeling of The PEM Type Fuel Cells. Turk. J. Mater. 2019, 4, 1–10. [Google Scholar]
- Fletcher, T.; Thring, R.; Watkinson, M. An Energy Management Strategy to concurrently optimise fuel consumption & PEM fuel cell lifetime in a hybrid vehicle. Int. J. Hydrogen Energy 2016, 41, 21503–21515. [Google Scholar] [CrossRef]
- Shah, S.A.; Najam, T.; Bashir, M.S.; Peng, L.; Nazir, M.A.; Javed, M.S. Single-atom catalysts for next-generation rechargeable batteries and fuel cells. Energy Storage Mater. 2022, 45, 301–322. [Google Scholar] [CrossRef]
- Singh, R.; Sui, P.; Wong, K.; Kjeang, E.; Knights, S.; Djilali, N. Modeling the effect of chemical membrane degradation on pemfc performance. J. Electrochem. Soc. 2018, 165, 3328–3336. [Google Scholar] [CrossRef]
- Najam, T.; Shah, S.A.; Ibraheem, S.; Cai, X.; Hussain, E.; Suleman, S.; Javed, M.S.; Tsiakaras, P. Single-atom catalysis for zinc-air/O2 batteries, water electrolyzers and fuel cells applications. Energy Storage Mater. 2022, 45, 504–540. [Google Scholar] [CrossRef]
- Javed, M.S.; Zhang, X.; Ali, S.; Abdul Mateen Idrees, M.; Sajjad, M.; Batool, S.; Ahmad, A.; Imran, M.; Najam, T.; Han, W. Heterostructured bimetallic–sulfide@layered Ti3C2Tx–MXene as a synergistic electrode to realize high-energy-density aqueous hybrid-supercapacitor. Nano Energy 2022, 101, 107624. [Google Scholar] [CrossRef]
- Javed, M.S.; Shaheen, N.; Hussain, S.; Li, J.; Shah, S.; Abbas, Y.; Ahmad, M.; Raza, R.; Mai, W. An ultra-high energy density flexible asymmetric supercapacitor based on hierarchical fabric decorated with 2D bimetallic oxide nanosheets and MOF-derived porous carbon polyhedral. J. Mater. Chem. A 2019, 7, 956–957. [Google Scholar] [CrossRef]
- Dannenberg, K.; Ekdunge, P.; Lindbergh, G. Mathematical model of the PEMFC. J. Appl. Electrochem. 2000, 30, 1377–1387. [Google Scholar] [CrossRef]
- Jiang, M.; Meng, X.; Zhang, W.; Huang, H.; Wang, F.; Wang, S.; Ouyang, Y.; Yuan, W.; Zhang, L. Facile synthesis of heterophase sponge-like Pd toward enhanced formic acid oxidation. Electrochem. Commun. 2021, 126, 107004. [Google Scholar] [CrossRef]
- Yang, Q.; Lin, H.; Wang, X.; Zhang, L.; Jing, M.; Yuan, W.; Li, C. Dynamically self-assembled adenine-mediated synthesis of pristine graphene-supported clean Pd nanoparticles with superior electrocatalytic performance toward formic acid oxidation. J. Colloid Interface Sci. 2022, 613, 515–523. [Google Scholar] [CrossRef] [PubMed]
- Fan, X.; Yuan, W.; Zhang, D.; Li, C. Heteropolyacid-Mediated Self-Assembly of Heteropolyacid-Modified Pristine Graphene Supported Pd Nanoflowers for Superior Catalytic Performance toward Formic Acid Oxidation. ACS Appl. Energy Mater. 2018, 1, 411–420. [Google Scholar] [CrossRef]
- Xing, Y.; Costa-Castelló, R.; Na, J.; Renaudineau, H. Control-oriented modelling and analysis of a solid oxide fuel cell system. Int. J. Hydrogen Energy 2020, 45, 20659–20672. [Google Scholar] [CrossRef]
- Priya, K.; Rajasekar, N. Application of flower pollination algorithm for enhanced proton exchange membrane fuel cell modelling. Int. J. Hydrogen Energy 2019, 44, 18438–18449. [Google Scholar] [CrossRef]
- Seleem, S.I.; Hasanien, H.M.; El-Fergany, A.A. Equilibrium optimizer for parameter extraction of a fuel cell dynamic model. Renew. Energy 2021, 169, 117–128. [Google Scholar] [CrossRef]
- Turgut, O.E.; Coban, M.T. Optimal proton exchange membrane fuel cell modelling based on hybrid Teaching Learning Based Optimization-Differential Evolution algorithm. Ain Shams Eng. J. 2016, 7, 347–360. [Google Scholar] [CrossRef]
- Jia, J.; Li, Q.; Wang, Y.; Cham, Y.; Han, M. Modeling and dynamic characteristic simulation of a Proton Exchange Membrane Fuel Cell. IEEE Trans. Energy Convers. 2009, 24, 283–291. [Google Scholar] [CrossRef]
- Ali, M.; El-Hameed, M.A.; Farahat, M.A. Effective parameters’ identification for polymer electrolyte membrane fuel cell models using grey wolf optimizer. Renew. Energy 2017, 111, 455–462. [Google Scholar] [CrossRef]
- Yang, B.; Wang, J.; Yu, L.; Shu, H.; Yu, T.; Zhang, X.; Yao, W.; Sun, L. A critical survey on proton exchange membrane fuel cell parameter estimation using meta-heuristic algorithms. J. Clean. Prod. 2020, 265, 121660. [Google Scholar] [CrossRef]
- Mo, Z.; Zhu, X.; Wei, L.; Cao, G. Parameter optimization for a PEMFC model with a hybrid genetic algorithm. Int. J. Energy Res. 2006, 30, 585–597. [Google Scholar] [CrossRef]
- Ohenoja, M.; Leiviskä, K. Validation of genetic algorithm results in a fuel cell model. Int. J. Hydrogen Energy 2010, 35, 12618–12625. [Google Scholar] [CrossRef]
- Zhang, L.; Wang, N. An adaptive RNA genetic algorithm for modeling of proton exchange membrane fuel cells. Int. J. Hydrogen Energy 2013, 38, 219–228. [Google Scholar] [CrossRef]
- Ye, M.; Wang, X.; Xu, Y. Parameter identification for proton exchange membrane fuel cell model using particle swarm optimization. Int. J. Hydrogen Energy 2009, 34, 981–989. [Google Scholar] [CrossRef]
- Gong, W.; Yan, X.; Liu, X.; Cai, Z. Parameter extraction of different fuel cell models with transferred adaptive differential evolution. Energy 2015, 86, 139–151. [Google Scholar] [CrossRef]
- Fathy, A.; Abd Elaziz, M.; Alharbi, A.G. A novel approach based on hybrid vortex search algorithm and differential evolution for identifying the optimal parameters of PEM fuel cell. Renew. Energy 2020, 146, 1833–1845. [Google Scholar] [CrossRef]
- Yang, S.; Wang, N. A novel P system based optimization algorithm for parameter estimation of proton exchange membrane fuel cell model. Int. J. Hydrogen Energy 2012, 37, 8465–8476. [Google Scholar] [CrossRef]
- Askarzadeh, A.; Rezazadeh, A. A grouping-based global harmony search algorithm for modeling of proton exchange membrane fuel cell. Int. J. Hydrogen Energy 2011, 36, 5047–5053. [Google Scholar] [CrossRef]
- Niu, Q.; Zhang, H.; Li, K. An improved TLBO with elite strategy for parameters identification of PEM fuel cell and solar cell models. Int. J. Hydrogen Energy 2014, 39, 3837–3854. [Google Scholar] [CrossRef]
- Guarnieri, M.; Negro, E.; Noto, V.D.; Alotto, P. A selective hybrid stochastic strategy for fuel-cell multi-parameter identification. J. Power Sources 2016, 332, 249–264. [Google Scholar] [CrossRef]
- El-Fergany, A.A. Extracting optimal parameters of PEM fuel cells using Salp Swarm Optimizer. Renew. Energy 2018, 119, 641–648. [Google Scholar] [CrossRef]
- Rao, Y.; Shao, Z.; Ahangarnejad, A.H.; Gholamalizadeh, E.; Sobhani, B. Shark Smell Optimizer applied to identify the optimal parameters of the proton exchange membrane fuel cell model. Energy Convers. Manag. 2019, 182, 1–8. [Google Scholar] [CrossRef]
- Yang, B.; Zeng, C.; Wang, L.; Guo, Y.; Chen, G.; Guo, Z.; Chen, Y.; Li, D.; Cao, P.; Shu, H.; et al. Parameter identification of proton exchange membrane fuel cell via Levenberg-Marquardt backpropagation algorithm. Int. J. Hydrogen Energy 2021, 46, 22998–23012. [Google Scholar] [CrossRef]
- Yang, B.; Li, D.; Zeng, C.; Chen, Y.; Guo, Z.; Wang, J.; Shu, H.; Yu, T.; Zhu, J. Parameter extraction of PEMFC via Bayesian regularization neural network based meta-heuristic algorithms. Energy 2021, 228, 120592. [Google Scholar] [CrossRef]
- Legala, A.; Zhao, J.; Li, X. Machine learning modeling for proton exchange membrane fuel cell performance. Energy AI 2022, 10, 100183. [Google Scholar] [CrossRef]
- Qin, F.; Liu, P.; Niu, H.; Song, H.; Yousefi, N. Parameter estimation of PEMFC based on Improved Fluid Search Optimization Algorithm. Energy Rep. 2020, 6, 1224–1232. [Google Scholar] [CrossRef]
- Yakout, A.H.; Hasanien, H.M.; Kotb, H. Proton Exchange Membrane Fuel Cell Steady State Modeling Using Marine Predator Algorithm Optimizer. Ain Shams Eng. J. 2021, 12, 3765–3774. [Google Scholar] [CrossRef]
- Ćalasan, M.; Abdel Aleem, S.; Hasanien, H.M.; Alaas, Z.M.; Ali, Z.M. An innovative approach for mathematical modeling and parameter estimation of PEM fuel cells based on iterative Lambert W function. Energy 2023, 264, 126165. [Google Scholar] [CrossRef]
- Wilberforce, T.; Rezk, H.; Olabi, A.G.; Epelle, E.I.; Abdelkareem, M.A. Comparative analysis on parametric estimation of a PEM fuel cell using metaheuristics algorithms. Energy 2023, 262 Pt B, 125530. [Google Scholar] [CrossRef]
- Wolpert, D.H.; Macready, W.G. No free lunch theorems for optimization. IEEE Trans. Evol. Comput. 1997, 1, 67–82. [Google Scholar] [CrossRef]
- Naruei, I.; Keynia, F. A new optimization method based on COOT bird natural life model. Expert Syst. Appl. 2021, 183, 115352. [Google Scholar] [CrossRef]
- Lyon, B.E.; Shizuka, D. Extreme offspring ornamentation in American coots is favored by selection within families, not benefits to conspecific brood parasites. Proc. Natl. Acad. Sci. USA 2020, 117, 2056–2064. [Google Scholar] [CrossRef] [PubMed]
- Salaia, K.E.; Mansouri, I.; Squalli, W.; El Hassani, A.; Dakki, M.; Zine, N.E. Nesting features and breeding chronology of the crested coot (Fulica cristata) in two North African high altitude wetlands. J. Anim. Behav. Biometeorol. 2021, 9, e2129. [Google Scholar] [CrossRef]
- Gouda, E.A.; Kotb, M.F.; Ghoneim, S.S.M.; Al-Harthi, M.M.; El-Fergany, A.A. Performance assessment of solar generating units based on coot bird metaheuristic optimizer. IEEE Access 2021, 9, 111616–111632. [Google Scholar] [CrossRef]
- Mohammad, H.; Nadimi-Shahraki Taghian, S.; Mirjalili, S.; Faris, H. MTDE: An effective multi-trial vector-based differential evolution algorithm and its applications for engineering design problems. Appl. Soft Comput. 2020, 97 Pt A, 106761. [Google Scholar] [CrossRef]
- Mirjalili, S. The ant lion optimizer. Adv. Eng. Softw. 2015, 83, 80–98. [Google Scholar] [CrossRef]
- Mirjalili, S. Dragonfly algorithm: A new meta-heuristic optimization technique for solving single-objective, discrete, and multi-objective problems. Neural Comput. Appl. 2015, 27, 1053–1073. [Google Scholar] [CrossRef]
- Zhao, W.; Wang, L.; Zhang, Z. Atom search optimization and its application to solve a hydrogeologic parameter estimation problem. Knowl.-Based Syst. 2019, 163, 283–304. [Google Scholar] [CrossRef]
- Saremi, S.; Mirjalili, S.; Lewis, A. Grasshopper Optimisation Algorithm: Theory and application. Adv. Eng. Softw. 2017, 105, 30–47. [Google Scholar] [CrossRef]
- Mohammad, H.; Nadimi-Shahraki Taghian, S.; Mirjalili, S. An improved grey wolf optimizer for solving engineering problems. Expert Syst. Appl. 2021, 166, 113917. [Google Scholar] [CrossRef]
- Faramarzi, A.; Heidarinejad, M.; Mirjalili, S.; Gandomi, A.H. Marine Predators Algorithm: A nature-inspired metaheuristic. Expert Syst. Appl. 2020, 152, 113377. [Google Scholar] [CrossRef]
- Matlab (R2020a) Is a Product of the MathWorks. Available online: http://www.mathworks.com (accessed on 5 January 2023).
- IBM SPSS (Version 22) Is a Product of the IBM Corporation. Available online: http://www.ibm.com/analytics/us/en/technology/spss/ (accessed on 9 January 2023).


| Model Parameter | |||||||
|---|---|---|---|---|---|---|---|
| Lower boundary | −1.1997 | 0.001 | 3.6 × 10⁻⁵ | −2.6 × 10⁻⁴ | 10 | 0.0001 | 0.0136 |
| Upper boundary | −0.8532 | 0.005 | 9.8 × 10⁻⁵ | −9.54 × 10⁻⁵ | 24 | 0.0008 | 0.5 |
| Stack Parameters | Operation Ranges | ||
|---|---|---|---|
| Number of cells in series | 24 | Inlet anode pressure (bar) | 1–3 |
| Cell’s active area A () | 27 | Inlet cathode pressure (bar) | 1–5 |
| Nafion 115:5 mil l (μm) | 127 | Stack temperature T (K) | 353.15–343.15 |
| Maximum current density () | 860 | Relative humidity in anode | 1 |
| Rated power (W) | 250 | Relative humidity in cathode | 1 |
| Stack Type | Ballard-Mark-V 5 kW [21,35] | Nedstack-PS6 6 kW [18,33] | Temasek 1 kW [21,39] | SR-12 PEM 500 W [20,28] | BCS 500 W [28,33] |
|---|---|---|---|---|---|
| Number of cells | 35 | 65 | 20 | 48 | 32 |
| Cell’s active area A () | 232 | 240 | 150 | 62.5 | 64 |
| Nafion 115:5 mil l (μm) | 178 | 178 | 51 | 25 | 178 |
| Max current density () | 1500 | 1200 | 1500 | 672 | 469 |
| Stack temperature T (K) | 343 | 343 | 323 | 323 | 333 |
| Hydrogen pressure () | 1 | 0.5–5 | 0.5 | 1.47628 | 1 |
| Oxygen pressure () | 1 | 0.5–5 | 0.5 | 0.2095 | 0.2095 |
| Algorithm | Fitness | AV_Time b | |||||||
|---|---|---|---|---|---|---|---|---|---|
| CBO [43] | 0.84042 | 0.38 | −0.8593 | 0.0032844 | 9.80 × 10⁻⁵ | −9.54 × 10⁻⁵ | 24 | 0.0001 | 0.0136 |
| IGWO [52] | 1.0006 | 0.95 | −0.85321 | 0.0032678 | 9.799 × 10⁻⁵ | −9.541 × 10⁻⁵ | 24 | 0.0001 | 0.013602 |
| GOA [51] | 1.0897 | 5.32 | −1.14622 | 0.00379843 | 8.06 × 10⁻⁵ | −9.54 × 10⁻⁵ | 24 | 0.0001 | 0.0136 |
| MPA [53] | 1.1415 | 0.8 | −0.93466 | 0.0034948 | 9.80 × 10⁻⁵ | −9.54 × 10⁻⁵ | 24 | 0.0001 | 0.0136 |
| MTDE [47] | 1.1531 | 3.8 | −1.061 | 0.0038525 | 9.80 × 10⁻⁵ | −9.54 × 10⁻⁵ | 24 | 0.0001 | 0.0136 |
| DA [49] | 1.1655 | 33.24 | −0.8532 | 0.00326576 | 9.80 × 10⁻⁵ | −9.54 × 10⁻⁵ | 24 | 0.0001 | 0.0136 |
| ALO [48] | 1.1659 | 2.75 | −0.87109 | 0.00303416 | 8.16 × 10⁻⁵ | −9.54 × 10⁻⁵ | 24 | 0.0001 | 0.0136 |
| ASO [50] | 1.3483 | 0.72 | −1.00738 | 0.00318212 | 6.75 × 10⁻⁵ | −9.54 × 10⁻⁵ | 23.72 | 0.0005574 | 0.014613 |
| VSDE [28] | 1.0526 | NR a | −1.1921 | 3.199 × 10⁻³ | 3.79 × 10⁻⁵ | 1.870 × 10⁻⁴ | 22.81 | 1.202 × 10⁻⁴ | 0.02903 |
| TLBO-DE [19] | 7.2776 | NR a | −0.8532 | 2.6505 × 10⁻³ | 8.0016 × 10⁻⁵ | −1.360 × 10⁻⁴ | 15.65 | 1.0000 × 10⁻⁴ | 0.0364 |
| QPSO [21] | 7.2776 | NR a | −0.8569 | 2.5665 × 10⁻³ | 7.2708 × 10⁻⁵ | −1.303 × 10⁻⁴ | 13.54 | 3.9173 × 10⁻⁴ | 0.0299 |
| ITHS [31] | 7.5798 | NR a | −0.9228 | 2.7348 × 10⁻³ | 7.0967 × 10⁻⁵ | −1.426 × 10⁻⁴ | 16.52 | 1.0091 × 10⁻⁴ | 0.0362 |
| Sa-DE [31] | 7.6276 | NR a | −0.8534 | 2.5846 × 10⁻³ | 7.5880 × 10⁻⁵ | −1.154 × 10⁻⁴ | 12.6 | 1.0000 × 10⁻⁴ | 0.0329 |
| STLBO [31] | 7.6426 | NR a | −0.8532 | 2.5843 | 7.6892 × 10⁻⁵ | −1.154 × 10⁻⁴ | 12.6 | 1.0000 × 10⁻⁴ | 0.0329 |
| BIPOA [29] | 7.9416 | NR a | −0.8016 | 2.6673 × 10⁻³ | 8.1288 × 10⁻⁵ | −1.271 × 10⁻⁴ | 13.51 | 0.80 | 0.0324 |
| ARNA-GA [25] | 8.1039 | NR a | −0.8806 | 2.9450 × 10⁻³ | 8.4438 × 10⁻⁵ | −1.288 × 10⁻⁴ | 13.48 | 1.0068 × 10⁻⁴ | 0.0316 |
| RGA [24] | 8.4854 | NR a | −1.1568 | 3.4243 × 10⁻³ | 6.4161 × 10⁻⁵ | −1.154 × 10⁻⁴ | 12.89 | 1.4504 × 10⁻⁴ | 0.0343 |
| MPSO [21] | 9.7539 | NR a | −0.9479 | 3.0835 × 10⁻³ | 7.7990 × 10⁻⁵ | −1.880 × 10⁻⁴ | 20.76 | 2.8666 × 10⁻⁴ | 0.0296 |
| Algorithm | Best Fitness (min. Obj) | Stand. Deviation | Average | Median | Worst Fitness (Max. Obj) | Variance | Average Elapsed Time |
|---|---|---|---|---|---|---|---|
| ASO [50] | 1.3483 | 2.9229 | 4.8585 | 4.1624 | 18.323 | 8.6297 | 0.7278 |
| ALO [48] | 1.1659 | 0.008722 | 1.176198 | 1.17455 | 1.1937 | 7.684 × 10⁻⁵ | 2.75704 |
| DA [49] | 1.1655 | 1.206342 | 1.390042 | 1.1773 | 11.7925 | 2.253582 | 33.24938 |
| MTDE [47] | 1.1531 | 1.99 × 10⁻¹⁵ | 1.1531 | 1.1531 | 1.1531 | 4.03 × 10⁻³⁰ | 4.14063 |
| MPA [53] | 1.1415 | 1.11 × 10⁻¹⁵ | 1.1415 | 1.1415 | 1.1415 | 1.245 × 10⁻³⁰ | 0.8052 |
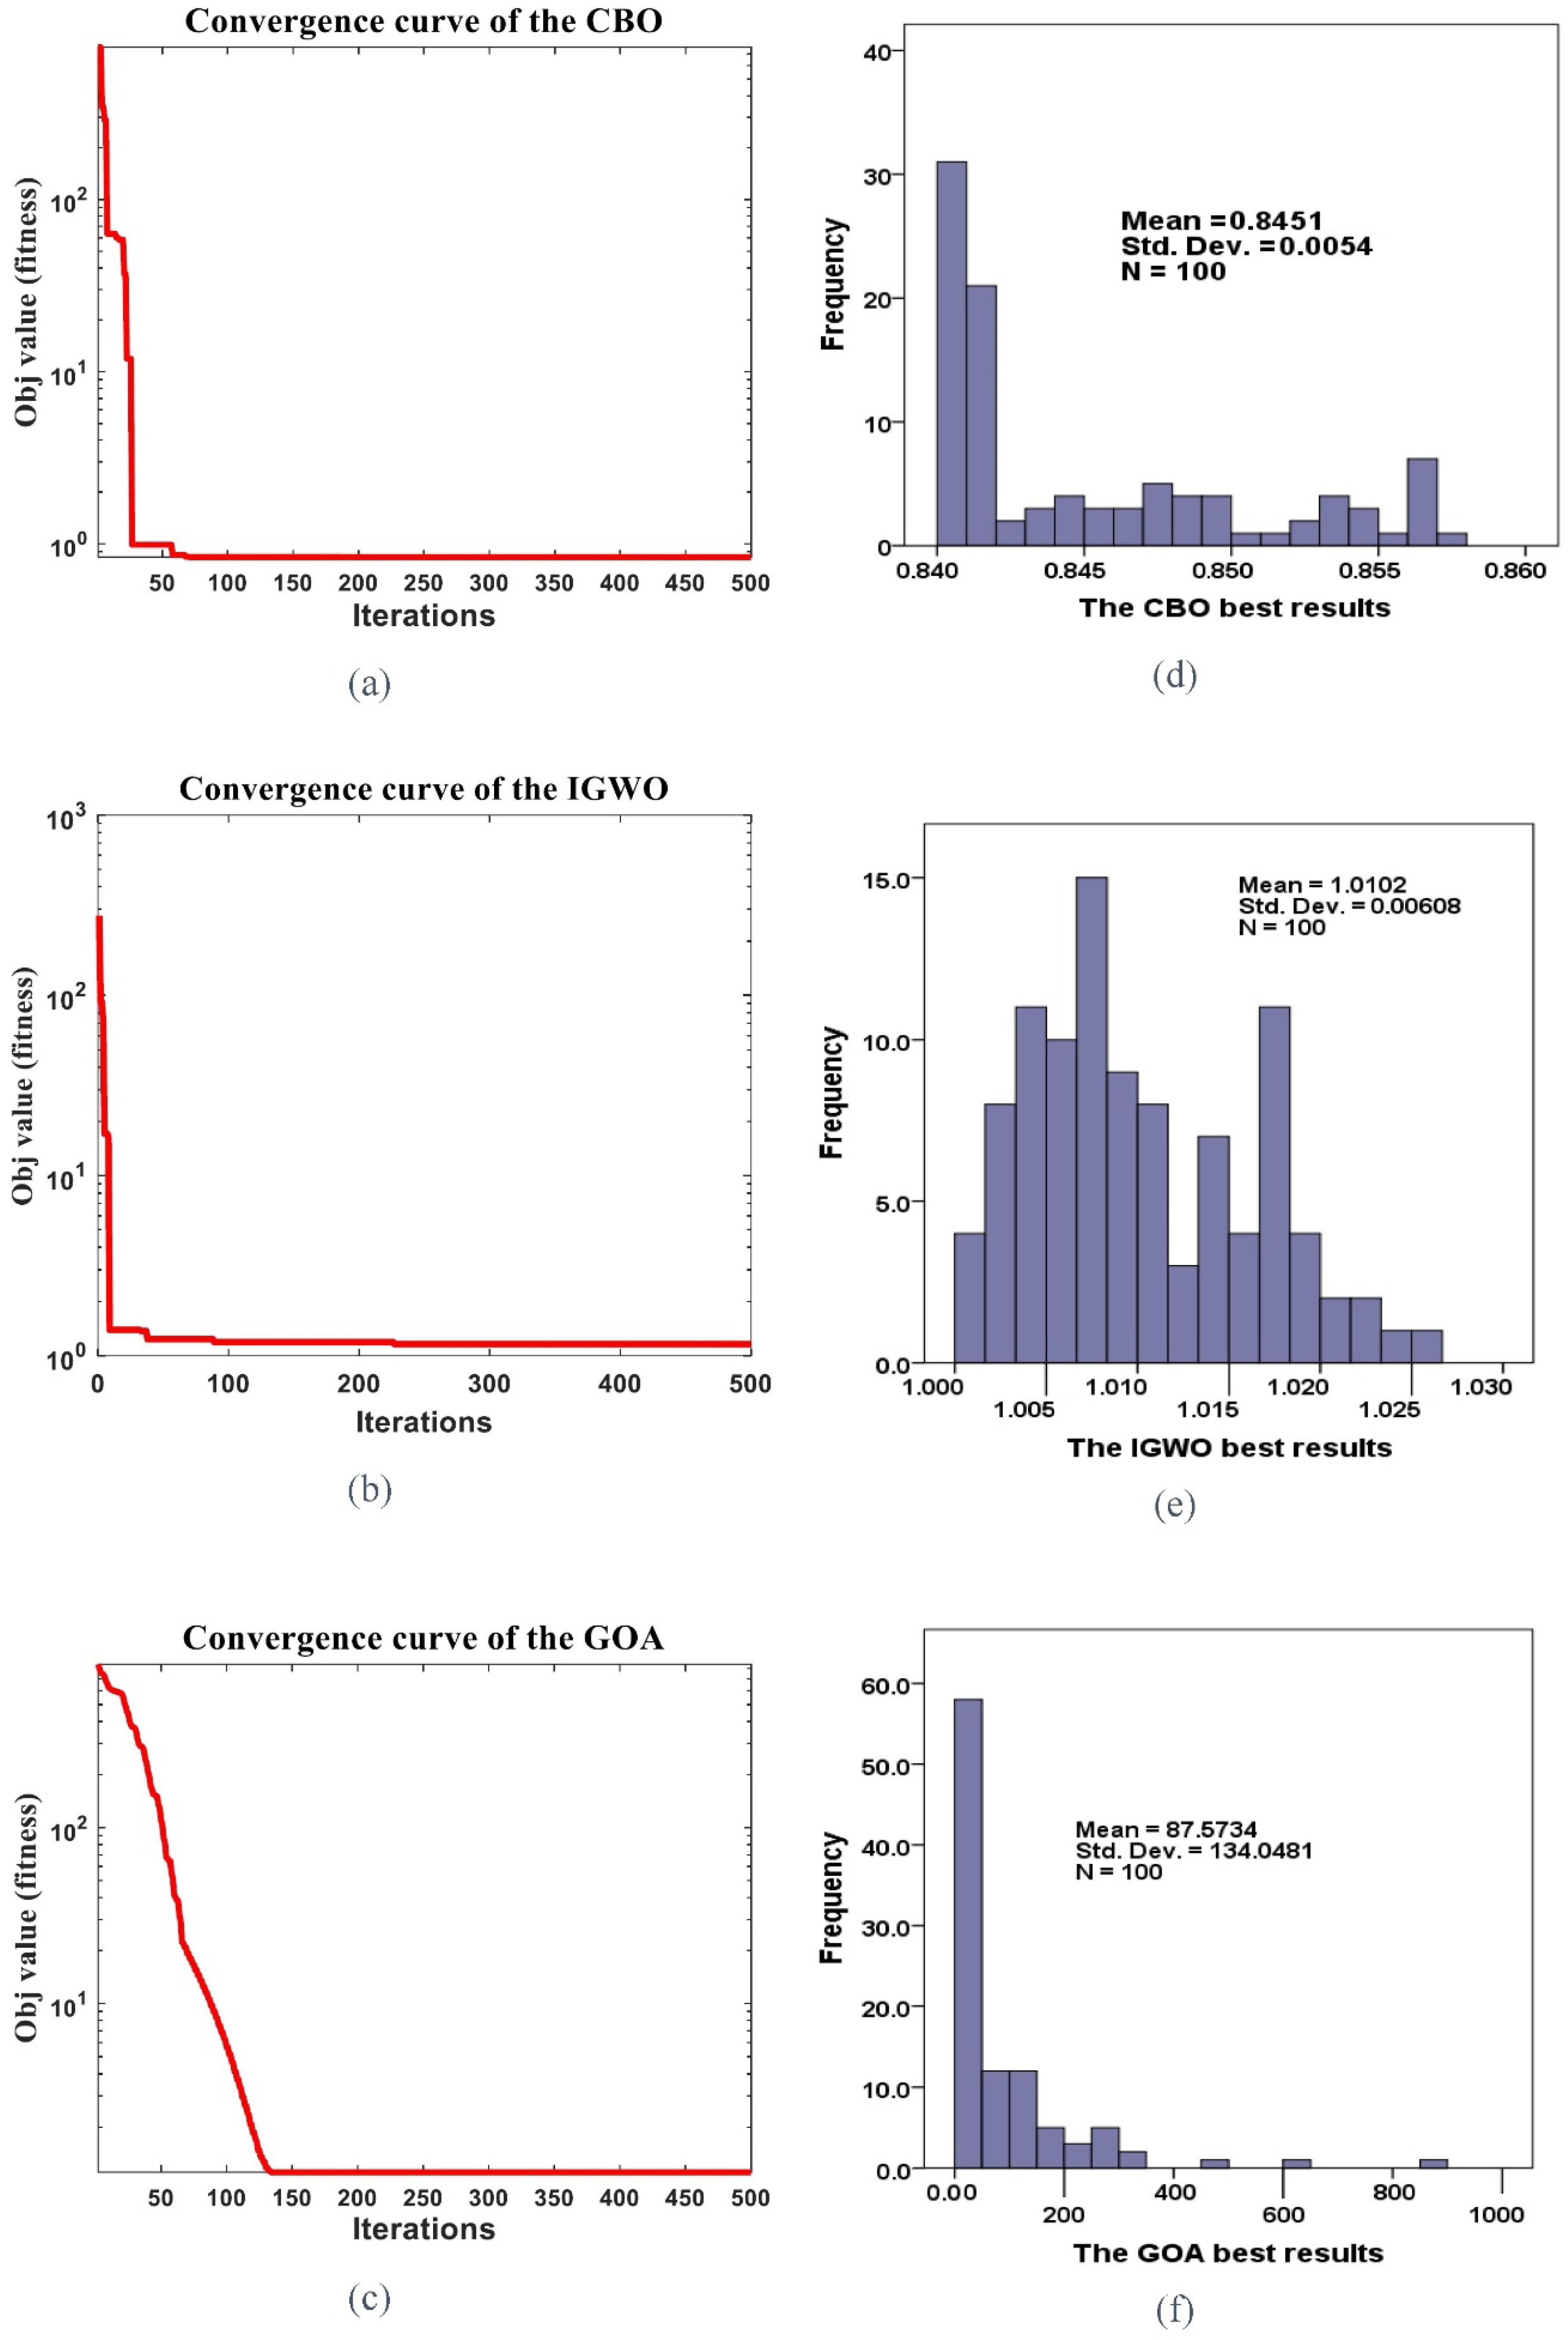
| GOA [51] | 1.0897 | 133.37 | 87.573 | 33.951 | 871.03 | 17968.8 | 5.3231 |
| IGWO [52] | 1.0006 | 0.00605587 | 1.010265 | 1.0088 | 1.0262 | 3.704 × 10⁻⁵ | 0.986453905 |
| CBO [43] | 0.84042 | 0.005467 | 0.845162 | 0.841525 | 0.85763 | 3.019 × 10⁻⁵ | 0.387034 |
| Comparison | CBO-EO | CBO-GOA | IGWO-GOA |
|---|---|---|---|
| p-value | 0 | 0 | 0 |
| Positive rank | 0 | 0 | 0 |
| Negative rank | 100 | 100 | 100 |
| Decision | Reject the null hypotheses | Reject the null hypotheses | Reject the null hypotheses |
| Device | Approach | Fitness | Elapsed Time | |||||||
|---|---|---|---|---|---|---|---|---|---|---|
| Ballard-Mark-V 5 kW | CBO | 0.00061592 | 0.25 | −1.1788 | 0.0028743 | 3.64 × 10⁻⁵ | −1.195 × 10⁻⁴ | 12.08 | 0.0008 | 0.0136 |
| FPO [17] | 0.0006204 | NR a | −1.0257 | 3.4 × 10⁻³ | 6.79 × 10⁻⁵ | −1.285 × 10⁻⁴ | 15.644 | 5.2906 × 10⁻⁴ | 0.0614 | |
| GWO [21] | 0.002067 | NR a | −1.1827 | 3.7080 × 10⁻³ | 9.36 × 10⁻⁵ | −1.192 × 10⁻⁴ | 11.76 | 7.8773 × 10⁻⁴ | 0.0136 | |
| IFSO [38] | 0.784 | 3.80 | −1.12 | 3.57 × 10⁻³ | 8.01 × 10⁻⁵ | −1.59 × 10⁻⁴ | 22.00 | 1.00 × 10⁻⁴ | 0.015 | |
| Nedstack-PS6 6 kW | CBO | 1.5734 | 0.35938 | −1.0945 | 2.8818 × 10⁻³ | 5.66 × 10⁻⁵ | −1.162 × 10⁻⁴ | 16.287 | 1.0125 × 10⁻⁴ | 0.1148 |
| VSDE [28] | 2.08849 | NR a | 1.1212 | 3.3487 × 10⁻³ | 4.67 × 10⁻⁵ | 9.54 × 10⁻⁵ | 13.000 | 1 × 10⁻⁴ | 0.0494 | |
| SSO [33] | 2.18067 | NR a | 0.9719 | 3.3487 × 10⁻³ | 7.91 × 10⁻⁵ | 9.5435 × 10⁻⁵ | 13.000 | 1 × 10⁻⁴ | 0.0534 | |
| GOA [28] | 2.18586 | NR a | 1.1997 | 3.5505 × 10⁻³ | 4.61 × 10⁻⁵ | 9.54 × 10⁻⁵ | 13.009 | 1.01 × 10⁻⁴ | 0.0579 | |
| VSA [28] | 2.34260 | NR a | 0.8946 | 3.3480 × 10⁻³ | 9.75 × 10⁻⁵ | 9.54 × 10⁻⁵ | 13.000 | 1.03 × 10⁻⁴ | 0.0429 | |
| Temasek 1 kW | CBO | 0.15204 | 0.29688 | −0.9421 | 2.8427 × 10⁻³ | 8.70 × 10⁻⁵ | −9.54 × 10⁻⁵ | 10 | 0.00059487 | 0.1319 |
| FPO [17] | 0.1881 | NR a | −0.4838 | 1.0 × 10⁻³ | 2.77 × 10⁻⁵ | −7.578 × 10⁻⁵ | 11.322 | 1.1091 × 10⁻⁴ | 0.1287 | |
| GWO [21] | 1.6481 | NR a | −1.0299 | 2.4105 × 10⁻³ | 4.00 × 10⁻⁵ | −9.54 × 10⁻⁵ | 10.000 | 1.0873 × 10⁻⁴ | 0.1274 | |
| SR-12PEM-500 W | CBO | 1.1171 | 0.29688 | −0.8863 | 0.0027936 | 8.92 × 10⁻⁵ | −9.54 × 10⁻⁵ | 10 | 0.00067766 | 0.1631 |
| VSDE [28] | 1.266 | NR a | −0.8576 | 3.0100 × 10⁻³ | 7.78 × 10⁻⁵ | −9.54 × 10⁻⁵ | 23.000 | 1.339 × 10⁻⁴ | 0.1516 | |
| Shark smell [34] | 1.517 | NR a | −0.9664 | 2.2833 × 10⁻³ | 3.4 × 10⁻⁵ | −9.54 × 10⁻⁵ | 15.797 | 6.685 × 10⁻⁴ | 0.1804 | |
| GWO [21] | 1.517 | NR a | −0.9664 | 2.2833 × 10⁻³ | 3.40 | −9.54 × 10⁻⁵ | 15.796 | 6.6853 × 10⁻⁴ | 0.1804 | |
| BCS 500 W | CBO | 0.01161 | 0.5468 | −1.0922 | 0.0028264 | 6.97 × 10⁻⁵ | −1.212 × 10⁻⁴ | 23.154 | 1.4445 × 10⁻⁴ | 0.0141 |
| VSDE [28] | 0.01214 | NR a | −1.1970 | 4.2330 × 10⁻³ | 9.79 × 10⁻⁵ | −1.9201 × 10⁻⁵ | 20.194 | 1.108 × 10⁻⁴ | 0.0157 | |
| SSO [33] | 0.01219 | NR a | −0.8532 | 4.8115 × 10⁻⁵ | 9.43 × 10⁻⁵ | −1.9205 × 10⁻⁴ | 23.000 | 3.49 × 10⁻⁴ | 0.0159 | |
| Shark smell [34] | 7.18890 | NR a | −1.0180 | 2.3151 × 10⁻³ | 5.24 × 10⁻⁵ | −1.2815 × 10⁻⁴ | 18.855 | 7.50 × 10⁻⁴ | 0.0136 | |
| GWO [21] | 7.1889 | NR a | −1.0180 | 2.3151 × 10⁻³ | 5.24 × 10⁻⁵ | −2.6 × 10⁻⁴ | 18.854 | 7.5036 × 10⁻⁴ | 0.0136 |
Disclaimer/Publisher’s Note: The statements, opinions and data contained in all publications are solely those of the individual author(s) and contributor(s) and not of MDPI and/or the editor(s). MDPI and/or the editor(s) disclaim responsibility for any injury to people or property resulting from any ideas, methods, instructions or products referred to in the content. |
© 2023 by the authors. Licensee MDPI, Basel, Switzerland. This article is an open access article distributed under the terms and conditions of the Creative Commons Attribution (CC BY) license (https://creativecommons.org/licenses/by/4.0/).
Share and Cite
Ali, M.A.; Mandour, M.E.; Lotfy, M.E. Adaptive Estimation of Quasi-Empirical Proton Exchange Membrane Fuel Cell Models Based on Coot Bird Optimizer and Data Accumulation. Sustainability 2023, 15, 9017. https://doi.org/10.3390/su15119017
Ali MA, Mandour ME, Lotfy ME. Adaptive Estimation of Quasi-Empirical Proton Exchange Membrane Fuel Cell Models Based on Coot Bird Optimizer and Data Accumulation. Sustainability. 2023; 15(11):9017. https://doi.org/10.3390/su15119017
Chicago/Turabian StyleAli, Mohamed Ahmed, Mohey Eldin Mandour, and Mohammed Elsayed Lotfy. 2023. "Adaptive Estimation of Quasi-Empirical Proton Exchange Membrane Fuel Cell Models Based on Coot Bird Optimizer and Data Accumulation" Sustainability 15, no. 11: 9017. https://doi.org/10.3390/su15119017
APA StyleAli, M. A., Mandour, M. E., & Lotfy, M. E. (2023). Adaptive Estimation of Quasi-Empirical Proton Exchange Membrane Fuel Cell Models Based on Coot Bird Optimizer and Data Accumulation. Sustainability, 15(11), 9017. https://doi.org/10.3390/su15119017