Article

Photovoltaic Power Prediction Using Analytical Models and Homer-Pro: Investigation of Results Reliability

by
Fadhil Khadoum Alhousni
1,*,
Firas Basim Ismail Alnaimi
1,
Paul C. Okonkwo
2,
Ikram Ben Belgacem
3,
Hassan Mohamed
4 and
El Manaa Barhoumi
2
1
Power Generation Unit, Institute of Power Engineering (IPE), Universiti Tenaga Nasional (UNITEN), Kajang 43000, Selangor, Malaysia
2
College of Engineering, Dhofar University, Salalah 211, Oman
3
Laboratoire de Génie Mécanique, Ecole Nationale d’Ingénieurs, Université de Monastir, Monastir 5019, Tunisia
4
Institute of Sustainable Energy, Universiti Tenaga Nasional, Jalan Ikram-UNITEN, Kajang 43000, Selangor, Malaysia
*
Author to whom correspondence should be addressed.
Sustainability 2023, 15(11), 8904; https://doi.org/10.3390/su15118904
Submission received: 20 April 2023 / Revised: 23 May 2023 / Accepted: 30 May 2023 / Published: 31 May 2023

Abstract

:
This paper aims to develop an analytical model for the prediction of the electricity produced in a Photovoltaic Power Station (PVS). In this context, the developed mathematical model is implemented in a Simulink Model. The obtained simulation results are compared to the experimental data, the results obtained from the software Homer-Pro model, and the results given by the online PV calculator (Photovoltaic Geographical Information System), developed by the European commission. The comparison results show the reliability of the developed analytical model for specific months of the year. However, an error of 10% between simulations and experimental results is observed for July and August. This error is mainly due to the effects of humidity and dust that were not considered in the analytical model. Nevertheless, the monthly and yearly produced electricity values show the robustness of the proposed model to predict the PVS generated power. The developed model will be used as a powerful tool for data prediction and the optimization of electricity generation. This permits us to reduce the losses in power generation by optimizing the connected generating power stations to the power grid.

1. Introduction

The world is increasingly moving to renewable energy sources to reduce greenhouse gas emissions and combat climate change [1]. According to the International Energy Agency, Photovoltaics (PV) is expected to become the largest source of electricity in the world by the mid-century [2]. Technological advances, cost reductions, and favorable policies are driving the growth of PV, which is already competing with fossil fuels in many regions [3].
Standalone, hybrid, and grid-connected PV systems will play an important role in the transition to a sustainable environment in the future [4]. Grid-connected PV systems allow end-users of electricity, communities, and small factories to generate electrical energy from the sun. The excess is fed back into the grid. This approach can reduce reliance on fossil fuels and lower energy bills [5]. In addition, grid-connected PVS are a reliable source of electricity during grid outages, especially when storage systems are Installed to provide the required electricity.
The prediction of PV electricity permits us to minimize the energy production cost by controlling different generators connected to the power grid [6]. The forecasting of energy production and load variation represents a key solution for reducing the energy losses and improving the efficiency of power system networks [7]. Moreover, the prediction of PV-generated electricity allows operators to control other connected generating power stations, which ensure the stability and reliability of electricity supply to the end users [8].
Temperature, solar radiation, humidity, and wind speed determine PV power plant electricity forecasts. Thus, weather-based analytical models anticipate PV production electricity [9]. The developed analytical models are mainly based on programming linear equations [10]. To improve the results accuracy of analytical models, some other factors, such as azimuth angle and inclination angle, were included in analytical models [11].
With the development of Artificial Intelligence (AI), deep learning, and artificial neural networks (ANNs), new analytical models based on ANNs have been developed for the prediction of PV power [12]. Despite these new models providing more accurate data and information, the implementation requires huge amounts of data and high-speed processors to perform calculations in a short time. However, AI and ANNs have been used to optimize the cost and the location selection of PV power [13]. The obtained results are very interesting and models can be used to determine the optimized sizes and cost of PV power stations [14]. Recently, analytical models have been improved to obtain more accurate results for both sizing and power prediction. These sophisticated models combine analytical models and AI techniques [15]. Moreover, other parameters, such as reflective solar radiation, moisture, dust, and humidity, have been considered to predict the losses and the PV power output [16].
Machine Learning (ML) has proven its ability for forecasting weather and solar radiation data for short and medium time. However, more improvements are required to connect the ML models to real time sensors for predicting PV power output [17].
In the last decennia, many pieces of professional software, e.g., Homer-Pro, PV case, and Solargis, have been developed to assist with the design, optimization, and prediction of PV power output. These tools permit us to analyze renewable energy potential by providing all information related to global solar radiation, temperature, clearness index and many other factors. To optimize renewable energy systems, including PV power stations, Homer-Pro has been used to determine the optimal cost and the minimum levelized cost of energy production. Homer-Pro has been used to design wind, solar, and hybrid energy systems [18]. When using Homer, the user must first enter information such as the location of the PV power station, the different components of the power station, the orientation of the solar panels, and the anticipated weather conditions in order to predict the PV power output and the cost of the project [19]. The software then simulates the behavior of the system under various situations, such as temperature, shade, and solar irradiance changes, using a variety of algorithms and mathematical models. The Homer-Pro model also takes into account extra elements such as battery storage capacity and grid connectivity potential. The system can then be designed and operated to the best of its ability. The design of PV systems and the forecast of electricity output have both been achieved using HOMER-Pro software. It enables the modelling of hybrid energy systems that combine several renewable energy sources, including biomass, hydropower, and wind, with more traditional sources, including diesel generators [20,21]. This feature makes it easier to develop more dependable and economical systems that can function under a variety of diverse circumstances. The system performance analysis and optimization tools included in HOMER-Pro also contain sensitivity analysis and optimization algorithms, which can be used to find the most economical and effective system configurations. HOMER-Pro represents a potential tool for estimating PV power output and improving the efficiency of hybrid renewable energy systems [22].
Numerous other software tools have been created to forecast solar PV energy in addition to Homer-Pro. For instance, the Solargis software offers information and services on solar resources for researchers and engineers working in the field of solar energy [23]. Based on local temperature and solar radiation, Solargis can precisely anticipate the PV power output of solar systems. Advanced modelling approaches and the availability of high-quality data on solar resource availability enable this capability [24]. The user must first enter the location and details of the solar installation in order to anticipate the PV power output using Solargis. The behavior of the system is then simulated by Solaris using sophisticated algorithms and models, including variations in temperature, sun irradiation, and shading. A network of ground-based measurement stations and satellite imaging are used to provide the tool with historical and real-time data on solar irradiance as well as precise information about the solar resource at the installation site [25]. The precision of Solargis’ data on solar resources is one of the main advantages of utilizing it to forecast PV power output. For precise projections of power output, the program uses a variety of data sources to deliver highly accurate solar irradiance and meteorological data.
This paper aims to develop and simulate an analytical model for the prediction of PVS output power. The paper’s Section 2 presents the three methods proposed to predict and measure the PVS output power. The Section 3 presents the different simulation results. These results are analyzed in the Section 4. Finally, the conclusion and recommendations are shown in the Section 5 of the paper.

2. Materials and Methods

An analytical model was developed and implemented in Matlab–Simulink (R2012b, MathWorks Limited, London, UK) to calculate and display the produced electrical energy to predict the PV power output. In addition, the model requires temperature and solar radiation variation. To validate the model and determine its reliability, the Homer software and experimental results were compared to the obtained analytical model results. This section describes the different models developed in this paper.

2.1. Analytical Model

A PV power station contains PV panels (Jinko Solar Eagle, Mono cristillane) and Maximum Power Point Tracking (MPPT) inverters (Sun-2000 KTL-M). Analytical models have become essential tools to develop and analyze PV power stations. The basic equation used for modelling a photovoltaic (PV) panel is the current–voltage (I-V) curve equation, describing the relationship between the current and output voltage of the PV cells in the module [26]:
I = Iph − I0(exp((V + IRs)/aVT)),
where:
I is the current generated by the PV module (A).
Iph is the photocurrent generated by the PV cells in the module (A).
I0 is the saturation current of the diode in the module (A).
V is the voltage output of the PV module in volts (V).
Rs is the series resistance of the module in ohms (Ω).
a is the diode ideality factor.
VT represents the thermal voltage (V), which is equal to the product of the Boltzmann constant (k) and the absolute temperature (T) divided by the electron charge (q).
The maximum power point (MPP) of the PV module occurs at a given voltage where the product of current and voltage is at its maximum. The MPP can be calculated using the derivative of the above equation with respect to voltage and setting it as equal to zero. The resulting equation for Vmpp is given by [27]:
Vmpp = (aVT/qs) × ln((Iph − Impp)/I0 + 1) − Rs × Impp
where:
Impp represents the current at the MPP (A).
Vmpp represents the voltage at the MPP (V).
Therefore, the output power of a PV power station is expressed using the following equation [28]:
P = Vmpp × Impp
To calculate the output power of a PV panel, the following equation can be easily implemented [29]:
P = P0 × (1 − α(T − T0)) × G/G0
where:
P represents the output power of the PV panel in watts (W).
P0 represents the nominal output power of the PV panel at reference temperature T0 and solar radiation G0, which represent the standard test conditions (STC).
α represents the temperature coefficient of the PV panel, expressed in percent per degrees Celsius (%/°C).
T represents the temperature of the PV panel in degrees Celsius (°C).
T0 represents the reference temperature, usually taken as 25 °C.
G represents the solar radiation incident on the PV panel in watts per square meter (W/m2).
G0 represents the reference solar radiation, usually taken as 1000 W/m2.
The parameters used to simulate the PV power station are summarized in Table 1.
These equations were implemented in the Matlab–Simulink Model to simulate the output power of a 250 kWp PV power station. The real data of solar radiation and temperature at the site were used as input in the model. The Matlab model was refined and improved according to the steps presented in the flowchart of Figure 1. The developed model used the real data of temperature and solar radiation to calculate the output power. The obtained results were compared with the data recorded and provided by the monitoring system in the power station. The model parameters were updated to reduce the error between experimental and simulation results. The convergence characteristic was mainly based on error calculation. The convergence criterion was set to be less than 10%.

2.2. Homer-Pro Model

The Homer-Pro (3.14.2 version) software was developed to facilitate the design and the optimization of renewable energy systems [30]. Homer-Pro is a sophisticated software application for modelling and analyzing power systems. It is intended for modelling and analyzing complicated power systems such as micro grids. It has a graphical user interface that makes it simple to design and run power system models, and it includes a comprehensive variety of analysis and optimization capabilities. One of Homer-Pro’s primary features is its ability to simulate both AC and DC power systems, making it especially helpful for analyzing hybrid systems that incorporate both sources of power.
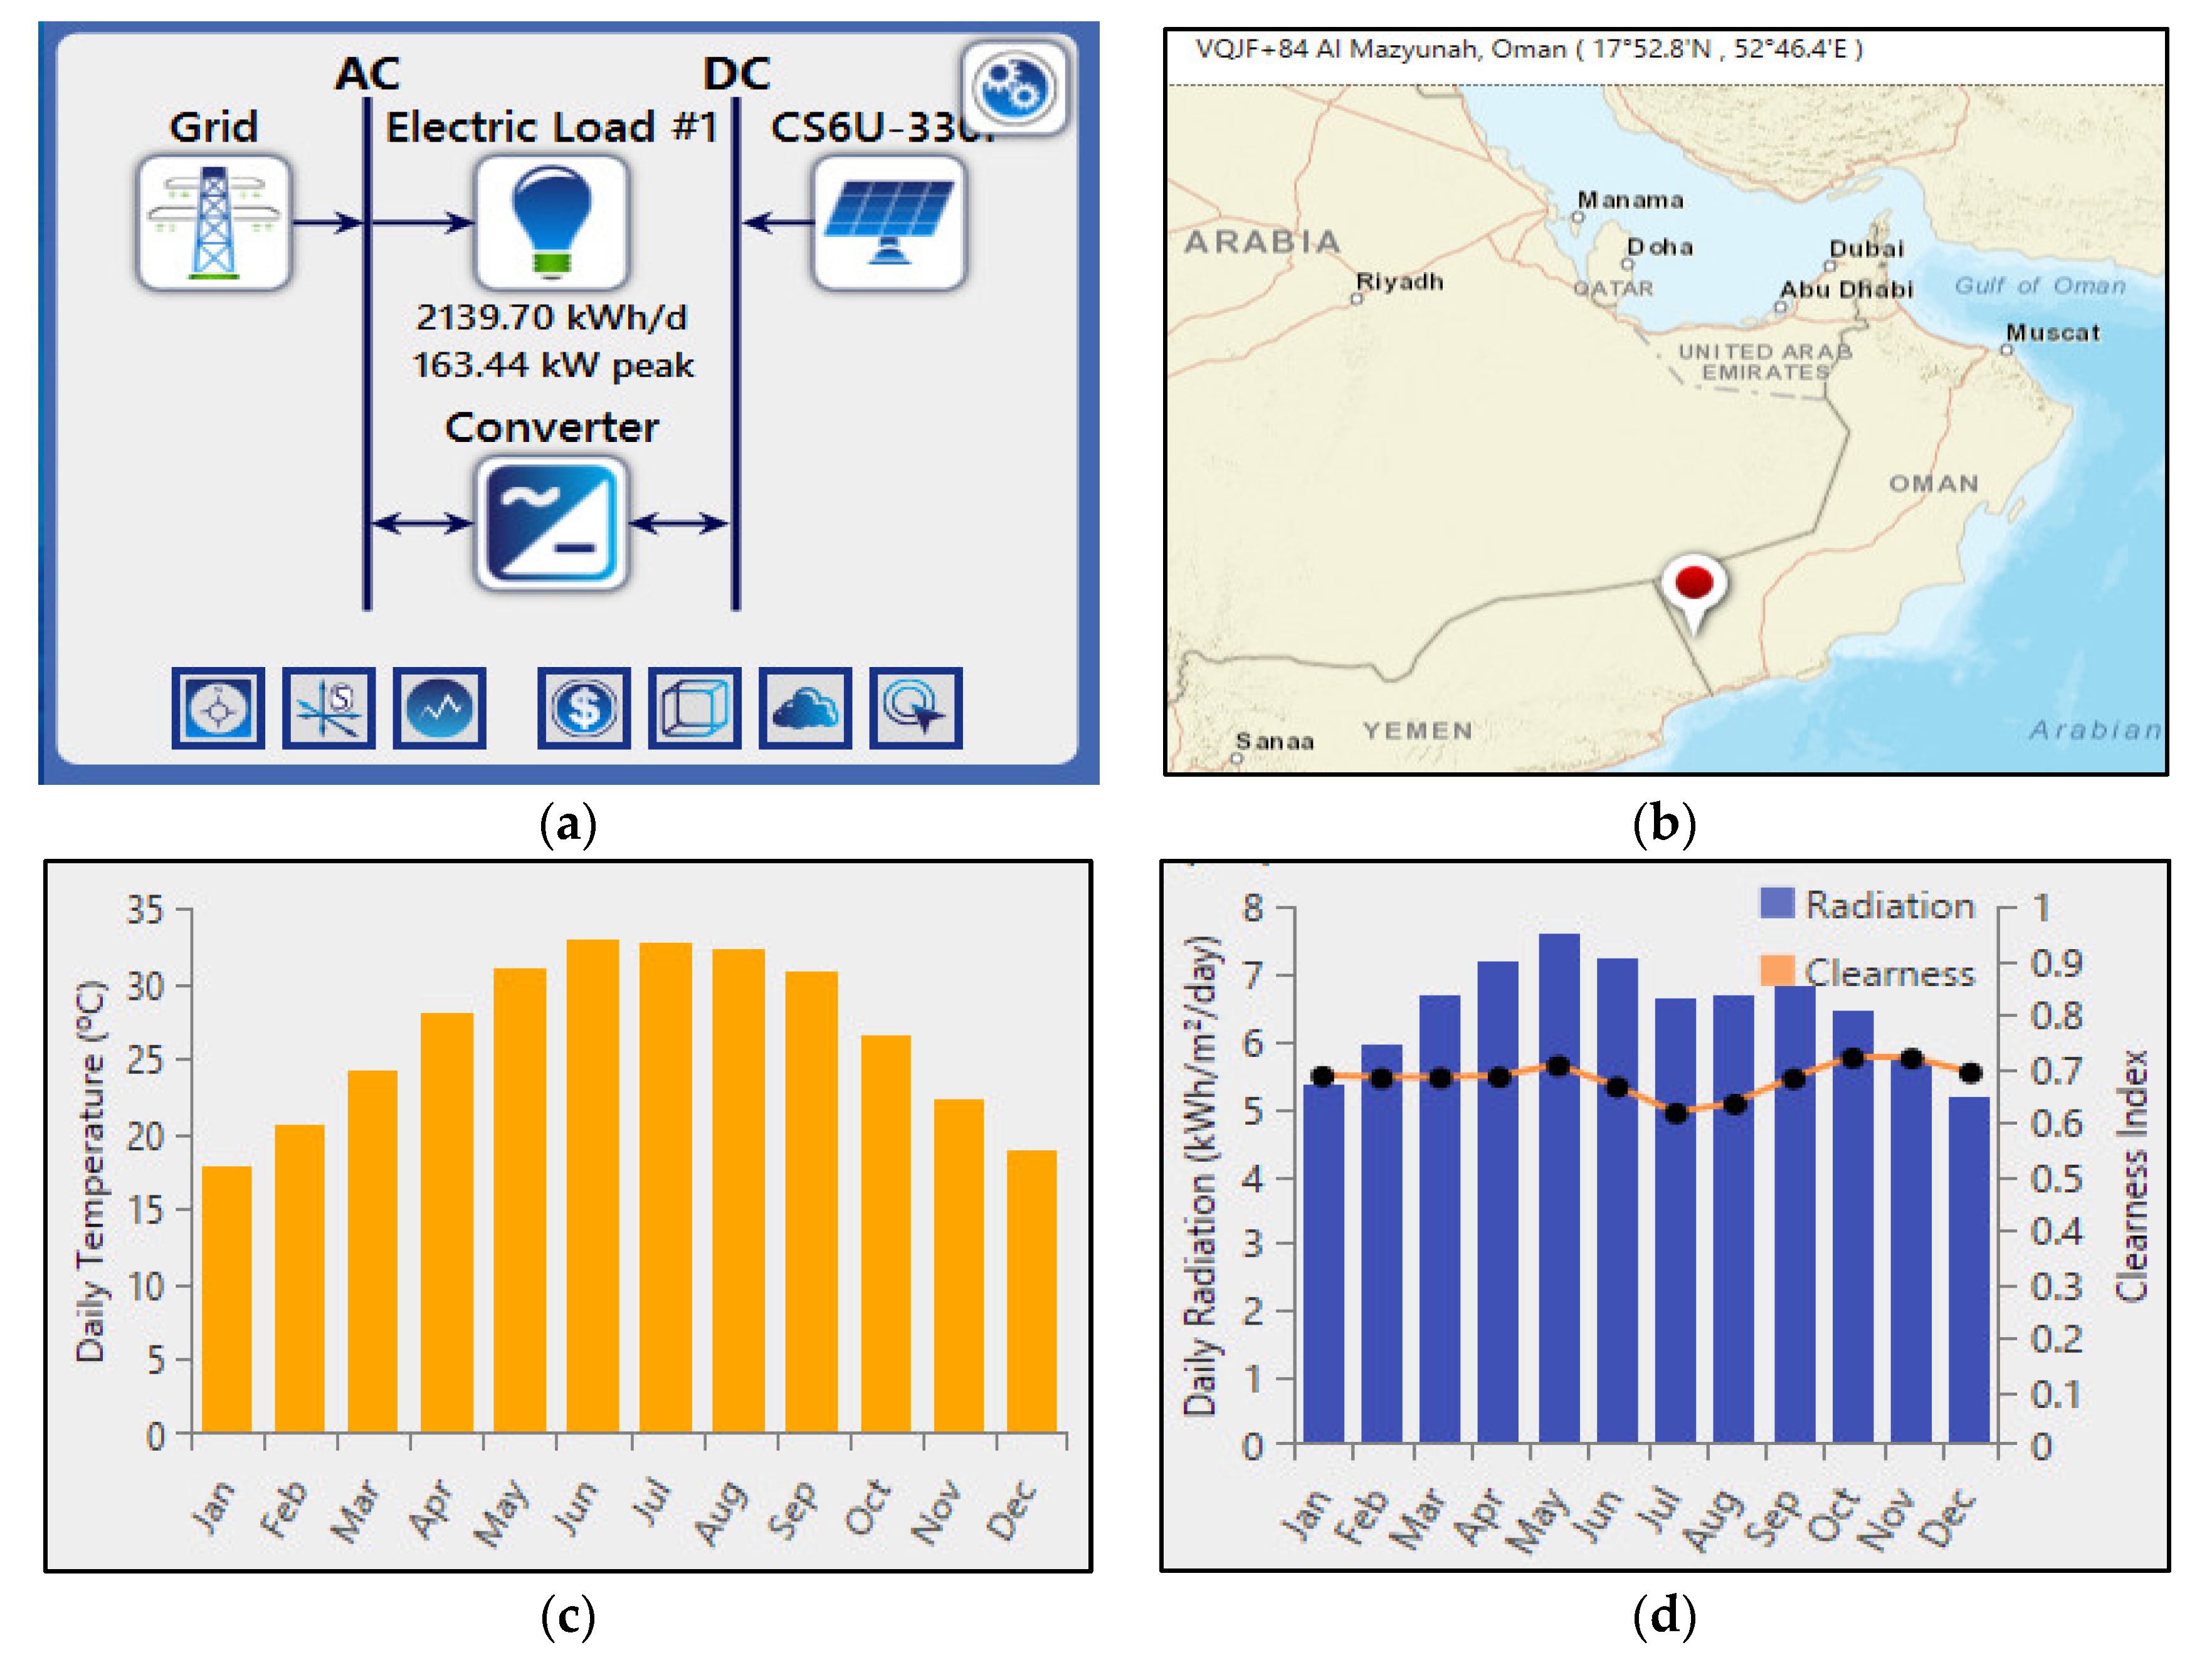
This software calculates the optimal size and costs of different components used in a power system. The Homer-Pro software requires the location data, the electric load, and the initial costs and maintenance costs of the different components. In this paper, the software was used to calculate the energy generated by a 250 kWp PV station. This PV power station is located in the Dhofar region in the south of Oman. This area is characterized by its high PV potential. An arbitrary electric load was defined, and the PV power station was connected to the power grid. The model depicted in Figure 2a allowed us to calculate the electrical energy produced at every instant of the year. It displays the results and the variation of produced electrical energy over a complete year. Thereafter, the electrical energy produced daily, monthly, or yearly can be calculated. The simulation model requires the location of the power station, Figure 2b, the temperature, Figure 2c, and the solar radiation, Figure 2d.
To calculate the produced power using the Homer-Pro software, the following objective function was defined inside the model itself:
Fobj = min(total NPC)
where NPC represents the total net present cost of the project.
The constraints of the optimization problem are defined by Equations (6) and (7):
∑(P_pv) − ∑(P_load) − P_grid = 0
P_pv ≤ P_pv_max

2.3. Experiments

To validate the developed analytical model (Section 2.1), the obtained results were compared with the Homer-Pro results and the measured results provided by the Al-Mazyona PV power station. The PV power station is a 25 MW photovoltaic power plant that was commissioned in 2019. It is located in the Wilayat of Thumrait, which is about 700 km south of Muscat, the capital city of Oman. The power station spans an area of approximately 4.5 hectares and uses over 70,000 solar panels to generate electricity. Only the output power of a total capacity of 250 kWp was recorded and used in this paper. The PV power station includes a data storage and analysis component, which collects and stores data from various sensors and devices within the PV power station. These data can be analyzed to improve the performance of the power station and identify any issues that need to be addressed. A real diagram of the grid-connected PV power station is depicted in Figure 3.
When utilizing the Matlab model to estimate the output of a PV power plant in Dhofar, Oman, a dataset is critical in assessing the model’s performance. The prediction dataset is made up of historical measurements of important variables such as solar irradiance, ambient temperature, and PV power output. The primary input for predicting PV power production is solar irradiation. This information, which is commonly measured in watts per square meter (W/m2), is gathered from weather sensors located in the Power PV power plant. The dataset contains historical measurements of real PV power production as a function of solar irradiation and ambient temperature. These readings are derived from on-site monitoring equipment linked to the PV power facility.

3. Results

The different models discussed in the previous section were implemented in Matlab–Simulink and Homer-Pro software. The obtained results are presented in this section.

3.1. Analytical Model Results

The output power of the PV power station simulated using the Matlab Model is presented in Figure 4. For the clarity of the results, only the month of January is considered in the simulation model. The PV power varied from day to day and the maximum power was reached at approximately 12.00 p.m. every day. For cloudy days, the output power decreased due to the reduced solar radiation received by the PV panels.
As shown in Figure 4, the PV power varied throughout the year due to changes in solar radiation and the temperature of the solar panels. The output power of the PV power station was highest during the month of November when there are longer periods of daylight and the sun is more intense, and lowest during the summer months when there are more cloudy days and the sun is less intense. Moreover, the solar radiation used as input in the model shows reduced values during the summer months due to cloud cover and rain. The yearly produced electricity in the PV power station was around 430,100 kWh. The analytical model permits us to predict the PV power at every hour for a complete year. The PV power output presented in Figure 4 shows the that power station produced its maximum power during the month of November. The power produced during December, January, and February was higher than the power produced during the other months of the year. This can be explained by the higher solar radiation values during these months of the year.

3.2. Homer-Pro Model Results

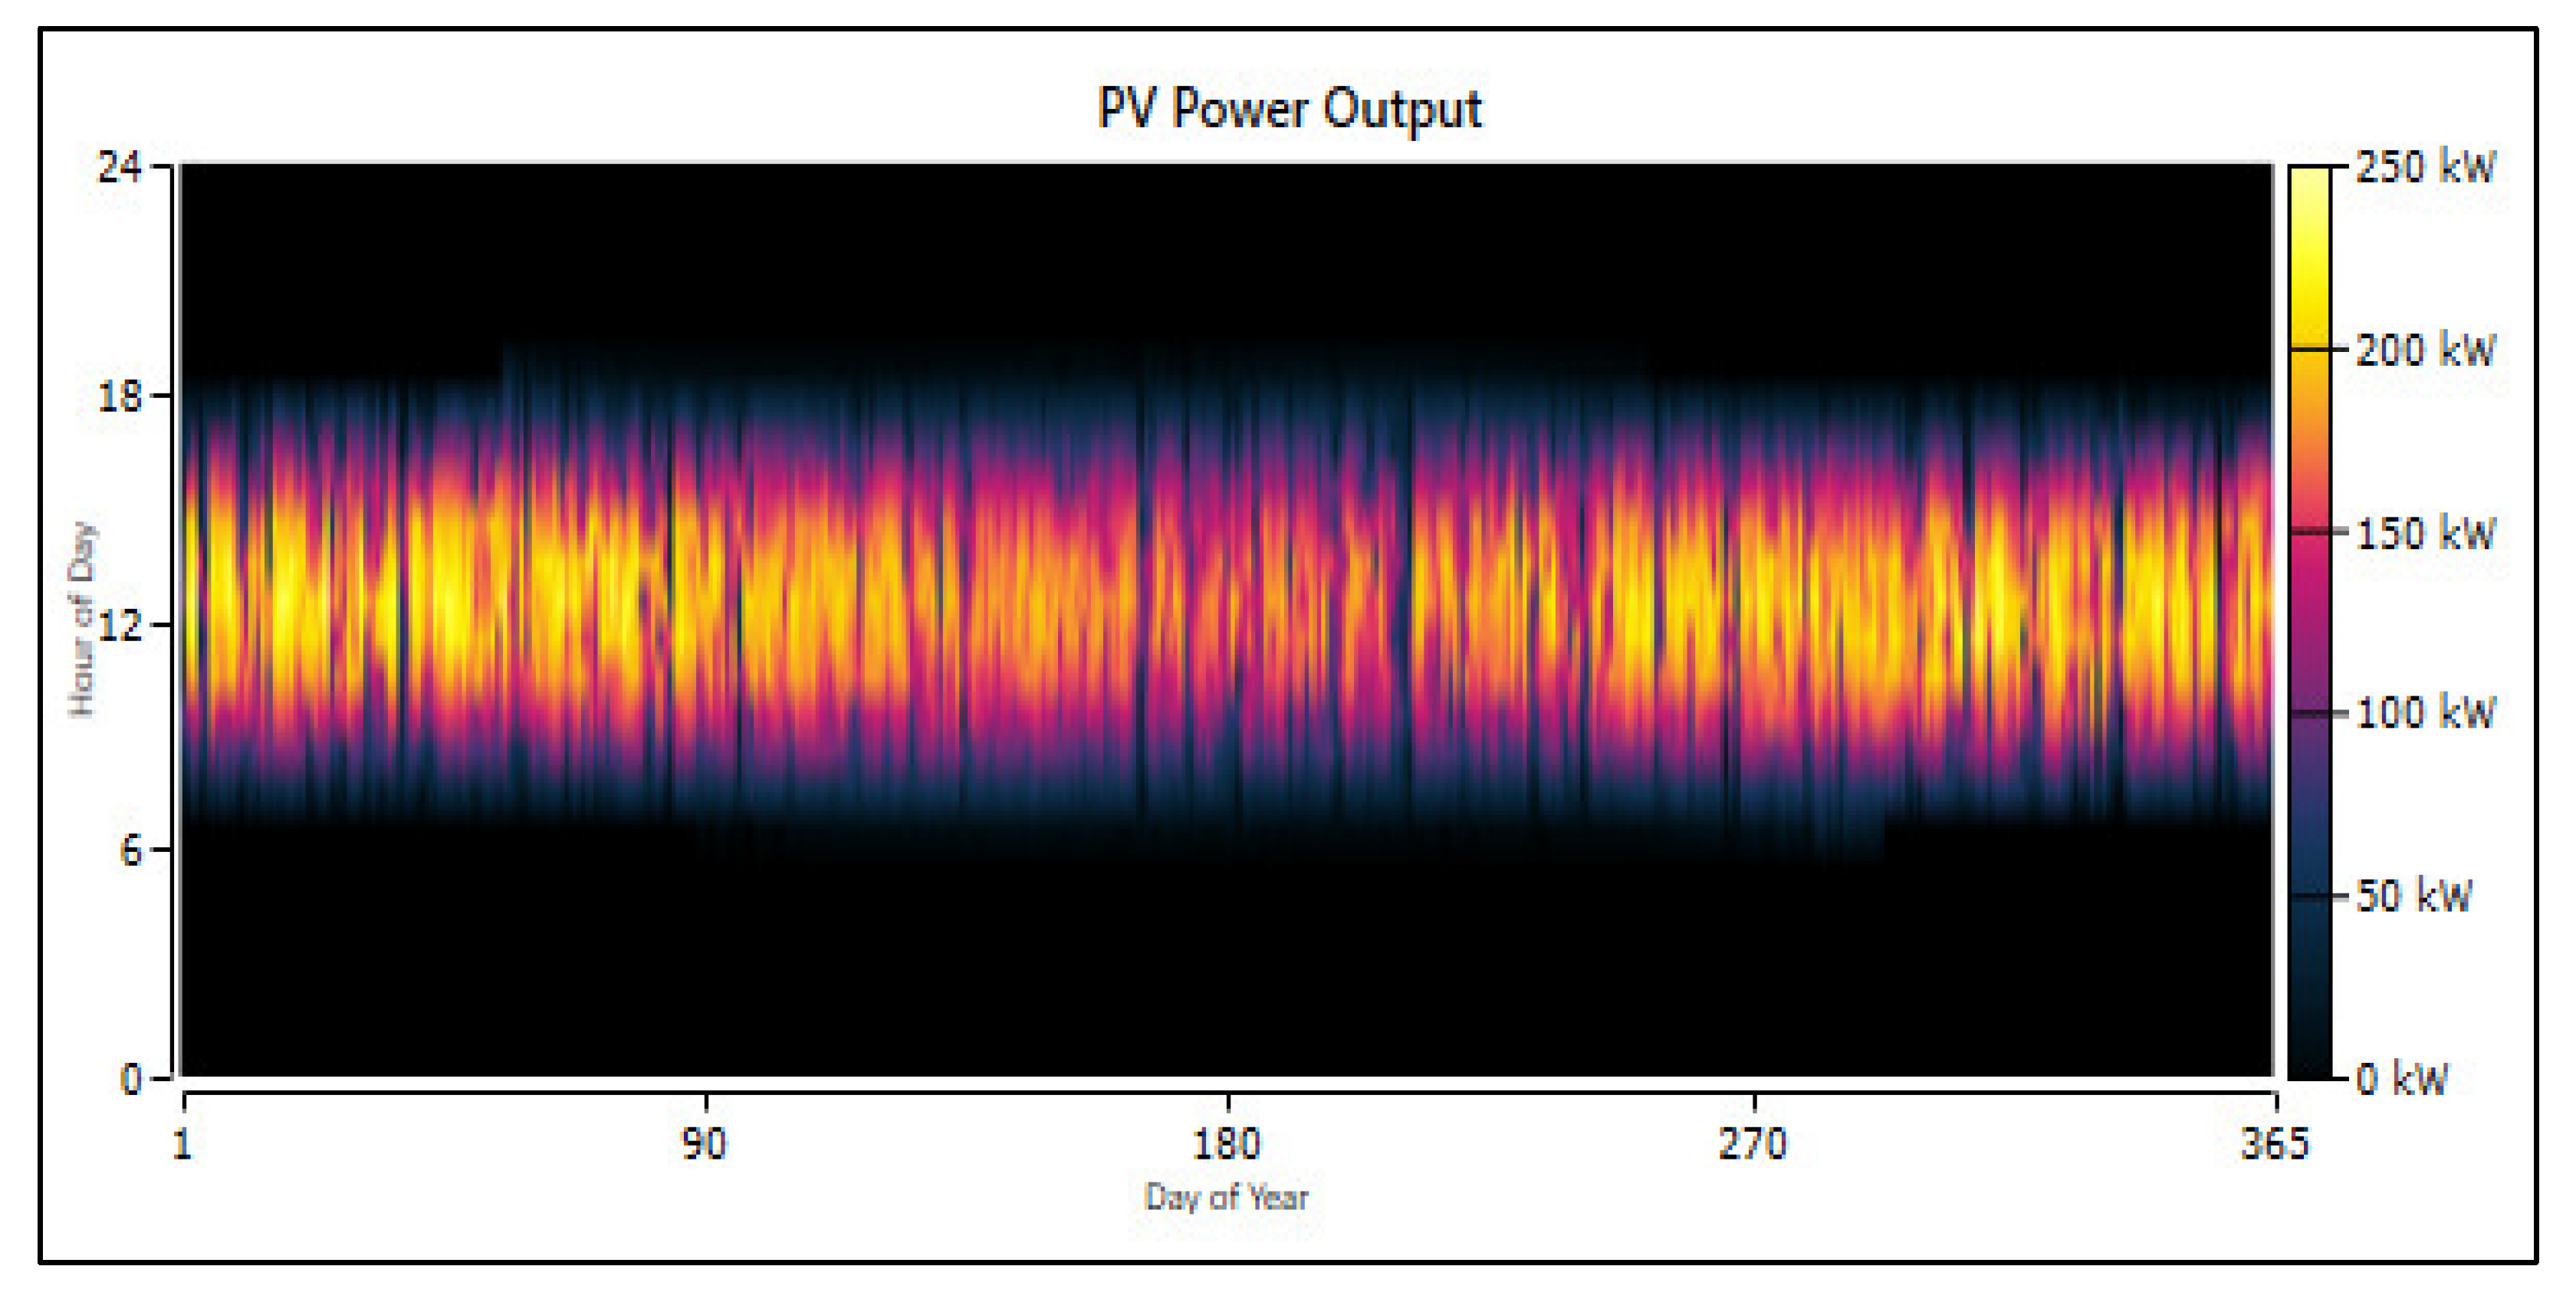
The Homer-Pro model permits us to simulate the PV power output for the complete year based on the variations of solar radiation, temperature, and clearness index. The obtained results using the Homer-Pro model are presented in Figure 5, Figure 6 and Figure 7. Figure 5 shows that the maximum produced power is 250 kW.
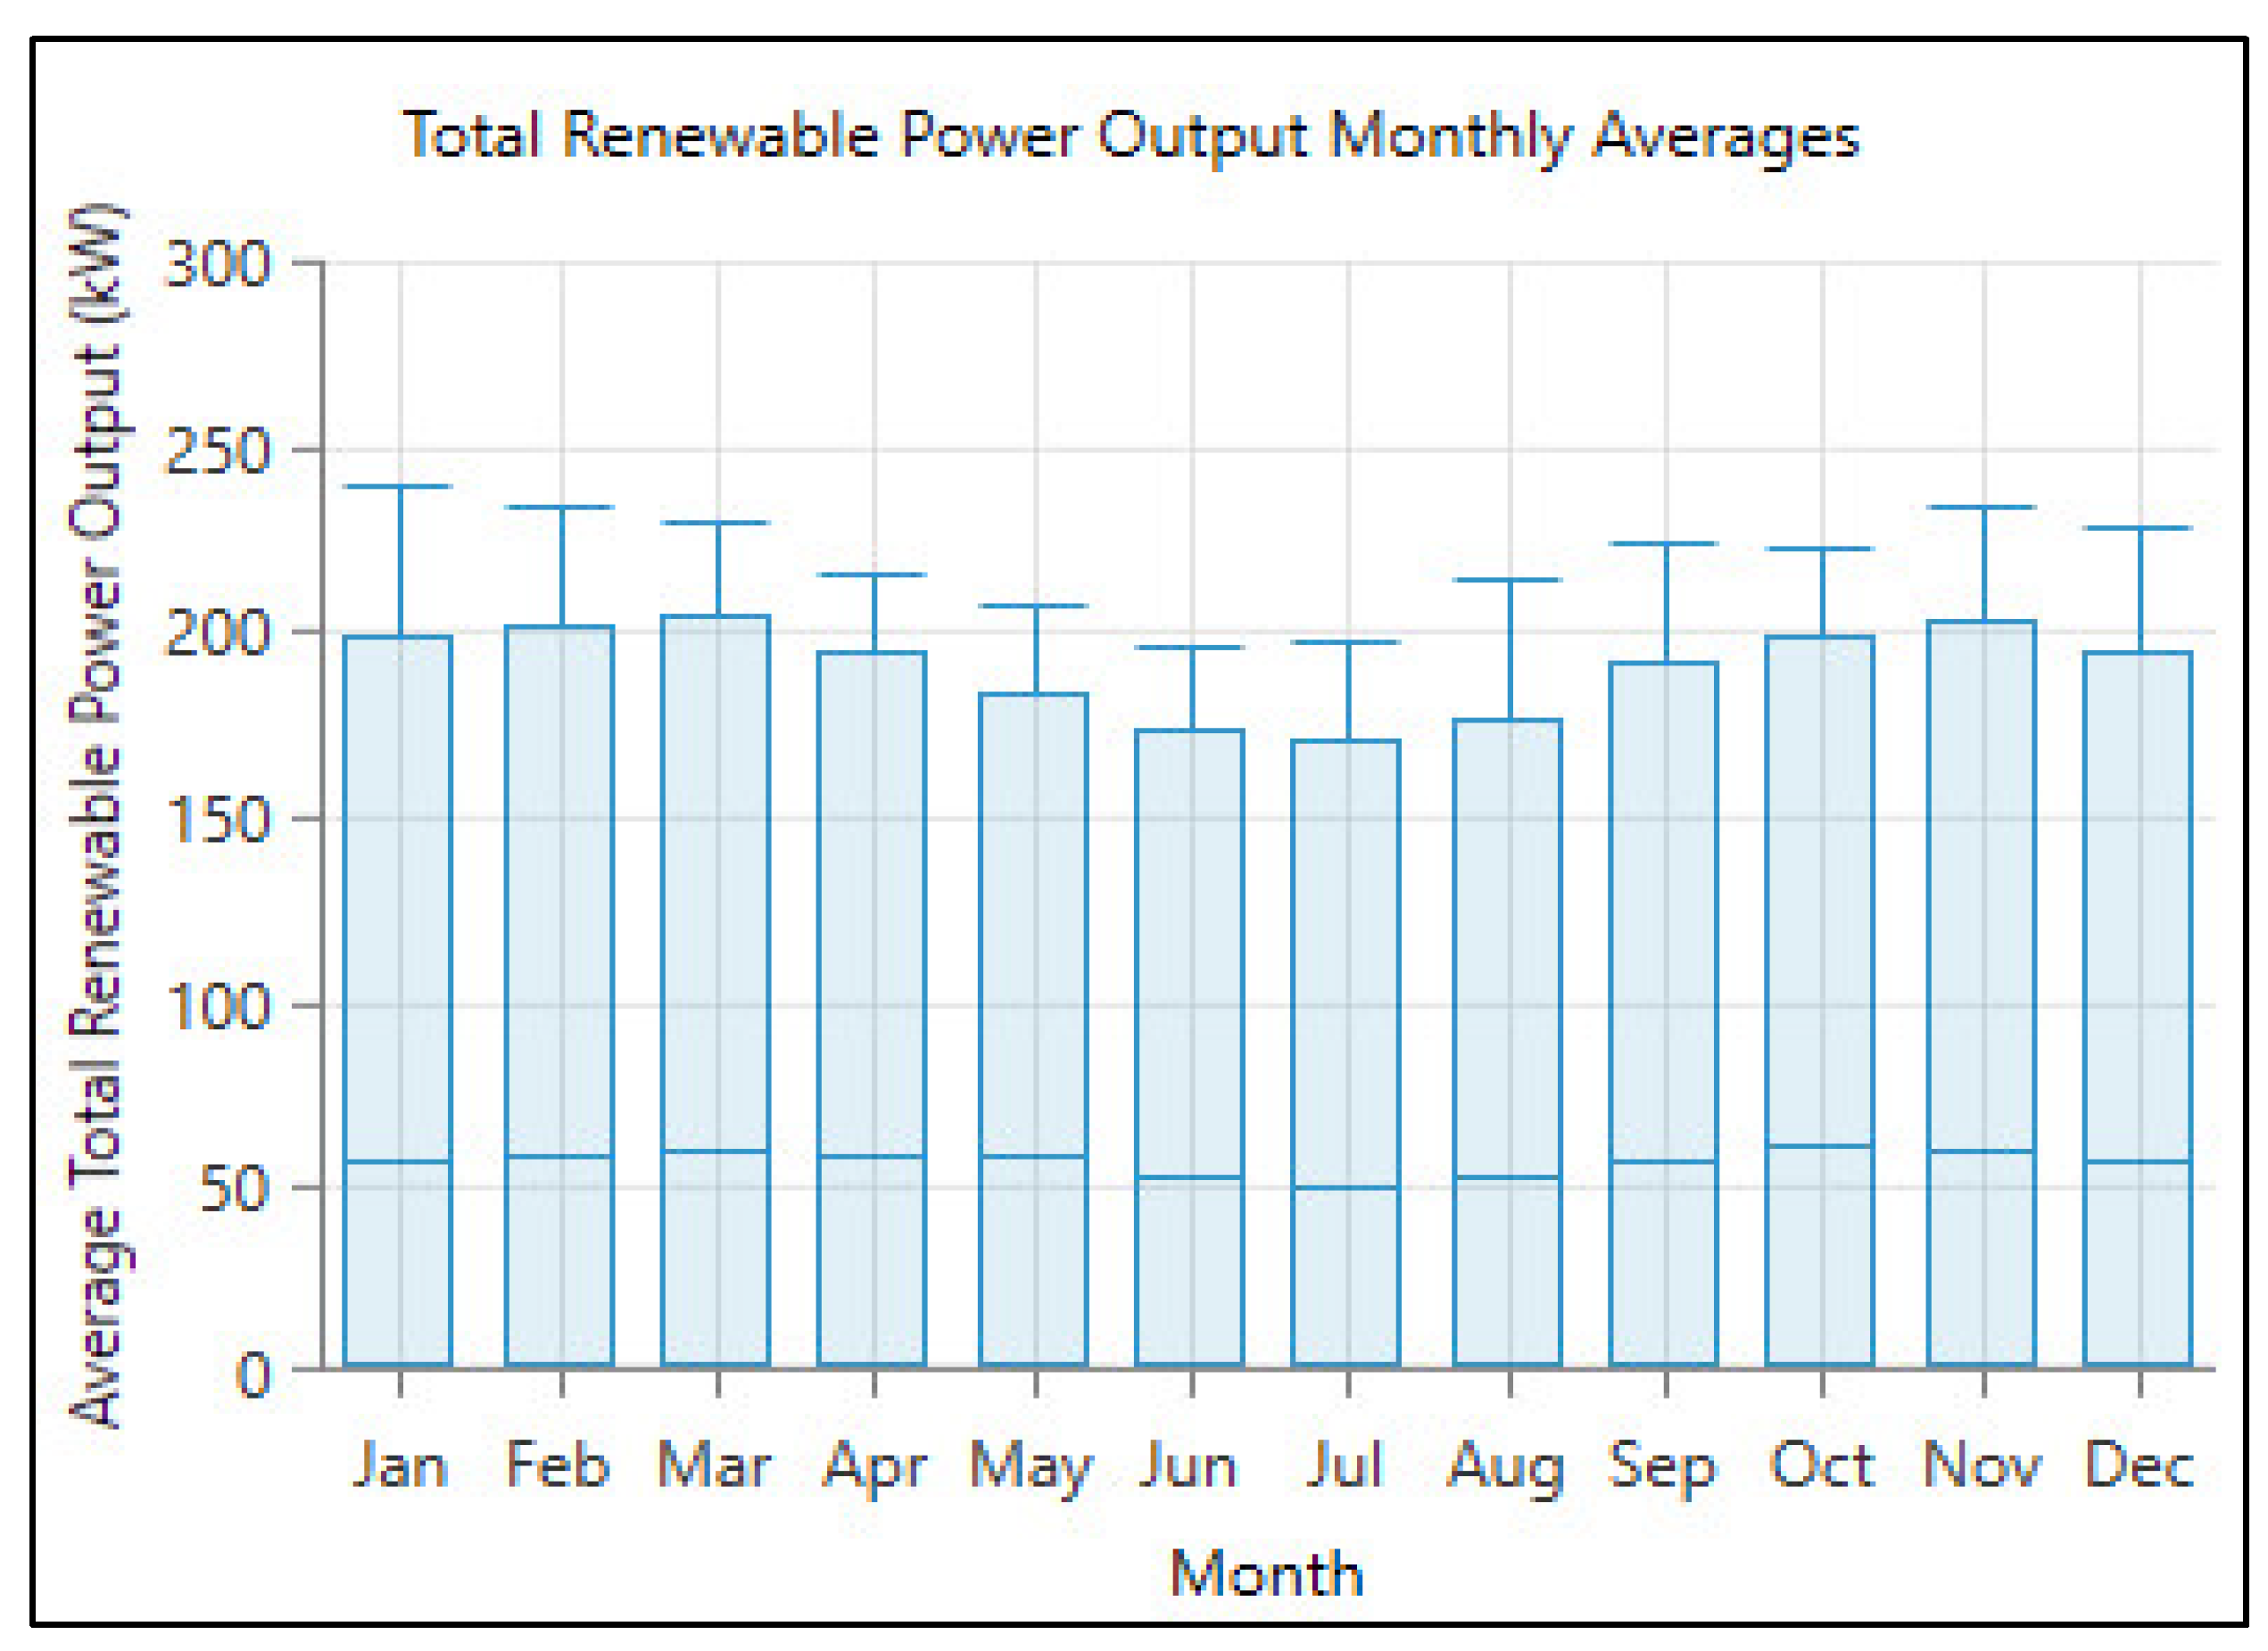
The monthly average variation of the PV power output is presented in Figure 6. It shows that the maximum energy was produced during the months of February, March, October, and November. During these months, the daily average production was 65 kWh, which is equivalent to 1154 kWh of produced energy daily. The annual max value of generated power was around 240 kW, whereas the daily average max of power was 200 kW during these months. The minimum produced power was found in June, July, and August.
The yearly generated energy, calculated using Homer-Pro, was 444,320 kWh. Despite this, the power variation profile was similar to the developed analytical model, as shown in Figure 7. However, a difference between the calculated total energies was observed. This can be explained by the different models used by Homer and Matlab to calculate the output power. Indeed, Homer-Pro contains prepared PV panel parameters and the user cannot change them. The analytical model allows us to adjust the parameters of the PV array according to the PV panel characteristics used. Moreover, Homer-Pro uses the average solar radiation and the temperature average to predict the PV power. For the analytical model, the real data of the solar radiation variation and temperature were used as inputs for the model.

3.3. Experimental and Recorded Real Data

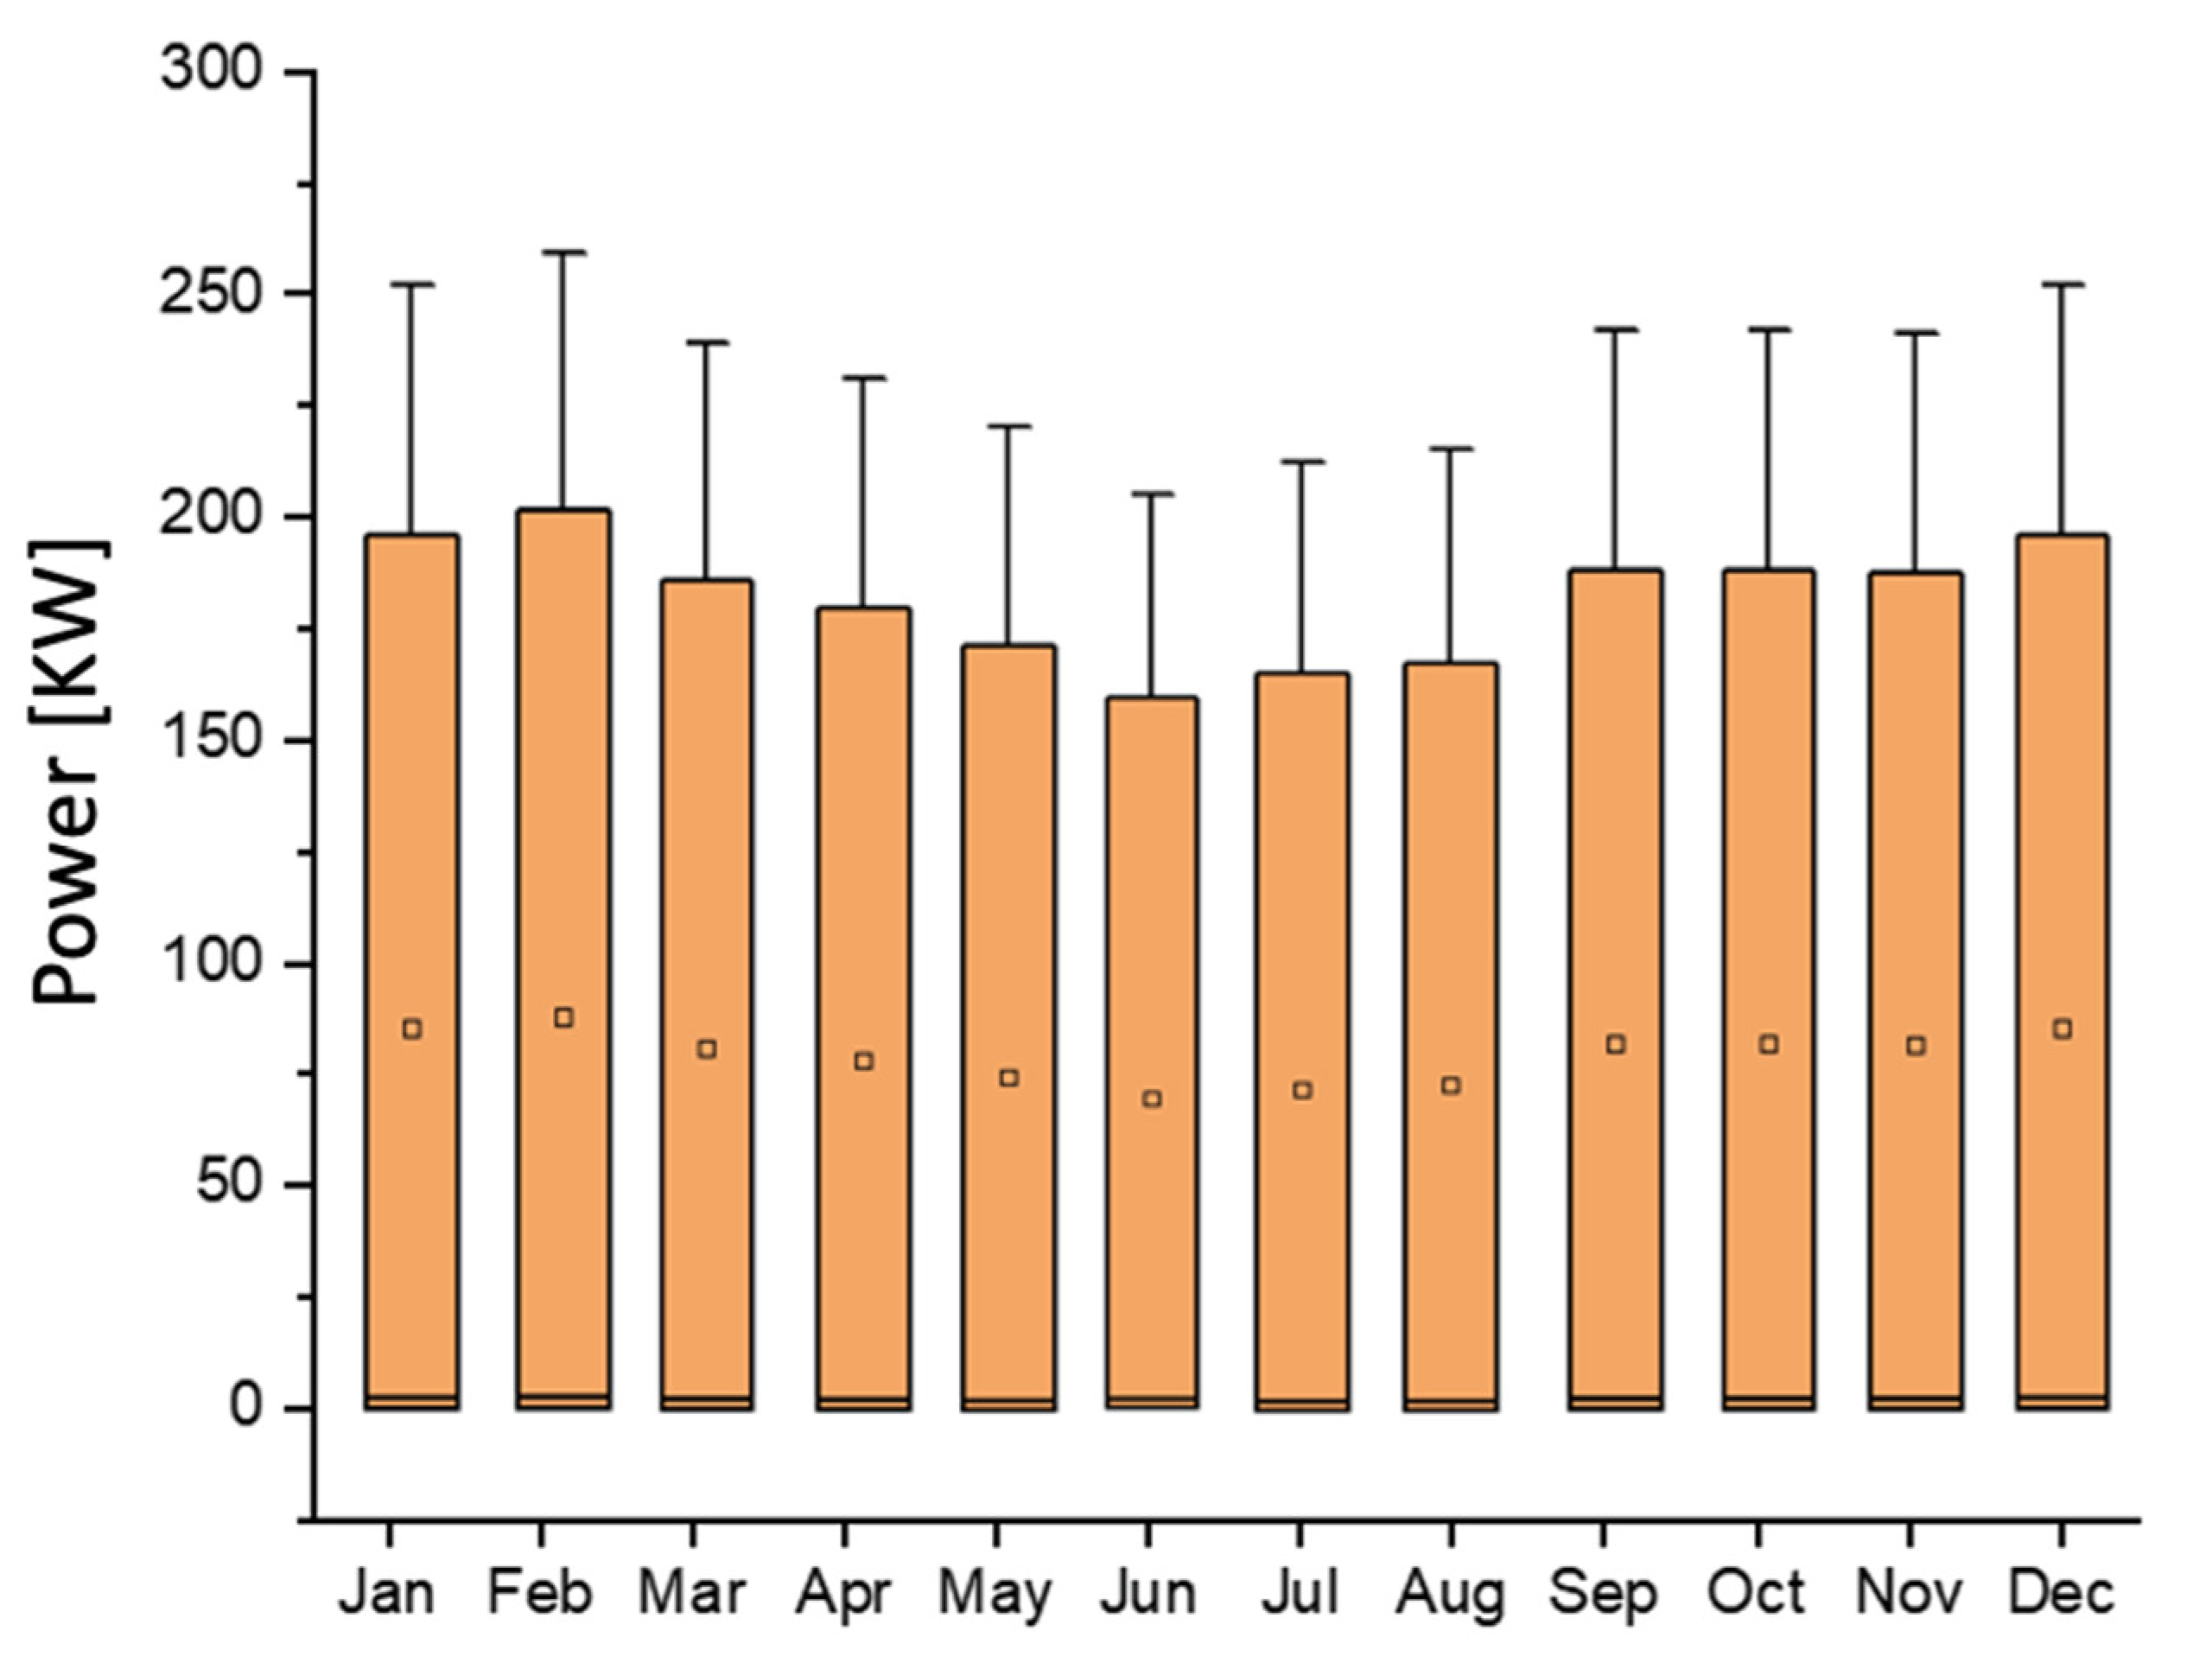
The data provided by the power station control center for one year is plotted as shown in Figure 7. The variation of the power shows that that minimum power was obtained for the months of February and December due to the low solar radiation received by the PV panels.

4. Discussion

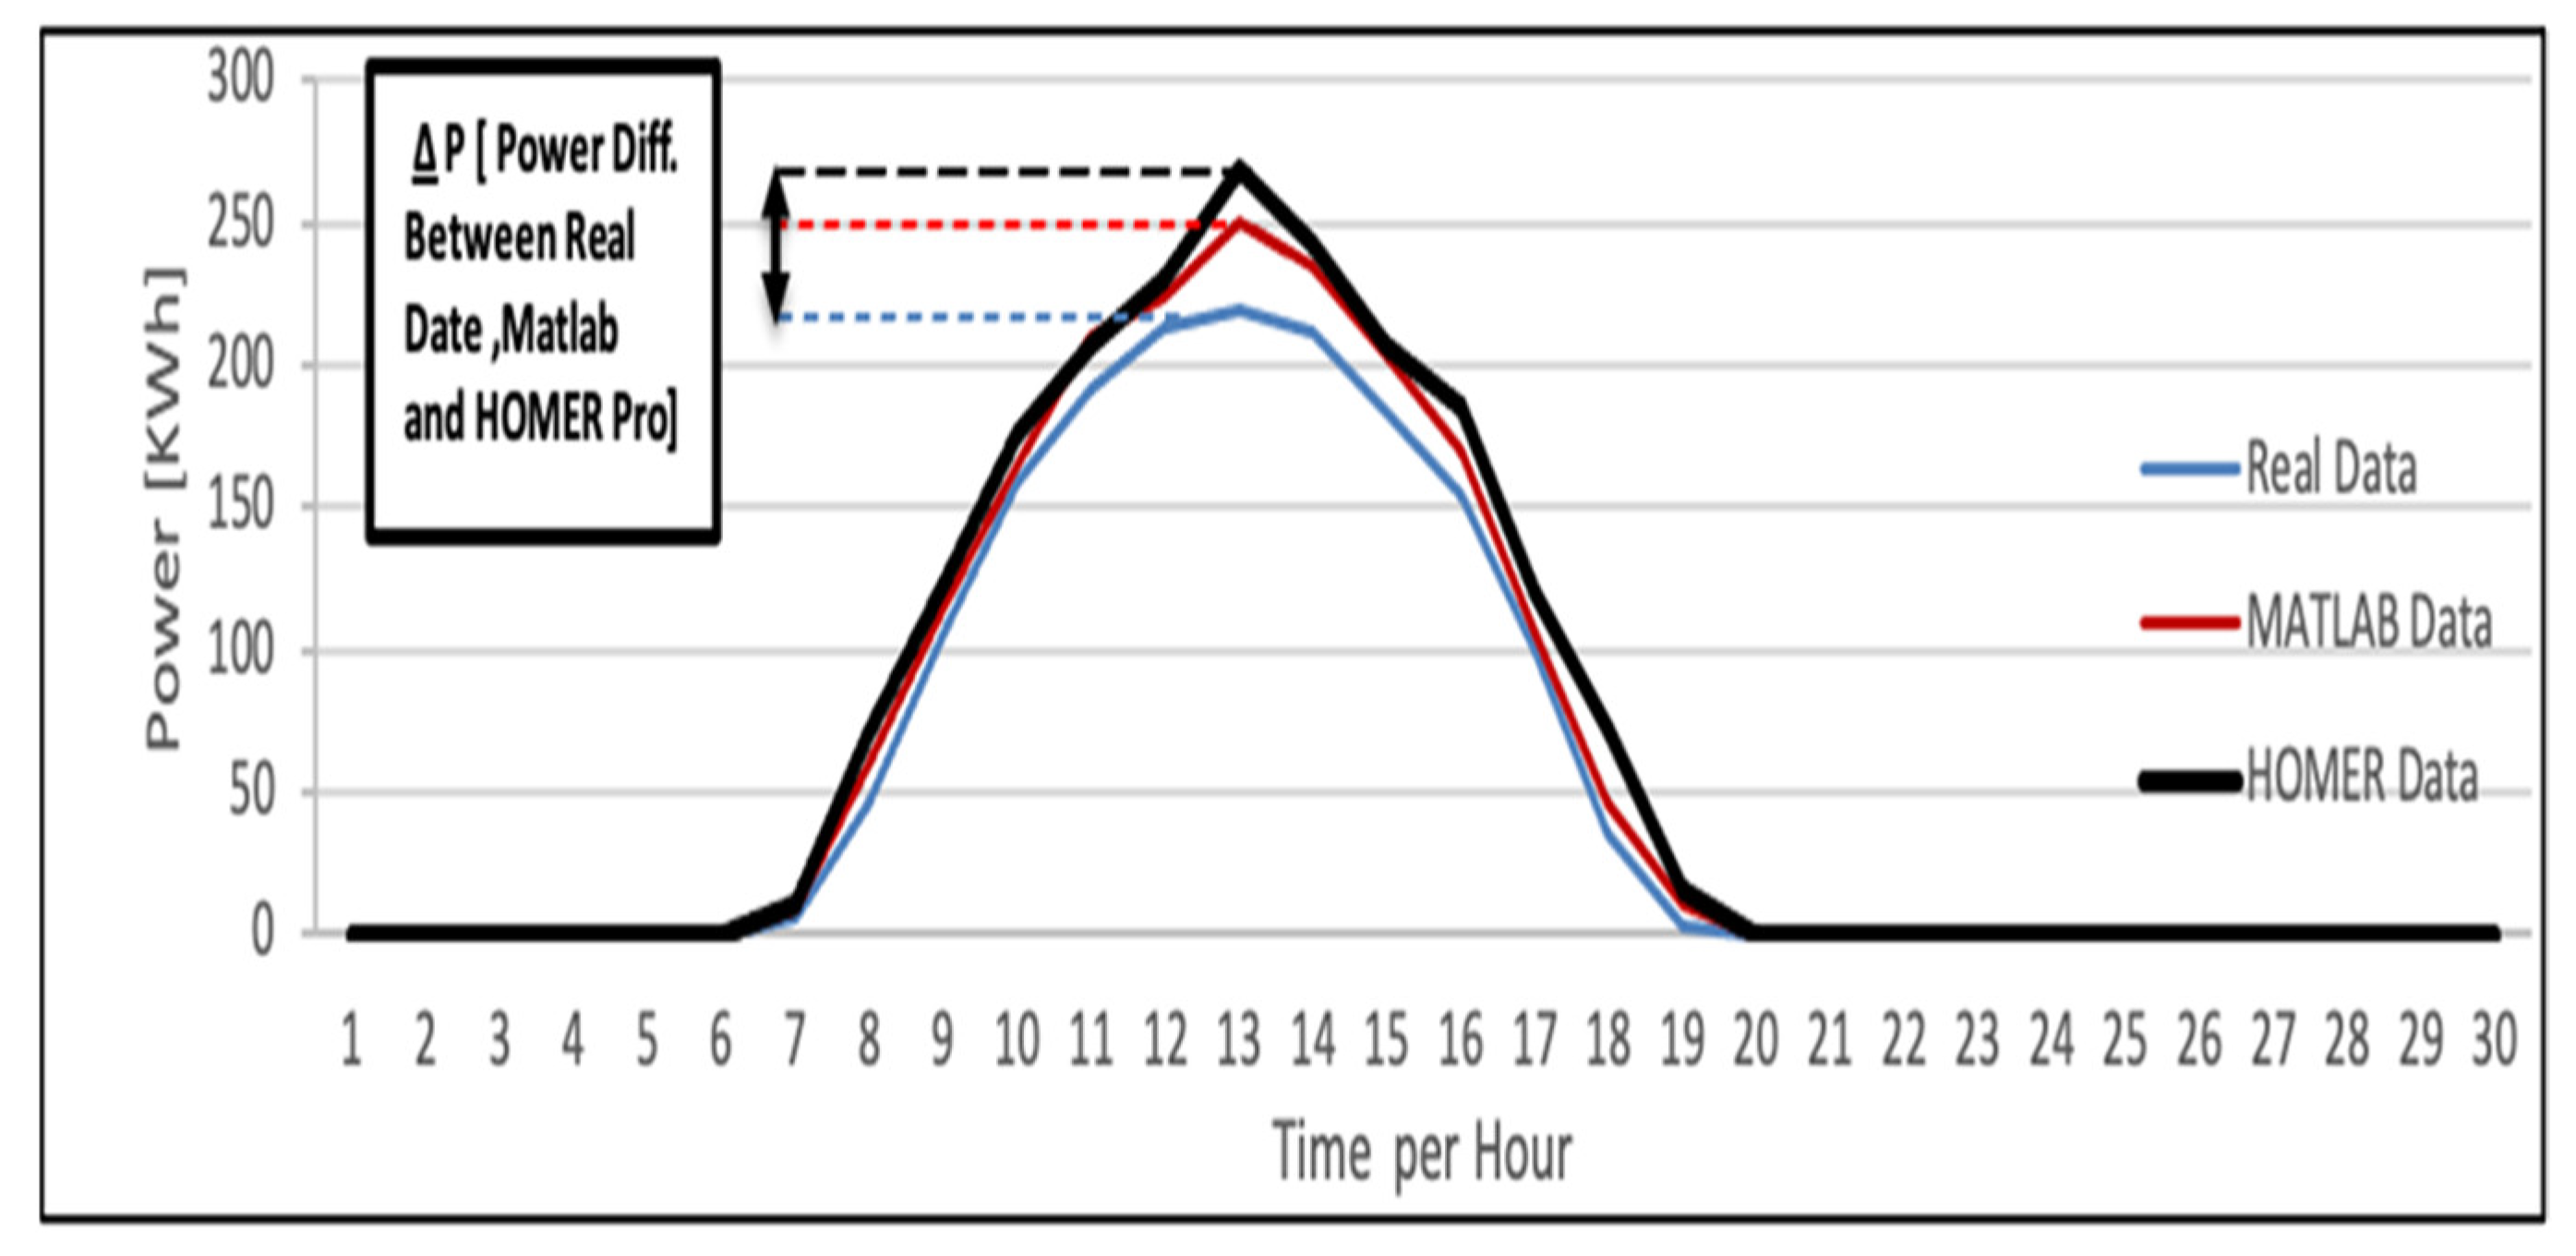
The 250 kWp PV power was simulated using Matlab–Simulink and Homer-Pro. These two methods are based on mathematical models and simulation hypothesizes. In both methods, many factors that can affect the PV power output were neglected. Despite these approximations, the developed analytical model results are identical to the Homer-Pro results. Indeed, the Homer and Matlab models calculate the output power according to the solar radiation and temperature at the site. Table 2 presents the values of the temperature at the PV surface, the solar radiation, and the output power measured using the three different methods, for around 17 h. As the PV power station is located in an area characterized by long days which have around 10 sunny hours, the station starts producing electricity at 6.00 a.m. The produced electricity increases to reach 269 kW in the afternoon, according to Homer model results. At the same time, the maximum produced power calculated using the Matlab model is 250 W. However, the real power measured in the PV power station is only 219.18 kW. The generated power is 10.46 kW at 6.00 p.m, according to the Matlab model results. The Homer model shows a produced power of 15.22 kW, and the real generated power measured in the PV power station is 2.2 kW.
The presented results show differences in power calculation using simulation models. However, the analytical model implemented in Matlab led to accurate results when compared to the Homer Model. Indeed, the analytical model is based on the real data of solar radiation and temperature at the site. However, the Homer model calculates the PV power based on the average of solar radiation and temperature values.
Table 3 summarizes the daily, monthly, and yearly calculated and measured power using the three methods. The differences observed in Table 3 are confirmed by the average and total values of generated electricity through a full year. According to the Homer model, the hourly average produced power is 49.26 kWh. The analytical model shows an average of 48.6 kWh, whereas the real average power is 46 kWh. The total produced electricity in the complete year shows a difference of around 33 MWh between the Homer and the measured results. The difference between the analytical model and experimental results is around 20 MWh for a full year of generated power, as shown in Table 3. The percentage error between the developed models and experimental results show the reliability of the data presented by the analytical model.
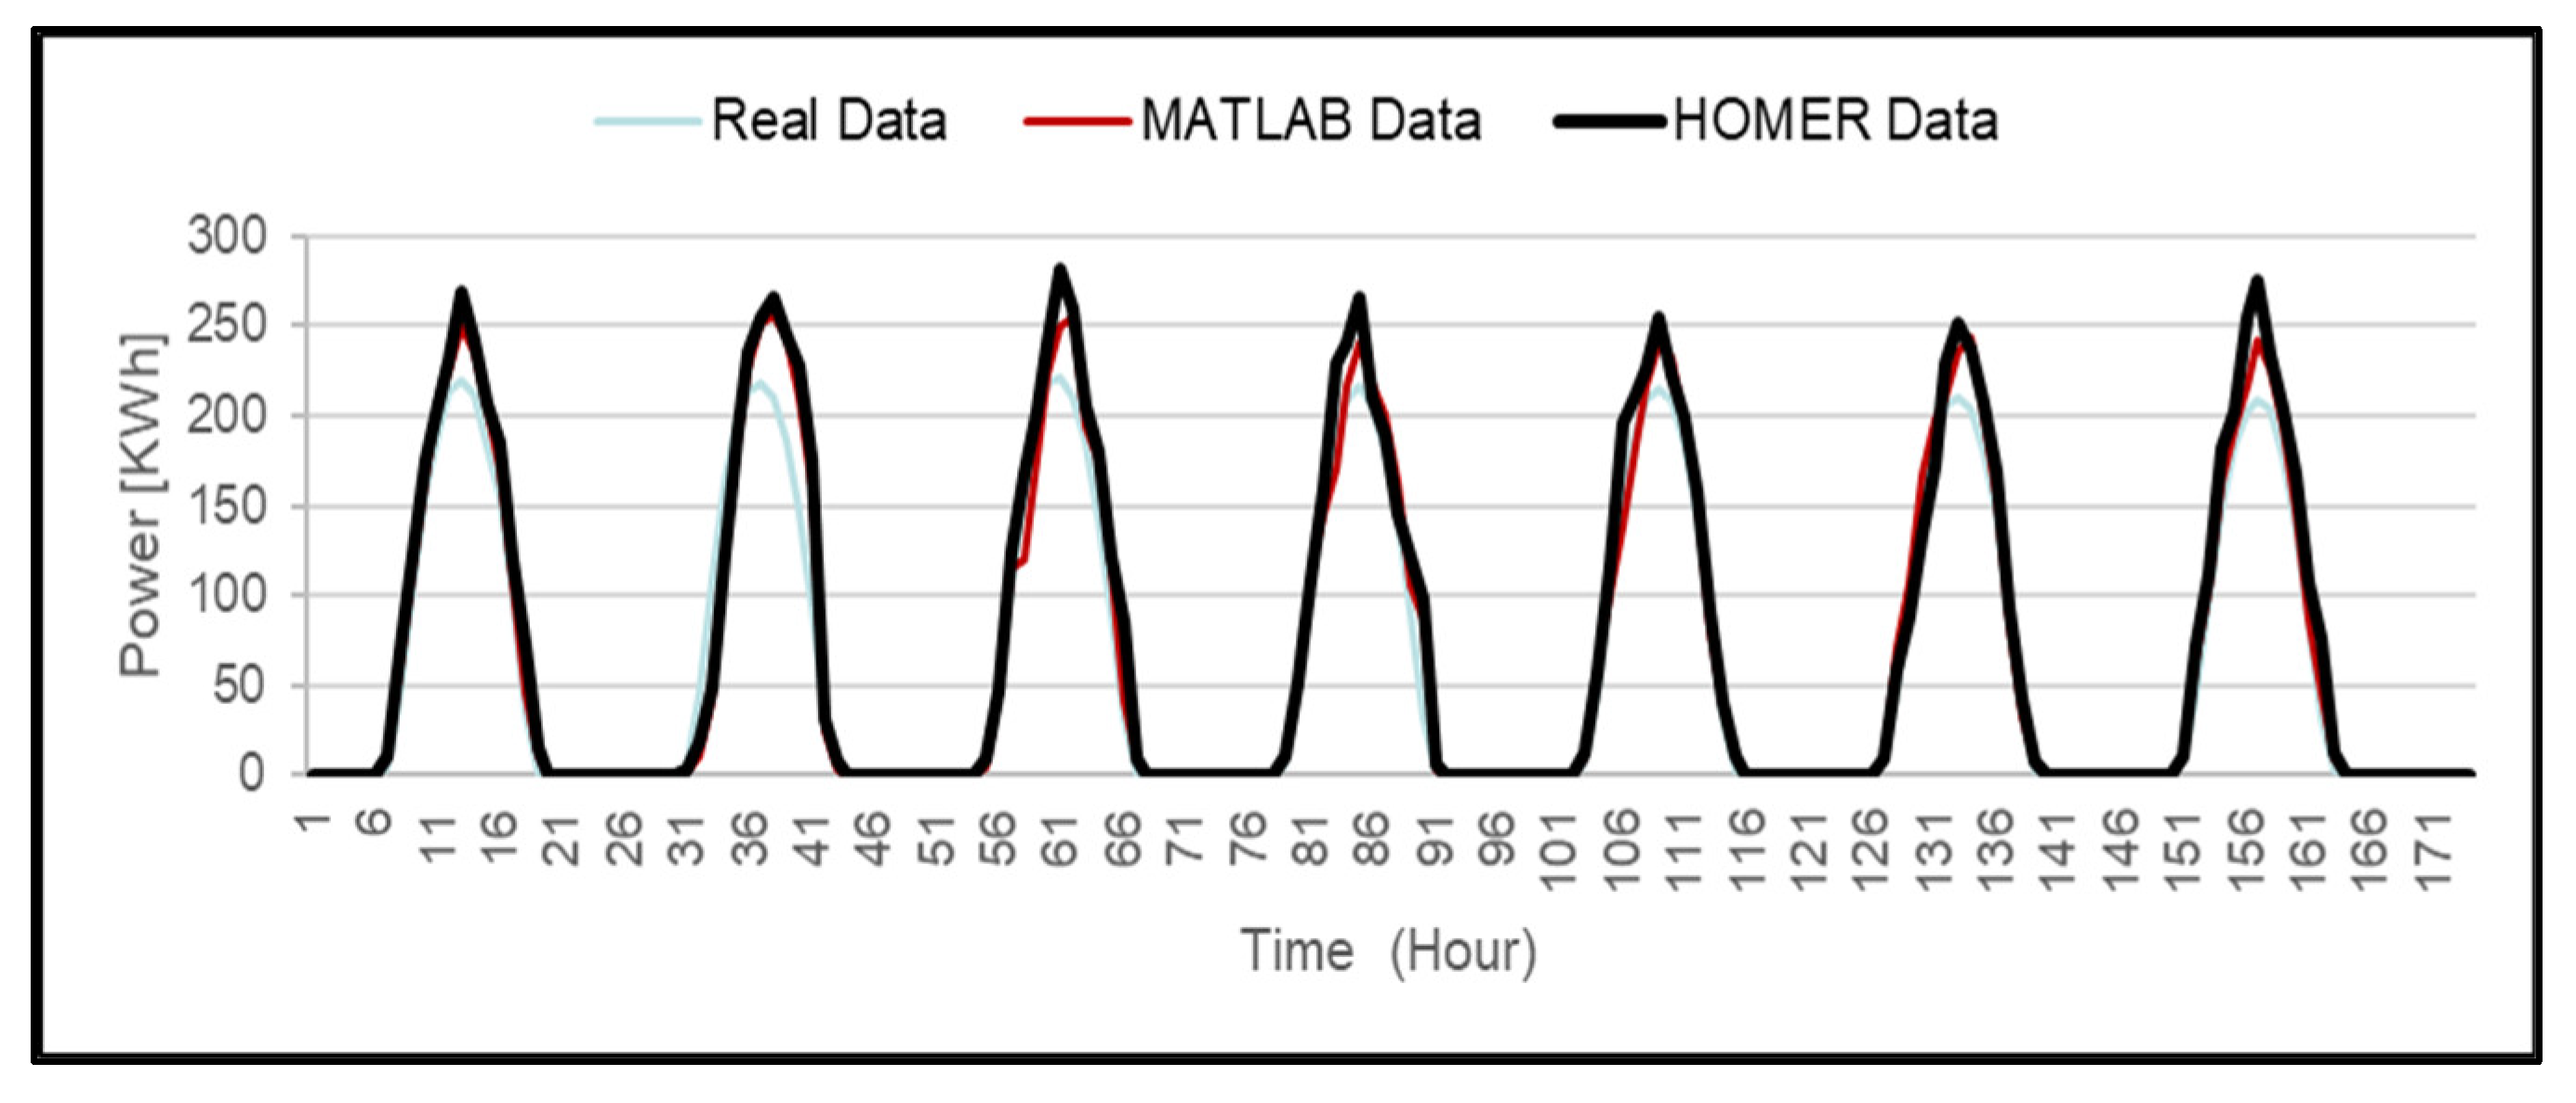
To highlight the differences between the experimental and simulation results using the Homer and Matlab methods, the variation of produced power for a full week is depicted in Figure 8. It shows that the generated power using the Homer and analytical models is higher than the real produced power. For the second day, the error of calculation increases, which is attributed to some variation in solar radiation or temperature, or partial shading, which is not considered in the simulation models.
Figure 9 shows the variation of power for a single day. The results prove that the analytical model presents an error less than the error obtained in the Homer model. Therefore, the developed analytical model implemented in Matlab can be used for the prediction and the sizing of PV power stations. The analytical model can be improved to obtain more accurate results. The black, red, and blue lines represent the real data, the analytical model results, and the Homer simulation results, respectively.

5. Conclusions

This paper has presented a comparison of the generated power of a PV power station using three methods. The first method is Homer software, the second is the analytical model simulated using Matlab, and the last method is based on experimental results and the measurement of the real power produced in the power station.
The obtained results show that the analytical model gives perfect results when compared to Homer. Indeed, the obtained results with the analytical model show a percentage relative error of 4.62% in the total yearly produced electricity. For the same conditions, the percentage relative error obtained with Homer-Pro is around 8.02%. As a result, the analytical model is a more accurate tool for estimating the power that a PV power plant will produce. While the analytical model can be a useful tool for predicting the performance of a PV power plant before it is constructed or for making modifications to existing systems, experimental results offer the most accurate depiction of the actual power production.
The accuracy of the analytical model is affected by a number of parameters, including system part shadings, wind speed, and dust. Therefore, future work must focus on further validating the analytical model by contrasting its predictions with additional experimental findings from various sites and environments. The artificial neural networks and deep learning models will be developed and implemented to simulate and predict the PV power output. On the other hand, in order to further enhance the capabilities of the model, an investigation into the quality of the power will be included. The model will take into consideration power quality metrics such as voltage stability, harmonic distortion, and frequency changes. The improved model will be able to provide a more in-depth study of the performance of the PV system. This integration of power quality analysis will give a more robust and trustworthy prediction, which will allow better understanding and management of the overall efficiency and power output quality of the PV power station. Moreover, this integration of power quality analysis will offer a more accurate and reliable forecast.

Author Contributions

Investigation, F.K.A. and F.B.I.A.; Methodology, P.C.O.; Project administration, F.K.A.; Supervision, F.B.I.A.; Writing—original draft, F.K.A. and I.B.B.; Simulation, I.B.B. and F.K.A.; Data collection, I.B.B. and F.K.A.; Formal analysis, E.M.B.; Writing—review and editing, H.M.; Visualization, H.M. All authors have read and agreed to the published version of the manuscript.

Funding

This research received no external funding.

Institutional Review Board Statement

Not applicable.

Informed Consent Statement

Not applicable.

Data Availability Statement

The data presented in this study are available on request from the corresponding author.

Conflicts of Interest

The authors declare no conflict of interest.

References

  1. Kazem, H.A. Renewable energy in Oman: Status and future prospects. Renew. Sustain. Energy Rev. 2011, 15, 3465–3469. [Google Scholar] [CrossRef]
  2. Chen, X.; Liu, Y.; Wang, Q.; Lv, J.; Wen, J.; Chen, X.; Kang, C.; Cheng, S.; McElroy, M.B. Pathway toward carbon-neutral electrical systems in China by mid-century with negative CO2 abatement costs informed by high-resolution modeling. Joule 2021, 5, 2715–2741. [Google Scholar] [CrossRef]
  3. Rahman, M.M.; Khan, I.; Field, D.L.; Techato, K.; Alameh, K. Powering agriculture: Present status, future potential, and challenges of renewable energy applications. Renew. Energy 2022, 188, 731–749. [Google Scholar] [CrossRef]
  4. Obaideen, K.; Olabi, A.G.; Al Swailmeen, Y.; Shehata, N.; Abdelkareem, M.A.; Alami, A.H.; Rodriguez, C.; Sayed, E.T. Solar Energy: Applications, Trends Analysis, Bibliometric Analysis and Research Contribution to Sustainable Development Goals (SDGs). Sustainability 2023, 15, 1418. [Google Scholar] [CrossRef]
  5. Mukisa, N.; Zamora, R.; Lie, T.T. Energy Business Initiatives for Grid-Connected Solar Photovoltaic Systems: An Overview. Sustainability 2022, 14, 15060. [Google Scholar] [CrossRef]
  6. Ahmad, T.; Zhang, D.; Huang, C.; Zhang, H.; Dai, N.; Song, Y.; Chen, H. Artificial intelligence in sustainable energy industry: Status Quo, challenges and opportunities. J. Clean. Prod. 2021, 289, 125834. [Google Scholar] [CrossRef]
  7. O’Shaughnessy, E.; Cruce, J.R.; Xu, K. Too much of a good thing? Global trends in the curtailment of solar PV. Sol. Energy 2020, 208, 1068–1077. [Google Scholar] [CrossRef]
  8. You, M.; Wang, Q.; Sun, H.; Castro, I.; Jiang, J. Digital twins based day-ahead integrated energy system scheduling under load and renewable energy uncertainties. Appl. Energy 2022, 305, 117899. [Google Scholar] [CrossRef]
  9. Sharadga, H.; Hajimirza, S.; Balog, R.S. Time series forecasting of solar power generation for large-scale photovoltaic plants. Renew. Energy 2020, 150, 797–807. [Google Scholar] [CrossRef]
  10. Ghalandari, M.; Maleki, A.; Haghighi, A.; Shadloo, M.S.; Nazari, M.A.; Tlili, I. Applications of nanofluids containing carbon nanotubes in solar energy systems: A review. J. Mol. Liq. 2020, 313, 113476. [Google Scholar] [CrossRef]
  11. Barhoumi, E.M.; Belgacem, I.B.; Khiareddine, A.; Zghaibeh, M.; Tlili, I. A Neural Network-Based Four Phases Interleaved Boost Converter for Fuel Cell System Applications. Energies 2018, 11, 3423. [Google Scholar] [CrossRef]
  12. Li, W.; Sengupta, N.; Dechent, P.; Howey, D.; Annaswamy, A.; Sauer, D.U. One-shot battery degradation trajectory prediction with deep learning. J. Power Sources 2021, 506, 230024. [Google Scholar] [CrossRef]
  13. Ridha, H.M.; Gomes, C.; Hizam, H.; Ahmadipour, M.; Heidari, A.A.; Chen, H. Multi-objective optimization and multi-criteria decision-making methods for optimal design of standalone photovoltaic system: A comprehensive review. Renew. Sustain. Energy Rev. 2021, 135, 110202. [Google Scholar] [CrossRef]
  14. Rejeb, O.; Shittu, S.; Ghenai, C.; Li, G.; Zhao, X.; Bettayeb, M. Optimization and performance analysis of a solar concentrated photovoltaic-thermoelectric (CPV-TE) hybrid system. Renew. Energy 2020, 152, 1342–1353. [Google Scholar] [CrossRef]
  15. Sailor, D.J.; Anand, J.; King, R.R. Photovoltaics in the built environment: A critical review. Energy Build. 2021, 253, 111479. [Google Scholar] [CrossRef]
  16. Conceição, R.; González-Aguilar, J.; Merrouni, A.A.; Romero, M. Soiling effect in solar energy conversion systems: A review. Renew. Sustain. Energy Rev. 2022, 162, 112434. [Google Scholar] [CrossRef]
  17. Alzoubi, A. Machine Learning for Intelligent Energy Consumption in Smart Homes. Int. J. Comput. Inf. Manuf. 2022, 2, 62–75. [Google Scholar] [CrossRef]
  18. Okonkwo, P.C.; Barhoumi, E.M.; Emori, W.; Shammas, M.I.; Uzoma, P.C.; Mohamed, A.M.A.; Abdullah, A.M. Economic evaluation of hybrid electrical systems for rural electrification: A case study of a rural community in Nigeria. Int. J. Green Energy 2022, 19, 1059–1071. [Google Scholar] [CrossRef]
  19. Barhoumi, E.M.; Okonkwo, P.C.; Zghaibeh, M.; Belgacem, I.B.; Farhani, S.; Bacha, F. Optimization of PV-Grid Connected System Based Hydrogen Refueling Station. In Proceedings of the 2022 8th International Conference on Control, Decision and Information Technologies (CoDIT), Istanbul, Turkey, 17–20 May 2022; pp. 1603–1607. [Google Scholar] [CrossRef]
  20. Al-Karaghouli, A.; Kazmerski, L.L. Optimization and life-cycle cost of health clinic PV system for a rural area in southern Iraq using HOMER software. Sol. Energy 2010, 84, 710–714. [Google Scholar] [CrossRef]
  21. Sharma, A.; Singh, A.; Khemariya, M. Homer Optimization Based Solar PV; Wind Energy and Diesel Generator Based Hybrid System. Int. J. Soft Comput. Eng. 2013, 3, 199–204. [Google Scholar]
  22. Garni, H.A.; Awasthi, A. Techno-economic feasibility analysis of a solar PV grid-connected system with different tracking using HOMER software. In Proceedings of the 2017 IEEE International Conference on Smart Energy Grid Engineering (SEGE), Oshawa, ON, Canada, 14–17 August 2017; pp. 217–222. [Google Scholar] [CrossRef]
  23. Cebecauer, T.; Suri, M. Typical Meteorological Year Data: SolarGIS Approach. Energy Procedia 2015, 69, 1958–1969. [Google Scholar] [CrossRef]
  24. Tarigan, E.; Djuwari; Purba, L. Assessment of PV Power Generation for Household in Surabaya Using SolarGIS–pvPlanner Simulation. Energy Procedia 2014, 47, 85–93. [Google Scholar] [CrossRef]
  25. Jamil, I.; Zhao, J.; Zhang, L.; Jamil, R.; Rafique, S.F. Evaluation of Energy Production and Energy Yield Assessment Based on Feasibility, Design, and Execution of 3 × 50 MW Grid-Connected Solar PV Pilot Project in Nooriabad. Int. J. Photoenergy 2017, 2017, 6429581. [Google Scholar] [CrossRef]
  26. Zhang, Y.; Yu, Y.; Meng, F.; Liu, Z. Experimental Investigation of the Shading and Mismatch Effects on the Performance of Bifacial Photovoltaic Modules. IEEE J. Photovolt. 2020, 10, 296–305. [Google Scholar] [CrossRef]
  27. Akram, N.; Khan, L.; Agha, S.; Hafeez, K. Global Maximum Power Point Tracking of Partially Shaded PV System Using Advanced Optimization Techniques. Energies 2022, 15, 4055. [Google Scholar] [CrossRef]
  28. Singh, A.; Baredar, P.; Gupta, B. Techno-economic feasibility analysis of hydrogen fuel cell and solar photovoltaic hybrid renewable energy system for academic research building. Energy Convers. Manag. 2017, 145, 398–414. [Google Scholar] [CrossRef]
  29. Alizadeh, H.; Nazari, M.A.; Ghasempour, R.; Shafii, M.B.; Akbarzadeh, A. Numerical analysis of photovoltaic solar panel cooling by a flat plate closed-loop pulsating heat pipe. Sol. Energy 2020, 206, 455–463. [Google Scholar] [CrossRef]
  30. Okedu, K.E.; Uhunmwangho, R. Optimization of Renewable Energy Efficiency using HOMER. Int. J. Renew. Energy Res. 2014, 4, 421–427. [Google Scholar]
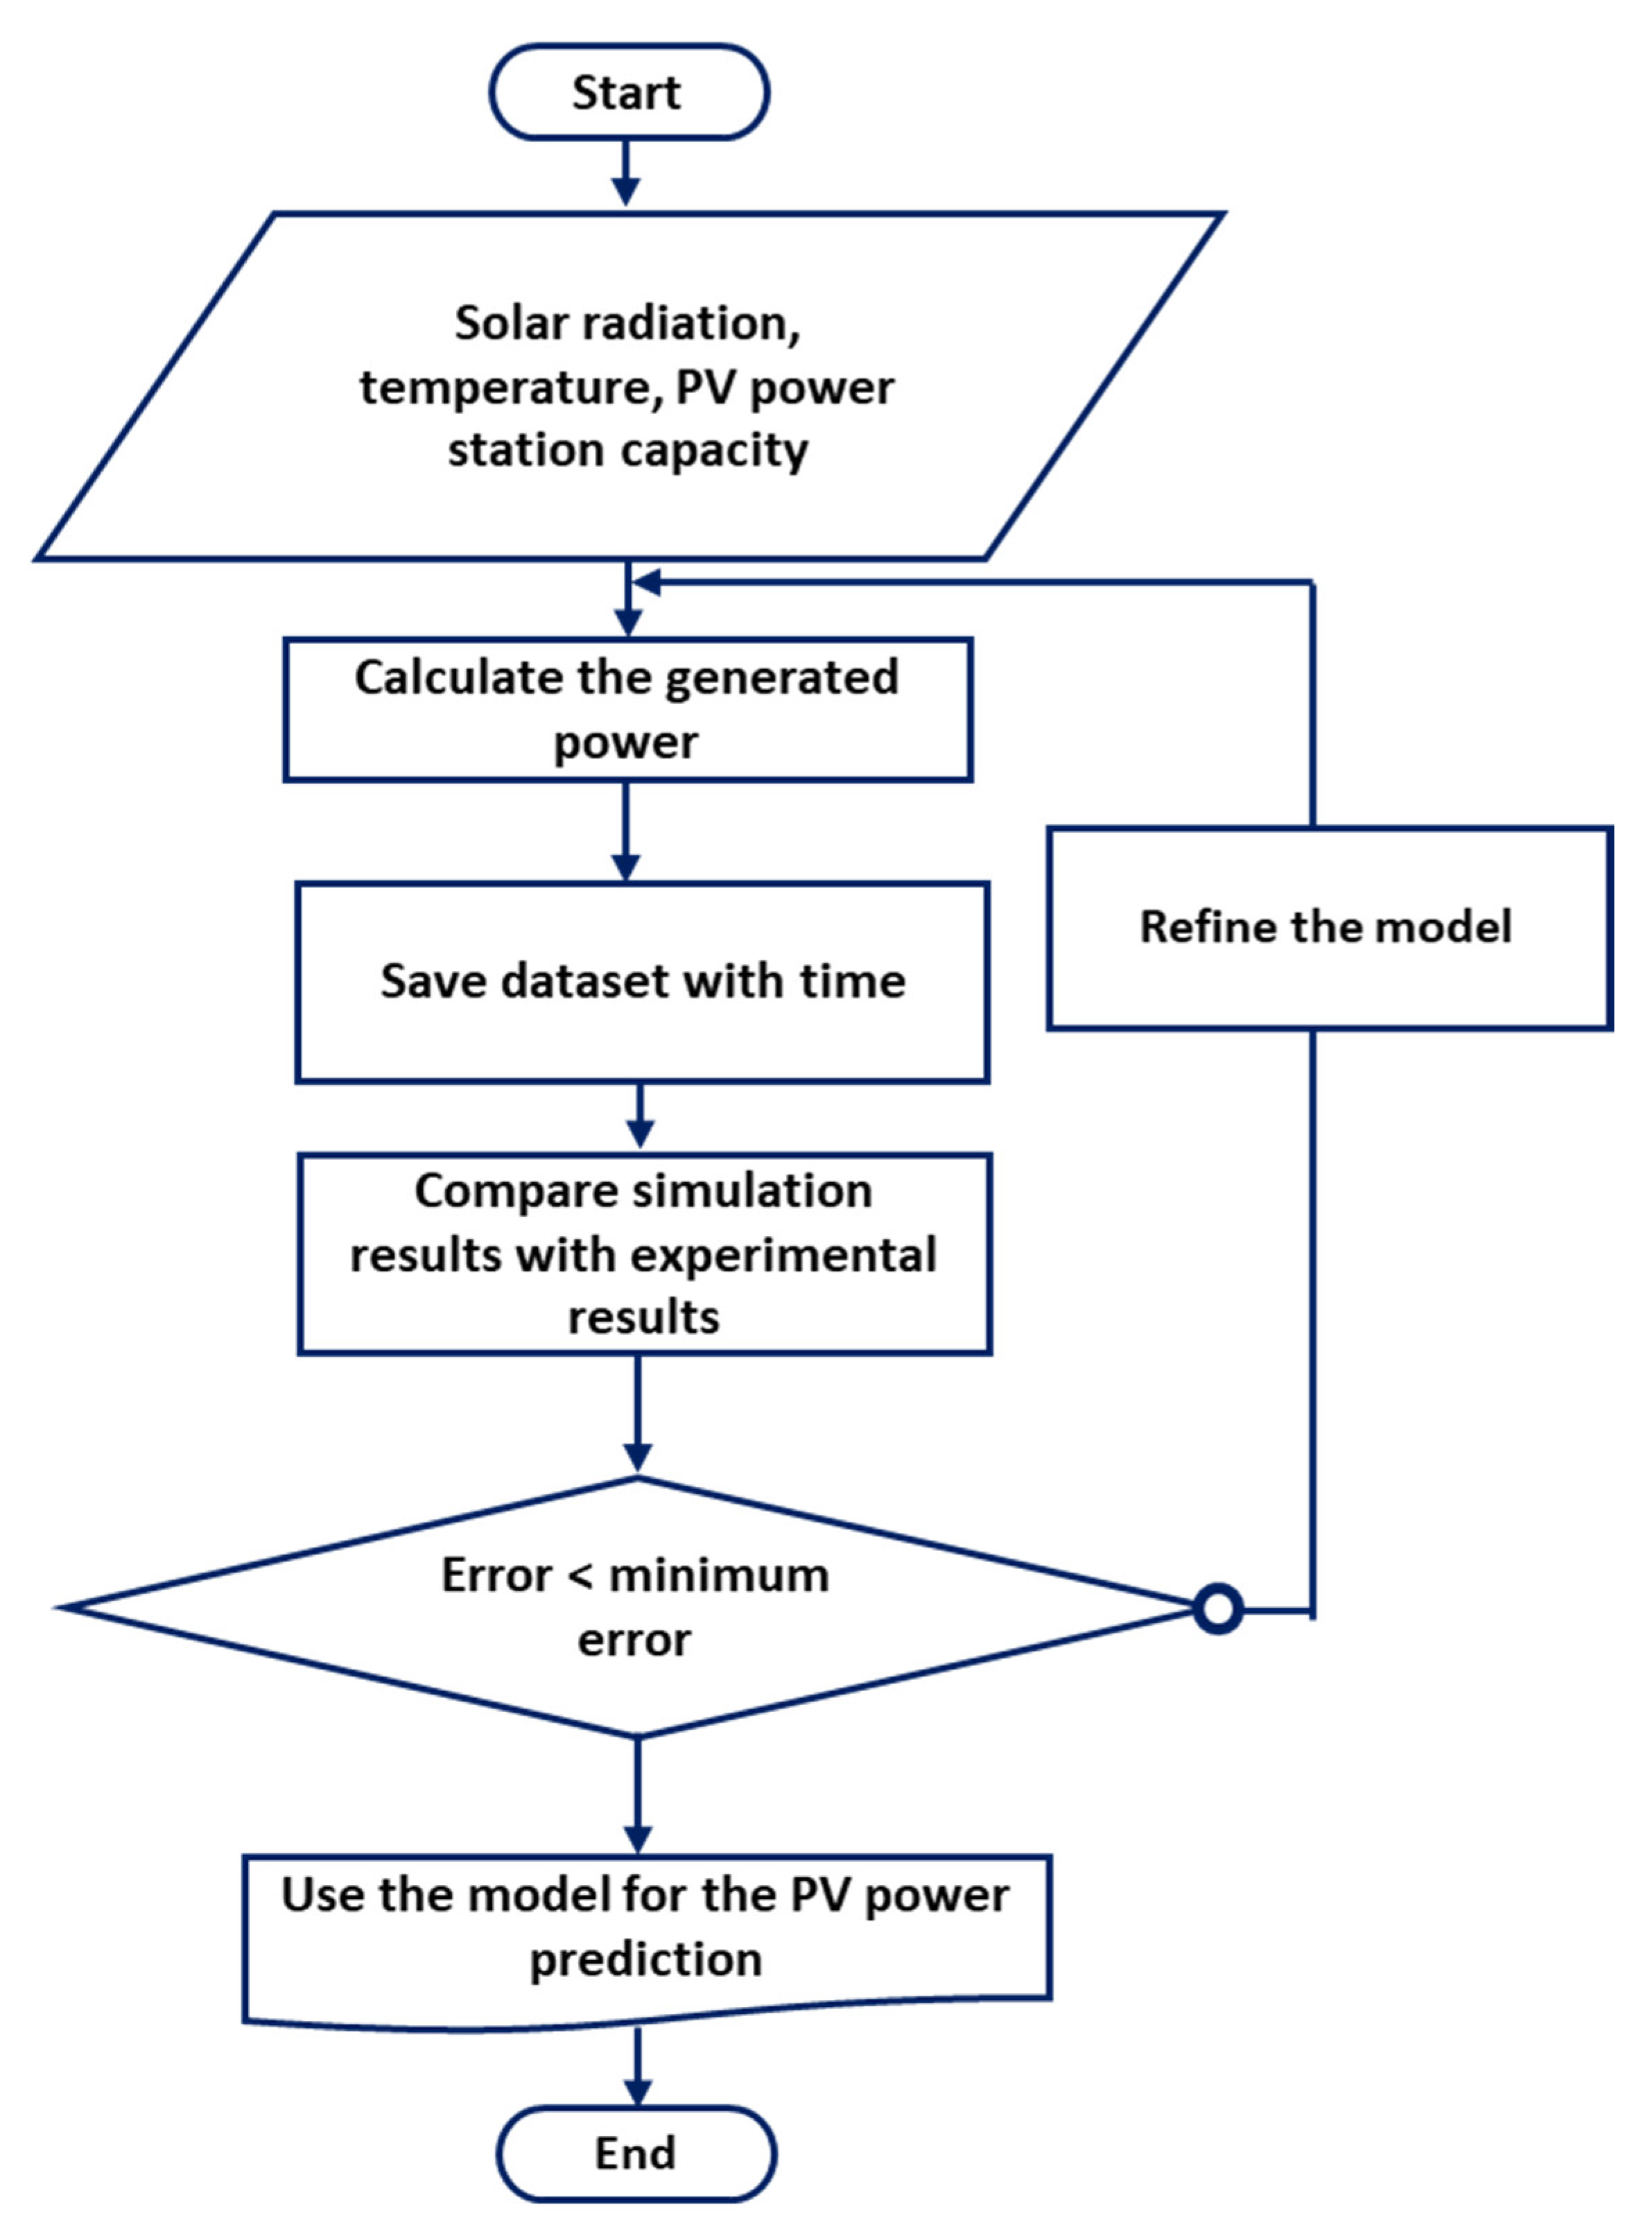
Figure 1. Flowchart for the development of the Matlab–Simulink Model.
Sustainability 15 08904 g001
Figure 2. Homer Model of the grid-connected PV system. (a) Model; (b) site location; (c) temperature; (d) solar radiation.
Sustainability 15 08904 g002
Figure 3. Grid connected PV system in Al-Mazyona—Oman.
Sustainability 15 08904 g003
Figure 4. PV output power using analytical Matlab Model.
Sustainability 15 08904 g004
Figure 5. PV power output (Homer Model).
Sustainability 15 08904 g005
Figure 6. Energy sold to the grid (Homer Model).
Sustainability 15 08904 g006
Figure 7. PV power output for one year (recorded data).
Sustainability 15 08904 g007
Figure 8. Daily average profile of the output.
Sustainability 15 08904 g008
Figure 9. Daily average profile of the output.
Sustainability 15 08904 g009
Table 1. Simulation parameters of the PV power station.
ParameterSymbolValue
PhotocurrentIph8 A
Saturation currentI02.5 × 10−10 A
Series resistanceRs0.5 Ω
Diode ideality factora1.3
Thermal voltageVT25.85 mV
Nominal output power P0250 kW
Reference temperatureT025 °C
Reference solar radiationG01000 W/m2
Temperature coefficientα0.5%/°C
Table 2. Comparison of the analytical model with Homer and Experimental results for 17 h.
TimeT.PV. Surface [°C]Solar
Radiation [W/m2]
Generated Power Recorded Data [kWh]Generated Power
MatalbModel [kWh]
Generated Power Homer Model [kWh]
4 a.m.21.450000
5 a.m.20.660000
6 a.m.20.8121.025.238.656610.998
7 a.m.26.52208.2745.6559.9170.12675
8 a.m.34.84478.58106.15114.97122.89457
9 a.m.46.21722.03158.4165.593175.3129
10 a.m.57.02906.68191.68209.593207.4723
11 a.m.59.191017.42213.13223.656230.1718
12 p.m.59.421049.62219.18250.07269.4676
1 p.m.57.93998.62212.3235.285242.39704
2 p.m.52.86869.34183.43204.334207.10436
3 p.m.49.23661.32154.28170.5987185.45966
4 p.m.43.04398.08100.1106.9301120.33
5 p.m.36.9145.635.245.53372.467
6 p.m.32.3942.210.46615.222
7 p.m.30.70000
8 p.m.30.060000
9 p.m.29.520000
10 p.m.28.250000
Table 3. Comparison of the average and total production results.
Experimental Results Analytical Model% ErrorHomer% Error
Hourly average produced power46 kWh48.6 kWh5.6549.2 kWh6.96
Daily average produced power1090 kWh1120 kWh2.751154 kWh5.87
Monthly average produced power36.5 MWh38 MWh4.1139 MWh6.85
Monthly maximum produced power37 MWh39.8 MWh7.5740.3 MWh8.92
Monthly minimum produced power33.5 MWh34 MWh1.4935 MWh4.48
Yearly produced power 411,252 kWh430,100 kWh4.62444,320 kWh8.02
Disclaimer/Publisher’s Note: The statements, opinions and data contained in all publications are solely those of the individual author(s) and contributor(s) and not of MDPI and/or the editor(s). MDPI and/or the editor(s) disclaim responsibility for any injury to people or property resulting from any ideas, methods, instructions or products referred to in the content.