Abstract
This study aims to evaluate the fatigue phenomenon in recycled hot asphalt mixture for an asphalt surface layer. Eight mixtures were evaluated in the laboratory, and the samples were divided into two major groups: four mixtures containing neat binder and RAP from source 1 (RAP with neat binder) and four mixtures containing SBS-modified binder and RAP from source 2 (RAP with SBS-modified binder). The levels of RAP incorporation were 0%, 10%, 20%, and 30% in relation to the total weight of the mixtures. The mixtures followed the Marshall mix design methodology. The results indicate that mixtures with polymer-modified binder presented better performance, whereas the addition of RAP slightly decreased the resistance to fatigue cracking. In terms of economic analysis, the use of RAP, for all cases, leads to a reduction in production costs due to the reduction of the binder and aggregate added, with savings of up to 14.1% in the case of 30% of RAP for the SBS binder. When evaluating the economic impact of inserting RAP and its relationship with fatigue performance in the long term, it can be observed that the type of binder added impacts the results: mixtures with SBS binder present economic gains within acceptable quality parameters up to 30% RAP insertion; for mixtures with neat binder, the percentage of up to 10% RAP is advantageous.
1. Introduction
Throughout its service life, asphalt pavement undergoes thermal-oxidative aging and integrity loss mechanisms [1,2], resulting in damages such as rutting and/or fatigue cracking. Rehabilitating this pavement may involve removing part or all the asphalt layer through milling, giving rise to the material called RAP (Reclaimed Asphalt Pavement). This material can be reused via incorporating it into layers of bases or sub-bases [3,4] and/or to produce new asphalt pavements [5,6], resulting in environmental and economic benefits due to reduced consumption of energy, aggregates, virgin binders, and greenhouse gases [7,8,9,10].
Although the use of RAP has been highlighted in recent decades, the transport departments of several countries limit the RAP incorporation for the production of asphalt mixtures to 15 to 30% in China [11] and 15 to 45% in the US [12]. This limitation is due to the properties of reclaimed asphalt binder, which is characterized by high stiffness, elasticity, and brittleness. These properties can lead to premature damage such as fatigue failure and cracking at low temperatures [6,13,14,15,16,17,18,19,20].
In addition, some properties and phenomena make the assessment of fatigue cracking of these asphalt mixtures complex. The origin and level of aging of the RAP influence the degree of binder activity (DoA) and availability (DoAv), which represent the minimum and maximum amount, respectively, of RAP binder that can be considered in a mixture design and are intrinsic properties of the material. The interaction of the RAP binder with virgin materials or rejuvenating agents is linked to a phenomenon called degree of binder blending (DoB) and describes the contribution of the RAP binder to the final properties of the recycled mix [10,21,22].
Finally, the different tests show a different response of the recycled blends in terms of fatigue. Tabakovic et al. (2010) [23], using the indirect tensile test, found that a mixture with 30% content had better behavior than a mixture with 10%. The study conducted by [24] showed from the indirect tensile fatigue test that the fatigue life of the recycled asphalt mixture decreased with increasing RAP content, loading rate, and test temperature. In addition, fatigue life decreased with increasing loading frequency. Moreover, fatigue life increased with increasing RAP content as observed in the four-point bending test conducted by Tomlinson (2012) [25]. Ref. [17] identified, using the four-point bending test, loss of performance with 25% of RAP. The same authors identified similar behavior to the mixture without RAP from the use of a rejuvenating agent. Additionally, [26] discovered a significant enhancement in the fatigue performance of asphalt mixtures when 40% RAP was added, based on the tensile-compression test. Ref. [27] established that high RAP content reduces fatigue strength as a result of the aged binder increasing the stiffness of the asphalt mix.
In recent times, fatigue models founded on viscoelasticity theory and continuous damage mechanics have contributed significantly to comprehending the progression of damage in asphalt mixtures under diverse loading and temperature circumstances [28,29]. Simplified viscoelastic continuum damage (S-VECD) models, which integrate simplified continuous damage mechanics and viscoelastic properties, comprehensively depict microscale phenomena. Through leveraging the intrinsic properties of asphalt mixtures, these models successfully capture and describe the behavior of asphalt concrete under different loading and temperature conditions. The VECD model consists of essential elements including the damage characteristic curve, which establishes the relationship between a material’s integrity property and the extent of accumulated damage. Additionally, the VECD model facilitates the prediction of material fatigue failure through considering failure criteria such as GR vs. Nf [24] or DR [27]. Significantly, the entirety of this model maintains its autonomy from the testing conditions. Through the proper integration of the S-VECD model into pavement analysis frameworks such as the FlexPAVETM software, it becomes possible to accurately predict the fatigue damage encountered by asphalt layers in diverse field conditions [2,17,27]. The mechanistic approach of FlexPAVETM is well established as a predictive model of performance over time through providing satisfactory answers when correlating simulated behavior in the laboratory with that measured in the field [30,31,32,33,34]. In addition to the economic and environmental benefits, the fatigue performance of recycled asphalt mixes must be equivalent or superior to that of asphalt mixes produced with virgin materials. However, it is recognized that aging can affect the susceptibility to cracking in the field. Therefore, conducting fatigue analysis of mixtures with RAP using consolidated methods and models is fundamental for achieving an effective and efficient circular economy of asphalt materials.
This work investigated the influence of two different sources of RAP and two different types of asphalt binders added (neat binder and SBS-modified binder) on the fatigue behavior of asphalt mixtures with different levels of incorporation of RAP (0%, 10%, 20% and 30%), through tests and simulations conducted in the laboratory through S-VECD and FlexPAVETM. In addition, an economic analysis of the solutions studied was carried out, evaluating the influence of the insertion of RAP in the mixtures on production costs and performance, considering a typical pavement structure in Brazil.
2. Materials and Methods
Considering the potential vulnerability of recycled mixtures to fatigue cracking caused by the aged binder found in the RAP, the experimental program aims to assess the fatigue life of a total of eight asphalt mixtures. These mixtures consist of six recycled asphalt mixtures obtained from two different sources of RAP, with three different levels of incorporation, along with two reference mixtures using two virgin binders. The materials, asphalt mix design, test methods, and analysis of the economic–financial benefit together with performance are presented below.
Figure 1 shows a flowchart with a summary of the 6 recycled asphalt mixtures and the 2 reference mixtures. In the mixtures with SBS RAP, a virgin binder of PG 70S-22 was used, while in the mixtures with Neat RAP, a virgin binder of PG 64S-22 was used. The final granulometric composition for the same RAP incorporation content was the same for both materials.
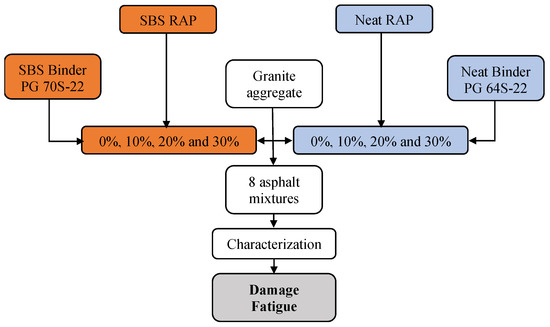
Figure 1.
Experimental flowchart of the mixtures analyzed.
The materials, asphalt mix design, test methods, and analysis of the economic–financial benefit together with performance are presented below.
2.1. Materials
Two sources of RAP with different origins were used to compose the recycled mixtures. The first source has an unmodified binder as a base, designated as Neat RAP. 5.38% content binder was determined following the ASTM D2172 standard, method A [35], 2.671 g/cm3 [36]. The second source is based on a modified SBS binder (SBS RAP), 4.95% content binder [35], 2.544 g/cm3 [36]. Both materials were subjected to a service life of approximately 10 years and were in an advanced state of fatigue degradation. The levels of incorporation of RAP material were 0%, 10%, 20%, and 30%. As for virgin materials, two asphalt binders were used, a neat binder (PG 58-22) and an SBS binder (PG 64-28). The characterization tests of the binder extracted and recovered from the two sources of RAP and the binders inserted are presented in Table 1. The virgin aggregates used come from a granite rock massif in the fractions of 3/4″ crushed stone, 3/8″ crushed stone, and stone dust.

Table 1.
Characterization of the binders.
To mitigate the impact of material gradation on the performance of asphalt mixtures, a decision was made to utilize an identical gradation range for both neat binder and SBS binder mixes. Figure 2 illustrates the gradation of the mixtures.
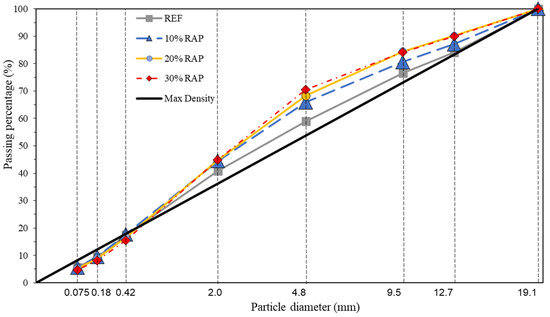
Figure 2.
Aggregate gradation of mixtures.
2.2. Asphalt Mixtures Design
For the mix design of eight mixtures, the Marshall methodology was used [40], with the design contents for 4% of the void volume and the maximum measured density (Gmm) determined using the Rice method [41]. The binder, mineral aggregate, and RAP material were heated to constant temperatures of 155 °C, 165 °C, and 110 °C, respectively. The RAP remained at this temperature for 2 to 3 h to avoid aging of the binder. After heating, the materials were introduced into the mechanical mixer for machining the mixtures. Table 2 shows the nomenclature of the mixtures, the Gmm, the final asphalt binder content, and the values of VMA (voids in mineral aggregate). It is noted that an increase in the RAP content results in a lower addition of virgin binder, which results from the activation of the aged binder present in the RAP.
Table 2.
Mixture summary, design grade, Gmm, VMA.
2.3. Tests and Analysis
This section presents the methodology used to carry out the tests, as well as the methodology for analyzing the results.
2.3.1. Asphalt Mixture Linear Viscoelastic Characterization
The viscoelastic characterization of asphalt mixtures was determined using the complex modulus test, according to AASHTO T342 (2017) [42]. To ensure accuracy, the results of three samples were averaged to determine the linear viscoelastic behavior of the material. Additionally, the air void contents were measured, and all test samples adhered to the desired air void content range of 5.5% ± 0.5%. Four samples were tested for each mixture, with the coefficients of variation between results for each sample being within the limits established in the standard referred above. The dynamic modulus and phase angle values were obtained at ten frequencies of 25, 20, 10, 5, 2, 1, 0.5, 0.2, 0.1, and 0.01 Hz at temperatures of −10 °C, 4 °C, 21 °C, 37 °C, and 54 °C. After applying the time–temperature superposition principle for a reference temperature of 21 °C, with the shift factors determined using Equation (1), the dynamic module master curves were constructed.
The LVE behavior of mixtures was described via sigmoidal function, Equation (2).
where: a, b, d, g, α1, α2, and α3 are the model adjustment coefficients; αT is the shift time–temperature factor; |E*| is the dynamic modulus (MPa); Rf is reduced frequency (Hz); and T is temperature (°C).
2.3.2. Asphalt Mixture Fatigue Characterization Using Uniaxial Cyclic Fatigue Test
Asphalt mixtures were characterized for fatigue damage using the uniaxial tensile-compression fatigue test according to AASHTO TP 107 (2018) [43]. The test was carried out on 100 × 130 mm samples with 5.5 ± 0.5% void volume, at a frequency of 10 Hz and four different levels of initial strain (150 and 300 µs). The simplified continuous damage viscoelastic model (S-VECD) was used to interpret the damage evolution and to determine the damage characteristic curve and the failure criterion based on the material pseudo-deformation dissipation (GR vs. Nf) of the analyzed asphalt materials.
The damage characteristic curves, which depict the correlation between the material’s integrity (C) and damage (S), were derived through power fitting and the utilization of regression coefficients C11 and C12, as presented in Equation (3).
The GR fatigue failure criterion and the S-VECD model were employed for all the analyzed mixtures. Zhang et al. (2013) [44] introduced this criterion and devised an energy calculation that consistently and accurately represents the rate of damage dissipation. This calculation can be utilized in conjunction with the S-VECD model, thereby ensuring that the prediction of fatigue failure is equivalent to the reduction in phase angle observed experimentally. Subsequently, Sabouri and Kim (2014) [45] improved the approach and defined the GR criterion as the mean rate of pseudo energy stored per cycle released throughout the loading history, as stated in Equation (4).
where WCR is the pseudo deformation energy (or pseudo energy) released per cycle and Nf is the number of cycles to fatigue failure defined by the peak in phase angle during the test [46].
The power law equation (Equation (5)) was employed to fit the mixture failure criterion curves (GR vs. Nf), utilizing the regression coefficients Y and ∆.
2.3.3. Fatigue Performance Evaluation Using FlexPAVETM Program Simulations
The fatigue behavior of the recycled mixes investigated in this study was projected within the context of an asphalt pavement design scenario, utilizing FlexPAVETM software [47]. The FlexPAVETM analysis incorporated the characteristics of the granular layer and subgrade materials, as indicated by their elastic modulus values. The fatigue crack properties of the different asphalt concretes were determined based on the viscoelastic damage data obtained using the S-VECD model and the failure criterion GR, which considers dynamic loads and induces three-dimensional stresses.
A new pavement structure was considered in the study, comprising multiple layers. The asphalt concrete layer had a thickness of 100 mm and a Poisson’s ratio of 0.30. The granular base layer, made of graded crushed gravel, had a thickness of 150 mm, a modulus of 202 MPa, and a Poisson’s ratio of 0.3. The granular subbase layer, composed of dry macadam, had a thickness of 200 mm, a modulus of 197 MPa, and a Poisson’s ratio of 0.4. The subgrade had a modulus of 84 MPa and a Poisson’s ratio of 0.45. The southern region of Brazil commonly employs this structural model, along with its corresponding stiffness values. Climate data for the study was obtained from an Enhanced Integrated Climate Model (EIMC) based on information from San Diego, CA (USA), as its thermal variations are similar to those observed in the region.
The traffic was characterized according to the daily load requests imposed by the 80 kN Dual Wheel Single Axle (DWSA), equipped with tires inflated to 0.80 MPa. The axle was arranged in a rectangular contact area with a length/width ratio of 1.5714 and operated at a speed of 80 km/h. The analysis period concluded with approximately 2.0 × 10⁸ load repetitions (USACE).
Using these parameters, plots were created showing the progression of accumulated mean damage (N/Nf) in the point network, calculated using Miner’s law, for all mixtures over the planning period. This allowed the observation of differences in the behavior of the different mixes when they were installed in the same structure and subjected to the same weather and traffic conditions. The analysis points selected for the calculation of the average single cumulative damage were determined based on the criterion proposed by Nascimento (2015) [30], which uses a network of 110 points distributed over the thickness of the crack-prone asphalt layer. The average cumulative damage curves represent the total fatigue life consumption at (N/Nf = 1), while (N/Nf = 0) represents an undamaged layer.
2.3.4. Transfer Function Application
The conversion of the average accumulated damage simulated for the pavement in the laboratory in the cracked area of the field was obtained using the calibration’s constant in Nascimento (2015) [30]. The findings of Nascimento (2015) [30] and Bueno et al. (2020) [33] indicate that predictions of cracked surface area in asphalt coatings are reliable for both thick and thin pavements, yielding accurate results. However, it is worth noting that the approach does not allow for the determination of the direction of crack formation (top-down or bottom-up). Based on the monitoring of 27 experimental sections in Brazil, the author calibrated transference function between simulated damage and field cracked area with a correlation coefficient (R2 = 0.72) considered satisfactory for pavement modeling. Thus, the calculation was carried out in two stages.
First, the accumulated average damage was transformed into reduced average damage through a translation factor S, coming from a linear calibration equation (Function S—Equation (6)) which corresponds to the number of the month in which the coating has an average damage of 0.35 (T0.35).
The transfer function, an empirical equation called the field-laboratory correspondence function obtained from observations in experimental sections, is described in Equation (7). For the explanation of how the transfer function was developed, refer to the work by Nascimento (2015) [30].
2.3.5. Cost Analysis
The survey of the reference unit costs for the services used in the evaluated structures was defined using the compositions of the SICRO (System of Reference Costs of Works) system of the DNIT (National Department of Transport Infrastructure), Brazil. The only costs considered were for paving a road with the type of section indicated in 2.3.3 and considering a platform with a width of 7.2 m. The currency adopted is the US dollar. Based on February 2022 data, the conversion factor used in the survey was USD 1.00 = BRL 5.20 for the US dollar (USD) and Brazilian real (BRL).
The costs of asphalt materials were calculated using data for the month of April 2021 from the Competition Defense Coordination (CDC) of the National Agency of Petroleum, Natural Gas and Biofuels (ANP), according to Ordinance No. 349 of 03/06/2010. The contents of binders considered were those added to the mixtures, as shown in Table 2.
The Average Transport Distances (ATD) defined for the different materials were delimited according to Table 3. It should be noted that the analyses will represent the reality delimited from these transport distances, defined as the hypothetical case of the present study.
Table 3.
Average Transport Distance (ATD) used for cost survey.
As recommended by DNIT (2021) [48] for medium-sized road construction and rehabilitation, the final unit prices for asphalt concrete (without and with the addition of RAP), tack coat, prime coat, graded gravel, and dry macadam were determined through incorporating the base cost, profits, and indirect profit and expense (IPE) of 24.01% for materials, equipment, and labor. Additionally, for acquisition and transport, the IPE was increased by 15%. Table 4 summarizes the final unit price for each of the different services considered in the evaluated structure. For asphalt binders, the final cost plus ICMS (Brazilian tax) resulted in USD 746.38/ton for PG 64S-22 and USD 924.93/ton for PG 70S-22.
Table 4.
Final unit prices for different materials and labor.
With the unit costs of the services, the impact of the insertion of RAP on the production costs of the mixtures and the construction of the structure analyzed in FlexPAVETM was evaluated. In addition, an economic analysis of the use of materials in the long term (project period with NUSACE = 2.0 × 10⁸) was carried out, considering the cracking criterion maximum of 30%.
3. Results and Discussions
3.1. Linear Viscoelastic Characterization
The master dynamic modulus and phase angle curves of the mixtures are shown in Figure 3 for the neat (a,b) and SBS (c,d) mixtures. The reference temperature used was 21 °C. It is verified that the addition of RAP in virgin mixtures resulted in different responses of the materials in terms of viscoelasticity. For Neat RAP mixtures, increasing the recycling rate reduced the stiffness of the mixtures at low and intermediate temperatures, and increased stiffness at high temperatures when compared to the reference mixture. In contrast, for mixtures with SBS RAP, the addition of RAP promoted an increase in stiffness at all temperatures, as found in [49]. Table 5 presents the coefficients obtained using the sigmoidal model.
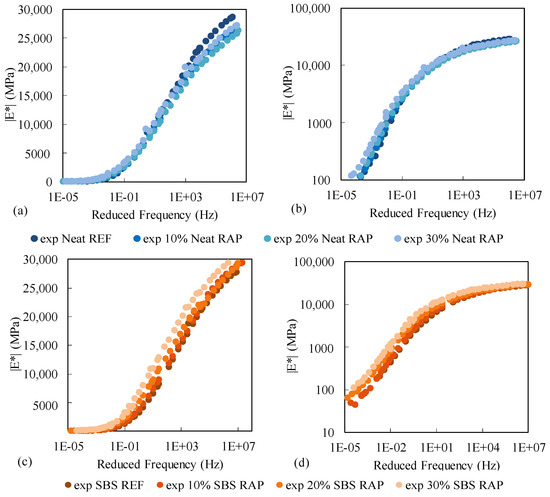
Figure 3.
Dynamic module master curves for the different RAPs and binders: master curves in (a) semilog and (b) log-log scale for neat binder and RAP, and master curves in (c) semilog and (d) log-log scale for SBS binder and RAP.
Table 5.
Sigmoidal model coefficients.
3.2. Fatigue Analysis
The integrity loss curves with damage accumulation (C vs. S), fitted to the power model of Equation (3), are shown in Figure 4 for the mixtures with neat (a) and SBS RAP (b). The curves presented for each mixture are the representation of the average of the samples of each mixture. Samples in which the curve did not collapse over others of the same mixture were excluded and retested. This process decreases the variability of fatigue characterization results. The analysis of the damage characteristic curves shows a greater accumulation of damage for the same loss of integrity as the RAP incorporation content increases. This outcome is due to the mixture becoming more brittle once the RAP is incorporated into the mix. It can be interpreted that the damage in mixes with higher RAP content grows slightly faster than the damage in other mixes at the beginning of loading.
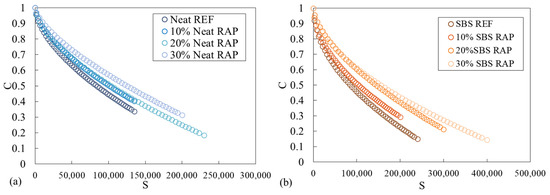
Figure 4.
Damage characteristic curves of mixtures with Neat (a) and SBS (b) RAPs.
All mixtures reached failure with integrity levels ranging from 0.4 to 0.1. Regarding the type of binder and type of RAP, the mixtures with binder and RAP SBS withstand a greater accumulation of damage at the failure than the mixtures with binder and RAP Neat.
Although C versus S curves are a good tool to assess how mixtures lose knowledge over cycles, a more accurate analysis can be used as GR vs. Nf, where GR comprises an average rate of pseudo-strain energy released per test cycle. Table 6 presents the values found for the coefficients C11 and C12 obtained through adjusting the curvature C vs. S, and the coefficients Y, ∆, and α (damage evolution rate).
Table 6.
C11 and C12 coefficients of the fitting of C vs. S curves and Y, Δ, and α coefficients.
Figure 5 shows the GR vs. Nf. All R2 for power models that fit the curves were greater than 0.88, demonstrating the low variability of the data. The mixtures that tend to have better fatigue performance have envelopes higher and to the right in the graph, in addition to lower slopes. When analyzing the figure with the envelopes, it can be seen that the 20% and 30% mixtures for both sources of RAP are the ones with the greatest slope in the curve, indicating that, possibly, they present a greater susceptibility to fatigue cracking. In addition, the mixtures with SBS RAP are shown above and to the right, indicating a better behavior of these mixtures in the face of fatigue.
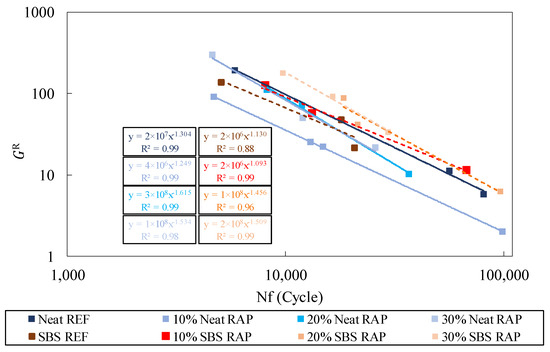
Figure 5.
GR vs. Nf.
Fatigue Performance Analysis Using FlexPAVETM Software
Analysis using the FlexPAVETM 1.0 software allows for obtaining graphs with the evolution of the average accumulated damage (N/Nf). The pseudo stiffness (C) values and the N/Nf ratio are calculated at different points of the asphalt layer thickness. The N/Nf is found from the GR failure criterion and the values range from 0 to 1, with this classification going from having no damage to complete damage to the mixture. Average values of N/Nf are measured for 110 points below the loaded area, and the damage calculation is directly related to the distribution of stresses and strains along the entire layer. From the results obtained, it was also possible to apply Nascimento’s (2015) [30] transfer equation and obtain a percentage of the cracked area.
Figure 6 presents the cumulative damage curves of the eight mixtures for the presented structure, and a 2 × 10⁸ traffic (NUSACE). In general, it’s observed that, for mixtures with neat binder, the addition of RAP worsened the results, with mixtures 20 Neat RAP and 30 Neat RAP having the worst performances, which reinforces the results found using GR envelopes. For the mixtures containing SBS binder, the addition of 10% of RAP caused an improvement in the behavior; for 20 and 30%, there is a worsening in the results.
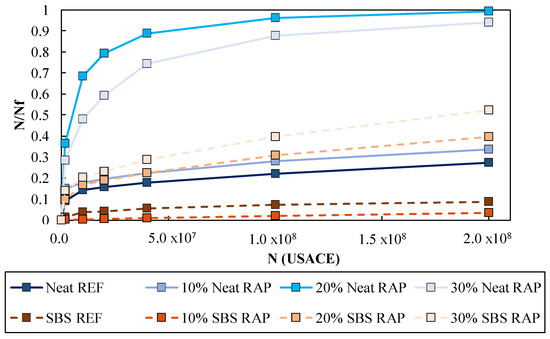
Figure 6.
Accumulated damage for all mixes with 2 × 10⁸ NUSACE traffic.
A possible explanation for the different behavior obtained, regarding the addition of RAP, between the mixtures with PG 64S-22 and PG 70S-22 binder is due to the types of asphalt binders present in the RAPs. Thus, it is important to emphasize that the binder present in the Neat RAP mixtures is a binder without the addition of polymers and the binder present in the RAP of the SBS mixtures has polymer in its composition. Thus, it can be inferred that the polymer binder contained in SBS RAP, despite being aged, gave the mixtures a better fatigue performance because it is a binder with more flexible behavior and resistance to damage.
Figure 7 and Figure 8 show the thermal graphs generated for the mixtures 20 Neat RAP and SBS REF, respectively. From these graphs, it can be seen that the fatigue process starts at the bottom layer of the coating. The red zones (N/Nf = 1) indicate that the cell of a 110-element mesh [28] was completely damaged during the fatigue process. Zones in blue (N/Nf = 0) indicate that no fatigue damage was observed in that region. It can be visually observed in the cross-section of the pavement, the difference in damage between the mixture with the highest damage level among those investigated, and a mixture with a very low damage level. These figures were chosen for exemplification.
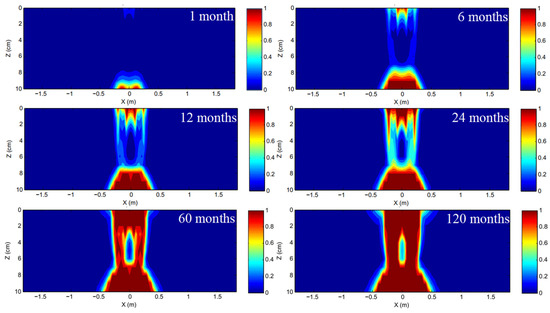
Figure 7.
Damage represented in the thermal graph for the 20 Neat RAP mixture.
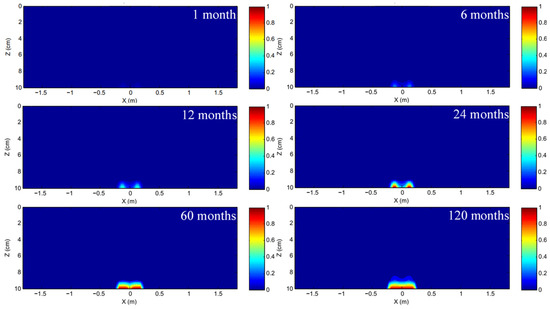
Figure 8.
Damage is represented in the thermal chart for the SBS REF mixture.
Based on the transfer function developed by Nascimento (2015) [30], it was possible to transform the accumulated damage into a percentage of the cracked area, considering 95% reliability. The author observed that the onset of field cracking correlates with the same time the mixture reaches 0.35 simulated damage. For mixtures that do not meet this criterion, cracking is likely to stabilize at 10% or less cracked area. Figure 9 presents the cracked area graph for the mixtures studied in this work, relating it to the number of requests on the standard axis. Following the criterion suggested by Nascimento (2015) [30], the mixtures with binder 60/85, except for 30 SBS RAP, and the mixture Neat REF would stabilize in the field and present a good fatigue performance.
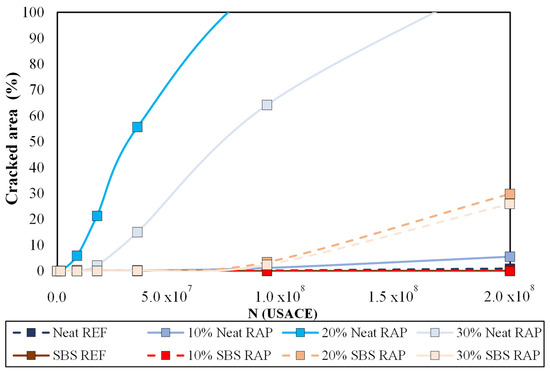
Figure 9.
Evolution of cracked area for all mixtures.
It is important to emphasize that this analysis is valid only for the mixtures studied in this research and for the simulated pavement and traffic; the evaluation of fatigue derives from the property of the material and the structure that will be submitted, so even mixtures with poor performance may be viable in other configurations, even more so when considering the financial aspects arising from the reduction of the binder content.
The hot recycling technique becomes extremely favorable and important for the reuse of milled material and lower consumption of energy and natural resources. It reinforces the need for integration of dosage (considering the field equipment and RAP inlet temperatures), material properties, integration with the structural design and analysis of the cost in the pavement life cycle for each project case.
3.3. Economic Analysis
To evaluate the economic impact of the use of RAP on the costs of asphalt mixtures, the unit costs for production and execution of the same for the conditions presented in the methodology are shown in Figure 10. A cost reduction can be seen as RAP is added to the mixture, due to the reduction in the binder content and aggregates. For mixtures with neat binder, the maximum cost reduction compared to the reference mixture is 4.3% for the addition of 30% RAP; for mixtures with SBS RAP, the reduction reaches up to 14.1% in cost with the addition of 30% of RAP. This reduction is more pronounced for the modified binders due to the higher unit price of the asphalt binder.
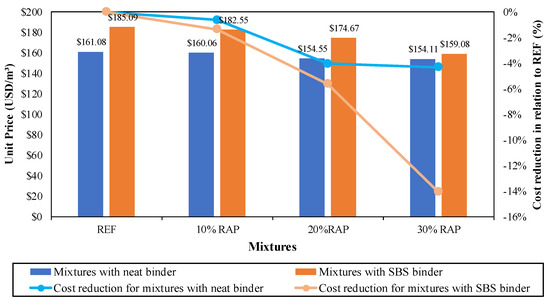
Figure 10.
Unit prices of asphalt concrete without and with the addition of RAP.
Table 7 shows the production costs of the evaluated asphalt mixtures, demonstrating the impact of increasing the RAP percentage on costs related to added aggregates and binders, as well as transport and RAP material. The objective of this section is to demonstrate the impact of the RAP on the consumption of materials and, consequently, on the total cost. We point out that an assessment of the impact of machining energy consumption on cost was not carried out, which will be the subject of further studies with this database and complementary research.
Table 7.
Details of costs of asphalt mixes.
Figure 11 shows the costs of implementing the paving layers per km (USD/km) for all solutions. The values indicate a decrease in total construction costs when RAP is added to the mixture for all alternatives evaluated, with greater reductions for mixtures with SBS binder. A reduction of up to 8.25% can be achieved when adding 30% of RAP in mixtures with SBS binder.
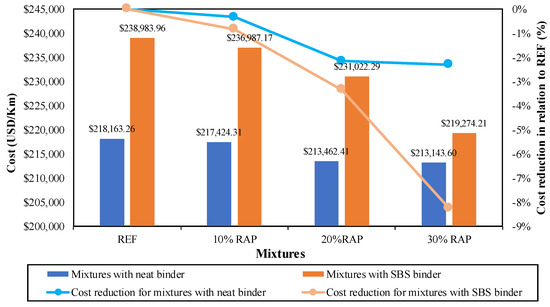
Figure 11.
Total construction cost (USD/km) for the evaluated structure and the different asphalt mixtures.
In addition to the economic benefits shown in Figure 10, the reuse of RAP in the mixtures causes a reduction in the use of virgin materials: aggregates and binders, reducing the environmental impacts of the exploitation of aggregates and petroleum. As shown in Figure 12, for the hypothetical situation of the present work, it is possible to save up to more than 400 tons of extracted rock and more than 27 tons of asphalt binder per kilometer.
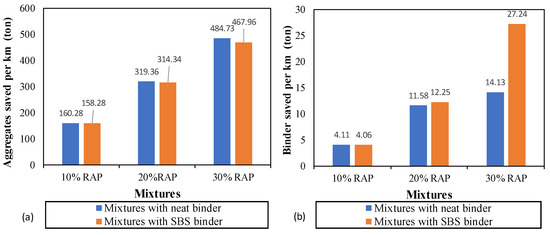
Figure 12.
Tons of virgin materials saved per km: (a) aggregates and (b) binders.
As the addition of RAP influences the performance of the mixtures, and consequently the useful life of the structure, an economic analysis was carried out considering a design period with NUSACE = 2.0 × 10⁸ for the structure studied. The cost/km ratios, which were quantified for the pavement structures, were divided by the NFATIGUE that occurred until the pavement reached the limits of 30% of the cracked area. In cases where the cracked area limit was not reached, the total traffic of the analysis with NFATIGUE was considered. Figure 13 presents the USD/NFATIGUE ratio per kilometer for the evaluated pavements.
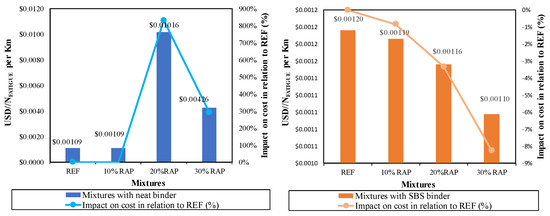
Figure 13.
Comparison of the USD/NFATIGUE per Km for the pavements evaluated considering a maximum of 30% of the cracked area.
It is possible to observe that for mixtures with binder and neat RAP, an increase of 10% in RAP does not impact the USD/NFATIGUE per Km as it does not result in reduced fatigue performance compared to the reference mixture. However, for 20% and 30% RAP, a substantial increase can be seen in the USD/NFATIGUE per Km, especially for 20% RAP. This is due to the worsening of fatigue cracking with the addition of RAP in these cases.
For mixtures with binder and SBS RAP, a reduction in the cost per NFATIGUE can be seen for RAP percentages, indicating significant economic gains with the use of RAP and SBS according to the cracked area parameter. With the addition of 30% RAP, there is an 8.25% reduction in USD/NFATIGUE per Km.
It should be noted that these results represent the materials and conditions evaluated in the present study, not representing the universe of mixtures with RAP. The use of dosage and production techniques with greater heating of the RAP, use of rejuvenating agents, or other types of binders can cause a higher percentage of binder activation, enhancing financial and performance gains. Another aspect that can be evaluated is the environmental gains of these inserts.
4. Conclusions
In this study, the fatigue behavior of recycled hot asphalt mixtures was examined. A total of eight mixtures were assessed in the laboratory, and these samples were categorized into two primary groups: four mixtures composed of neat binder and recycled asphalt pavement (RAP) sourced from source 1 (RAP with neat binder), and four mixtures consisting of SBS-modified binder and RAP obtained from source 2 (RAP with SBS-modified binder). The levels of RAP incorporation were 0%, 10%, 20%, and 30%. From the linear viscoelastic and fatigue characterization, a hypothetical structure was evaluated in heavy traffic in the FlexPAVE software. The conclusions are listed below:
(a) For Neat RAP mixtures, increasing the recycling rate reduced the stiffness of the mixtures at low and intermediate temperatures, and increased stiffness at high temperatures when compared to the reference mixture. In contrast, for mixtures with SBS RAP, the addition of RAP promoted an increase in stiffness at all temperatures.
(b) FlexPAVETM software allowed us to perform simulations, and accumulated damage curves were obtained, which corroborated the results of the low performance of the mixtures with 50/70 binder. Both binders with 10% of RAP showed almost zero damage to simulated structure/traffic. When analyzing the mixtures with 20% and 30% of RAP for neat and SBS binder, the mixtures with 20% and 30% of RAP presented worse performance. However, for these mixtures, the SBS binder showed the best performance.
(c) About the economic impact of the use of RAP on the costs of asphalt mixtures, it can be concluded that, regardless of the type of RAP and binder added, there is a reduction in the consumption of materials that reduces the cost of production of these mixtures. However, the percentages of cost reduction depend on the type of binder used in the mixture: for mixtures with the addition of neat binder, for 30% of RAP, the economic gains with the reduction of material about the reference mixture are 4.3%; for mixtures with SBS binder, a reduction of up to 14.1% in production and execution costs can be achieved. It should be noted that in the present work, the impact of machining on energy consumption was not considered.
(d) For evaluated structures, the insertion of RAP leads to a reduction in the construction cost per kilometer for all cases, in addition to a reduction in the consumption of virgin materials. When evaluating the economic impact of RAP insertion and its relationship to long-term fatigue performance, it can be seen that the type of binder added impacts the results. For mixtures with neat binder, the insertion of RAP above 10% causes a loss of performance, making mixtures with a worse cost/performance ratio. The mixtures with SBS binder present good performance even with the insertion of RAP, making them economically viable, with financial gains.
(e) It should be noted that these analyses represent the materials studied here, and other materials and technologies may yield different results. For future studies, it is suggested to use rejuvenators for all mixtures to verify the improvement in fatigue behavior and its impact on cost. Additional evaluations are also necessary to confirm the reactivation of the RAP binder, which affects the total binder content of the mixture and, therefore, the mechanical properties. Furthermore, the integration of laboratory data with structural pavement analysis, performance, and life cycle cost should also be considered.
(f) Therefore, adequate characterization of mixtures with RAP can enable their use, both from a technical and economic point of view, reducing the consumption of natural resources.
Author Contributions
Conceptualization, B.M.C. and L.P.S.; methodology, B.M.C., L.P.S. and F.D.B.; software, S.L.S. and C.F.; validation, L.P.S.; formal analysis, B.M.C., S.L.S., P.O.B.d.A.J. and C.F.; investigation, B.M.C.; resources, L.P.S., D.d.S.P. and L.A.H.d.N.; writing—original draft preparation, B.M.C., P.O.B.d.A.J., S.L.S. and C.F.; writing—review and editing, L.P.S., D.d.S.P., L.A.H.d.N. and L.A.T.B.; visualization, B.M.C.; supervision, L.P.S.; project administration, L.P.S.; funding acquisition, L.P.S., D.d.S.P., L.A.H.d.N. and L.A.T.B. All authors have read and agreed to the published version of the manuscript.
Funding
This work was supported by CNPQ [grant number 140753/2021-4] and [grant number 300987/2018-7]; ANP/Petrobras [grant number 5850.0106353.17.9]. The APC was partially funded by the Pavements Laboratory (Federal University of Rio Grande do Sul).
Institutional Review Board Statement
Not applicable.
Informed Consent Statement
Not applicable.
Data Availability Statement
All data shown in the manuscript. In that case, feel free to write whatever statement necessary.
Acknowledgments
The authors would like to thank ANP/Petrobras, the National Council for Scientific and Technological Development (CNPq), and the North Carolina State University (NSCU) for the license to use the FLEXPAVE™ software.
Conflicts of Interest
The authors declare no conflict of interest.
Abbreviations
| S-VECD | Simplified Viscoelastic Continuum Damage |
| VECD | Viscoelastic Continuum Damage |
| RAP | Reclaimed Asphalt Pavement |
| RAB | Reclaimed Asphalt Binder |
| PG | Performance Grade |
| Gmm | Maximum measured density |
| VMA | Voids in mineral aggregate |
| VB | Virgin Binder |
| TBC | Total Binder Content |
| EIMC | Enhanced Integrated Climate Model |
| DWSA | Dual Wheel Single Axle |
| USACE | United States Army Corps of Engineers |
| SICRO | System of Reference Costs of Works |
| DNIT | National Department of Transport Infrastructure |
| CDC | Competition Defense Coordination |
| ANP | National Agency of Petroleum, Natural Gas and Biofuels |
| ATD | Average Transport Distances |
| IPE | Indirect Profit and Expense |
| ICMS | Brazilian tax |
References
- Soenen, H.; Lu, X.; Laukkanen, O. Oxidation of bitumen: Molecular characterization and influence on rheological properties. Rheol. Acta 2016, 55, 315–326. [Google Scholar] [CrossRef]
- Zhang, C.; Ren, Q.; Qian, Z.; Wang, X. Evaluating the effects of high RAP content and rejuvenating agents on fatigue performance of fine aggregate matrix through DMA flexural bending test. Materials 2019, 12, 1508. [Google Scholar] [CrossRef]
- Kuchiishi, A.K.; Vasconcelos, K.L.; Antao, C.C.S.; Souza, G.; Andrade, L.; Dave, E.; Bernucci, L.L.B. Impact of Nonlinear Elastic Behavior of Foamed Asphalt Stabilized Mixes on Pavement Structural Performance. J. Mater. Civ. Eng. 2021, 33, 04021261. [Google Scholar] [CrossRef]
- Kuchiishi, A.K.; Vasconcelos, K.; Bernucci, L.L.B. Effect of mixture composition on the mechanical behaviour of cold recycled asphalt mixtures. Int. J. Pavement Eng. 2021, 22, 984–994. [Google Scholar] [CrossRef]
- Medina, J.; Motta, L.M.G. Mecânica dos Pavimentos, 3rd ed.; Interciência: Rio de Janeiro, Brazil, 2015; 638p. [Google Scholar]
- Copeland, A. Reclaimed Asphalt Pavement in Asphalt Mixtures: State of the Practice; Report No. FHWA-HRT-11-021; FHWA: McLean, VA, USA, 2011. [Google Scholar]
- Mangiafico, S. Linear Viscoelastic Properties and Fatigue of Bituminous Mixtures Produced with Reclaimed Asphalt Pavement and Corresponding Binder Blends. Ph.D. Thesis, l’École Nationale des Travaux Publics de l’État, Lyon, France, 2014. [Google Scholar]
- Gennesseaux, M.M.L. Avaliação da Durabilidade de Misturas Asfálticas a Quente e Mornas Contendo Material Asfáltico Fresado. Ph.D. Thesis, Departamento de Engenharia de Transportes, Escola Politécnica da Universidade de São Paulo, São Paulo, Brazil, 2015; 195p. [Google Scholar]
- Hoy, M.; Rachan, R.; Horpibulsuk, S.; Arulrajah, A.; Mirzababaei, M. Effect of Wetting-Drying Cycles on Compressive Strength and Microstructure of Recycled Asphalt Pavement–Fly Ash Geopolymer. Constr. Build. Mater. 2017, 144, 624–634. [Google Scholar] [CrossRef]
- Lo Presti, D.; Vasconcelos, K.; Orescovik, M.; Pires, G.M.; Bressi, S. On the degree of binder activity of reclaimed asphalt and degree of blending with recycling agents. Road Mater. Pavement Des. 2020, 21, 2071–2090. [Google Scholar] [CrossRef]
- Zheng, K.; Xu, J.; Wang, J. Viscoelasticity of Recycled Asphalt Mixtures with High Content Reclaimed SBS Modified Asphalt Pavement. Sustainability 2023, 15, 2515. [Google Scholar] [CrossRef]
- Norouzi, A.; Kim, Y.R. Mechanistic evaluation of fatigue cracking in asphalt pavements. Int. J. Pavement Eng. 2015, 18, 530–546. [Google Scholar] [CrossRef]
- Maciejewski, K.; Ramiączek, P.; Remisova, E. Effects of Short-Term Ageing Temperature on Conventional and High-Temperature Properties of Paving-Grade Bitumen with Anti-Stripping and WMA Additives. Materials 2021, 14, 6229. [Google Scholar] [CrossRef]
- Centofante, R. Estudo Laboratorial da Utilização de Material Fresado em Misturas Asfálticas Recicladas a Quente. Master’s Thesis, Universidade Federal de Santa Maria, Santa Maria, Brazil, 2016; 152p. [Google Scholar]
- Bohn, K.A. Avaliação das Misturas Asfálticas Mornas com uso de Ligantes Convencional e Modificado por Polímero. Master’s Thesis, Universidade Federal de Santa Maria, Centro de Tecnologia, Programa de Pós-Graduação em Engenharia Civil, Santa Maria, Brazil, 2017. [Google Scholar]
- Suzuki, K.Y. Avaliação de Misturas Asfálticas Recicladas a Quente com Diferentes Teores de Material Fresado. Master’s Thesis, Escola Politécnica da Universidade de São Paulo, São Paulo, Brazil, 2019; 153p. [Google Scholar]
- Luzzi, F.C.; Specht, L.P.; Schuster, S.L.; Boeira, F.D.; Pereira, D.S.; de Almeida Júnior, P.O.B.; Vitorello, T.; Hirsch, F. Adaptação de usina para reciclagem à quente e avaliação laboratorial das misturas asfálticas produzidas. Rev. Ibero Am. Ciências Ambient. 2021, 12, 362–382. [Google Scholar] [CrossRef]
- Eltwati, A.; Putra Jaya, R.; Mohamed, A.; Jusli, E.; Al-Saffar, Z.; Hainin, M.R.; Enieb, M. Effect of Warm Mix Asphalt (WMA) Antistripping Agent on Performance of Waste Engine Oil-Rejuvenated Asphalt Binders and Mixtures. Sustainability 2023, 15, 3807. [Google Scholar] [CrossRef]
- Chen, Y.; Chen, Z.; Xiang, Q.; Qin, W.; Yi, J. Research on the influence of RAP and aged asphalt on the performance of plant-mixed hot recycled asphalt mixture and blended asphalt. Case Stud. Constr. Mater. 2021, 15, e00722. [Google Scholar] [CrossRef]
- Ziari, H.; Hajiloo, M.; Ayar, P. Influence of Recycling Agents Addition Methods on Asphalt Mixtures Properties Containing Reclaimed Asphalt Pavement (RAP). Sustainability 2022, 14, 16717. [Google Scholar] [CrossRef]
- Menegusso Pires, G.; Lo Presti, D.; Airey, G.D. A practical approach to estimate the degree of binder activity of reclaimed asphalt materials. Road Mater. Pavement Des. 2021, 22, 1093–1116. [Google Scholar] [CrossRef]
- Al-Saffar, Z.H.; Yaacob, H.; Al Jawahery, M.S.; Yousif, S.T.; Satar, M.K.I.M.; Jaya, R.P.; Radeef, H.R.; Eltwati, A.S.; Shaffie, E. Extraction and Characterisation of Maltene from Virgin Asphalt as a Potential Rejuvenating Agent. Sustainability 2023, 15, 909. [Google Scholar] [CrossRef]
- Tabaković, A.; Gibney, A.; McNally, C.; Gilchrist, M.D. Influence of recycled asphalt pavement on fatigue performance of asphalt concrete base courses. J. Mater. Civ. Eng. 2010, 22, 643–650. [Google Scholar] [CrossRef]
- Ma, Q.; Guo, Z.; Guo, P.; Sun, L.; Yang, F.; Li, H. Research on Fatigue Prediction Model of Asphalt Mixture with High RAP Content. Sustainability 2021, 13, 7995. [Google Scholar] [CrossRef]
- Tomlinson, C. The Effect of High RAP and High Asphalt Binder Content on the Dynamic Modulus and Fatigue Resistance of Asphalt Concrete. Master’s Thesis, Virginia Polytechnic Institute and State University, Blacksburg, VA, USA, 2012. [Google Scholar]
- Tapsoba, N.; Sauzéat, C.; Di Benedetto, H.; Baaj, H.; Ech, M. Behaviour of asphalt mixtures containing reclaimed asphalt pavement and asphalt shingle. Road Mater. Pavement Des. 2014, 15, 330–347. [Google Scholar] [CrossRef]
- Norouzi, A.; Sabouri, M.; Kim, Y.R. Evaluation of the fatigue performance of asphalt mixtures with high RAP content. J. Tylor Fr. Group 2014, 1, 1069–1077. [Google Scholar]
- Schuster, S.L.; Faccin, C.; Boeira, F.D.; Specht, L.P.; Pereira DD, S.; do Nascimento, L.A.H. Fatigue behaviour of plant produced asphalt mixtures through viscoelastic continuum damage model. Road Mater. Pavement Des. 2023, 24, 59–85. [Google Scholar] [CrossRef]
- Gkyrtis, K.; Plati, C.; Loizos, A. Mechanistic Analysis of Asphalt Pavements in Support of Pavement Preservation Decision-Making. Infrastructures 2022, 7, 61. [Google Scholar] [CrossRef]
- Do Nascimento, L.A.H. Implementation and Validation of the Viscoelastic Continuum Damage Theory for Asphalt Mixture and Pavement Analysis in Brazil. Ph.D. Thesis, Graduate Faculty of North Carolina State University, Raleigh, NC, USA, 2015. [Google Scholar]
- Wang, Y.D.; Keshavarzi, B.; Kim, Y.R. Fatigue performance prediction of asphalt pavements with FlexPAVETM, the S-VECD model, and DR failure criterion. Transp. Res. Rec. J. Transp. Res. Board 2018, 2672, 217–227. [Google Scholar] [CrossRef]
- Wang, Y. Development of the Framework of Performance-Engineered Mixture Design for Asphalt Concrete. Ph.D. Dissertation, Graduate Faculty of North Carolina State University, Raleigh, NC, USA, 2019. [Google Scholar]
- Bueno, L.D.; Schuster, S.L.; Specht, L.P.; Pereira, D.d.S.; do Nascimento, L.A.H.; Kim, Y.R.; Brenner, M.G.B. Asphalt pavement design optimisation: A case study using viscoelastic continuum damage theory. Int. J. Pavement Eng. 2022, 23, 1070–1082. [Google Scholar] [CrossRef]
- Wang, Y.D.; Ghanbari, A.; Underwood, B.S.; Kim, Y.R. Development of preliminary transfer functions for performance predictions in FlexPAVE™. Constr. Build. Mater. 2021, 266, 121182. [Google Scholar] [CrossRef]
- ASTM D2172; Standard Test Methods for Quantitative Extraction of Asphalt Binder from Asphalt Mixtures. American Society for Testing and Materials: West Conshohocken, PA, USA, 2018.
- ASTM D2041; Standard Test Method for Theoretical Maximum Specific Gravity and Density of Bituminous Paving Mixtures. American Society for Testing and Materials: West Conshohocken, PA, USA, 2019.
- ASTM D56; Standard Test Method for Flash Point by Tag Closed Cup Tester. American Society for Testing and Materials: West Conshohocken, PA, USA, 2021.
- ASTM D36; Standard Test Method for Softening Point of Bitumen (Ring-and-Ball Apparatus). American Society for Testing and Materials: West Conshohocken, PA, USA, 2014.
- AASHTO M 332-18; Standard Specification for Performance-Graded Asphalt Binder Using Multiple Stress Creep Recovery (MSCR). American Association of State and Highway Transportation Officials; American Association of State Highway and Transportation Officials: Washington, DC, USA, 2018.
- AASHTO T 245; Standard Method of Test for Resistance to Plastic Flow of Asphalt Mixtures Using Marshall Apparatus. American Association of State Highway and Transportation Officials: Washington, DC, USA, 2015.
- ABNT (2016) NBR 15619; Misturas Asfálticas—Determinação da Densidade Máxima Teórica e da Massa Específica Máxima Teórica em Amostras Não Compactadas. Associação Brasileira de Normas Técnicas: Rio de Janeiro, Brazil, 2016.
- AASHTO T342; Standard Practice for Developing Dynamic Modulus Master Curves for Asphalt Mixtures Using the Asphalt Mixture Performance Tester (AMPT). AASHTO: Washington, DC, USA, 2017.
- AASHTO TP 107; Standard Method of Test for Determining the Damage Characteristic Curve of Asphalt Mixtures from Direct Tension Cyclic Fatigue Tests. AASHTO: Washington, DC, USA, 2014.
- Zhang, J.; Sabouri, M.; Kim, Y.R.; Guddati, M.N. Development of a failure criterion for asphalt mixtures under fatigue loading. Road Mater. Pavement Des. 2013, 14, 1–15. [Google Scholar] [CrossRef]
- Sabouri, M.; Kim, Y.R. Development of a Failure Criterion for Asphalt Mixtures under different modes of fatigue loading. Transp. Res. Rec. 2014, 2447, 117–125. [Google Scholar] [CrossRef]
- Reese, R.A. Properties of aged asphalt binder related to asphalt concrete fatigue life. J. Assoc. Asph. Paving Technol. AAPT 1997, 66, 604–632. [Google Scholar]
- Eslaminia, M.; Thirunavukkarasu, S.; Guddati, M.N.; Kim, Y.R. Accelerated pavement performance modeling using layered viscoelastic analysis. In Proceedings of the 7th RILEM International Conference on Cracking in Pavements; Springer: Dordrecht, The Netherlands, 2012; pp. 497–506. [Google Scholar]
- Departamento Nacional de Infraestrutura de Transportes (DNIT). Custos e Pagamentos—SICRO/Sul, Maio de 2021. Available online: https://www.gov.br/dnit/pt-br/assuntos/planejamento-e-pesquisa/custos-e-pagamentos/custos-e-pagamentos-dnit/sistemas-de-custos/bdi (accessed on 10 March 2023).
- Norouzi, A.; Kim, Y.R.; Kim, S.S.; Yang, J. Effect of reclaimed asphalt pavement content and binder grade of fatigue—Resisting performance of asphalt mixtures in Georgia. J. Mater. Civ. Eng. 2017, 29, 04017115. [Google Scholar] [CrossRef]
Disclaimer/Publisher’s Note: The statements, opinions and data contained in all publications are solely those of the individual author(s) and contributor(s) and not of MDPI and/or the editor(s). MDPI and/or the editor(s) disclaim responsibility for any injury to people or property resulting from any ideas, methods, instructions or products referred to in the content. |
© 2023 by the authors. Licensee MDPI, Basel, Switzerland. This article is an open access article distributed under the terms and conditions of the Creative Commons Attribution (CC BY) license (https://creativecommons.org/licenses/by/4.0/).