
Land Consumption for Current Diets Compared with That for the Planetary Health Diet—How Many People Can Our Land Feed?


Abstract
1. Introduction
- RQ 1:
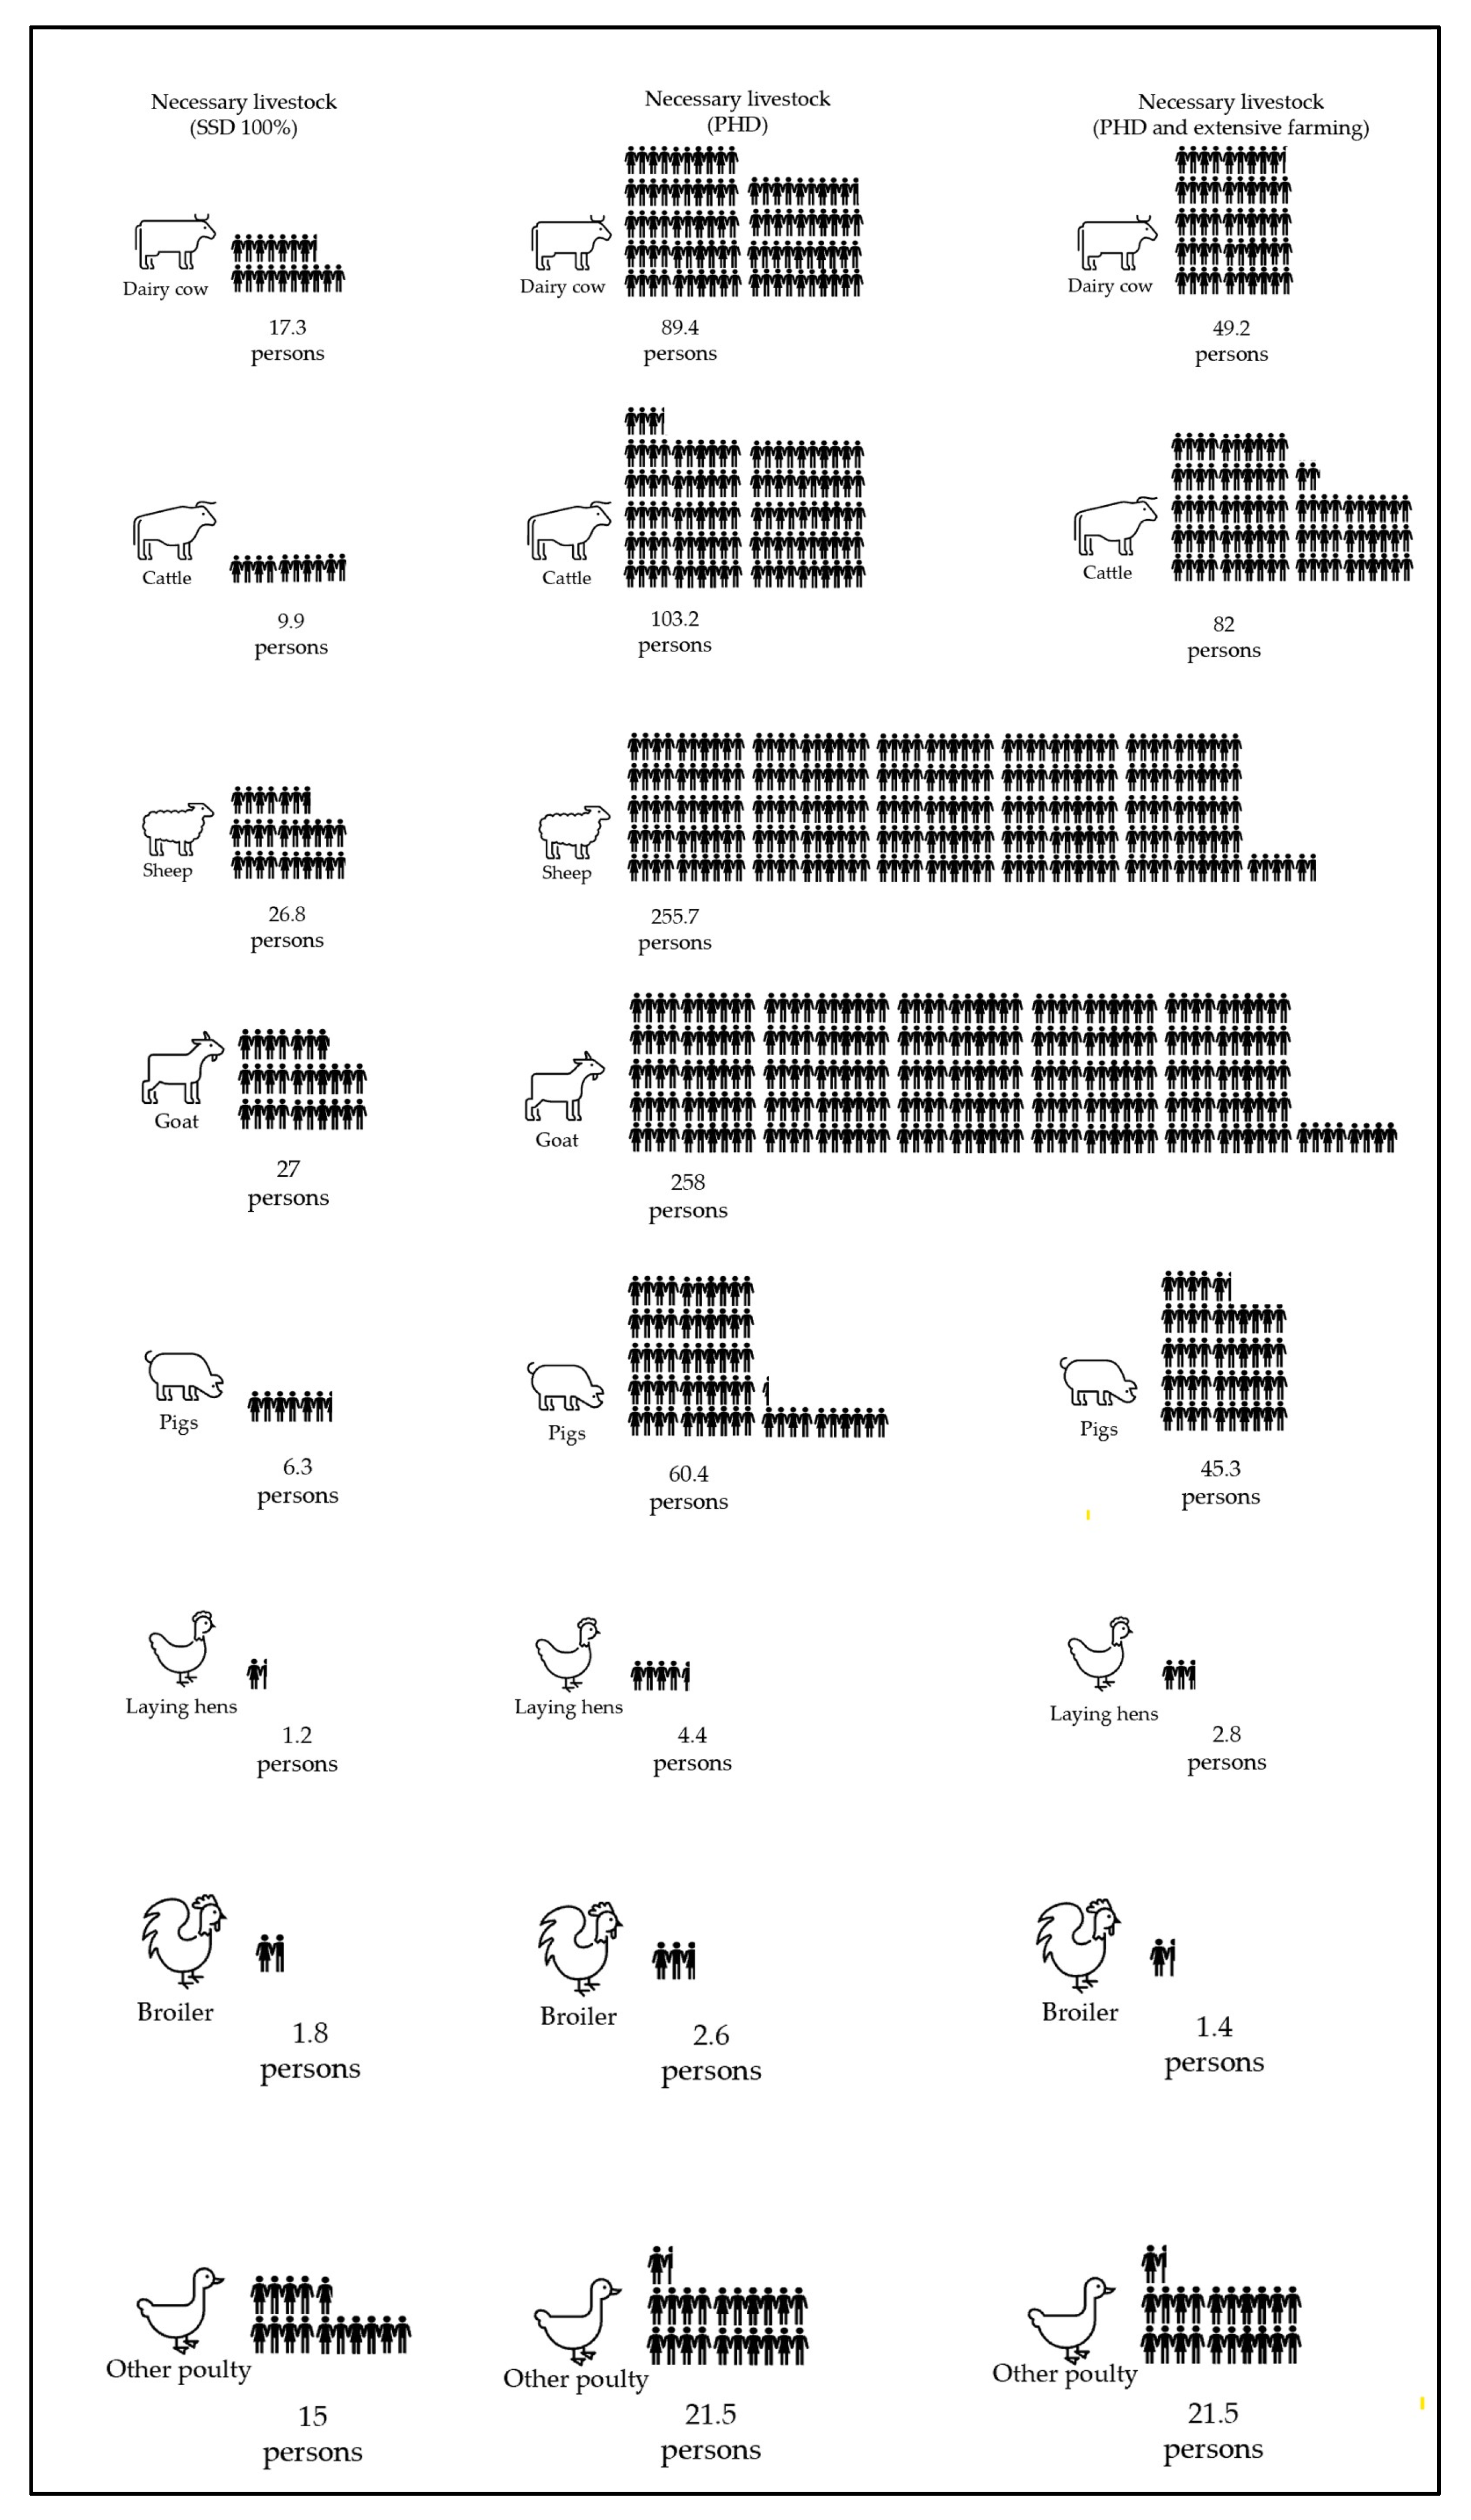
- How many animals would be necessary to satisfy the demand for regional animal products (meat, dairy and eggs) in the context of current consumption patterns?
- RQ 2:
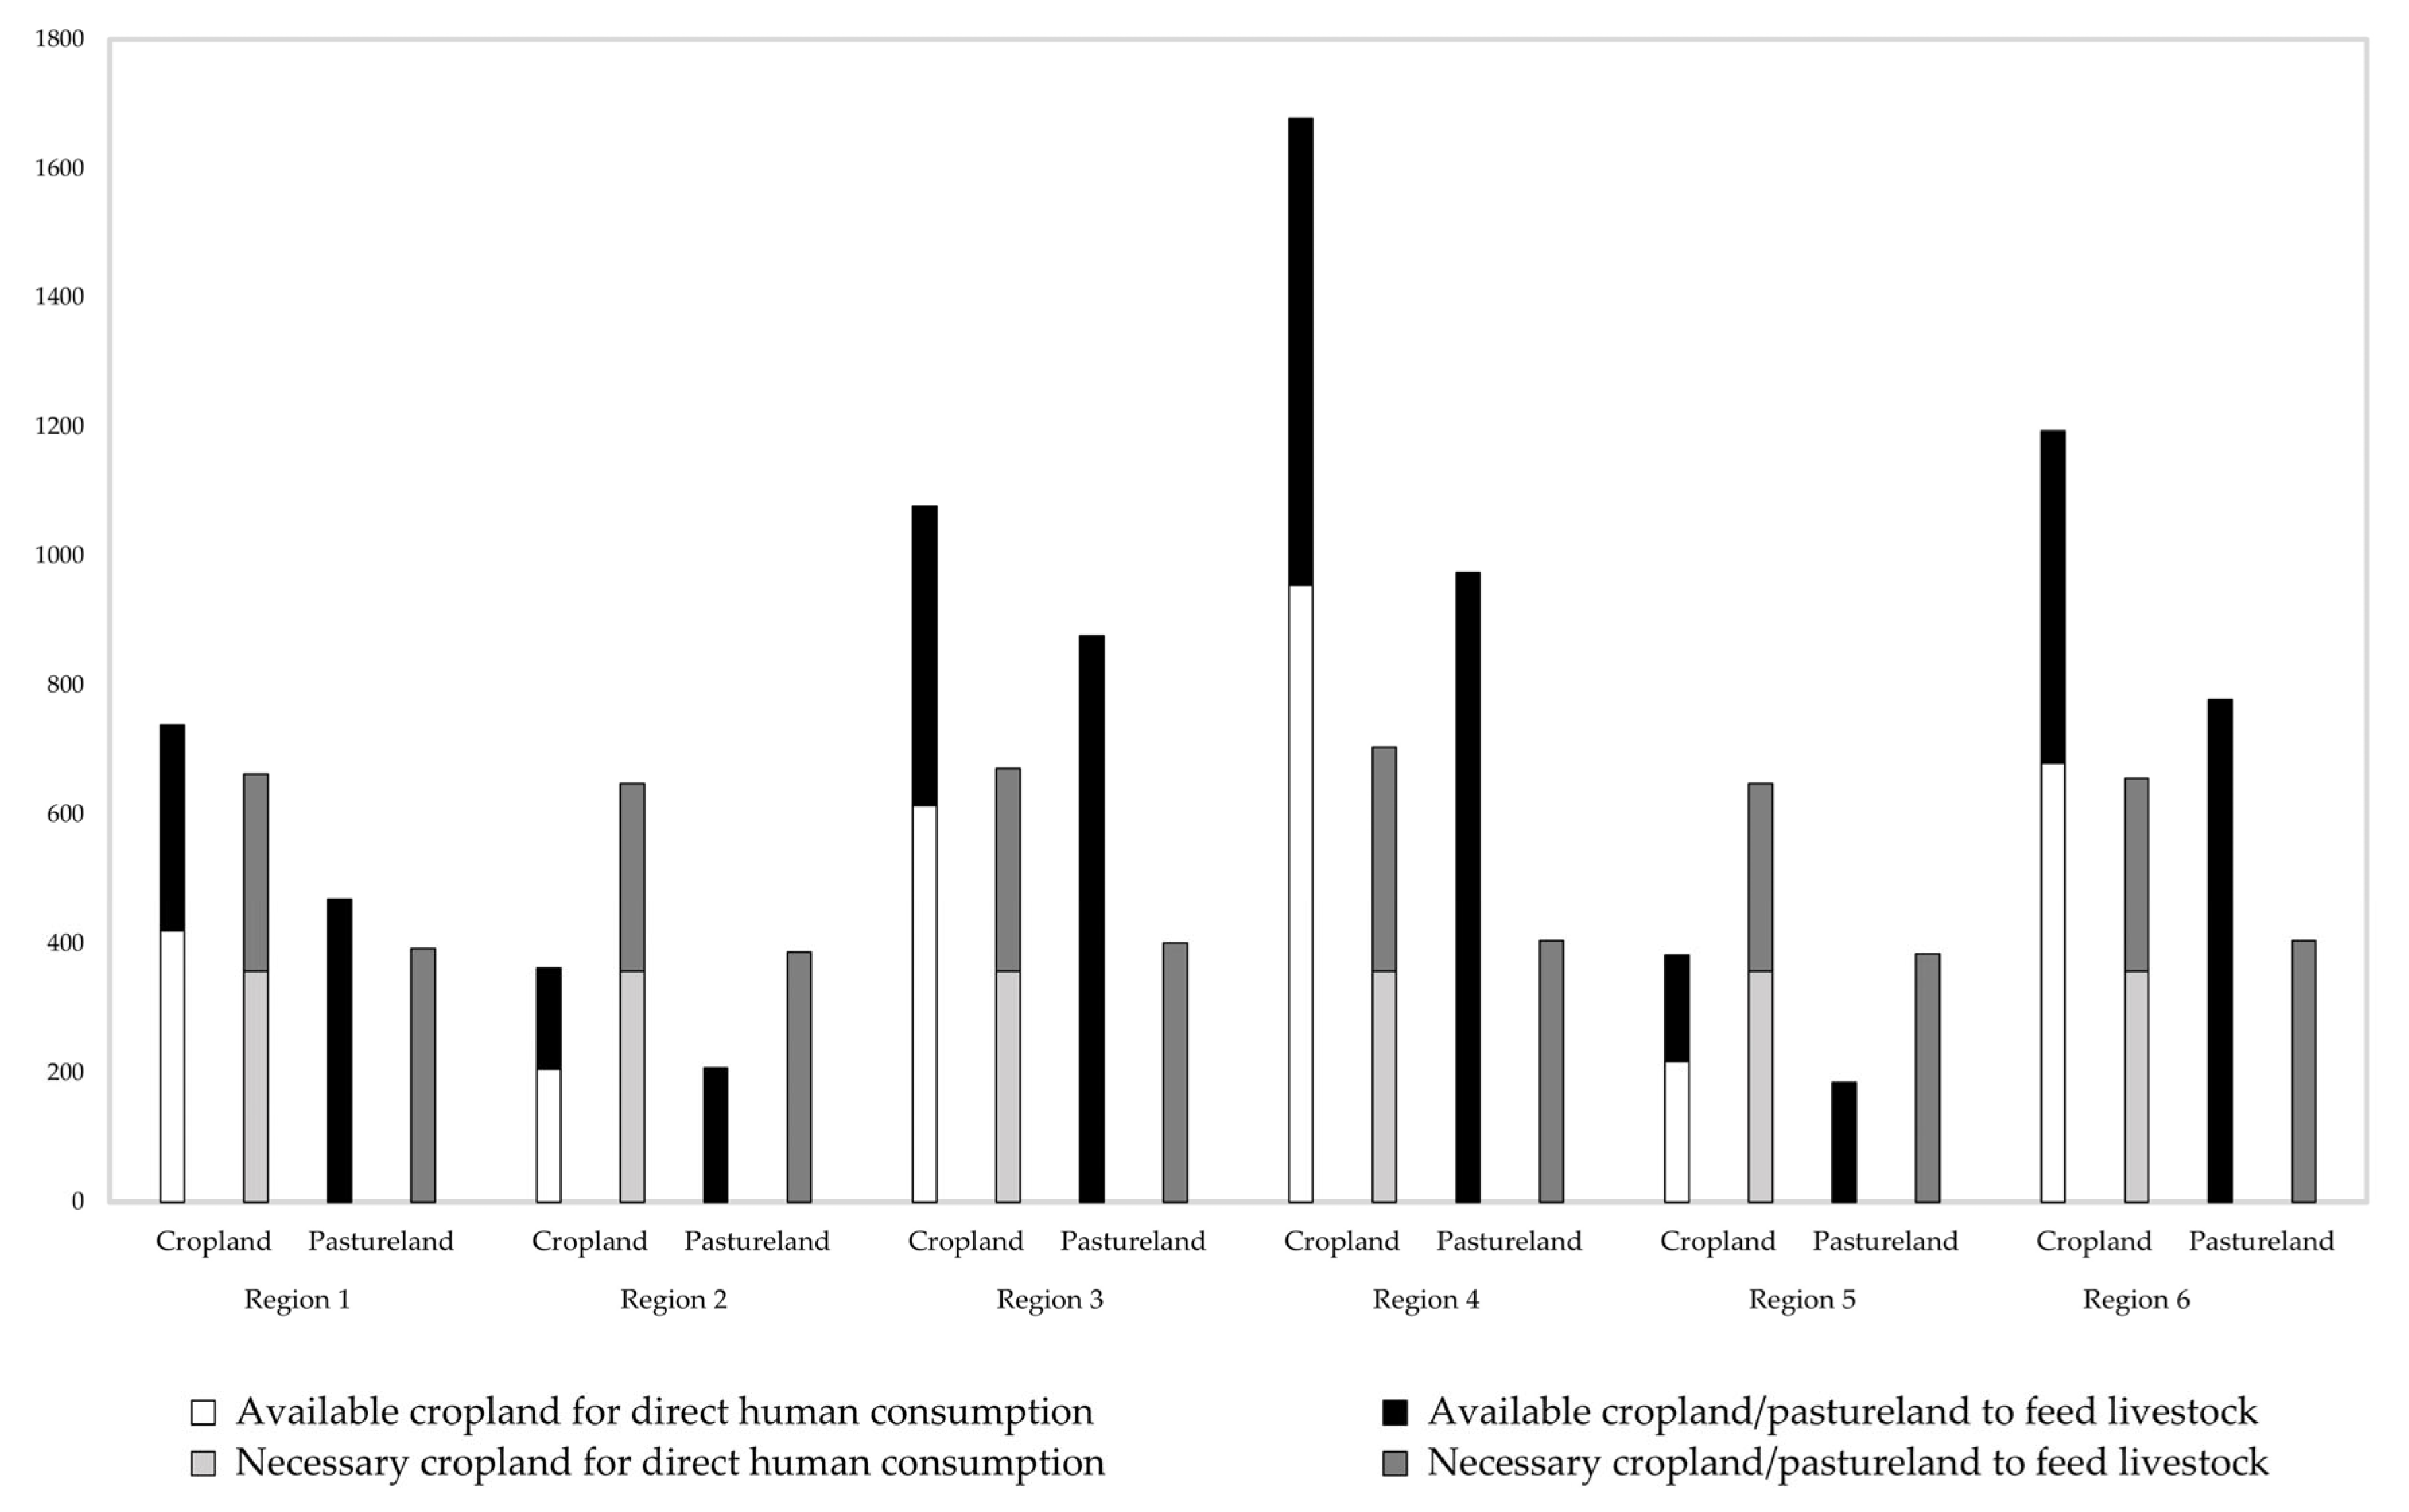
- Can local land feed the number of currently kept livestock and the number of livestock necessary to achieve a 100% degree of self-sufficiency (SSD)?
- RQ 3:
- How much food is grown on local fields, and how much would be necessary to feed the local population in a plant-based, healthy, appealing and diverse way, as recommended by the planetary health diet (PHD)?
- RQ 4:
- How would land consumption change if everyone consumed in a more environmentally friendly manner—specifically, consuming fewer meat, eggs and dairy products, as, for instance, proposed in the planetary health diet by the EAT-Lancet Commission in 2019 [13]—and agriculture became more sustainable and environmentally friendly?
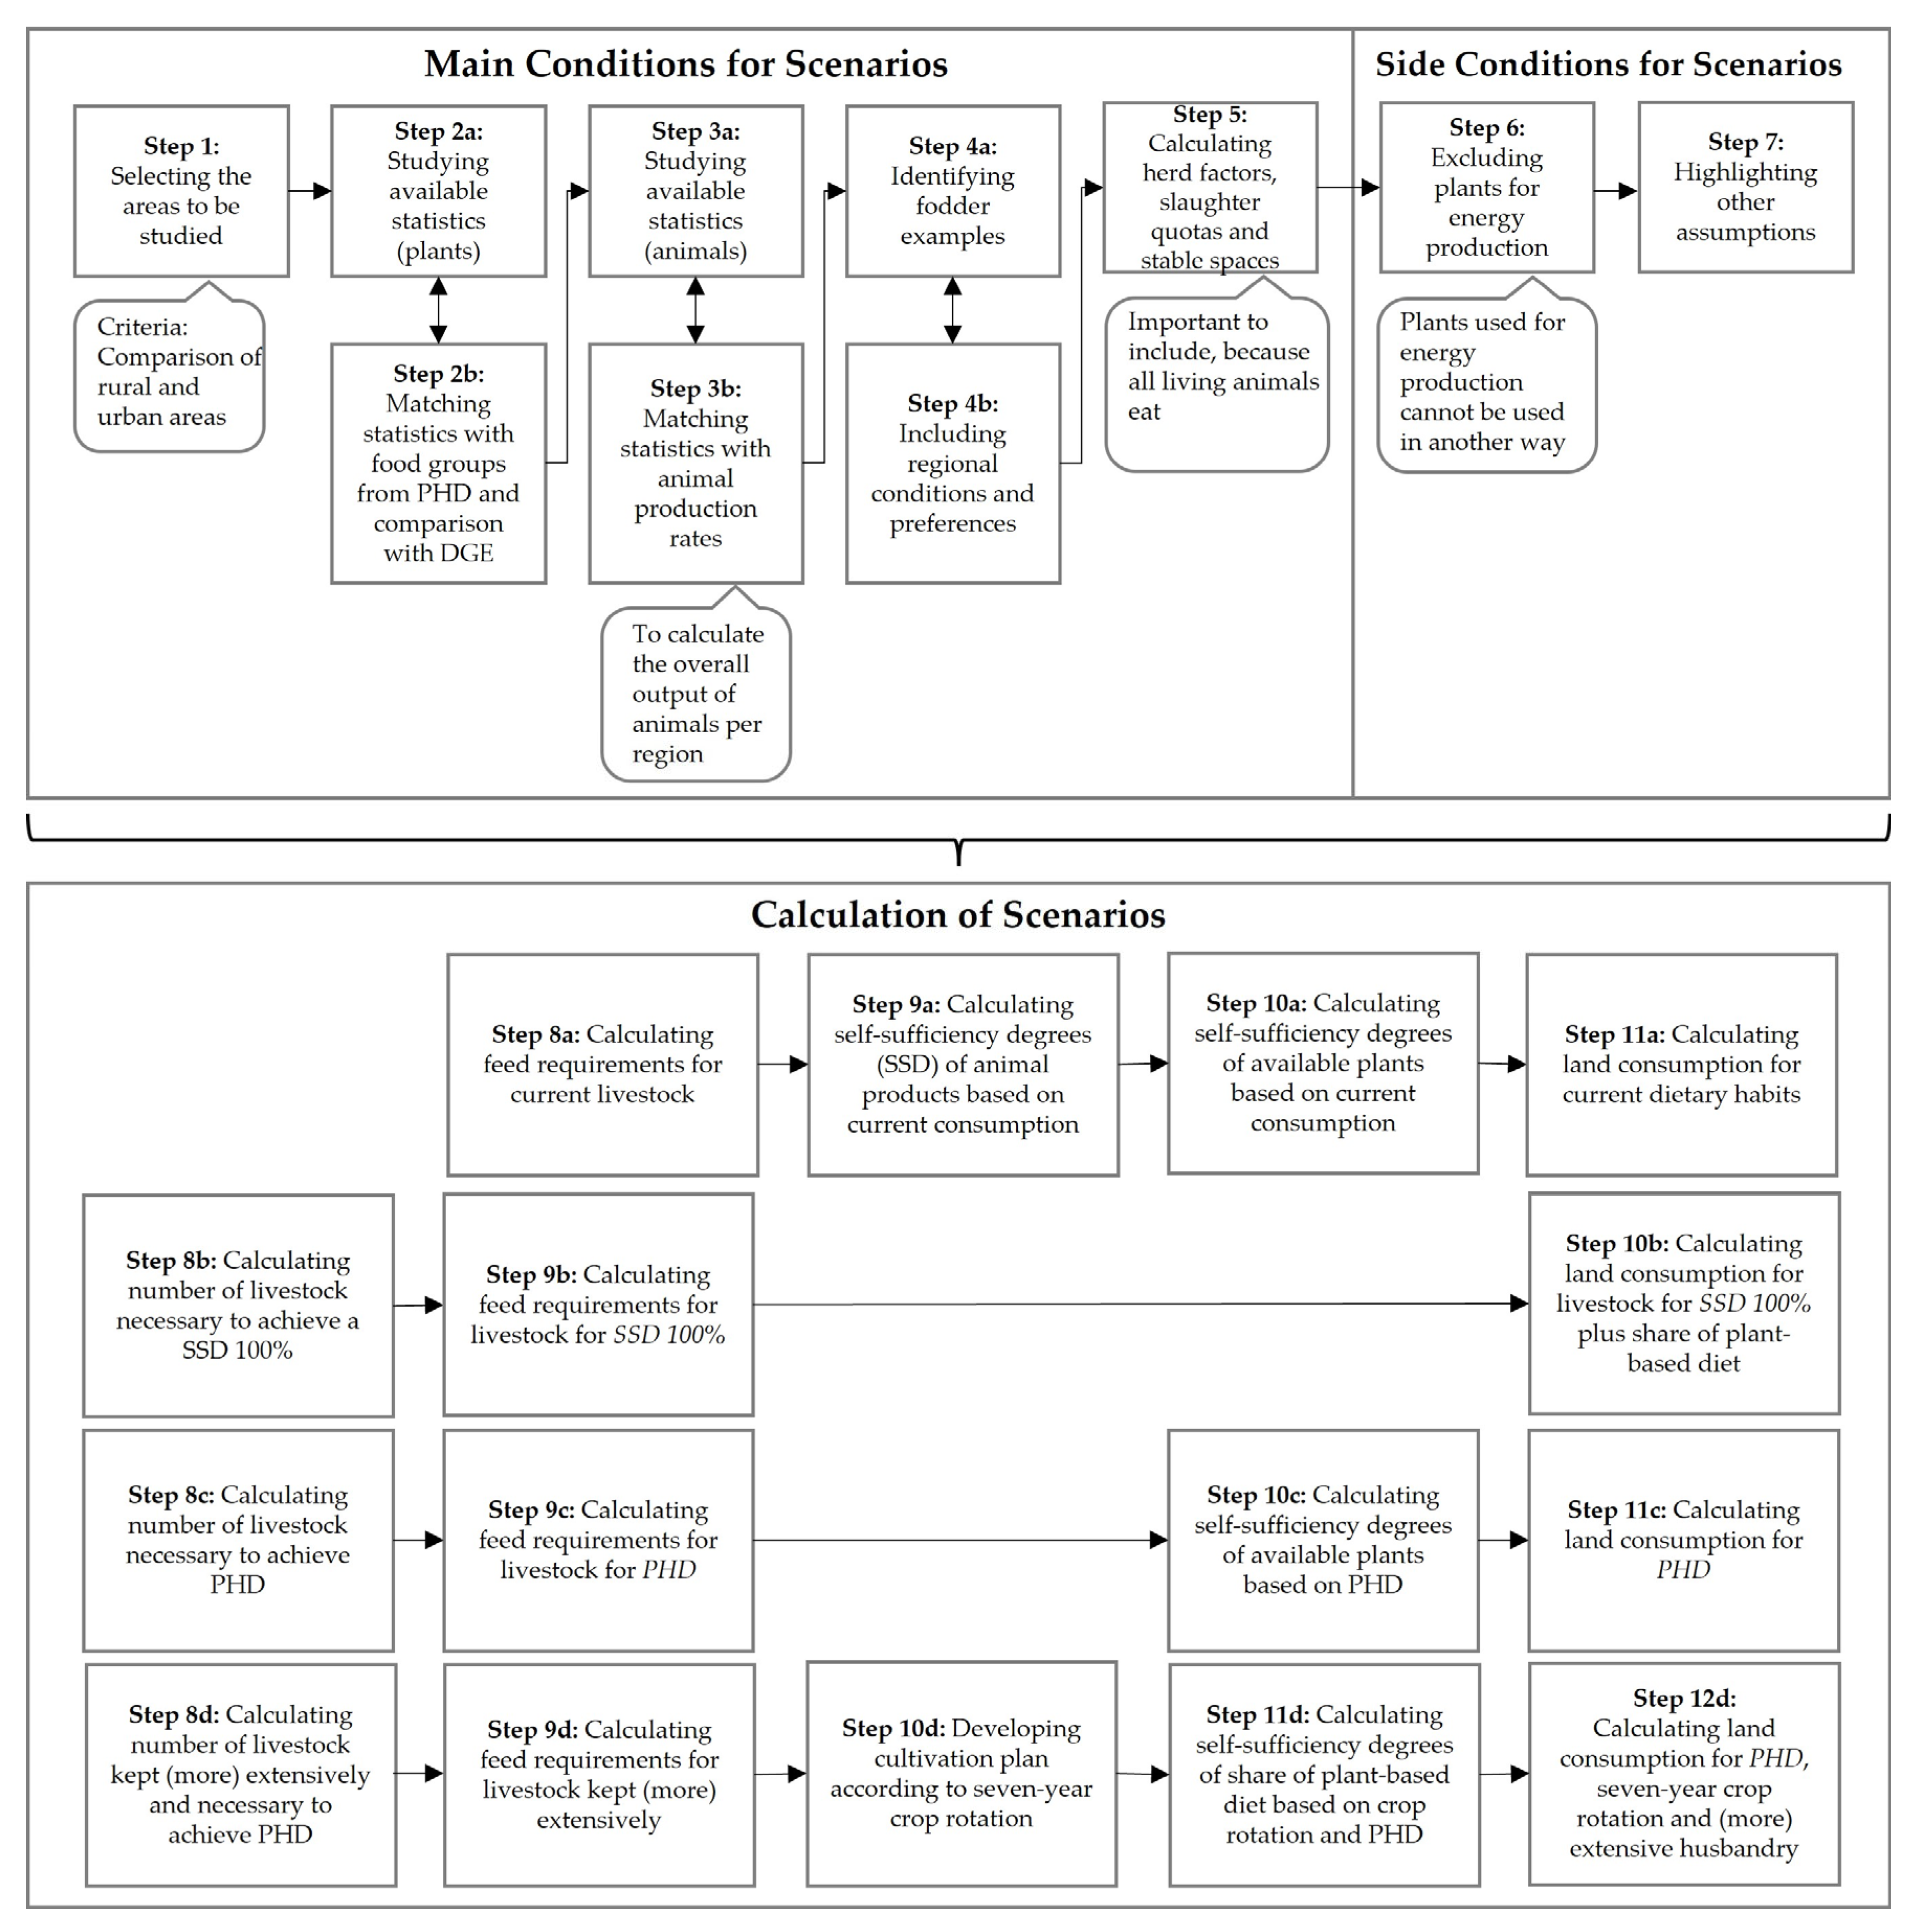
2. Method and Concept of the Study
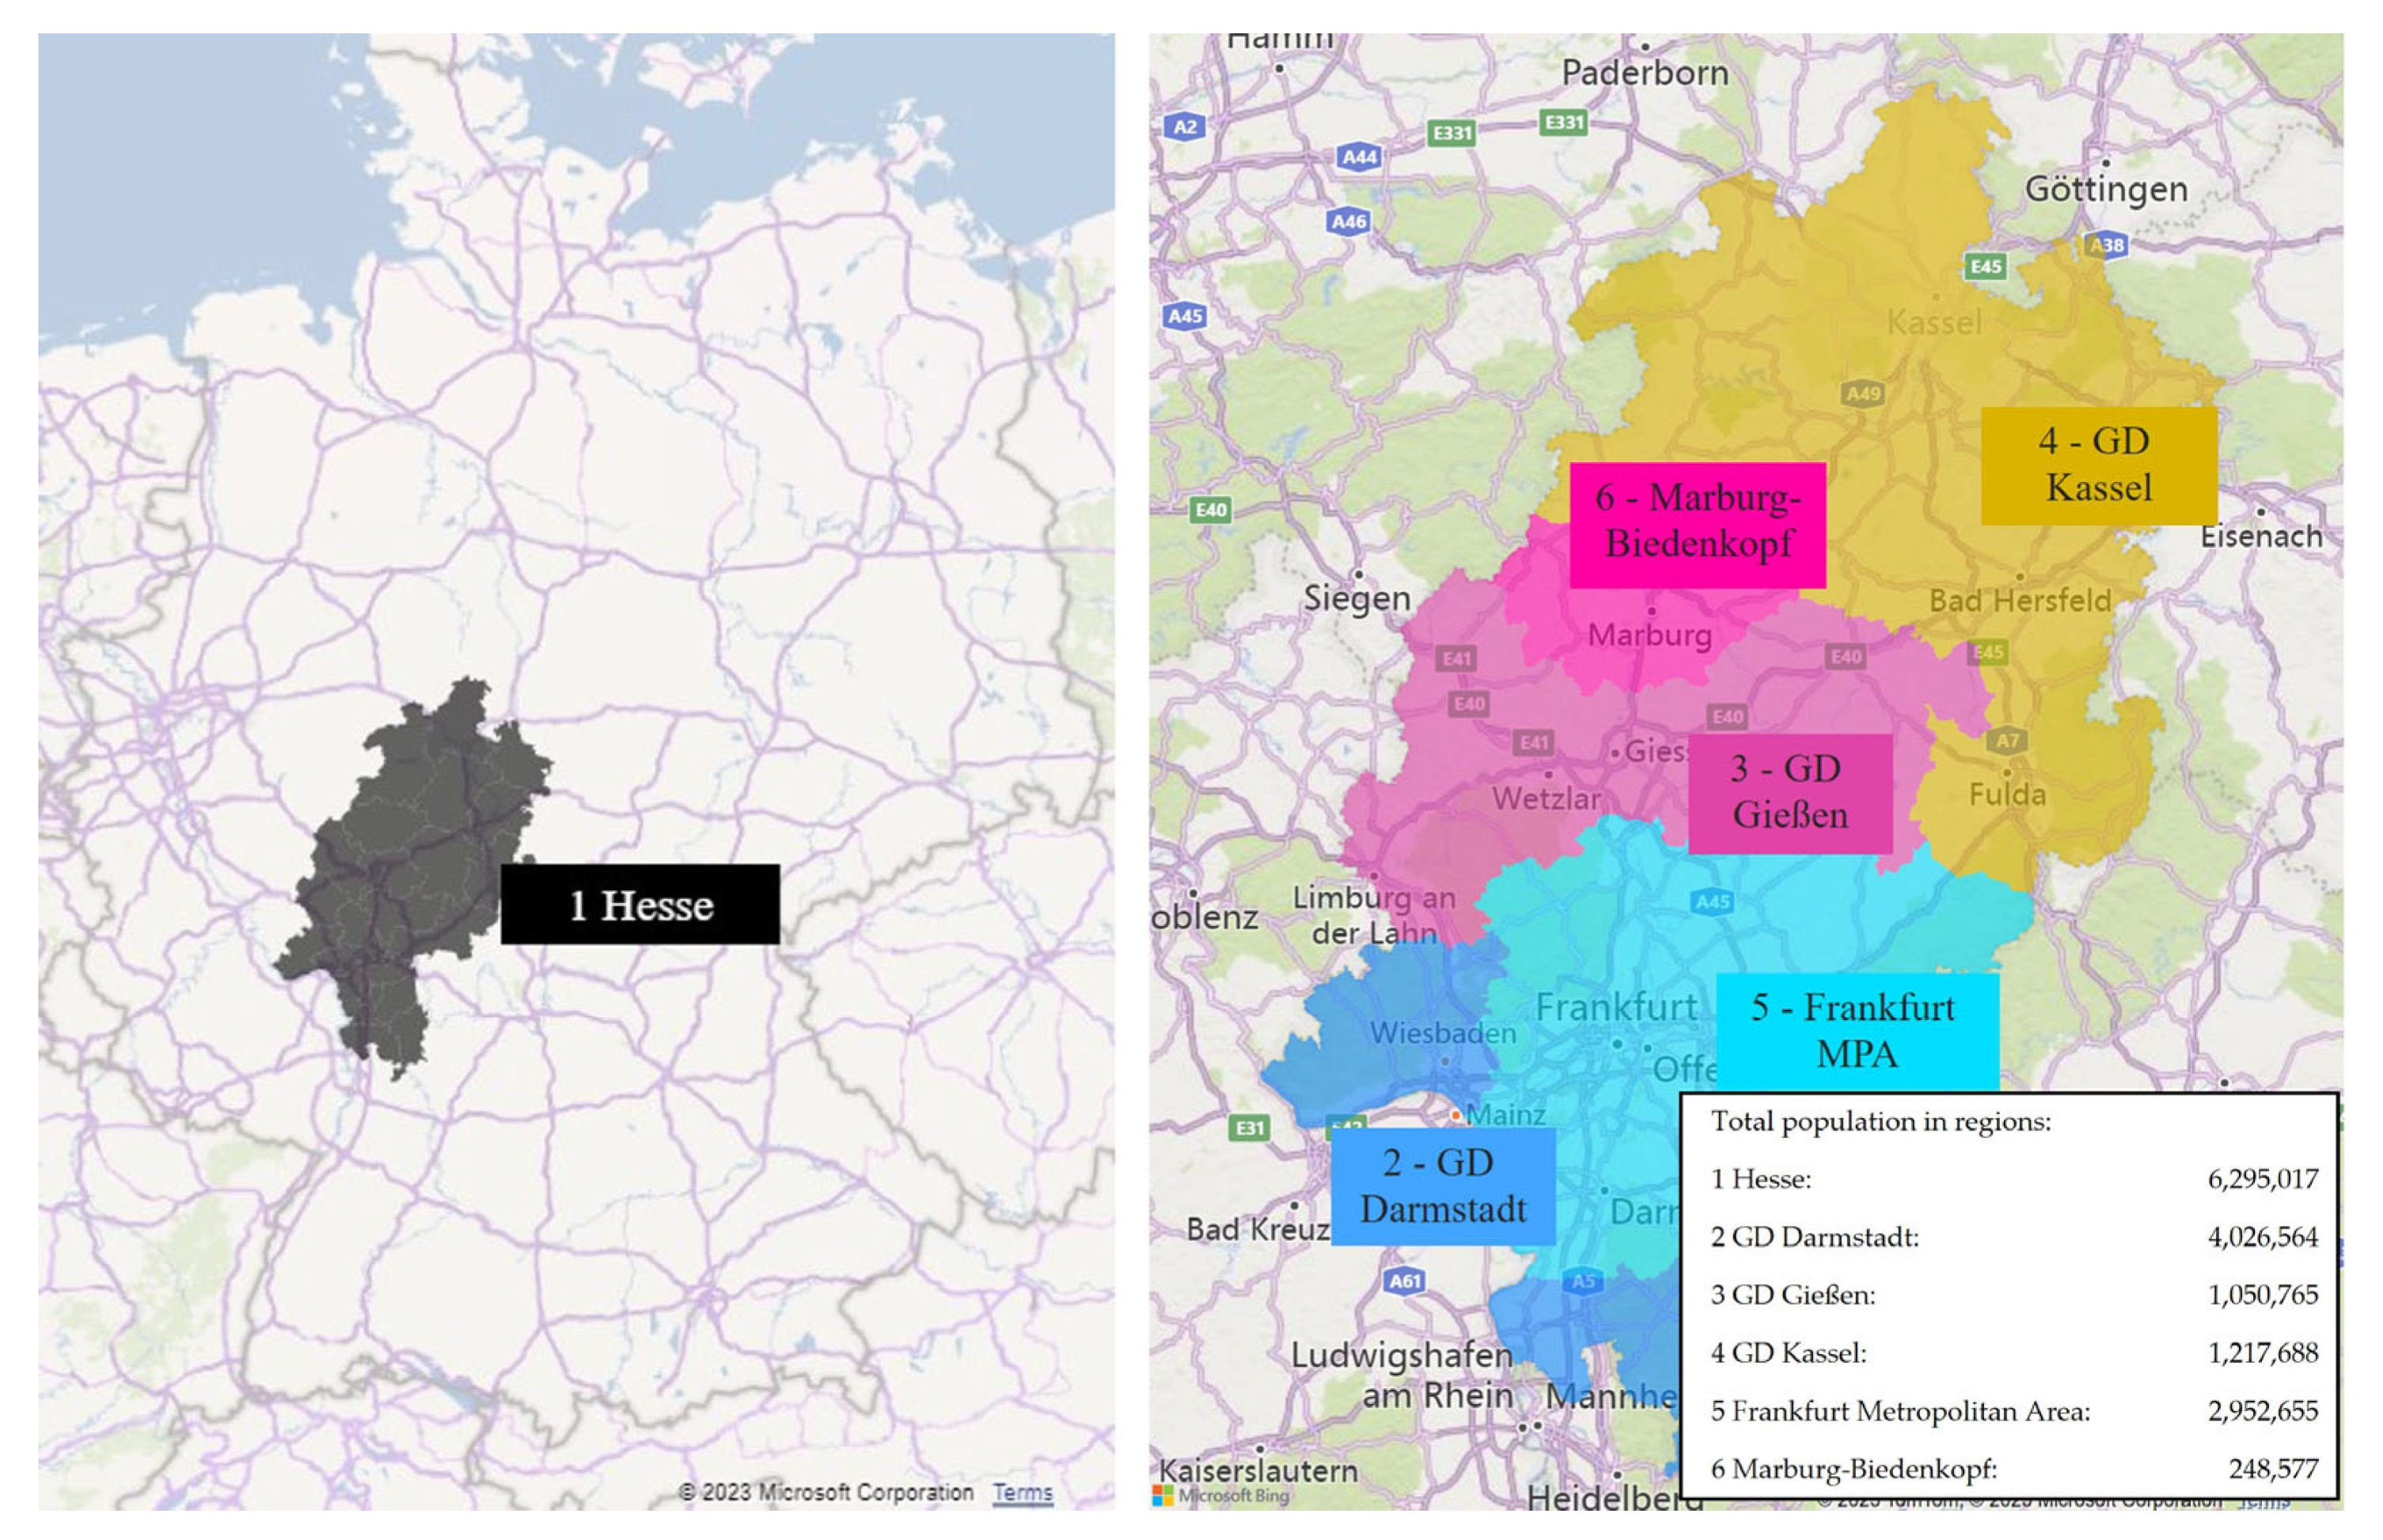
2.1. Regions under Consideration
2.2. Selected Food Groups
2.3. Animal Production Rates
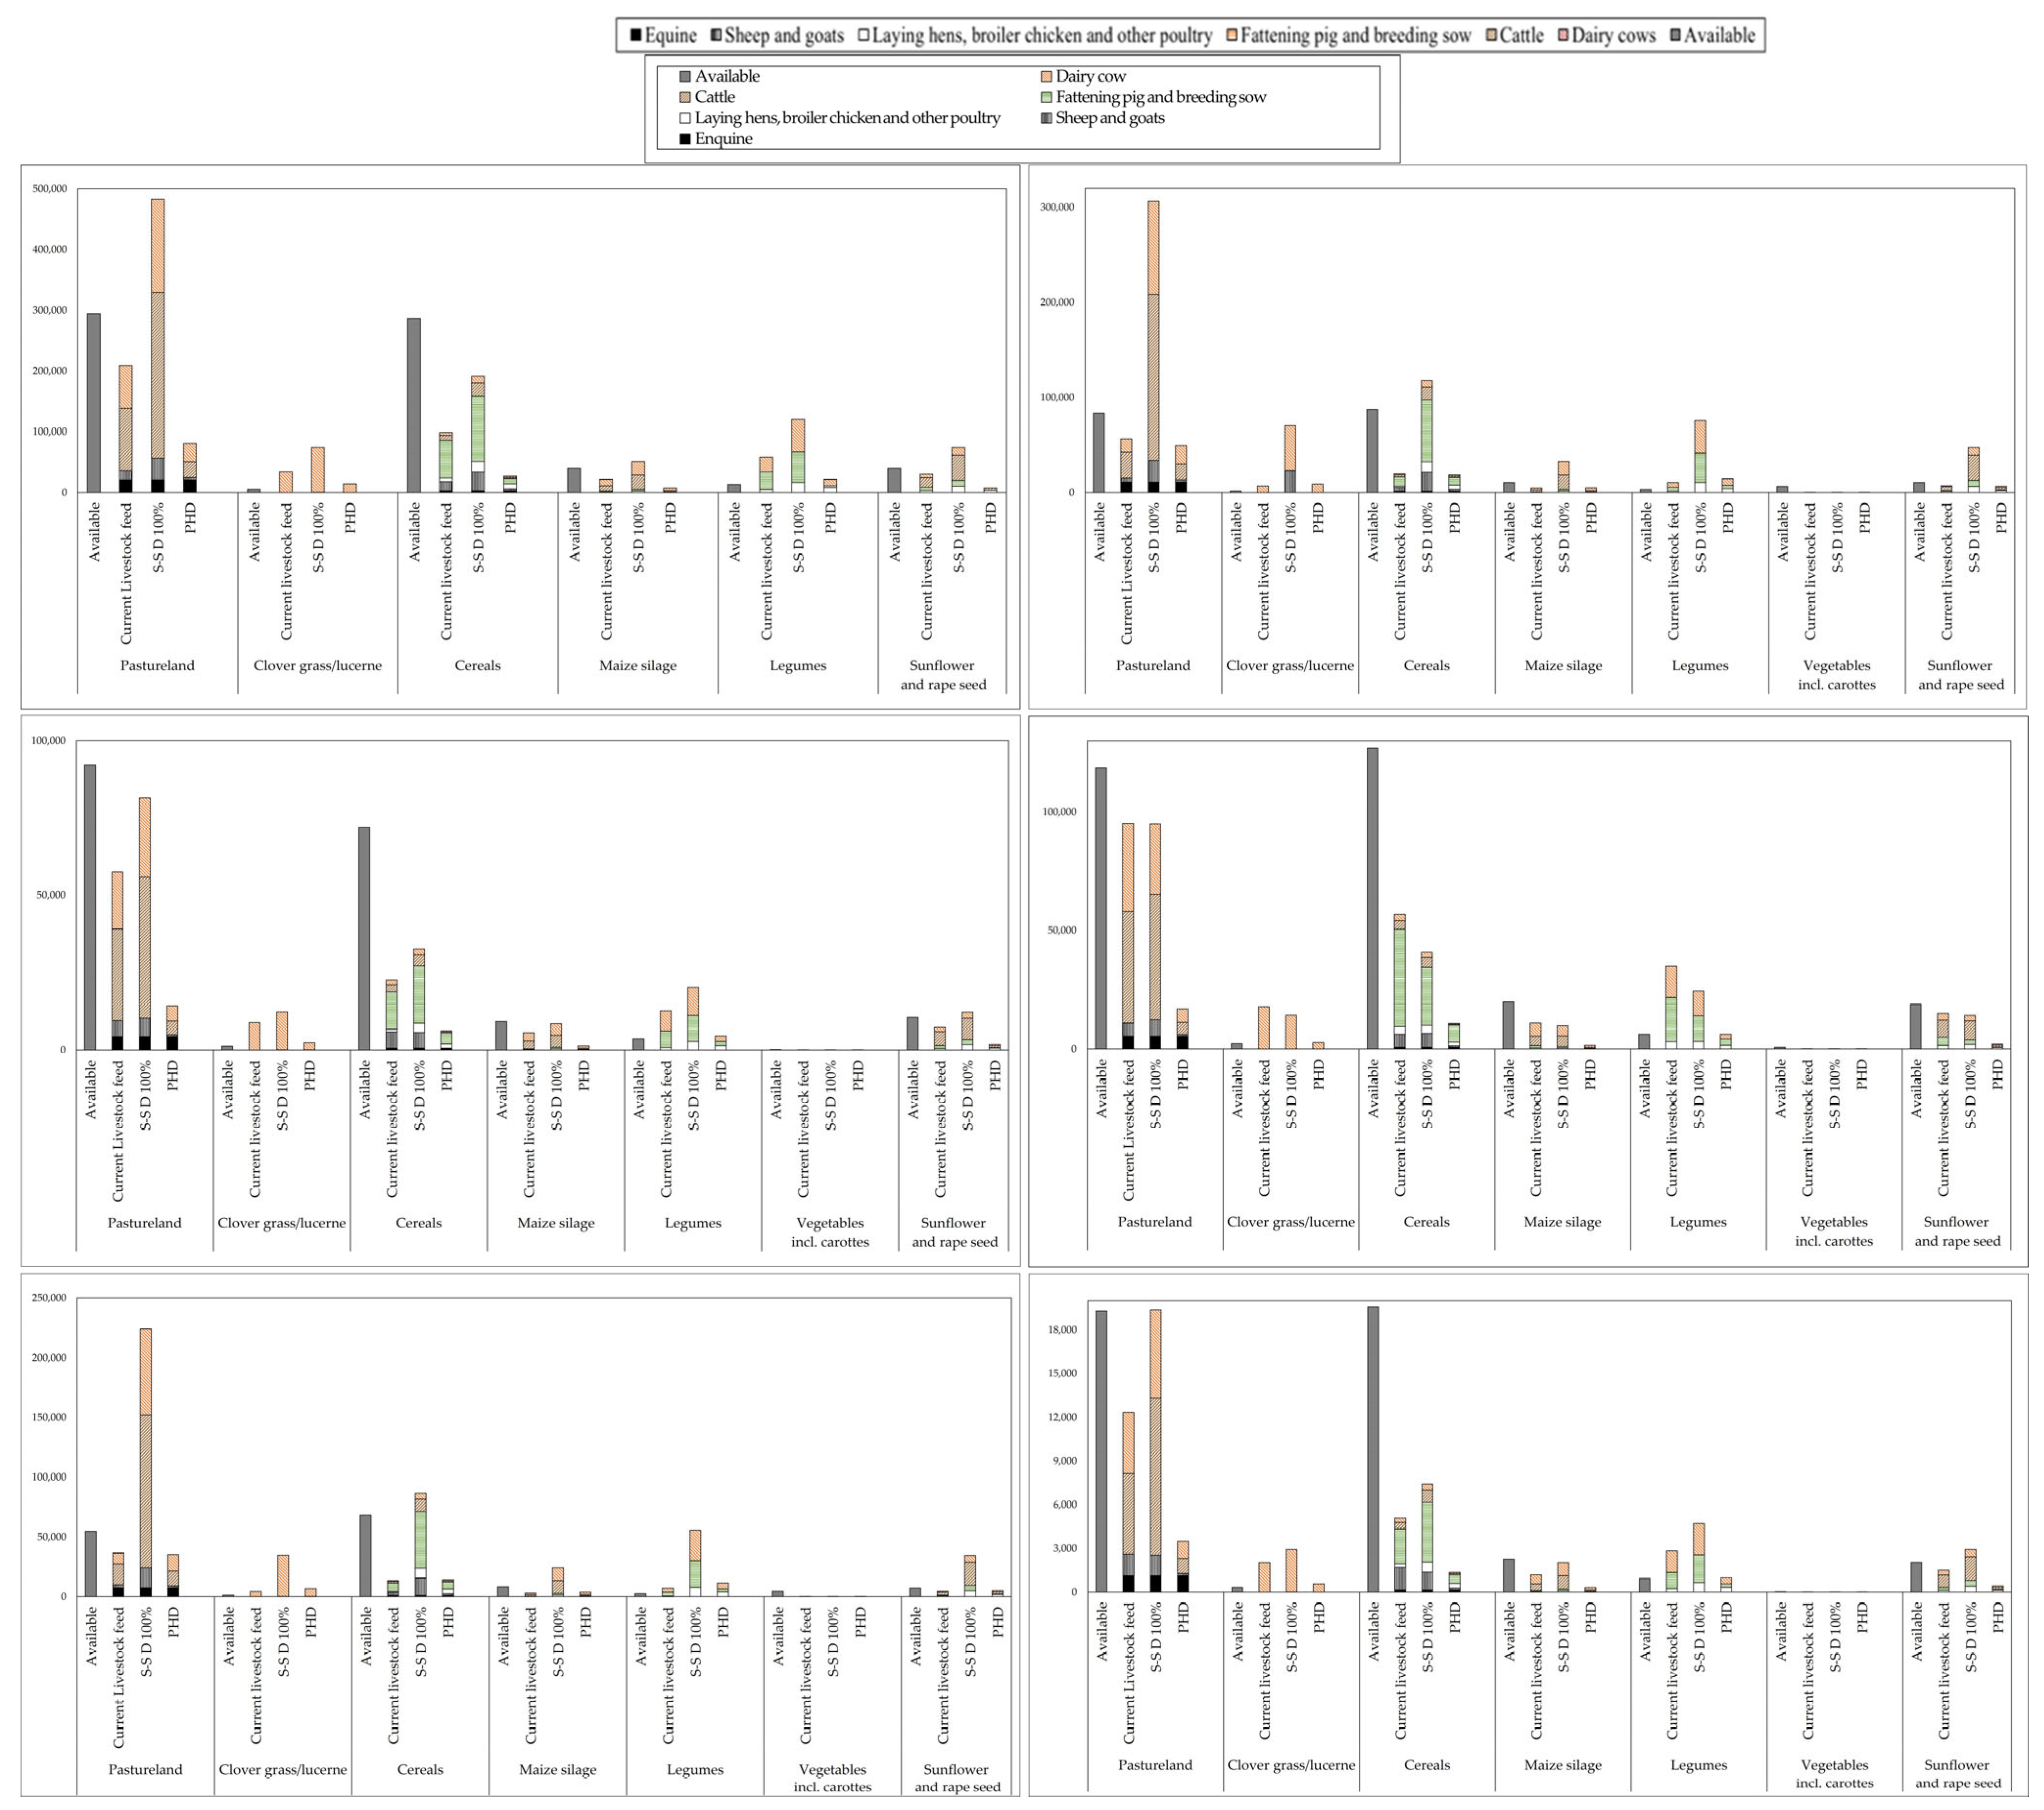
2.4. Land Consumption for Animal Feed
2.5. Plants for Energy Production
2.6. Further Assumptions
2.7. The Calculated Scenarios: Current, SSD 100%, PHD and Extensive
- livestock for current: The necessary feed requirements for current livestock in ha (cf. Table S5) in the different regions and the self-sufficiency degrees of red meat, white meat, eggs and milk/dairy products;
- livestock for SSD 100%: The number of livestock, including herd factors/stable places, necessary to ensure our current consumption patterns (100% self-sufficiency degrees of animal products; cf. Table S9);
- livestock for PHD: The number of livestock, including herd factors/stable places, necessary to ensure the consumption level recommended by the PHD (100% self-sufficiency degrees of animal products; cf. Table S10);
- livestock for extensive—livestock, including seven-year crop rotation system: The self-sufficiency degrees of plants and animal products in the utopian case in which all farmers use a seven-year crop rotation system and only keep animals extensively instead of intensively (as it is mainly practiced today) (cf. Table S11).
3. Analysis of the Status Quo: Low Self-Sufficiency Degrees—What Must Change?
3.1. Overview of the State of Hesse
3.2. Arable Farming
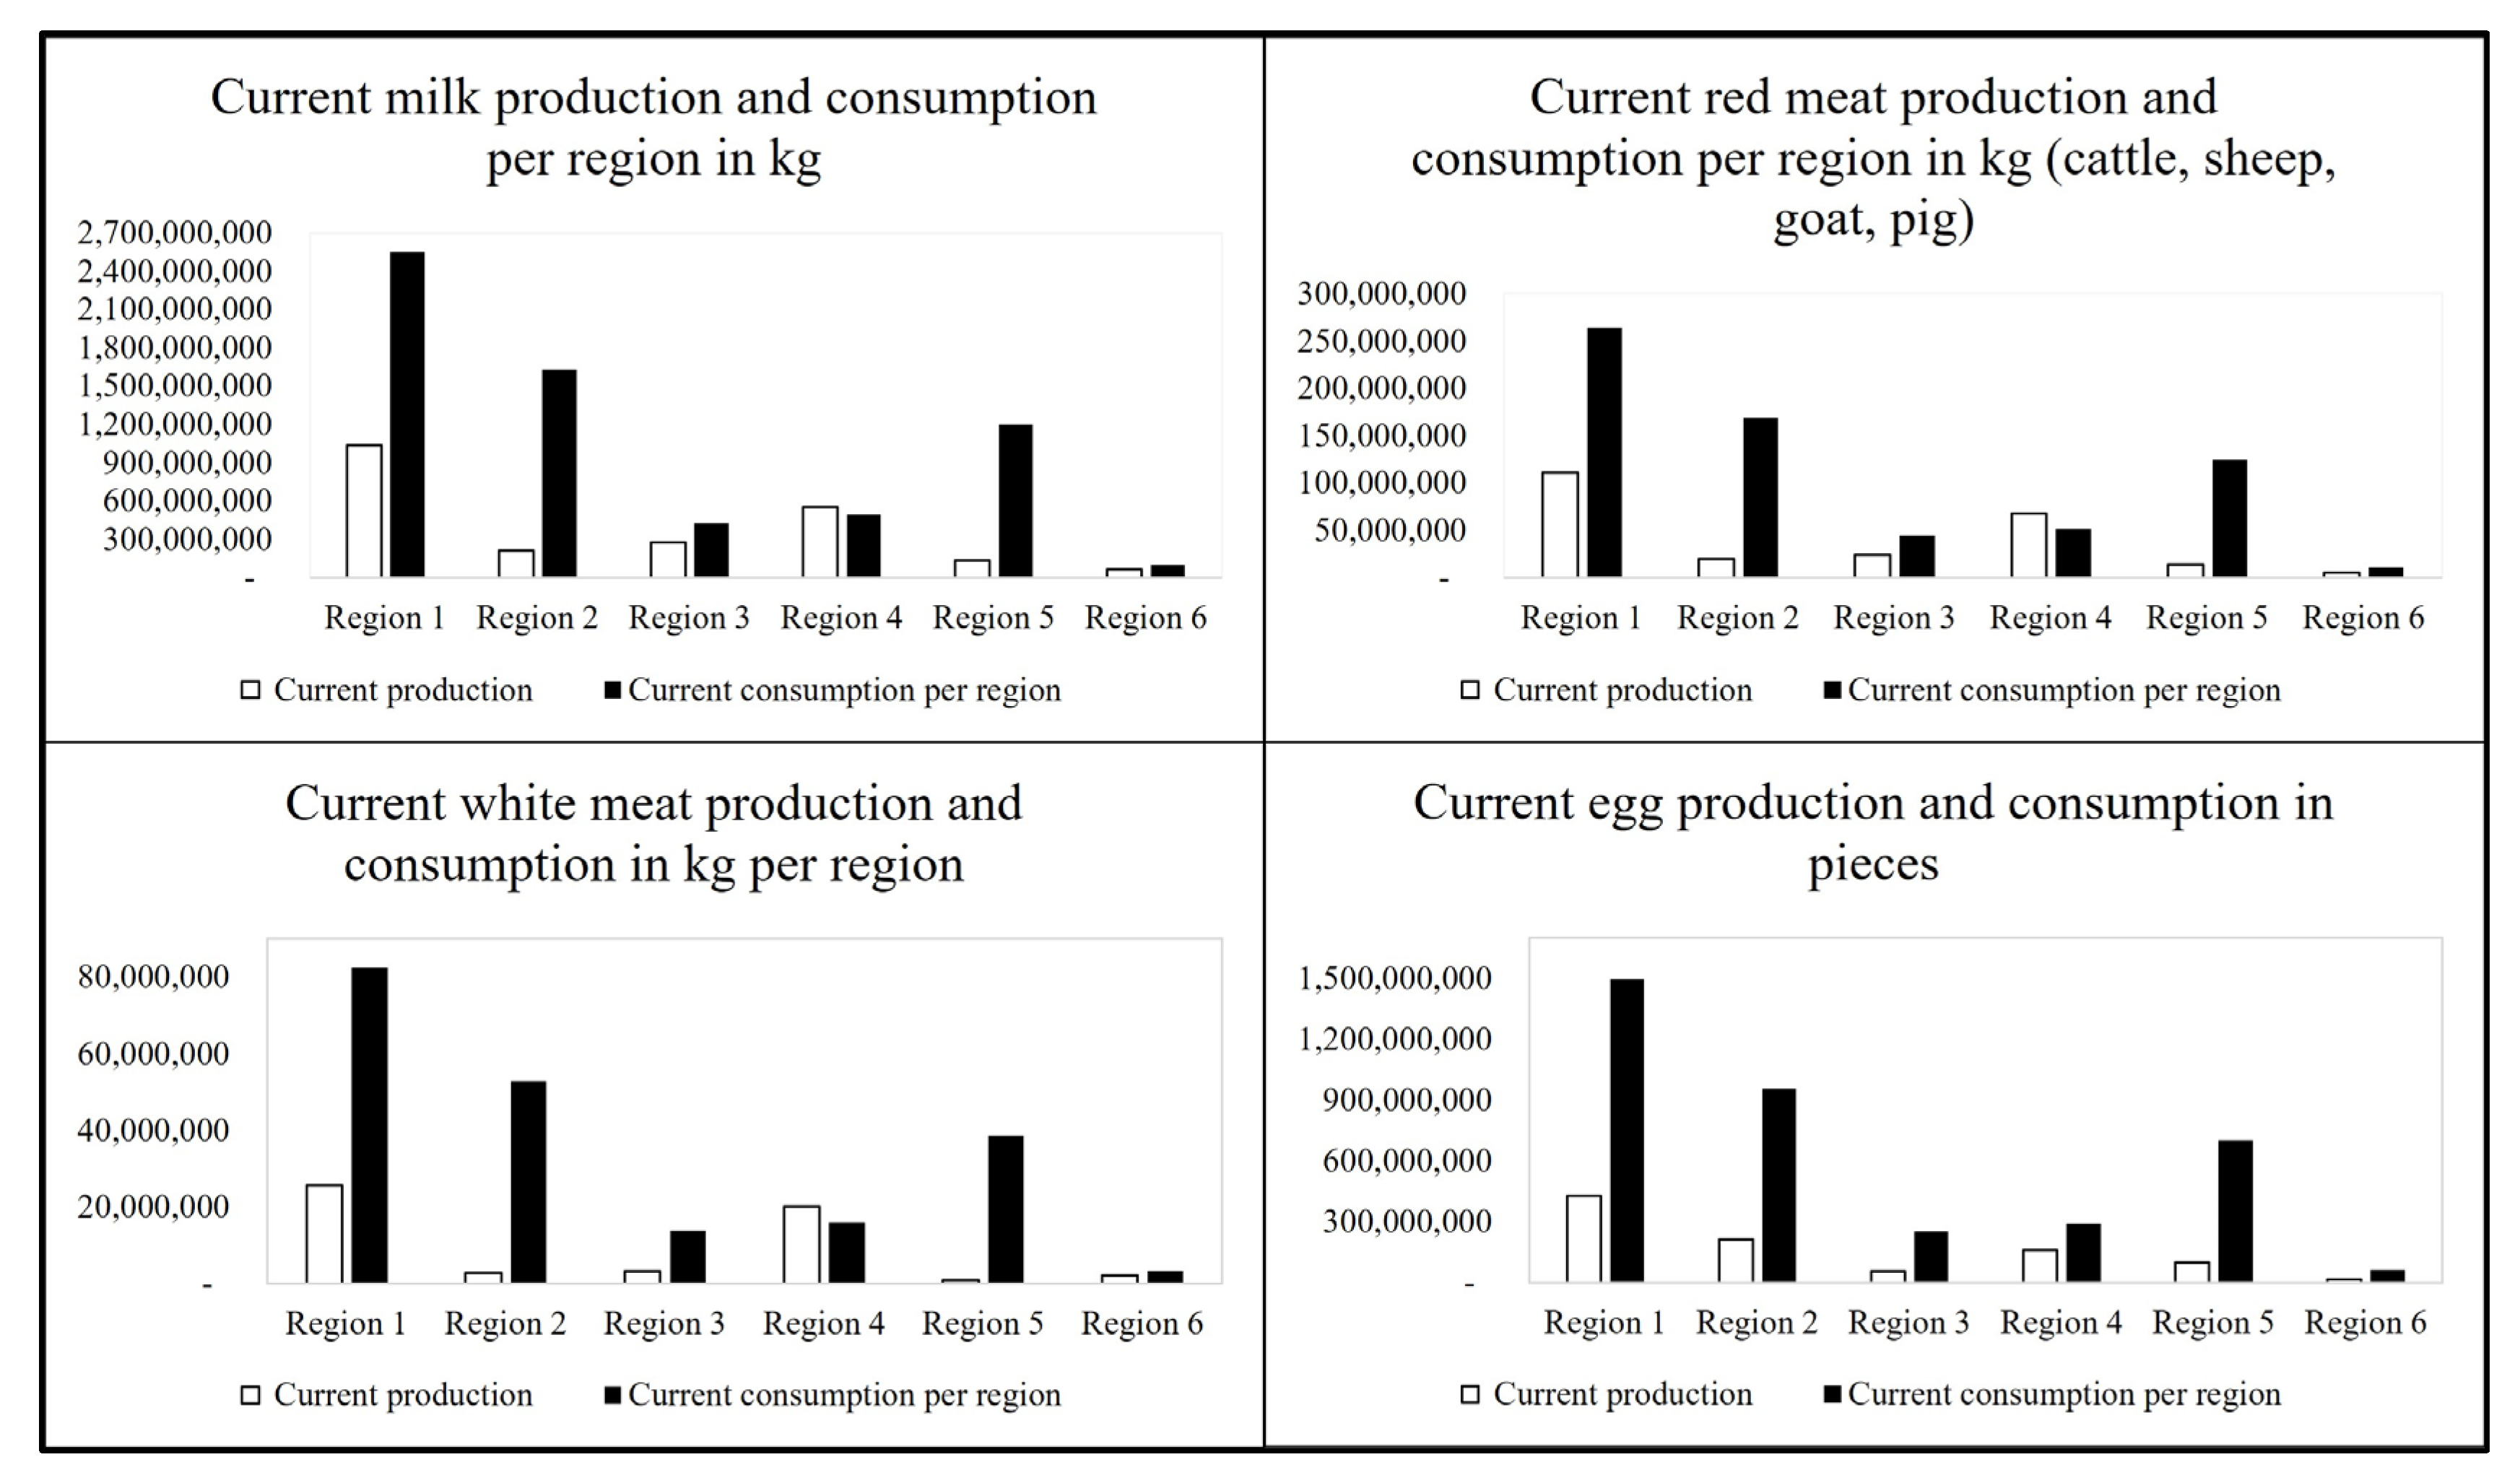
3.3. Current Production and Consumption of Animal Products
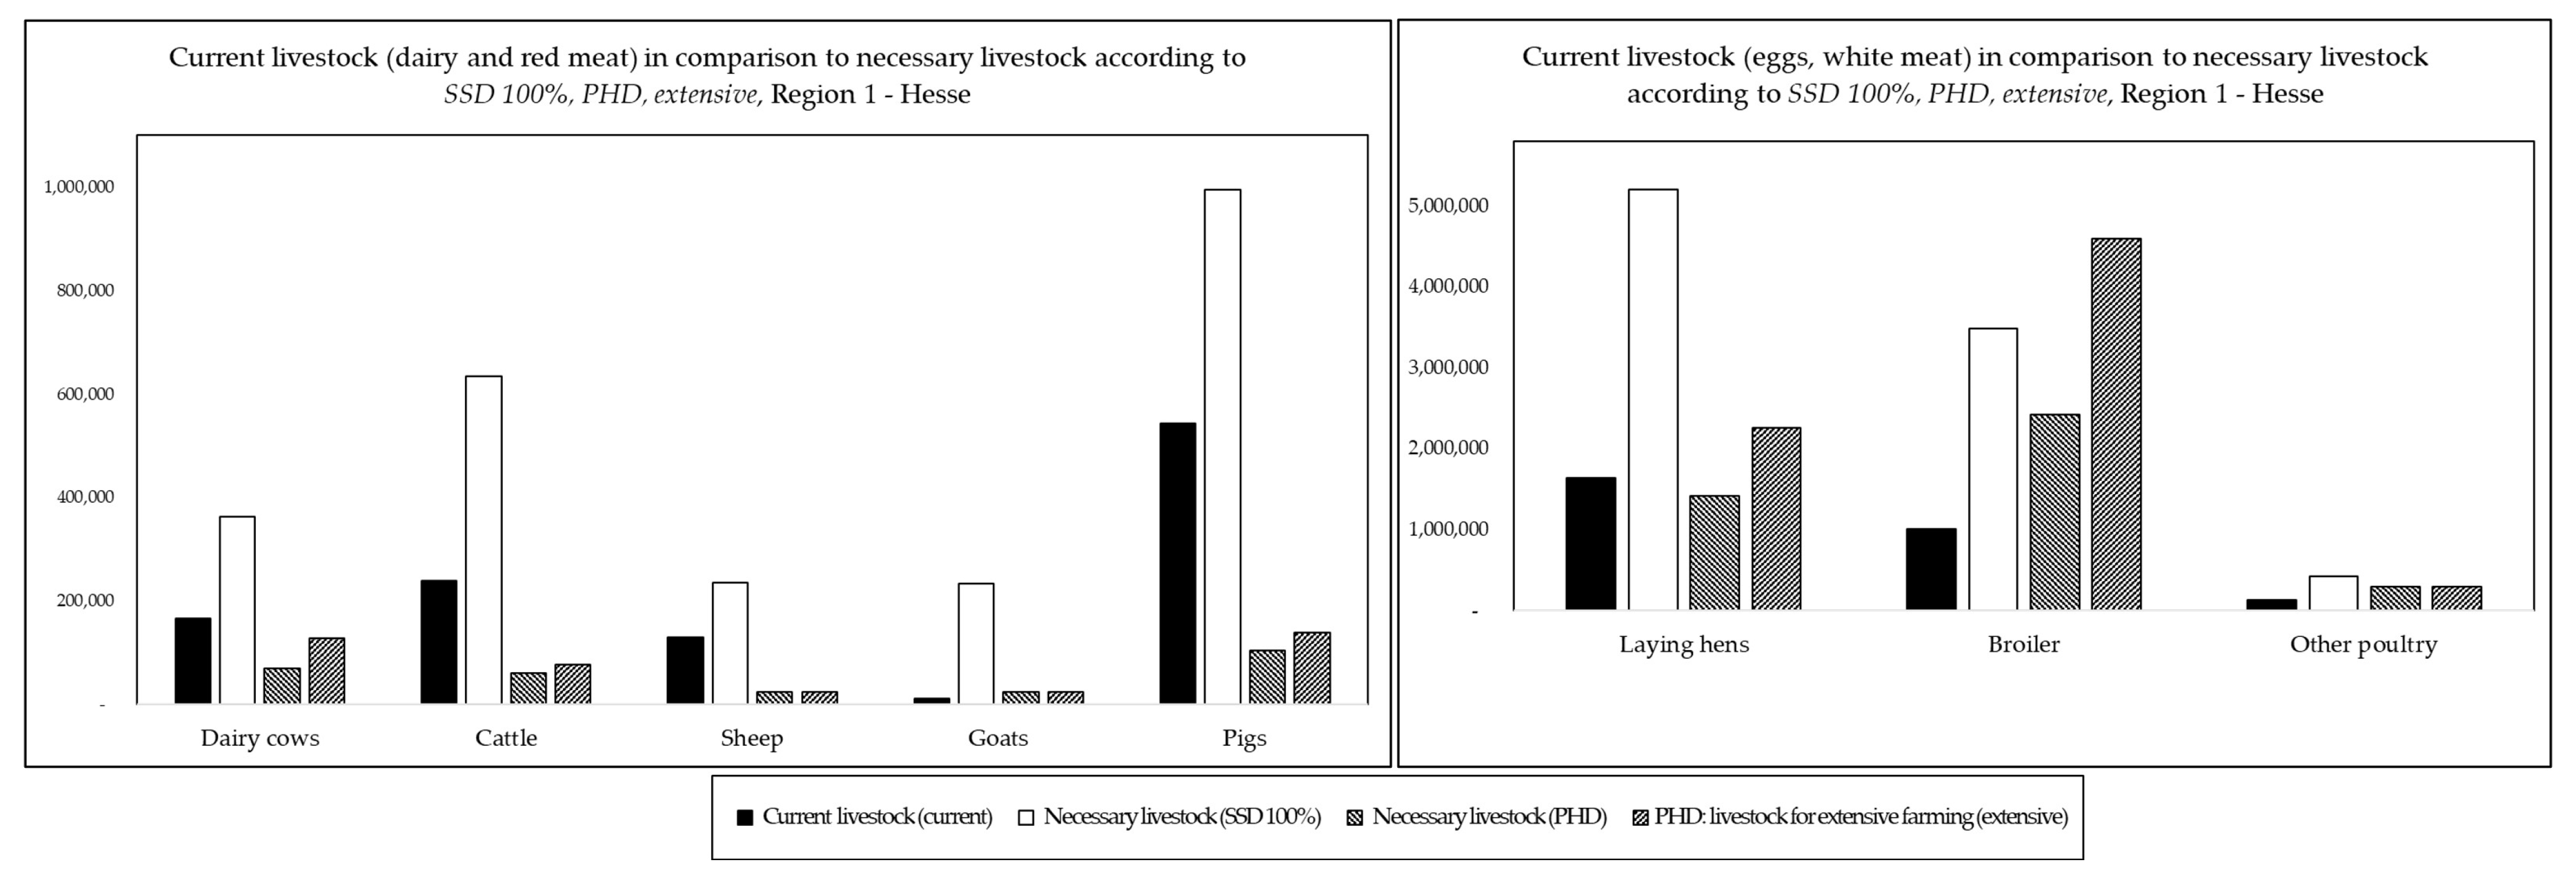
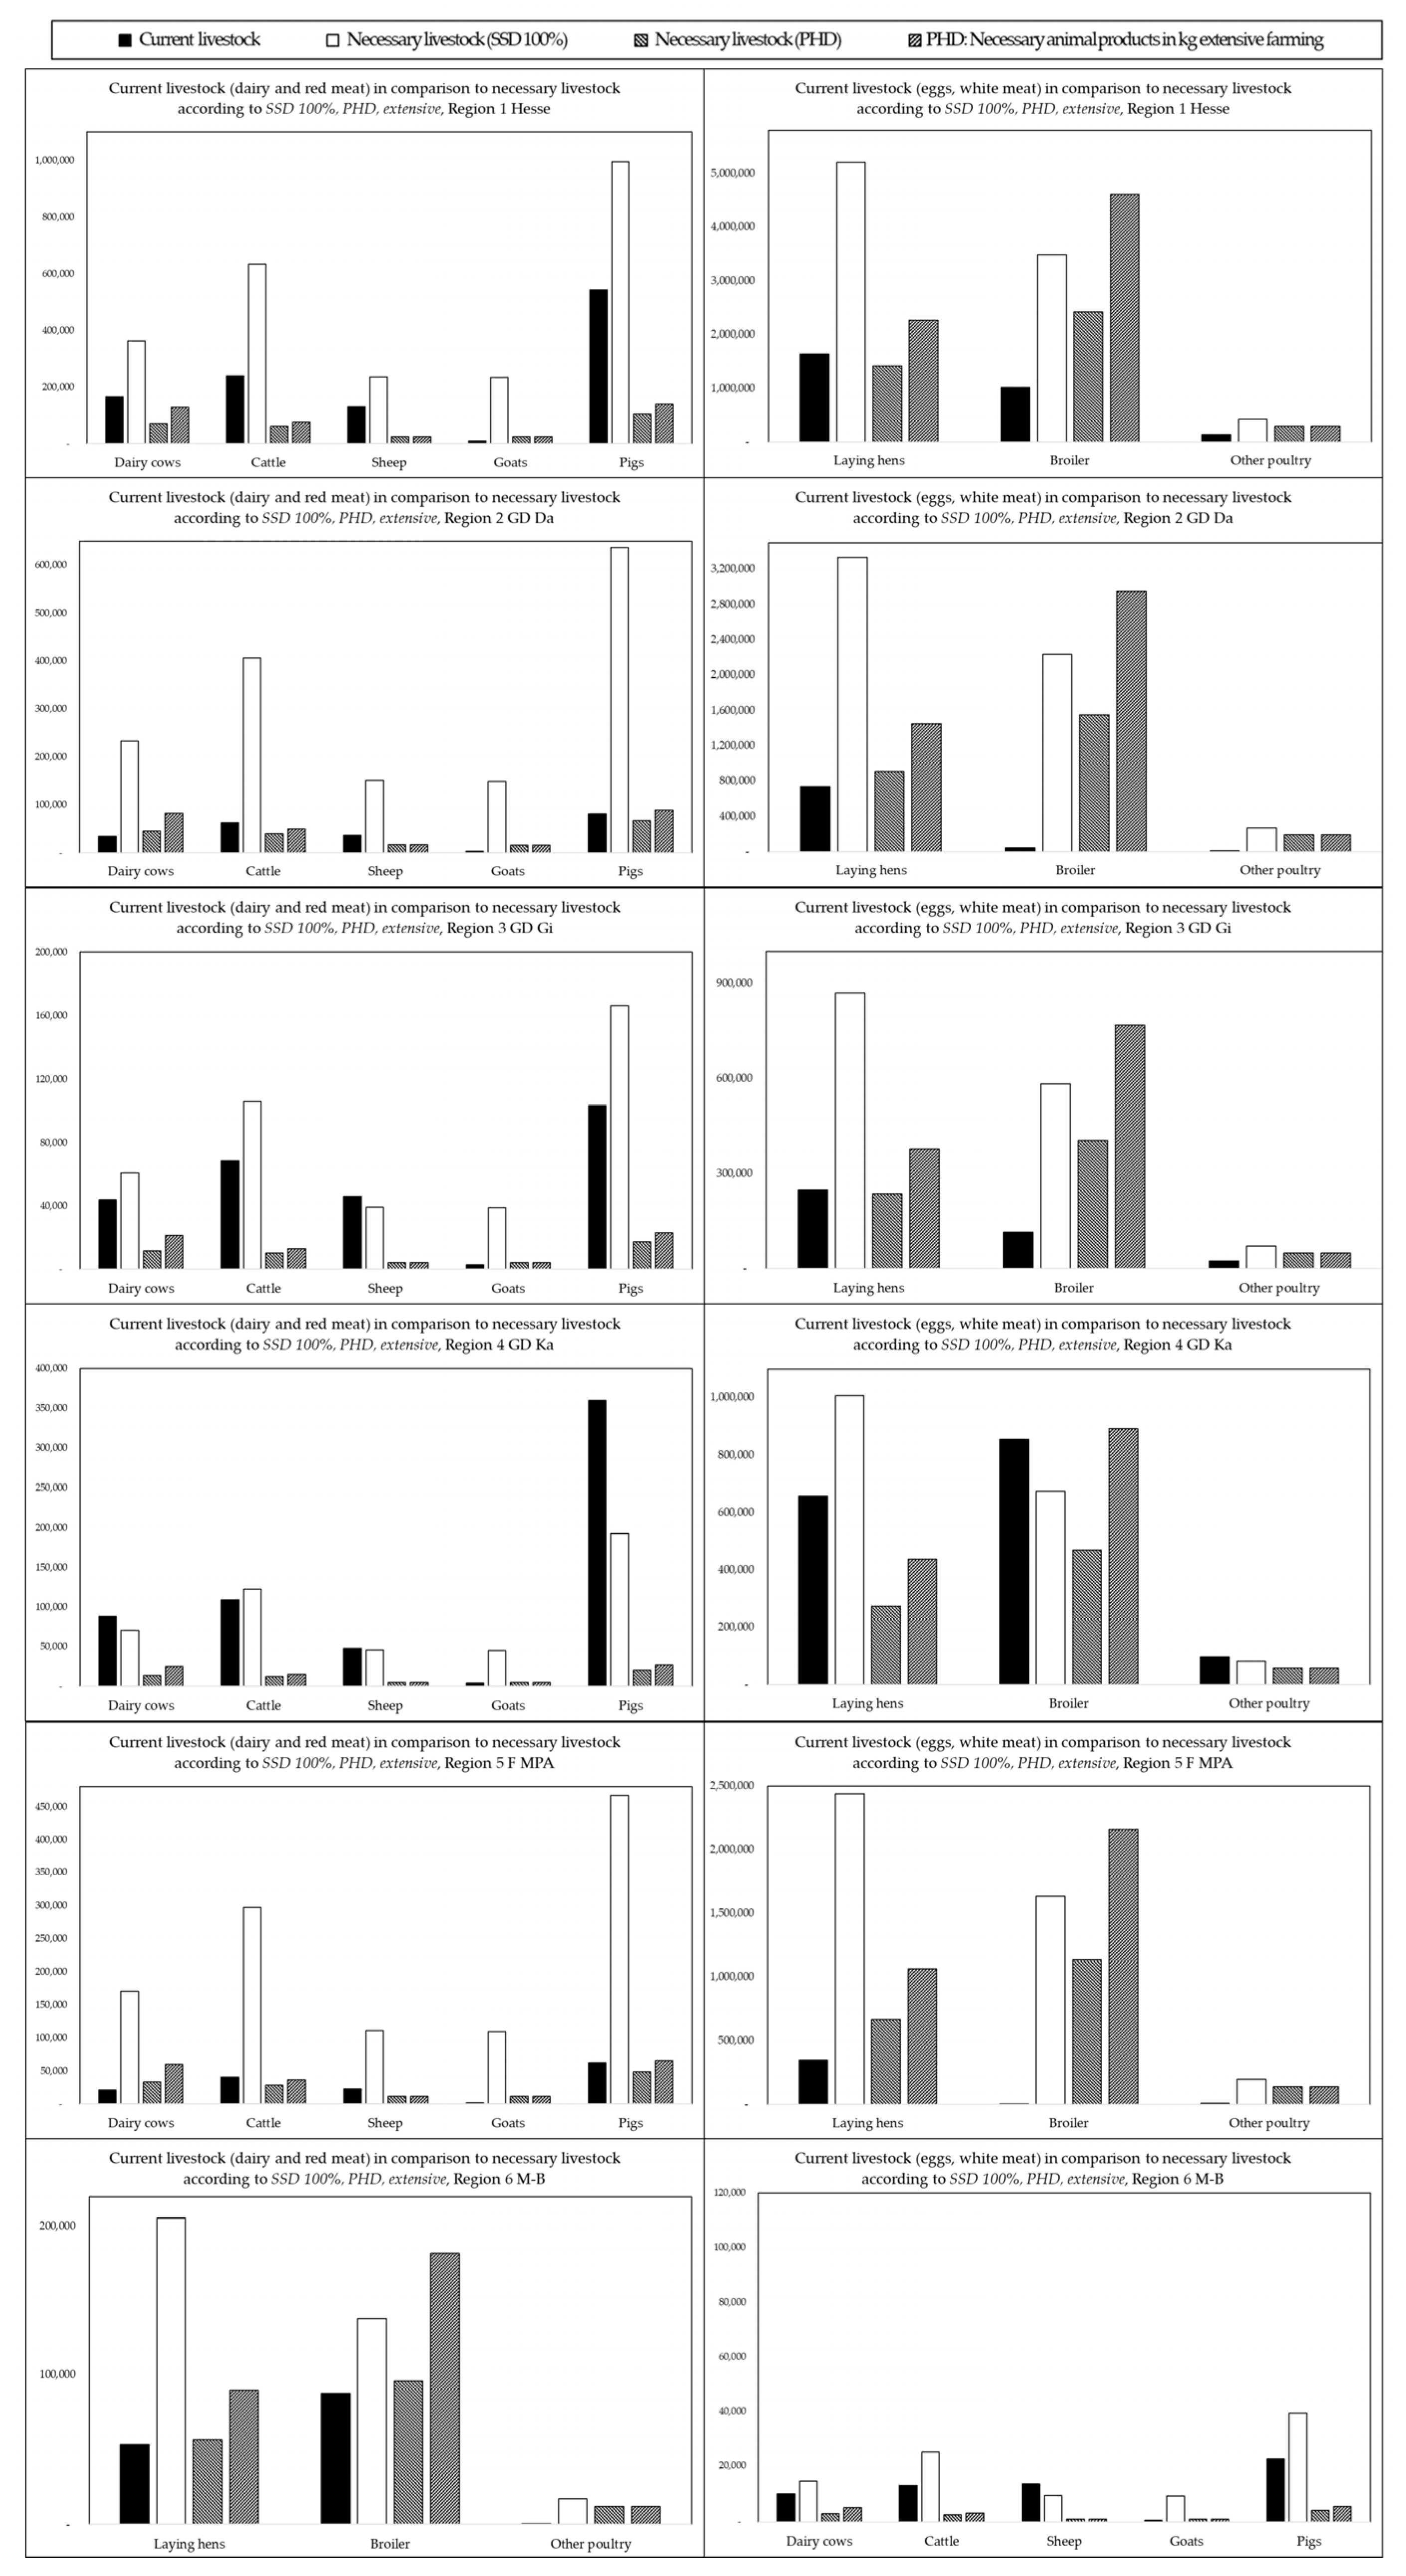
3.4. Calculated Number of Animals for Current Consumption and Consumption According to PHD Recommendations
3.5. Calculation of Feed Quantities and Land Consumption Required for Livestock
3.6. Direct Human Consumption—Self-Sufficiency Degree (SSD 100% and PHD)
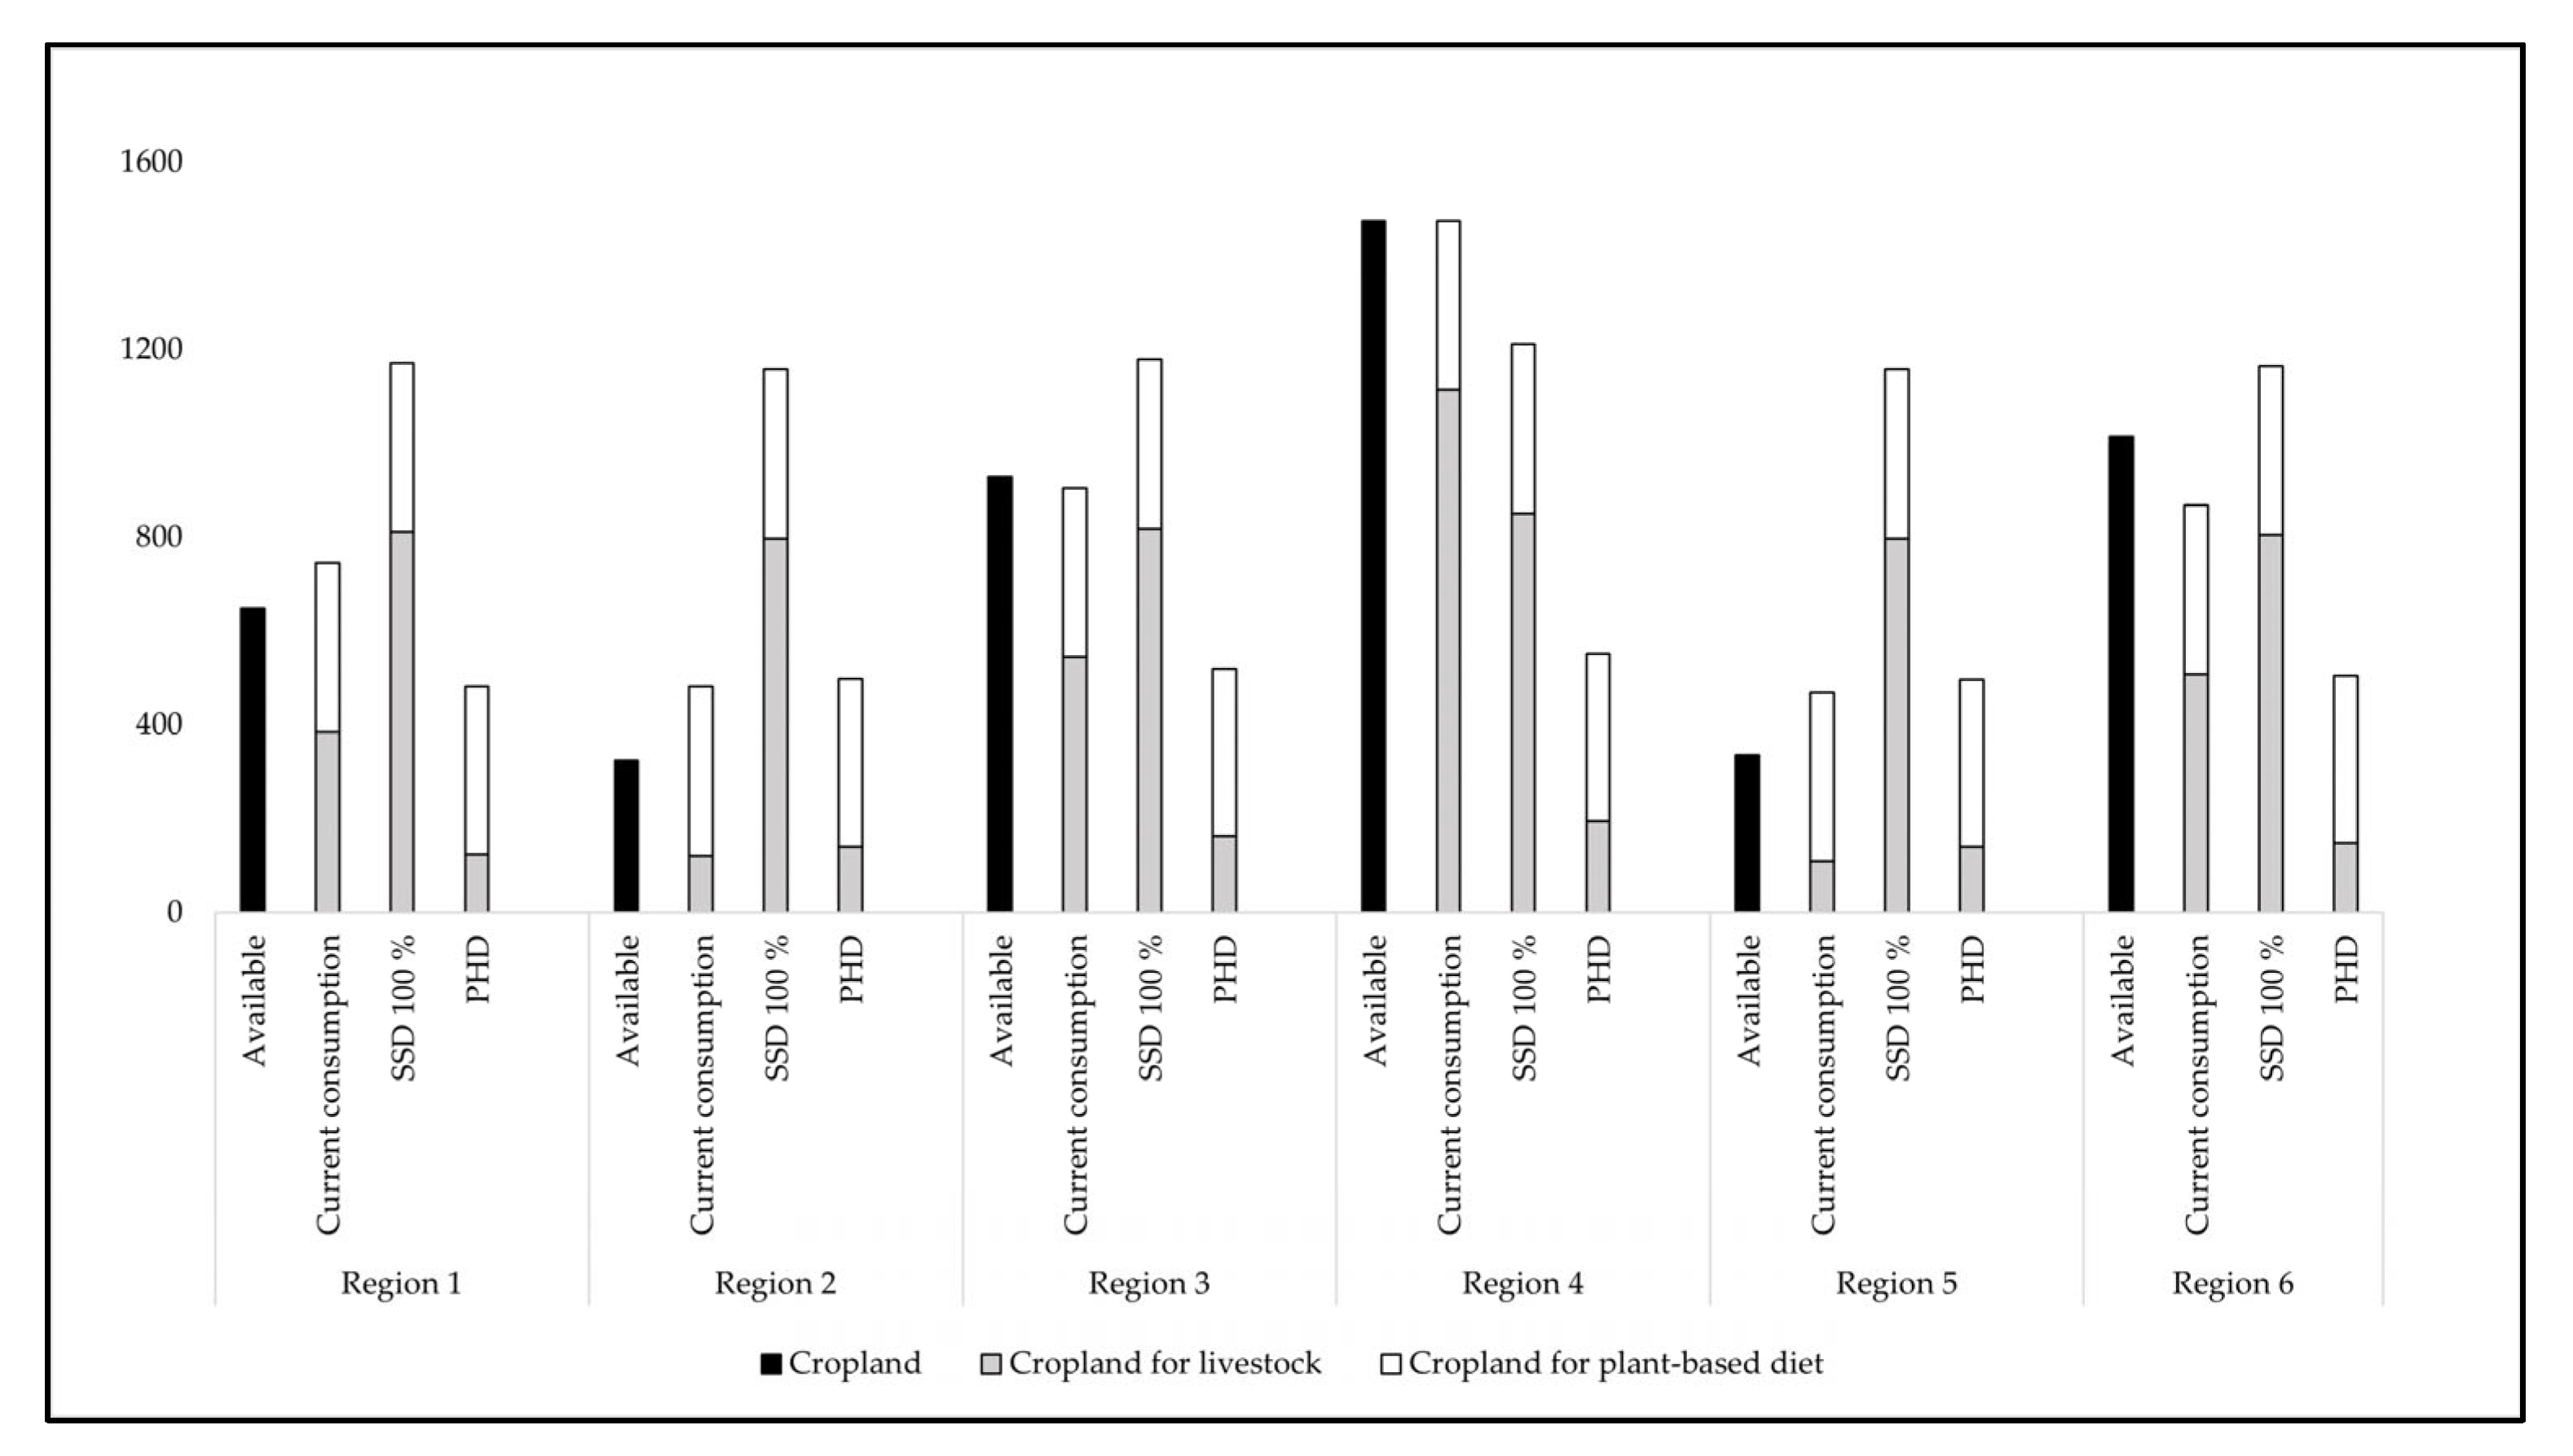
3.7. Land Consumption Due to Consumption Patterns—Total and per Capita
3.8. ‘What Would Change If…’: Self-Sufficiency Degrees Based on the Planetary Health Diet plus Crop Rotation and Extensive Animal Husbandry
4. Discussion—We Must Change Our Consumption Level
4.1. Climate Change Mitigation—A Multi-Layered Global Challenge
4.2. Adapting the Planetary Health Diet to Local Cuisine and Culture
4.3. The Planetary Health Diet and Pets
5. Conclusions
Supplementary Materials
Author Contributions
Funding
Institutional Review Board Statement
Informed Consent Statement
Data Availability Statement
Acknowledgments
Conflicts of Interest
Appendix A

| Available Crop Land in Hectare, Regions 1 to 6 (I) | |||||||||||
|---|---|---|---|---|---|---|---|---|---|---|---|
| thereof | |||||||||||
| Region | Operating Farms | Crop Land Total | Cereals Total | Wheat, Spelt, Einkorn | Rye | Triticale | Barley | Oat | Corn Maize/Corn-Cob-Mix | Other Cereals | |
| 1 Hesse | in total | 15,128 | 464,437 | 289,347 | 143,606 | 15,059 | 19,342 | 87,266 | 9277 | 13,470 | 1327 |
| thereof organic | 2108 | 22,296 | 9318 | 2383 | 3101 | 3655 | 2496 | 787 | 556 | ||
| in % | 14% | 8% | 6% | 16% | 16% | 4% | 27% | 6% | 42% | ||
| 2 GD Da | in total | 4935 | 145,714 | 88,511 | 48,442 | 4670 | 2440 | 23,057 | 2458 | 6963 | 481 |
| thereof organic | 486 | 4506 | 1925 | 467 | 372 | 712 | 534 | 389 | 108 | ||
| in % | 10% | 5% | 4% | 10% | 15% | 3% | 22% | 6% | 22% | ||
| 3 GD Gi | in total | 3832 | 113,216 | 72,640 | 33,400 | 3658 | 5657 | 23,318 | 3039 | 3198 | 370 |
| thereof organic | 743 | 8677 | 3523 | 962 | 1292 | 1402 | 1060 | 235 | 202 | ||
| in % | 19% | 12% | 11% | 26% | 23% | 6% | 35% | 7% | 55% | ||
| 4 GD Ka | in total | 6361 | 204,239 | 128,197 | 61,764 | 6731 | 11,244 | 40,892 | 3780 | 3310 | 476 |
| thereof organic | 879 | 9113 | 3870 | 954 | 1437 | 1541 | 902 | 163 | 247 | ||
| in % | 14% | 7% | 6% | 14% | 13% | 4% | 24% | 5% | 52% | ||
| 5 F MPA | in total | 3207 | 112,825 | 69,097 | 38,528 | 3991 | 1825 | 16,787 | 1614 | 5967 | 385 |
| thereof organic | 323 | 3691 | 1578 | 392 | 282 | 480 | 378 | 330 | 65 | ||
| in % | 10% | 5% | 4% | 10% | 15% | 3% | 23% | 6% | 17% | ||
| 6 M-B | in total | 1106 | 29,664 | 19,765 | 8189 | 1417 | 1791 | 5777 | 889 | 1619 | 83 |
| thereof organic | 197 | 2625 | 918 | 370 | 449 | 471 | 277 | 103 | 35 | ||
| in % | 18% | 13% | 11% | 26% | 25% | 8% | 31% | 6% | 42% | ||
| Available Crop Land in Hectare, Regions 1 to 6 (II) | |||||||||||
| Region | Silage Maize | Sugar Beets | Potatoes | Winter Oilseed Rape | Pulses | Vege-tables | Grass-land | Per-manent Crops | Clover Grass/Lucerne | ||
| 1 Hesse | in total | 43,897 | 16,504 | 4421 | 43,204 | 13,410 | 7494 | 294,288 | 5855 | 501 | |
| thereof organic | 1425 | 318 | 495 | 179 | 4666 | ||||||
| in % | 3% | 2% | 11% | 0% | 35% | ||||||
| 2 GD Da | in total | 11,689 | 8,845 | 3192 | 11,406 | 3303 | 6582 | 83,574 | 4888 | 133 | |
| thereof organic | 188 | 157 | 187 | 52 | 881 | ||||||
| in % | 2% | 2% | 6% | 0% | 27% | ||||||
| 3 GD Gi | in total | 10,198 | 1486 | 487 | 11,465 | 3737 | 150 | 92,089 | 202 | 116 | |
| thereof organic | 550 | 52 | 103 | 71 | 1595 | ||||||
| in % | 5% | 3% | 21% | 1% | 43% | ||||||
| 4 GD Ka | in total | 22,010 | 6173 | 742 | 20,333 | 6371 | 763 | 118,627 | 726 | 251 | |
| thereof organic | 688 | 109 | 205 | 57 | 2190 | ||||||
| in % | 3% | 2% | 28% | 0% | 34% | ||||||
| 5 F MPA | in total | 9155 | 7361 | 1014 | 7773 | 2463 | 4569 | 54,763 | 1400 | 104 | |
| thereof organic | 115 | 69 | 127 | 0 | 762 | ||||||
| in % | 1% | 1% | 13% | 0% | 31% | ||||||
| 6 M-B | in total | 2490 | 313 | 77 | 2200 | 941 | 35 | 19,311 | 21 | 339 | |
| thereof organic | 152 | 22 | 538 | ||||||||
| in % | 6% | 0% | 29% | 0% | 57% | ||||||
| Field Crop | Yield dt/ha Hesse (Year: 2021) |
|---|---|
| Cereals total incl. corn maize and corn-cob-mix | 67.9 |
| Cereals total excluding corn maize and corn-cob-mix | 66.7 |
| Wheat (mean value winter and summer wheat) | 65.95 |
| Rye | 56.3 |
| Barley (mean value winter and summer barley) | 64.5 |
| Oilseed rape (winter) | 35.5 |
| Potatoes | 420.6 |
| Sugar beets | 847.3 |
| Corn maize | 93.3 |
| Silage maize | 547.9 |
| Forage (permanent grassland) | 60 |
| Forage (cultivation on arable land) | 61.8 |
| Clover grass/alfalfa (dry mass) | 60.3 |
| Field beans | 37.9 |
| Field peas | 35.4 |
| Sweet lupines | 33.5 |
| Soybeans | 34 |
| Sunflower seeds | 26.1 |
| Yields per Region and Crop in dt per Hectare (I) | ||||||||
|---|---|---|---|---|---|---|---|---|
| there of | ||||||||
| Region | Cereals Total | Wheat, Spelt, Einkorn | Rye | Triticale | Barley | Oat | Corn Maize/Corn-Cob-Mix | Other Cereals |
| 1 Hesse | 19,100,767 | 9,274,372 | 847,822 | 1,275,605 | 5,628,657 | 447,267 | 1,256,751 | 33,175 |
| 2 GD Da | 5,836,665 | 3,128,484 | 262,921 | 160,918 | 1,487,177 | 118,506 | 649,648 | 12,025 |
| 3 GD Gi | 4,798,879 | 2,157,041 | 205,945 | 373,079 | 1,504,011 | 146,518 | 298,373 | 9250 |
| 4 GD Ka | 8,465,290 | 3,988,847 | 378,955 | 741,542 | 2,637,534 | 182,243 | 308,823 | 11,900 |
| 5 F MPA | 4,555,467 | 2,488,218 | 224,693 | 120,359 | 1,082,762 | 77,815 | 556,721 | 9625 |
| 6 M-B | 1,306,996 | 528,863 | 79,777 | 118,116 | 372,617 | 42,861 | 151,053 | 2075 |
| Yields per Region and Crop in dt per Hectare (II) | ||||||||
| Region | Silage maize | Sugar beets | Potatoes | Winter oilseed rape | Pulses | Vegetables | ||
| 1 Hesse | 21,884,168 | 13,726,924 | 1,852,673 | 1,422,695 | 350,516 | 2,148,383 | ||
| 2 GD Da | 5,827,370 | 7,356,680 | 1,337,646 | 375,596 | 86,335 | 1,886,931 | ||
| 3 GD Gi | 5,084,055 | 1,235,955 | 204,083 | 377,539 | 97,679 | 43,002 | ||
| 4 GD Ka | 10,972,744 | 5,134,289 | 310,944 | 669,560 | 166,528 | 218,737 | ||
| 5 F MPA | 4,564,083 | 6,122,388 | 424,929 | 255,963 | 64,379 | 1,309,843 | ||
| 6 M-B | 1,241,351 | 260,332 | 32,268 | 72,445 | 24,596 | 10,034 | ||
| Current Consumption and Recommended Consumption per Region in kg | ||||||||||||
|---|---|---|---|---|---|---|---|---|---|---|---|---|
| Food Group (in kg) | Current Consumption Region 1 | Consumption Recommended by PHD Region 1 | Current Consumption Region 2 | Consumption Recommended by PHD Region 2 | Current Consumption Region 3 | Consumption Recommended by PHD Region 3 | Current Consumption Region 4 | Consumption Recommended by PHD Region 4 | Current Consumption Region 5 | Consumption Recommended by PHD Region 5 | Current Consumption Region 6 | Consumption Recommended by PHD Region 6 |
| Cereals | 523,745,414 | 458,433,354 | 335,010,125 | 293,233,718 | 87,423,648 | 76,521,751 | 101,311,642 | 88,677,885 | 245,660,896 | 215,026,510 | 20,681,606 | 18,102,570 |
| Pulses | 15,737,543 | 148,200,438 | 10,066,410 | 94,795,383 | 2,626,913 | 24,737,635 | 3,044,220 | 28,667,420 | 7,381,638 | 69,512,880 | 621,443 | 5,852,124 |
| Potatoes | 375,183,013 | 98,800,292 | 239,983,214 | 63,196,922 | 62,625,594 | 16,491,757 | 72,574,205 | 19,111,613 | 175,978,238 | 46,341,920 | 14,815,189 | 3,901,416 |
| Vegetables | 688,674,860 | 592,801,751 | 440,506,102 | 379,181,532 | 114,953,691 | 98,950,540 | 133,215,067 | 114,669,679 | 323,020,457 | 278,051,521 | 27,194,324 | 23,408,496 |
| Fruits | 453,870,726 | 395,201,167 | 290,315,264 | 252,787,688 | 75,760,157 | 65,967,027 | 87,795,305 | 76,446,453 | 212,886,426 | 185,367,681 | 17,922,402 | 15,605,664 |
| Plant-Oil | 148,562,401 | 102,357,102 | 95,026,910 | 65,472,011 | 24,798,054 | 17,085,460 | 28,737,437 | 19,799,631 | 69,682,658 | 48,010,229 | 5,866,417 | 4,041,867 |
| Nuts | 31,475,085 | 98,800,292 | 20,132,820 | 63,196,922 | 5,253,825 | 16,491,757 | 6,088,440 | 19,111,613 | 14,763,275 | 46,341,920 | 1,242,885 | 3,901,416 |
| Sugar | 204,588,053 | 61,256,181 | 130,863,330 | 39,182,092 | 34,149,863 | 10,224,889 | 39,574,860 | 11,849,200 | 95,961,288 | 28,731,991 | 8,078,753 | 2,418,878 |
| Milk, equiv. diary | 2,553,258,895 | 494,001,459 | 1,633,174,358 | 315,984,610 | 426,190,284 | 82,458,783 | 493,894,253 | 95,558,066 | 1,197,596,868 | 231,709,601 | 100,822,831 | 19,507,080 |
| Eggs (pcs.) | 1,498,214,046 | 407,747,236 | 958,322,232 | 260,812,694 | 250,082,070 | 68,061,218 | 289,809,744 | 78,873,324 | 702,731,890 | 191,252,369 | 59,161,326 | 16,101,082 |
| Red meat total | 264,390,714 | 27,664,082 | 169,115,688 | 17,695,138 | 44,132,130 | 4,617,692 | 51,142,896 | 5,351,252 | 124,011,510 | 12,975,738 | 10,440,234 | 1,092,396 |
| White meat | 82,464,723 | 57,304,169 | 52,747,988 | 36,654,215 | 13,765,022 | 9,565,219 | 15,951,713 | 11,084,736 | 38,679,781 | 26,878,314 | 3,256,359 | 2,262,821 |
| Fish | 79,946,716 | 55,219,889 | 51,137,363 | 35,321,019 | 13,344,716 | 9,217,311 | 15,464,638 | 10,681,559 | 37,498,719 | 25,900,690 | 3,156,928 | 2,180,517 |
| Beef | 514,302,889 | 328,970,279 | 85,847,501 | 99,485,110 | 241,231,914 | 20,308,741 | ||||||
| Sheep and goat | 59,173,160 | 37,849,702 | 9,877,191 | 11,446,267 | 27,754,957 | 2,336,624 | ||||||
| Pig | 3,777,010 | 2,415,938 | 630,459 | 730,613 | 1,771,593 | 149,146 | ||||||
| Other meat | 195,145,527 | 124,823,484 | 32,573,715 | 37,748,328 | 91,532,305 | 7,705,887 | ||||||
| Meat total (red and white + industry) | 6,295,017 | 4,026,564 | 1,050,765 | 1,217,688 | 2,952,655 | 248,577 | ||||||
| Necessary ha of Crops for Direct Human Consumption for Self-Sufficiency Degree of 100% (Baseline: Current Consumption) | |||||||
|---|---|---|---|---|---|---|---|
| Region | Cereals Total (Wheat, Spelt, Einkorn, Rye, Barley, Oat, Other Cereals) | Sugar from Sugar Beets 20% Sugar per Beet | Potatoes | Oil from Oilseed Rape 2.3 kg per 1 L Oil | Legumes (95% in Hesse for Livestock) | Vegetables | Sum |
| 1-Hesse | 78,523 | 12,073 | 8920 | 96,252 | 6733 | 24,022 | 226,522 |
| 2-GD Da | 50,226 | 7722 | 5706 | 61,567 | 4306 | 15,366 | 144,893 |
| 3-GD Gi | 13,107 | 2015 | 1489 | 16,066 | 1124 | 4010 | 37,811 |
| 4-GD Ka | 15,189 | 2335 | 1725 | 18,619 | 1302 | 4647 | 43,818 |
| 5-F MPA | 36,831 | 5663 | 4184 | 45,147 | 3158 | 11,268 | 106,250 |
| 6-M-B | 3101 | 477 | 352 | 3801 | 266 | 949 | 8945 |
| Necessary ha of Crops for Direct Human Consumption for Self-Sufficiency Degree of 100% (baseline: Planetary Health Diet) | |||||||
| 1-Hesse | 68,731 | 3615 | 2349 | 66,316 | 63,401 | 20,678 | 225,090 |
| 2-GD Da | 43,963 | 2312 | 1503 | 42,418 | 40,554 | 13,227 | 143,977 |
| 3-GD Gi | 11,473 | 603 | 392 | 11,069 | 10,583 | 3452 | 37,572 |
| 4-GD Ka | 13,295 | 699 | 454 | 12,828 | 12,264 | 4000 | 43,541 |
| 5-F MPA | 32,238 | 1696 | 1102 | 31,105 | 29,738 | 9699 | 105,578 |
| 6-M-B | 2714 | 143 | 93 | 2619 | 2504 | 817 | 8888 |
| Livestock | Herd Factors | Herd Factors (Extensive Husbandry) | Herd Share Producing “Output”/ Stable Place (Slaughter Quota) | Output kg Milk/Animal; Eggs/Animal | Output Slaughter Weight/ Animal in kg | Output (Extensive Husbandry) |
|---|---|---|---|---|---|---|
| Dairy cow | 1.33 | 0.67 | 9358.4 | 5150 kg/milk p.a. | ||
| Cattle | 2.7 | 3 | 0.37 | 230 | ||
| Sheep | 0.5 | 21.4 | ||||
| Goats | 0.5 | 10.8 | ||||
| Fattening pigs | 2 | 98 | 1.5 | |||
| Laying hen | 288 | 180 eggs/hen p.a. | ||||
| Broiler chicken | 10 | 2 | ||||
| Geese | 4.1 | 5.2 | ||||
| Turkeys | 2.9 | 10 | ||||
| Ducks | 4.3 | 2.2 |
| Percentages of Crops for Energy Purposes and Industry (Excl. Starch Production) | |||||||
|---|---|---|---|---|---|---|---|
| Cereals Total | Wheat, Spelt, Einkorn | Silage Maize | Sugar Beets | Potatoes | Winter Oilseed Rape | Pulses | |
| 2.10% | 9.00% | 1.84% | 0.40% | 7.20% | 1.00% | ||
| Hectares Used per Region (1 to 6) for Crops for Energy Purposes and Industry (excl.Starch Production) | |||||||
| Region | Cereals total | Wheat, spelt, Einkorn | Silage maize | Sugar beets | Potatoes | Winter oilseed rape | Pulses |
| 1 Hesse | 6002 | 2979 | 3955 | 303 | 16 | 3128 | 133 |
| 2 GD Da | 1836 | 1005 | 1053 | 163 | 12 | 826 | 33 |
| 3 GD Gi | 1507 | 693 | 919 | 27 | 2 | 830 | 37 |
| 4 GD Ka | 2659 | 1281 | 1983 | 113 | 3 | 1472 | 63 |
| 5 F MPA | 1433 | 799 | 825 | 135 | 4 | 563 | 24 |
| 6 M-B | 410 | 170 | 224 | 6 | 0 | 159 | 9 |

| Available ha for Direct Human Consumption, Regions 1 to 6 | |||||||
|---|---|---|---|---|---|---|---|
| Region | Cereals Total | Sugar Beets | Potatoes | Rape Seeds | Legumes (5%) | Vegetables | Sum |
| 1-Hesse | 256,535 | 16,504 | 4421 | 43,204 | 671 | 7494 | 328,829 |
| 2-GD Da | 79,108 | 8845 | 3192 | 11,406 | 165 | 6582 | 109,298 |
| 3-GD Gi | 63,785 | 1486 | 487 | 11,465 | 187 | 150 | 77,560 |
| 4-GD Ka | 113,643 | 6173 | 742 | 20,333 | 319 | 763 | 141,973 |
| 5-F MPA | 61,305 | 7361 | 1014 | 7773 | 123 | 4569 | 82,145 |
| 6-M-B | 16,355 | 313 | 77 | 2200 | 47 | 35 | 19,027 |
| Self-Sufficiency Degree of Direct Human Consumption per Crop, Regions 1 to 6 (Current Consumption) | |||||||
|---|---|---|---|---|---|---|---|
| Region | Cereals Total | Sugar Beets | Potatoes | Rape Seeds | Legumes (5%) | Vegetables | Sum |
| 1-Hesse | 327% | 137% | 50% | 45% | 10% | 31% | 145% |
| 2-GD Da | 158% | 115% | 56% | 19% | 4% | 43% | 75% |
| 3-GD Gi | 487% | 74% | 33% | 71% | 17% | 3.7% | 205% |
| 4-GD Ka | 748% | 264% | 43% | 109% | 24% | 16% | 324% |
| 5-F MPA | 166% | 130% | 24% | 17% | 4% | 41% | 77% |
| 6-M-B | 527% | 66% | 22% | 58% | 18% | 3.7% | 213% |
| Self-Sufficiency Degree of Direct Human Consumption per Crop, Regions 1 to 6 (PHD) | |||||||
|---|---|---|---|---|---|---|---|
| Region | Cereals Total | Sugar Beets | Potatoes | Rape Seeds | Legumes (5%) | Vegetables | Sum |
| 1-Hesse | 373% | 457% | 188% | 65% | 1.1% | 36% | 146% |
| 2-GD Da | 180% | 383% | 212% | 27% | 0.4% | 50% | 76% |
| 3-GD Gi | 556% | 246% | 124% | 104% | 1.8% | 4.3% | 206% |
| 4-GD Ka | 855% | 883% | 163% | 159% | 2.6% | 19% | 326% |
| 5-F MPA | 190% | 434% | 92% | 25% | 0.4% | 47% | 78% |
| 6-M-B | 603% | 219% | 83% | 84% | 1.9% | 4.3% | 214% |
References
- Crippa, M.; Solazzo, E.; Guizzardi, D.; Monforti-Ferrario, F.; Tubiello, F.N.; Leip, A. Food systems are responsible for a third of global anthropogenic GHG emissions. Nat. Food 2021, 2, 198–209. [Google Scholar] [CrossRef] [PubMed]
- Li, M.; Jia, N.; Lenzen, M.; Malik, A.; Wei, L.; Jin, Y.; Raubenheimer, D. Global food-miles account for nearly 20% of total food-systems emissions. Nat. Food 2022, 3, 445–453. [Google Scholar] [CrossRef]
- Development Initiatives Poverty Research Ltd. Global Nutrition Report: Action on Equity to End Malnutrition; UNICEF Data: Bristol, UK, 2020; ISBN 978-1-9164452-6-0. [Google Scholar]
- Robert Koch-Institut. 2.6 Übergewicht Und Adipositas, Berlin. 2008. Available online: https://www.rki.de/DE/Content/Gesundheitsmonitoring/Studien/Kiggs/Basiserhebung/GPA_Daten/Adipositas.pdf?__blob=publicationFile (accessed on 11 January 2023).
- Chiffoleau, Y.; Dourian, T. Sustainable Food Supply Chains: Is Shortening the Answer? A Literature Review for a Research and Innovation Agenda. Sustainability 2020, 12, 9831. [Google Scholar] [CrossRef]
- Meynard, J.-M.; Jeuffroy, M.-H.; Le Bail, M.; Lefèvre, A.; Magrini, M.-B.; Michon, C. Designing coupled innovations for the sustainability transition of agrifood systems. Agric. Syst. 2017, 157, 330–339. [Google Scholar] [CrossRef]
- Shindelar, R. The Ecological Sustainability of Local Food Systems. Think Global, Eat Local: Exploring Foodways; Rachel Carson Center for Environment and Society: Munich, Germany, 2015; pp. 19–24. [Google Scholar]
- Canfora, I. Is the Short Food Supply Chain an Efficient Solution for Sustainability in Food Market? Agric. Agric. Sci. Procedia 2016, 8, 402–407. [Google Scholar] [CrossRef]
- Kögl, H.; Tietze, J. Regionale Erzeugung, Verarbeitung und Vermarktung von Lebensmitteln: Studie im Auftrag des Bundesministeriums für Landwirtschaft, Ernährung und Verbraucherschutz: Projektträger: Bundesanstalt für Landwirtschaft und Ernährung (FKZ: 05HS023), Projektlaufzeit: 2006–2009, Berichtszeitraum: 1999–2007; Universität Rostock Professur für Landwirtschaftliche Betriebslehre und Management; Universitätsbibliothek: Rostock, Germany, 2010; ISBN 978-3-86009-086-2. [Google Scholar]
- Mastronardi, L.; Marino, D.; Cavallo, A.; Giannelli, A. Exploring the Role of Farmers in Short Food Supply Chains: The Case of Italy. Int. Food Agribus. Manag. Rev. 2015, 18, 109–130. [Google Scholar] [CrossRef]
- Erokhin, V.; Gao, T. Impacts of COVID-19 on Trade and Economic Aspects of Food Security: Evidence from 45 Developing Countries. Int. J. Environ. Res. Public Health 2020, 17, 5775. [Google Scholar] [CrossRef]
- Mardones, F.O.; Rich, K.M.; Boden, L.A.; Moreno-Switt, A.I.; Caipo, M.L.; Zimin-Veselkoff, N.; Alateeqi, A.M.; Baltenweck, I. The COVID-19 Pandemic and Global Food Security. Front. Vet. Sci. 2020, 7, 578508. [Google Scholar] [CrossRef]
- Willett, W.; Rockström, J.; Loken, B.; Springmann, M.; Lang, T.; Vermeulen, S.; Garnett, T.; Tilman, D.; DeClerck, F.; Wood, A.; et al. Food in the Anthropocene: The EAT–Lancet Commission on healthy diets from sustainable food systems. Lancet 2019, 393, 447–492. [Google Scholar] [CrossRef]
- BMEL. Eckpunktepapier: Weg zur Ernährungsstrategie der Bundesregierung. 2022. Available online: https://www.bmel.de/SharedDocs/Downloads/DE/_Ernaehrung/ernaehrungsstrategie-eckpunktepapier.pdf?__blob=publicationFile&v=4 (accessed on 25 February 2023).
- Carolan, M. The Sociology of Food and Agriculture, 3rd ed.; Taylor & Francis Group: London, UK, 2022; ISBN 978-0-367-68002-2. [Google Scholar]
- Hinrichs, C. Embeddedness and local food systems: Notes on two types of direct agricultural market. J. Rural Stud. 2000, 16, 295–303. [Google Scholar] [CrossRef]
- Galli, F.; Brunori, G. Short Food Supply Chains as Drivers of Sustainable Development. Evidence Document; Document developed in the framework of the FP7 project FOODLINKS (GA No. 265287); Laboratorio di studi rurali Sismondi: Pisa, Italy, 2013; ISBN 978-8-890896-01-9. [Google Scholar]
- Pretty, J.N.; Ball, A.S.; Lang, T.; Morison, J. Farm costs and food miles: An assessment of the full cost of the UK weekly food basket. Food Policy 2005, 30, 1–19. [Google Scholar] [CrossRef]
- DeLind, L.B. Are local food and the local food movement taking us where we want to go? Or are we hitching our wagons to the wrong stars? Agric. Hum. Values 2011, 28, 273–283. [Google Scholar] [CrossRef]
- Sonnino, R.; Marsden, T. Beyond the divide: Rethinking relationships between alternative and conventional food networks in Europe. J. Econ. Geogr. 2006, 6, 181–199. [Google Scholar] [CrossRef]
- Ernährungsrat Köln. Konzept zur Steigerung und Einführung von Regionalität und Nachhaltigkeit in Kölner Kitas und Familienzentren; Ernährungsrat Köln: Köln, Germany, 2023; Available online: https://stern-kita.koeln/wp-content/uploads/2023/03/Konzept.pdf (accessed on 24 March 2023).
- La Via Campesina. Food Sovereignity. Available online: https://viacampesina.org/en/food-sovereignty/ (accessed on 17 January 2023).
- Krivonos, E.; Kuhn, L. Trade and dietary diversity in Eastern Europe and Central Asia. Food Policy 2019, 88, 101767. [Google Scholar] [CrossRef]
- McMichael, P. A food regime genealogy. J. Peasant. Stud. 2009, 36, 139–169. [Google Scholar] [CrossRef]
- Pimentel, D.; Hurd, L.E.; Bellotti, A.C.; Forster, M.J.; Oka, I.N.; Sholes, O.D.; Whitman, R.J. Food production and the energy crisis. Science 1973, 182, 443–449. [Google Scholar] [CrossRef]
- Moschitz, H.; Frick, R.; Oehen, B. Von global zu lokal: Stärkung regionaler Versorgungskreisläufe von Städten als Baustein für eine nachhaltige Ernährungspolitik—Drei Fallstudien. In Schwerpunkt: Globalisierung Gestalten; Schneider, M., Fink-Keßler, A., Stodieck, F., Eds.; ABL Bauernblatt Verlags-GmbH: Hamm, Germany, 2018; pp. 185–189. ISBN 978-3-930413-63-8. [Google Scholar]
- Ernährungsrat Köln. Impulse Für Die Kommunale Ernährungswende. 2019. Available online: https://www.ernaehrungsrat-koeln.de/ernaehrungsstrategie/ (accessed on 24 January 2023).
- Schiff, R.; Levkoe, C.Z.; Wilkinson, A. Food Policy Councils: A 20—Year Scoping Review (1999–2019). Front. Sustain. Food Syst. 2022, 6, 868995. [Google Scholar] [CrossRef]
- Weber, C.L.; Matthews, H.S. Food-miles and the relative climate impacts of food choices in the United States. Environ. Sci. Technol. 2008, 42, 3508–3513. [Google Scholar] [CrossRef]
- Clark, M.; Tilman, D. Comparative analysis of environmental impacts of agricultural production systems, agricultural input efficiency, and food choice. Environ. Res. Lett. 2017, 12, 64016. [Google Scholar] [CrossRef]
- Kavallari, A. The Global Agriculture Perspectives System (GAPS). 2016. Available online: https://www.fao.org/3/i6112e/i6112e.pdf (accessed on 21 April 2023).
- Latham, J. The myth of a food crisis. In Rethinking Food and Agriculture: New Ways Forward; Kassam, A., Kassam, L., Eds.; Elsevier Woodhead Publishing: Cambridge, UK, 2021; pp. 93–111. ISBN 978-0-12816-410-5. [Google Scholar]
- Schader, C.; Muller, A.; Scialabba, N.E.-H.; Hecht, J.; Isensee, A.; Erb, K.-H.; Smith, P.; Makkar, H.P.S.; Klocke, P.; Leiber, F.; et al. Impacts of feeding less food-competing feedstuffs to livestock on global food system sustainability. J. R. Soc. Interface 2015, 12, 20150891. [Google Scholar] [CrossRef]
- Hungerkamp, M. 2,40 Euro mehr: Deutsches Putenfleisch für Verbraucher bald Luxus? 2023. Available online: https://www.agrarheute.com/tier/240-euro-mehr-deutsches-putenfleisch-fuer-verbraucher-bald-luxus-604381 (accessed on 22 April 2023).
- Pontius, J.; Uken, M. “Natürlich gibt es kein Recht auf Billigfleisch”: Interview mit Julia Glöckner. 2021. Available online: https://www.zeit.de/wirtschaft/2021-04/julia-kloeckner-lebensmittel-massentierhaltung-tierwohl-label-gruene-eu (accessed on 22 April 2023).
- Garnett, T.; Godde, C.; Muller, A.; Röös, E.; Smith, P.; de Boer, I.J.M. Grazed and Confused? Ruminating on Cattle, Grazing Systems, Methane, Nitrous Oxide, the Soil Carbon Sequestration Question—And What It All Means for Greenhouse Gas Emissions. 2017. Available online: https://www.oxfordmartin.ox.ac.uk/downloads/reports/fcrn_gnc_report.pdf (accessed on 15 February 2023).
- Cassidy, E.S.; West, P.C.; Gerber, J.S.; Foley, J.A. Redefining agricultural yields: From tonnes to people nourished per hectare. Environ. Res. Lett. 2013, 8, 034015. [Google Scholar] [CrossRef]
- Machovina, B.; Feeley, K.J.; Ripple, W.J. Biodiversity conservation: The key is reducing meat consumption. Sci. Total Environ. 2015, 536, 419–431. [Google Scholar] [CrossRef] [PubMed]
- Weis, A. The Ecological Hoofprint: The Global Burden of Industrial Livestock; Zed Books: London, UK, 2013; ISBN 978-1-78032-096-0. [Google Scholar]
- Carolan, M. The Real Cost of Cheap Food, 2nd ed.; Routledge: London, UK, 2018; ISBN 978-1-13808-076-8. [Google Scholar]
- Valin, H.; Sands, R.D.; van der Mensbrugghe, D.; Nelson, G.C.; Ahammad, H.; Blanc, E.; Bodirsky, B.; Fujimori, S.; Hasegawa, T.; Havlik, P.; et al. The future of food demand: Understanding differences in global economic models. Agric. Econ. 2014, 45, 51–67. [Google Scholar] [CrossRef]
- Dawson, T.P.; Perryman, A.H.; Osborne, T.M. Modelling impacts of climate change on global food security. Clim. Chang. 2016, 134, 429–440. [Google Scholar] [CrossRef]
- Desiere, S.; Hung, Y.; Verbeke, W.; D’Haese, M. Assessing current and future meat and fish consumption in Sub-Sahara Africa: Learnings from FAO Food Balance Sheets and LSMS household survey data. Glob. Food Secur. 2018, 16, 116–126. [Google Scholar] [CrossRef]
- FAO. Food Balance Sheets: A Handbook; FAO: Rome, Italy, 2001. [Google Scholar]
- Pretty, J. Agricultural sustainability: Concepts, principles and evidence. Philos. Trans. R. Soc. Lond. B Biol. Sci. 2008, 363, 447–465. [Google Scholar] [CrossRef]
- Ingram, J. A food systems approach to researching food security and its interactions with global environmental change. Food Sec. 2011, 3, 417–431. [Google Scholar] [CrossRef]
- de Shutter, O. Report Submitted by the Special Rapporteur on the Right to Food; General Assembly. 2010. Available online: http://www.srfood.org/images/stories/pdf/officialreports/20110308_a-hrc-16-49_agroecology_en.pdf (accessed on 25 January 2023).
- Flies, E.J.; Brook, B.W.; Blomqvist, L.; Buettel, J.C. Forecasting future global food demand: A systematic review and meta-analysis of model complexity. Environ. Int. 2018, 120, 93–103. [Google Scholar] [CrossRef]
- TheWorldCounts. Number of Planet Earth We Need: To Provide Resources and Absorb Our Waste. Available online: https://www.theworldcounts.com/challenges/planet-earth/state-of-the-planet/overuse-of-resources-on-earth (accessed on 20 April 2023).
- Aronson, E.; Wilson, T.D.; Akert, R.M.; Sommers, S.R. Social Psychology, 9th ed.; revised edition of the authors’ Social psychology, 2013; Pearson: Boston, MA, USA, 2016; ISBN 978-0133936544. [Google Scholar]
- Harman, G. Your Brain on Climate Change: Why the Threat Produces Apathy, Not Action. 2014. Available online: https://www.theguardian.com/sustainable-business/2014/nov/10/brain-climate-change-science-psychology-environment-elections (accessed on 20 April 2023).
- OECD/FAO. OECD-FAO Agricultural Outlook 2021–2030, Paris. 2021. Available online: https://doi.org/10.1787/19428846-en (accessed on 28 April 2023). [CrossRef]
- Hessisches Statistisches Landesamt. 9801 T Ausgewählte Merkmale für Landwirtschaftliche Betriebe in Hessen 2020 Nach Kreisen. Chapter 2. Available online: https://statistik.hessen.de/sites/statistik.hessen.de/files/2022-06/CIV10_1b_20.pdf (accessed on 12 December 2022).
- Hessisches Statistisches Landesamt. CIV10-1b_20_Anhang_Landwirtschaftszählung nach Kreisen Hessen: 6. 9804.2 T Anbau auf dem Ackerland in landwirtschaftlichen Betrieben in Hessen 2020 nach Rechtsformen, ausgewählten so-zialökonomischen ausgewählten Merkmalen und Größenklassen der landwirtschaftlich genutzten Fläche, Betriebstypen und Art der Bewirtschaftung. Tabelle 1–6. Available online: https://statistik.hessen.de/sites/statistik.hessen.de/files/CIV10_2_20.pdf (accessed on 19 January 2023).
- Hessisches Statistisches Landesamt. Anbau, Ertrag und Ernte Ausgewählter Gemüsearten im Freiland in Hessen 2021. 2021. Available online: https://statistik.hessen.de/unsere-zahlen/land-und-forstwirtschaft (accessed on 12 December 2022).
- Hessisches Statistisches Landesamt. Erträge ausgewählter Feldfrüchte in Hessen 2014 bis 2021 (in dt/ha)—1dt—100kg. Available online: https://statistik.hessen.de/unsere-zahlen/land-und-forstwirtschaft (accessed on 19 January 2023).
- Hessisches Statistische Landesamt. Hessische Gemeindestatistik Ausgabe 2022, Wiesbaden. 2022. Available online: https://statistik.hessen.de/publikationen/hessische-gemeindestatistik (accessed on 19 January 2023).
- Bundesministerium für Ernährung und Landwirtschaft. Pro-Kopf-Konsum von Hülsenfrüchten in Deutschland in den Jahren 2008/09 bis 2016/2017² (in Kilogramm). Available online: https://de.statista.com/statistik/daten/studie/175416/umfrage/pro-kopf-verbrauch-von-huelsenfruechten-in-deutschland-seit-1935/ (accessed on 28 March 2023).
- Statista. Pro-Kopf-Konsum von Lebensmitteln in Deutschland in den Jahren 1900 und 2020 (in Kilogramm). Available online: https://de.statista.com/statistik/daten/studie/163514/umfrage/pro-kopf-verbrauch-von-lebensmitteln-in-deutschland/ (accessed on 17 October 2022).
- Bundesanstalt für Landwirtschaft und Ernährung. Pro-Kopf-Konsum von Fleisch in Deutschland nach Art in den Jahren 2019 bis 2021 (in Kilogramm). Available online: https://de.statista.com/statistik/daten/studie/311479/umfrage/pro-kopf-konsum-von-fleisch-in-deutschland-nach-arten/ (accessed on 28 March 2023).
- Bundesministerium für Ernährung und Landwirtschaft. Pro-Kopf-Konsum von Getreide in Deutschland in den Jahren 1950/51 bis 2020/21 (in Kilogramm Mehlwert). Available online: https://de.statista.com/statistik/daten/studie/175412/umfrage/pro-kopf-verbrauch-von-getreideerzeugnissen-mehlwert-in-deutschland-seit-1935/ (accessed on 28 March 2023).
- Bundesanstalt für Landwirtschaft und Ernährung. Pro-Kopf-Konsum von Zucker in Deutschland in den Jahren 1950/51 bis 2020/21 (in Kilogramm Weißzuckerwert). Available online: https://de.statista.com/statistik/daten/studie/175483/umfrage/pro-kopf-verbrauch-von-zucker-in-deutschland/ (accessed on 28 March 2023).
- Deutsche Gesellschaft für Ernährung. DGE Quality Standard for Meals in Schools, 2nd ed.; Deutsche Gesellschaft für Ernährung: Bonn, Germany, 2022. [Google Scholar]
- EAT-Lancet Commission. Healthy Diets from Sustainable Food Systems: Food Planet Health. Available online: https://eatforum.org/content/uploads/2019/07/EAT-Lancet_Commission_Summary_Report.pdf (accessed on 17 October 2022).
- Deutsche Gesellschaft für Ernährung. DGE Quality Standard for Meals in Daycare Centres. 2022. Available online: https://www.fitkid-aktion.de/fileadmin/user_upload/medien/DGE-QST/DGE_Quality_Standard_Meals_Daycare.pdf (accessed on 19 April 2023).
- Statistisches Bundesamt. Statistisches Bundesamt, Fachserie 3, R 3.2.1, Feldfrüchte 2021. 2022. Available online: https://www.destatis.de/DE/Themen/Branchen-Unternehmen/Landwirtschaft-Forstwirtschaft-Fischerei/Feldfruechte-Gruenland/Publikationen/Downloads-Feldfruechte/feldfruechte-jahr-2030321217164.html (accessed on 27 January 2023).
- IV: 01—Schäfer, Moritz (February 2022): Expert interview on dairy farming, Germany. Online. Transcript Notes. 20 February.
- IV: 02—Feist, Christoph (Three discussion rounds in November 2022): Expert interview on ecological agriculture and crop rotation, Germany. Online. Transcript Notes.
- Hessisches Statistisches Landesamt. Landwirtschaftszählung 2020 Landwirtschaftliche Betriebe und Viehbestände: Kennziffer: C IV 10—3/20, Wiesbaden. 2021. Available online: https://statistik.hessen.de/sites/statistik.hessen.de/files/2022-06/CIV10_3_20.pdf (accessed on 12 December 2022).
- Statistik Austria. Lebend- und Schlachtgewichte, Schlachtausbeute, Schlachtungen sowie Fleischanfall. Available online: https://www.ama.at/getattachment/c9170514-b892-46ff-9e27-f2fd74e0d9b9/220_schlachtgew_2005-2016.pdf (accessed on 29 April 2022).
- DLG-Ausschuss für Geflügel. Haltung von Masthühnern: Haltungsansprüche—Fütterung—Tiergesundheit. DLG-Merkblatt 406. 2021. Available online: https://www.dlg.org/de/landwirtschaft/themen/tierhaltung/gefluegel/dlg-merkblatt-406/ (accessed on 13 March 2023).
- Hessischer Verband für Leistungs- und Qualitätsprüfung in der Tierzucht e.V. Jahresbericht 2021. 2022. Available online: https://www.hvl-alsfeld.de/fileadmin/download/MLP/Jahresberichte/HVL_Jahresbericht_2021_Web.pdf (accessed on 24 March 2023).
- Statistisches Bundesamt. Betriebe mit Legehennenhaltung, Erzeugte Eier, Legeleistung: Bundesländer, Jahre, Haltungsformen, Größenklassen der Hennenhaltungsplätze. 2021. Available online: https://www-genesis.destatis.de/genesis/online?sequenz=tabelleErgebnis&selectionname=41323-0004&leerzeilen=false#abreadcrumb (accessed on 13 March 2023).
- Bundesministerium für Ernährung und Landwirtschaft. Rinderhaltung in Deutschland. 2023. Available online: https://www.bmel-statistik.de/landwirtschaft/tierhaltung/rinderhaltung (accessed on 28 March 2023).
- Brüggemann, C.; Lebendvieh-Export. Weniger Rinder aus Deutschland exportiert. 2021. Available online: https://www.topagrar.com/rind/news/weniger-rinder-aus-deutschland-exportiert-12468630.html (accessed on 28 March 2023).
- Hiller, P. Auf die Mischung kommt es an: Eigenmischungen für Geflügel glasklar formuliert. 2023. Available online: https://www.lwk-niedersachsen.de/lwk/news/25369_Auf_die_Mischung_kommt_es_an_Eigenmischungen_fuer_Gefluegel_glasklar_formuliert (accessed on 13 March 2023).
- Bayerische Landesanstalt für Landwirtschaft. LfL Gruber Tabelle zur Milchviehfütterung, 47. Auflage. Available online: https://www.lfl.bayern.de/mam/cms07/publikationen/daten/informationen/gruber_tabelle_fuetterung_milchkuehe_zuchtrinder_schafe_ziegen_lfl-information.pdf (accessed on 23 March 2023).
- Verhoeven, A.; Hoppe, S.; Hünting, K.; Beintmann, S.; Pries, M. Maisilage reiche Fütterung oder Kleegras betonte Fütterung? 2018. Available online: https://www.landwirtschaftskammer.de/riswick/versuche/tierhaltung/fuetterung/mais_klee_fuetterung.htm (accessed on 30 January 2023).
- Bonsels, T. Dem Futtermangel trotzen. 2022. Available online: https://llh.hessen.de/tier/rinder/fuetterung-rinder/dem-futtermangel-trotzen/ (accessed on 30 January 2023).
- Landesbetrieb Landwirtschaft Hessen. Agrarstrukturerhebung: 5.9804.1 T Landwirtschaftliche Betriebe und Anbauflächen der Kulturarten in Hessen 2020 nach Größenklassen der Landwirtschaftlich Genutzten Fläche, Rechtsformen, Sozialökonomischen Betriebstypen und Art der Bewirtschaftung. 2021. Available online: https://llh.hessen.de/unternehmen/agrarstatistik/ergebnisse-der-agrarstrukturerhebung/ (accessed on 27 January 2023).
- VÖL. International Legume Day; Email Correspondence between Treffinger, E. and Kirch, P. from VÖL—Vereinigung Ökologischer Landbau Hessen on 1 February 2022.
- Greenpeace. Greenpeace Nachrichten. 2023. Available online: https://gpn.greenpeace.de/ausgabe/01-23/brennpunkt-landwirtschaft/ (accessed on 11 February 2023).
- Weltagrarbericht. Ein Fünftel des deutschen Ackerlandes dient Produktion von Biogas und Biosprit. Available online: https://www.weltagrarbericht.de/aktuelles/nachrichten/news/de/33208.html (accessed on 27 January 2023).
- Hessische Landesregierung. Hessen.De. Available online: https://hessen.de/ (accessed on 23 January 2023).
- Umwelt Hessen. Landwirtschaft: Ökologischer Landbau. Available online: https://umwelt.hessen.de/landwirtschaft/oekolandbau (accessed on 9 February 2023).
- Hartmann, S.; Dorsch, K. So funktioniert der Luzerneanbau. Available online: https://www.topagrar.com/dl/2/8/0/6/5/5/3/32-37_Luzerne.pdf (accessed on 12 December 2022).
- agrarheute. Luzernesilage: Potential für Geflügel- und Schweinefütterung. Available online: https://www.agrarheute.com/management/finanzen/luzernesilage-potential-fuer-gefluegel-schweinefuetterung-441037 (accessed on 16 March 2023).
- Zukunftsstiftung Landwirtschaft. Global Field. Available online: https://www.2000m2.eu/ (accessed on 9 February 2023).
- Böhm, M. Fruchtfolge im Bio-Ackerbau: Es geht um mehr! Available online: https://www.bio-austria.at/a/bauern/fruchtfolge-im-bio-ackerbau-es-geht-um-mehr/ (accessed on 13 December 2022).
- Schindler, T. Immer wieder Fruchtfolge. Available online: https://bio2030.de/wp-content/uploads/2019/01/DLG0119_64-66.pdf (accessed on 13 December 2022).
- Badgley, C.; Moghtader, J.; Quintero, E.; Zakem, E.; Chappell, M.J.; Avilés-Vázquez, K.; Samulon, A.; Perfecto, I. Organic agriculture and the global food supply. Renew. Agric. Food Syst. 2007, 22, 86–108. [Google Scholar] [CrossRef]
- Aguilera, E.; Díaz-Gaona, C.; García-Laureano, R.; Reyes-Palomo, C.; Guzmán, G.I.; Ortolani, L.; Sánchez-Rodríguez, M.; Rodríguez-Estévez, V. Agroecology for adaptation to climate change and resource depletion in the Mediterranean region. A review. Agric. Syst. 2020, 181, 102809. [Google Scholar] [CrossRef]
- Leippert, F.; Darmaun, M.; Bernoux, M.; Mpheshea, M. The Potential of Agroecology to Build Climate-Resilient Livelihoods and Food Systems; FAO: Rome, Italy, 2020. [Google Scholar] [CrossRef]
- Edmondson, J.L.; Davies, Z.G.; Gaston, K.J.; Leake, J.R. Urban cultivation in allotments maintains soil qualities adversely affected by conventional agriculture. J. Appl. Ecol. 2014, 51, 880–889. [Google Scholar] [CrossRef] [PubMed]
- Sheldrake, R. Setting innovation free in agriculture. In Rethinking Food and Agriculture: New Ways Forward; Kassam, A., Kassam, L., Eds.; Elsevier Woodhead Publishing: Cambridge, UK, 2021; pp. 1–29. ISBN 978-0-12816-410-5. [Google Scholar]
- Vanavichit, A. Riceberry Rice for Well-Being. 2021. Available online: https://www.openaccessgovernment.org/riceberry-rice-for-well-being/119541/ (accessed on 15 February 2023).
- Poore, J.; Nemecek, T. Reducing food’s environmental impacts through producers and consumers. Science 2018, 360, 987–992. [Google Scholar] [CrossRef] [PubMed]
- Thunberg, G. Speaking Notes for a Speech Held in the European Parliament in Strasbourg at an Extraordinary Meeting of the Environment Committee, Open to All Members. 2019. Available online: https://www.europarl.europa.eu/resources/library/media/20190416RES41665/20190416RES41665.pdf (accessed on 10 March 2023).
- European Commission. Key Policy Objectives of the New CAP. 2021. Available online: https://agriculture.ec.europa.eu/common-agricultural-policy/cap-overview/new-cap-2023-27/key-policy-objectives-new-cap_en (accessed on 25 February 2023).
- Zinke, O. Klimahysterie: Das denken Landwirte darüber. 2019. Available online: https://www.agrarheute.com/management/betriebsfuehrung/klimahysterie-denken-landwirte-darueber-554648 (accessed on 9 March 2023).
- Deutsche Gesellschaft für Ernährung. DGE-Studie zu Kosten- und Preisstrukturen in der Schulverpflegung (KuPS): Kosten und Wirtschaftlichkeit der Schulverpflegung im Fokus—Eine Handreichung für Schul- und Sachaufwandsträger. 2019. Available online: https://www.dge.de/fileadmin/Dokumente/DGE/Projekte/BMEL-Schulverpflegung-KuPS-Studie.pdf (accessed on 24 March 2023).
- Nadkarni, M. Der Giftvertrag EU-Mercosur. 2023. Available online: https://www.greenpeace.de/biodiversitaet/waelder/waelder-erde/eu-mercosur-abkommen (accessed on 15 February 2023).
- Mariotti, F.; Gardner, C.D. Dietary Protein and Amino Acids in Vegetarian Diets-A Review. Nutrients 2019, 11, 2661. [Google Scholar] [CrossRef] [PubMed]
- ZDFheute. Agrarexpertin zu Kriegsfolgen “Dramatischer Angebotseinbruch” beim Getreide. Available online: https://www.zdf.de/nachrichten/wirtschaft/agrar-getreide-russland-ukraine-krieg-100.html (accessed on 27 April 2023).
- Statistik Hessen. Zahlen von A bis Z: Land- und Forstwirtschaft in Hessen. Available online: https://statistik.hessen.de/unsere-zahlen/land-und-forstwirtschaft (accessed on 28 March 2023).
- Hessisches Statistisches Landesamt. Landwirtschaftszählung 2020: Landwirtschaftliche Betriebe und Bodennutzung. Kennziffer: C IV 10—2/2020. 2022. Available online: https://www.statistischebibliothek.de/mir/servlets/MCRFileNodeServlet/HEHeft_derivate_00011231/CIV10_2_20_2kA_a.pdf (accessed on 28 December 2022).
- Statistisches Bundesamt. Feldfrüchte und Grünland: Ackerland nach Hauptfruchtgruppen und Fruchtarten. 2022. Available online: https://www.destatis.de/DE/Themen/Branchen-Unternehmen/Landwirtschaft-Forstwirtschaft-Fischerei/Feldfruechte-Gruenland/Tabellen/ackerland-hauptnutzungsarten-kulturarten.html (accessed on 28 December 2022).
- Statistisches Bundesamt. Wachstum und Ernte—Feldfrüchte—Fachserie 3: Reihe 3.2.1—16/2021. 2022. Available online: https://www.destatis.de/DE/Themen/Branchen-Unternehmen/Landwirtschaft-Forstwirtschaft-Fischerei/Feldfruechte-Gruenland/Publikationen/Downloads-Feldfruechte/feldfruechte-jahr-2030321217164.html (accessed on 28 December 2022).
- Bundesministerium für Ernährung und Landwirtschaft. Ackerbau. 2020. Available online: https://www.bmel.de/DE/themen/landwirtschaft/pflanzenbau/ackerbau/ackerbau_node.html (accessed on 28 December 2022).


| Food Group | Current Consumption 1 | Consumption Recommended by PHD 2500 kcal | Consumption Recommended by PHD 2150 kcal |
|---|---|---|---|
| Cereals | 85.4 | 84.7 | 72.8 |
| Legumes | 0.9 | 27.4 | 23.5 |
| Potatoes | 71.7 | 18.3 | 15.7 |
| Vegetables | 98.6 | 109.5 | 94.2 |
| Fruits | 66.5 | 73.0 | 62.8 |
| Plant-oil | 14.5 | 18.9 | 16.3 |
| Nuts | 5.0 | 18.3 | 15.7 |
| Sugar | 33.6 | 11.3 | 9.7 |
| Milk, equiv. diary | 409.6 | 91.3 | 78.5 |
| Eggs (pcs.) | 239.0 | 75.3 | 64.8 |
| Red meat | 42.0 | 5.1 | 4.4 |
| White meat | 13.1 | 10.6 | 9.1 |
| Fish | 14.1 | 10.2 | 8.8 |
Disclaimer/Publisher’s Note: The statements, opinions and data contained in all publications are solely those of the individual author(s) and contributor(s) and not of MDPI and/or the editor(s). MDPI and/or the editor(s) disclaim responsibility for any injury to people or property resulting from any ideas, methods, instructions or products referred to in the content. |
© 2023 by the authors. Licensee MDPI, Basel, Switzerland. This article is an open access article distributed under the terms and conditions of the Creative Commons Attribution (CC BY) license (https://creativecommons.org/licenses/by/4.0/).
Share and Cite
Schön, A.-M.; Böhringer, M. Land Consumption for Current Diets Compared with That for the Planetary Health Diet—How Many People Can Our Land Feed? Sustainability 2023, 15, 8675. https://doi.org/10.3390/su15118675
Schön A-M, Böhringer M. Land Consumption for Current Diets Compared with That for the Planetary Health Diet—How Many People Can Our Land Feed? Sustainability. 2023; 15(11):8675. https://doi.org/10.3390/su15118675
Chicago/Turabian StyleSchön, Anna-Mara, and Marita Böhringer. 2023. "Land Consumption for Current Diets Compared with That for the Planetary Health Diet—How Many People Can Our Land Feed?" Sustainability 15, no. 11: 8675. https://doi.org/10.3390/su15118675
APA StyleSchön, A.-M., & Böhringer, M. (2023). Land Consumption for Current Diets Compared with That for the Planetary Health Diet—How Many People Can Our Land Feed? Sustainability, 15(11), 8675. https://doi.org/10.3390/su15118675