1. Background of the Study
Degradation of the environment and increased energy use have emerged as two of the world’s most pressing issues in recent years. According to IEA, carbon emissions have grown as a consequence of an increase in the usage of fossil fuels. On the one hand, fast economic growth has hurt the environment. In contrast, on the other, it has depleted a substantial quantity of non-RE sources (such as coal, oil, and gas). Consequently, securing energy security and ensuring environmental sustainability has become the world’s top two worries and the most highly disputed problems at all international forums [
1,
2,
3]. The relevance of emerging nations in achieving both of these objectives has grown due to their substantial reliance on non-RE sources [
4]. RE is the energy derived from natural resources such as sunlight, wind, and water which are replenished naturally. RE sources have the potential to provide a clean, sustainable, and cost-effective alternative to traditional energy sources. In addition, RE sources are generally more environmentally friendly and can help reduce carbon emissions. As such, RE is gaining traction as an important factor in combating climate change. The potential of RE is not limited to environmental benefits. RE can be an important source of economic development and job creation. For example, solar energy is becoming increasingly affordable, and its installation can create jobs and stimulate economic growth. Moreover, RE can be an important source of energy security, as it is not dependent on foreign sources. Despite the potential of renewable energy, it is not always easy to access financing for RE projects. This is partly due to the bureaucratic systems in many countries, which can make it difficult to obtain the necessary permits and access the necessary financing. In addition, the lack of access to financing can be a major obstacle to the uptake of RE sources.
China’s rapid economic expansion and massive energy requirements have created environmental problems, notably shifting away from non-RE sources. If we switch to RE sources, we can simultaneously help the planet and meet our growing energy needs. Improved green jobs, green economic development, and quality of life are all outcomes that benefit from SDG 13’s goal of increasing the share of RE in the energy mix [
5]. The sun, water, wind, tides, biomass, biofuels, and geothermal heat are all examples of renewable energy. The openness of China’s trade market, the country’s fast industrialization, and its rapid UR are the key drivers to China’s high energy consumption, placing it among the world’s leading energy consumers. Consumption of energy plays an important role in the growth of a country’s economy, yet both production and consumption of energy result in the formation of externalities that ultimately demoralize the nation’s economic sustainability [
6]. Possible effects of policies encouraging free trade and UR on energy consumption and the pace of sustainable economic growth. Therefore, it is crucial to comprehend the relationship between economic openness and energy use. In addition, energy consumption and business are vital for several reasons, one of which is that an inefficient energy strategy may result in a fall in economic activity and business. Increases in trade policy lead to higher energy use, whereas efforts to reduce energy use have little effect on free trade policies. Trade liberalization measures are intended to increase economic activity, but their effects will be mitigated by energy conservation regulations that lower energy use [
7,
8]. The trade–energy consumption link is unidirectional, suggesting an energy–trade strategy that promotes wasteful consumption. Since an increase in free trade would most likely lead to a rise in economic activity, it is possible that this would influence the energy the nation uses. An increase in consumer demand is one consequence of a growing export market, especially in the manufacturing sector.
The National Action Plan on Climate Change in China has established a challenging objective of decreasing carbon emissions by 18% per unit of GDP by 2023. The implementation of this policy necessitates a substantial alteration in China’s energy consumption trends, prioritizing the utilization of sustainable energy sources such as wind and solar power. China has identified “innovation” as a critical keyword to reduce emissions and promote economic growth. This entails the development of cutting-edge technologies that can effectively address these two objectives. The strategy involves significant investment in the research and development of low-carbon technologies, alongside the adoption of market-based mechanisms such as carbon trading schemes, which incentivize businesses to adopt environmentally friendly practices. In addition, the government intends to enhance public consciousness regarding sustainable living using educational initiatives and incentives for individuals who adopt environmentally-friendly lifestyles. In general, the policies of the Chinese government demonstrate a dedication to attaining sustainability objectives over the long run while simultaneously managing economic development necessities amidst the difficulties posed by climate change. China is leading the way in RE expansion to become a global leader in sustainable energy by investing heavily in solar, hydro, and wind power, focusing on reducing emissions and promoting a green economy. The Chinese government is committed to investing in RE infrastructure, and the country has set ambitious goals for the future. By 2035, China plans to have installed 20 gigawatts of solar energy, 30 gigawatts of wind power, and 20 gigawatts of hydro power. This will help China achieve its climate goals and provide sustainable energy for its citizens. Furthermore, China is the world’s largest energy consumer. So the country’s RE expansion will greatly impact global energy usage. China has also pledged to invest heavily in RE infrastructure, to have 20% of its energy from renewable sources by 2030. This investment has already begun to pay dividends, as the country is now the world’s leading solar and wind energy producer. In addition, the Chinese government is trying to reduce coal consumption. It has pledged to reduce its coal capacity by 800 million tons by the end of 2030. This move towards RE is expected to have a positive impact on China’s economy and the environment. in this process, The Chinese government has announced that it has plans to invest $360 billion in RE projects by 2020 and is aiming to have RE sources account for 15 percent of its energy mix by that time. Additionally, the Chinese government has targeted having RE sources account for 20% of its energy mix by 2030. The focus on RE expansion in the Chinese economy is part of the country’s efforts to reduce its carbon emissions and mitigate the effects of climate change. Intending to reach carbon neutrality by 2060 and peak carbon emissions by 2030, the Chinese government has achieved tremendous progress in its policies to reduce carbon emissions. The government has pledged to cut carbon intensity (i.e., CO2 emissions per dollar of GDP) by more than 65% from 2005 levels by 2030. To achieve this goal, they are, among other things, encouraging the use of renewable energy sources such as wind and solar and gradually retiring coal-fired power facilities. More than 2000 major businesses in sectors as diverse as power generation, steel milling, cement manufacture, and airline travel are included in the government’s emission trading system (ETS). The ETS’s stated goal is to motivate businesses to reduce their emissions of greenhouse gases or to buy permits from other businesses if they cannot do so on their own. The world community has largely applauded China’s efforts to reduce its carbon footprint, seeing them as a significant contribution to the fight against global warming.
The study considered financial deepening (FD hereafter), urbanization (UR, hereafter), and institutional quality (IQ, hereafter) on energy consumption, proxied by three distinct sources of REC, NREC, and FEC in china. The existing literature on the determinant of energy consumption has provided diverse evidence with various macro-fundamentals, including trade openness, FDI, gross capital formation, financial development, economic growth, personal remittance, and others. Regarding the financial system’s contribution to clean energy inclusion instead of conventional energy in the energy mix, the literature posited that Regardless of the financial and economic repercussions, the expansion of the banking sector may impact the popularity of renewable energy. To transition to renewable energy, a large financial commitment is necessary. Starting, sustaining, and eventually paying off these initiatives will come at a larger price [
9]. With a strong financial structure, enhancing the production and consumption of renewable energy is feasible. New RE projects may not materialize despite the desire because of the chaotic funding system. Unfortunately, there is little research on expanding the financial market for renewable energy. Brunnschweiler (2010) was the first to show that increasing finance sector growth enhanced RE generation in a group of non-OECD nations. According to a study by Lin and Qamruzzaman [
10], RE is linked to higher spending in China. Rasoulinezhad and Saboori [
11] (2018) examined the relationships between GDP growth, renewable and non-RE sources, the complexity of the financial sector, and the volume of international trade using data from a panel of 12 Commonwealth countries. Economic growth directly contributes to the development of RE sources.
Additionally, as a determinant of energy consumption, the critical role of energy consumption has been extensively investigated and explored with the mixed linkage between UR and diverse energy sources in the economy [
12,
13,
14]. The effects of UR on rural areas may be seen in the increasing concentration of people in urban centers and the corresponding increases in urban energy consumption. The industrial sector relies on the labor of the city’s residents, which increases the need for electricity. Rising energy consumption has far-reaching consequences for the environment and human health, with the use of fossil fuels to create electricity being particularly damaging. Bad air quality significantly influences city dwellers’ health. It is unsightly because it causes dust to settle on vegetation, buildings, and other surfaces. The bulk of the world’s population seems to reside in urban areas. More than 60% of all carbon dioxide emissions contribute to global warming. At the same time, urban areas use more than half of all energy produced. It has been argued, however, that since 2005, the fastest-growing CO
2 emissions have been in rising economies, and more notably in the Asian Region. This way, there is a mutually beneficial connection between UR and an effective energy policy.
The impact of the study is as follows. First, there is a growing consensus that RE is the way of the future and that sustainable energy sources are essential to mitigating climate change. However, the transition to RE sources is often hindered by the lack of access to financing and difficulty navigating bureaucratic systems. Thus, the present study has explored the potential effects on overall energy consumption, namely REC, NREC, and FEC in china. Several studies have explored the potential of RE and the challenges associated with financing and institutionalizing these energy sources. For example, a study by the International RE Agency (IRENA) found that the cost of financing and difficulty navigating bureaucratic systems are the main barriers to the uptake of RE sources. The study also highlighted the prominence of financial deepening in unlocking the potential of RE. Financial deepening refers to increasing access to financial services and resources. This can be conducted by establishing an institutional framework that enables individuals and businesses to access financing for RE projects. Second, the study highlighted urbanization’s role in driving renewable energy uptake. Greater energy consumption is one of the unintended consequences of urbanization, which can create greater demand for RE sources. Moreover, urbanization can also increase the availability of financial resources, which can help to finance RE projects. Finally, the study highlighted the importance of IQ in driving the uptake of renewable energy. IQ refers to the laws, regulations, and policies that govern the financial system. Good institutional quality can help to ensure that RE projects are financed efficiently and transparently.
This research aims to investigate the symmetric and asymmetric impacts that economic growth, UR, and governance efficiency have had on using renewable, non-renewable, and fossil fuels from the year 1985 to the year 2020. This work used linear and nonlinear ARDL to investigate the explanatory components’ elasticities. In addition, a furious-TY causality test was carried out in symmetric and asymmetric scenarios to establish the relationship’s nature and direction. The results of the Bayer-Hack combined and Maki cointegration tests indicated the existence of a long-run link between the explanatory variables of fossil energy usage, financial depth, UR, and governmental performance, as well as REC and NREC. For REC, financial development, UR, and government efficiency coefficients were positive and statistically significant. Still, for NREC and the usage of fossil fuels, the coefficients were all negative. Fourth, a long-run connection was validated using the upgraded ARDL bound testing procedure, after which it was validated the same way. Fifth, the results of the conventional Wald test revealed an unequal connection between the explanatory variables and the explanatory factors in both the long run and the short run. The asymmetry coefficients for FD, UR, and IQ all revealed positive results in long-term and short-term studies; these outcomes were statistically significant at the 1 percent level. Sixth, the directional causality revealed that feedback theory might explain the causal link between explanatory factors and using RE sources.
The estimation and interpretation of the econometric models take up
Section 3.3.1, followed by a discussion of the research findings in
Section 4. Lastly, a conclusion and some suggestions for public policy are presented in
Section 4.3.
2. Literature Survey
FD is increasing access to financial services and products such as savings, credit, and insurance. This process has been linked to increasing RE consumption, allowing households to invest in more energy-efficient technologies. FD has enabled households to access financing for RE projects, such as solar panels and wind turbines. This has allowed households to invest in more energy-efficient technologies, which can reduce their energy bills and help them save money in the long run. Additionally, FD has enabled households to access loans for RE projects, which can help them cover the upfront costs associated with these projects. Furthermore, FD has enabled households to access grants and subsidies from governments and other organizations, which can help them cover the costs of RE projects. Body Title: Increased Demand for RE Products FD has also increased the demand for RE products, such as solar panels and wind turbines. This is because households can now access financing for these products, making them more affordable and accessible. Additionally, FD has enabled households to access grants and subsidies from governments and other organizations, which can help them cover the costs of RE products. Furthermore, FD has enabled households to access loans for RE projects, which can help them cover the upfront costs associated with these projects. Conclusion: In conclusion, FD has positively affected RE consumption. It has enabled households to access financing for RE projects, which can help them reduce their energy bills and save money in the long run. Additionally, it has increased the demand for RE products, as households can now access financing. FD is thus an important factor in promoting RE consumption.
The connection between the utilization of conventional energy sources and the growth of an economy has been examined in earlier research. Since the government’s investments are insufficient to match the demand for renewable energy, the financial sector aggressively promotes and supports the energy industry’s transformation. If the financial system is operating properly, businesses in sectors connected to RE can obtain a wide scale of low-cost financing. This encourages investment and increases energy consumption [
15]. Due to the robust financial system, businesses may reduce their exposure to liquidity risk, making it easier for them to obtain the cash required to implement energy-saving technology. Additionally, the growth of RE sources is made easier by the rise of the financial sector, which allows money to be diverted from inefficient low-energy businesses due to the expansion of the financial sector. The link between economic development and the usage of RE may also be seen, given long-term investments’ impact on using RE sources and the optimistic expectations about the possibility of profitable growth [
5].
The study [
16] for G-20 nations revealed that FD has beneficial effects in alleviating environmental quality in the long run. For empirical investigation, panel data econometric tools such as panel quantile regression have been executed from 1985–2017. For turkey, Faisal, et al. [
17] investigated the nexus between financial deepening, UR, economic growth, and carbon emission from 1968 to 2013 by employing ARDL bound test and causality test under the symmetry and asymmetry framework. The study unveiled a long-run association between explained and explanatory variables. Moreover, the coefficient of the FD index exposed positive and statistical significance to CO
2, suggesting FD accelerates environmental degradation in the long and short-run horizon. In terms of causal association, unidirectional causality was revealed between the FD index and CO
2. Taking into account the asymmetric framework, [
18] investigated the effects of FD measured by domestic savings and broad money in the economy on REC and NREC in china for the period 1990–2019. According to the asymmetric coefficient of domestic savings and broad money, FD accelerates the development of REC inclusion. At the same time, the demand for NREC has been mitigated, especially in the long run.
For OECD [
19] examined the role of FD and green technological innovation on environmental sustainability for 1991–2016 by executing augmented Mean groups. Regarding the study findings, it is concluded that FD fosters environmental quality by lowering CO
2 emissions in the ecosystem. Other effects of the environment’s FD have been revealed in the study [
20]. The study established the beneficiary role of FD in managing environmental quality through carbon emission. The study further advocated that green technology can be initiated with financial support and credit accessibility. A similar domain of evidence can be found in the study [
21] for Sub-Saharan African Countries from 2000–2018.
Over the last several decades, there has been a steadily growing need for energy. According to Shahbaz, et al. [
22], academics are interested in the association between the growing demand for energy and the associated growth in dangerous environmental pollution levels. Specifically, the researchers want to know whether or not there is a causal relationship between the two. In addition, we cannot minimize energy’s significant impact on our day-to-day lives. On the other hand, the availability of energy has both a direct and an indirect impact on the expansion of any economy. Many individuals are relocating to metropolitan regions because they can access better educational and career possibilities quicker. This is one of the primary reasons why so many people are migrating to cities. Many of these emissions come from the growing need for urban infrastructure [
23,
24].
UR can alter a nation’s demographic structure, occupational pattern, consumption habits, economic divide, and leading sectors. UR influences the propensity of people to use environmentally friendly energy sources in two ways. First, a wider variety of energy sources will be necessary as metropolitan areas continue to grow in population, industries continue to adapt to meet new needs, and the energy consumption habits of consumers continue to vary. In most situations, direct and indirect energy requirements are likely to overlap because anything one company considers a commodity might be a source of raw materials for a different company. The UR process may be broken down into three stages: fast, intermediate, and established. During the first, second, and third phases of UR, varying percentages of the population use non-conventional, environmentally friendly forms of energy. In the case of Chine, Yang, et al. [
25] evaluated the effects of UR on REC. They revealed a contributory role in amplifying energy growth for RE sources.
Evidence from [
26] involving quantile regression analysis, investigated how UR influences renewable and non-RE energy sources. The analysis revealed no statistically significant link between the two types of energy consumption. On the other hand, when looking at non-REC, a positive and statistically significant link was discovered. Salim & Shafiei, 2014 [
27] Looked at the case of the OECD and found that the effects of UR on demand for NREC were significant, while the effects on the demand for REC were minimal. Shahbaz, Abbas Rizvi, et al., 2022 [
28] Analyzed the impacts of fiscal decentralization, inequality, and UR on REC in China by utilizing quarterly data ranging from 1980Q1 to 2018Q4. Their findings were presented in the paper. Researchers have shown that while financial decentralization and UR increase the demand for RECs, inequality negatively correlates with the usage of RECs in China. Ma and Qamruzzaman [
29] have initiated an investigation of the relationships between Regional Economic Competitiveness (REC), UR, trade openness, Gross Domestic Product (GDP), and industrialization in 116 different countries over the years 2000–2014. According to the findings of this study, UR and a greater openness to trade contributed to growth in REC, but industrialization undermined this tendency.
However, research in Bangladesh demonstrates that UR is detrimental to REC and contributes to the proliferation of behaviors that are not REC-compliant [
30,
31]. A disproportionate number of people tend to dwell in rural regions in the early stages of UR when agriculture is favored over other economic activities. There may be an increase in the demand for energy if relatively modest levels of agricultural technology are combined with significantly increased production levels. Despite this, the broad usage of RE has been slow to develop, mostly because of the challenges presented by technical limitations. The pace of urbanization is increasing in China, which has led to an increase in the number of Chinese cities that have proclaimed their intentions to transform into carbon-neutral megalopolises [
32]. Between 1980 and 2014, Mrabet, et al. [
33] examined the affiliation amongst UR and Non-RE use in developed and developing nations. The study indicated that the demand for NREC has increased by 0.72 percentage points.
In contrast, the possibility of UR has increased by one percentage point. Much research has been conducted on UR and energy consumption in recent years. While some studies have demonstrated that UR increases energy consumption, others have found that it may promote the efficient use of public infrastructure, reducing overall use. The unknown is, however, which kind of energy is most susceptible to UR. In light of the increasing emphasis on this problem, particularly as it applies to power production in major cities, the question of whether or not UR may hinder the trend toward using RE has emerged. It is essential to evaluate UR’s effects on renewable and NREC individually to determine how UR affects disaggregated energy consumption and where policymakers should focus their efforts.
Using a panel data analysis, Huang, et al. [
34] examine how globalization, environmental deterioration, and political will have affected the adoption of RE sources in five ASEAN nations. 1980–2019 data stationarity is analyzed with panel data approaches such as Levin, Lin, and Chu (LLC) and Im Pesaran. (IPS). In stationarity testing, it is shown that all variables continue to behave as predicted despite any modifications to the initial conditions. Pedroni’s cointegration studies may uncover more evidence of their close relationship. Pooled Ordinary Least Square, Fully Modified Ordinary Least Square, and Dynamic Ordinary Least Square are different estimation approaches (DOLS). The findings indicate that a rise in UR, commercialization, and environmental deterioration all result in reduced RE use. In the future, a bigger percentage of the population will need to depend on RE due to developments in global commerce, environmental deterioration, and urbanization. However, FDI and professional governance are required for the maximum use of RE. This suggests that both foreign direct investment and good governance contribute to the growth of RE utilization. According to the findings, boosting the use of RE requires both the commercialization of RE and the strengthening of government supervision.
Uzar [
35] implemented a study with a panel data estimate utilized for 1990–2015 by a consortium of 38 nations. It opened the door to the possibility of quantifying the impacts of institutional power, carbon emissions, and economic expansion on the use of renewable energy. The correlation coefficients for intelligence, carbon dioxide emissions, and prosperity indicate a positive association between greater intelligence and carbon dioxide emissions and REC. However, wealth is a barrier to the latter’s usage, following [
36]. Panel ARDL was put into operation. As a direct result, the relationship between institutional vigor, trade surplus, economic expansion, and the creation of RE became clear. Multiple studies have shown that increased exports, institutional effectiveness, and economic growth significantly influence the amount of RE used. The findings of the causal direction analysis revealed that using RE sources has a favorable influence (REC(IQ)) on the quality of the institutions. From 1995 to 2018, research was conducted on India’s REC from the perspective of institutional quality, research and development, globalization, and financial development [
37]. A quantile ARDL method was used to complete this task successfully. The findings indicated that conventional energy consumption increased due to economic growth and globalization, despite technological advances and improved quality of institutions driving its decrease. In the case of Pakistan, [
38] analyzes the influence of institutional quality and the pace of technological innovation on the quantity of energy consumed across several sectors from 1980 to 2019 using a unique dynamic ARDL simulation. According to the report, technological innovation helps safeguard the environment and improve industrial operations’ energy efficiency. Even though public-private partnerships benefit the country’s commercial operations, improving the efficacy of the nation’s institutions may be the key to increasing industrial production. Consumption and spending habits inside households also greatly influenced the residential sector.
Sun, et al. [
39] take a sample of 99 countries from 1995–2016 and apply a spatial econometric model to assess the correlation between institutional quality and energy efficiency. The scientific inquiry into the possibility of a connection between a country’s average IQ and energy efficiency yielded a favorable and statistically significant result. This study’s results suggest that efficient energy use is crucial to environmental progress, highlighting the need for effective intelligence. The summary of literature survey displayed in
Table 1.
4. Estimation and Interpretation
4.1. Descriptive Statistics
The descriptive result of explained and explanatory variables are displayed in
Table 5. The average value of REC is 21.4496 with a standard deviation of 8.006, having maximum and minimum values of 34.08361 and 11.34000. For NREC, the mean, standard deviation, maximum, and minimum value is 80.16289, 2.081805, 82.84348, and 72.96208 m, respectively. Furthermore, the mean value of fossil fuel consumption is 80.93459 with a standard deviation of 5.266225, along with the range of maximum and minimum values of 88.89836 and 71.56748. The FD index’s mean and standard deviation are −0.074408 and 1.579117, with maximum and minimum limits of 2.039428 and −2.881266.
4.2. Unit Root Test
Variables stationary attribute critically impacts time series estimation, especially in selecting the appropriate econometrical tools. The study has implemented several static tests following the framework offered by Dickey and Fuller [
46], Phillips and Perron [
47], Elliott, et al. [
48], and Kwiatkowski, et al. [
49]. The test’s stationary component results are summarized in
Table 6, which may be seen below. After performing the first difference operation, it is evident from a review of the test statistics that all variables reach their final stationary state. Following the second difference, neither variable has revealed itself as stationary. This is desired for correct estimation using more complex econometrical models since it ensures consistent estimates.
In the preceding paragraph, the study demonstrated how the conventional unit root test ignored the structure break issue in the data set. Furthermore, the Narayan and Popp study employed a unit root test with a structural Break in this investigation. Results from the unit root test performed by Narayan and Popp [
50] are shown in
Table 7; it is evident that all variables showed integration after the first difference operation with two structural Break.
4.3. Cointegration Test Results
The following section deals with the investigation of the long-run association between explained, explanatory and control variables, in this regards study implemented the novel combined cointegration test proposed by Bayer and Hanck [
51] and Maki [
52] cointegration test with a structural break The results of the cointegration test are displayed in
Table 8.
4.4. Augmented ARDL Estimation
The results of the cointegration among energy consumption measured by REC, NREC, and FEC, financial deepening, UR, governmental effectiveness, foreign direct investment, and personal remittances are displayed in
Table 9. For cointegration, all the variables have been considered dependent for testing the null hypothesis of no-cointegration. Referring to the test statistics that were derived from Fpass, tDV, and FIDV, all of which are statistically significant at a level of 1 percent, indicating the rejection of the null hypothesis of no-cointegration alternatively, the long-run association has disclosed between REC, NREC, FEC, FD, UR, FDI, GG, and ED. The next phase in the research process examines the explanatory variables’ long-run and short-run elasticity on the explained variable. This occurs after the long-term influence has been identified as the primary focus of the investigation.
Long-run and short-run coefficients under the symmetric framework are displayed in
Table 10, which consists of the Colum of output, particularly column [
1] with REC as the dependent variable, column [
2] with NREC as the dependent variable, and column [
3] for fossil energy consumption, respectively.
For FD as a determent of energy consumption, that is, renewable energy, non-renewable, and fossil energy consumption, the study established a positive connection to REC (a coefficient of 0.1744) in the long-run and short-run (coefficients of 0.0398), which is supported by the study of [
18]. Additionally, the coefficients of FD have disclosed adversely connected to NREC in the long-run (a coefficient of −0.1283) and short-run (coefficients of −0.0291) and fossil energy consumption (a coefficient of −0.0701) in the long-run and (a coefficient of −0.0337) in the short-run. According to study findings, it is presumed that clean energy development and the reduction of conventional energy reliance can be managed with the financial system’s effective and efficient contribution. FD is a process that makes it easier for people to access loans and credit, which can be used to expand clean energy consumption; it helps expand the amount of clean energy being generated and consumed, reducing greenhouse gas emissions. FD also helps create jobs in new industries related to clean energy--such as solar panel installation or wind turbine maintenance--and creates more opportunities for those who need them most: women and minority groups.
The UR coefficient has shown positive and statistically significant impacts on energy consumption in both the long and short runs. These effects have been shown in both developed and developing countries. To be more specific, a positive change of 10 percent in UR in China will result in an acceleration of consumption of RE by 1.745 percent (0.707 percent), consumption of nonRE by 1.305 percent (0.256 percent), and consumption of fossil fuel by 0.962 percent (0.720 percent), respectively. Based on the research results, it is expected that UR will contribute to incorporating clean energy both in the long and short run. However, in the near term, the coefficient of UR has a more significant impact on the use of fossil fuels. Urbanization is assumed to be a crucial step in the transition to clean energy consumption, as it allows for more efficient and sustainable uses of existing infrastructure. Urbanization has been shown to increase the energy produced from land and other resources. This is especially important because it allows for more efficient use of available resources. As urbanization continues, there will be an increased demand for clean energy sources such as solar panels or windmills. These technologies allow for more efficient use of land and other resources, meaning that fewer environmental impacts are associated with their use than traditional forms of energy production such as coal plants or oil refineries.
The impact of institutional quality, which is measured by governmental effectiveness, has exposed a positive and statistically significant tie to REC (a coefficient of 0.0621) while adversely connected to NREC (a coefficient of −0.0765) and fossil fuel consumption (a coefficient of −0.1106). For the short-run, the effects of institutional quality revealed a similar line of connection to REC (a coefficient of 0.0463), NREC (a coefficient of −0.0127), and fossil energy consumption (a coefficient of −0.0291), respectively. In particular, a 10% change in institutional effectiveness will result in REC in the long run (short-run) by 0.321% (0.453%); on the other hand, the demand for NREC will decrease in the long-run (short-run) by 0.765% (0.127%), and fossil energy consumption by 1.109% (0.291%), respectively. Study findings established that governmental effectiveness benefits clean energy progress in the economy instead of conventional energy development. Good governance is critical in ensuring that clean energy expansion is possible. Good governance is how a government or other institution implements policies and programs to achieve its goals. Good governance provides the framework for sustainable development because it helps ensure that environmental protection efforts are implemented effectively and efficiently. It also helps ensure that new technologies are developed and used in practice. In addition to being good for the environment, good governance helps countries grow economically by promoting innovation and creating jobs for their citizens.
Studies established that inflows of FDI have an accelerating role in overall energy consumption; that is, the increase of 10% in the economy will increase REC by 1.794%, NREC by 1.444%, and fossil fuel energy consumption by 0.835% in the long run. While, in coefficients in the short-run disclosed in the case of fossil energy consumption, FDI inflows produce adverse linkage. The positive association between FDI and REC aligns with the literature offered by [
53,
54]. Regarding environmental degradation’s role in energy selection, referring to the coefficient of ED, the study revealed a positive and statistically significant connection to REC. In contrast, a negative statistically significant connection was exposed for NREC and FEC in the long and short run. More precisely, a 1% additional carbon emission will intensify the clean energy consumption in the economy by 0.314% in the long run and by 0.631% in the short run, respectively.
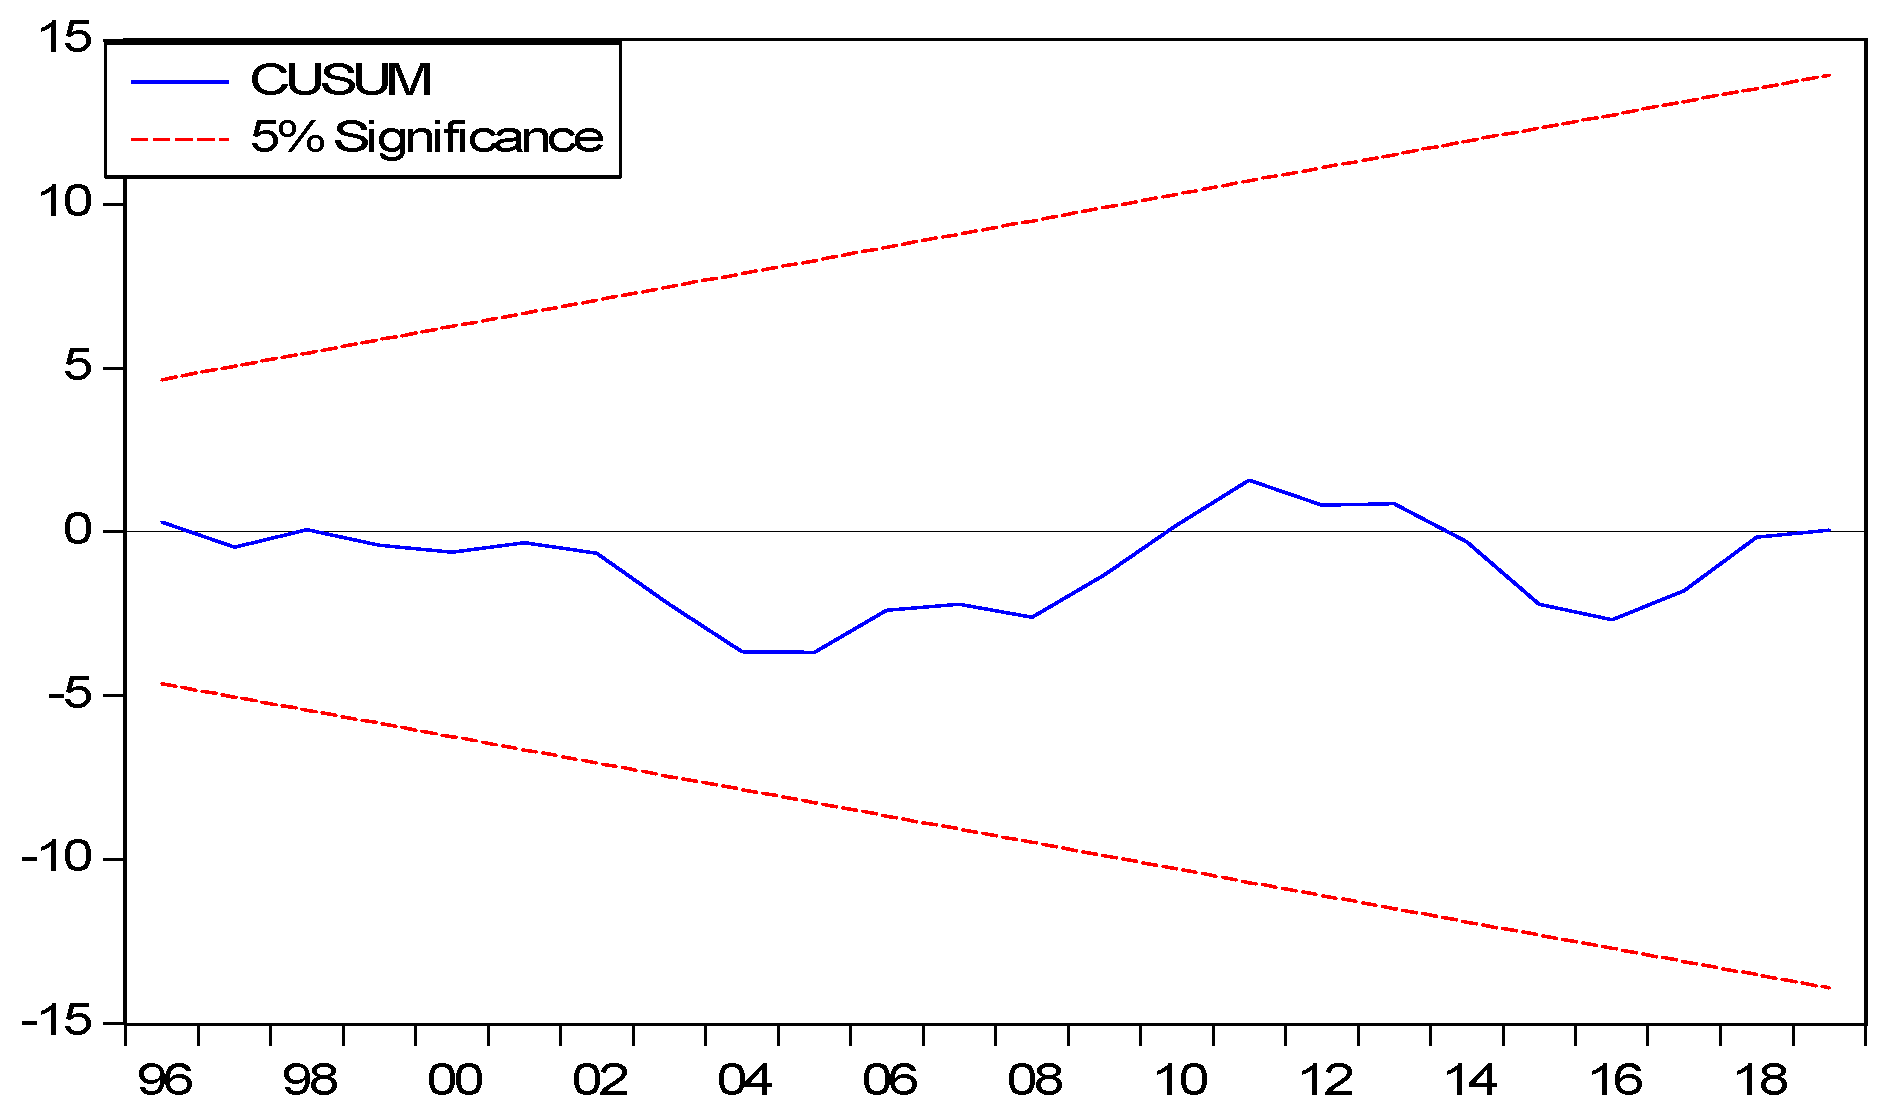
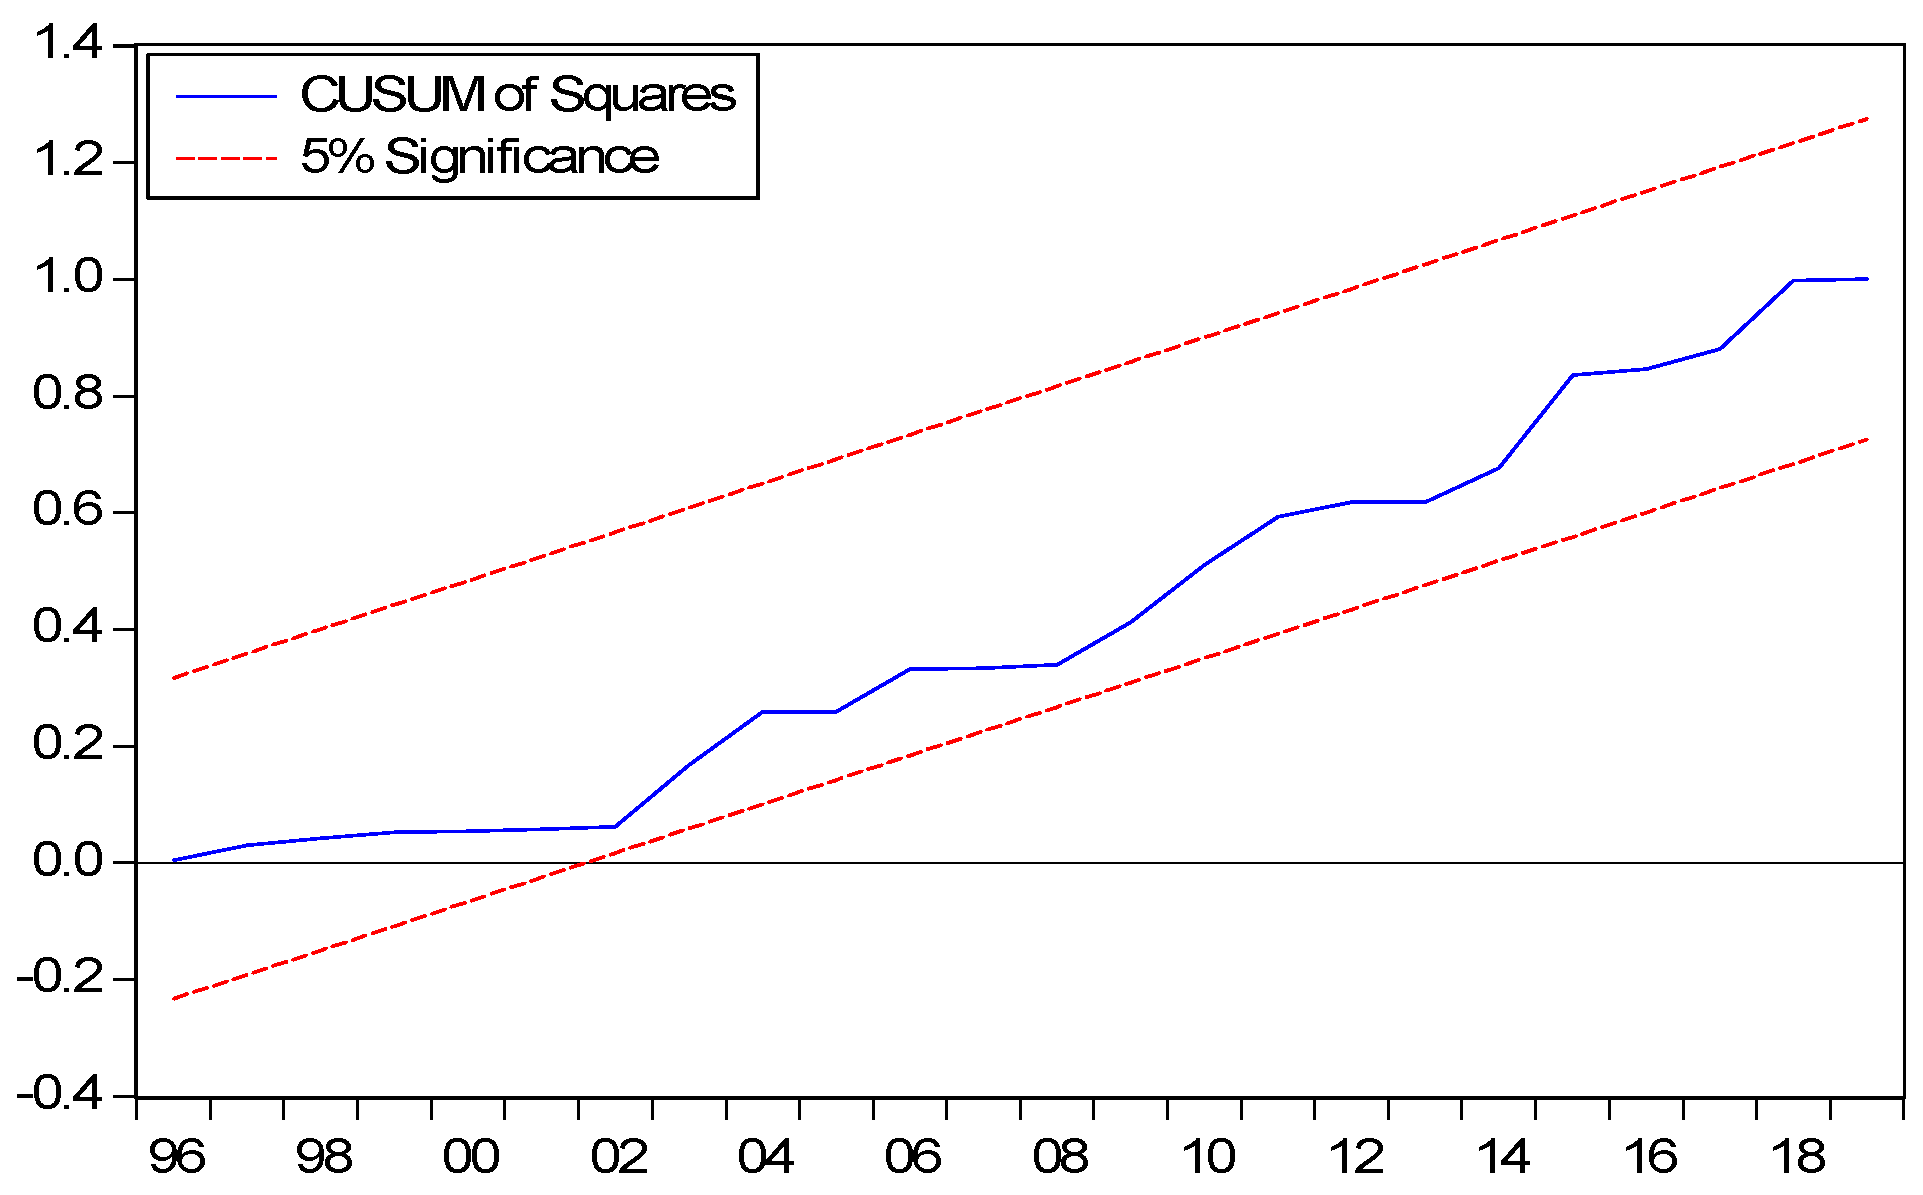
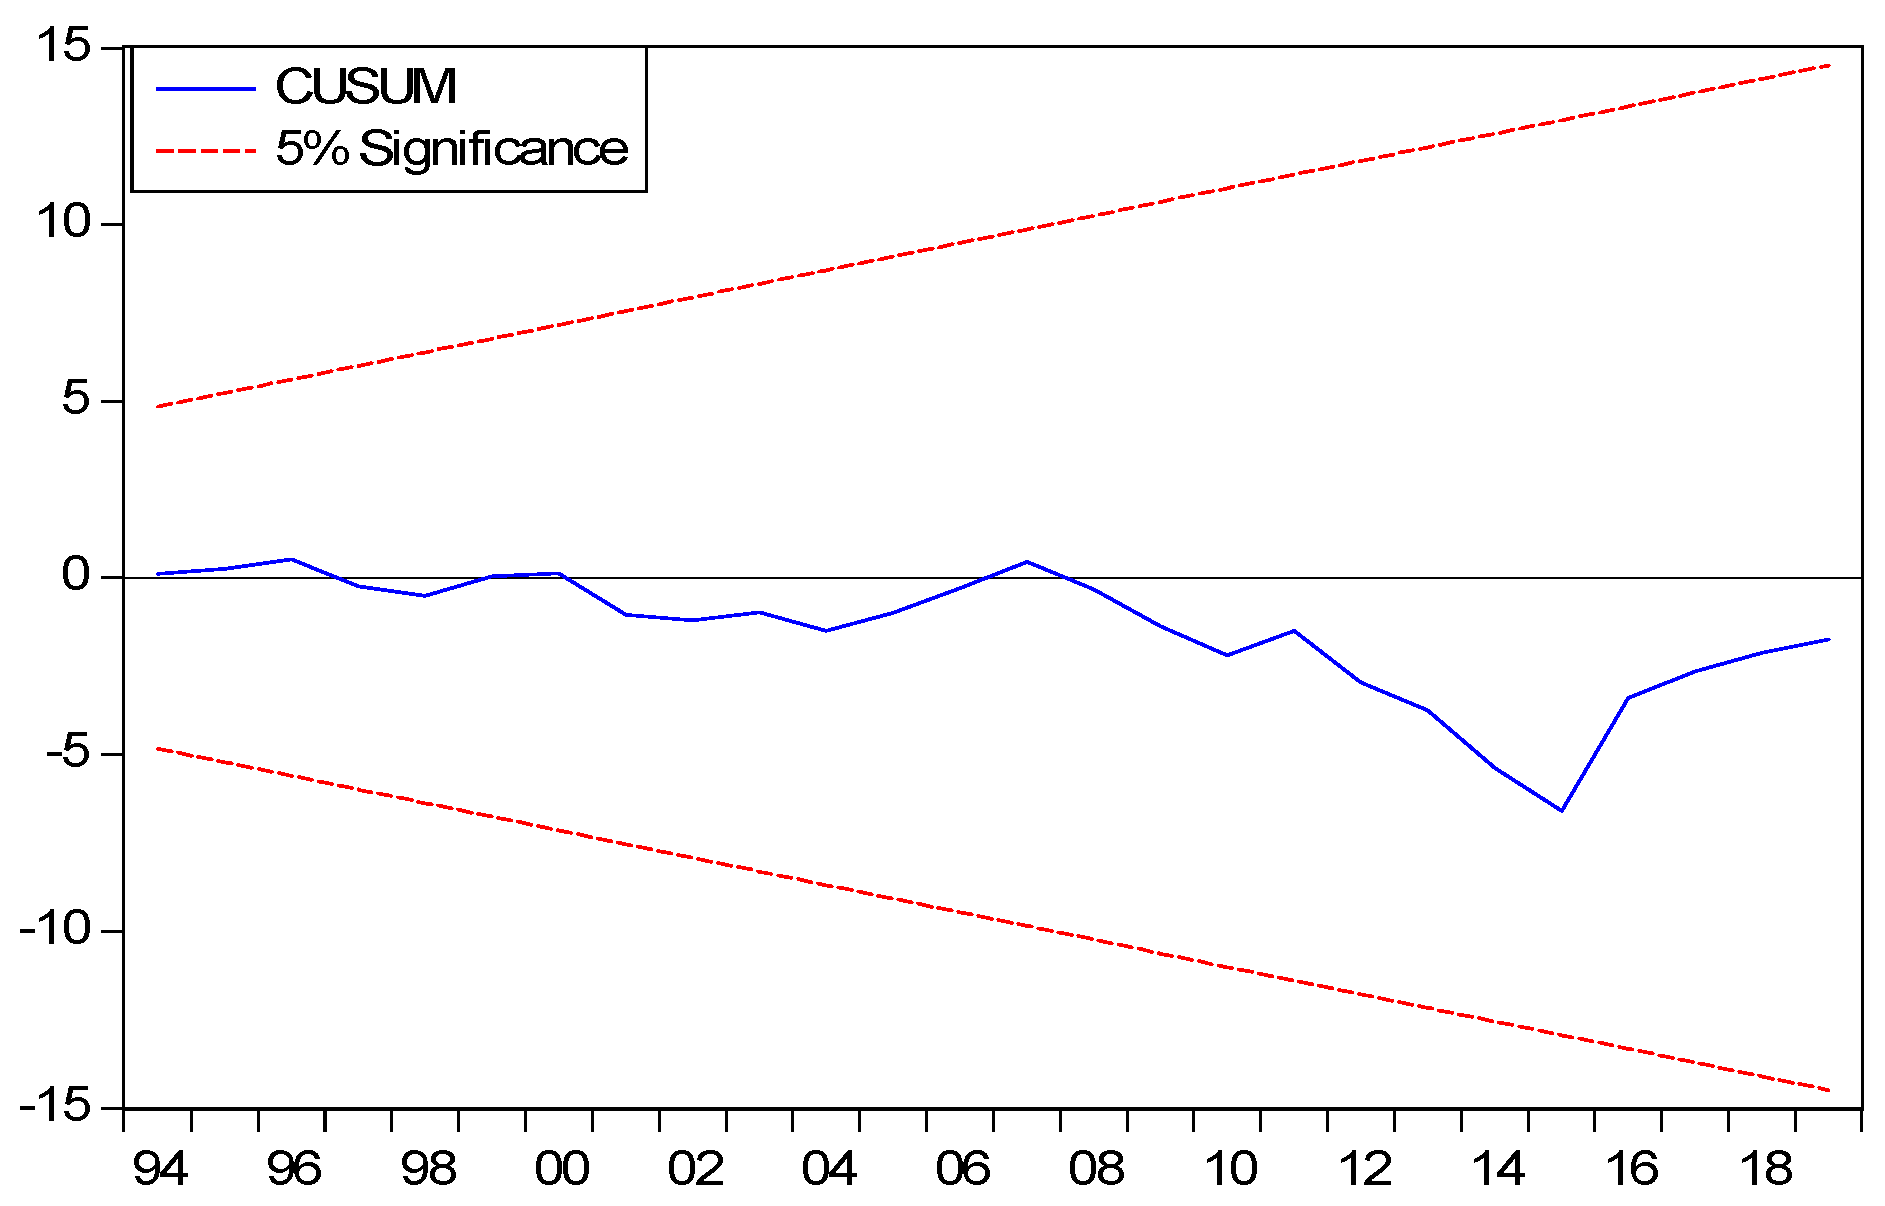
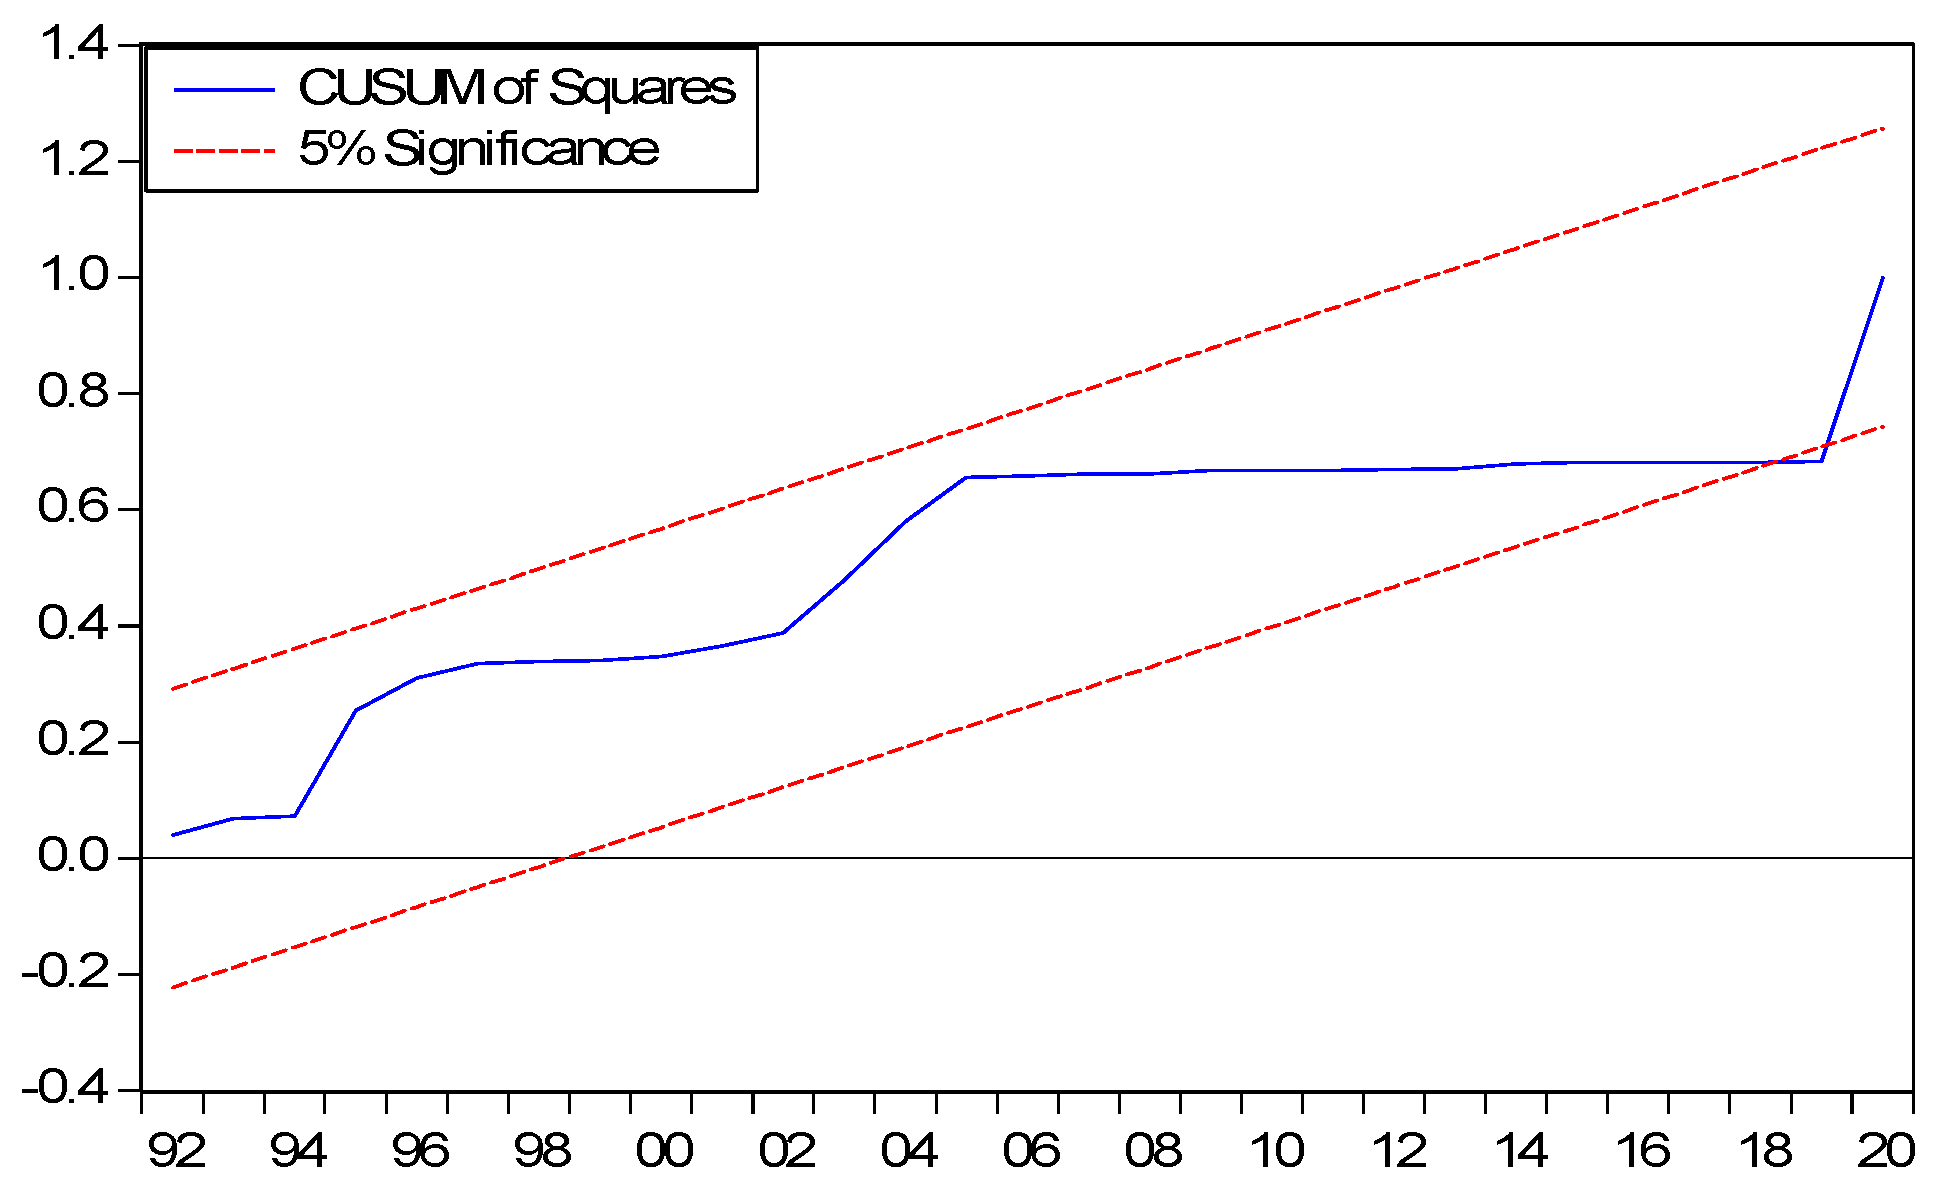
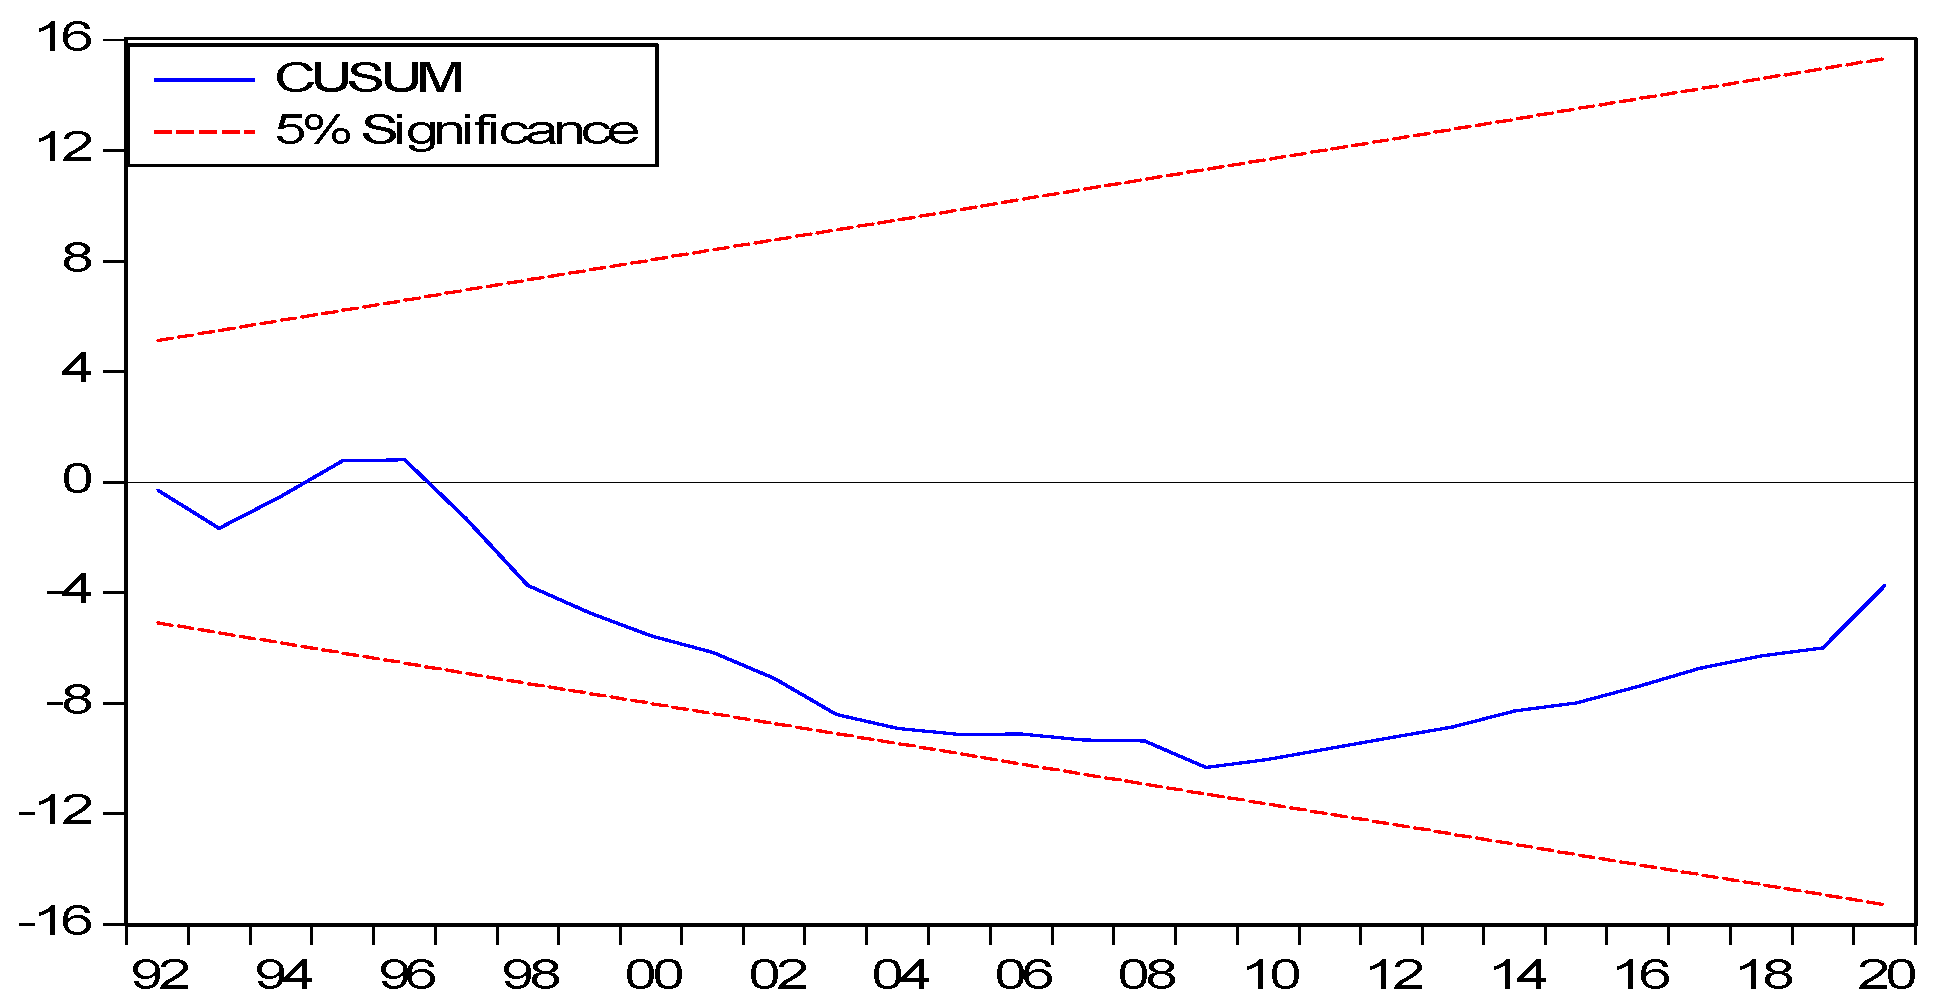
The study has implemented several residual diagnostic tests to assess the empirical model construction and estimation efficiency. Their results are displayed in
Table 11. The test statistics of the residual diagnostic test revealed empirical model is free from autocorrelation absence of heteroskadacity; residuals are normally distributed and have internal consistency. The results of CUSUM and CUSUM of square displayed in
Figure 1,
Figure 2,
Figure 3,
Figure 4,
Figure 5 and
Figure 6.
4.5. Asymmetric ARDL Estimation
The study implemented a standard Wald test with the null of symmetry in the long and short run to address the asymmetric association between examined and explanatory variables. In terms of test statistics derived from the Wald test, that is found statistically significant, which ascertains the rejection of the tested null hypothesis. Alternatively, the long-run and short-run asymmetric association has been established.
In the following section, a study has investigated the asymmetric elasticity of FD [FD+/−), UR [UR+/−], and governmental effectiveness [GG+/−} on REC, NREC, and fossil energy consumption. The results of asymmetric coefficients exhibited in
Table 12, consisting of the long-run coefficients and symmetry test in Panel—A and Panel-B, contain the short-run coefficient and results of short-run symmetry, respectively.
For asymmetric coefficients of FD on energy consumption, in terms of positive (negative) shock elasticity study unveiled positive and statistically significant ties with REC [a coefficient of , while an adverse statistically significant association divulged with non-REC [a coefficient of ] and fossil energy consumption [a coefficient of ]. More precisely, a 10% positive (negative) innovation in FD, in the long run, will result in acceleration (reduction) of REC by 0.961% (1.3801%). On the other hand, the consumption of NREC and fossil energy consumption reacted differently; that is, NREC reduced (increased) by 1.0529% (0.0352%) and fossil fuel consumption by 1.1035% (1.3798%), respectively. In the short run, the asymmetric effects of FD unveiled a similar line of association established in the long run. Essentially, a 1% positive (negative) variation s in FD can amplify (diminish) the REC by 0.0395% (0.0521%), the NREC by −0.0651% (−0.0199%), and the fossil energy consumption by −0.0273% (−0.0467%), respectively. FD, or increasing the amount of money available to households and businesses, is an effective way to increase the use of clean energy in many countries because it allows people who cannot afford clean energy technologies to purchase them, thus making them more accessible and affordable. The result is that more people have access to these technologies, which means they are more likely to use them. FD also helps reduce carbon emissions by encouraging economic growth and creating jobs in areas where this type of investment would not otherwise occur.
The study established the positive (negative) shocks in UR as positive and statistically significant to REC (a coefficient of , NREC (a coefficient of , and fossil energy consumption (a coefficient of , respectively. More precisely, a 10% positive (negative) innovation in UR can cause the intensified (degrade) REC by 0.4524% (1.1085%), non-REC by 0.268% (0.4812%), and fossil energy consumption by 0.643% (0.939%), respectively. For the short-run, the positive and negative shocks in UR unveiled positively connected to REC (a coefficient of ), whereas the impact on NREC and fossil energy consumption exposed statistically insignificant. According to study findings, UR is key to clean energy expansion. It assists in creating new, sustainable, affordable housing, which can be used as an alternative to fossil fuels. Urbanization also increases the amount of land available for solar panels and wind turbines, which will help reduce carbon emissions. Moreover, UR can also help increase the amount of RE produced in a given area by providing more opportunities for people to install solar panels and wind turbines in their homes or businesses. The resulting production of clean energy will decrease dependence on fossil fuels and help reduce global warming effects on our planet
The positive (negative) coefficients of institutional quality, which is measured by governmental effectiveness found positive and statistically significant in the long run (a coefficient of ) and short-run (a coefficient of . Precisely, a 10% positive (negative) shock in institutional quality will result in acceleration (control) of REC in the long run by 0.1832% (0.3132%) and the short run by 0.556% (0.244%), respectively. Positive innovation in IQ in the short run is more significant. At the same time, negative shocks are more apparent in the long run. For non-renewable and fossil fuel energy, a 10% increase (decrease) in institutional quality will result in a reduction (amplification) of energy demand by 1.494% (0.244%) and 0.411% (0.965%), respectively. The asymmetric coefficients have been exposed as statistically insignificant in the short run. Institutional quality and clean energy consumption are two of the most important factors in determining the success of a clean energy strategy. Institutional quality indicates how well-developed a country’s infrastructure is, which can help it be more efficient and economically viable. For example, suppose a country has a strong educational system. In that case, more people will be. Clean energy consumption is another factor that affects institutional quality because it suggests how much effort countries put into researching and developing new technologies for sustainable development. Suppose a country has high levels of clean energy consumption. In that case, they will likely be able to invest more money into research projects related to this field than countries with low levels of clean energy consumption.
The study has implemented several residual diagnostic tests to assess the empirical model construction and estimation efficiency. Their results are displayed in
Table 13. The test statistics of the residual diagnostic test revealed empirical model is free from autocorrelation absence of heteroskadacity; residuals are normally distributed and have internal consistency.
4.6. Furious TY Casualty Test: With the Symmetric and Asymmetric Framework
The results of directional causality with a symmetric framework are displayed in
Table 14. Referring to the test statistics, bidirectional causality runs between REC and FD [REC←→FD]; Urbanization and REC [UR←→REC], and institutional quality and REC [IQ←→REC], urbanization and NREC [UR←→NREC], institutional quality and NREC [IQ←→NREC], and FDI and fossil energy consumption [FDI←→FEC] respectively. Furthermore, several unidirectional causalities have been exposed, such as [REC→FDI], [ED→NREC], [FDI→NREC], [FEC→IQ], and [FEC→ED] respectively.
The results asymmetric casualty test are displayed in
Table 15, and several causal associations have been documented. In particular, it is explored that a unidirectional association from asymmetric FD, urbanization, and institutional quality shocks is unidirectional to REC, NREC, and FEC.
4.7. Robustness Assessment
Next, extended the empirical investigation in the motivation of long-run coefficient robustness test by employing the dynamic OLS, Fully-modified OLS, and CCR regression. The robustness estimation results are displayed in
Table 16. According to the coefficients, it is apparent that the derived coefficients have supported the long-run coefficients of explanatory variables on explained variables.
5. Discussion
The impact of FD on REC exposed positively associated. In contrast, the adverse linkage was found for NREC and fossil energy consumption both in the long run and short run, according to linear ARDL estimation. Regarding asymmetric assessment, the positive and negative shocks of FD, i.e., FD+/−, have divulged positive and statistically significant to REC, whereas negative statistically significant to NREC and fossil energy consumption both in the long-run and short-run. Our findings are supported by the evidence offered in the study by [
2,
7,
10,
18,
55,
56,
57]. Based on our findings, financial growth might facilitate the shift in focus from conventional to RE sources [
58]. State that the direct impact, wealth, and business effect are the three pathways by which a country’s level of financial development affects the prevalence of RE usage. The financial sector supports green investment in energy-intensive enterprises and renewable technologies, which provides funding and promotes such investments. Growth in REC and reduction in nonRE consumption among the EU’s founding nations are strongly correlated with financial progress [
59].
As a result of the expanded financial depth of the economy, an ever-increasing number of individuals now have access to banking and other financial services. The availability of easily accessible investment loans would encourage investors to start new enterprises, creating wealth and boosting the country’s total economic activity. The average income of a nation’s population and that people’s quality of life improves as that country’s economy gains off the ground. Consequently, customers are more likely to use luxuries such as automobiles, heating and cooling systems, microwaves, refrigerators, light-emitting diodes (LEDs), mobile phones, washing machines, etc. Consequently, there is an increase in the amount of energy used by the economy as a direct result of the effects on business, wealth, and customers. Financial diversification has two opposing effects: on the one hand, it fosters economic expansion; on the other, it supports the expansion of RE projects and the usage of these projects. In addition, encouraging the dissemination of resources and finances to individuals and organizations engaged in research and development activities within the clean energy industry encourages the generation of RE and its use. The study established that UR has a positive and statistically significant linkage to energy consumption in the economy regardless of the energy sources.
Moreover, regarding coefficients, the demand for clean energy consumption has significantly affected non-renewable and fossil fuel consumption in the long run. Our study findings are supported by the existing literature, such as [
25,
28]. However, our findings dispute the findings offered by [
27]. Study finding has advocated that the inclusion and development of clean energy from renewable sources in the aggregated economic activities in China can foster with the assistance of planned urban development. Institutional quality proxied by governmental effectiveness suggested a potential contributory variable for REC and placed an inhibiting role for conventional energy consumption.
Furthermore, the results of asymmetric coefficients that are positive and negative shocks in IQ established positive and statistically significant linkage to REC in the long and short run. At the same time, the asymmetric elasticity of IQ has disclosed negative and statistically significant to NREC and fossil fuel consumption in the long run. All the different models exhibit statistically significant and generally positive developments in governance quality. The presence of a positive sign shows that the amount of RE being used increases in tandem with the improvement in the quality of governance. To solve the issue of an energy shortage, the government requires power plants to use RE sources such as solar, wind, and hydropower. This is carried out to close the energy gap. In this context, our findings are consistent with those of Bellakhal et al., who argue that a nation with strong governance should support developmental initiatives to guarantee energy supply and reduce the gap between demand and supply. In this context, our findings are consistent with those of [
34,
60]. Good governance is a key factor in the success of clean energy expansion. It ensures that the market can function efficiently and that there are no barriers to entry, making it easier for new players to enter the market and compete with existing ones. Good governance also helps create an environment where companies can be accountable for their actions. This means that consumers can have confidence in their products or services, knowing they will be safe from harmful side effects. Good governance also helps companies avoid environmental problems and lower costs. For example, if a company is not following the proper procedures for handling waste materials, then it may end up contaminating the environment with harmful chemicals or other toxins [
10,
55,
61].
6. Conclusions and Policy Suggestions
The use of energy, the degradation of the environment, and the crisis brought on by climate change have been recognized as the three most pressing issues facing our world at the present moment by the global economy. At the same time, the government is providing funding for several initiatives that are working toward reducing carbon emissions and increasing the efficiency with which energy is used. Consumers have the potential to minimize the amount of money they spend on their monthly energy bills and their negative impact on the ecosystem in their immediate environment if they make purchases of goods that have a lower total energy consumption. The spread of globalization and industrialization are likely responsible for the bulk of the increase in energy consumption that has been seen. Because a rise in economic activity often leads to increased carbon dioxide emissions, deciding whether to reduce energy use or promote economic development is challenging. The growing energy demand is one of the most important contributors to the increase in the emissions of greenhouse gases. Using no sources damages the environment’s overall quality around one’s location because it generates carbon dioxide (CO2). Consequently, the authorities have devoted substantial attention and consideration to many alternative kinds of clean energy. Consequently, the major focus of the most recent research has been on the many ways in which energy interacts with the environment in which it exists.
The key findings from the study are as follows. First, the stationary test ensures the variables’ order of integration. After the first difference, all the variables become stationary, essential for implementing robust econometric tools. Second, the Bayer-Hack combined and Maki cointegration test established a long-run association between explained variables: REC, NREC, fossil energy consumption, FD, UR, and governmental effectiveness. Forth, the augmented ARDL bound testing approach confirmed the existence of long-run association; moreover, the coefficients of FD, UR, and governmental effectiveness exposed positive and statistically significant to REC. In contrast, FD and governmental effectiveness had an inhibiting effect on NREC and fossil energy consumption. Fifth, the standard Wald test revealed an asymmetric association between explained and explanatory variables in the long and short run. Moreover, the asymmetric coefficients of FD, UR, and IQ were positive and statistically significant at a 1% level in the long and short run. Sixth, the directional causality revealed feedback hypothesis holds in explaining the causal association between explanatory variables and REC.
On a policy note, important policy suggestions for China are included in the study. First, the government should put its money towards RE and cutting-edge technology. To enhance environmental quality and encourage business use of greener, more energy-efficient technology, authorities should modify current RE legislation. China’s efforts to maximize its green growth and meet its climate change goals may benefit from its new energy and finance laws. China’s energy industry may be able to avoid a financial crunch if more people switch to RE sources. China has to maintain stable and long-lasting policies for FD if it wants to increase the usage of renewable energy. Macroeconomic stability, which benefits green growth and environmental quality, is essential to the long-term expansion of the financial industry. China might incentivize using renewable and non-RE by financial institutions by providing cheaper credits for energy-efficient equipment. As a result, China may improve its output, development, and ecological standing.
Second, the institutional, technical, and economic issues identified as limiting the broad implementation of RE technologies must be addressed by creating a strong, top-notch institutional framework that might help mitigate these problems’ effects. Therefore, Chine’s government organizations should use opportunities to utilize RE and aid businesses that produce RE. Institutions can also create facilities for RE and work with the sector to advance research, development, and techniques to meet technological goals, carry out R&D alongside pertinent companies to advance and commercialize technologies, support renewable technology and its uptake by potential consumers, and provide technical facilities and guidance to support.
In the concluding note, the literature survey has emphasized the potential of RE and the challenges associated with financing and institutionalizing these energy sources. The transition to RE requires a concerted effort to make financing more accessible and ensure that institutional quality is up to supporting RE projects. One way to make financing more accessible is through innovative financing mechanisms, such as green bonds and crowdfunding. Green bonds are bonds issued by companies or governments to finance projects related to renewable energy. They provide an additional source of financing that can be used to finance RE projects. Similarly, crowdfunding can be used to finance RE projects. Crowdfunding allows individuals to invest in projects they believe in and can provide an additional source of financing for RE projects. In addition, governments can play an important role in facilitating the transition to RE sources. Governments can incentivize businesses to invest in RE projects, such as subsidies or tax breaks. Governments can also provide support to RE projects through PPP. These partnerships can help to reduce the cost of financing and make RE projects more attractive to investors. Finally, governments can also play an important role in improving institutional quality. This can be comnducted by introducing regulations and laws that ensure transparency and accountability in financing RE projects. Governments can also provide technical assistance to businesses to help them navigate the bureaucratic systems and ensure that projects are implemented efficiently and on time.


