
Risk Assessment of Innovation Prototype for the Example Hydraulic Cylinder


 ,
,  , ,
, ,  , ,
, ,  and
and
Abstract
1. Introduction
2. Review of the Literature
2.1. Overview of Risk Assessment Methods
- Strategic management;
- Statistical;
- Operational research;
- Financial.
2.2. Technical Innovation Prototype Risk Assessment—Theoretical Foundations
2.3. Theoretical Assumptions—SWOT/TOWS Analysis
3. Risk Assessment Procedure
3.1. Research Assumptions
- CG.1.—The scale of the innovation prototype that determines the accessibility of the particular solution on the market. It was assumed that prototypes on the scale of the world will be less risky than those made within the company due to the economic viability of future innovation;
- CG.2.—The period of technology application in the world is the time that has elapsed since the first emergence of the technology used in the prototype. It was assumed that a project is riskier when the related technology is used worldwide for less than one year. This results from the assumption that it is still not finally verified/tested in terms of the chances for technical success;
- CG.3.—The period of project implementation that is directly related to the assessment of the prototype costs. The longer the completion time, the higher the costs of such a project, and at the same time, the higher the risk related to the life span of the particular solution on the market. Therefore, it was assumed that the risk is higher when the project implementation period is longer.
- Low (“State of SO domination”);
- Medium (“State of WO domination”);
- High (“State of ST domination”);
- Very high (“State of WT domination”).
- “State of SO domination” (strengths–opportunities”)—the aggressive strategy, otherwise called maxi–maxi, will correspond to low risk due to the domination of prototype strengths and opportunities. This is the most favorable situation in which attempts should be made to finalize the production of the prototype;
- “State of WO domination” (weaknesses–opportunities”)—the competitive strategy, otherwise called mini–maxi, means the advantage of opportunities over threats with the domination of project weaknesses. However, the prototype implementation proceeds in a favorable environment, which slightly minimizes the risk and allows us to call it medium;
- “State of ST domination” (strengths–hazards)—the conservative strategy defined as maxi–mini corresponds to high risk. Despite the strong internal potential mostly related to the project concept, there is a large number of external threats that potentially place the project in a very high-risk area. In this respect, attempts should be made to maximize the use of own strengths and, with their help, minimize the external threats;
- “State of WT domination” (weaknesses–threats)—the defensive strategy, defined as mini–mini, corresponds to very high risk. This is a situation in which the project has a low design potential and is additionally characterized by a great number of threats usually related to the economic viability of the project. This most likely results from a low scale of innovation of the prototype being evaluated; probably in the future, such an innovation would be of high importance only for the implementing company and not the entire economy. Action in an adverse environment and the external threats are strengthened by the internal weaknesses of the project, contributing to the fact that the performance of such a project should be deeply considered in the context of changes of the design, operating assumptions, etc.
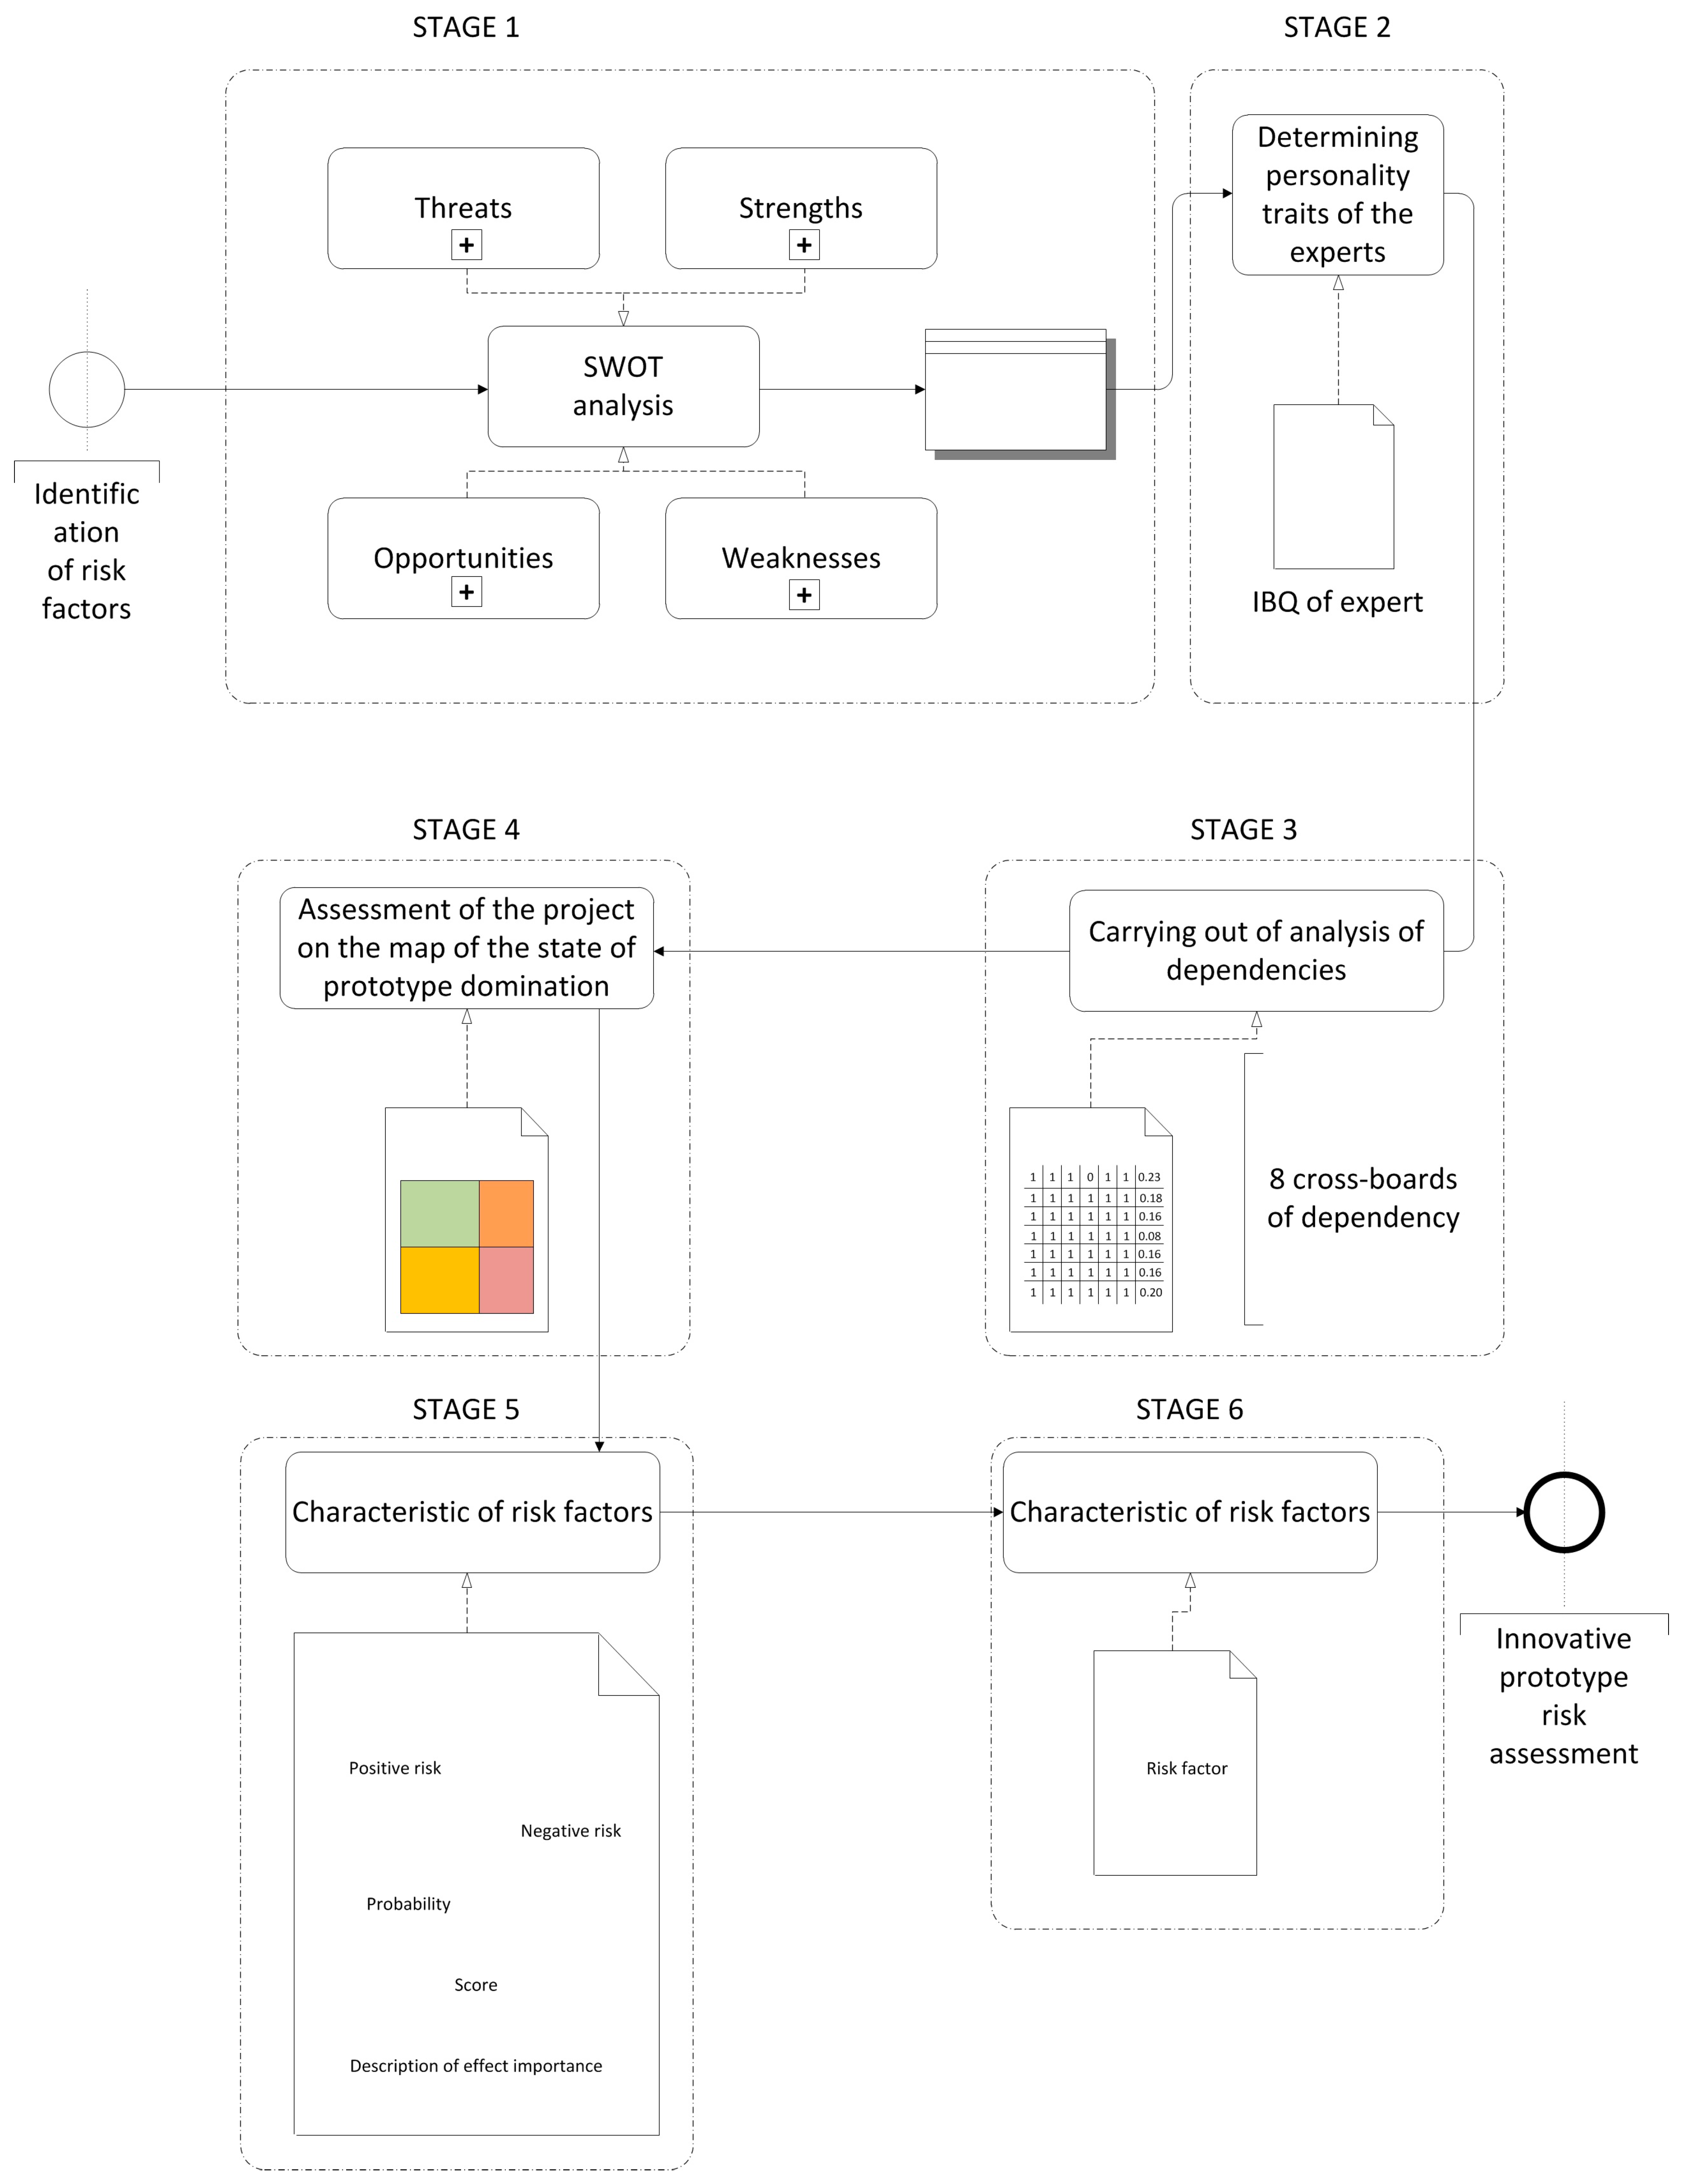
3.2. The Proposed Model
- Way of placing decision makers’ control;
- Motivation to act;
- Need for stimulation.
- Will the identified strengths allow taking advantage of the upcoming opportunities?
- Will the identified strengths allow the threats to be overcome?
- Will the identified weaknesses prevent taking advantage of the upcoming opportunities?
- Will the identified weaknesses strengthen the impact of the threats?
- Will the opportunities enhance the strengths?
- Will the threats weaken the strengths?
- Will the opportunities allow the weaknesses to be overcome?
- Will the threats enhance the weaknesses?
4. Innovative Hydraulic Cylinder Prototype Risk Assessment
4.1. Research Object
4.2. Descriptive Characteristics of the Prototype
- Mass effectiveness—reduced cylinder weight: The structure is made of lightweight materials (light-weighting): the hydraulic cylinder made of composite material is characterized by low mass, better resistance to atmospheric conditions and the effect of the electromagnetic field, with maintained required working parameters. As compared to the existing, traditional solutions, the application of the composite material allows for a 65% reduction in the cylinder weight, being of particular importance for the aviation, car, mobile machinery and construction industries. The base and head made from plastic allow for a further reduction in the actuator’s mass. Simultaneously, the solution combines some elements of material engineering as well as mechanical engineering (in particular design and operation of machines with hydrostatic drive);
- Wide application in the following sectors—aviation, automotive, construction and maritime. On the other hand, high-pressure hydraulic system manufacturers are defined as the target group being the direct recipient of the technology. The analysis of the markets of actuators, high-pressure hydraulic devices as well as composite materials confirmed a good economic situation as well as an upward trend in these markets;
- Higher resistance to atmospheric factors with maintained desired working parameters—the making of a liner by rotary spraying or dipping technology allows a liner to be obtained from thermally and chemically hardened materials (also with fillers) with fixed thickness and surface quality. The elimination of the steel/aluminum liner makes it possible to minimize the differences in rigidity and thermal expansion coefficients between the element’s layers (particularly critical at cyclical loads and temperature changes);
- Higher resistance to the effect of electromagnetic fields is obtained by eliminating or minimizing the presence of ferromagnetic materials;
- The possibility to operate in increased temperatures (50–80 °C) is obtained by the selection of composite materials characterized by a high glass transition temperature. This allows the application of these materials in operation conditions in temperatures up to 80 °C. Such temperature values of the working liquid are more and more commonly found in machines and devices with a hydrostatic drive. This particularly applies to machinery working in underground conditions (e.g., LGOM mines);
- The possibility to obtain high working pressures at high efficiency—through the application of state-of-the-art composite materials, resistance to the effect of temperature and a liner made by the rotational spraying or dipping method allows high working pressures to be obtained (more than 20 MPa) with maintained internal and external tightness of the cylinder (volumetric efficiency) and not increased hydraulic losses on flow and friction in the cylinder (hydraulic-mechanical efficiency).
- Level of implementation readiness TRL—The TRL level (Technology Readiness Level) is used to determine the technological readiness of the particular solution on a nine-degree scale. Technological readiness is nothing else but the stage of development of a project from the broadly understood technology industry. The cylinder prototype was tested in an environment close to the natural one. Everything indicates that the end product can be created and will perform its tasks. Initial actions were conducted to confirm project feasibility, and, consequently, at the present moment, the implementation readiness level is 6;
- Failure to achieve the assumed design and operating conditions, including a reduction in mass, at the same time ensuring the cylinder’s working parameters and bad selection of composite/nanocomposite materials;
- Accessibility of competitive solutions—cylinders made of composite materials are already available on the market (Parker product series—Lightraulics® products, Imenco Bauer products, Tenderlift Yacht Hydraulic System®—cylinders of the American company Polygon—PolySlide®);
- The need to conduct a repeated analysis of the violation of third-party intellectual property rights (the invention was internally reported in the university in the concept phase);
- Restricted technological capabilities of machinery—directly affect no possibility to make improvements in and modify the cylinder.
- Only one serious competitor on the market—despite the existing competitive solutions on the market, it should be stated that only Lightraulic® products are characterized by a reduction in mass up to 60%, allowing the innovative cylinder prototype to eliminate the “weaker competitor”;
- Extended sales possibility—in the future, there will be a possibility to sell not only the innovative product, being the hydraulic cylinder, but also the applied technology;
- Well-identified demand for cylinders on the domestic and foreign markets—(11 potential domestic recipients and 8 potential foreign recipients) hydraulic cylinders are characterized by a high potential for modifications;
- A growing interest in smart technologies in production—cylinders are one of the elements used in creating smart machines and equipment;
- A further possibility to develop the cylinder—with the possibility to monitor the hydraulic devices’ resources in real-time and forecast and detect defects in the smart wireless technology, it will be possible to make further improvements in the cylinder elements not listed in item 6;
- A further possibility to develop the composite piston rod, piston and base—(e.g., by pultrusion or pullwinding) could possibly lead to the development of a new actuator application within particularly aggressive environments, e.g., chemical or maritime industry, offshore.
- Market pressure related to the development of composite cylinders—the market needs results in the fact that the production of innovative cylinders is still in the area of interest among potential suppliers of this product, which increases the number of potential competitors on the market;
- Widespread use of composite materials—the application of composite materials in the structure of the particular elements or entire cylinders has already been applied by several companies to manufacture hydraulic cylinders intended for the maritime, manufacturing and aviation industries;
- High production costs of carbon fiber—presently the efforts of companies and research centers focus on the optimization of carbon fiber manufacturing processes (reducing the costs of manufacturing and energy during the production process). A serious competitor is composite hybrid materials combining carbon and glass fiber because they are less expensive;
- The long time for research and development as well as the production of carbon fiber may result in some problems concerning selecting the best material for the production of the cylinder;
- The high defectiveness coefficient of carbon fibers used for the production of the cylinder contributes to the risk of the prototype being defective.
4.3. Application of the Innovation Behavior Questionnaire (IBQ)
4.4. Dependencies Occurring between Strengths and Opportunities
4.5. Domination Map
- The number of interactions that correspond to O (226) and are a result of the answers given to the following questions:
- Will the opportunities enhance the strengths?—number of interactions from the TOWS analysis = 126;
- Will the opportunities allow the weaknesses to be overcome?—number of interactions from the TOWS analysis = 100.
- The number of interactions that correspond to T (206) is a result of the answers given to the following questions:
- Will the threats weaken the strengths?—number of interactions from the TOWS analysis = 122;
- Will the threats enhance the weaknesses?—number of interactions from the TOWS analysis = 84.
- The number of interactions that correspond to S (221) and are a result of the answers given to the following questions:
- Will the identified strengths allow for taking advantage of the upcoming opportunities?—number of interactions from the SWOT analysis = 121;
- Will the identified strengths allow for the threats to be overcome?—number of interactions from the SWOT analysis = 100.
- The number of interactions that correspond to W (209) and are a result of the answers given to the following questions:
- Will the identified weaknesses prevent taking advantage of the upcoming opportunities?—number of interactions from the SWOT analysis = 113;
- Will the identified weaknesses strengthen the strength of the impact of the threats?—number of interactions from the SWOT analysis = 96.
4.6. Characteristics of Risk Factors
4.7. Development of the Report
5. Results and Discussion
- The emergence of new competitors and new solutions regarding hydraulic cylinders (competition on the cylinders market);
- Change in mass productivity;
- The emergence of new composite materials (widespread use of composite materials);
- Failure to achieve the assumed design and operating conditions.
- Higher resistance to atmospheric factors;
- High production costs of carbon fiber;
- A long time for research and development as well as production of carbon fiber;
- High defectiveness coefficient of carbon fibers;
- Only one serious competitor on the market;
- Wide application;
- Implementation readiness level TRL;
- Accessibility of competitive solutions.
6. Conclusions
- The development of a specific procedure of conduct that applies to prototypes and not just innovation;
- The application of the neutral concept in risk estimation;
- Reduced subjectivity in the assessment by the application of a team of experts with specific psychological traits, the identification of which is to eliminate extremely risky assessments, being a new contribution to the use of the SWOT/TOWS analysis;
- The possibility to visualize the results on risk (domination) maps;
- A combination under one assessment procedure of two independent approaches to risk estimation (one related to the preparation of the map of domination results from the assumptions of the SWOT/TOWS analysis, the other associated with the preparation of the risk report);
- Freedom in updating the assessment result at every stage of the project implementation.
Author Contributions
Funding
Institutional Review Board Statement
Informed Consent Statement
Data Availability Statement
Conflicts of Interest
References
- Willett, A. No the Economic Theory of Risk Insurance; University of Pennsylvania Press: Philadelphia, PA, USA, 1951. [Google Scholar]
- Zsidisin, G.A. A Grounded Definition of Supply Risk. J. Purch. Supply Manag. 2003, 9, 217–224. [Google Scholar] [CrossRef]
- Yates, J.F.; Stone, E.R. The Risk Construct. In Risk-Taking Behaviour; Yates, J.F., Ed.; Wiley: Chichester, UK, 1992; pp. 1–25. [Google Scholar]
- Chapman, C.; Ward, S. Project Risk Management: Processes, Techniques and Insights; John Wiley and Sons Ltd.: Hoboken, NJ, USA, 2000. [Google Scholar]
- Kliem, R.L.; Ludin, I.S. Reducing Project Risk, 1st ed.; Taylor and Francis: London, UK, 1997. [Google Scholar] [CrossRef]
- Jajuga, K. Risk Management [Zarządzanie Ryzykiem]; Wydawnictwo Naukowe PWN: Warsaw, Poland, 2007. (In Polish) [Google Scholar]
- Manuel, E. Innovation and Risk Management; SSRN: Rochester, NY, USA, 2007. [Google Scholar] [CrossRef]
- Wang, Y.; Li, M. The Role of Internal Audit in Engineering Project Risk Management. Procedia Eng. 2011, 24, 689–694. [Google Scholar] [CrossRef]
- Segal, S. Risk Identification: A Critical First Step in Enterprise Risk Management. Risk Manag. 2006, 13, 180043. [Google Scholar]
- AIRMIC. Alarm. IRM. A Structured Approach to Enterprise Risk Management (ERM) and the Requirements of ISO 31000. 2010. Available online: https://www.ferma.eu/app/uploads/2011/10/a-structured-approach-to-erm.pdf (accessed on 8 November 2022).
- Füllbrunn, S.C.; Luhan, W.J. Decision Making for Others: The Case of Loss Aversion. Econ. Lett. 2017, 161, 154–156. [Google Scholar] [CrossRef]
- Marmier, F.; Gourc, D.; Laarz, F. A Risk Oriented Model to Assess Strategic Decisions in New Product Development Projects. Decis. Support Syst. 2013, 56, 74–82. [Google Scholar] [CrossRef]
- OECD/Eurostat. Oslo Manual 2018: Guidelines for Collecting, Reporting and Using Data on Innovation, 4th ed.; OECD/Eurostat: Luxembourg; Paris, France, 2018. [CrossRef]
- Dogson, M.; Gann, D.M.; Salter, A. The Management of Technological Innovation; Oxford University Press: Oxford, UK, 2008. [Google Scholar]
- Westland, J.C. Global Innovation Management, 1st ed.; Palgrave Macmillan: London, UK, 2008. [Google Scholar]
- Janasz, W. Innovations in the Organisation Development Strategy in the European Union [Innowacje w Strategii Rozwoju Organizacji w Unii Europejskiej]; Difin: Warszawa, Poland, 2009. (In Polish) [Google Scholar]
- Oke, A. Innovation Types and Innovation Management Practices in Service Companies. Int. J. Oper. Prod. Manag. 2007, 27, 564–587. [Google Scholar] [CrossRef]
- Tidd, J.; Bessant, J. Managing Innovation: Integrating Technological, Market and Organizational Change; John Wiley & Sons: Chichester, UK, 2009. [Google Scholar]
- Trott, P. Innovation Management and New Product Development; Prentice Hall: Edinburgh Gate, UK, 2005. [Google Scholar]
- Robin, R.; Riedel, J.C.K.H. Design and Innovation in Successful Product Competition. Technovation 1997, 17, 537–548. [Google Scholar] [CrossRef]
- Luzzini, D.; Ronchi, S. Organizing the Purchasing Department for Innovation. Oper. Manag. Res. 2011, 4, 14–27. [Google Scholar] [CrossRef]
- Vonortas, N.S.; Xue, L. Process Innovation in Small Firms: Case Studies on CNC Machine Tools. Technovation 1997, 17, 427–438. [Google Scholar] [CrossRef]
- Xin, J.Y.; Yeung, A.C.L.; Cheng, T.C.E. Radical Innovations in New Product Development and Their Financial Performance Implications: An Event Study of US Manufacturing Firms. Oper. Manag. Res. 2008, 1, 119–128. [Google Scholar] [CrossRef]
- Deptuła, A.M.; Knosala, R. Risk Assessment of the Innovative Projects Implementation. Manag. Prod. Eng. Rev. 2015, 6, 15–25. [Google Scholar] [CrossRef]
- Lubecki, M.; Stosiak, M.; Gazińska, M. Numerical and Experimental Analysis of the Base of a Composite Hydraulic Cylinder Made of PET. Lect. Notes Mech. Eng. 2020, 24, 396–405. [Google Scholar] [CrossRef]
- Stryczek, J.; Banaś, M.; Krawczyk, J.; Marciniak, L.; Stryczek, P. The Fluid Power Elements and Systems Made of Plastics. Procedia Eng. 2017, 176, 600–609. [Google Scholar] [CrossRef]
- Solazzi, L. Design and Experimental Tests on Hydraulic Actuator Made of Composite Material. Compos. Struct. 2020, 232, 111544. [Google Scholar] [CrossRef]
- Elasswad, M.; Tayba, A.; Abdellatif, A.; Alfayad, S.; Khalil, K. Development of Lightweight Hydraulic Cylinder for Humanoid Robots Applications. Proc. Inst. Mech. Eng. Part C J. Mech. Eng. Sci. 2018, 232, 3351–3364. [Google Scholar] [CrossRef]
- Choi, H.G.; Ahn, J.H. Risk Analysis Models and Risk Degree Determination in New Product Development: A Case Study. J. Eng. Technol. 2010, 27, 110–124. [Google Scholar] [CrossRef]
- Chin, K.S.; Tang, D.W.; Yang, J.B.; Wong, S.Y.; Wang, H. Assessing New Product Development Project Risk by Bayesian Network with a Systematic Probability Generation Methodology. Expert Syst. Appl. 2009, 36, 9879–9890. [Google Scholar] [CrossRef]
- Ayağ, Z.; Özdemir, R.G. An Analytic Network Process-Based Approach to Concept Evaluation in a New Product Development Environment. J. Eng. Des. 2007, 18, 209–226. [Google Scholar] [CrossRef]
- Dey, P.K.; Ogunlana, S.O. Selection and Application of Risk Management Tools and Techniques for Build-Operate-Transfer Projects. Ind. Manag. Data Syst. 2004, 104, 334–346. [Google Scholar] [CrossRef]
- Lee, S.F.; Tsai, Y.C.; Jih, W.J. An Empirical Examination of Customer Perceptions of Mobile Advertising. Inf. Resour. Manag. J. 2006, 19, 39–55. [Google Scholar] [CrossRef]
- Nadkarni, S.; Shenoy, P.P. Bayesian Network Approach to Making Inferences in Causal Maps. Eur. J. Oper. Res. 2001, 128, 479–498. [Google Scholar] [CrossRef]
- Kahraman, C.; Büyüközkan, G.; Ateş, N.Y. A Two Phase Multi-Attribute Decision-Making Approach for New Product Introduction. Inf. Sci. 2007, 177, 1567–1582. [Google Scholar] [CrossRef]
- Neubauer, A.C.; Freudenthaler, H.H. Models of emotional intelligence. In Emotional Intelligence: An International Handbook; Schultz, R., Roberts, R.D., Eds.; Hogrefe Publishing: Göttingen, Germany, 2005; pp. 31–50. [Google Scholar]
- Dörfler, V.; Ackermann, F. Understanding intuition: The case for two forms of intuition. Manag. Learn. 2012, 43, 545–564. [Google Scholar] [CrossRef]
- Petrides, K.V.; Perazzo, M.F.; Pérez-Díaz, P.A.; Jeffrey, S.; Richardson, H.C.; Sevdalis, N.; Ahmad, N. Trait Emotional Intelligence in Surgeons. Front Psychol. 2022, 13, 829084. [Google Scholar] [CrossRef] [PubMed]
- Mobey, A.; Parker, D. Risk Evaluation and Its Importance to Project Implementation. Work Study 2002, 51, 202–208. [Google Scholar] [CrossRef]
- Mullins, J.W.; Sutherland, D.J. New Product Development in Rapidly Changing Markets: An Exploratory Study. J. Prod. Innov. Manag. 1998, 15, 224–236. [Google Scholar] [CrossRef]
- Tyszka, T. Decision Analysis and Decision Psychology [Analiza Decyzyjna i Psychologia Decyzji]; Wydawnictwo Naukowe, P.W.N.: Warsaw, Poland, 1986. (In Polish) [Google Scholar]
- Zaleśkiewicz, T. Economic Psychology [Psychologia Ekonomiczna]; Wydawnictwo Naukowe P.W.N.: Warsaw, Poland, 2015. (In Polish) [Google Scholar]
- Kahneman, D.; Tversky, A. On the Psychology of Prediction. Psychol. Rev. 1973, 80, 237–251. [Google Scholar] [CrossRef]
- Kahneman, D.; Tversky, A. Prospect Theory: An Analysis of Decision under Risk. Econometrica 1979, 47, 263–292. [Google Scholar] [CrossRef]
- Kahneman, D.; Tversky, A. Choices, Values, and Frames. Am. Psychol. 1984, 39, 341–350. [Google Scholar] [CrossRef]
- Deptuła, A.M.; Rudnik, K. Risk Assessment of Innovative Project Using Fuzzy Inference System with Expert’s Psychological Conditions. In Proceedings of the 29th International Business Information Management Association (IBIMA), Vienna, Austria, 3–4 May 2017; pp. 3093–3105. [Google Scholar]
- Deptuła, A.M.; Rudnik, K. Fuzzy Approach Using Experts’ Psychological Conditions to Estimate the Criteria Importance for the Assessment of Innovative Projects Risk. Manag. Prod. Eng. Rev. 2018, 9, 13–23. [Google Scholar] [CrossRef]
- Gierszewska, G.; Romanowska, M. Strategic Analysis of the Enterprise [Analiza Strategiczna Przedsiębiorstwa]; Polskie Wydawnictwo Ekonomiczne: Warszawa, Poland, 2017. (In Polish) [Google Scholar]
- Phadermrod, B.; Crowder, R.M.; Wills, G.B. Importance-Performance Analysis Based SWOT Analysis. Int. J. Inf. Manag. 2019, 44, 194–203. [Google Scholar] [CrossRef]
- Dyson, R.G. Strategic Development and SWOT Analysis at the University of Warwick. Eur. J. Oper. Res. 2004, 152, 631–640. [Google Scholar] [CrossRef]
- Samejima, M.; Shimizu, Y.; Akiyoshi, M.; Komoda, N. SWOT Analysis Support Tool for Verification of Business Strategy. In Proceedings of the 2006 IEEE International Conference on Computational Cybernetics, Talinn, Estonia, 20–22 August 2006; pp. 1–4. [Google Scholar] [CrossRef]
- Ayub, A.; Razzaq, A.; Aslam, M.S.; Iftekhar, H.A. Conceptual Framework on Evaluating Swot Analysis as The Mediator in Strategic Marketing Planning Through Marketing Intelligence. Eur. J. Bus. Soc. Sci. 2013, 2, 91–98. [Google Scholar]
- Kurttila, M.; Pesonen, M.; Kangas, J.; Kajanus, M. Utilizing the Analytic Hierarchy Process (AHP) in SWOT Analysis—A Hybrid Method and Its Application to a Forest-Certification Case. For. Policy Econ. 2000, 1, 41–52. [Google Scholar] [CrossRef]
- Kangas, J.; Pesonen, M.; Kurttila, M.; Kajanus, M. A’wot: Integrating the AHP with SWOT Analysis. In Proceedings of the Sixth International Symposium on the Analytic Hierarchy Process ISAHP, Berne, Switzerland, 2–4 August 2001. [Google Scholar]
- Lee, K.L.; Lin, S.C. A Fuzzy Quantified SWOT Procedure for Environmental Evaluation of an International Distribution Center. Inf. Sci. 2008, 178, 531–549. [Google Scholar] [CrossRef]
- Yüksel, I.; Daǧdeviren, M. Using the Analytic Network Process (ANP) in a SWOT Analysis—A Case Study for a Textile Firm. Inf. Sci. 2007, 177, 3364–3382. [Google Scholar] [CrossRef]
- Yang, Y. SWOT-TOPSIS Integration Method for Strategic Decision. In Proceedings of the ICEE ’10: Proceedings of the 2010 International Conference on E-Business and E-Government, Guangzhou, China, 7–9 May 2010; pp. 1575–1578. [Google Scholar] [CrossRef]
- Deptuła, A.M.; Deptuła, A. Analysis of the Optimization Results of an Innovative Gear Pump in the Context of the Validity of the Evaluation Criteria Used [Analiza Wyników Optymalizacji Innowacyjnej Pompy Zębatej w Kontekście Ważności Zastosowanych Kryteriów Oceny]. In Innowacje w Zarządzaniu i Inżynierii Produkcji [Innovations in Management and Production Engineering]; Knosala, R., Ed.; Oficyna Wydawnicza Polskiego Towarzystwa Zarządzania Produkcją: Opole, Poland, 2017. (In Polish) [Google Scholar]
- Pollatsek, A.; Tversky, A. A Theory of Risk. J. Math. Psychol. 1970, 7, 540–553. [Google Scholar] [CrossRef]
- Andersson, O.; Holm, H.J.; Tyran, J.R.; Wengström, E. Risk Aversion Relates to Cognitive Ability: Preferences or Noise? J. Eur. Econ. Assoc. 2016, 14, 1129–1154. [Google Scholar] [CrossRef]
- Folkes, V.S. The Availability Heuristic and Perceived Risk. J. Consum. Res. 1988, 15, 13–23. [Google Scholar] [CrossRef]
- Deptuła, A.M. Analysis of Risk Perception in the Process of Implementing Technicalinnovation. In Business Risk in Changing Dynamics of Global Village; Nowak, A., Wilimowska, Z., Eds.; Oficyna Wydawnicza PWSZ w Nysie: Nysa, Poland, 2017; pp. 125–138. [Google Scholar]
- Deptuła, A.M.; Nosal, C.S. Innovator Behavior Questionnaire as an Expert Selecting for Technical Innovation Risk Assessment. Eur. Res. Stud. J. 2021, 24, 107–119. [Google Scholar] [CrossRef]
- Coman, A.; Ronen, B. Focused SWOT: Diagnosing Critical Strengths and Weaknesses. Int. J. Prod. Res. 2009, 47, 5677–5689. [Google Scholar] [CrossRef]
- Piercy, N.; Giles, W. Making Swot Analysis Work. Mark. Intell. Plan. 1989, 7, 5–7. [Google Scholar] [CrossRef]
- Gürel, E. Swot analysis: A theoretical review. J. Int. Soc. Res. 2017, 10, 994–1006. [Google Scholar] [CrossRef]
- Ghazinoory, S.; Abdi, M.; Azadegan-Mehr, M. Swot Methodology: A State-Of-The-Art Review for The Past, A Framework for The Future. J. Bus. Econ. Manag. 2011, 12, 24–48. [Google Scholar] [CrossRef]
- Obłój, K. Organization Strategy [Strategia Organizacji]; Polskie Wydawnictwo Ekonomiczne: Warszawa, Poland, 1998. (In Polish) [Google Scholar]
- Nosal, C.S. Psychology of Managerial Thinking and Acting: Problem Solving, Decision Making, and Strategy Formation [Psychologia Myślenia i Działania Menedżera: Rozwiązywanie Problemów, Podejmowanie Decyzji, Kreowanie Strategii]; Akade: Wrocław, Poland, 2001. (In Polish) [Google Scholar]
- Zuckerman, M. Sensation Seeking and Risky Behavior. Sensation Seeking and Risky Behavior; American Psychological Association: New York, NY, USA, 2007. [Google Scholar] [CrossRef]
- Strelau, J. Individual Differences: History–Determinants–Applications [Różnice Indywidualne. Historia–Determinanty–Zastosowania]; Wydawnictwo Naukowe Scholar: Warsaw, Poland, 2014. (In Polish) [Google Scholar]
- Rotter, J.B. Generalized Expectancies for Internal versus External Control of Reinforcement. Psychol. Monogr. 1966, 80, 1–28. [Google Scholar] [CrossRef]
- Singer, R. Motor Learning and Human Performance; Undefined; Macmillan and Company: New York, NY, USA, 1975. [Google Scholar]
- Larsen, R.; Buss, D. Personality Psychology: Domains of Knowledge About Human Nature; McGraw–Hill, Higer Education: London, UK, 2013. [Google Scholar]
- Zimmerman, B.J. Attaining Self-Regulation. In Handbook of Self-Regulation; Elsevier: Amsterdam, The Netherlands, 2000; pp. 13–39. [Google Scholar] [CrossRef]


| EXTERNAL FACTORS | ||||
|---|---|---|---|---|
| Opportunities | Threats | |||
| Maxi–Maxi | Maxi–Mini | |||
| Aggressive Strategy | Conservative Strategy | |||
| INTERNAL FACTORS | Strengths | number of interactions | ||
| weighed number of interactions | ||||
| Mini–Maxi | Mini–Mini | |||
| Competitive Strategy | Defensive Strategy | |||
| Weaknesses | number of interactions | |||
| weighed number of interactions | ||||
| S/O | CG1 | CG2 | CG3 | O1 | O2 | O3 | O4 | O5 | O6 | Weight | Number of Interactions | Product of Weights and Interactions | Importance |
|---|---|---|---|---|---|---|---|---|---|---|---|---|---|
| CG1 | 1 | 1 | 1 | 1 | 1 | 1 | 6 | ||||||
| CG2 | 1 | 0 | 0 | 1 | 1 | 1 | 4 | ||||||
| CG3 | 1 | 0 | 1 | 1 | 1 | 1 | 5 | ||||||
| S1 | 1 | 1 | 1 | 1 | 1 | 1 | 0 | 1 | 0 | 0.23 | 7 | 1.58 | 1 |
| S2 | 0 | 0 | 0 | 1 | 1 | 1 | 1 | 1 | 1 | 0.18 | 7 | 1.23 | 4 |
| S3 | 1 | 1 | 1 | 1 | 1 | 1 | 1 | 1 | 1 | 0.16 | 9 | 1.46 | 2 |
| S4 | 1 | 1 | 1 | 1 | 1 | 1 | 1 | 1 | 1 | 0.08 | 9 | 0.71 | 6 |
| S5 | 0 | 1 | 0 | 1 | 1 | 1 | 1 | 1 | 1 | 0.16 | 7 | 1.09 | 5 |
| S6 | 0 | 1 | 0 | 1 | 1 | 1 | 1 | 1 | 1 | 0.20 | 7 | 1.43 | 3 |
| Number of interactions | 3 | 5 | 3 | 9 | 7 | 8 | 8 | 9 | 8 | ||||
| Product of weights and interactions | 1.80 | 0.82 | 1.07 | 1.89 | 1.54 | 1.14 | |||||||
| Importance | 2 | 6 | 5 | 1 | 3 | 4 | |||||||
| Total interactions total products | 121 15.73 |
| EXTERNAL FACTORS | ||||
|---|---|---|---|---|
| Opportunities | Threats | |||
| Maxi–Maxi | Maxi–Mini | |||
| Aggressive Strategy | Conservative Strategy | |||
| INTERNAL FACTORS | Strengths | number of interactions | 121 | 100 |
| weighed number of interactions | 15.73 | 13.04 | ||
| Mini–Maxi | Mini–Mini | |||
| Competitive Strategy | Defensive Strategy | |||
| Weaknesses | number of interactions | 113 | 96.00 | |
| weighed number of interactions | 16.02 | 13.58 | ||
| Positive Risk—Strengths and Opportunities Area | Probability | Negative Risk—Weaknesses and Threats Area | ||
|---|---|---|---|---|
| Score | Description of effect importance | Interval | Score | Description of effect importance |
| 1 | Additional improvement of the design parameters having smaller importance for the cylinder’s efficiency | 0–40 | 1 | Deterioration of the design parameters having smaller importance for the cylinder’s efficiency |
| 2 | Smaller costs than assumed | 41–50 | 2 | Higher costs than assumed |
| 3 | Greater cylinder weight reduction than assumed | 51–70 | 3 | Smaller cylinder weight reduction than assumed |
| 4 | Smaller costs than assumed, and at the same time, greater cylinder weight reduction than assumed | 71–80 | 4 | Higher costs than assumed, and at the same time, smaller cylinder weight reduction than assumed |
| 5 | Smaller costs than assumed and greater cylinder weight reduction than assumed, with the simultaneous improvement in selected design parameters | 81–100 | 5 | Higher costs than assumed and smaller cylinder weight reduction than assumed, with the simultaneous deterioration of selected design parameters |
| P | S | Risk | Risk Factor |
|---|---|---|---|
| 5 | 5 | 25 | Competition in the cylinders market |
| 4 | 5 | 20 | Mass effectiveness |
| 4 | 5 | 20 | Widespread use of composite materials |
| 4 | 5 | 20 | Failure to achieve the assumed design and operating conditions |
| 4 | 4 | 16 | Higher resistance to atmospheric factors |
| 4 | 4 | 16 | High production costs of carbon fiber |
| 4 | 4 | 16 | A long time for research and development as well as the production of carbon fiber |
| 4 | 4 | 16 | High defectiveness coefficient of carbon fibers |
| 4 | 4 | 16 | Only one serious competitor on the market |
| 3 | 5 | 15 | Wide application |
| 5 | 3 | 15 | Implementation readiness level TRL |
| 5 | 3 | 15 | Accessibility of competitive solutions |
| 4 | 3 | 12 | Possibility to obtain high working pressures at high efficiency |
| 3 | 4 | 12 | Extended sales possibility |
| 4 | 3 | 12 | A growing interest in smart technologies in the production |
| 4 | 3 | 12 | A further possibility to develop the cylinder |
| 4 | 3 | 12 | Possibility to modify the composite plunger rod, plunger and heads |
| 4 | 3 | 12 | Restricted technological capabilities of the machinery |
| 3 | 3 | 9 | Well-identified demand |
| 4 | 2 | 8 | Need to conduct repeated analysis of the violation of third-party intellectual property rights |
| 4 | 1 | 4 | Higher resistance to the effect of electromagnetic fields |
| 4 | 1 | 4 | Possibility to operate in increased temperatures |
Disclaimer/Publisher’s Note: The statements, opinions and data contained in all publications are solely those of the individual author(s) and contributor(s) and not of MDPI and/or the editor(s). MDPI and/or the editor(s) disclaim responsibility for any injury to people or property resulting from any ideas, methods, instructions or products referred to in the content. |
© 2022 by the authors. Licensee MDPI, Basel, Switzerland. This article is an open access article distributed under the terms and conditions of the Creative Commons Attribution (CC BY) license (https://creativecommons.org/licenses/by/4.0/).
Share and Cite
Deptuła, A.M.; Stosiak, M.; Deptuła, A.; Lubecki, M.; Karpenko, M.; Skačkauskas, P.; Urbanowicz, K.; Danilevičius, A. Risk Assessment of Innovation Prototype for the Example Hydraulic Cylinder. Sustainability 2023, 15, 440. https://doi.org/10.3390/su15010440
Deptuła AM, Stosiak M, Deptuła A, Lubecki M, Karpenko M, Skačkauskas P, Urbanowicz K, Danilevičius A. Risk Assessment of Innovation Prototype for the Example Hydraulic Cylinder. Sustainability. 2023; 15(1):440. https://doi.org/10.3390/su15010440
Chicago/Turabian StyleDeptuła, Anna M., Michał Stosiak, Adam Deptuła, Marek Lubecki, Mykola Karpenko, Paulius Skačkauskas, Kamil Urbanowicz, and Algimantas Danilevičius. 2023. "Risk Assessment of Innovation Prototype for the Example Hydraulic Cylinder" Sustainability 15, no. 1: 440. https://doi.org/10.3390/su15010440
APA StyleDeptuła, A. M., Stosiak, M., Deptuła, A., Lubecki, M., Karpenko, M., Skačkauskas, P., Urbanowicz, K., & Danilevičius, A. (2023). Risk Assessment of Innovation Prototype for the Example Hydraulic Cylinder. Sustainability, 15(1), 440. https://doi.org/10.3390/su15010440