Article

Sustainability of an Open-Loop GWHP System in an Italian Alpine Valley

1
Department of Geosciences, Università degli Studi di Padova, Via Gradenigo 6, 35131 Padova, Italy
2
DolomitiGeo Geo Engineering, Via C. Castaldi 2, 32032 Feltre, Italy
*
Author to whom correspondence should be addressed.
Sustainability 2023, 15(1), 270; https://doi.org/10.3390/su15010270
Submission received: 28 November 2022 / Revised: 12 December 2022 / Accepted: 20 December 2022 / Published: 23 December 2022
(This article belongs to the Special Issue Groundwater Protection and Sustainable Utilization)

Abstract

:
Shallow geothermal systems (SGSs) for building climatization represent an advantageous alternative to traditional air-conditioning systems, resulting in economic and environmental benefits. Installation of these systems requires knowledge of site-specific geological and hydrogeological conditions, which in feasibility studies are often evaluated only at the single plant scale, lacking a comprehensive view and risking not to guarantee the system sustainability over time. In this paper a methodology for the sustainable design of SGSs is presented. The methodology is developed from an example on the aquifer scale in Longarone (Belluno, Italy), where three groundwater heat pumps (GWHPs) were installed in an industrial area located in a mountain basin hosting a coarse-grained phreatic aquifer, characterized by sediments with high hydraulic conductivity and proximal to a large river (Piave River). Open-loop systems were first analyzed through numerical modeling using FEFLOW software, identifying peculiar features of the aquifer, due to its interaction with surface waters, and suggesting the possibility of its greater geothermal exploitation. Subsequently, a relationship between flow rates and thermal plume extensions was obtained, which is useful to providing support in the evaluation of potential interference with neighboring systems. The study at the aquifer scale proved representative of the system, highlighting the criticalities of the area, such as trends of aquifer temperature alteration, interference between plants, and thermal feedback.

1. Introduction

Climate change mitigation is a crucial challenge for the coming years and will be focused on reducing the emissions of greenhouse gases, which are considered the main cause of global warming [1,2,3]. To achieve this goal, it is necessary to move toward renewable and sustainable energy and to develop more efficient technologies. Renewable resources capable of decreasing the anthropogenic impact on climate are needed, and geothermal resources are one of these [4,5,6]. Geothermics can be exploited to generate geothermal energy by means of high-enthalpy (high-temperature) systems or to extract and store heat through low-enthalpy (low-temperature) systems. Although the former can be applied only in certain geological settings, the latter has the advantage of being always accessible, allowing widespread deployment [7]. Low-enthalpy plants are shallow geothermal systems (SGSs) and therefore have depths below 300 m and temperatures less than 40 °C [7]. The SGSs are equipped with a heat pump that provides building air conditioning, and these systems can achieve economic and environmental benefits if they are properly designed. In fact, depending on the geological/hydrogeological settings and the thermal properties of the subsoil, different solutions may be adopted, choosing between closed-loop (GSHP, ground source heat pump) or open-loop systems (GWHP, groundwater heat pump). In GSHPs, heat exchange occurs through geothermal probes, in which thermal conduction is used to transfer heat between a fluid and the ground; borehole heat exchangers (BHEs) are quite common among these systems and consist of vertical geothermal probes. GWHPs, instead, require the presence of a water source (i.e., groundwater, rivers, lakes) from which water is extracted to exploit the favorable temperature for climatization, and then it is usually reinjected into the reservoir in order not to deplete the water resource. Both of these systems can provide heating and cooling to buildings through the use of a reversible heat pump, for which operation requires less energy than traditional systems, allowing for a significant saving in fossil fuel and reducing emissions of gases and particulates into the atmosphere [8,9,10]. The advantages of these techniques and the maintenance of their efficiency over time are the result of adequate planning and management, which aims to make the systems sustainable, since the installation of GSHPs and GWHPs may have adverse effects due to alteration of the natural temperatures of the ground, which can cause thermal pollution [11]. If these temperature variations do not disperse adequately, the efficiency of the system will tend to decrease with time [12,13]. Thermal impact should also be assessed to verify interference with any surrounding installations. Regarding GWHPs, in particular, water reinjection tends to generate thermal plumes, and there is also the risk of thermal feedback, that is, the recall of reinjected water to the extraction well [14,15]. Attention to these issues has led to the need to characterize in detail the area in which to install SGSs, with particular reference to hydrogeological, hydrological, and thermal conditions, to better evaluate the effects of geothermal systems [16,17]. Sustainability assessments are often carried out through numerical models, and in the scientific literature, there are numerous examples that provide insight into this argument [18,19,20,21].
The present study, starting from the evaluation of the effects of three GWHPs that exploit a phreatic aquifer in Longarone (Belluno, Italy), proposes a methodology for the sustainable design of SGS plants. This target was first evaluated through numerical modeling, in terms of thermal feedback to the extraction well, development of progressive alteration of aquifer temperatures and interference between different plants. The case reported in this paper thus provides a detailed example for conducting a hydrogeological and thermal study of an aquifer for geothermal purposes, describing procedures and reasoning that may be useful to designers undertaking this type of analysis. In addition, since the potential of the SGSs depends strongly on the context in which they are installed [22,23], in the paper a particular hydrogeological context is investigated. In fact, the study area is located within a classical geological setting for mountainous regions such as the Alps, characterized by the presence of a wide valley crossed by a river interacting with a highly permeable phreatic aquifer. In this setting, the important water exchange between groundwater and surface water deeply affects the thermal behavior of the aquifer, even at depth.
Numerical modeling is a powerful method to study groundwater and geothermal energy [21,24,25,26], but is also a challenging technique that requires expertise in hydrogeology and numerical analysis and, if applied at the local scale (single plant), can evaluate only the thermal feedback without detecting the other criticalities. The implementation of a new numerical simulation or the updating of an existing numerical model every time a plant is planned can be a time-consuming and expensive process. The methodology proposed in this article for the sustainable GWHP design involves first of all the implementation of a single numerical simulation with predictive purpose at the regional or aquifer scale. In this way it is possible to determinate a site-specific relationship between injection flow rate and thermal plume length in rather homogeneous areas. This simple tool, requiring only knowledge of the main groundwater flow direction, can be useful for designers to estimate the area affected by thermal alteration and is also easy to use by decision-makers with limited skills in hydrogeology. This could provide support for the permitting process and sustainable design, as potential interference between facilities or with surface waters is often not considered.
In Longarone three GWHPs are currently installed and continuously monitored by sensors located in wells and piezometers, providing a large dataset of hydraulic head and temperature measurements. Together with manual measurements of water level and thermal logs in the wells, these data were used to characterize the aquifer and develop a conceptual hydrogeological and thermal model of the area. Based on this, a numerical model was implemented using the code FEFLOW 7.0 [27]. Model calibration was carried out by means of (i) steady-state flow simulations, (ii) transient flow simulations, and (iii) transient flow and heat transport simulations. Calibration allowed estimation of thermal and hydraulic parameters of the phreatic aquifer and to improve the knowledge of the environmental system. Furthermore, using the calibrated model, predictive simulations were carried out to evaluate the sustainability of the GWHPs over 30 years of activity, both in the current configuration and increasing the number of plants. The predictive simulations allowed us to verify critical issues of a potential overexploitation condition, and the results highlighted the high geothermal potential of the natural system and its tendency to efficiently dissipate artificially induced thermal variations, mainly due to the magnitude of advective heat transport in the aquifer. In such a context, it is recommended to consider the use of GWHPs for building air conditioning, both for economic and environmental benefits. To optimize these aspects, correct positioning and dimensioning of the GWHPs are needed, and for this reason, a site-specific relationship between injection flow rates and plume length was obtained. This tool can be useful for designers to estimate the area affected by thermal alteration and to support the authorization process, which often does not consider the potential interference between plants [20,28].

2. Study Area

Longarone (BL) is located in the Alpine sector of the Piave Basin in a mountainous territory where the valley bottom is flat and approximately 900 m wide. The study area is characterized by the presence of the Piave River (flowing from north to south) and its tributary, the Maè Stream (flowing from west to east). The morphology of the valley facilitated the development of anthropogenic activities, including productive activities that are centered on the industrial area of Villanova (Figure 1), situated on a river terrace to the hydrographic right of the Piave River. This area is bordered to the north by the Maè Stream and to the east by the Piave River, and it is characterized by the presence of a thick phreatic aquifer. The availability of water led some of the companies established within Villanova to install groundwater heat pump systems to provide building air conditioning.

2.1. Geological and Hydrogeological Settings

The study area is located in the Belluno Dolomites [29], a mountain massif of the Eastern Alps mainly composed of carbonate rocks, and near Longarone, the outcropping rock formations consist of Triassic dolomites (Dolomia Principale), Jurassic limestones, Cretaceous limestones and marly limestones (Maiolica, Scaglia Rossa). The rock formations constitute the sides of the Piave Valley and its bottom; this valley is filled by Quaternary sediments mainly composed of pebbles, gravel, and sand, locally with a silty-clay matrix. These sediments were deposited by glacial and fluvial processes that occurred after the Last Glacial Maximum (LGM; 30,000–17,000 years ago), when the retreat of glaciers decreased the transport of sediments on the Venetian Plain and favored accumulation in mountain basins [30,31]. Several phases of deposition and fluvial incision occurred in the Longarone area, resulting in the Villanova River terrace, which is currently approximately 7–8 m higher than the valley bottom occupied by the Piave River (Figure 1). The Villanova terrace is delimited to the north by an alluvial fan deposited by the Maè Stream, which is the right affluent of the Piave River descending from the Zoldo Valley. The thickness of the alluvial deposits is estimated at approximately 100–150 m on the basis of geophysical surveys carried out in a southern area near Ponte delle Alpi [32].
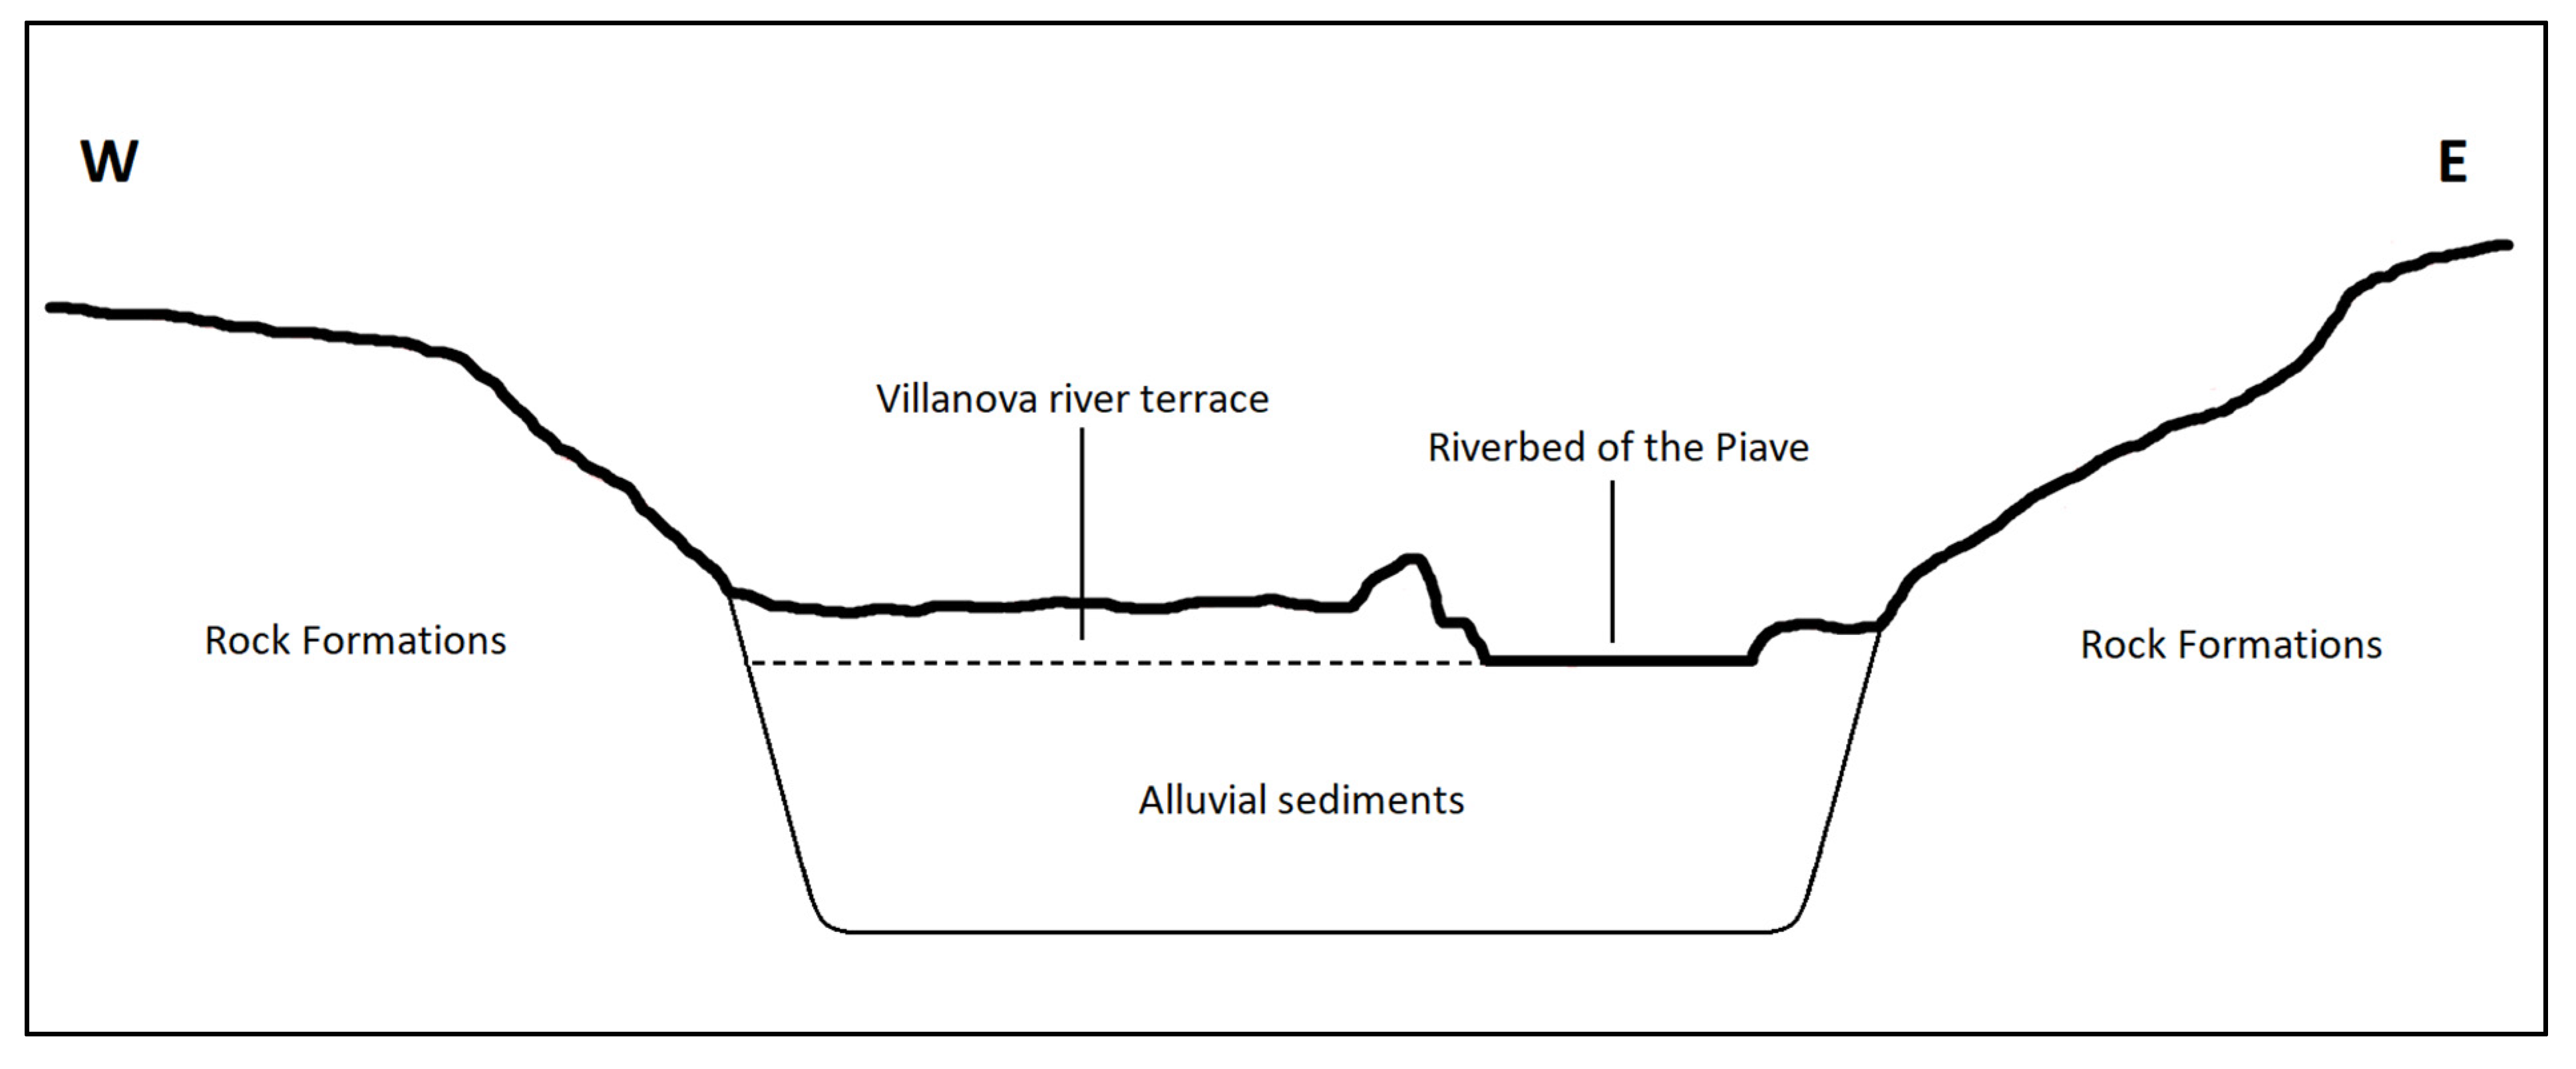
From a hydrogeological point of view, the geological units of the study area can be grouped into two hydrostratigraphic units (Figure 2):
  • the rock formations, with a low hydraulic conductivity, that can be considered an aquiclude;
  • the alluvial deposits, hosting a phreatic or unconfined aquifer, consist mainly of pebbles, gravel and sand; the hydraulic conductivity of the aquifer (K), calculated by pumping tests, ranges from 2.7 × 10⁻² to 1.0 × 10⁻³ m/s.
The high hydraulic conductivity of the alluvial sediments allows a strong interaction between groundwater and surface water of the Piave River and Maè Stream.

2.2. Geothermal Plants

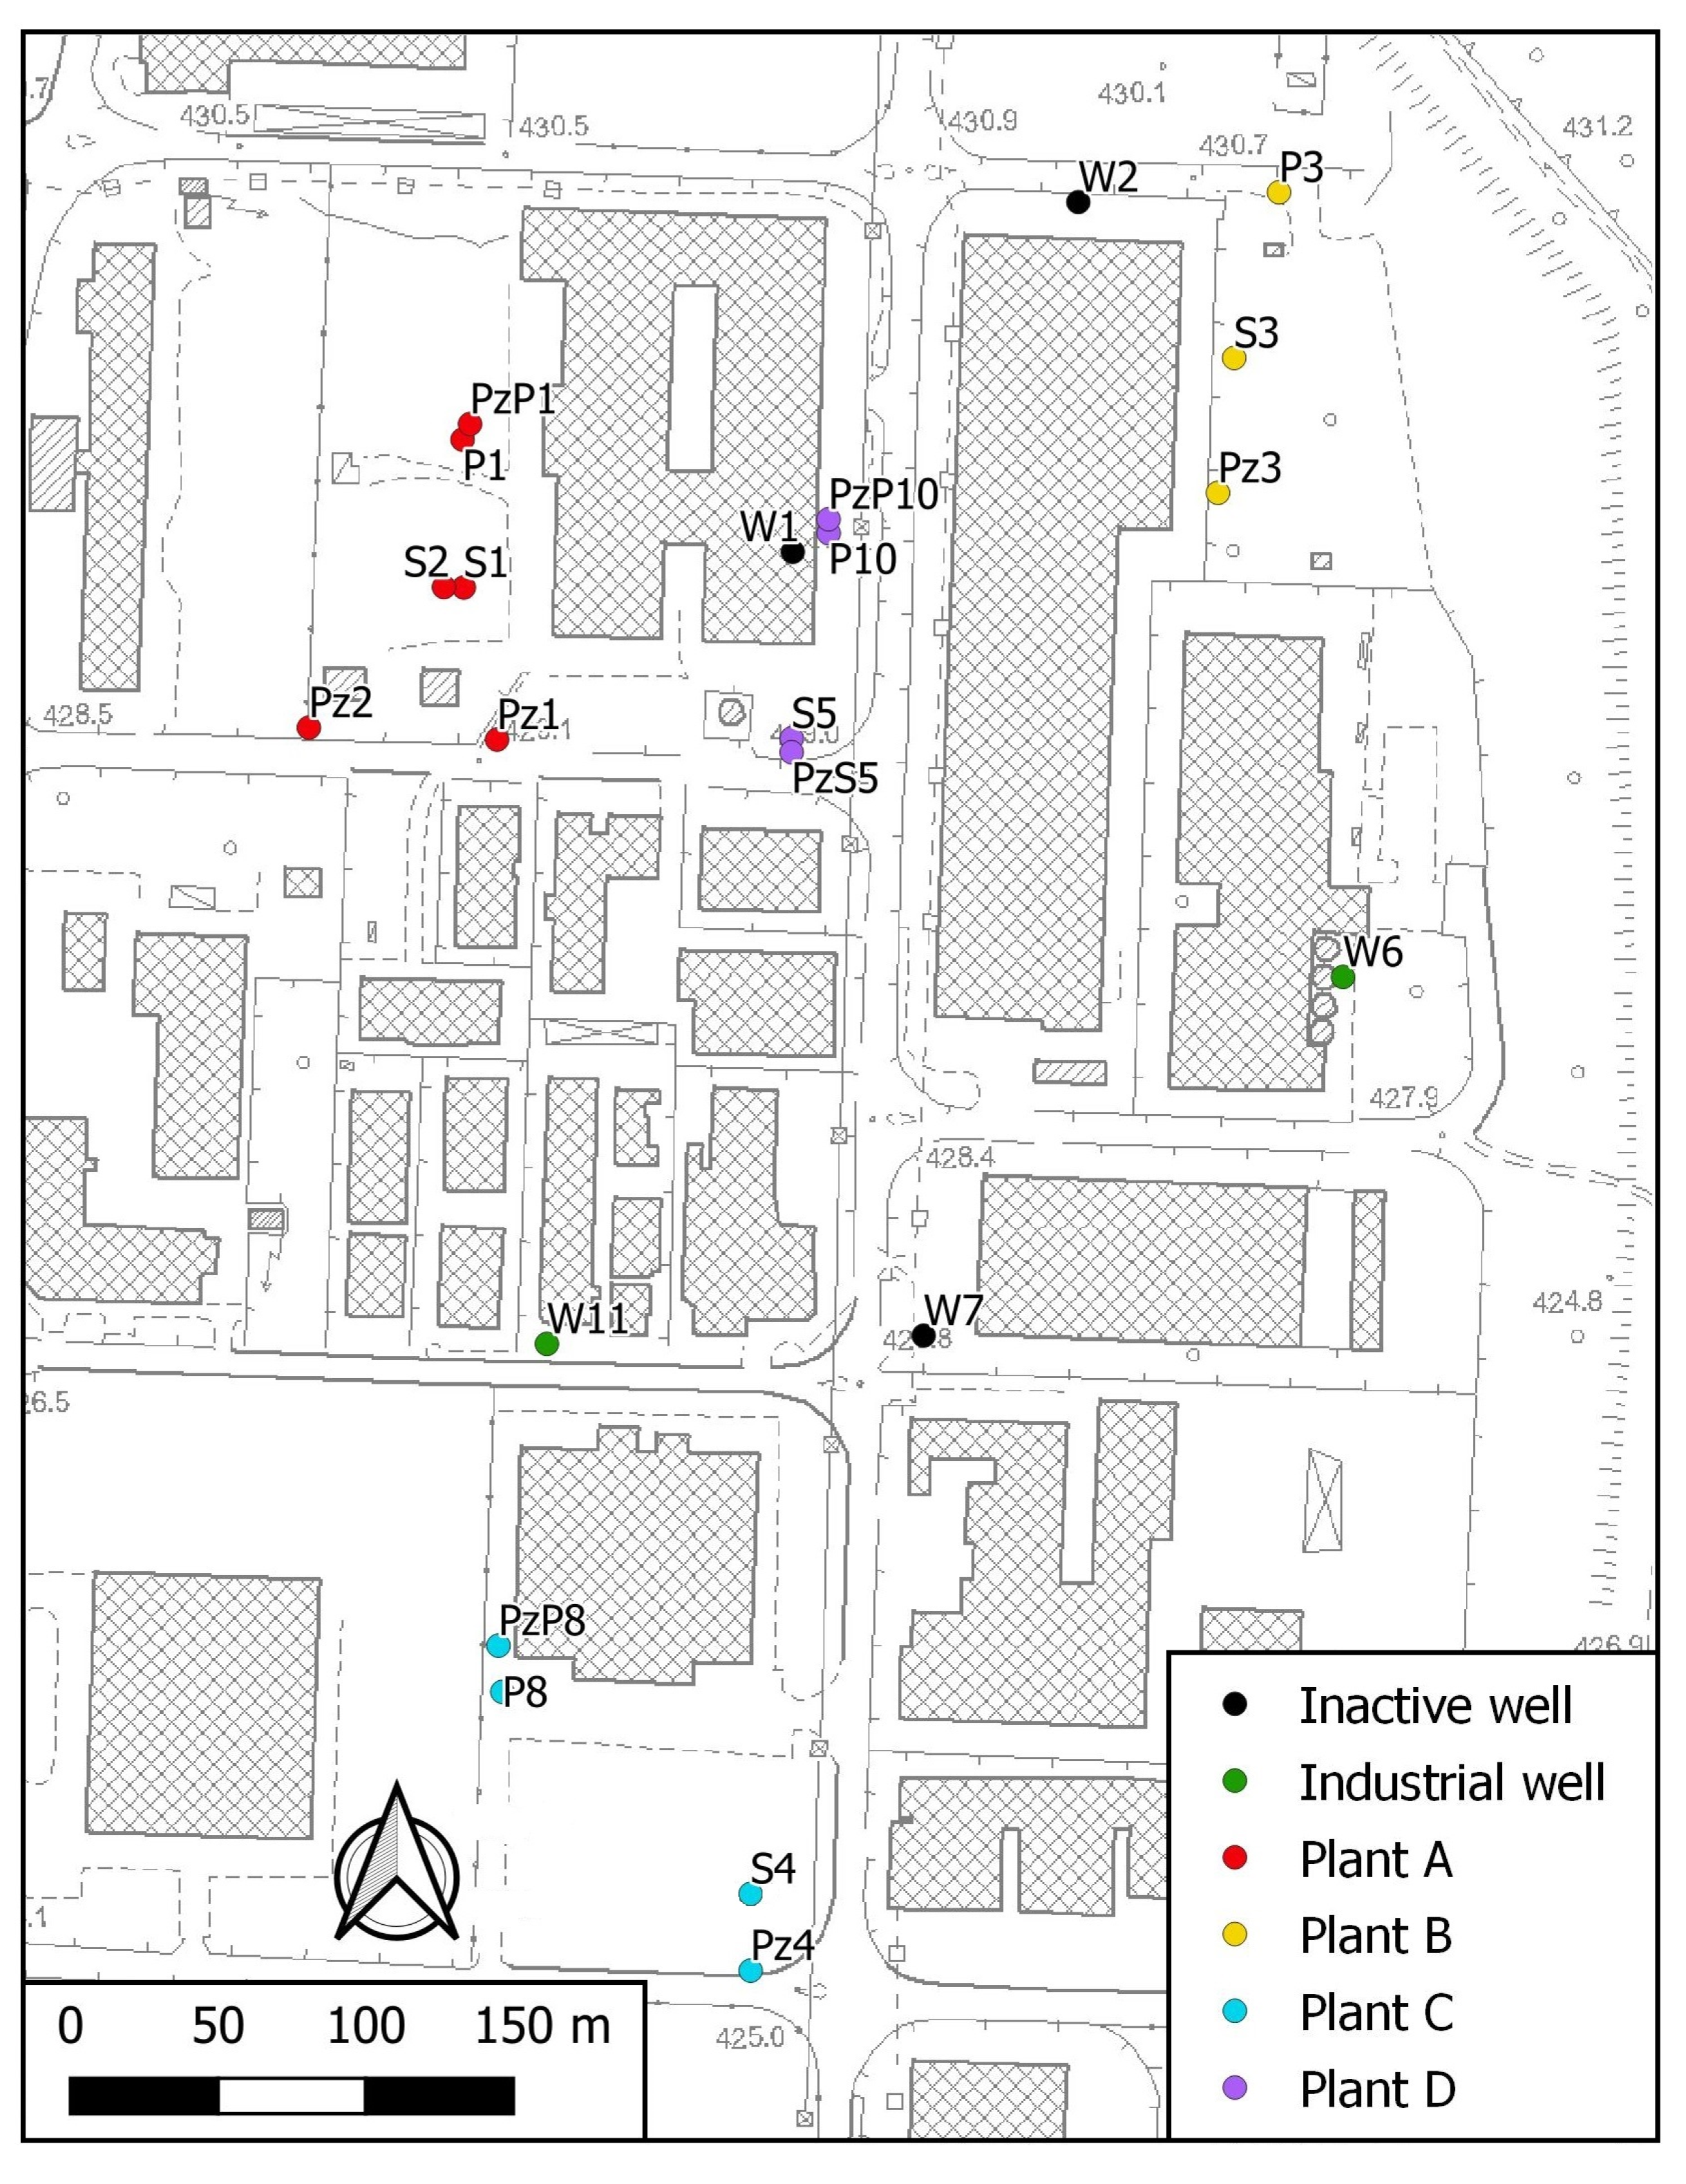
In the Villanova industrial area, there are currently three active GWHPs (A, B, C; Figure 3), and a fourth is planned (D; Figure 3). Typically, a GWHP consists of a pumping well that extracts groundwater and a restitution well that returns the water to the aquifer. The extracted water is used by the heat pump for the climatization of the buildings, and its final temperature varies with respect to the initial temperature: it is heated when the building needs to be cooled (cooling regime), and it is cooled when the building needs to be heated (heating regime). For this reason, during its activity, the GWHP can alter the aquifer temperature, generating a thermal plume into the aquifer.
In the study area, water restitution is carried out by injection wells, namely, large diameter wells approximately 3 m deep, lined with concrete rings 2 m in diameter. These wells promote downward percolation of water through the unsaturated zone and are considered a good solution because they are less expensive and attenuate water temperature due to thermal dissipation during the infiltration process. For GWHP monitoring, some piezometers were installed upstream and downstream of the injection wells (only downstream for Plant B; Figure 3). The configuration and parameters of the GWHP wells and piezometers are listed in Table 1.
The GWHPs have different operating characteristics because of the different needs of the buildings they climatize, referring in particular to the periods of activity, the type of climatization regime and the groundwater extraction rate. Plants A, B, and D operate only in the cooling regime, and Plant C also operates in the heating regime and is associated with the highest extraction rate. The features of the geothermal plants are summarized in Table 2. In the study area, there are also industrial and inactive wells (Figure 3). For these wells, accurate information is not available, and the only data are related to the extraction rate of wells W6 and W11 (17.0 L/s).

3. Material and Methods

3.1. Hydrogeological and Thermal Characterization

To understand the aquifer behavior and assess the flow and thermal properties required for the numerical simulations, the phreatic aquifer was characterized by thermal logs and continuous groundwater monitoring. Measurements in the wells and piezometers available in the study area were carried out, and the obtained results allowed the development of a conceptual hydrogeological and thermal model, on the basis of which a numerical model was implemented.

3.1.1. Thermal Logs

Thermal logs were performed at piezometers PzP1, Pz1, Pz2, Pz3, Pz4, and PzP8 (Figure 1) during four surveys from April to July 2021. Vertical temperature data were collected every 1 m until the bottom of the piezometers, both in the descending and ascending phases. The thermal profiles obtained (Figure 4) show that in the shallowest part of the aquifer, the piezometers located upstream of the GWHPs (PzP1, PzP8) are characterized by quite constant temperatures, while the piezometers located downstream of the GWHPs (Pz1, Pz3, and Pz4) show an increase in the water temperatures. This phenomenon is due to the restitution of warmer water by injection wells. The constant temperature recorded in the upstream piezometers allows the possibility of thermal feedback to be excluded. In Pz2, the temperature does not change as in the other downstream piezometers, indicating that the thermal plumes do not reach it. In Pz1 and Pz3, the thermal plume effect is particularly noticeable in the shallowest part of the aquifer, which intensifies during June and July due to the increase in exploitation. The thermal plume is particularly evident in the first 5–7 m below the water table, and then the aquifer temperature is rather constant along the vertical direction, with only slight variations in the last 4–5 m of PzP8. In the April survey, a different behavior was recorded in all the piezometers, but the overall trend identified in the piezometers was oriented toward a rise in temperature from April to July. The thermal logs also show that, excluding anthropogenic effects, there is a marked difference between the temperatures measured in the various piezometers, suggesting that the temperature distribution within the aquifer depends more on the horizontal position than on the depth. The cause of this behavior is probably due to the distance from the River Piave and Maè Stream, which strongly interact with groundwater. Another feature highlighted by the thermal logs concerns the extension of the heterothermic zone, defined as the layer in which seasonal temperature variations are recorded [33]. The heterothermic zone could reach at least a depth of 30 m, since the temperatures recorded by the deepest piezometers (Pz4, PzP8) varied throughout the measurement period. In addition, the aquifer does not appear to be directly affected by air temperature because the thermal profile shows constant values or changes as a result of the interception of the thermal plumes.

3.1.2. Continuous Monitoring

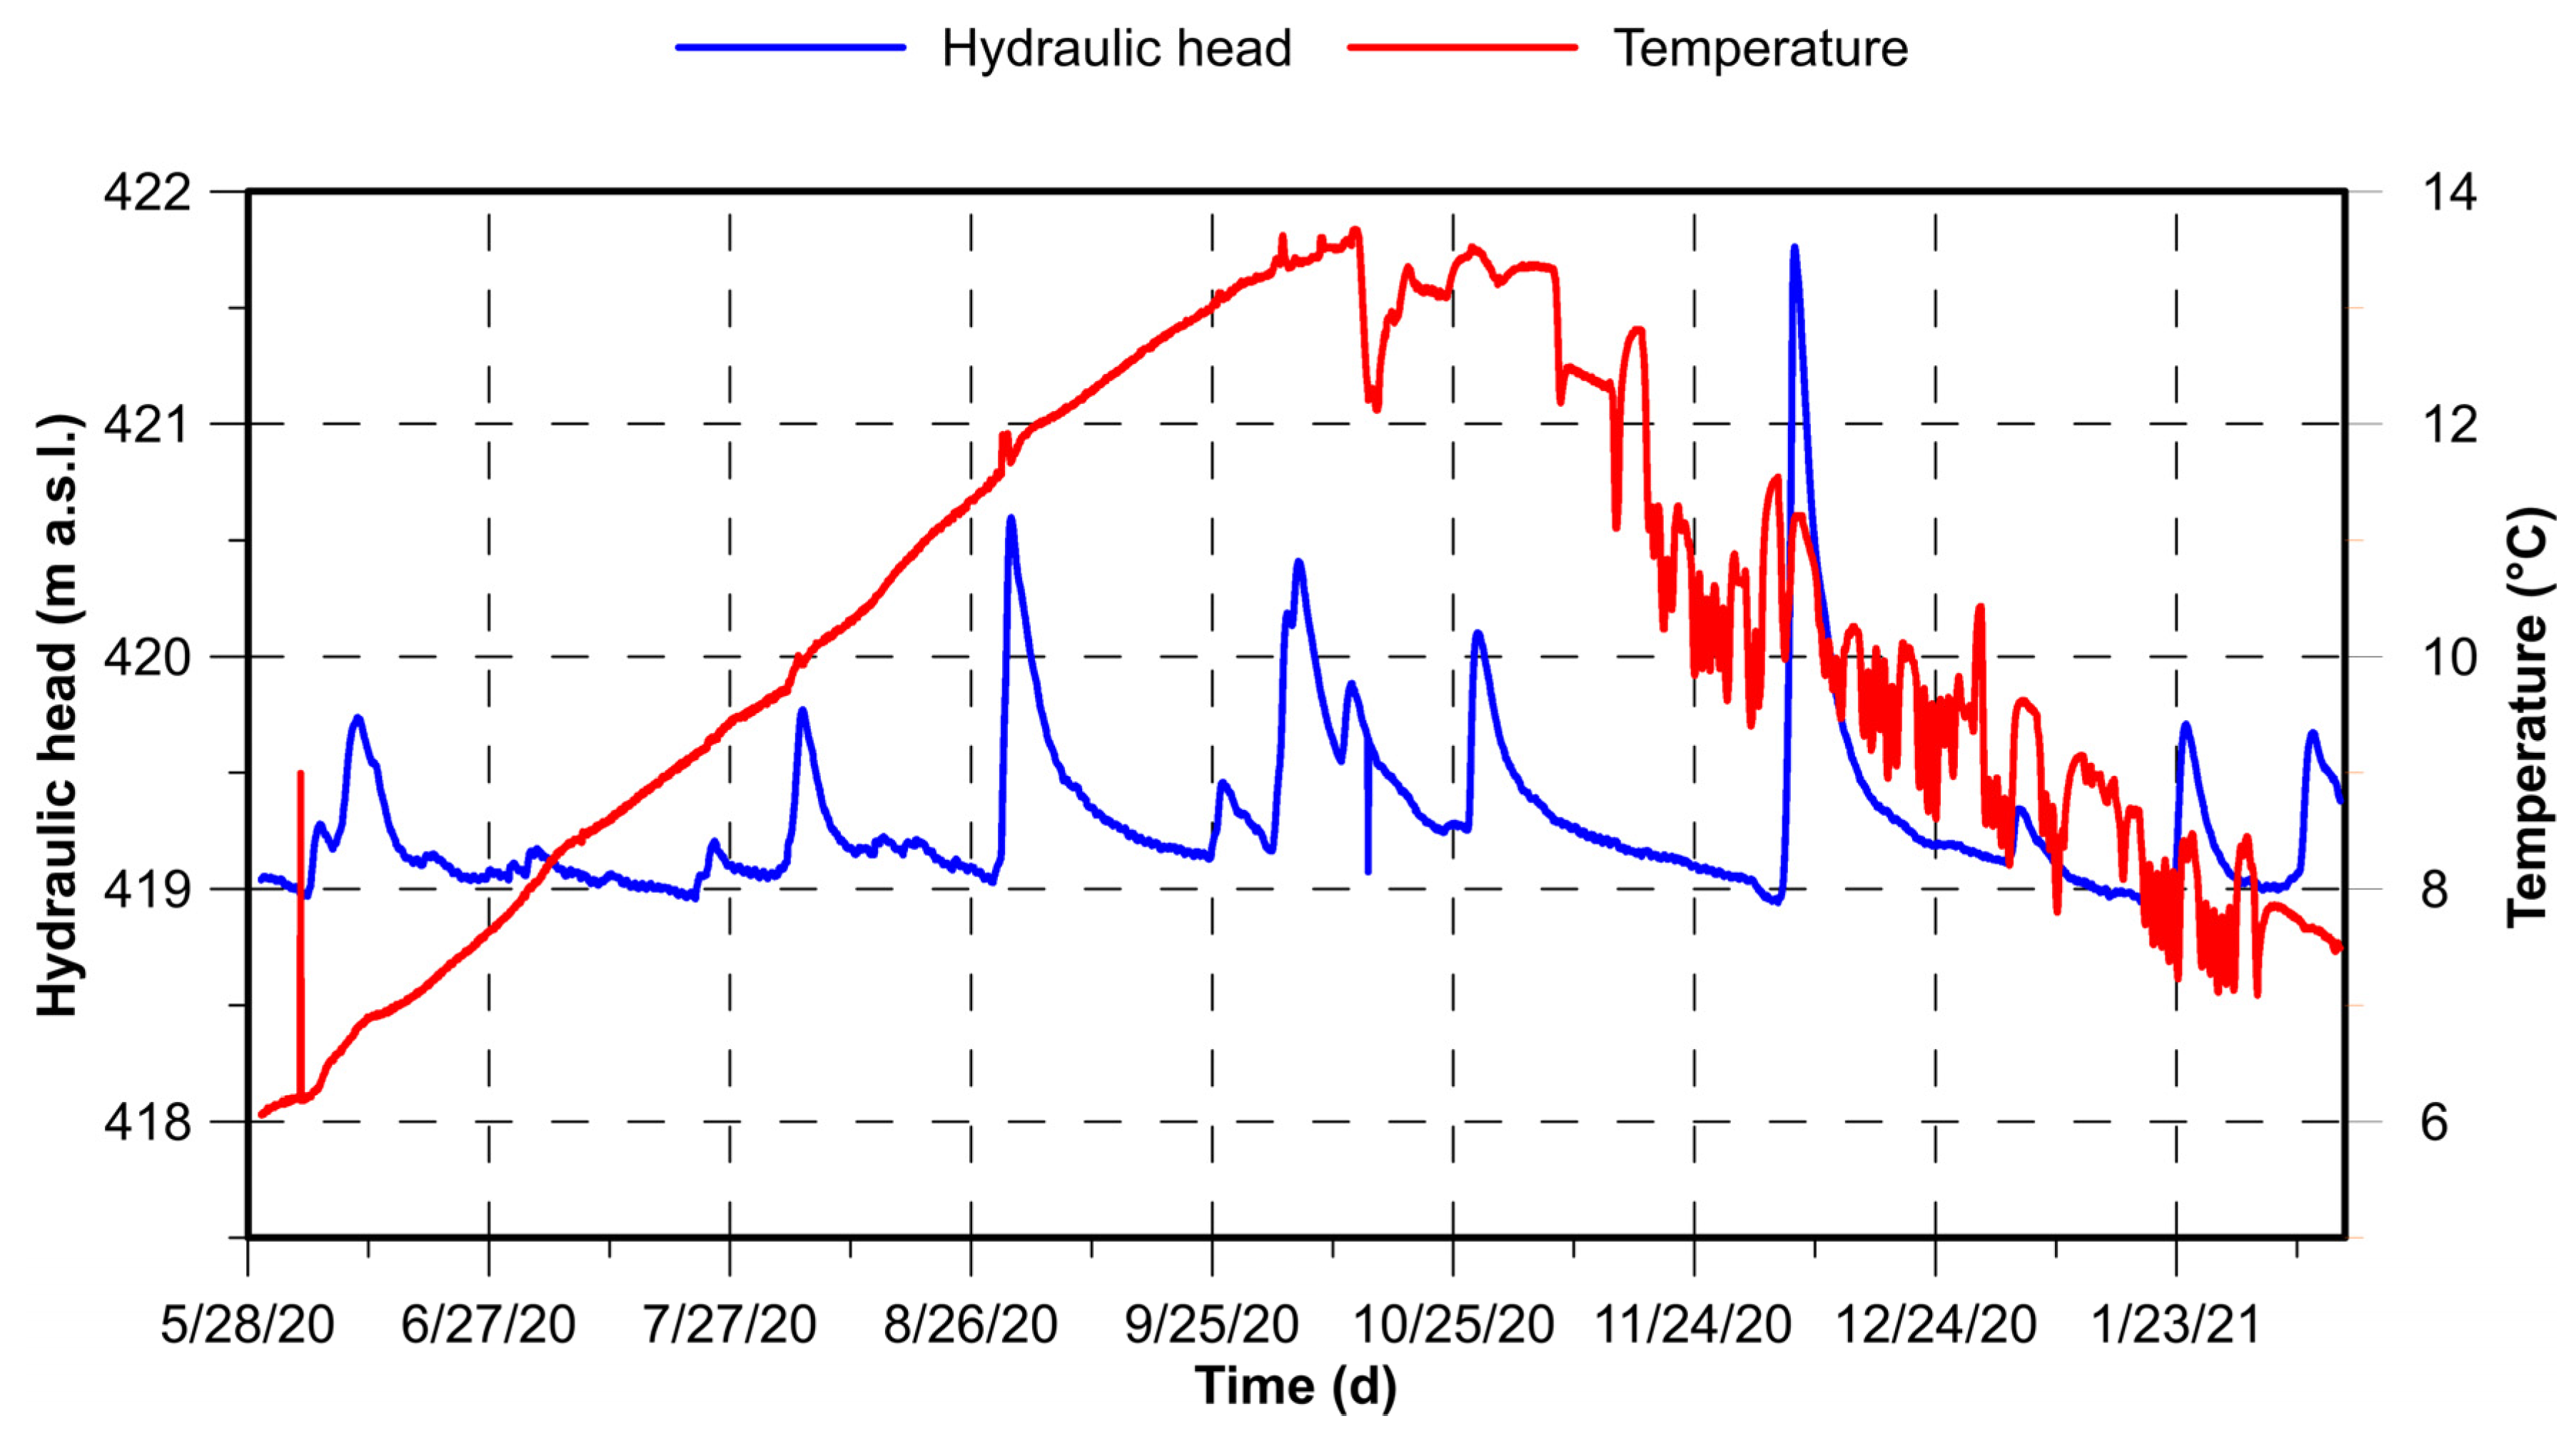
Continuous monitoring data of hydraulic head and groundwater temperature were recorded to verify the operation of GWHPs and their impact on the aquifer. Monitoring was carried out with a TD-Diver (Van Essen Instruments) with an accuracy of ±0.1 °C and ±1 cm for temperature and hydraulic head, respectively. The sensors were placed in extraction wells P1 and P3; injection wells S1, S3, and S4; and piezometers PzP1, Pz1, Pz3, PzP8, and Pz4 (Figure 1). The monitoring period and sensor depth for each well/piezometer are listed in Table 3. Data acquired in the extraction wells were not used due to the strong disturbance due to pumping, whereas data from injection wells provide insight into the operating characteristics of open-loop systems, such as periods of activity and the temperature of reinjected water. Continuous monitoring data acquired in the piezometers cover a period from 2012 to 2021, but sometimes the sensors were not submerged due to fluctuations in the water table. For this reason, the sensors were progressively deepened, and only in the period from 1 July 2019 to 12 February 2021 can the recorded values be considered homogeneous and reliable. Referring to this period, the minimum, average, and maximum values of temperature and hydraulic head recorded in each piezometer are shown in Table 4. Continuous monitoring indicates high natural variability in aquifer temperatures during the year, ranging from 4.1 °C to 14.7 °C (values measured in Pz3), and an average temperature of 10 °C. Furthermore, the effects of the thermal plumes were detected only in Pz4, the downstream piezometer related to the plant C with the highest exploitation (Figure 5). In the other downstream piezometers, the sensors were at such a depth that they could not intercept the plumes.

3.1.3. Hydrogeological and Thermal Conceptual Model

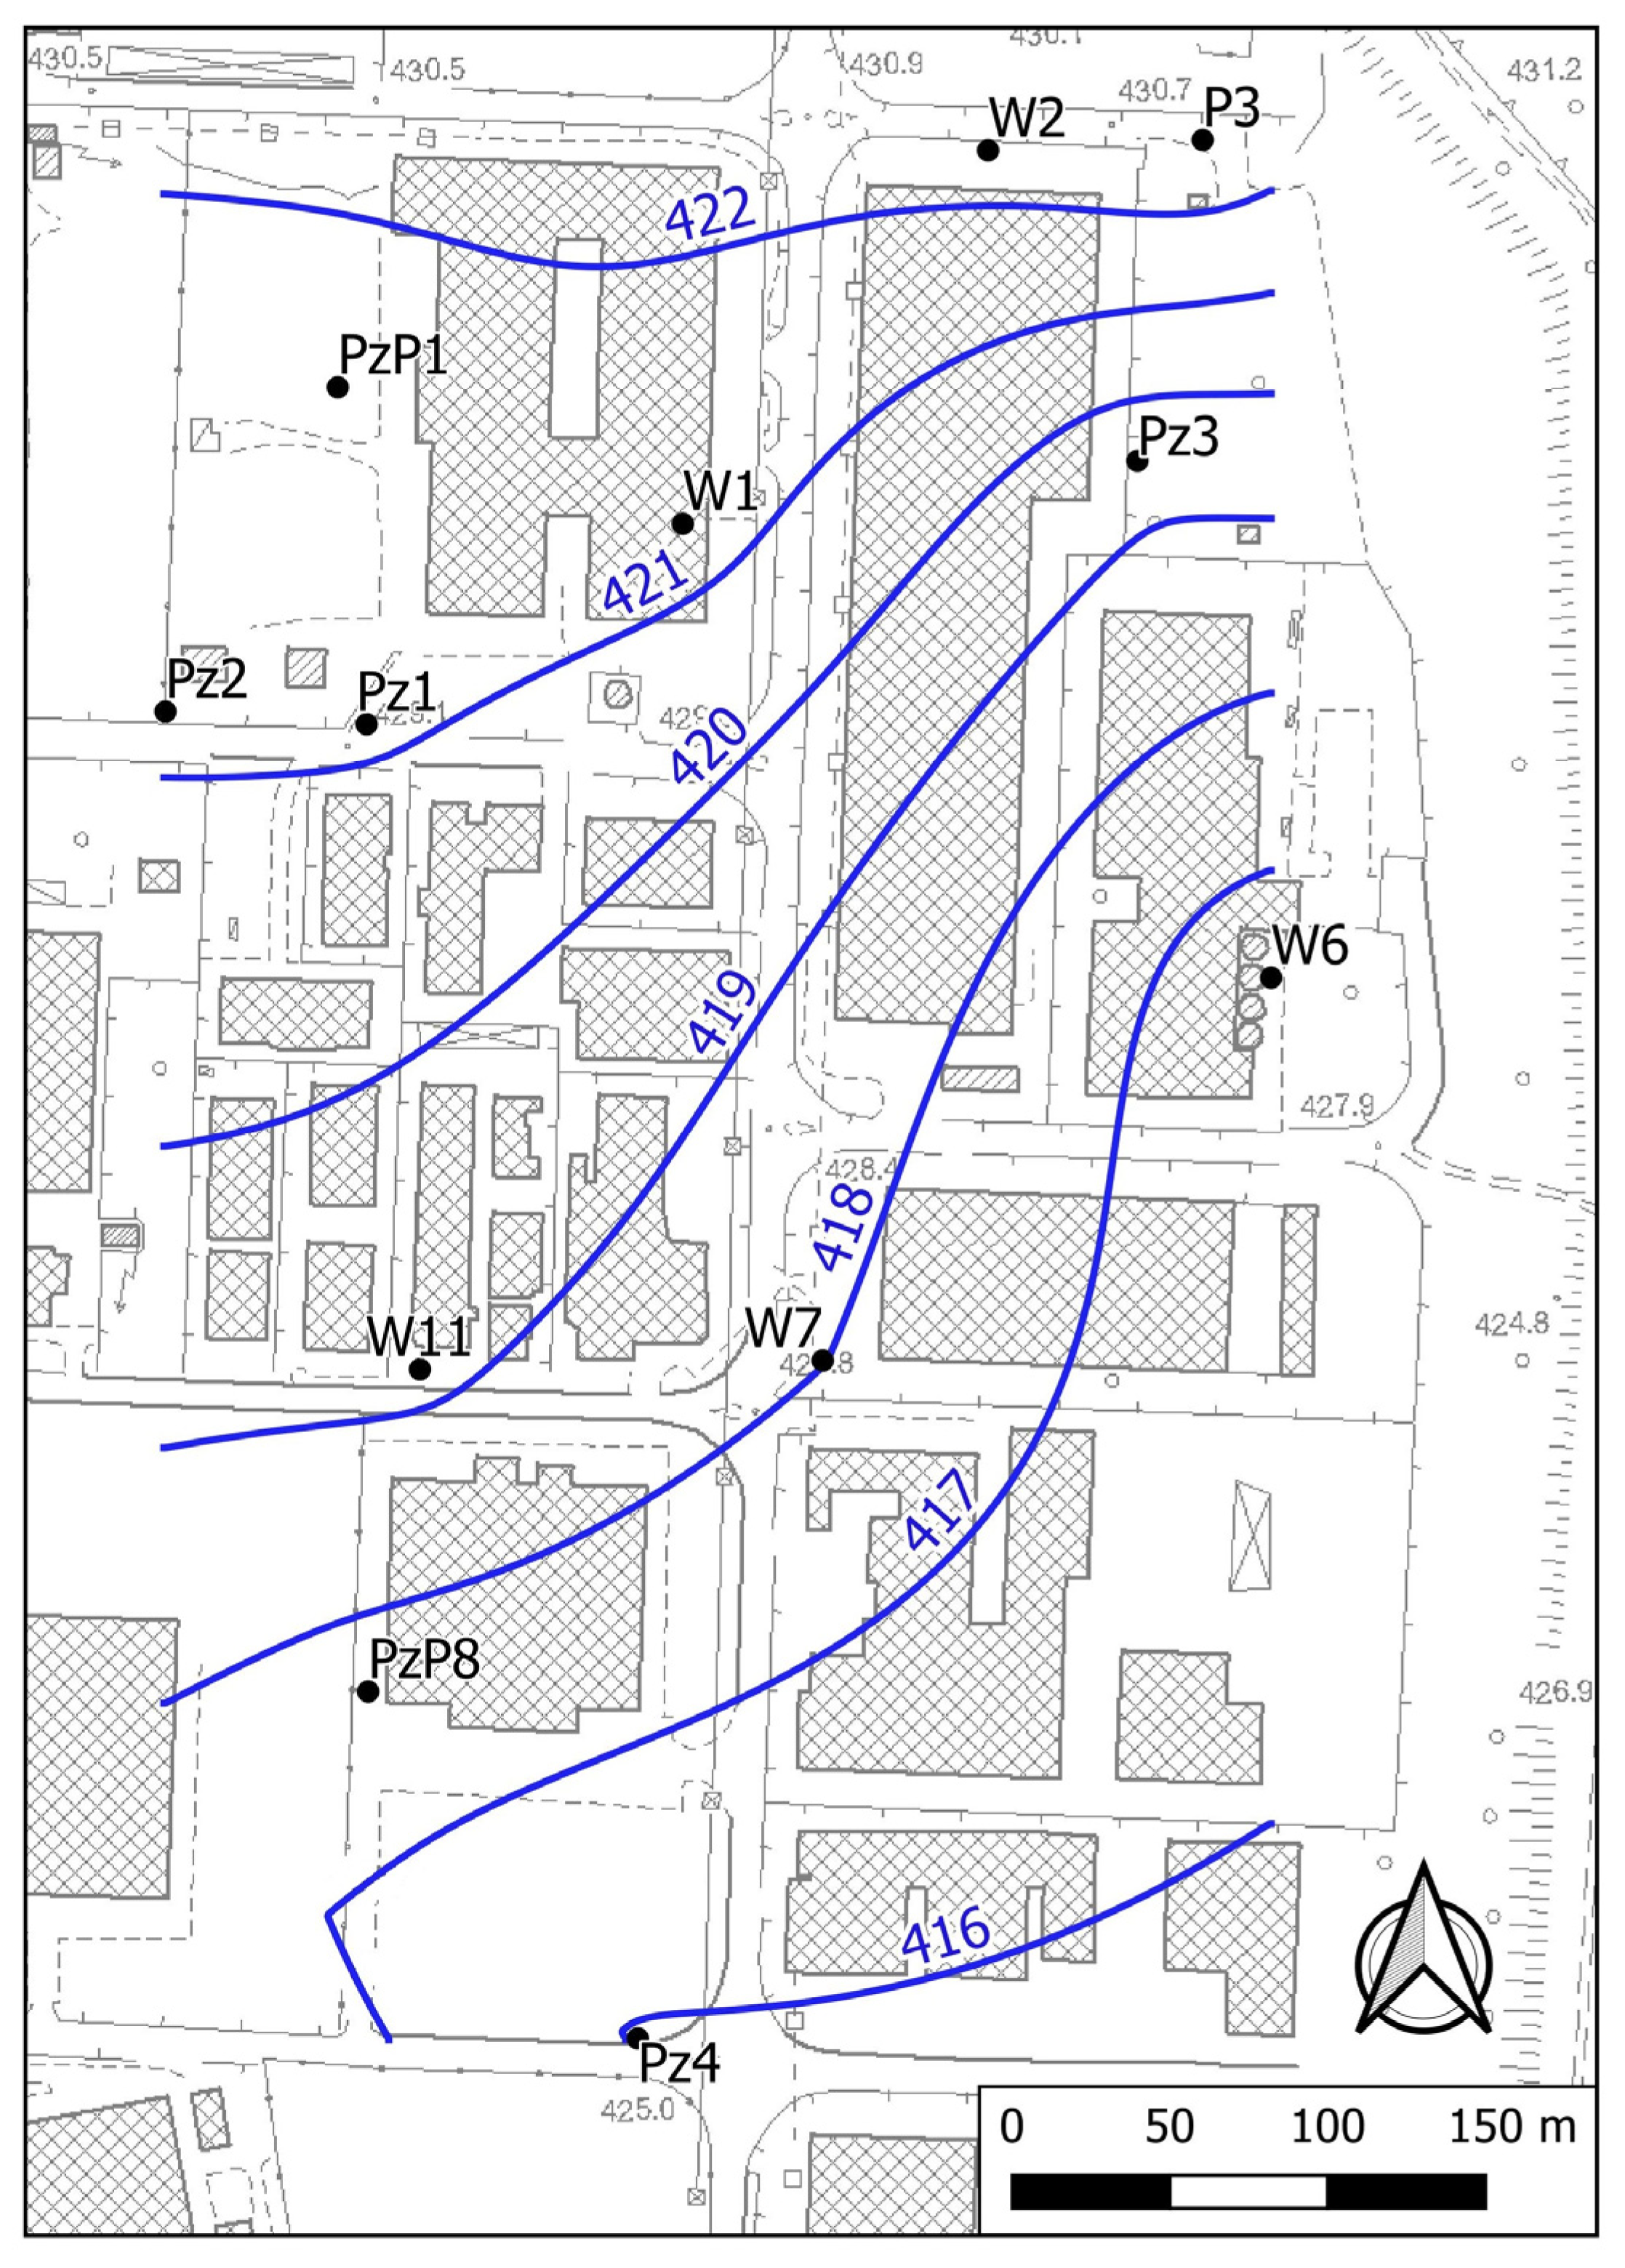
The measured hydraulic head was interpolated by a kriging algorithm [34,35], obtaining the isopotentiometric surface (Figure 6). The hydraulic head distribution indicated a groundwater flow direction from the northeast to the southwest and therefore from the Maè Stream to the Piave River. According to this evidence, in the study area, the Maè Stream can be identified as the main recharge element, while the Piave River presents a predominantly draining behavior.
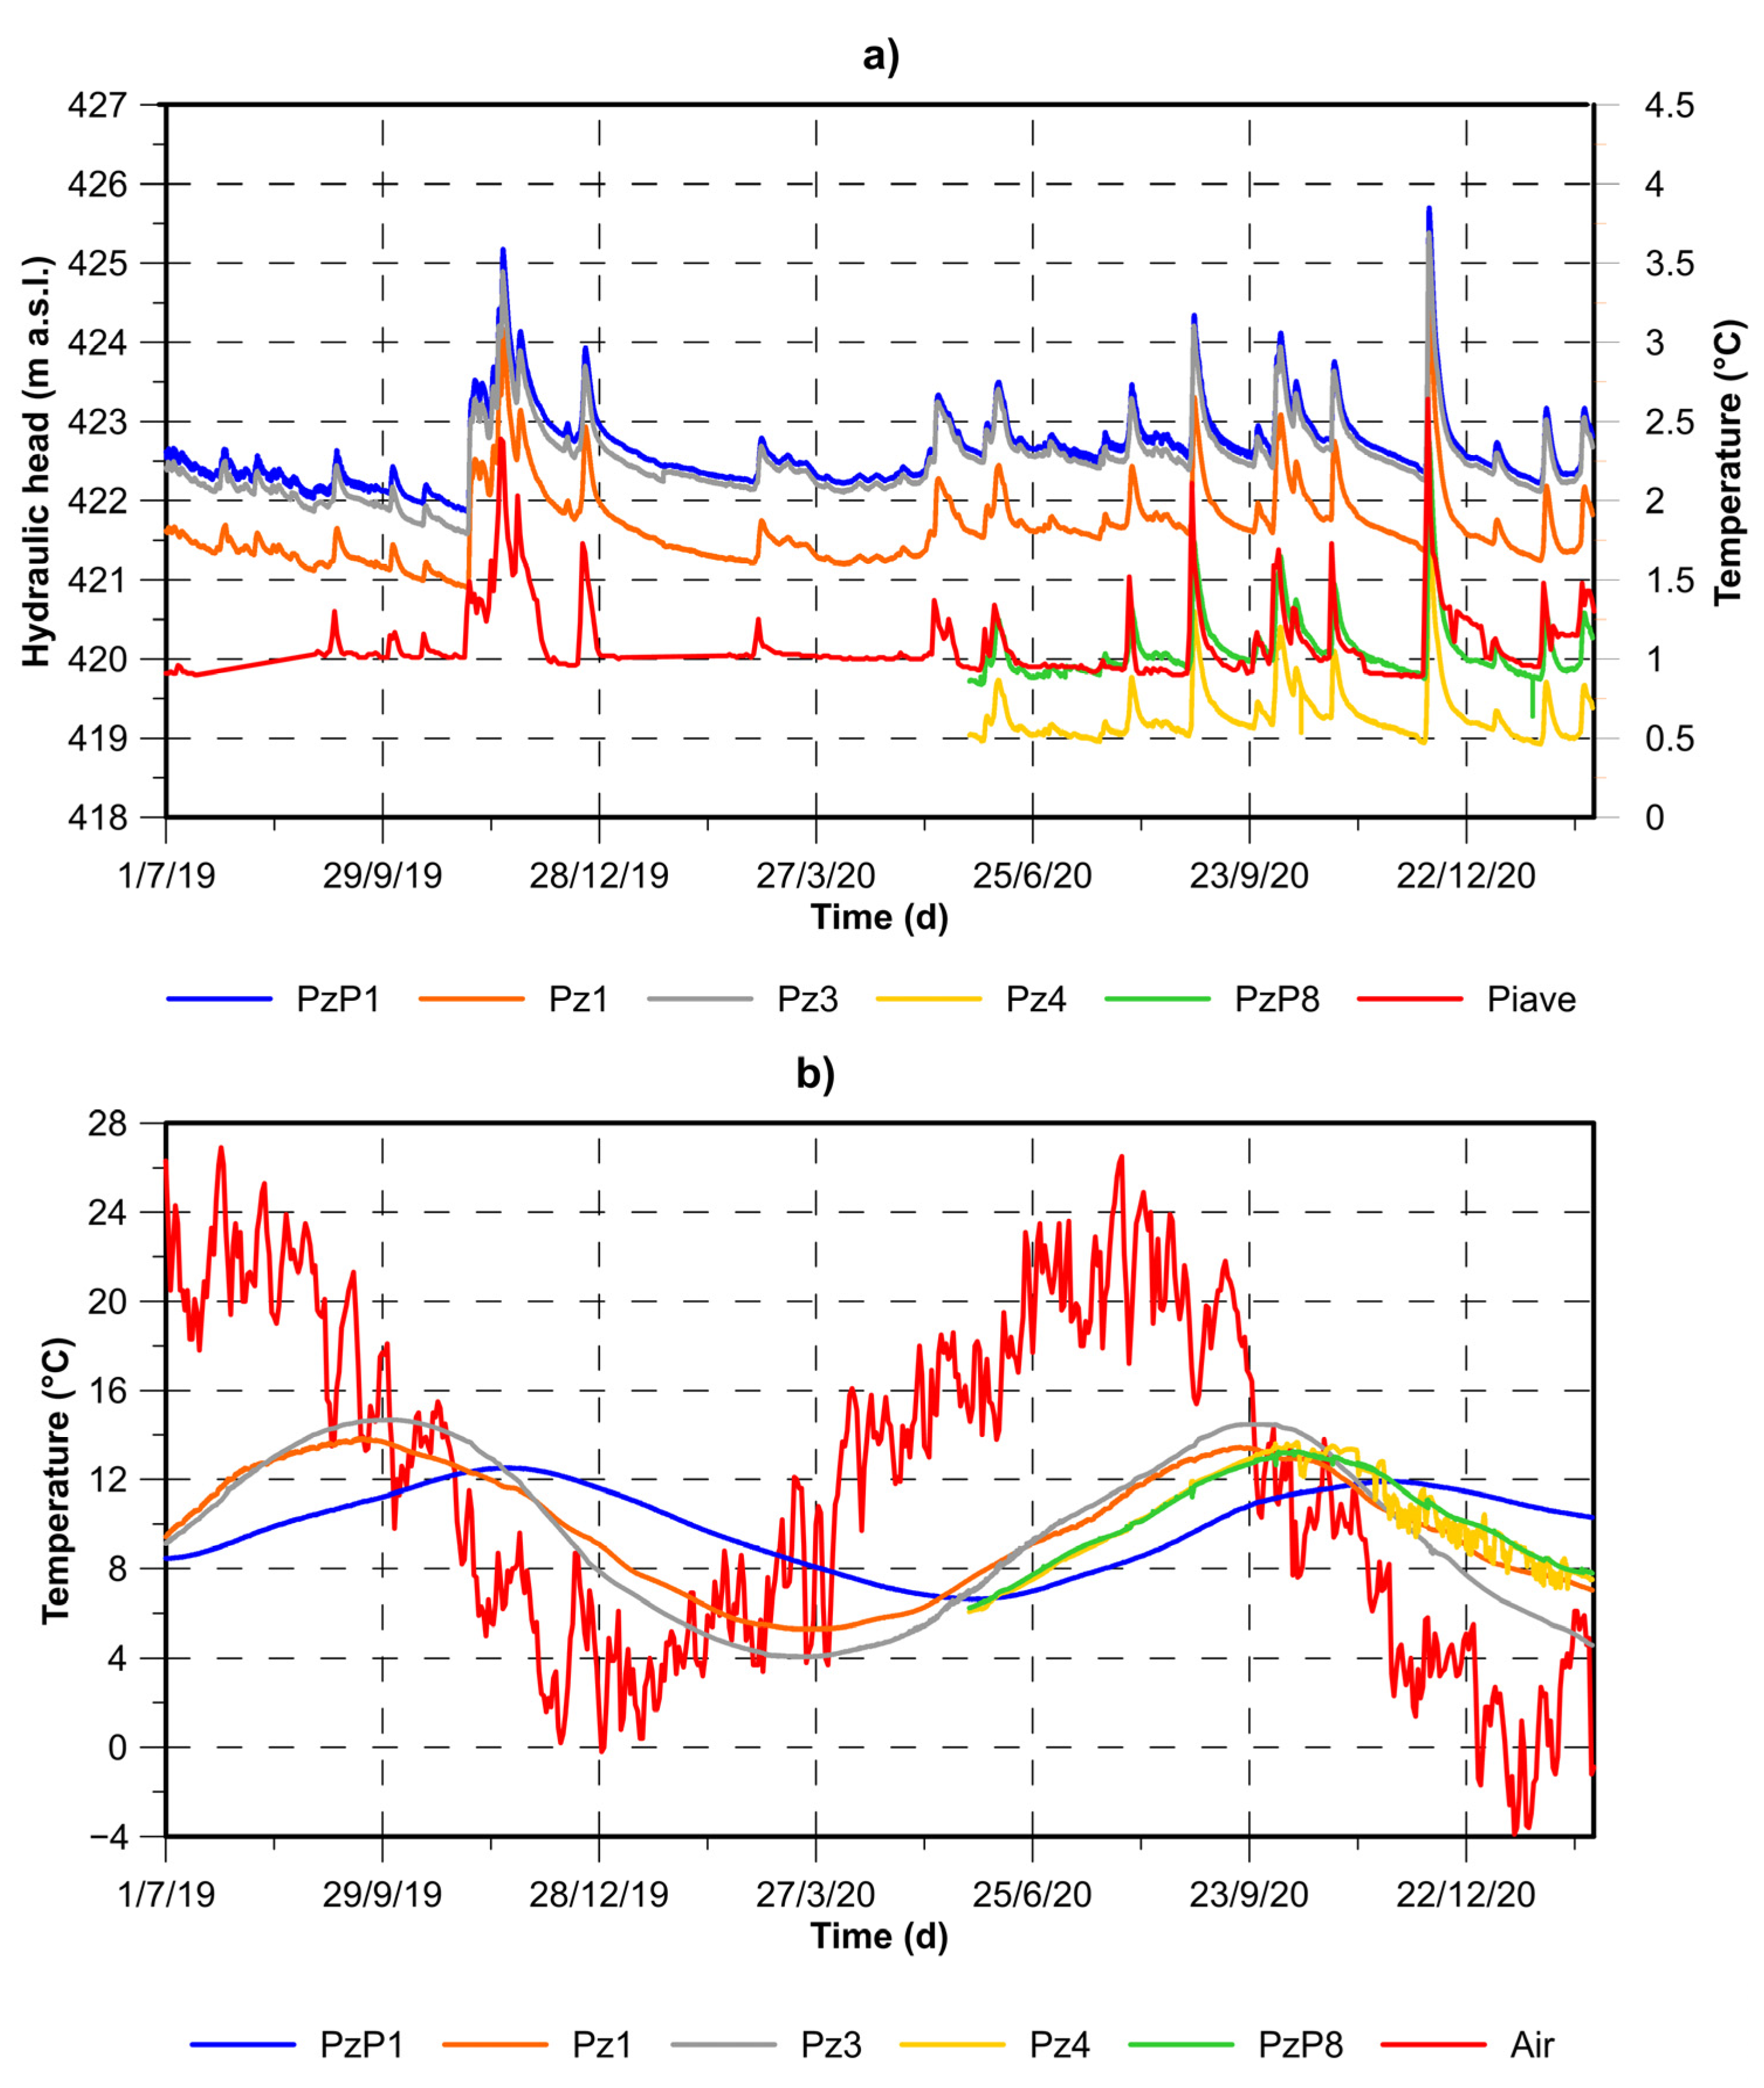
A comparison between the continuous hydraulic head data and the river stage of the Piave River at the Ponte della Vittoria monitoring station in Belluno shows a strong similarity (Figure 7a), confirming the relationship between rivers and the aquifer in the study area. The aquifer’s high hydraulic conductivity allows for rapid and efficient water exchange between surface waters and groundwater, and the aquifer regime is mainly dependent on the hydrological regime of the Piave and Maè Rivers. Instead, local rainfall should not affect the aquifer regime much, and its contribution is estimated to be less important than that of surface waters. In addition, the Villanova River terrace is an industrial area almost entirely asphalted and therefore waterproofed against infiltration.
Temperature monitoring indicated an average temperature of 10 °C but also showed a high temperature variability throughout the year, from approximately 4 °C to 15 °C. The daily mean air temperature measured at the Longarone weather station (Figure 1) was compared with the continuous monitoring temperature values recorded on the piezometers. Figure 7b shows that the aquifer temperature variations were mitigated and the peaks were delayed by approximately 70 days with respect to the air temperature of the Longarone station.
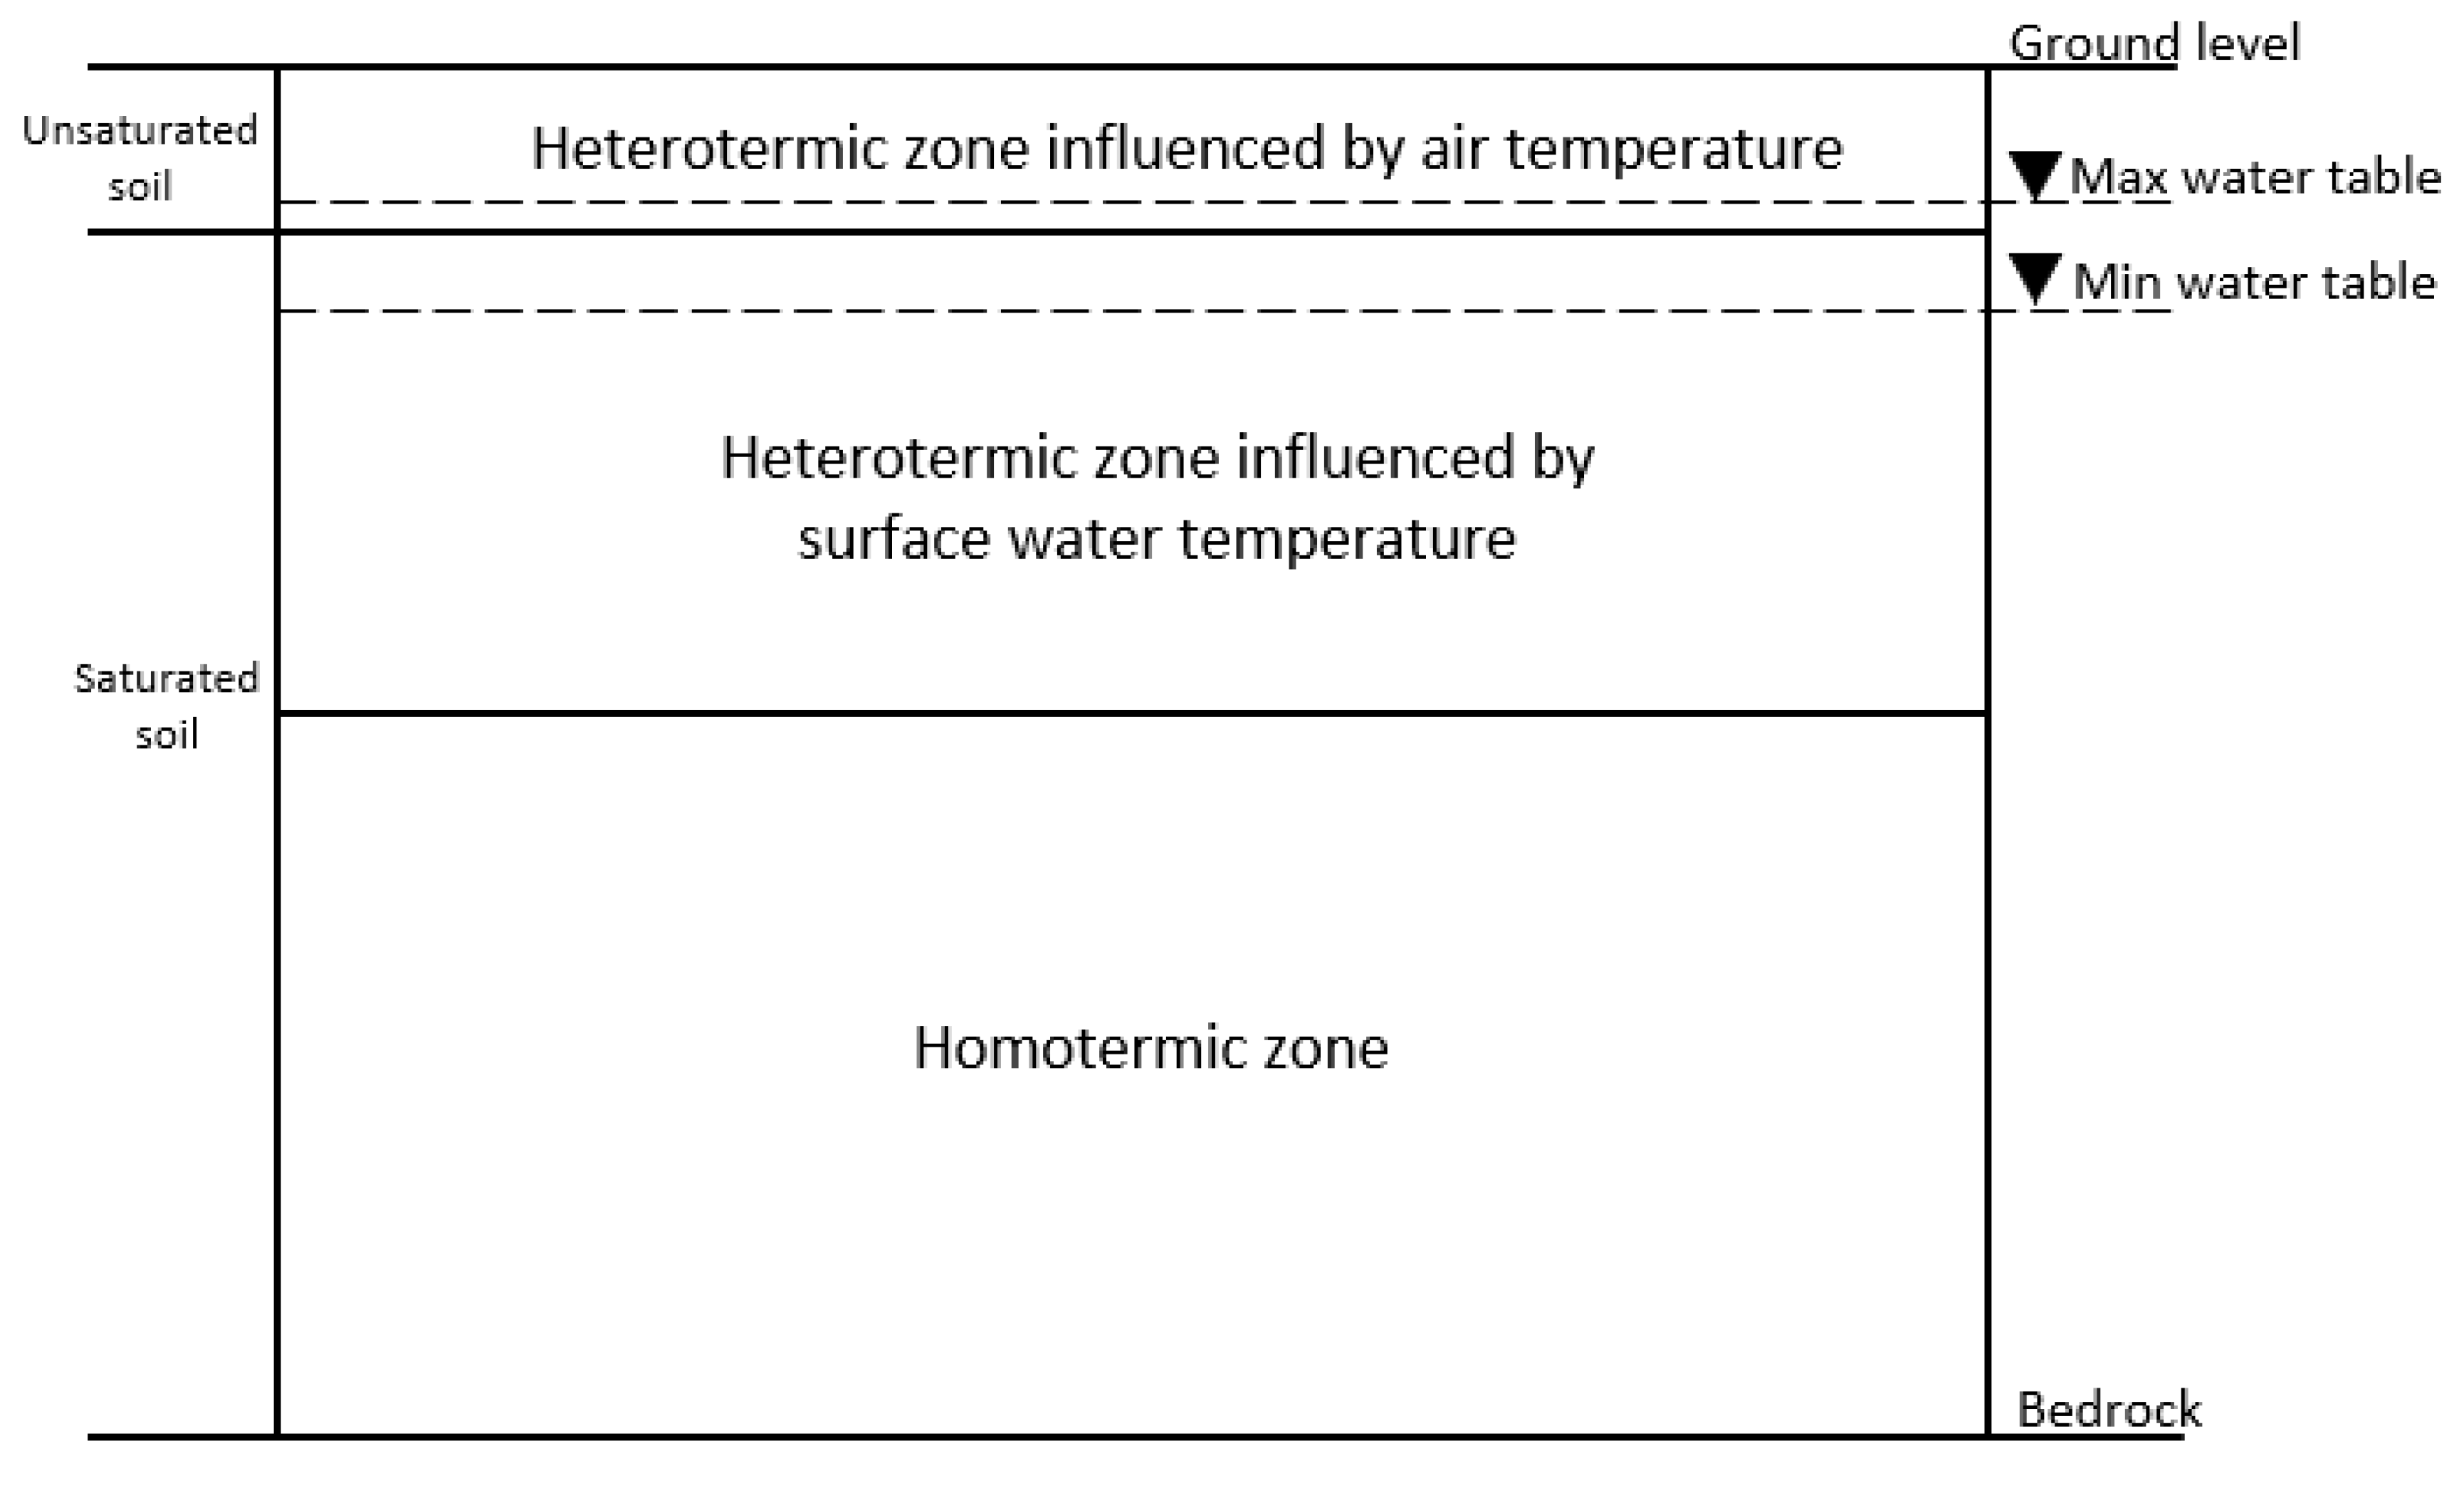
Furthermore, the sensors did not detect thermal plumes, except in the case of Pz4, while they were detected with thermal logs in the superficial part of the aquifer. These considerations suggest a conceptual hydrogeological and thermal model (Figure 8) as follows: (i) the hydraulic head of the phreatic aquifer is dependent on the Piave River and Maè Stream levels; (ii) the temperature of the phreatic aquifer is mainly affected by the exchange with surface water; (iii) the influence of air temperature affects only the unsaturated soil, while its effect on aquifer temperatures is negligible; (iv) aquifer temperatures can be generally considered constant in the vertical profile but quite variable over time depending on the proximity to the rivers (exceptions to this behavior may be due to local heterogeneity in the hydraulic conductivity of the aquifer); (v) thermal plumes generated by GWHPs affect only the first few meters below the water table; and (vi) it is assumed that a homothermic zone is reached at a certain depth, where the temperatures remain constant throughout the year. The depth of this zone is unknown, but it is certainly below 30 m.

3.2. Numerical Modeling

Numerical modeling was performed with FEFLOW 7.0 [27], a code allowing the simulation of flow and heat transport using the finite element method [36]. In the present study, calibration and predictive simulations were carried out, and they are summarized in Table 5. To calibrate the numerical model, six steady-state flow simulations (CFS1, CFS2, CFS3, CFS4, CFS5, and CFS6), one transient flow simulation (CFT), and one transient flow and heat transport simulation (CHT) were performed.
During calibration, hydraulic head and groundwater temperature were compared with those simulated using survey data for steady-state simulations and continuous monitoring data for transient simulations. To evaluate the quality of the results, three statistical indicators of common use in the assessment of numerical models were calculated [37]:
  • Normalized root mean square (nRMS), with a calibration target ≤ 0.1;
  • Nash–Sutcliffe efficiency (NSE), with a calibration target > 0.5;
  • RMSE–observation standard deviation ratio (RSR), with a calibration target ≤ 0.7.
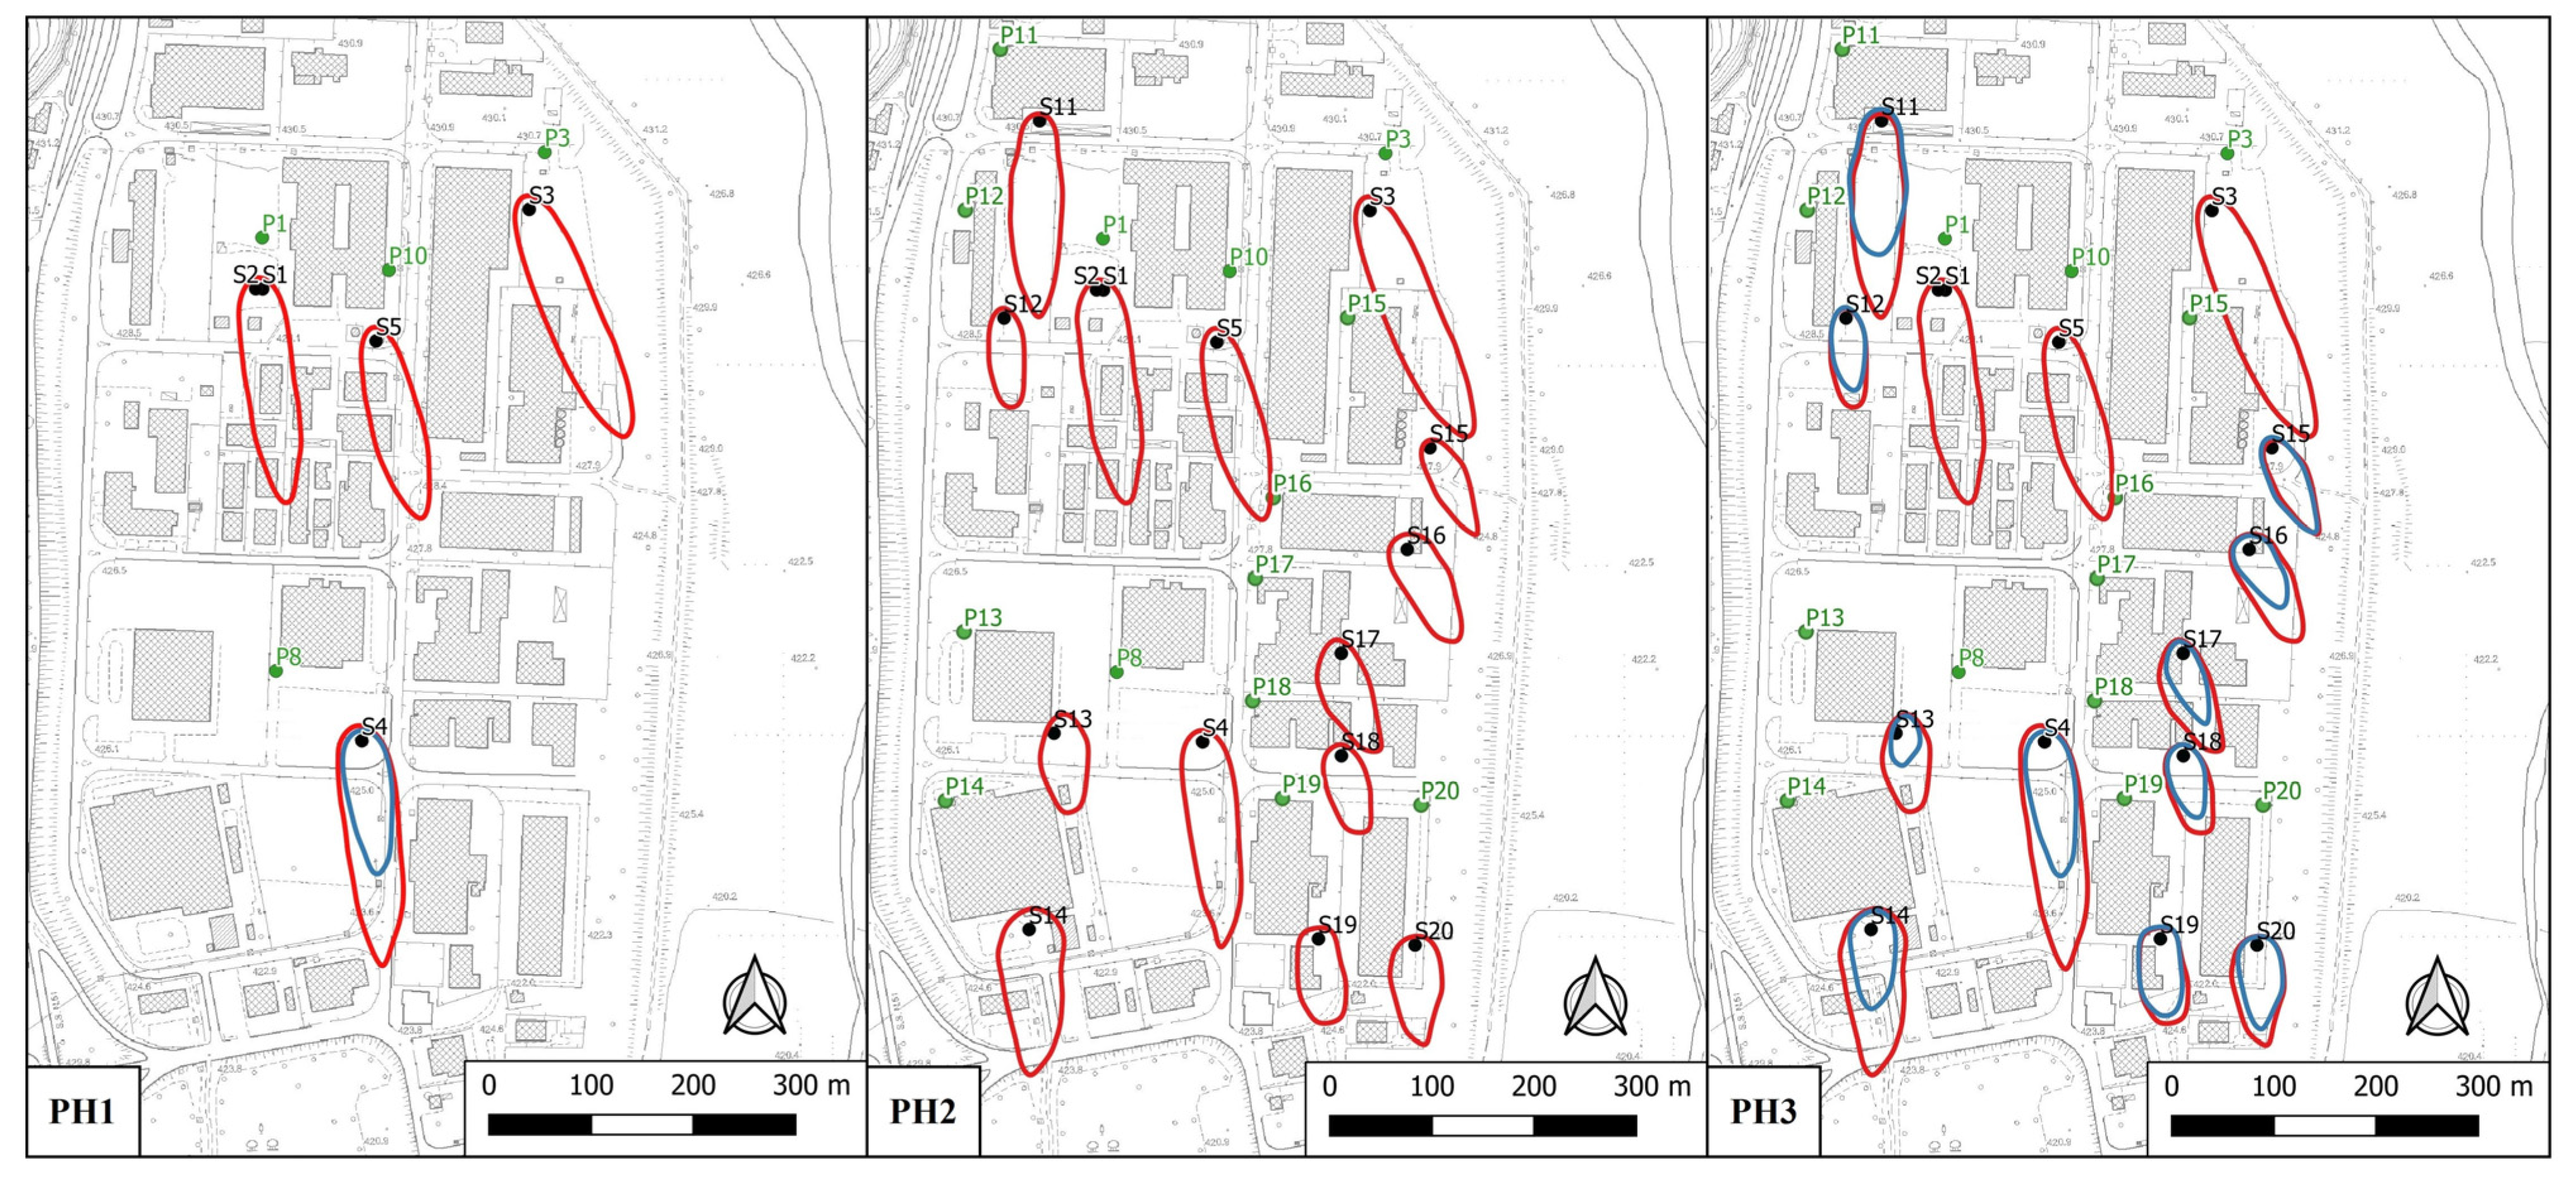
The calibration was initially manual and then refined automatically [38] with FEPEST 7.0 software, a graphical user interface of PEST 17.2 [39]. Once the model was calibrated, three predictive simulations (Table 5) were implemented to evaluate the long-term impact of GWHPs and the consequences of increased exploitation of the phreatic aquifer. PH1 simulates the functioning for thirty years of existing Plants A, B, C, and of designed Plant D; PH2 and PH3 simulate the functioning for thirty years of PH1 plants and of some new plants that are added, assuming the scenario in which the major buildings of the area decide to install GWHPs. In PH2, the new plants work only under the cooling regime, the one that is actually most widespread in the area, while in PH3, the new plants work both in the cooling and heating regimes. In PH2 and PH3, the plants added to those of PH1 are 10, for a total of 14 GWHPs (Figure 9). Each of these new systems is equipped with an upstream piezometer, an extraction well, an injection well, and a downstream piezometer, and the wells are placed to avoid interference between plants.

3.2.1. Discretization

The area of interest coincides with the Villanova River terrace and the surrounding alluvial deposits; therefore, the model domain is included between the rocky sides of the valley and extends a few hundred meters to the north and south of the industrial area, with a surface of approximately 2.4 km2. The bottom of the domain coincides with the bedrock, and the thickness of the sedimentary deposits was fixed at 150 m. Spatial discretization of the domain was carried out by 26,549 horizontal triangular elements and into 21 vertical slices, for a total of 584,078 triangular prisms. The finite element mesh was refined near the wells and piezometers of the A, B, C, and D plants. With regard to vertical discretization, the slices were horizontal planes variably spaced from each other, with greater distances in the deepest area of the aquifer (of which little information is available) and closed together in the more superficial area. In particular, the first two slices were separated by 10 m to avoid problems related to the complete desaturation of the first layer; those between 10 and 80 m were separated by 5 m, and those between 80 and 150 m were separated again by 10 m.
In transient simulations (CFT, CHT, PH1, PH2, and PH3), an automatic time-step control algorithm following the discretization scheme of the forward Adams–Bashforth/backward trapezoid rule was used (AB/TR) [27]. In addition, each simulation refers to a real-time period (Table 5): the steady-state simulations refer to a single day, the transient calibration simulations refer to a period of 409 days from 01/01/2020 to 12/02/2021, and the transient predictive simulations cover a period of 30 years from 01/01/2020 to 01/01/2050.

3.2.2. Parameterization

The subsoil of the study area is mainly composed of pebbles, gravel and sand, and in the absence of further information on stratigraphy, the reservoir was assumed to be a homogeneous and isotropic porous medium. This simplification was considered acceptable given the low variability of the alluvial deposits and considering that the model focuses on the shallowest portion of the aquifer, where the extraction and injection wells were drilled. For this reason, during parameterization, constant values were assigned throughout the domain for the flow and thermal properties (Table 6). In particular, the hydraulic conductivity (K) was considered equal in three dimensions (Kx, Ky, and Kz), and taking into account the well test results ranging from 2.7 × 10⁻² to 1.0 × 10⁻³ m/s, the starting value of K was set at 1.0 × 10⁻³ m/s. For the other flow parameters, specific yield (Sy), specific storage (Ss), in-transfer rate (ITr), and out-transfer rate (OTr), the default values proposed in FEFLOW were assumed to be starting values (Table 6). Regarding the thermal properties, the parameters of the solid material were set considering the values indicated in the German VDI tables, often used as standards in Europe [40]. In the presence of saturated gravels, a thermal conductivity (λs) of 1.6–2.5 W·m−1·K−1 and a volumetric heat capacity (Cvs) of 2.2–2.6 MJ·m−3·K−1 were suggested; therefore, the starting values were set at 1.8 W·m−1·K−1 and 2.4 MJ·m−3·K−1, respectively. Similar to hydraulic conductivity, thermal conductivity was also considered homogeneous and isotropic throughout the domain; therefore, the anisotropy of the thermal conductivity of the solid (acs) was set to 1. The effective porosity (ne) was set equal to Sy, as in an aquifer the water component that can be drained under the action of gravity approximates the value of the effective porosity. Other starting thermal properties, such as the thermal conductivity of the water (λw), the volumetric heat capacity of the water (Cvw), the longitudinal dispersivity (αL) and the transverse dispersivity (αT), were set to the default parameters suggested in FEFLOW (Table 6). These parameters were used as starting values in the calibration process, whereas the calibration results were considered in the predictive simulations.

3.2.3. Initial and Boundary Conditions

Iterative resolution of flow and heat transport equations requires defining an initial distribution of the hydraulic head and temperature, respectively. For steady-state flow simulations, to avoid problems related to desaturation of the first layer, the initial head was set equal to 500 m a.s.l. on the entire domain. In contrast, in transient simulations, the values of the initial distribution strongly affect the numerical solutions, and an accurate estimation of the initial conditions is needed. For this reason, the initial distribution of the hydraulic head used in the transient simulations coincided with the resulting hydraulic head of CFS1, which refers to 1 January 2020, the first day of the transient simulations. The initial temperature in the transient heat transport simulations, instead, was set to 8.8 °C throughout the domain, averaging the temperature values recorded in the piezometers on 1 January 2020
To constrain the flows of fluid and heat into and out of the domain, it was also necessary to define the boundary conditions (BCs). FEFLOW automatically assigns a second-type (null flow) condition to domain boundaries on which no other conditions are specified, and the aquifer recharge due to the infiltration is considered a property of the material, but it can be regarded as an areal Neumann BC (2nd kind). This condition was imposed on the whole first layer of the model, assigning a constant value of 462 mm/year. This value was obtained by applying a potential infiltration coefficient of 30%, consistent with the lithology of the subsoil, to an annual average precipitation value of 1541 mm/year derived from the rainfall data of the Longarone station (1 January 2010–28 February2021). This condition was unchanged for all the simulations.
A 2nd kind of point boundary, called a multilayer well in FEFLOW, was applied to simulate groundwater exploitation through wells where the screen interval spanned more than one layer. This boundary condition was used to represent wells with a single screen interval; therefore, multiscreen well P1 was considered as a well with a single screen interval intersecting all its screens, from 6 to 42 m deep. Among industrial wells (W6 and W11), a screen interval from 5 to 40 m from ground level was estimated based on local knowledge, while the other wells were not implemented in the model because they were inactive or lack information. All extraction wells hypothesized for GWHPs in the predictive simulations had a screen interval that extended from 15 to 30 m from ground level. The extraction rates of the added plants were assigned based on a linear relationship calculated between the volume of the existing building and their water needs.
The water restitution performed by the injection wells (3 m deep) was simulated through a 2nd kind of point boundary (Well-BC in FEFLOW) applied in the first slice. Return flow rates were assumed to be the same as those of GWHP extraction wells. An exception was Plant A, where the flow rate was divided between the two injection wells S1 and S2 (Figure 1).
The river–aquifer interaction was represented by a Cauchy (3rd kind) BC (River in FEFLOW) on the first slice and set along the course of the Piave River and Maè Stream. The values associated with this BC describe the river level, and they were initially obtained from lidar data and subsequently calibrated to reproduce the monitored hydraulic head. In the predictive simulations, it was assumed that in the future, the rivers will behave in a similar way to the current one; therefore, this BC repeats the 2020 trend for 30 years.
At the southern edge of the domain, a Dirichlet (1st kind) flow BC on all slices to define outflows was set, imposing a hydraulic head coinciding with the river level at the exit point of the domain.
Regarding the temperature BCs, during the calibration simulations, a Dirichlet heat BC was applied at the injection wells, imposing the temperature recorded in continuous monitoring during the activation of the GWHPs. For predictive simulations, the FEFLOW open-loop plugin was used [41,42,43]. This plugin relates the temperature at extraction and injection wells by applying a differential, making it possible to evaluate the impact of GWHPs considering the maximum variations allowed by Italian legislation. In the cooling regime, a water heating of 5 °C was set, while for the heating regime, a water cooling of 2 °C was set. The thermal delta in the heating phase is lower than that in the cooling phase because in the winter months, aquifer temperature is naturally approximately 4 °C, and cooling of over 2 °C would not be possible; furthermore, this value is consistent with the temperature variations recorded by Plant C, the only one operating in both regimes (Figure 7b). The activation over time of the GWHPs in the calibration simulations was derived from the monitoring data acquired in the injection wells. The period of operation in predictive simulations was set on the basis of their real periods of activity (Table 2), while for the hypothesized plants, the period of activity in the cooling mode was assigned from 15 April to 15 October and the heating one for the rest of the year; at all times, the GWHPs continuously worked.
The last BC applied was used to represent the influence of air temperature on the aquifer; therefore, a Neumann temperature boundary (2nd kind) was set on the first slice of the domain, assigning the daily temperature recorded at the Longarone station.

4. Results and Discussion

4.1. Calibration Simulation

Calibration targets were selected from the sets of discontinuous and continuous monitoring data available according to the type of simulation: (i) steady-state flow, (ii) transient flow, or (iii) transient flow and heat.
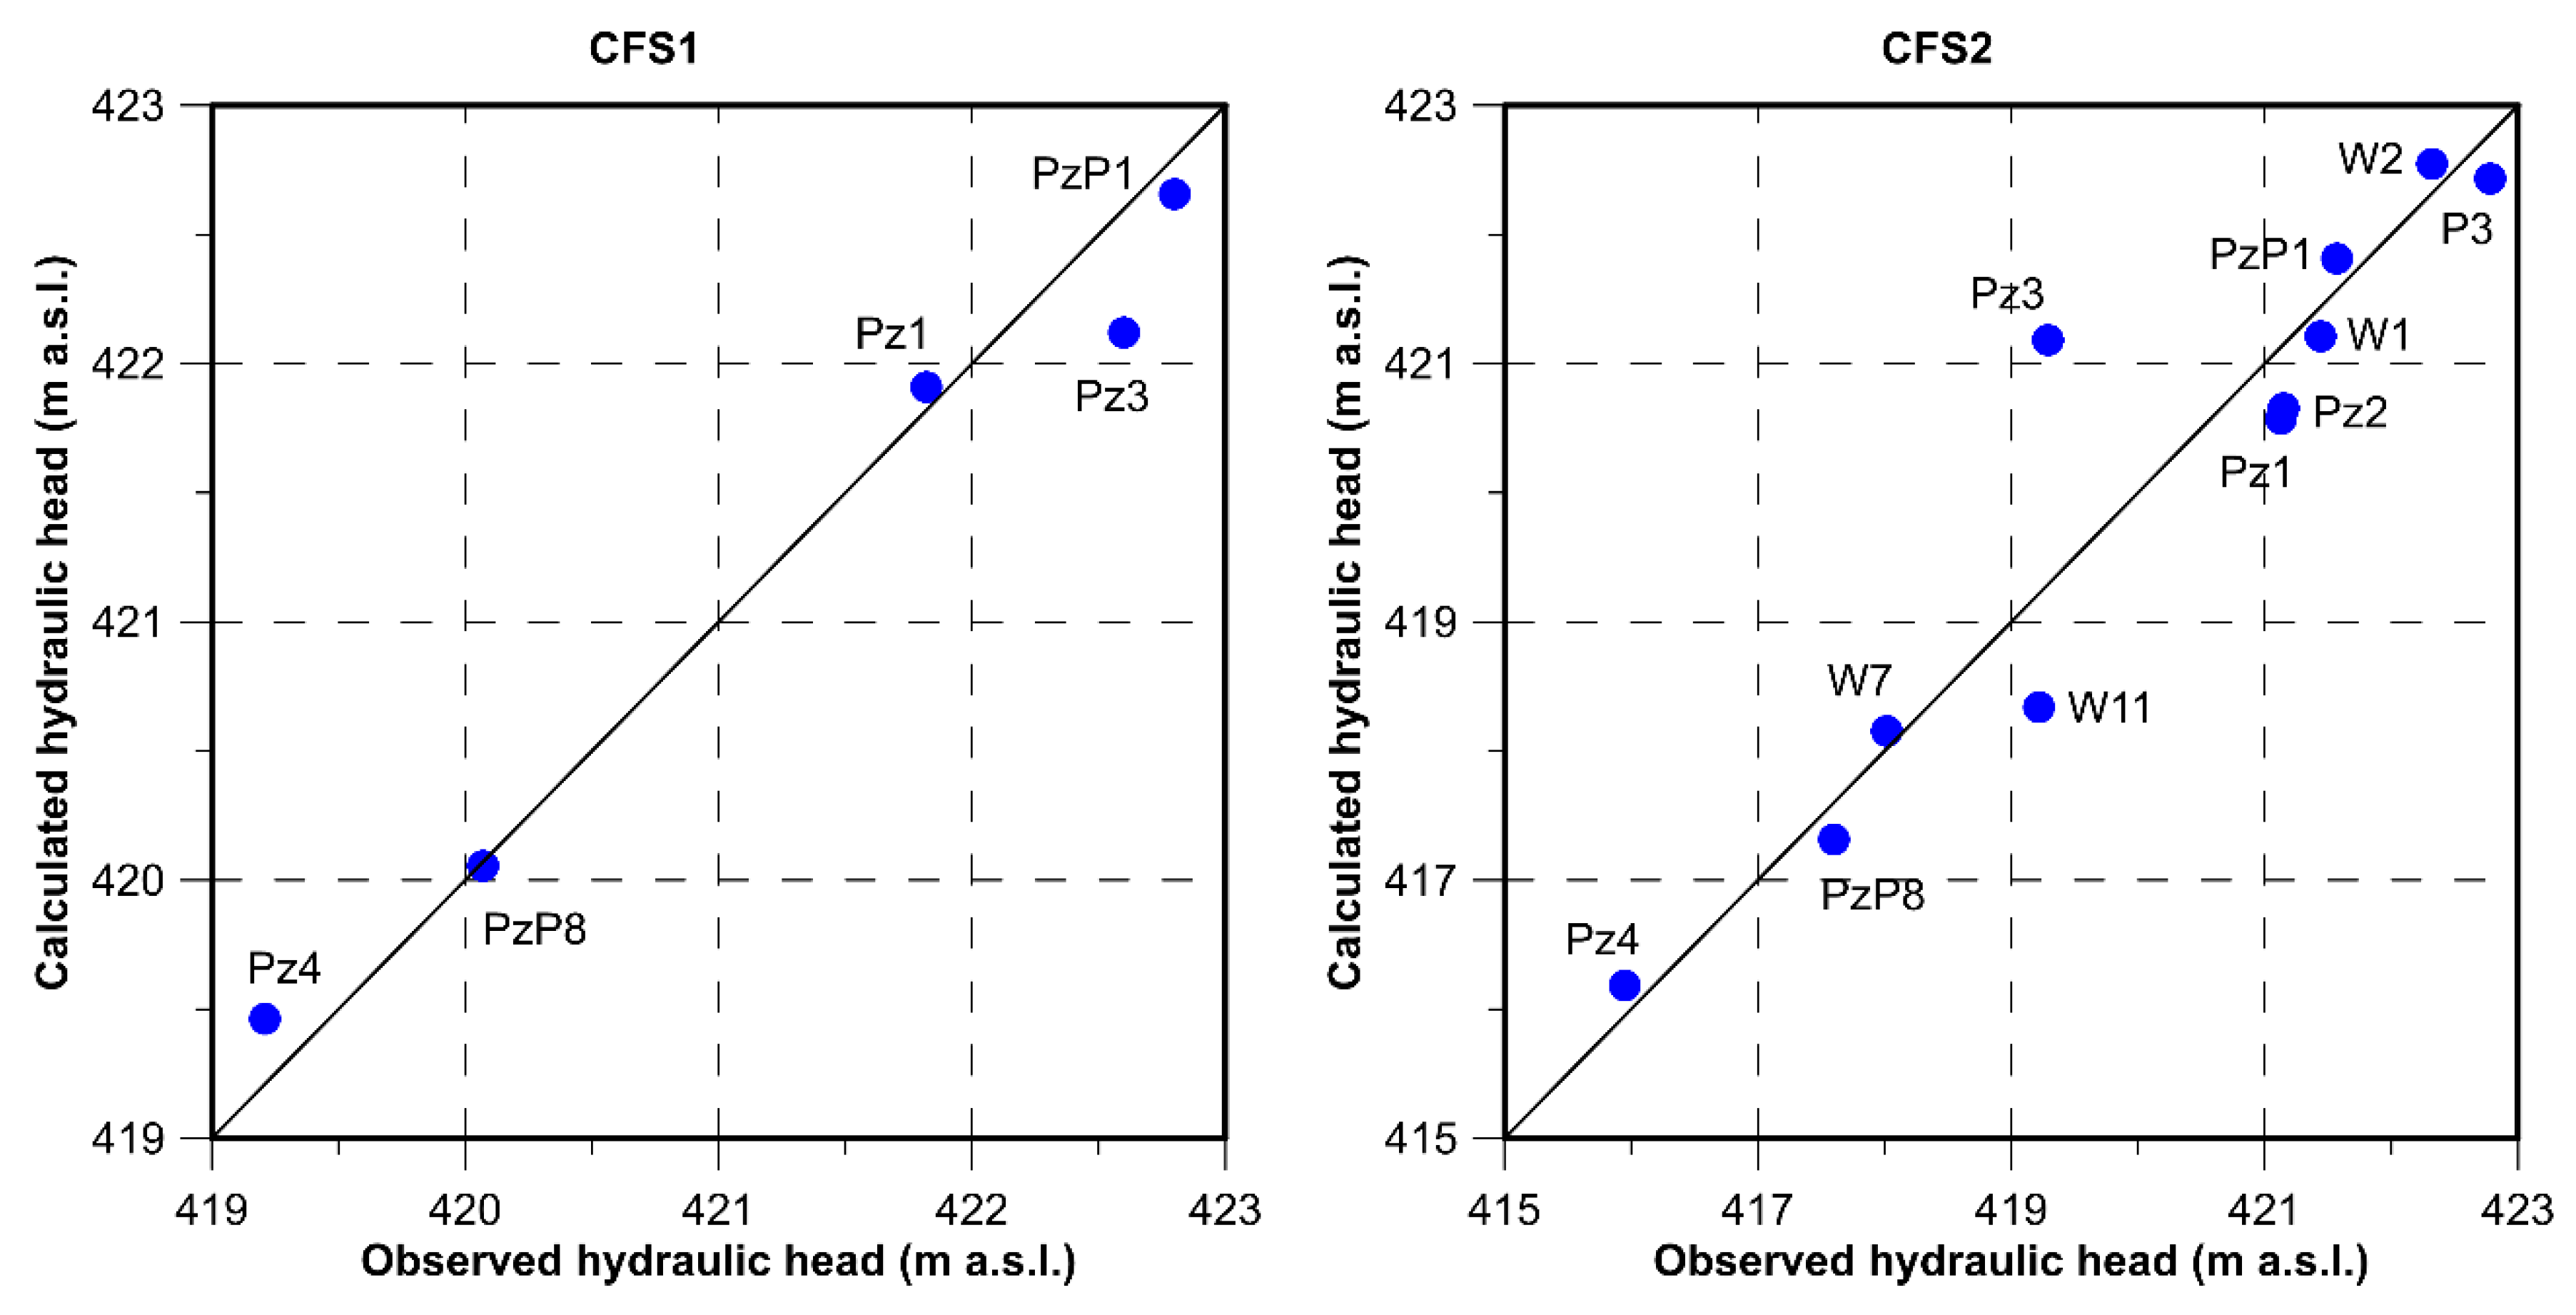
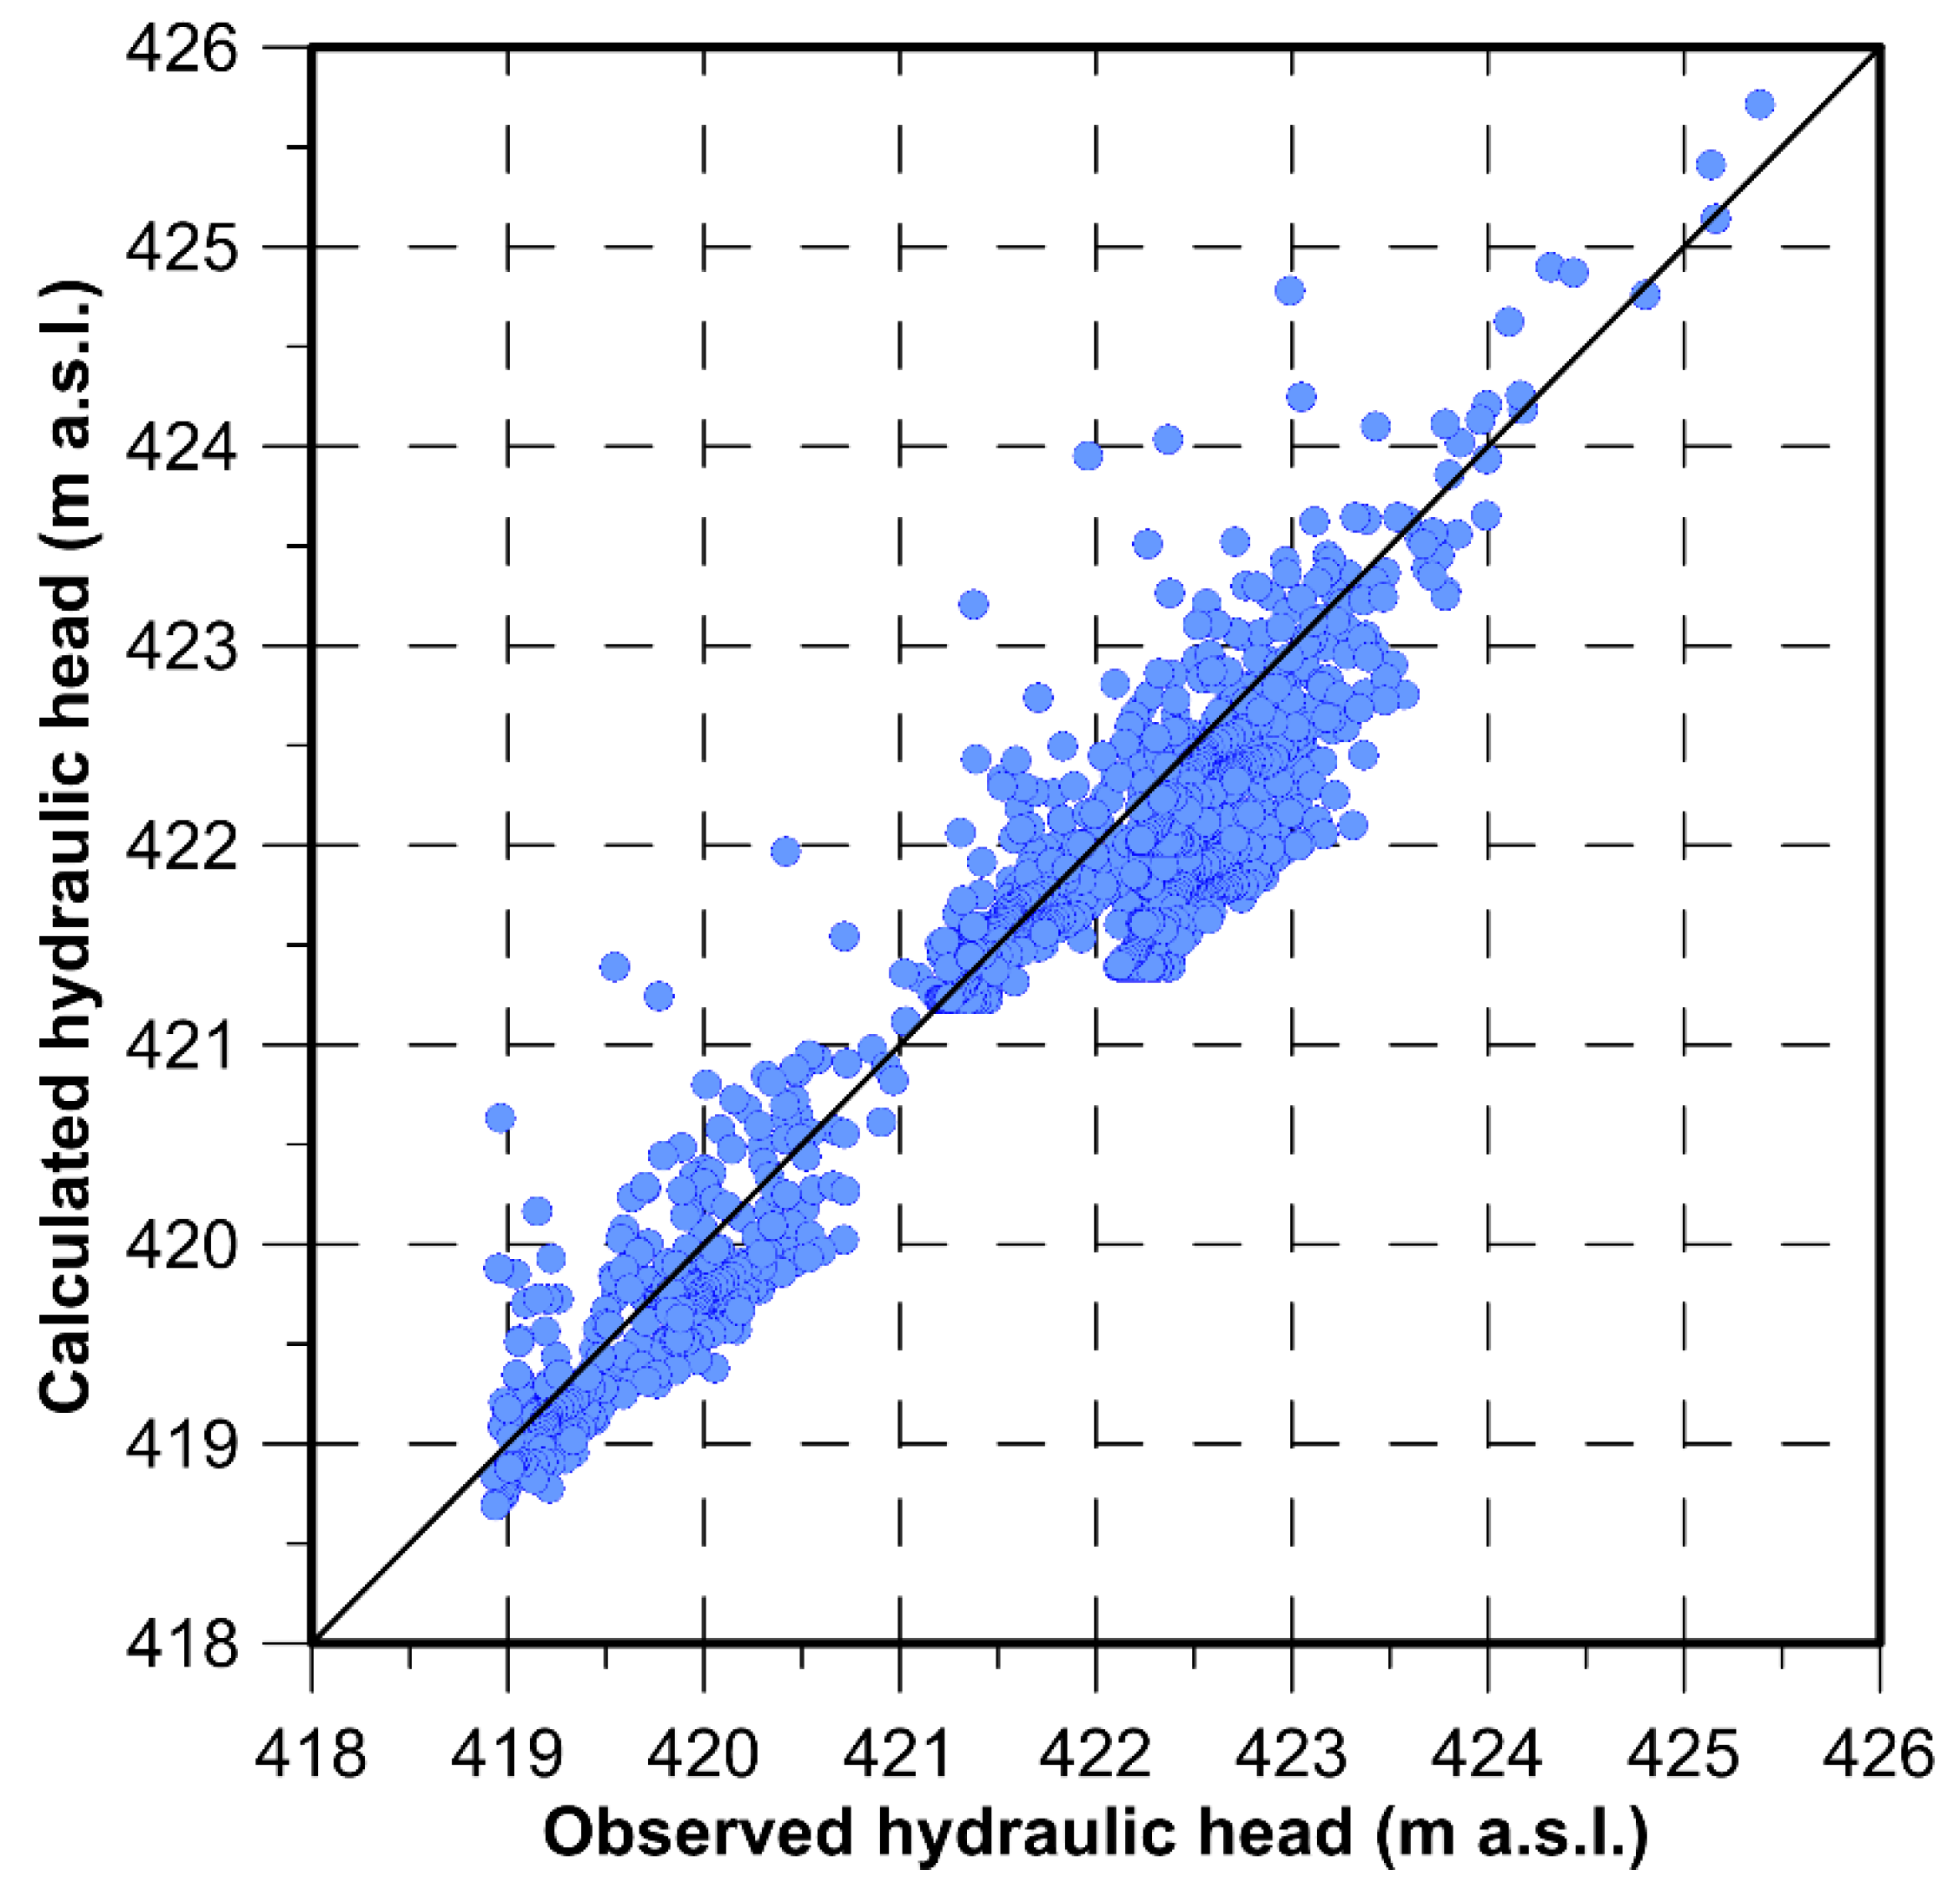
Manual calibration of steady-state flow simulations adjusted the river stage gradient in the model domain and optimized hydraulic conductivity, whose value was evaluated at 1.0 × 10⁻² m/s. These simulations confirmed the hypothesis of homogeneity and isotropy, despite a deviation from the general trend in Pz3, probably due to local heterogeneity in proximity to the Maè Stream. Figure 10 shows the scatter plots referring to the steady-state calibrations: CFS1 and CFS2.
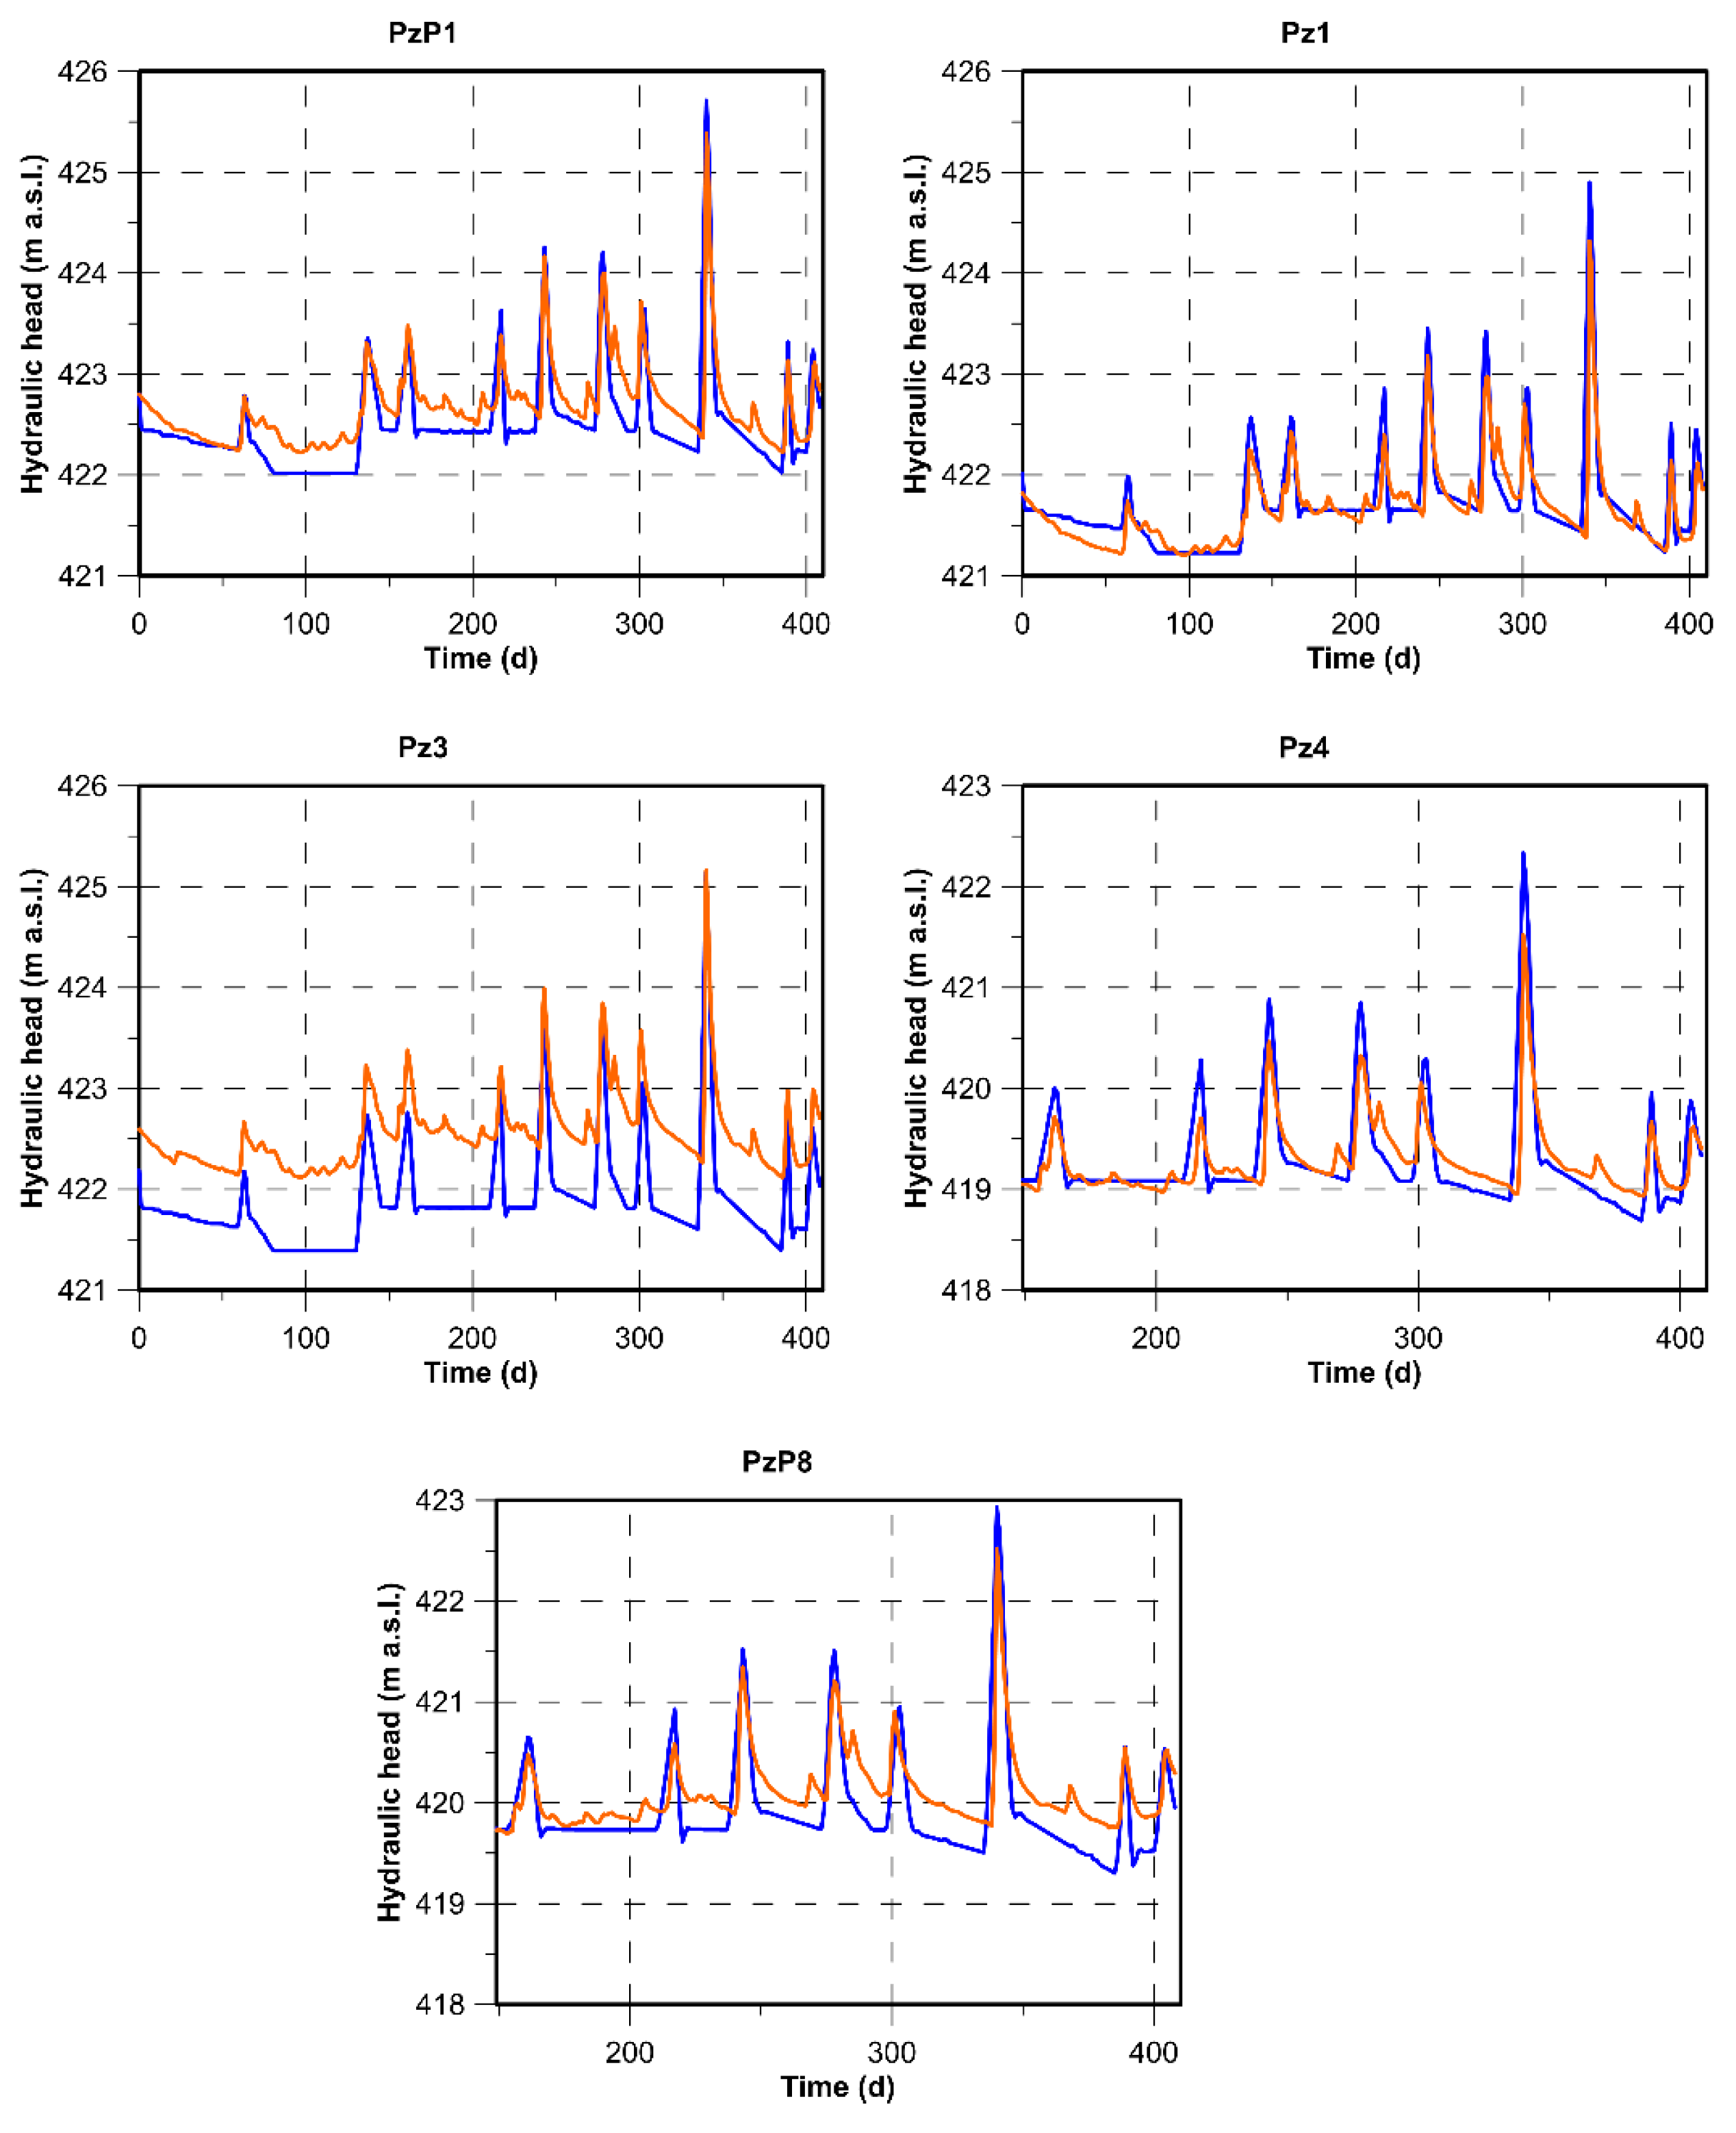
The calibration of the transient flow simulation CFT was performed both manually and automatically. The manual part defined a modulation function for the River BC, concerning a series of multipliers that made the BC variant with the Piave River stage measured at the Ponte della Vittoria monitoring station (Figure 7a). The automatic calibration by PEST allowed optimization of Sy, Ss, ITr, and OTr, and the resulting values are listed in Table 7. In Figure 11, the comparison between the measured and simulated hydraulic head for each piezometer highlights a good correspondence between them, except in Pz3, where the calibrated values are lower than the measured values. The CFT scatter plot is shown in Figure 12.
Regarding CHT, the calibration pointed out that the heat transport in the aquifer is mainly driven by convection, while conduction plays a secondary role in such a process. This was expected given the high hydraulic conductivity of the aquifer; thus, the model is not very sensitive to the thermal properties of the material, resulting in almost unchanged values with respect to the precalibration values (Table 6). Hence, in CHT, the calibration concerned mainly the temperature BCs: the initial 2nd kind boundary was replaced because the produced variations barely reached the aquifer, and therefore a 1st kind boundary, coinciding with the hydrographic network, was applied to simulate the river temperature. This confirmed the conceptual model hypothesis, stating that the atmospheric temperature does not affect the saturated zone, but it influences the water temperature exchange between the rivers and the aquifer. The values of this new BC were obtained by averaging the daily temperatures in the piezometers and temporally shifting the calculated curve by approximately 70 days. This procedure was adopted to derive the river temperature, assuming that it should be similar to that of the aquifer and in phase with the atmospheric temperature. This BC was implemented in the predictive simulation considering the temperature in 2020 and assuming a similar river thermal regime during the following years.
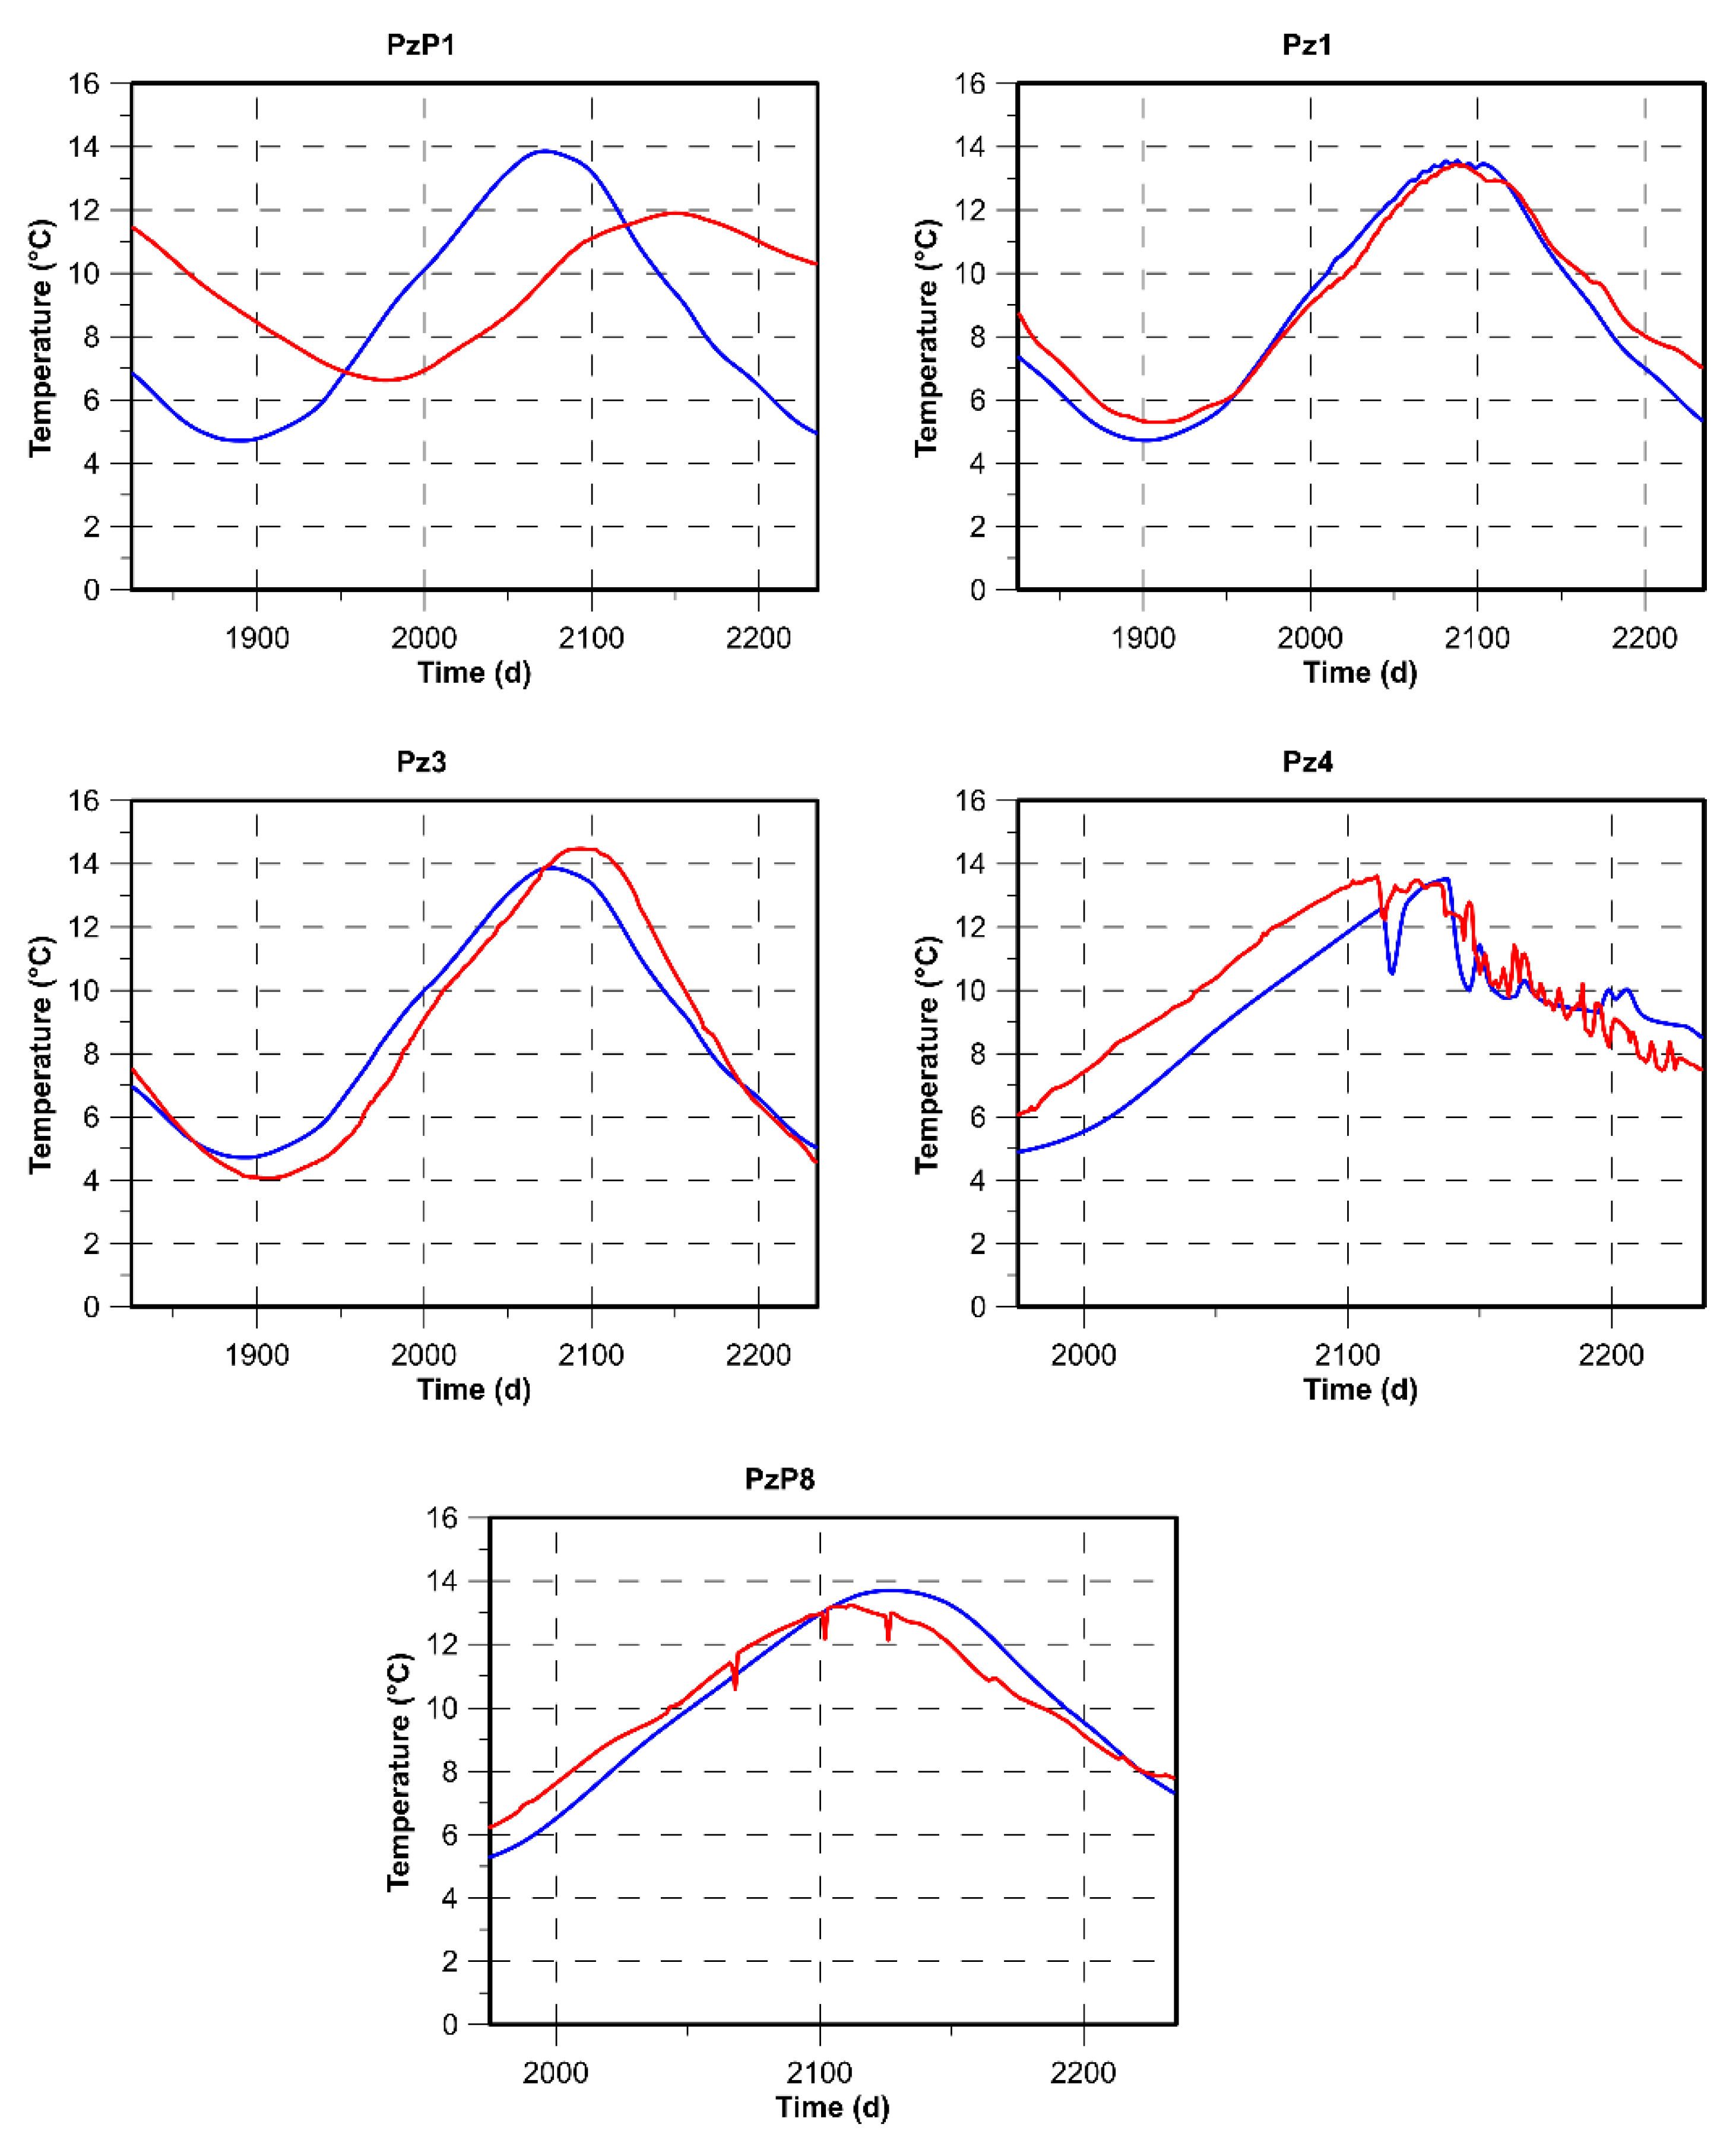
Figure 13 shows in all piezometers the comparison between measured and simulated temperatures, highlighting that the model reproduced reality quite well, except PzP1, where the simulated thermal trend was anticipated. In PzP1, it is considered that the proximity to the Maè Stream can be the cause of a local condition not represented by the model.
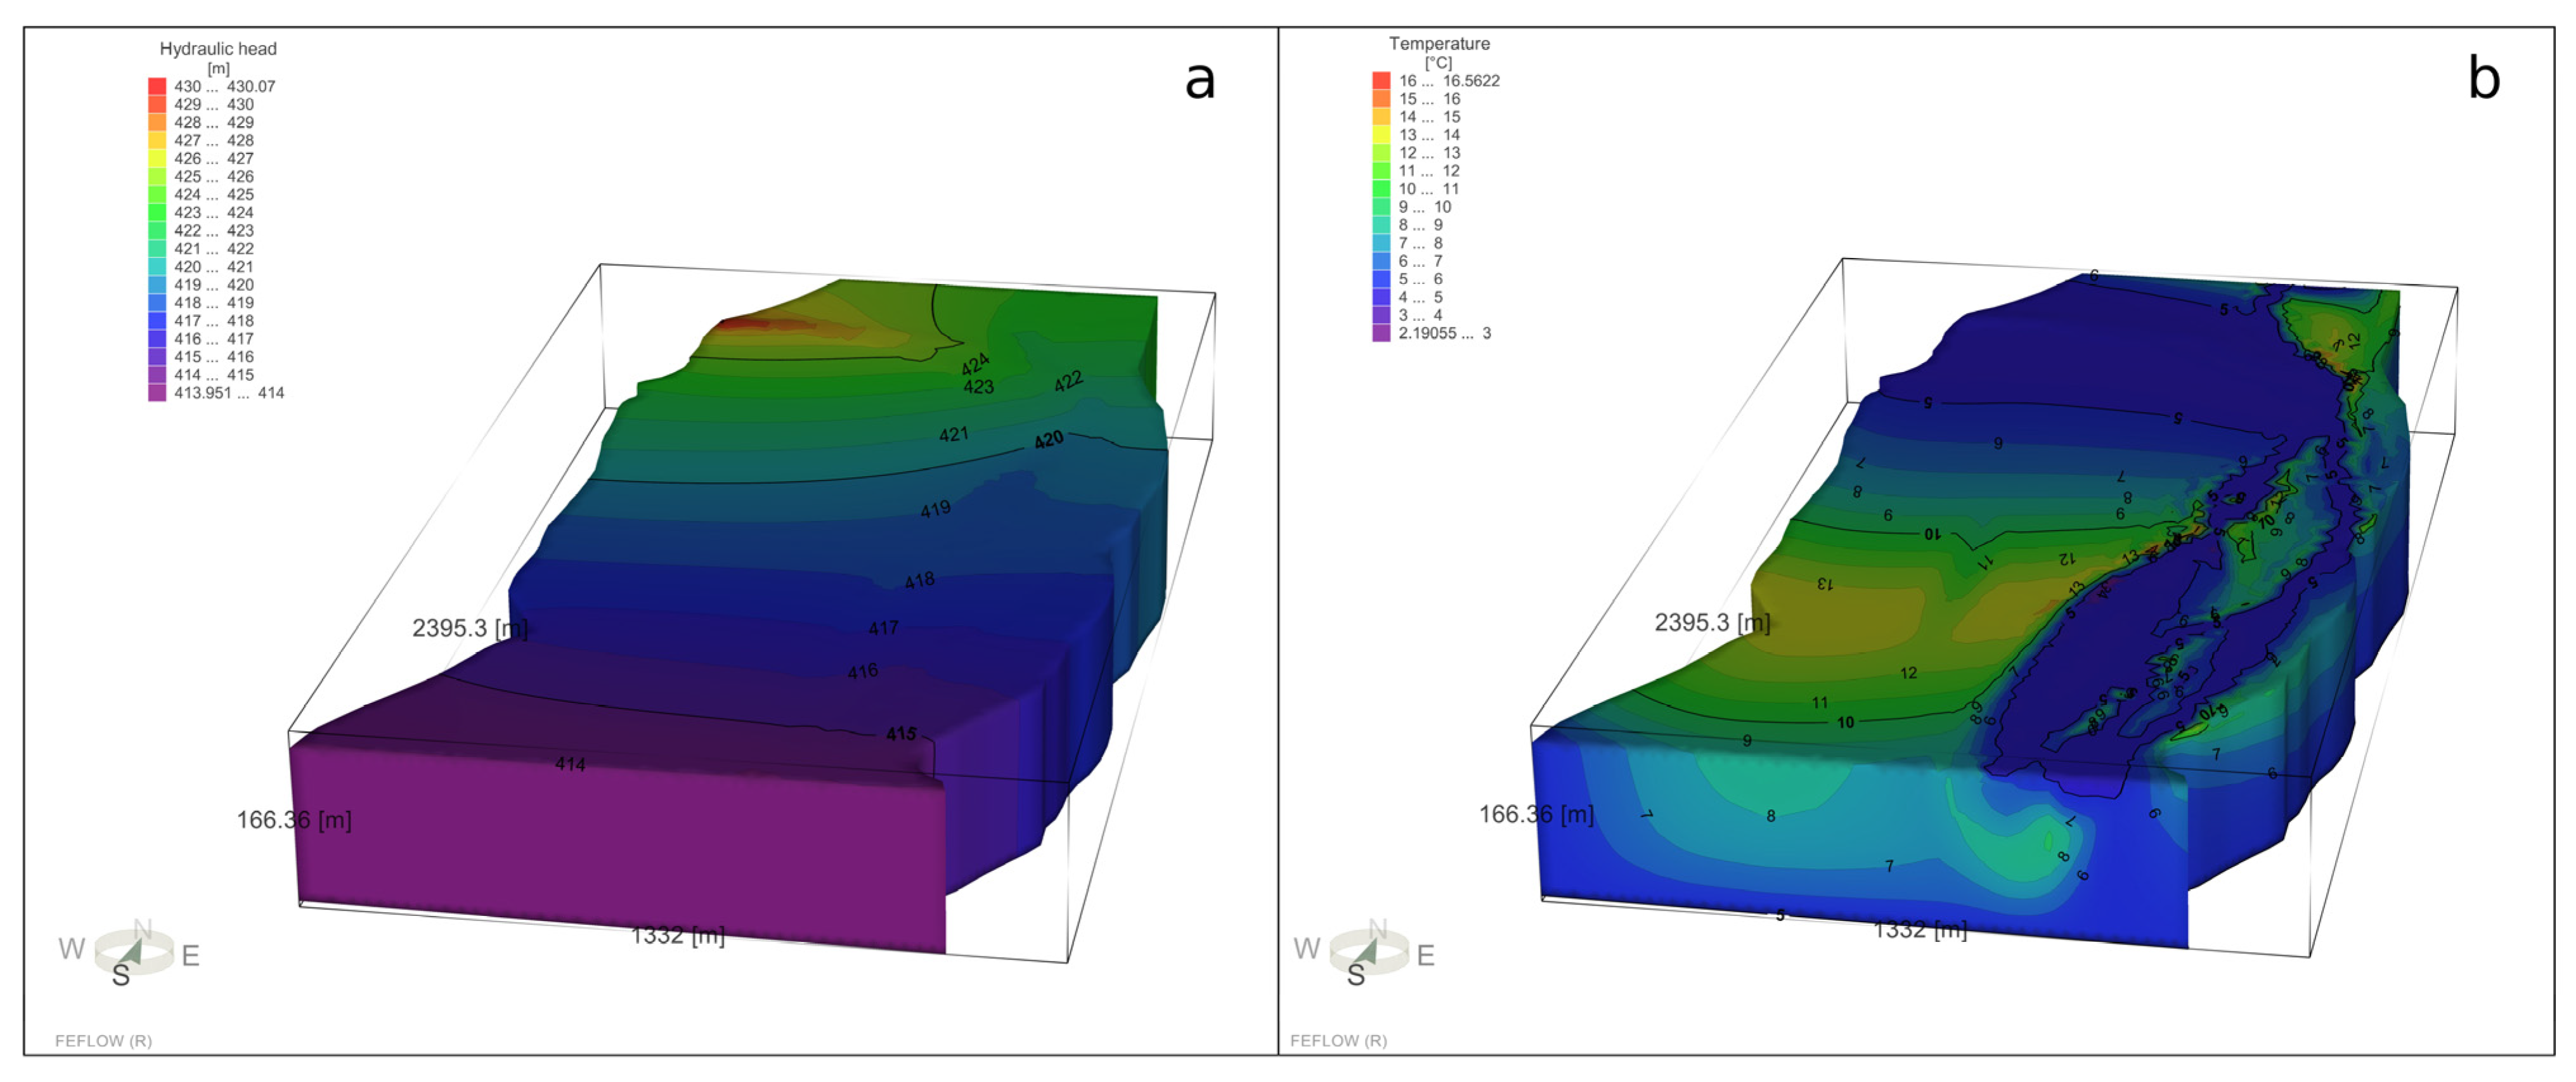
As stated by the statistical indicators listed in Table 8, the calibration targets were reached, and therefore, the model was successfully calibrated. The calibrated parameters and boundaries were then used to perform the predictive simulations. Figure 14 represents the postcalibration distribution of the hydraulic head and temperature in the model domain.
Temperature and hydraulic head data from continuous monitoring and thermal logs were used on the calibration process. Thanks to the presence of such a rich dataset a good model calibration was obtained, fundamental step to the following predictive simulations.

4.2. Predictive Simulation

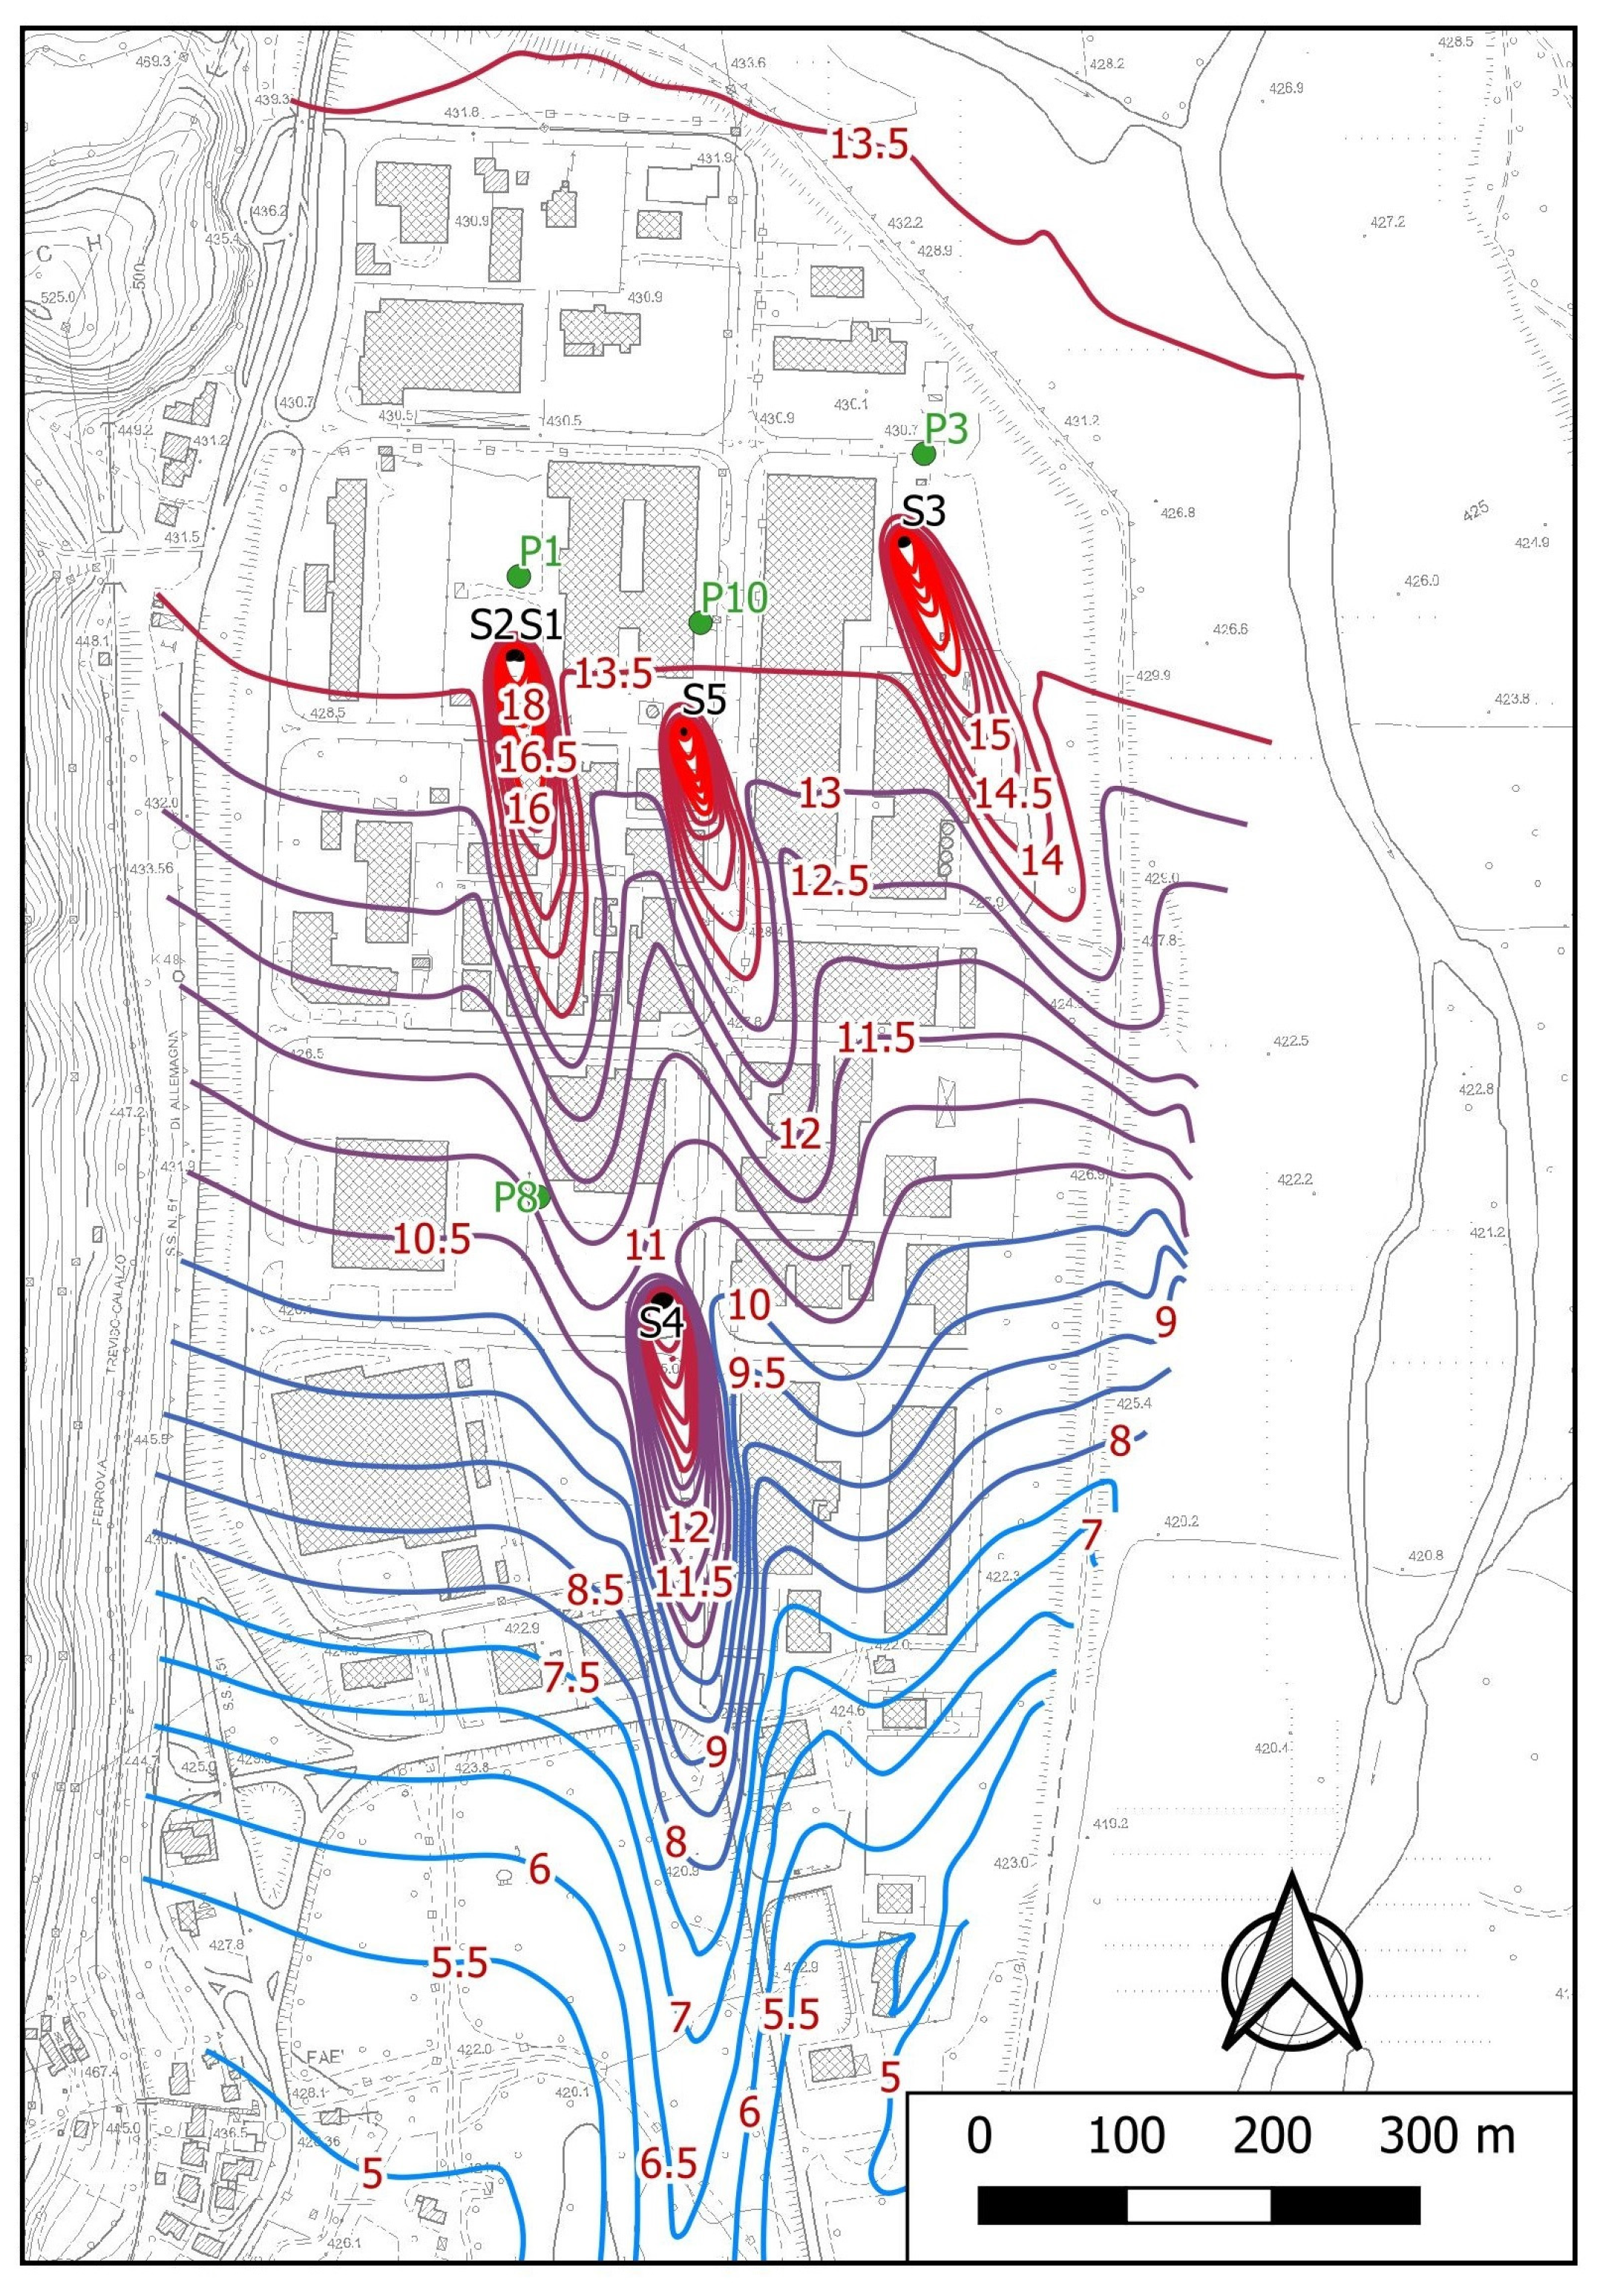
Once the model was calibrated, predictive simulations, PH1, PH2, and PH3, were carried out to evaluate the impact of GWHPs under the maximum temperature variation permitted by Italian legislation for a period of 30 years. This approach allowed us to define the isotherms deformed by the GWHP systems, from which the thermal plumes were isolated (Figure 15). Plume delimitation, in fact, is generally carried out considering aquifers with homogeneous temperature and defining temperature variation with respect to its average. In the present study, instead, the aquifer had temporally and spatially variable temperatures; therefore, another method was adopted to define the area thermally altered by water reinjection. For this reason, each plume was delimited considering the wider isotherm that circumscribes the respective injection well. The plumes delimited in this way include the part where the thermal effect is most evident and deviates most from the natural aquifer temperatures.
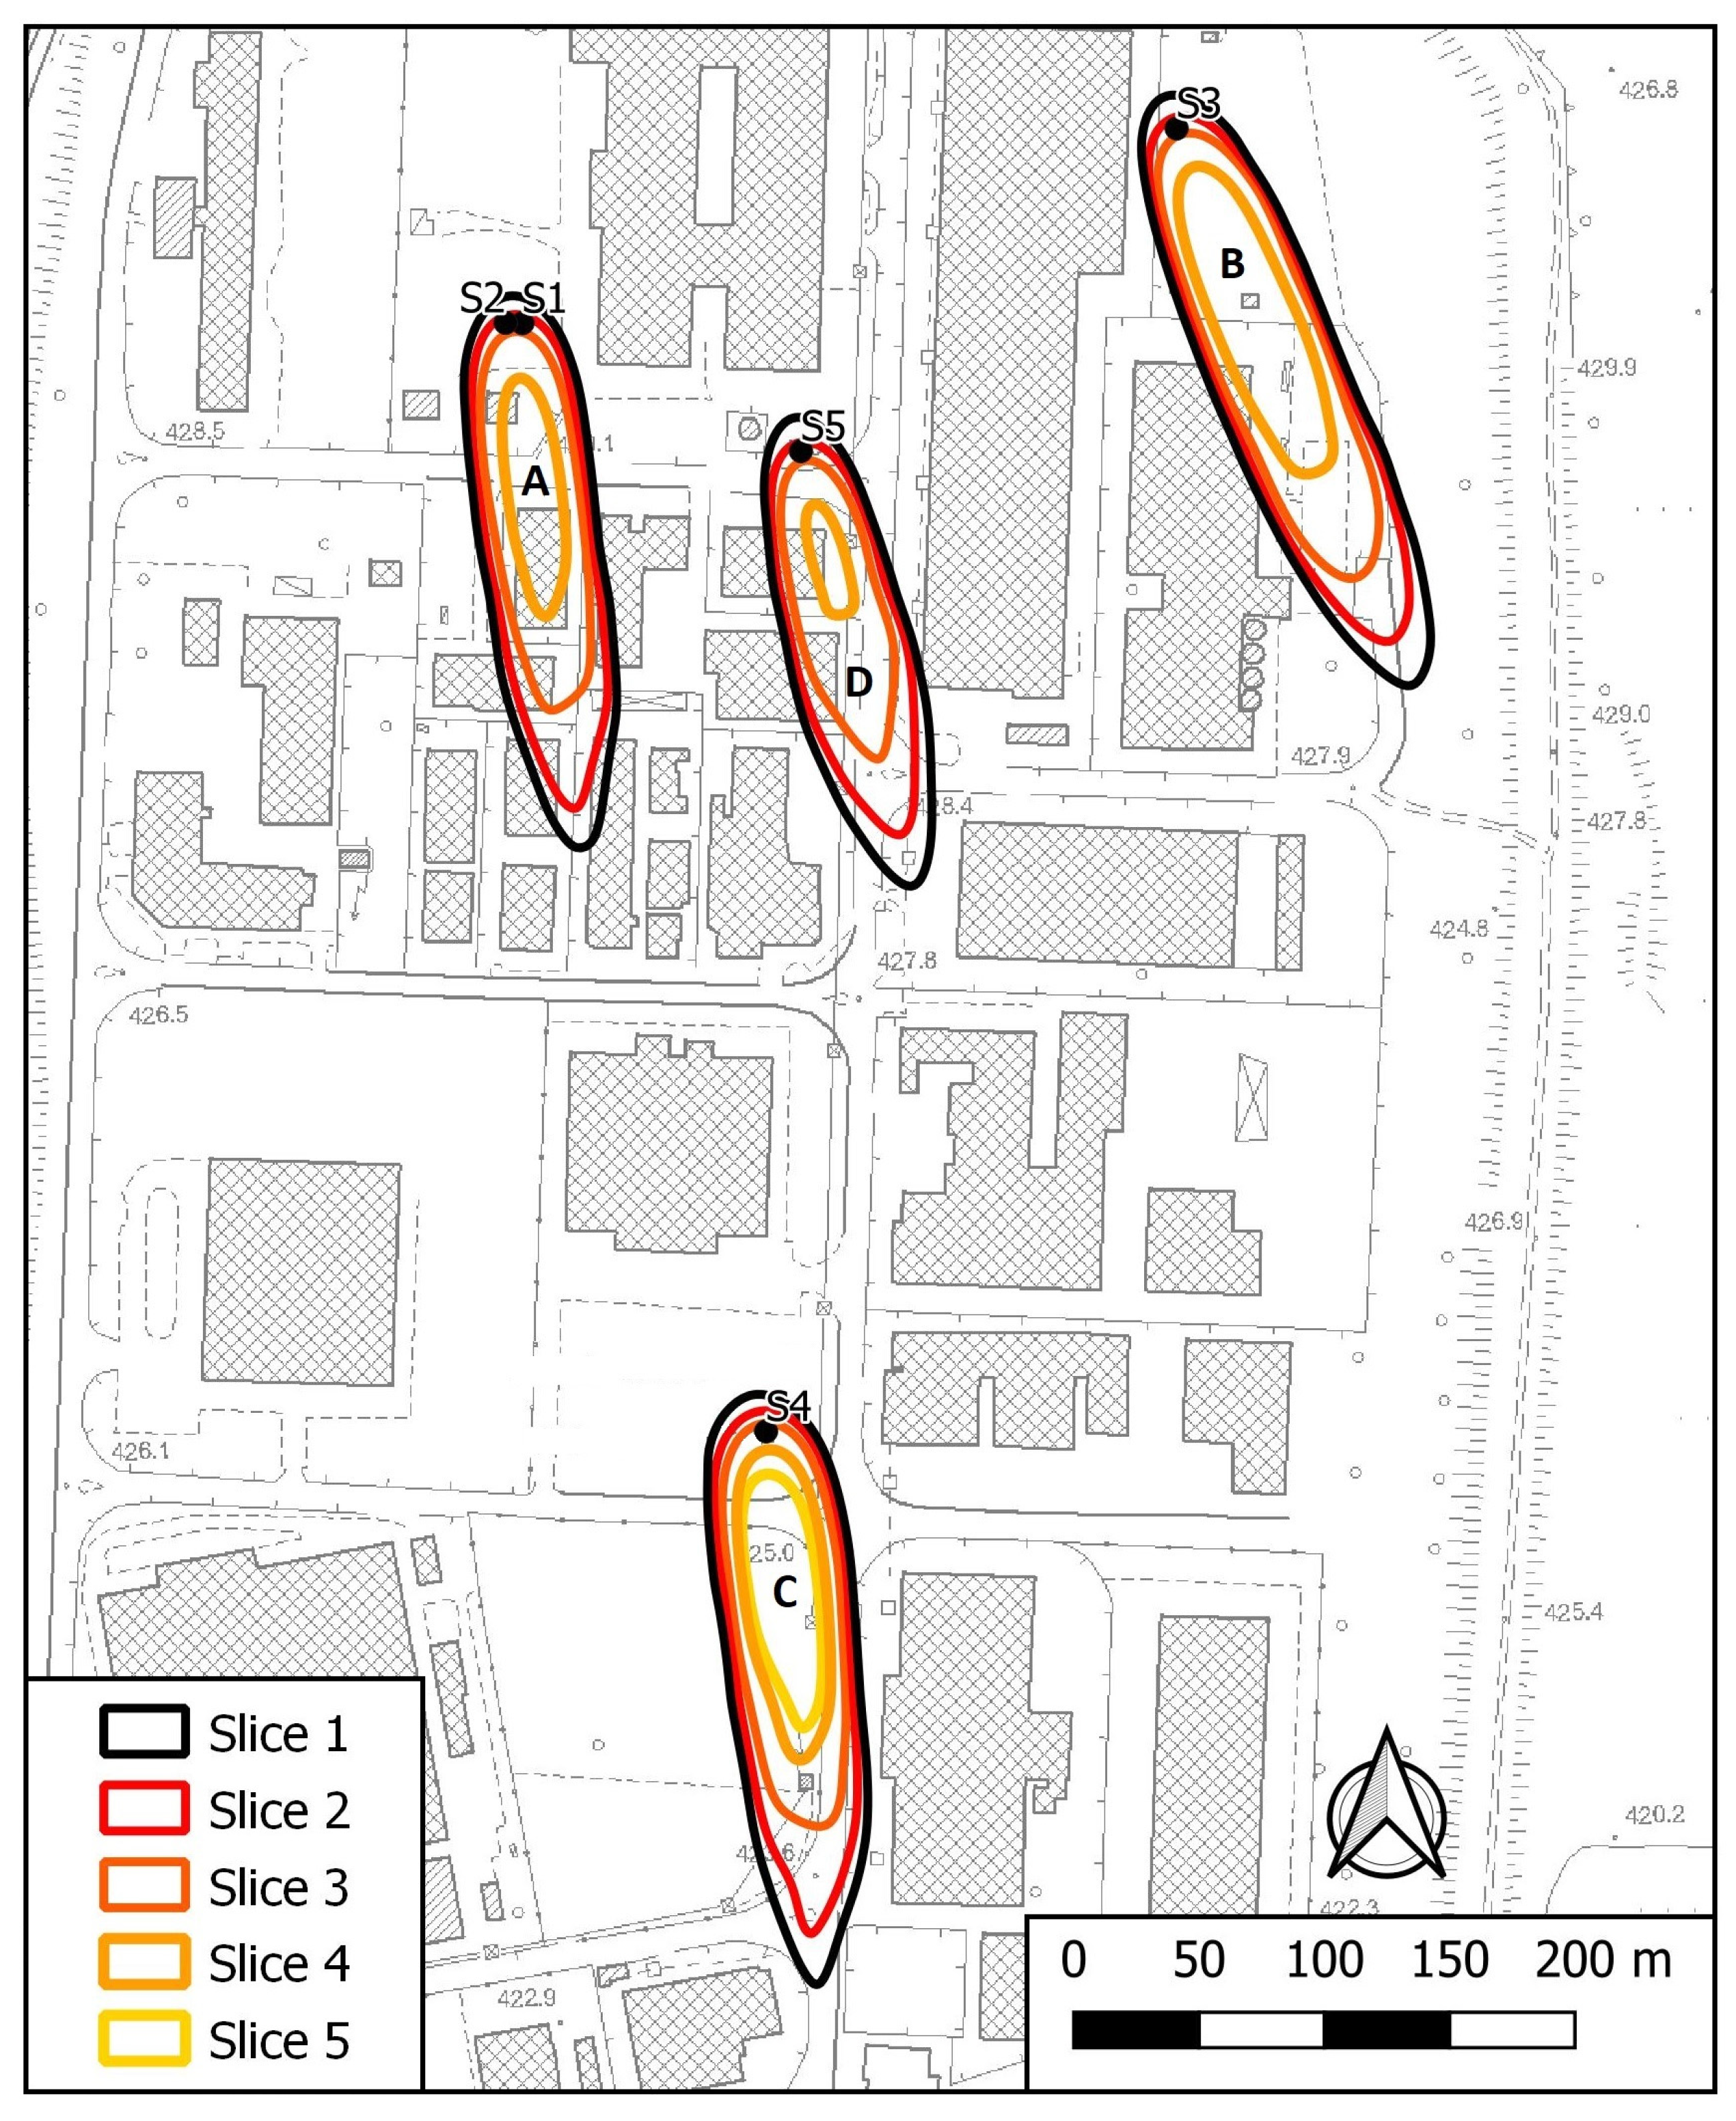
The resulting plumes for the three simulations at their maximum extension moment, i.e., at the end of the heating and cooling cycles of the thirtieth year, are shown in Figure 16. In PH1 and PH3, the thermal plumes of the heating cycle were more extensive than those of the cooling cycle due to the greater thermal delta applied. The disturbed areas of PH1 plumes on the first slice are shown as an example in Table 9. For PH1, plants were also evaluated at a plume depth of approximately 20 m, except for the plume of Plant C, which was 25 m deep, due to its higher discharge rate (Figure 17). A plant that exploits water that has been thermally altered by another plant can improve or worsen its efficiency, depending on the water temperature and on the climatization regime: warmer water in the heating regime and cooler water in the cooling regime are favorable situations; in contrast, warmer water in the cooling regime and cooler water in the heating regime are disadvantageous. Given that, generally, the plants of an area in the same periods work in approximately the same regime (unless they have special needs); the interferences can be advantageous depending, above all, on the delay time that a plume generated upstream takes to reach the extraction wells downstream. For example, a hot plume generated upstream during the cooling mode can reach the downstream plant when it works in the heating mode if the delay time is sufficiently long, allowing for a favorable heat exchange. In PH2 and PH3, despite the large number of plants, a careful design of the location of extraction wells relative to the injection wells avoids interference between plumes during the periods in which the plants work in the same regime (heating or cooling). Another observation concerns similar warm plumes in PH2 and PH3, indicating that operation in one regime does not significantly affect operation in the other regime. In Villanova, in fact, the thermal plumes are quickly transported by groundwater and just as quickly dissipated without ever reaching extraction wells downstream. Furthermore, in all three predictive simulations, there was no evidence of thermal feedback.
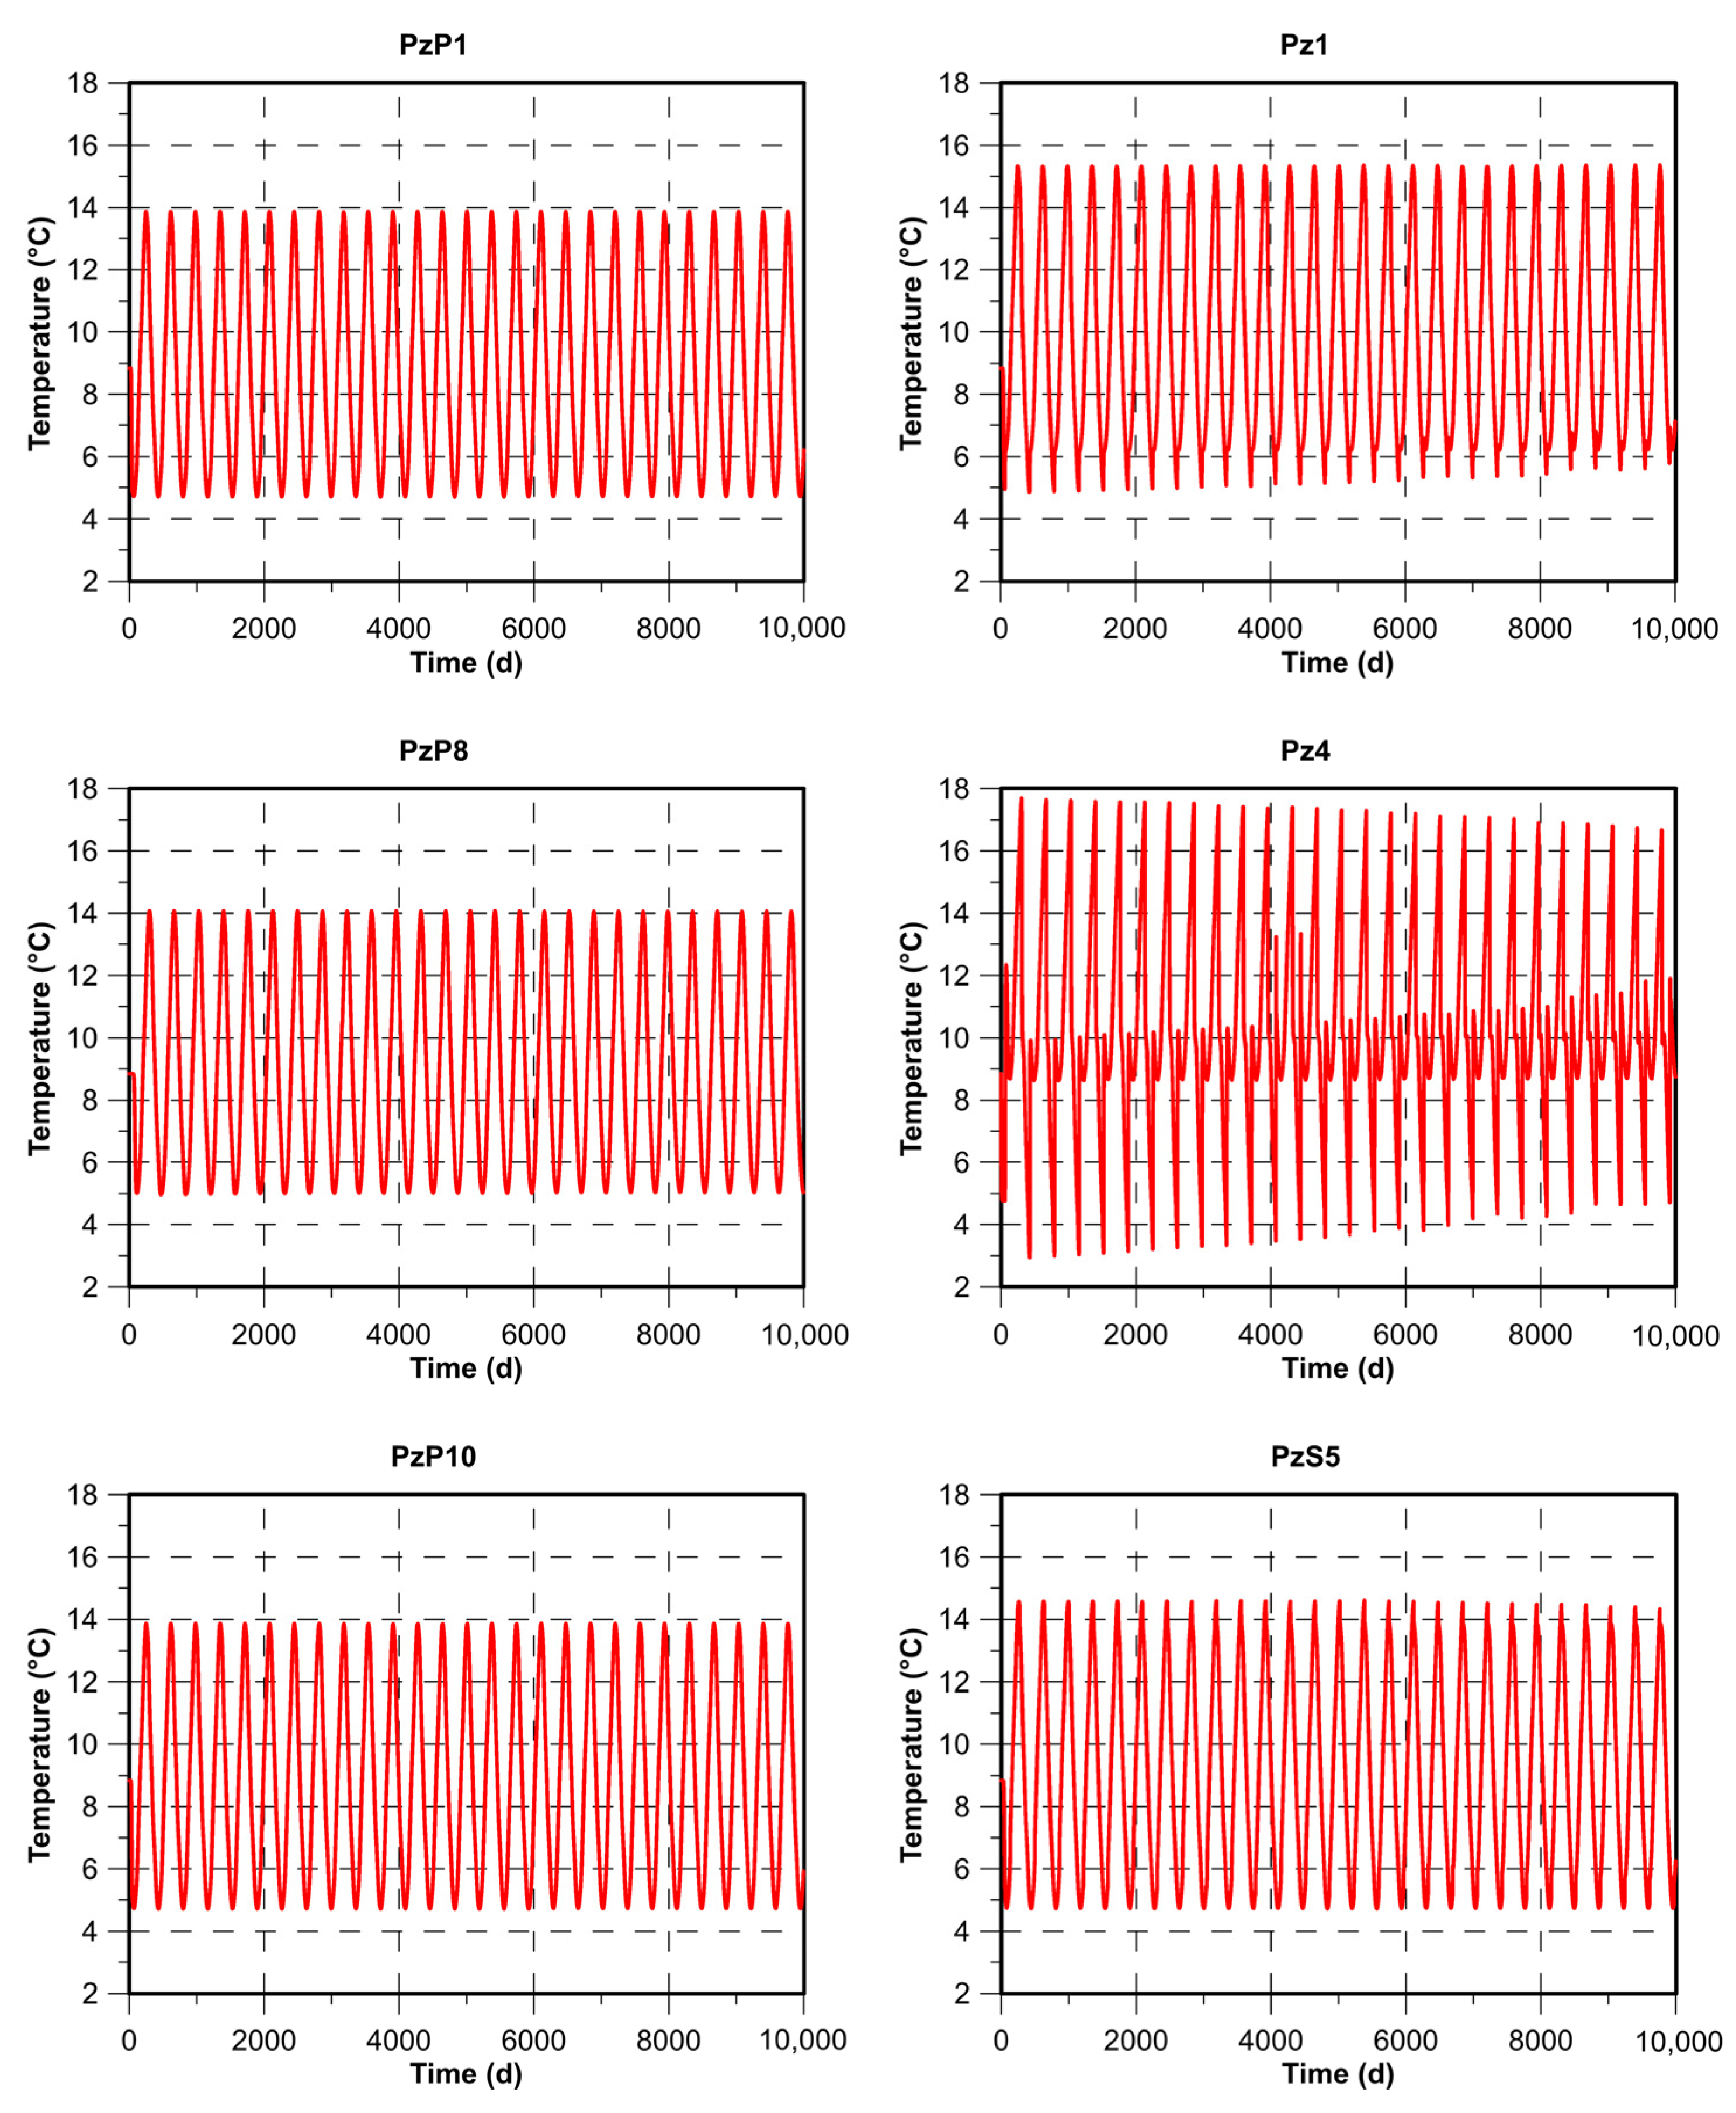
The long-term effects were evaluated by extracting the trend of temperatures calculated with the PH3 simulation in piezometers PzP1, Pz1, PzP8, Pz4, PzP10 and PzS5 (Figure 3 and Figure 9). An aquifer that gradually warms should show an increasing trend over the simulation period, while one that cools should show a decreasing trend; as visible in Figure 18, the temperature remains relatively constant throughout the simulation years. In the upstream piezometers (PzP1, PzP8 and PzP10), the temperatures remained in a range similar to the natural range, which was further confirmation of the absence of thermal feedback and the ability of the aquifer to dissipate thermal plumes from year to year. In the downstream piezometers, instead, a slight increase in the amplitude of the thermal oscillations due to interference with the reinjected waters was observed. The amplitude of these oscillations remained constant over time and indeed tended to decrease in two out of three cases (Pz1 and Pz4). The behavior differences among upstream and downstream piezometers are due to the monitoring point positions, because the upstream piezometer sites were planned to avoid interference with plumes from other plants differently from the downstream piezometers, in which this trick wasn’t needful to the plant functionality. The predictive simulations highlighted a water thermic balance at the end of each climatization cycle, even in the presence of a greater number of GWHPs. Therefore, the investigated aquifer can be considered a system with high geothermal potential. The geothermal potential of this site comes from its geological and hydrogeological characteristics, especially due to the presence of a highly permeable phreatic aquifer in connection with a large river such as the Piave River. However, similar geological/hydrogeological contexts are common in the Alpine region or in other mountainous regions; therefore, the considerations made in this study could be extended to other sites. In such contexts, the availability of groundwater is generally high, and the sediments tend to be coarse, implying high hydraulic conductivity. The water table could be relatively shallow, making pump-water extraction cost-effective. Furthermore, the high permeability of sediments allows the return of water to the aquifer through injection wells, drilled in the unsaturated zone taking advantage of the natural infiltration process and reducing reinjection costs and thermal alteration. Obviously, adequate investigations must be carried out on a case-by-case basis to highlight local characteristics.
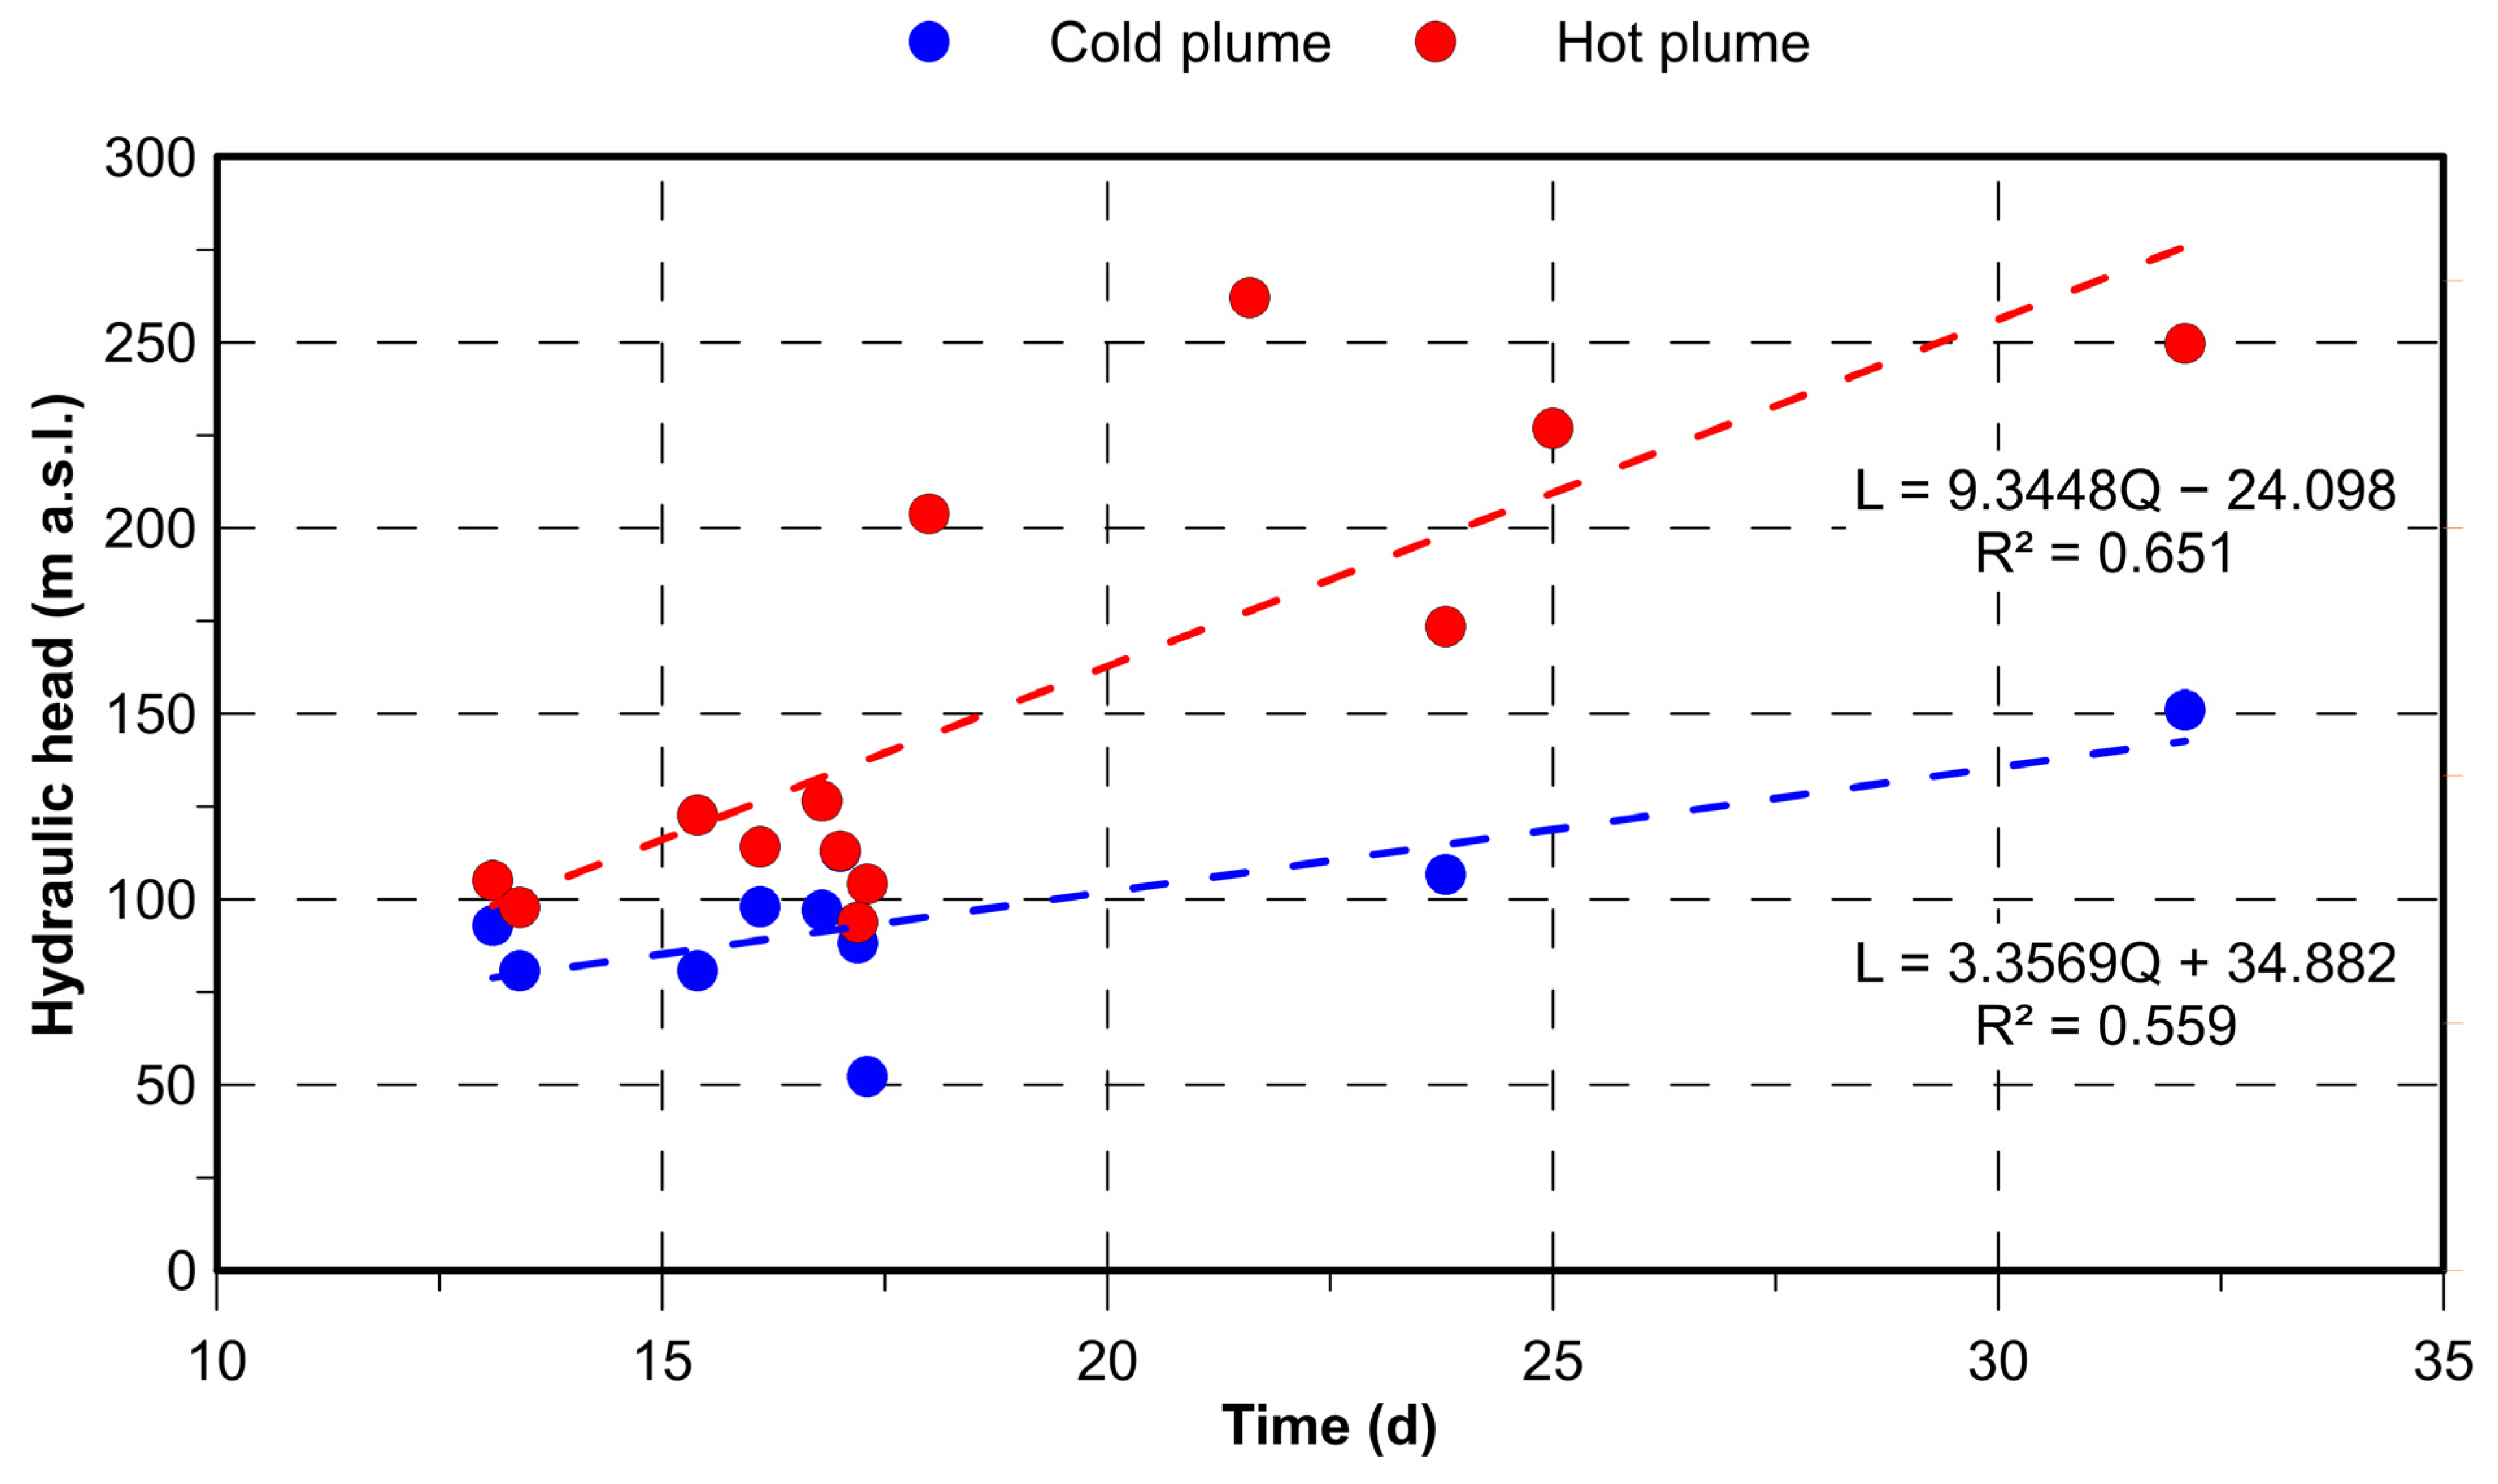
Given the possibility of making greater use of the aquifer with additional open-loop systems, it is necessary to define the correct positioning of the wells and the volumes of extracted and reinjected water to avoid interference between plants. For this reason, based on the predictive simulations, a linear relationship was identified between the flow rate injected into the aquifer and the maximum size of the plume (which occurred in slice 1), which can constitute a quick support tool for the dimensioning of future plants in the area and for the positioning of the wells (Figure 19). Despite, this ratio is influenced by a number of local factors, such as the location of wells, their distance from boundary conditions, the hydraulic gradient, and the hydraulic conductivity of the aquifer it can be assumed as a site-specific property of the aquifer. It should be noted that reference was made to the maximum length of the plumes because the relationship was made considering a +5 °C heating and a −2 °C cooling (the maximum variations considered suitable) for continuous operation throughout the same regime period. The lengths of the thermal plumes of PH3 in the first slice (Figure 16) were measured, both in the cooling and heating regimes, showing a direct proportionality with the outgoing flows from the plants (the plume related to S11 was not considered because it was located too close to the Maè Stream). This site-specific relationship allows a proper location of new plants, taking into account its development in homogeneous subsurface conditions. Recently, several published articles have addressed the topic of geothermal groundwater utilization by GWHPs in the context of alluvial aquifers and groundwater-surface water interactions [17,18,44,45,46,47,48], but no examples of such a correlation are available. This relationship can be useful to evaluate the induced thermal plume, giving additional information to decision-makers. Based on the knowledge of the main groundwater flow direction, using this tool, any GWHP interactions can be evaluated and corrected at the initial design stage without an additional numerical simulation, and consequently decreasing the cost for feasibility studies. If interference cannot be avoided, an alternative method of returning water to the aquifer could be considered instead of shallow injection wells; for example, using deep wells. This method, although more expensive, would probably still be cost-effective, and would allow exploitation of the entire thickness of the aquifer.
A limitation of predictive simulations is the difficulty of evaluating future variations in the variables affecting the system, such as the uncertainty about future hydrological stresses [38]. In this model, as an example, it was considered that the trend of the hydraulic and thermal stresses in the future will be the same as those in 2020. This simplification, despite providing plausible values, is certainly different from what will actually happen, especially in the context of climate change [49,50,51]. For this reason, knowledge on future inflows could be integrated, for instance, with rainfall–runoff hydrological models [52,53] and/or climate models [54,55]. Despite this, the model results show that, according to the conditions considered, the groundwater of the study area could be better exploited with the addition of other GWHPs, taking into account the need to avoid interactions between plants; in fact, the model shows that when the extraction and injection wells are properly positioned, the thermal plumes dissipate completely from one year to the next, without reaching downstream wells. Another type of interaction that should be avoided is with the surface waters: the anthropogenic impact on river temperature, which was not the subject of this study, is an important topic for ecological reasons related to thermal suitability for aquatic fauna [56,57]. In the scientific literature no studies focused on the alteration of river temperatures by GWHP were found, so its consequences are yet to be verified.

5. Conclusions

In the present study, the hydrogeological and thermal characteristics of the Longarone phreatic aquifer were analyzed through in situ measurements, which allowed the definition of a conceptual model to be subsequently validated through numerical simulation. The numerical model confirmed the conceptual hypothesis, providing further information on the properties of the exploited aquifer and the conditions governing its groundwater flow and temperature distribution.
As a result, there is evidence that the aquifer temperature depends on surface water temperature rather than air temperature: temperature varies more in the horizontal direction than in the vertical direction and significantly varies throughout the year even up to a depth of 30 m, a depth too deep to be directly affected by air temperature. Temperature fluctuations were therefore considered to be caused by the water exchange between groundwater and surface waters, which allows the seasonal cycles of surface temperatures to be transmitted even at depth, with a certain delay. This behavior is due to the high permeability of the reservoir composed of pebbles, gravel, and sand. In order to observe this peculiar behavior in the study area, the use of numerical modeling and aquifer-scale analysis proved to be fundamental. It could also be assessed that the currently installed geothermal plants can produce thermal plumes reaching a maximum of 25 m in depth and 260 m in length.
The model also shows that the use for climatization of GWHPs in Villanova is a sustainable alternative to traditional air-conditioning systems, even in the case of greater exploitation of the aquifer. Through predictive simulations, thermal alteration of the aquifer, interferences between plants and thermal feedback were checked. The peculiar geological and hydrogeological context of the site has revealed a high potential for the installation of GWHP systems which should be considered as an option, leading to both economic and environmental benefits.
Sustainability of SGSs, particularly referring to low environmental impacts and long life of geothermal plants, must be accompanied by effective and coordinated design. For this reason, a tool that can offer support to designers of future plants in Villanova was identified, consisting of a site-specific relationship between flow rates and maximum thermal plume length. This instrument may be useful to estimate the maximum size of the plumes and to define the thermally altered areas from knowledge of groundwater flow direction, allowing to avoid interference between geothermal plants or with other elements sensitive to temperature changes, such as surface water. To obtain this relationship, it is necessary to develop a model at the aquifer scale, which also allows the whole system to be studied better than individual plant-scale models.
In conclusion, this study highlighted that the analysis at the aquifer scale is a fundamental methodology for sites where GWHPs should be installed, allowing to identify the main variables affecting the system. Mechanisms regulating flow rates and temperatures at the plant scale must be placed in a wider context to consider surrounding factors and to more accurately assess the sustainability of SGSs.

Author Contributions

Conceptualization, D.C., L.P. and P.F.; Methodology, D.C., L.P. and A.P.; Validation, P.F.; Formal analysis, L.P. and P.F.; Investigation, D.C.; Data curation, D.C.; Writing—original draft, D.C.; Writing—review & editing, L.P., A.P. and P.F.; Supervision, L.P. and P.F. All authors have read and agreed to the published version of the manuscript.

Funding

This research received no external funding.

Institutional Review Board Statement

Not applicable.

Informed Consent Statement

Not applicable.

Data Availability Statement

Data available on request due to privacy restrictions.

Conflicts of Interest

The authors declare no conflict of interest.

References

  1. Solomon, S.; Qin, D.; Manning, M.; Chen, Z.; Marquis, M.; Averyt, K.B.; Tignor, M.; Miller, H.L. (Eds.) Contribution of Working Group I to the Fourth Assessment Report of the Intergovernmental Panel on Climate Change. In Climate Change 2007: The Physical Science Basis; Cambridge University Press: Cambridge, UK; New York, NY, USA, 2007; p. 996. [Google Scholar]
  2. Solomon, S.; Plattner, G.K.; Knutti, R.; Friedlingstein, P. Irreversible climate change due to carbon dioxide emissions. PNAS 2008, 106, 1704–1709. [Google Scholar] [CrossRef] [PubMed] [Green Version]
  3. Leung, D.Y.C.; Caramanna, G.; Maroto-Valer, M.M. An overview of current status of carbon dioxide capture and storage technologies. Renew. Sustain. Energy Rev. 2014, 39, 426–443. [Google Scholar]
  4. Goldstein, B.; Hiriart, G.; Bertani, R.; Bromley, C.; Gutiérrez-Negrín, L.; Huenges, E.; Muraoka, H.; Ragnarsson, A.; Tester, J.; Zui, V. Geothermal Energy; IPCC Special Report on Renewable Energy Sources and Climate Change Mitigation; Edenhofer, O., Pichs-Madruga, R., Sokona, Y., Seyboth, K., Matschoss, P., Kadner, S., Zwickel, T., Eickemeier, P., Hansen, G., Schlömer, S., et al., Eds.; Cambridge University Press: Cambridge, UK; New York, NY, USA, 2011. [Google Scholar]
  5. Lund, J.W.; Freeston, D.H.; Boyd, T.L. Direct utilization of geothermal energy 2010 worldwide review. Geothermics 2011, 40, 159–180. [Google Scholar] [CrossRef]
  6. Lund, J.W.; Huttrer, G.W.; Toth, A.N. Characteristics and trends in geothermal development and use, 1995 to 2020. Geothermics 2022, 105, 102522. [Google Scholar] [CrossRef]
  7. Banks, D. An Introduction to Thermogeology: Ground Source Heating and Cooling, 2nd ed.; Wiley-Blackwell: Chichester, UK, 2012; p. 517. [Google Scholar]
  8. Lo Russo, S.; Boffa, C.; Civita, M.V. Low-enthalpy geothermal energy: An opportunity to meet increasing energy needs and reduce CO2 and atmospheric pollutant emissions in Piemonte, Italy. Geothermics 2009, 38, 254–262. [Google Scholar] [CrossRef]
  9. Sarbu, I.; Sebarchievici, C. General review of ground-source heat pump systems for heating and cooling of buildings. Energy Build. 2014, 70, 441–454. [Google Scholar] [CrossRef]
  10. Aresti, L.; Christodoulides, P.; Florides, G.A. An investigation on the environmental impact of various Ground Heat Exchangers configurations. Renew. Energy 2021, 171, 592–605. [Google Scholar] [CrossRef]
  11. European Commission. Directive 2000/60/EC of the European Parliament and of the Council Establishing a Framework for the Community Action in the Field of Water Policy; Official Journal of the European Union: Luxembourg, Luxembourg, 2000. [Google Scholar]
  12. Perego, R.; Guandalini, R.; Fumagalli, L.; Aghib, F.S.; De Biase, L.; Bonomi, T. Sustainability evaluation of a medium scale GSHP system in a layered alluvial setting using 3D modeling suite. Geothermics 2016, 59, 14–26. [Google Scholar] [CrossRef]
  13. Abesser, C. Open-loop ground source heat pumps and the groundwater systems: A literature review of current applications, regulations and problems. Br. Geol. Surv. Open Rep. 2007, OR/10/045, 31. [Google Scholar]
  14. Banks, D. Thermogeological assessment of open-loop well-doublet schemes: A review and synthesis of analytical approaches. Hydrogeol. J. 2009, 17, 1149–1155. [Google Scholar] [CrossRef]
  15. Milnes, E.; Perrochet, P. Assessing the impact of thermal feedback and recycling in open-loop groundwater heat pump (GWHP) systems: A complementary design tool. Hydrogeol. J. 2013, 21, 505–514. [Google Scholar]
  16. Ferguson, G.; Woodbury, A.D. Subsurface heat flow in an urban environment. J. Geophys. Res. 2004, 109, B02402. [Google Scholar] [CrossRef]
  17. Perego, R.; Pera, S.; Boaga, J.; Bulgheroni, M.; Dalla Santa, G.; Galgaro, A. Thermal modeling of a Swiss urban aquifer and implications for geothermal heat pump systems. Hydrogeol. J. 2021, 29, 2187–2210. [Google Scholar] [CrossRef]
  18. Epting, J.; Händel, F.; Huggenberger, P. Thermal management of an unconsolidated shallow urban groundwater body. Hydrol. Earth Syst. Sci. 2013, 17, 1851–1869. [Google Scholar] [CrossRef] [Green Version]
  19. Choi, W.; Ooka, R.; Nam, Y. Impact of long-term operation of ground-source heat pump on subsurface thermal state in urban area. Sustain. Cities Soc. 2018, 38, 429–439. [Google Scholar] [CrossRef]
  20. Perego, R.; Dalla Santa, G.; Galgaro, A.; Pera, S. Intensive thermal exploitation from closed and open shallow geothermal systems at urban scale: Unmanaged conflicts and potential synergies. Geothermics 2022, 103, 102417. [Google Scholar] [CrossRef]
  21. Torresan, F.; Piccinini, L.; Cacace, M.; Pola, M.; Zampieri, D.; Fabbri, P. Numerical modeling as a tool for evaluating the renewability of geothermal resources: The case study of the Euganean Geothermal System (NE Italy). Environ. Geochem. Health 2022, 44, 2135–2162. [Google Scholar]
  22. Abesser, C.; Lewis, M.A.; Marchant, A.P.; Hulbert, A.G. Mapping suitability for open-loop ground source heat pump systems: A screening tool for England and Wales, UK. Q. J. Eng. Geol. Hydrogeol. 2014, 47, 373–380. [Google Scholar] [CrossRef] [Green Version]
  23. Wu, Q.; Xu, S.; Zhou, W.; LaMoreaux, J. Hydrogeology and design of groundwater heat pump systems. Environ. Earth Sci. 2015, 73, 3683–3695. [Google Scholar] [CrossRef]
  24. Chahoud, A.; Gelati, L.; Palumbo, A.; Patrizi, G.; Pellegrino, I.; Zaccanti, G. Groundwater flow model management and case studies in Emilia-Romagna (Italy). Acque Sotter. Ital. J. Groundw. 2013, AS04019, 59–73. [Google Scholar] [CrossRef] [Green Version]
  25. Dendys, M.; Tomaszewska, B.; Pajak, L. Numerical modelling in research on geothermal systems. Bull. Geogr. Phys. Geogr. Ser. 2015, 9, 39–44. [Google Scholar] [CrossRef] [Green Version]
  26. Vaccaro, M.; Conti, P. Numerical simulation of geothermal resources: A critical overlook. In Proceedings of the European Geothermal Conference, Pisa, Italy, 3–7 June 2013. Paper HS1-26. [Google Scholar]
  27. Diersch, H.J.G. FEFLOW—Finite Element Modeling of Flow, Mass and Heat Transport in Porous and Fractured Media; Springer: Berlin/Heidelberg, Germany, 2014; p. 996. [Google Scholar]
  28. Halilovic, S.; Böttcher, F.; Kramer, S.C.; Piggott, M.D.; Zosseder, K.; Hamacher, T. Well layout optimization for groundwater heat pump systems using the adjoint approach. Energy Convers. Manag. 2022, 268, 116033. [Google Scholar] [CrossRef]
  29. Masetti, D.; Bianchin, G. Geologia del Gruppo della Schiara (Dolomiti Bellunesi)—Suo inquadramento nella evoluzione giurassica del margine orientale della Piattaforma di Trento. Mem. Di Sci. Geol. 1987, 39, 187–212. [Google Scholar]
  30. Carton, A.; Bondesan, A.; Fontana, A.; Meneghel, M.; Miola, A.; Mozzi, P.; Primon, S.; Surian, N. Geomorphological evolution and sediment transfer in the Piave River system (northeastern Italy) since the Last Glacial Maximum. Géomorphologie Relief Process. Environ. 2009, 15, 155–174. [Google Scholar] [CrossRef] [Green Version]
  31. Fontana, A.; Mozzi, P.; Marchetti, M. Alluvial fans and megafans along the southern side of the Alps. Sediment. Geol. 2014, 301, 150–171. [Google Scholar] [CrossRef]
  32. Pellegrini, G.B.; Zambrano, R. Il corso del Piave a Ponte nelle Alpi nel Quaternario. Studi Trentini Di Sci. Nat. 1979, 56, 69–100. [Google Scholar]
  33. Badino, G. Geothermal flux and phreatic speleogenesis in gypsum, halite and quartzite rocks. Int. J. Speleol. 2018, 47, 1–11. [Google Scholar] [CrossRef] [Green Version]
  34. Kitanidis, P.K. Introduction to Geostatistics: Applications to Hydrogeology; Cambridge University Press: Cambridge, UK, 1997; p. 249. [Google Scholar]
  35. Fabbri, P.; Trevisani, S. A geostatistical simulation approach to a pollution case in the Northeastern Italy. Math. Geol. 2005, 37, 569–586. [Google Scholar] [CrossRef]
  36. Trefry, M.G.; Muffels, C. FEFLOW: A Finite-Element Ground Water Flow and Transport Modeling Tool. Ground Water 2007, 45, 525–528. [Google Scholar] [CrossRef]
  37. Moriasi, D.N.; Arnold, J.G.; Van Liew, M.W.; Bingner, R.L.; Harmel, R.D.; Veith, T.L. Model Evaluation Guidelines for Systematic Quantification of Accuracy in Watershed Simulations. Trans. ASABE 2007, 50, 885–900. [Google Scholar] [CrossRef]
  38. Anderson, M.P.; Woessner, W.W. Applied Groundwater Modeling—Simulation of Flow and Advective Transport, 1st ed.; Academic Press: San Diego, CA, USA, 1992; p. 381. [Google Scholar]
  39. Doherty, J. Calibration and Uncertainty Analysis for Complex Environmental Models; Watermark Numerical Computing: Brisbane, Australia, 2015; p. 237. ISBN 978-0-9943786-0-6. [Google Scholar]
  40. Verlag des Vereins Deutscher Ingenieure. Thermal Use of the Underground: Fundamentals, Approvals, Environmental Aspects; VDI 4640 Part 1; Verlag des Vereins Deutscher Ingenieure: Düsseldorf, Germany, 2000. [Google Scholar]
  41. Casasso, A.; Sethi, R. Modelling thermal recycling occurring in groundwater heat pumps (GWHPs). Renew. Energy 2015, 77, 86–93. [Google Scholar] [CrossRef] [Green Version]
  42. Park, D.K.; Kaown, D.; Lee, K.K. Development of a simulation-optimization model for sustainable operation of groundwater heat pump system. Renew. Energy 2020, 145, 585–595. [Google Scholar] [CrossRef]
  43. Park, D.K.; Lee, E.; Kaown, D.; Lee, S.S.; Lee, K.K. Determination of optimal well locations and pumping/injection rates for groundwater heat pump system. Geothermics 2021, 92, 102050. [Google Scholar] [CrossRef]
  44. Krčmář, D.; Marschalko, M.; Yilmaz, I.; Malík, P.; Černák, R.; Švasta, J.; Kullman, E.; Rusnáková, D.; Popielarczyk, D.; Yang, S. Mapping the low-enthalpy geothermal potential of Quaternary alluvial aquifers in Slovakia. Bull. Eng. Geol. Environ. 2020, 79, 1225–1238. [Google Scholar] [CrossRef]
  45. Previati, A.; Crosta, G.B. Regional-scale assessment of the thermal potential in a shallow alluvial aquifer system in the Po plain (northern Italy). Geothermics 2021, 90, 101999. [Google Scholar] [CrossRef]
  46. Garcìa-Gil, A.; Vázquez-Suñe, E.; Garrido Schneider, E.; Sánchez-Navarro, J.A.; Mateo-Lázaro, J. The thermal consequences of river-level variations in an urban groundwater body highly affected by groundwater heat pumps. Sci. Total Environ. 2014, 485, 575–587. [Google Scholar] [CrossRef]
  47. Garcìa-Gil, A.; Mejías Moreno, M.; Garrido Schneider, E.; Marazuela, M.A.; Abesser, C.; Lázaro, J.M.; Sánchez Navarro, J.A. Nested Shallow Geothermal Systems. Sustainability 2020, 12, 5152. [Google Scholar] [CrossRef]
  48. Permanda, R.; Ohtani, T. Thermal Impact by Open-Loop Geothermal Heat Pump Systems in Two Different Local Underground Conditions on the Alluvial Fan of the Nagara River, Gifu City, Central Japan. Energies 2022, 15, 6816. [Google Scholar] [CrossRef]
  49. Bates, B.C.; Kundzewicz, Z.W.; Wu, S.; Palutikof, J.P. Climate Change and Water; Technical Paper of the Intergovernmental Panel on Climate Change; IPCC Secretariat: Geneva, Switzerland, 2008; p. 210. [Google Scholar]
  50. Poulin, A.; Brissette, F.; Leconte, R.; Arsenault, R.; Malo, J.S. Uncertainty of hydrological modelling in climate change impact studies in a Canadian, snow-dominated river basin. J. Hydrol. 2011, 409, 626–636. [Google Scholar]
  51. Sonnenborg, T.O.; Seifert, D.; Refsgaard, J.C. Climate model uncertainty versus conceptual geological uncertainty in hydrological modeling. Hydrol. Earth Syst. Sci. 2015, 19, 3891–3901. [Google Scholar] [CrossRef] [Green Version]
  52. Chiew, F.H.S.; Teng, J.; Vaze, J.; Post, D.A.; Perraud, J.M.; Kirono, D.G.C.; Viney, N.R. Estimating climate change impact on runoff across southeast Australia: Method, results, and implications of the modeling method. Water Resour. Res. 2009, 45, W10414. [Google Scholar] [CrossRef]
  53. Vaze, J.; Post, D.A.; Chiew, F.H.S.; Perraud, J.M.; Viney, N.R.; Teng, J. Climate non-stationarity—Validity of calibrated rainfall-runoff models for use in climate change studies. J. Hydrol. 2010, 394, 447–457. [Google Scholar] [CrossRef]
  54. Jang, S.; Hamm, S.Y.; Yoon, H.; Kim, G.-B.; Park, J.H.; Kim, M. Predicting long-term change of groundwater level with regional climate model in South Korea. Geosci. J. 2015, 19, 503–513. [Google Scholar] [CrossRef]
  55. Achieng, K.O.; Zhu, J. Estimation of groundwater recharge using multiple climate models in Bayesian frameworks. J. Water Clim. Chang. 2021, 12, 3865. [Google Scholar] [CrossRef]
  56. Kelleher, C.; Wagener, T.; Gooseff, M.; McGlynn, B.; McGuire, K.; Marshall, L. Investigating controls on the thermal sensitivity of Pennsylvania streams. Hydrol. Process. 2012, 26, 771–785. [Google Scholar] [CrossRef]
  57. Jackson, F.L.; Fryer, R.J.; Hannah, D.M.; Millar, C.P.; Malcolm, I.A. A spatio-temporal statistical model of maximum daily river temperatures to inform the management of Scotland’s Atlantic salmon rivers under climate change. Sci. Total Environ. 2018, 612, 1543–1558. [Google Scholar] [CrossRef] [PubMed]
Figure 1. Schematization of the Piave Valley near Longarone. The study area coincides with the Villanova River terrace. The contour lines are represented only along the sides of the valley to delimit the area occupied by the rock formations.
Sustainability 15 00270 g001
Figure 2. Schematic cross-section of the Piave Valley corresponding to the study area (not to scale).
Sustainability 15 00270 g002
Figure 3. GWHP, wells and piezometers within the study area. The names of the wells and piezometers are listed in Table 1, and their initial letters define their use: “Pz” is used for piezometers, “P” for extraction wells, “S” for injection wells and “W” for industrial and inactive wells.
Sustainability 15 00270 g003
Figure 4. Thermal logs measured in the piezometers during the four surveys. These graphs refer to the measurements in the ascending phase.
Sustainability 15 00270 g004
Figure 5. Hydraulic head and temperature of continuous monitoring in Pz4 (29/05/2020–12/02/2021). From approximately the middle of September, the measured temperatures underwent variations compared to the normal trend of the aquifer due to the injection of cooler water by GWHPs operating in the heating regime.
Sustainability 15 00270 g005
Figure 6. Isopotentiometric map of the study area (m a.s.l.), interpolated with the measures acquired on 29 March 2021.
Sustainability 15 00270 g006
Figure 7. Comparison between (a) hydraulic head from the continuous monitoring and the stage of the Piave River; and (b) aquifer temperature from the continuous monitoring and the daily average air temperature at the Longarone weather station.
Sustainability 15 00270 g007
Figure 8. Schematization of the conceptual model developed for the study area.
Sustainability 15 00270 g008
Figure 9. Villanova industrial area map, with the existing (A, B, C), planned (D) and hypothesized (E, F, G, H, I, L, M, N, O, P) plants and their configuration of wells and piezometers.
Sustainability 15 00270 g009
Figure 10. Scatter plots of steady-state calibrations, CFS1 and CFS2, referred to as 1 January 2020 and 29 March 2021, respectively.
Sustainability 15 00270 g010
Figure 11. Comparison between the simulated and observed hydraulic head in the piezometers for simulation calibration (CFT). The orange lines represent the observed values, and the blue lines represent the calculated values.
Sustainability 15 00270 g011
Figure 12. Scatter plot of CFT.
Sustainability 15 00270 g012
Figure 13. Comparison between the simulated and observed temperature values in the CHT piezometers. The red lines represent the observed values, and the blue lines represent the calculated values.
Sustainability 15 00270 g013
Figure 14. Three-dimensional distribution of hydraulic head (a) and temperature (b) calculated at the end of simulation calibration (CHT).
Sustainability 15 00270 g014
Figure 15. Isotherms resulting from Simulation PH1 (temperatures on the Celsius scale).
Sustainability 15 00270 g015
Figure 16. Thermal plumes at the end of the 30th year of the predictive simulations. The warm plumes refer to 30 September and are represented with a red line, the cold plumes refer to 28 February and are represented with a blue line; the extraction wells are denoted in green and the injection wells are denoted in black.
Sustainability 15 00270 g016
Figure 17. Vertical extension of the PH1 plume. Slice 1 coincides with the water table; Slices 2, 3, 4, and 5 are located at 10, 15, 20, and 25 m from the ground surface, respectively. The isotherms that define the plumes indicate the same temperature in all slices for Plants A, B and D: 14 °C, 14 °C, and 13.5 °C, respectively. For Plant C, the isotherm indicates 11 °C for the first 4 slices, while Slice 5 indicates 10.5 °C.
Sustainability 15 00270 g017
Figure 18. Temperature fluctuations in piezometers during the thirty years of the PH3 simulation.
Sustainability 15 00270 g018
Figure 19. Relations between the length of the plumes (L), distinguished in the cooling and heating regimes, and the flow rate of the injection wells (Q); R2 is the coefficient of correlation.
Sustainability 15 00270 g019
Table 1. Characteristics of the wells and piezometers belonging to the GWHPs of Villanova; UPZ upstream piezometer, DPZ downstream piezometer, EW extraction well, and IW injection well.
NamePlantTypeDepth (m)Depth of filter (m)Altitude (m a.s.l.)Diameter (mm)
PzP1AUPZ20.303–20.30429.35101.6
P1AEW426–12/18–20/32–34/40–42429.26230
S1AIW2.8-429.122000
S2AIW2.8-429.092000
Pz1ADPZ15.453–15.45429.17101.6
Pz2ADPZ14.703–14.70428.91101.6
P3BEW2712–27430.65400
S3BIW2.8-427.312000
Pz3BDPZ15.203–15.20426.33101.6
PzP8CUPZ303–30425.66101.6
P8CEW3020–30425.53177
S4CIW3-425.142000
Pz4CDPZ303–30425.04101.6
P10DEW3015–27429.90168.3
PzP10DUPZ200–20429.9576.2
S5DIW3-429.182000
PzS5DDPZ200–20429.1276.2
Table 2. Operating characteristics of the geothermal plants of Villanova.
PlantRegimePeriod of ActivityExtraction Rate (L/s)
ACooling1 March–31 October25.0
BCooling15 April–15 October21.6
CCooling1 March–31 October32.1
Heating1 November–28 February38.8
DCooling1 May–30 September18.0
Table 3. Monitoring period and depth of sensors installed in wells and piezometers in the study area.
IDStartEndDepth (m)
P120 June 201228 December 201717.00
PzP112 April 201712 February 202117.25
Pz107August 201212 February 202113.70
S120 June 201212 February 20212.80
P319 March 201412 February 202121.00
Pz319 March 201412 February 202113.80
S319 March 201412 February 20212.80
PzP829 May 202012 February 202120.35
Pz429 May 202012 February 202115.45
S429 May 202012 February 20213.00
Table 4. Minimum, average and maximum values of temperature (T) and hydraulic head (H) obtained from continuous monitoring.
IDHmin
(m a.s.l.)
Hmax
(m a.s.l.)
Hmean
(m a.s.l.)
Tmin
(°C)
Tmax
(°C)
Tmean
(°C)
PzP1421.86425.70422.656.612.59.9
Pz1420.90424.64421.665.313.89.9
Pz3421.58425.38422.504.114.79.7
Pz4418.92421.76419.296.113.710.2
PzP8419.27422.75420.116.213.310.3
Table 5. List of simulations performed.
IDObjectiveTypeTemporal DiscretizationSimulation Time
CFS1CalibrationFlowSteady-state1 Januray 2020
CFS2CalibrationFlowSteady-state29 March 2021
CFS3CalibrationFlowSteady-state21 April 2021
CFS4CalibrationFlowSteady-state20 May 2021
CFS5CalibrationFlowSteady-state15 June2021
CFS6CalibrationFlowSteady-state13 July 2021
CFTCalibrationFlowTransient-state1 January 2020–12 Februray 2021
CHTCalibrationFlow and heatTransient-state1 January 2020–12 Februray 2021
PH1PredictiveFlow and heatTransient-state1 January 2020–1 January 2050
PH2PredictiveFlow and heatTransient-state1 January 2020–1 January 2050
PH3PredictiveFlow and heatTransient-state1 January 2020–1 January 2050
Table 6. Starting values of flow and thermal properties used in the calibration simulations.
ParameterValue
FlowK (m/s)1.0 × 10−3
Sy (-)0.2
Ss (1/m)1.0 × 10−4
ITr (1/d)108
OTr (1/d)108
Heatne (-)0.2
Cvw (MJ·m−3·K−1)4.2
Cvs (MJ·m−3·K−1)2.4
λw (W·m−1·K−1)0.65
λs (W·m−1·K−1)1.8
acs (-)1
αL (m)5
αT (m)0.5
Table 7. Calibrated material properties.
ParametersCalibrated Values
FlowK (m/s)1.0 × 10−2
Sy (-)0.35
Ss (1/m)4.5 × 10−5
ITr (1/d)13,172.4
OTr (1/d)13,172.4
Heatne (-)0.35
Cvw (MJ·m−3·K−1)4.2
Cvs (MJ·m−3·K−1)2.4
λw (W·m−1·K−1)0.65
λs ( W·m−1·K−1)1.8
acs (-)1.0
αL (m)5.0
αT (m)0.5
Table 8. Statistical indicators calculated for each calibration simulation to evaluate the quality of the results; H, hydraulic head; T, temperature; nRMS, normalized root mean square; NSE, Nash–Sutcliffe efficiency; and RSR, RMSE-observation standard deviation ratio.
SimulationParameterN. TargetsnRMSNSERSR
CFS1H40.040.990.11
CFS2H100.060.960.19
CFS3H70.050.970.16
CFS4H70.040.980.13
CFS5H70.070.960.21
CFS6H70.050.980.15
CFTH50.070.900.32
CHTH-T50.090.890.33
Table 9. Simulated area for the plumes of PH1 on the first slice.
PlantRegimePlume Area (m2)
ACooling8976.87
BCooling11,402.16
CCooling10,306.17
Heating5061.06
DCooling7562.98
Disclaimer/Publisher’s Note: The statements, opinions and data contained in all publications are solely those of the individual author(s) and contributor(s) and not of MDPI and/or the editor(s). MDPI and/or the editor(s) disclaim responsibility for any injury to people or property resulting from any ideas, methods, instructions or products referred to in the content.