Article

Finite Element Analysis of Novel Stiffened Angle Shear Connectors at Ambient and Elevated Temperature

1
Department of Civil Engineering, Faculty of Engineering, University of Malaya, Kuala Lumpur 50603, Malaysia
2
School of Civil & Environmental Engineering, Science & Engineering Faculty, Queensland University of Technology, 2 George St, Brisbane, QLD 4000, Australia
3
Construction Engineering Department, Prosser a Prime AE Group, Inc. Company, Tampa, FL 33579, USA
4
Research Center for Advanced Materials Science (RCAMS), King Khalid University, P.O. Box 9004, Abha 61413, Saudi Arabia
5
Physics Department, Faculty of Science, Zagazig University, Zagazig 44519, Egypt
*
Author to whom correspondence should be addressed.
Sustainability 2023, 15(1), 184; https://doi.org/10.3390/su15010184
Submission received: 12 October 2022 / Revised: 4 December 2022 / Accepted: 7 December 2022 / Published: 22 December 2022
(This article belongs to the Special Issue Circular Economy and Clean Technology for a Sustainable Future)

Abstract

:
This is a numerical study to investigate the behavior of novel stiffened angle shear connectors embedded in solid concrete slabs at both ambient and elevated temperatures. An advanced nonlinear finite element model is developed and validated with available experimental work by Nouri, K., et al. 2021. Additionally, parametric studies are performed to evaluate the variations in concrete strength and the connector’s dimensions. The results indicate that the ultimate strength of the stiffened angle shear connector drops by 92% in 1050 °C. Comparing studies show the strength of the stiffened shear connector at 700–850 °C is equivalent to the ordinary C-shaped shear connectors. The stiffened shear connector is more ductile at elevated temperatures as compared to ambient temperatures. The shear strength raised to 66% and 159.7% by increasing the height and width of the stiffened shear connector, respectively. Furthermore, the height of the stiffened shear connector is crucial to enhance the shear strength capacity as compared to the ordinary C-shaped shear connector.

1. Introduction

The shear connector between concrete slabs and steel beams is one of the major components in composite constructions and can play a vital role in the behavior of structures. Headed stud and Perfobond shear connectors are the most common types of shear connectors whilst the application of C-shaped shear connectors has increased over the last decades. The shear connectors help to send the significant horizontal inertial forces in the slab to the major lateral load resisting parts of the structure, which provide the necessary shear connection for composite action in flexure. In the case of a fire, a composite structural system behaves quite differently from the identical system at an ambient temperature. The study of the Broadgate fire and the Cardington structure [1] has improved structural interactions and load distribution in a genuine burning building. There is a lot of interplay between heat expansion, considerable deformation, material deterioration, and the 3D effects on a building with composite elements. The thermal and structural capabilities of a thin floor beam in a burning situation were examined by [2] utilizing numerical analytical methods based on ISO Tests [3] on standard fire and natural fire. According to these researchers’ findings, the bending ability of the beam will significantly reduce by increasing temperatures, thus the shear connections are vital to the beam’s continuing operation. The differential in deformation between the steel beam and the concrete slab at ambient temperatures puts shear connections under tensile-bending-shear composite stress. Since temperature distribution in a composite section is not uniform due to material properties, failure mechanisms are more complex at elevated temperatures than at ambient levels. The shear connector must perform well as it has a major impact on the structural resistance of a member when the temperature rises. In the event of a fire, both steel and concrete members face the fire directly, whereas shear connectors indirectly face the increase in temperature that is transferred by the steel. Shear connections depend on the material strength and stiffness of the connector and on the strength of concrete placed in front of the connector; this form of failure was seen in research [4]. The post-flashover behavior of components and buildings in a fully established fire is evaluated using a fire resistance test. In the last 60 years, there has been no change in the way fire resistance testing is conducted. The ISO 834 standard specifies how fire testing must be performed across the world [3]. BS 476 [5] defines the standard fire testing in the United Kingdom. Fire testing on construction materials and buildings is described in parts 20–23 of the 476th Standard of the British Standard Institution BS 476-20 [6]. In 1918, ASTM issued [7] the first standard for fire resistance testing.
Finite element (FE) modeling is an important tool in investigating shear connector performance given the lack of experimental results, and can be utilized to conduct extensive parametric studies. Most of the plasticity in the concrete and shear connector occurs at the bottom of the shear connector in the loading direction. Most FE analyses presented in the literature could capture these plastic actions under shear loading of the composite beam. After only 15 min of fire [7], the shear connector loses around 50% of its capacity. Most of the recent studies of effect of fire have been evaluated on the headed stud and Profobond shear connectors. Quevedo and Silva, 2013 [8] performed FE modeling of headed stud shear connectors at elevated temperatures. Parametric numerical simulations show that when concrete failure wins over stud failure, the height of the connectors, the compressive strength of the concrete, and the level at which concrete temperature is considered, all have a significant impact on the resistance. Using Eurocode 4, Muhammad and Uche, 2016 [9] investigated the dependability of shear connectors exposed to a fire. It was found that in the event of a fire, the safety indices value reduced, and the load ratio increased at the same time. Sensitivity analysis further revealed that for a given load, the temperature and span of the beam reduce as their safety indices rise, while the ultimate tensile strength and diameter of the stud rise. Olivia Mirza et al., 2016 [10] conducted an experimental and computational examination of composite steel–concrete beams at extreme temperatures that utilized carbon nanotubes. It was found that when the specimens were subjected to extreme temperatures, there was a reduction in concrete cracking and spalling when carbon nanotubes were incorporated into concrete. The ultimate capacity of the carbon nanotube concrete was found to be comparable to that of the conventional concrete up to 200 °C. The ultimate loads of the carbon nanotube concrete increased after it was heated to 200 °C. When subjected to high temperatures, the carbon nanotube concrete demonstrated a significant reduction in spalling and cracking. At elevated temperatures, Sencu et al., 2019 [11] found that the demountable shear connections showed ductile behavior. Shear connection resistance was unaffected by increasing the embedment height of the shear studs from 100 mm to 120 mm while using C40/50 concrete. When it came to through-hole welding specimens, Chen et al., 2015 [12] produced extremely cautious estimates due to the thinness of the deck and the welding process. Omitting the deck reduction factor from the analytical calculation of EC4-1-2 by [12] with regard to the transverse deck specimen, a more accurate estimate was supplied. In addition, the temperature of the stud was offered as a design reference for the concrete-dominated failure. Lim et al., 2020 [13] found that the stress distribution of the shear stud was concentrated near the stud root. Steel material decomposition caused this spot to migrate to the stud shank at higher temperatures.
A numerical analysis technique was developed by [14] to predict the behavior of channel connections embedded in high strength concrete (HSC) under fire and compared it to the numerical analysis performed in headed stud and Perfobond shear connectors subjected to fire, and compared the performance of channel connectors to headed stud and Perfobond shear connectors. As temperatures rise, researchers discovered that the shear strength of both the concrete and the connector significantly declines at a faster pace than that of the connector. At elevated temperatures, it loses some of its structural integrity, which affects its flexural and extensional stiffness, as well as its ability to transfer shearing forces. Shear connections quickly degrade because they are exposed to temperatures between 100 °C and 150 °C higher than the surrounding concrete. Almost all specimens modeled at extreme temperatures had a negative displacement due to the large thermal expansion, which may be translated into thermal stresses at varying levels of longitudinal restriction. Another factor that might cause channel shear connections to fail in an overturning failure mode rather than the more common shearing-off failure mode is the comparatively high temperature in the bottom layers of the concrete material. Steel may act as a protective layer for concrete slabs, as seen by the temperature distribution of the steel, concrete, and shear connection layers. For the first 10 min, the HSC solid slabs with channel shear connections can withstand 60% of their maximum stress. Push-out tests and monotonic static force were used in an experiment by [15] to investigate the effects of temperature increases on the angle connector’s performance. The results demonstrate that (1) the ductility of the samples is acceptable according to [16]; (2) increasing the temperature reduces stiffness; (3) shear ductility increases; and (4) shear capacity decreases. A reduction of 18.5% to 41% in angle shear connection resistance has also been achieved at ambient temperatures up to 850 °C. At both room temperatures and extreme temperatures, the stiffened angle shear connection was tested by Nouri, K., et al. [17]. The 48 specimens were tested in the experimental study. After starting at room temperature, the samples’ temperatures were raised to 550 °C, 700 °C, and 850 °C, and they were then successively loaded to failure one after the other. For various stiffened angle shear connectors, the ductility of the stiffened shear connector enhanced by 10.7 to 15.2 percent in average as the test temperatures raised, whilst strength reductions of 6.82% to 80.02% and 8.01% to 80.20% were observed. As a result, the shear strength of the material decreased at elevated temperatures [17].
Fire can start in and burn any type of structures at any time. Elevated temperatures have a destructive effect on materials which can cause serious structural damages. A remarkable number of research has been conducted to investigate the influence of fire on head stud shear connectors. The shear strength of the headed stud drops substantially at elevated temperatures [13,14,15,16,17,18,19,20]. Although many detailed studies have been performed to assess crucial parameters of the shear connector and the effect of concrete strength on the shear strength of the shear connector, very seldom has research been found to evaluate the efficiency of elevated temperatures on the behavior and strength of shear connectors, given that the stiffened angle shear connector is a novel type of C-shaped shear connector. There is a need for more robust, simple, and cost-effective shear connectors in steel–concrete composite beams to withstand extreme fire loading conditions. The novel stiffened angle shear connector enhanced the bending resistance of the angle leg of shear connectors at elevated temperatures where steel lost the strength that makes shear connectors extremely safe in the event of a fire. The stiffened shear connector is suggested for use for structures where the temperature is high, or chance of fire is high. Additionally, due to the high shear strength of stiffened shear connectors, a lower number of shear connectors are required, which leads to saved time for installation and cost. Since the stiffened angle shear connector is a new type of C-shaped shear connector which can overcome the weaknesses of traditional C-shaped shear connectors, such as low bending moment capacity at the leg of shear connector, poor performance at elevated temperature, and low load carry capacity, its effective parameters under fire conditions are deeply investigated in this paper.

2. Finite Element Analysis

To ensure modeling accuracy, the FE modeling must be verified by experimental results of a recent study by Nouri, K., et al. [17]. An advanced FE technique, numerical modeling to simulate the push-out test of new stiffened shear connections under monotonic load, is presented.

3. Description of Stiffened Angle Shear Connector

Nouri et al., 2021 [17] proposed that the stiffened angle shear connector contains a steel angle profile and truss shaped stiffener which welded to the steel I-beam. The angle profile is welded to the steel I beam vertically, while the height of the truss stiffener is welded to the back side of the angle profile and its base is welded to the steel I-beam. In this research, two types of stiffeners are used at full and half length. In the symbolization of the specimens, the first letter indicates the type of shear connector which is A, and stands for angle profile. The first two digits indicate the height, and the second two digits indicate the length of the angle shear connector in the concrete slabs. Full-length stiffener is indicated as F and Half-length stiffener is indicated as H. The last two/three digits indicate the temperature. As an example, A-100-50-F-550 means that the specimen includes of angle shear connector embedded in reinforced concrete when it has 100 mm height and 50 mm length, angle shear connector stiffened using full-length stiffener, and is tested at 550 °C.

4. Materials Properties

4.1. Steel-Ambient Temperature

The yield strength of steel ( f y ) is considered as 345 MPa. Concrete slab shear connectors and steel reinforcing bars were subjected to kinematic bilinear stress–strain relationships with full plastic stress. The stress–strain relationship for steel is shown in Figure 1.

4.2. Steel-Elevated Temperature

Structural fire engineering relies on material thermal characteristics and material mechanical properties data, both of which are critical for thermal and structural analyses. The steel material is defined according to structural fire design specifications [21].

4.2.1. Thermal Conductivity

Temperature gradients and heat flow are used to calculate the material’s conductivity, which is a thermal attribute. To determine thermal conductivity ( λ a ), we must look at how much energy is transferred from one face of the concrete to the other when there is a unit thickness difference across a unit area, providing the following Equations (1) and (2) for λ a .
λ a = 54 3.33 × 10 2 θ a W / mK 20   ° C     θ a < 800   ° C
λ a = 27.3 W / mK 800   ° C     θ a 1200   ° C
θ a is steel temperature [°C].

4.2.2. Specific Heat

The specific heat of steel C a was determined using the following Equations (3)–(6) [19].
C a = 425 + 7.73 × 10 1 θ a 1.69 × 10 3 θ a 2 + 2.22 × 10 6 θ a 3 J / kgK 20   ° C     θ a < 800   ° C
C a = 666 + ( 13002 / 738 θ a ) J / kgK 600   ° C     θ a < 735   ° C
C a = 545 + ( 17820 / θ a 731 ) J / kgK 735   ° C     θ a < 900   ° C
C a = 650 J / kgK 900   ° C     θ a 1200   ° C
θ a is steel temperature [°C].

4.2.3. Thermal Expansion

The thermal expansion of steel should be determined according to Equations (7)–(9) in [19] as follows:
l / l = 1.2 × 10 5 θ a + 0.4 × 10 8 θ a 2 2.416 × 10 4 20   ° C     θ a < 750   ° C
l / l = 1.1 × 10 2 750   ° C     θ a 860   ° C
l / l = 2 × 10 5 θ a 6.2 × 10 3   860   ° C     θ a 1200   ° C
l is the length at 20 °C.
l is the temperature induced elongation.
θ a is steel temperature [°C].

4.2.4. Stress–Strain Curve

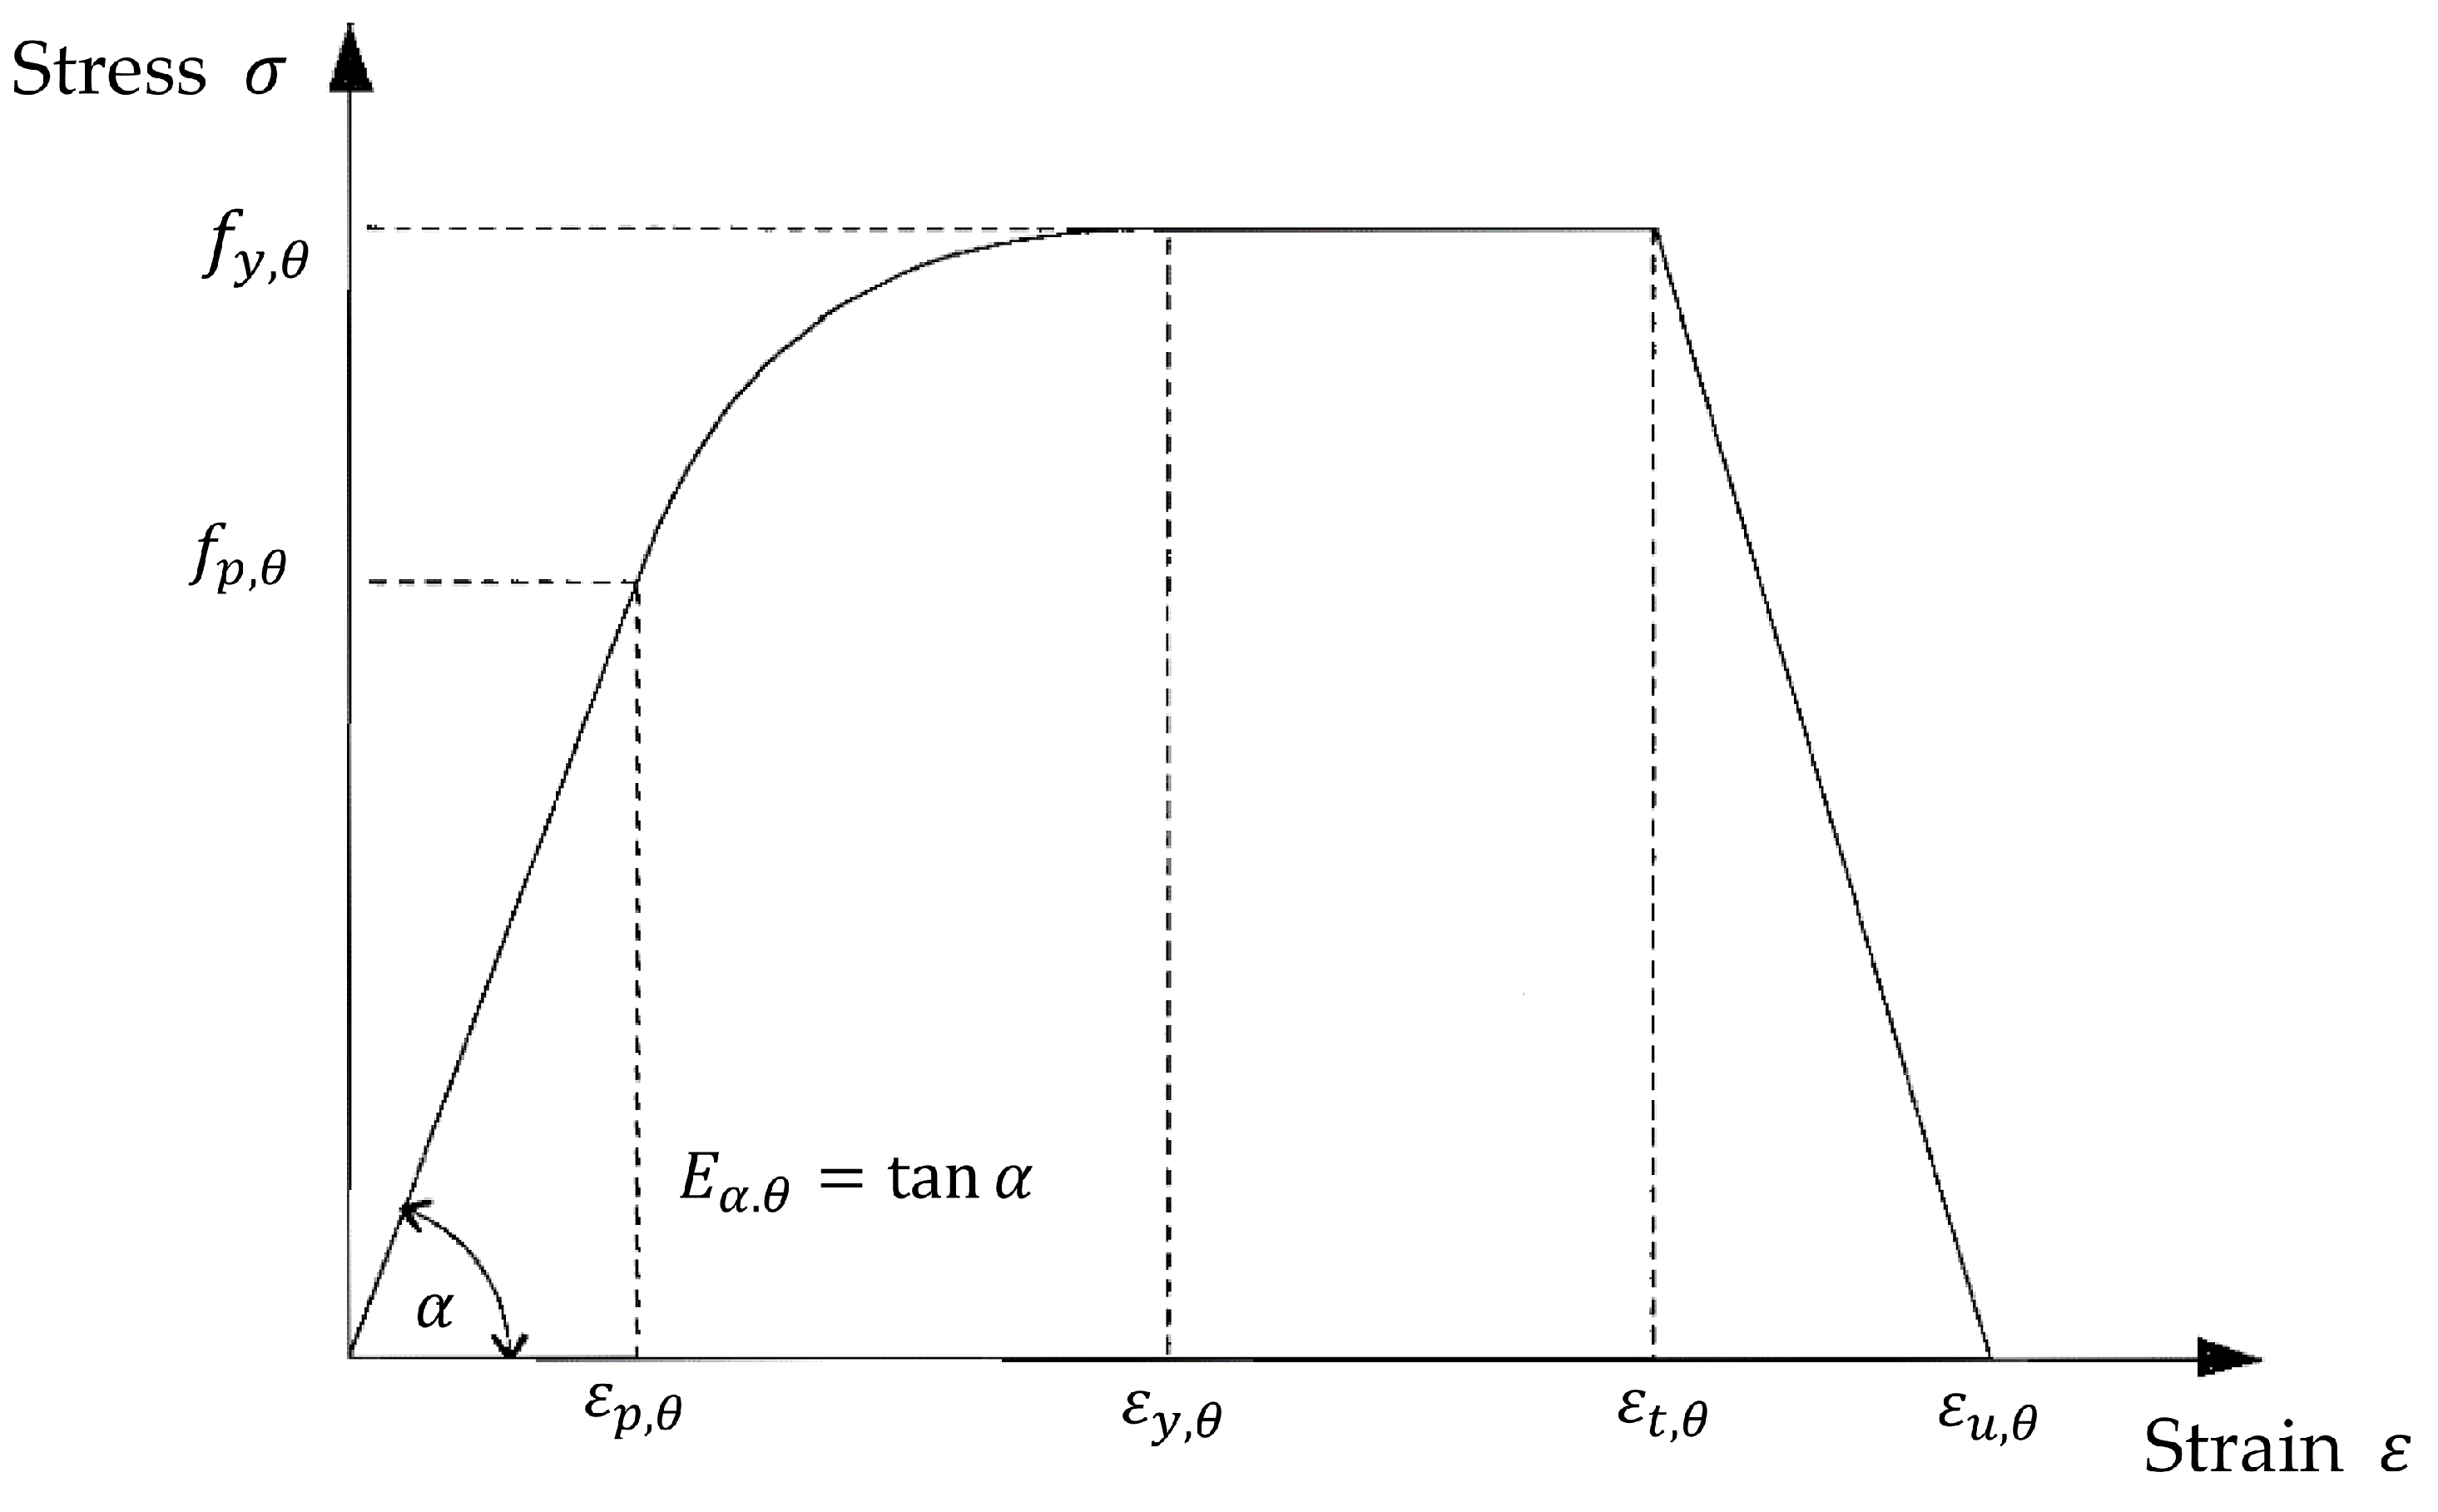
The stress–strain relationship of the steel structure at elevated temperatures is determined according to [21] as in following Equations (10)–(17) and Figure 2.
σ = ε E a θ ε     ε p θ
σ = f p θ c + ( b / a ) [ a 2 ( ε y θ ε ) 2 ] 0.5 ε p θ < ε < ε y θ
σ = f y θ ε y θ ε     ε t θ
σ = f y θ [ 1 ( ε ε t θ ) / ( ε u θ ε t θ ) ] ε t θ < ε < ε u θ
σ = 0 ε = ε u θ
a 2 = ( ε y θ ε p θ ) ( ε y θ ε p θ + c / E a θ )
b 2 = c   ( ε y θ ε p θ )   E a θ + c 2
c = ( ( f y θ f p θ ) 2 ) / ( ( ε y θ ε p θ ) E a θ 2 ( f y θ f p θ ) )
f y θ is effective yield strength.
f p θ is proportional limit.
E a θ is slope of linear elastic range.
ε y θ is yield strain.
ε t θ is limiting strain for yield strength.
ε u θ is ultimate strain.
Figure 2. Stress–strain relationship of steel at elevated temperature [21].
Sustainability 15 00184 g002
The reduction factor for the stress–strain relationship of carbon is determined by [21] as presented in Table 1.

4.3. Concrete-Ambient Temperature

The concrete slab’s substance is represented by the ABAQUS library’s Concrete Damaged Plasticity (CDP) model. The concrete grade ( f c ) considered 40 MPa as the normal weight of concrete. The material behavior is defined in terms of the elastic, plastic, compressive, and tensile characteristics of the material in this model. It is assumed that the concrete will fail in compression by crushing, or in tension via cracking. According to this study, the Poisson’s ratio and the density of concrete are both set at 0.2 and 2400 kg/m3. For the current analysis, the CDP model also requires the following parameters in addition to the compressive and tensile constitutive relationships: (i) dilation angle of 42°; (ii) eccentricity of 0.1; (iii) ratio of the strength in the biaxial state to the strength in the uniaxial state (fb0/fc0) of 1.16; (iv) parameter K, 0.667; and (v) viscosity parameter of 0 [13,22,23].
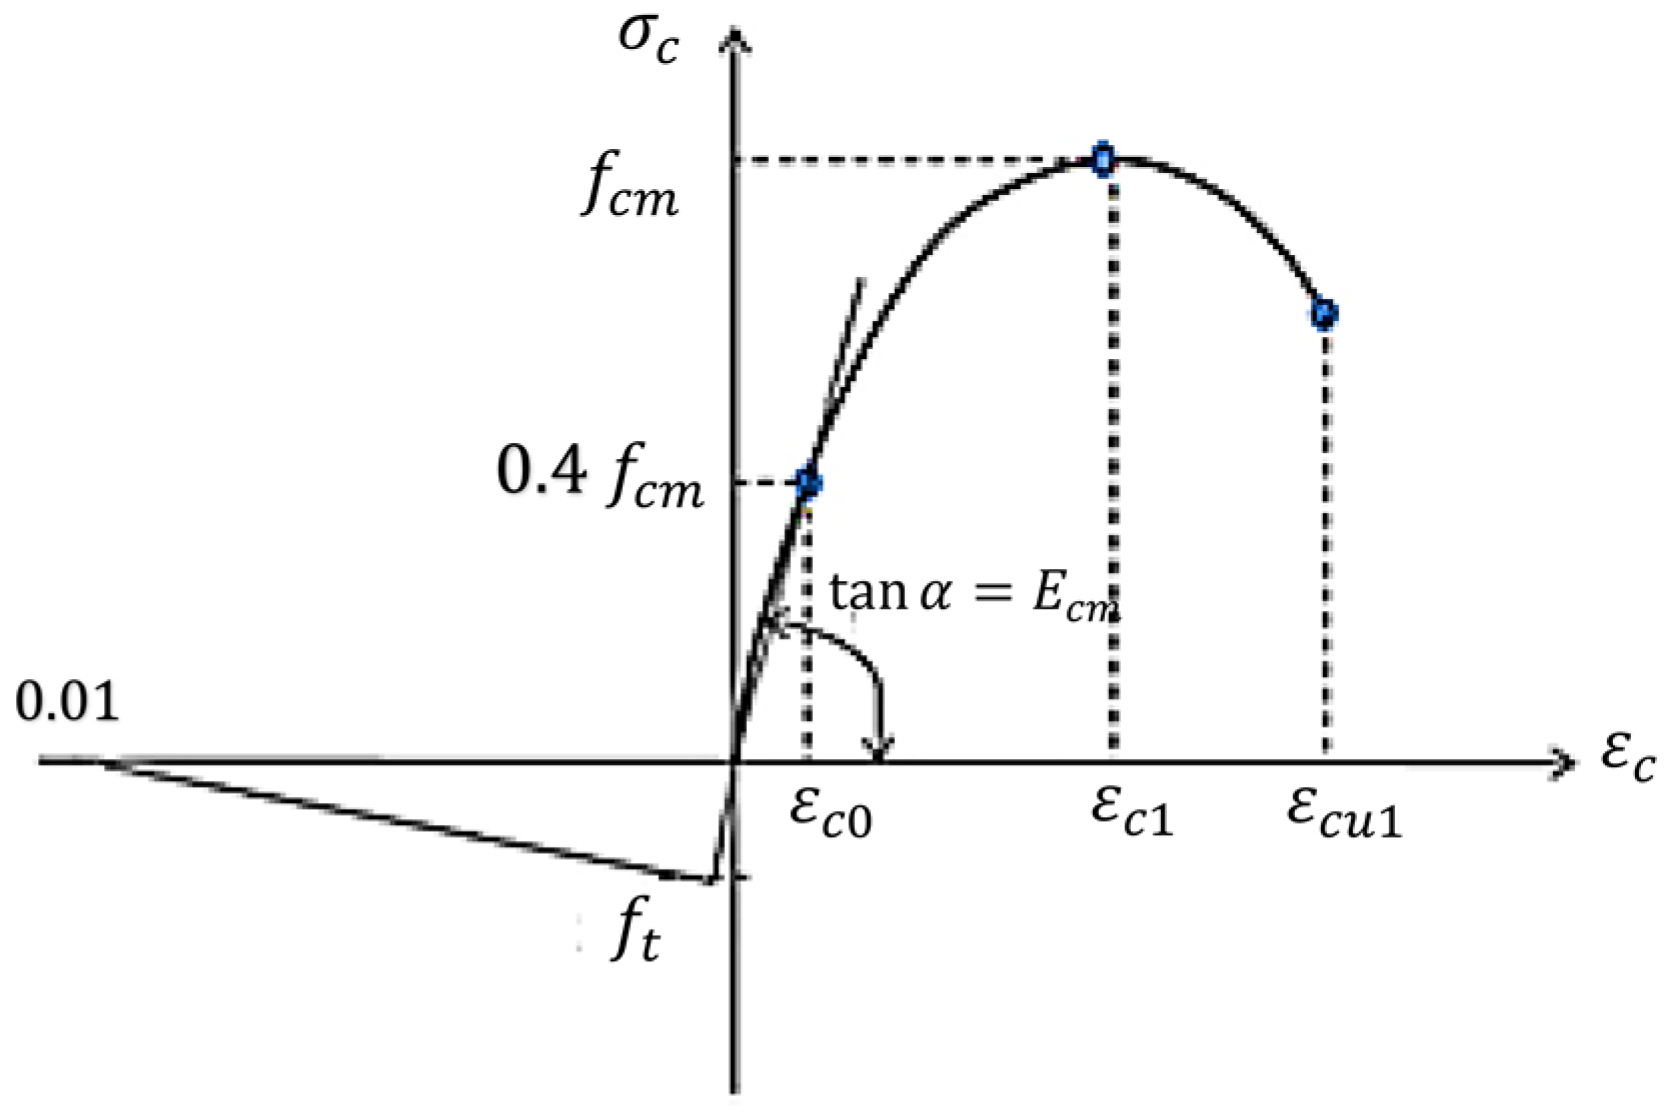
Figure 3 shows how the concrete is depicted using the Eurocode 2 [21] models. As a result of this, the stress–strain relation for concrete (i.e., the σ c   ε c relationship) under compression is provided by the following Equation (18).
σ c = ( ( k α α 2 ) / ( 1 + ( k 2 ) α ) ) f c m 0 ε c ε c u 1
In this expression, ε c u 1 is the nominal ultimate strain and f c m is the ultimate compressive strength of concrete, given by Equation (19):
f c m = f c k + 8
f c k is the characteristic cylinder strength.
The parameters k and α are given by the following equations, in which ε c 1 is the strain at the peak stress and E c m is the elastic modulus of concrete:
α = ε c / ε c 1
k = 1.05 E c m ( ε c 1 / f c m )
ε c 1 = 0.7 ( f c m ) 0.31 2.8
The nominal ultimate strain ( ε c u 1 ), as a percentage, is given by Equation (23) for f c k 50 N/mm2; otherwise, it is 3.5.
ε c u 1 = 2.8 + 27 [ ( 98 f c m ) / 100 ] 4
Additionally, the compressive damaged parameter ( d c ) needs to be defined at each inelastic strain level. The value for d c is obtained only for the descending branch of the stress–strain curve of concrete in compression, as given by Equation (24):
d c = ( f c m σ c ) / f c m ε c ε c 1
Although the tensile strength of concrete declines with increased tensile strain, the concrete remains to bear some tensile load after cracking has occurred. This process is known as tension stiffening. This will result in a more realistic interaction between the steel reinforcement and surrounding concrete in the study (i.e., bond). When the tensile strength of concrete is attained, it is expected that the tensile strength drops linearly to zero stress at a strain of 0.01. Others have used this value [24] and it permits the analysis to run smoothly and accurately without encountering any significant numerical issues. According to Eurocode 2 [21], the following Equations (25) and (26) may be used to determine the tensile strength of concrete:
f t = 0.3 f c k 2 / 3 f c k 50   N / mm 2
f t = 2.2 ln ( 1 + 0.1 f c m ) f c k > 50   N / mm 2
The tensile damage parameter d t must be specified at each increment of cracking strain in the model, just like in the compression simulation. Only the stress–strain curve’s descending branch for concrete in tension has the following Equation (27) value for d t :
d t = ( f t σ t ) / f t
in which f t is the tensile strength of concrete and σ t is the tensile stress of concrete corresponding to the tensile strain ε t .
Figure 3. Stress–strain relationship for concrete in compression and tension used for structural analysis, as given in Eurocode [21].
Sustainability 15 00184 g003

4.4. Concrete-Elevated Temperature

4.4.1. Thermal Conductivity

According to Eurocode 2 [21], the thermal conductivity of normal weight concrete is determined between lower and upper values as in the following Equations (28) and (29).
For upper limit of thermal conductivity:
λ c = 2 0.2451   ( θ / 100 ) + 0.0107 ( θ / 100 ) 2 W / mK 20   ° C θ 1200   ° C
For lower limit of thermal conductivity:
λ c = 1.36 0.136 ( θ / 100 ) + 0.0057 ( θ / 100 ) 2 W / mK 20   ° C θ 1200   ° C

4.4.2. Specific Heat

Eurocode 2 [21] is obtained by the specific heat of dry concrete ( u = 0) by following Equations (30)–(33).
C p θ = 900 J / kgK 20   ° C     θ a 100   ° C
C p θ = 900 + ( θ 100 ) J / kgK 100   ° C < θ a 200   ° C
C p θ = 1000 + ( θ 200 ) / 2   J / kgK 200   ° C < θ a 400   ° C
C p θ = 1100 J / kgK 400   ° C < θ a 1200   ° C
However, the moisture did not consider in the calculation method explicitly, so the Eurocode 2 specifies the peak of specific heat by a constant value between 100 °C and 115 °C, and linear decrease between 115 °C and 200 °C.
C p . p e a k = 900 J/kgK   for 0% of moisture content of concrete weight.
C p . p e a k = 1470 J/kgK   for 1.5% of moisture content of concrete weight.
C p . p e a k = 2020 J/kgK   for 3.0% of moisture content of concrete weight.

4.4.3. Thermal Expansion

The thermal strain of concrete ε c ( θ ) is defined by Eurocode 2 [21] as in the following Equations (34) and (35):
ε c ( θ ) = 1.8 × 10 4 + 9 × 10 6 θ + 2.3 × 10 11 θ 3 20   ° C     θ a 700   ° C
ε c ( θ ) = 14 × 10 3 700   ° C < θ a 1200   ° C

4.4.4. Density

The density of concrete influenced by water loss is defined by Eurocode 2 [21] by the following Equations (36)–(39):
ρ ( θ ) = ρ ( 20   ° C ) 20   ° C     θ a 115   ° C
ρ ( θ ) = ρ ( 20   ° C ) × ( 1 0.02 × ( θ 115 ) / 85 ) 115   ° C     θ a 200   ° C
ρ ( θ ) = ρ ( 20   ° C ) × ( 0.98 0.03 × ( θ 200 ) / 200 ) 200   ° C     θ a < 400   ° C
ρ ( θ ) = ρ ( 20   ° C ) × ( 0.95 0.07 × ( θ 400 ) / 800 )   400   ° C     θ a 1200   ° C

4.4.5. Stress–Strain Curve

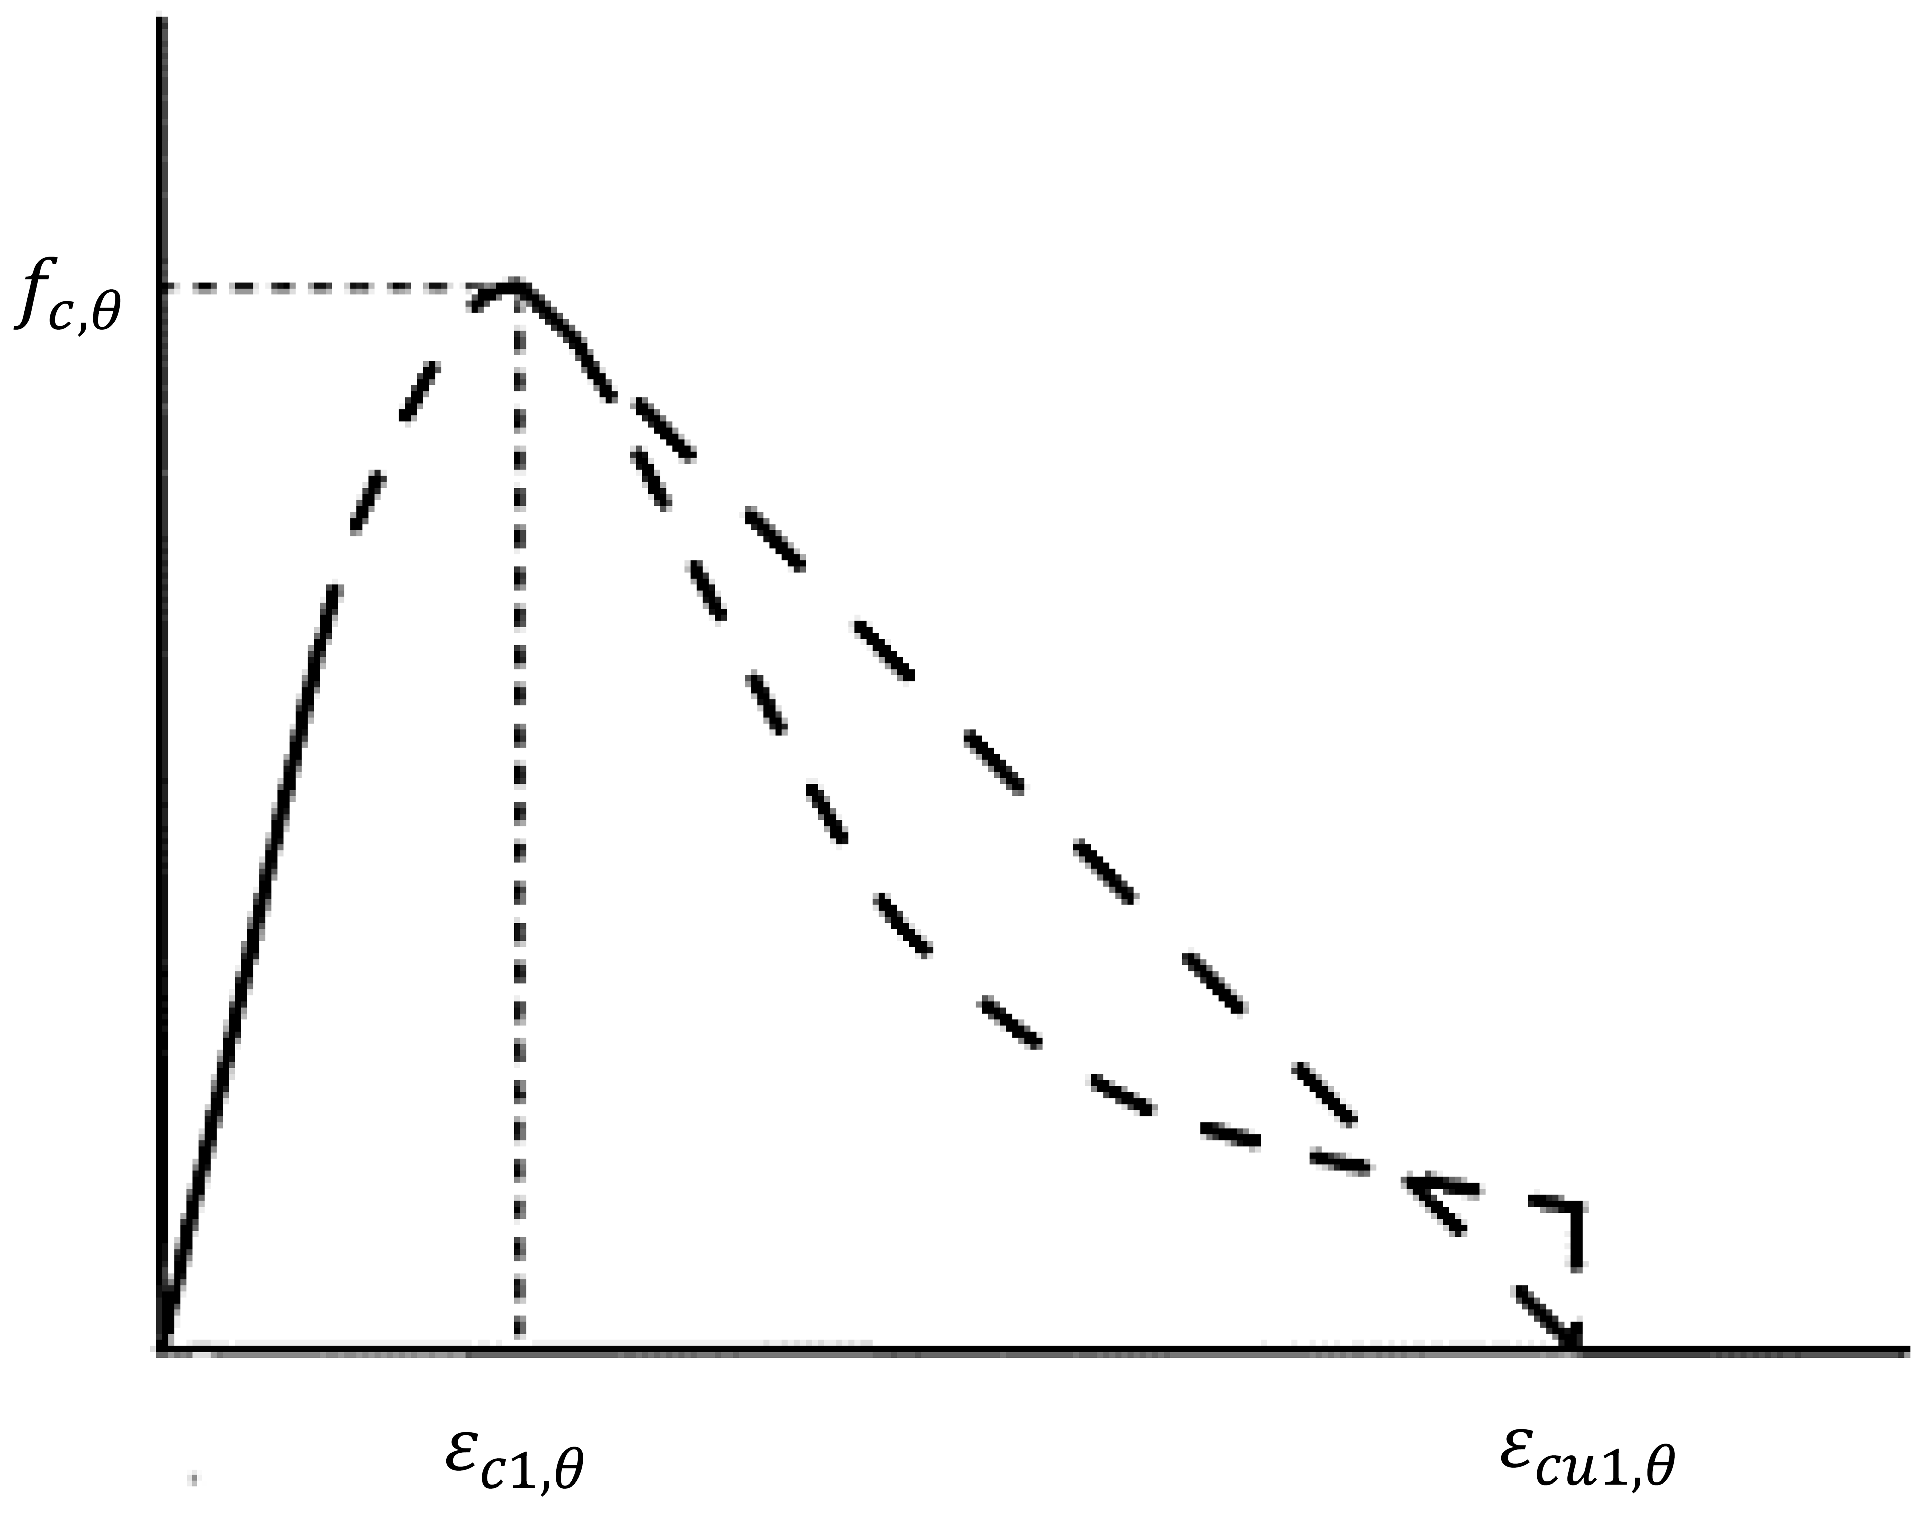
The stress–strain relationship of normal weight concrete at an elevated temperature is determined according to Eurocode 2 [21]. The following Equation (40) is to determine the compression behavior of concrete as shown in Figure 4.
σ = ( 3 × ε × f c θ ) / ( ε c 1 , θ × ( 2 + ( ε ε c 1 , θ ) 3 ) ) ε ε c 1 , θ
f c θ is the compressive strength of concrete.
ε c 1 , θ is the strain corresponding to f c θ .
For the range ε c 1 ( θ ) ε ε c u 1 , θ , the stress ( σ ), a descending branch should be adopted for numerical purposes. Linear or non-linear are permitted. ε c u 1 , θ is the ultimate strength of concrete at an elevated temperature.
Figure 4. The stress–strain relationship for concrete at elevated temperature.
Sustainability 15 00184 g004
The main value parameters of the stress–strain relationship of normal weight concrete at an elevated temperature is presented in Table 2 for Eurocode 2 [21].
To be more conservative, usually the tensile strength of concrete should be ignored; however, if it requires to count on tensile strength, the tensile strength of concrete at an elevated temperature is calculated as in the following Equations (41)–(43):
f c k , t ( θ ) = k c k ( θ ) × f c k , t
k c k ( θ ) = 1.0   20   ° C     θ 100   ° C
k c k ( θ ) = 1.0 1.0 × ( θ 100 ) / 500   100   ° C < θ 600   ° C
k c k ( θ ) is the coefficient for decrease of tensile stress of concrete.
f c k , t ( θ ) is the tensile strength of concrete at elevated temperature.
f c k , t is tensile strength of concrete at ambient temperature.

5. Modeling of the Specimens

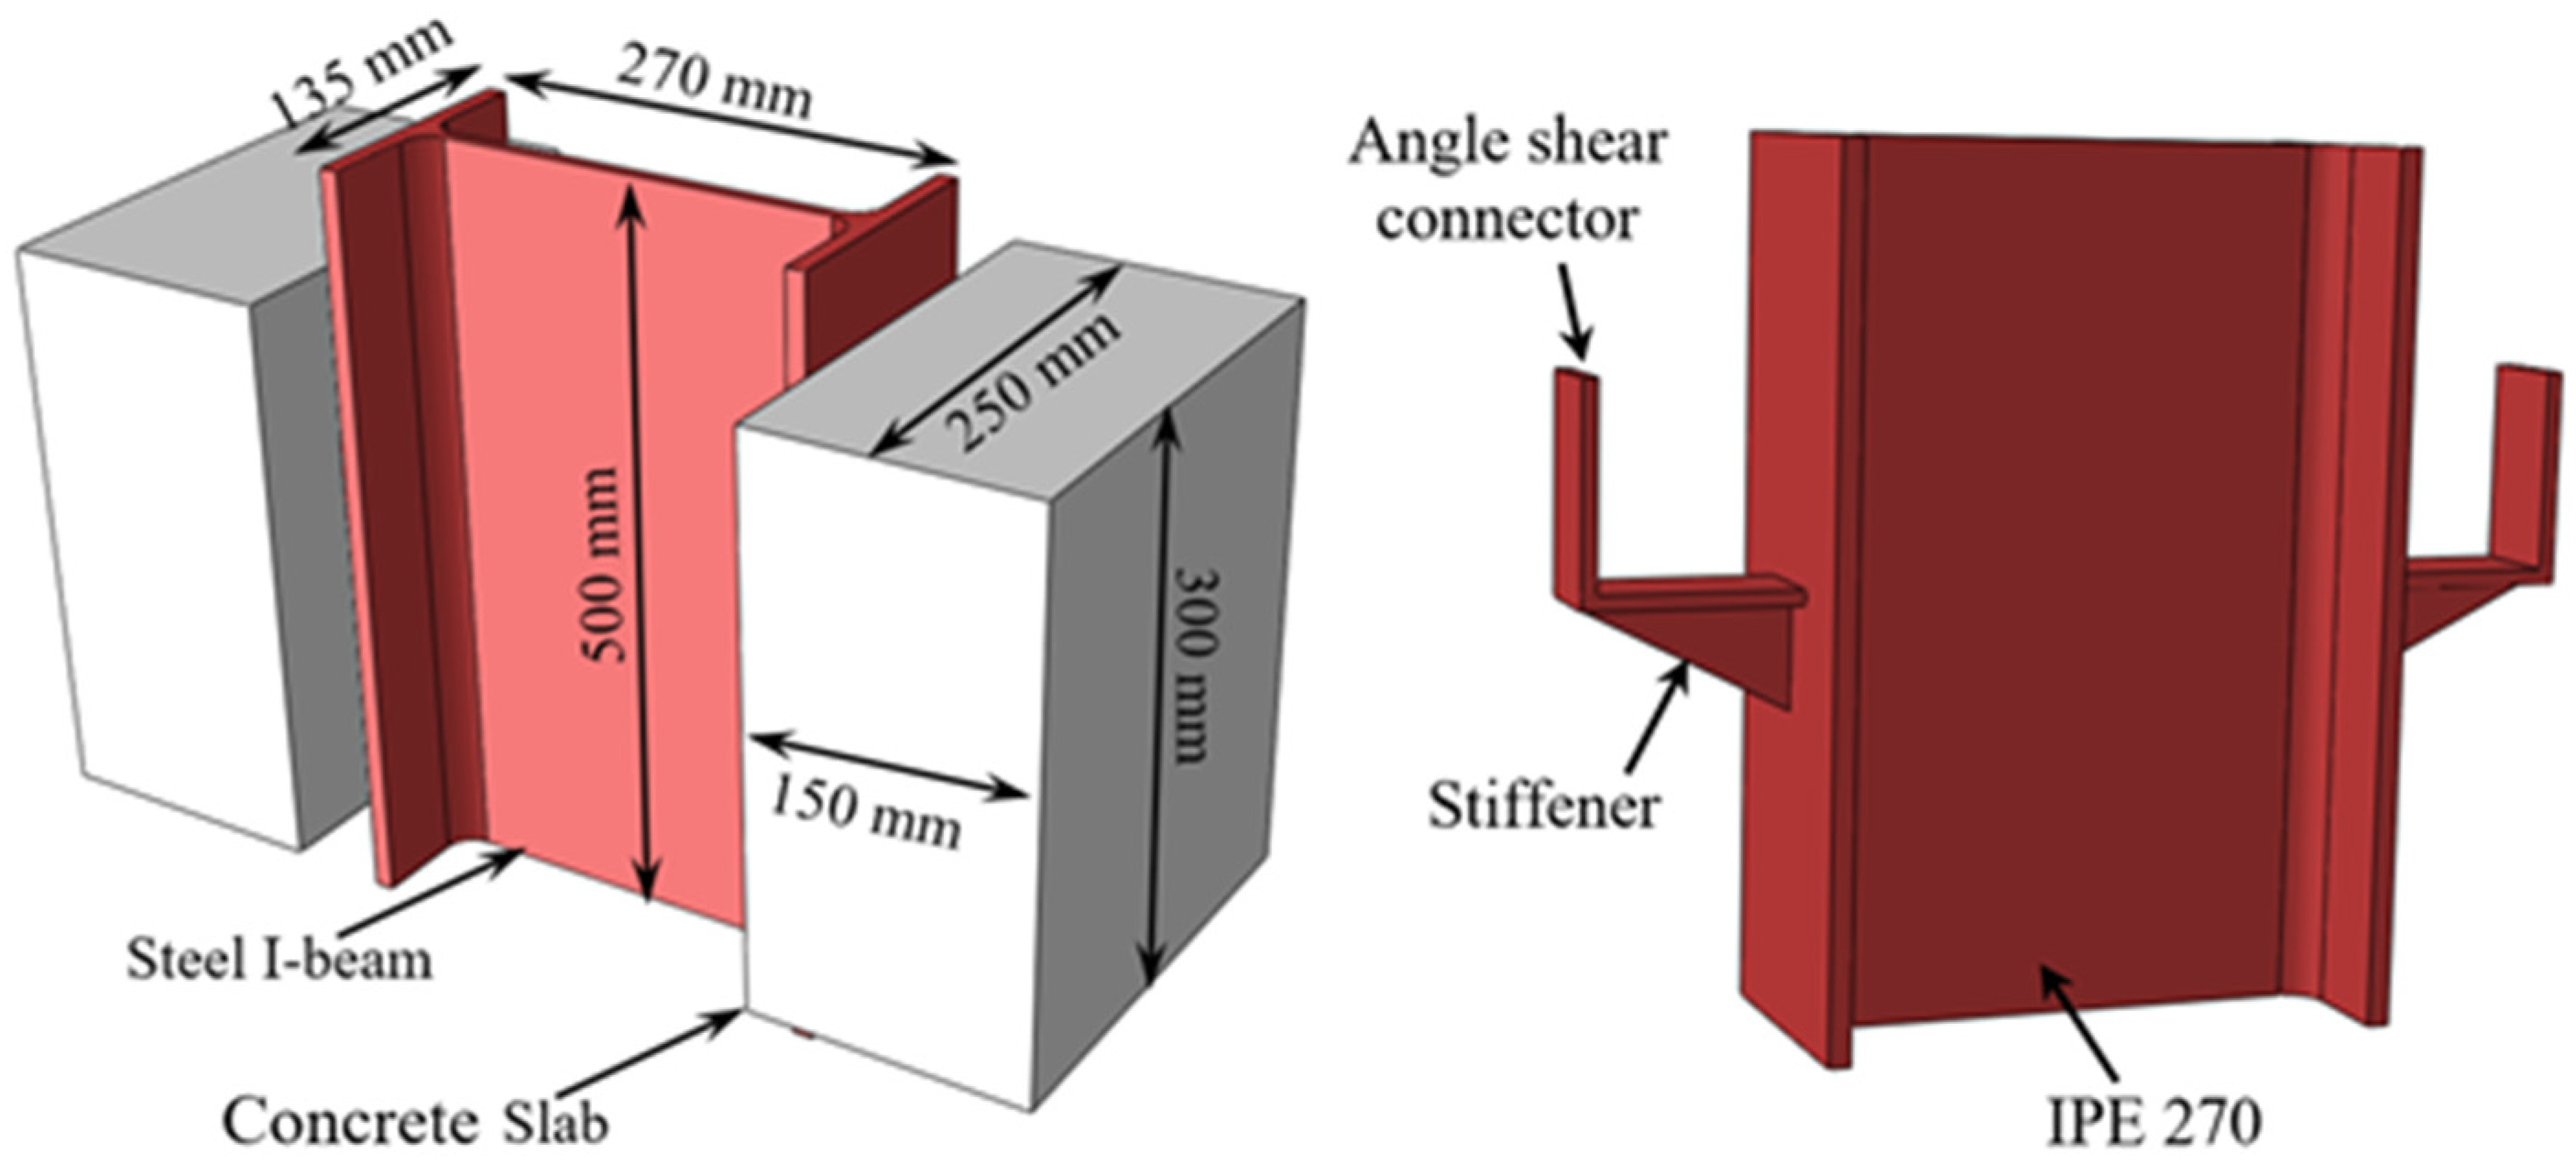
All of the steel I-beam, shear connections, reinforcing bars, and concrete slab have to be modeled in order to obtain correct results using the ABAQUS software (6.14.2). Friction and hard contact were used in the ABAQUS standard programe to simulate the interaction between the parts. Figure 5 and Figure 6 illustrate the detailing of specimens.

5.1. Element Type

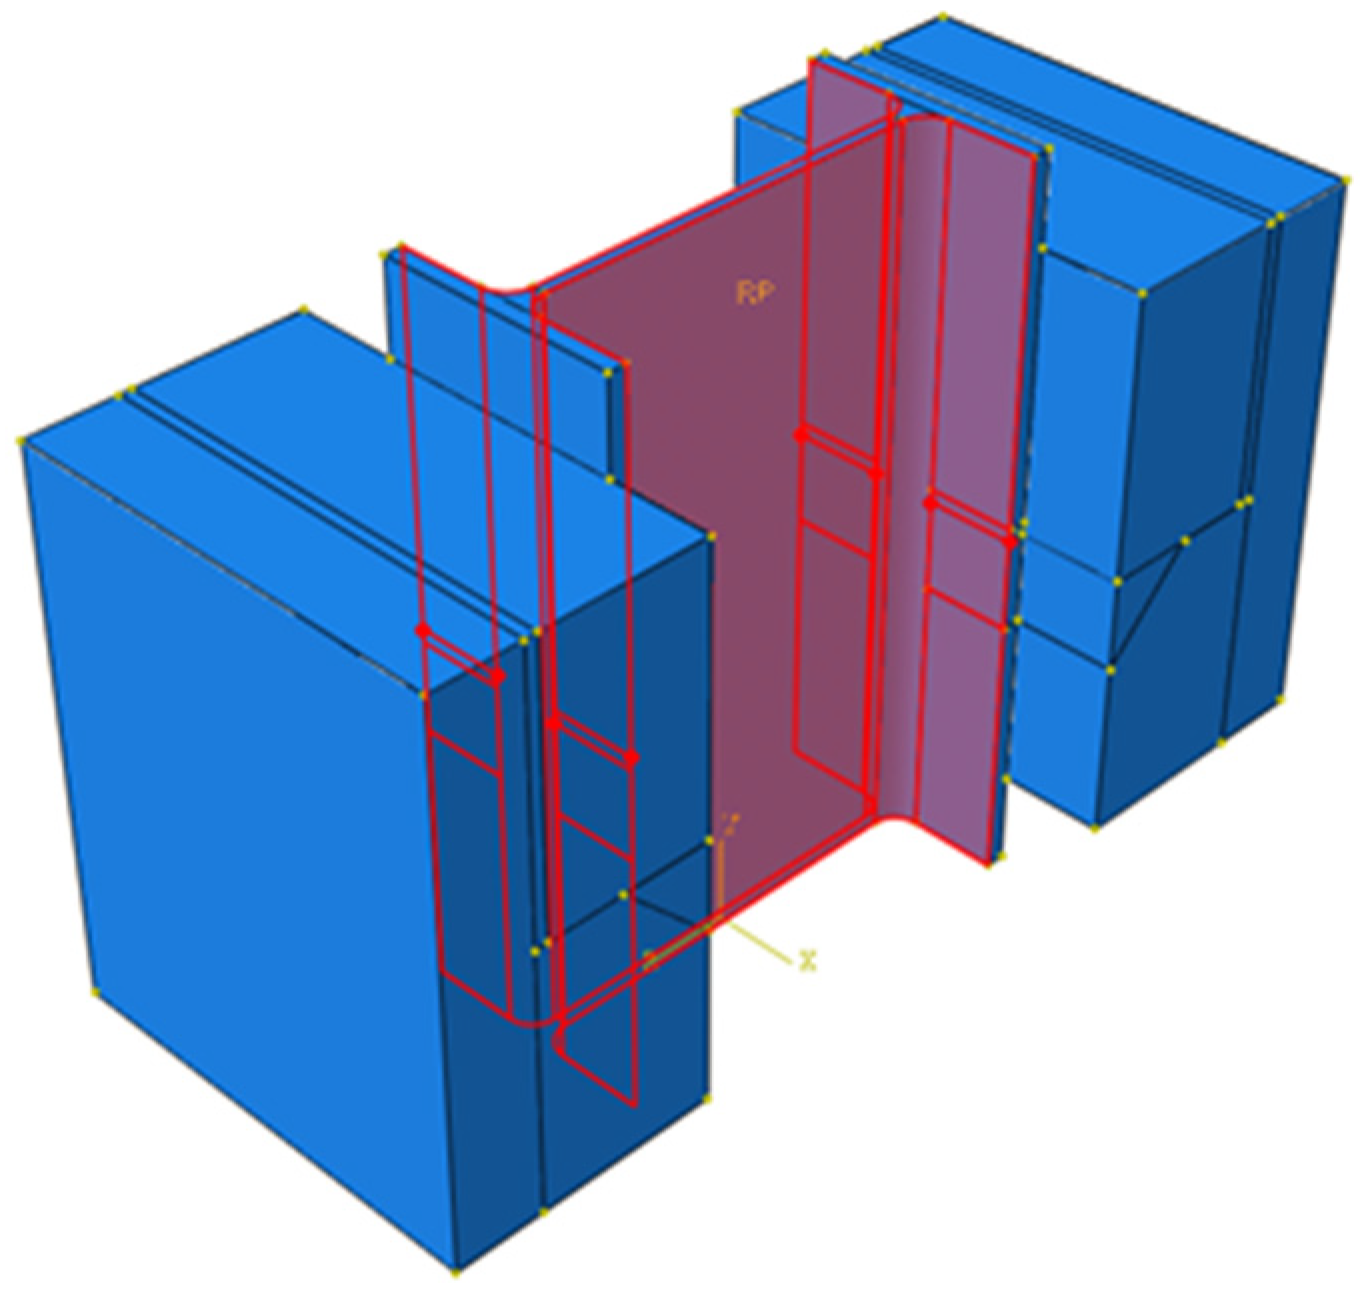
Figure 7 illustrates a typical finite element mesh used to simulate the test specimen’s geometry. The steel beam, shear connector, and concrete slab were all modeled using the eight-node solid element (C3D8R), as was the linear two-node truss element (T3D2). At each node in the global coordinate, there are two nodes and three translational degrees of freedom (translation in the x, y, and z dimensions).

5.2. Element Interaction

Accurately identifying the relationship between the pieces is critical to how finite element analysis behaves. The interaction between steel, concrete, and reinforcing elements was defined in two ways. The interaction between the steel and concrete elements was defined by the use of surface to surface contact (standard). Tangential behavior was modeled using a friction penalty concept. A steel plate-concrete block friction coefficient of 0.47 was reported by [25] with a nominal pressure range of 0–468 MPa. The stiffened angle shear connection (angle profile and stiffener) was modeled using an interlayer friction coefficient of 0.47. According to [26,27,28], we assumed that the bottom of the concrete slab and steel flange had a friction coefficient of 0.3. All contact layers were tested using a hard contact pressure-overclosure technique. Any contact pressure can be communicated between surfaces when they are in touch. If the contact pressure drops to zero, the surfaces will separate. When the space between two objects shrinks to zero, they come into touch [22]. No slide was supposed to occur between the reinforcing bars and the concrete slab to provide a solid connection. To do this, reinforcing bar elements were embedded into the concrete.

5.3. Loading and Boundary Condition

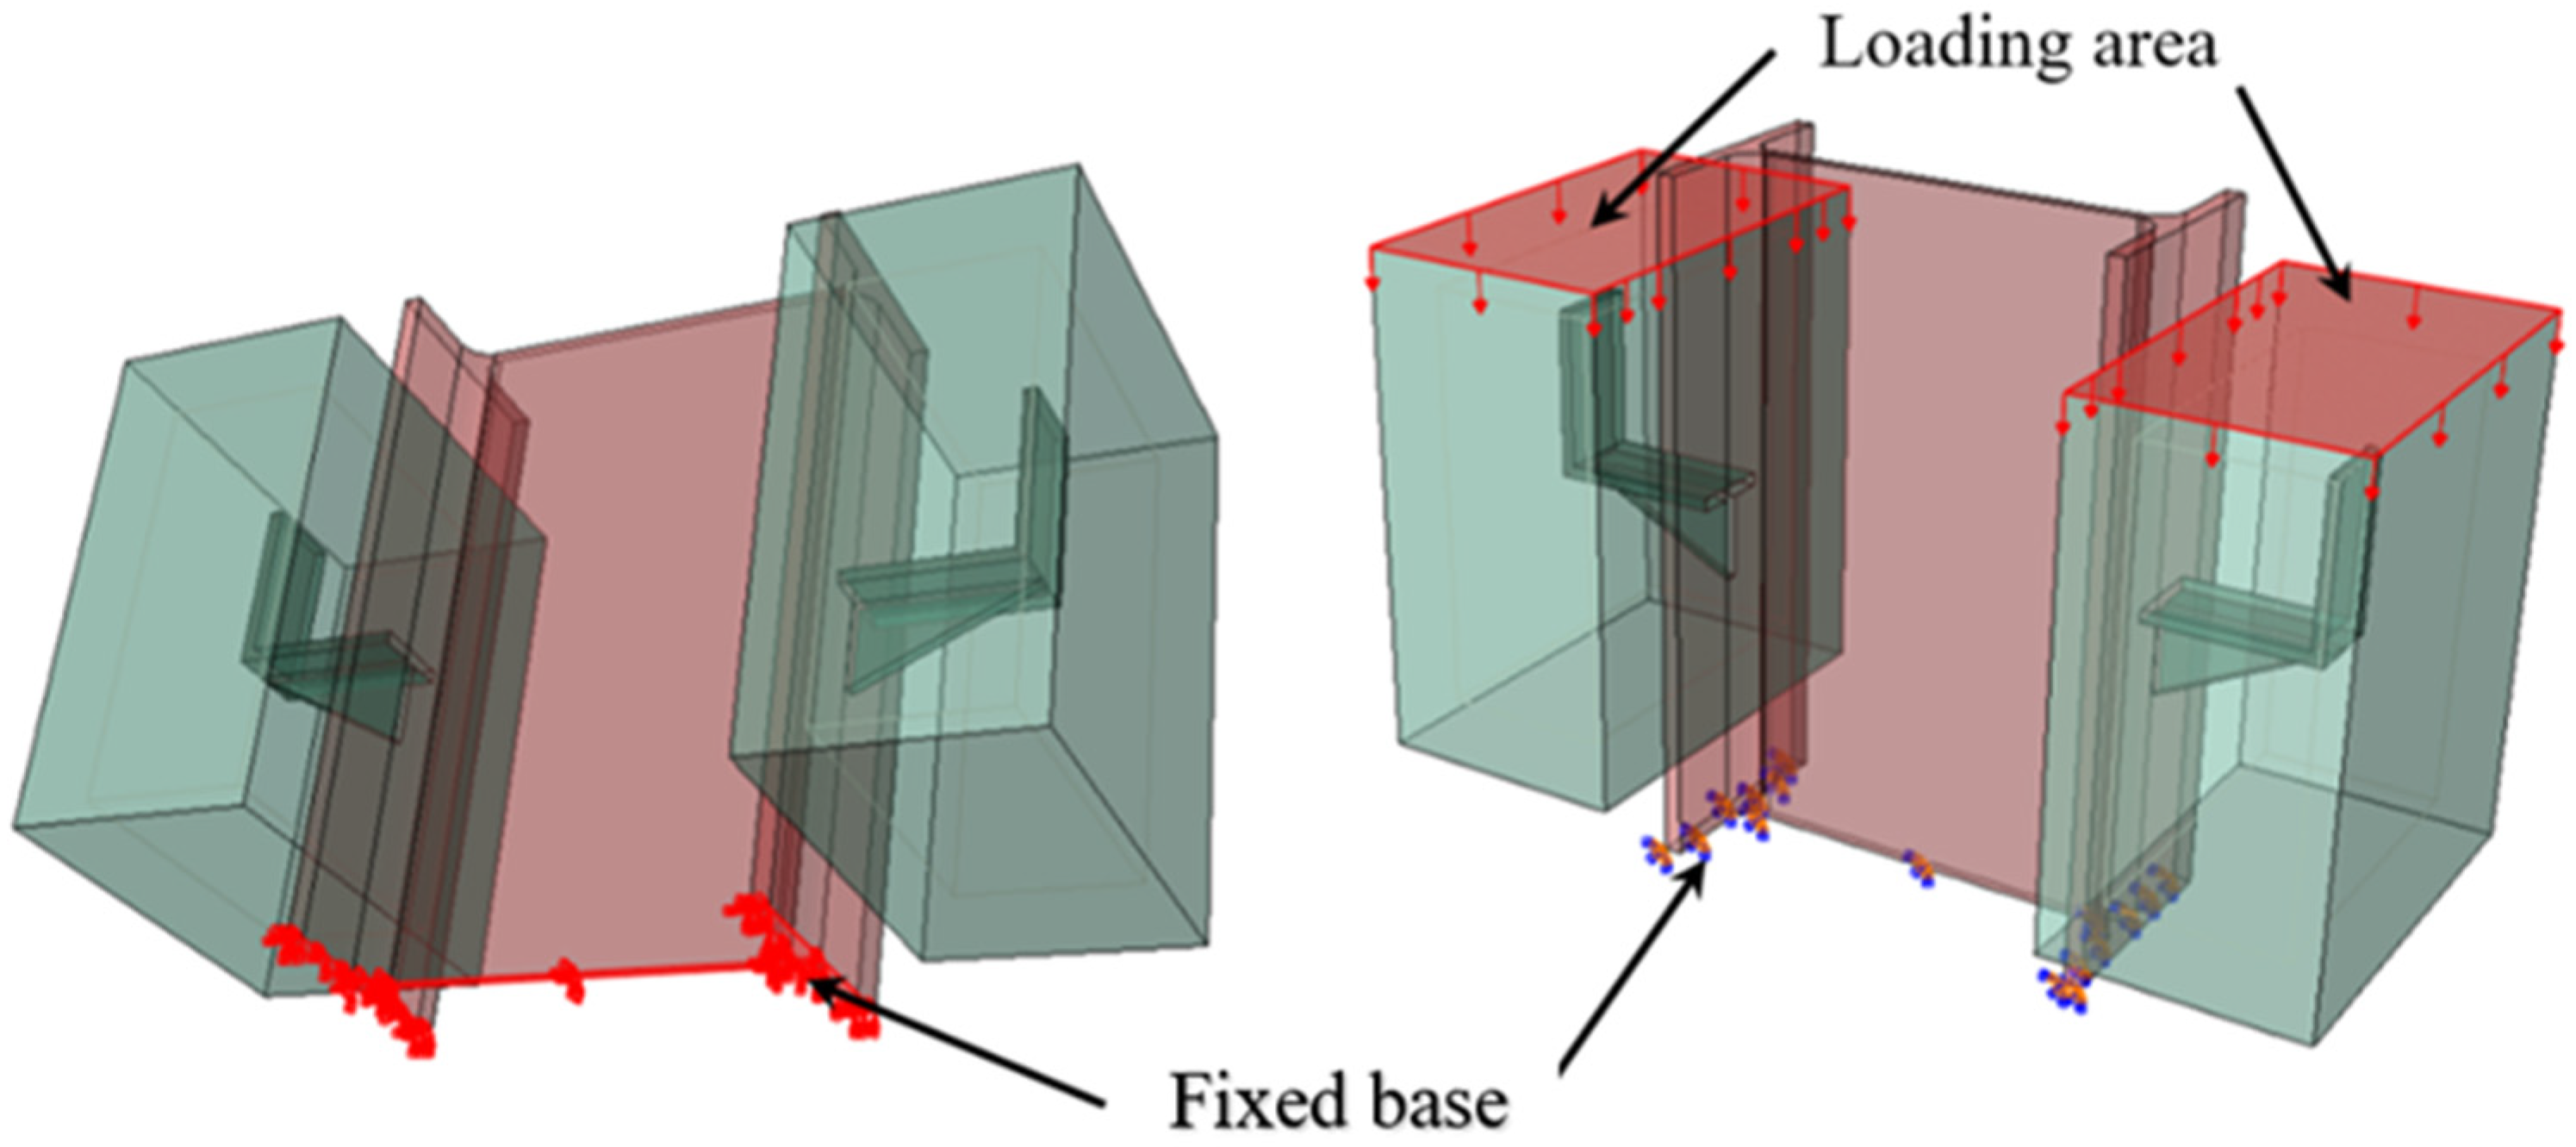
The finite element analysis was based on the same loading as the test specimen. On the concrete slab, a vertical velocity loading was used to put pressure on it. The weight is being transferred downwards. In the nonlinear stage, velocity-controlled loading is more stable than force-controlled loading. A quick loss in load-carrying capacity in brittle materials like concrete results in a significant rise in kinetic energy, which is particularly critical for these materials. To obtain a stable and reliable solution, the load application rate should be carefully designated and sufficiently slow to prevent a dramatic increase in the kinematic energy. Therefore, a uniform displacement is slowly applied to the surface of the concrete slab. The optimum loading rate was set to be 0.02 mm/s which has been used by other researchers [13,26,27,28,29,30] and also by using the trial and error approach of different loading rates. According to Figure 8, all I-beam sections were restrained against displacement in all three directions to mimic boundary conditions for specimens.
Temperature load under the coupled temp-displacement step was used to apply heat with an amplitude of heat according to the standard fire curve [3]. Figure 9 shows the area of applying heat where the heat is applied in a laboratory test.

6. Finite Element Results

6.1. Verification of Finite Element Results

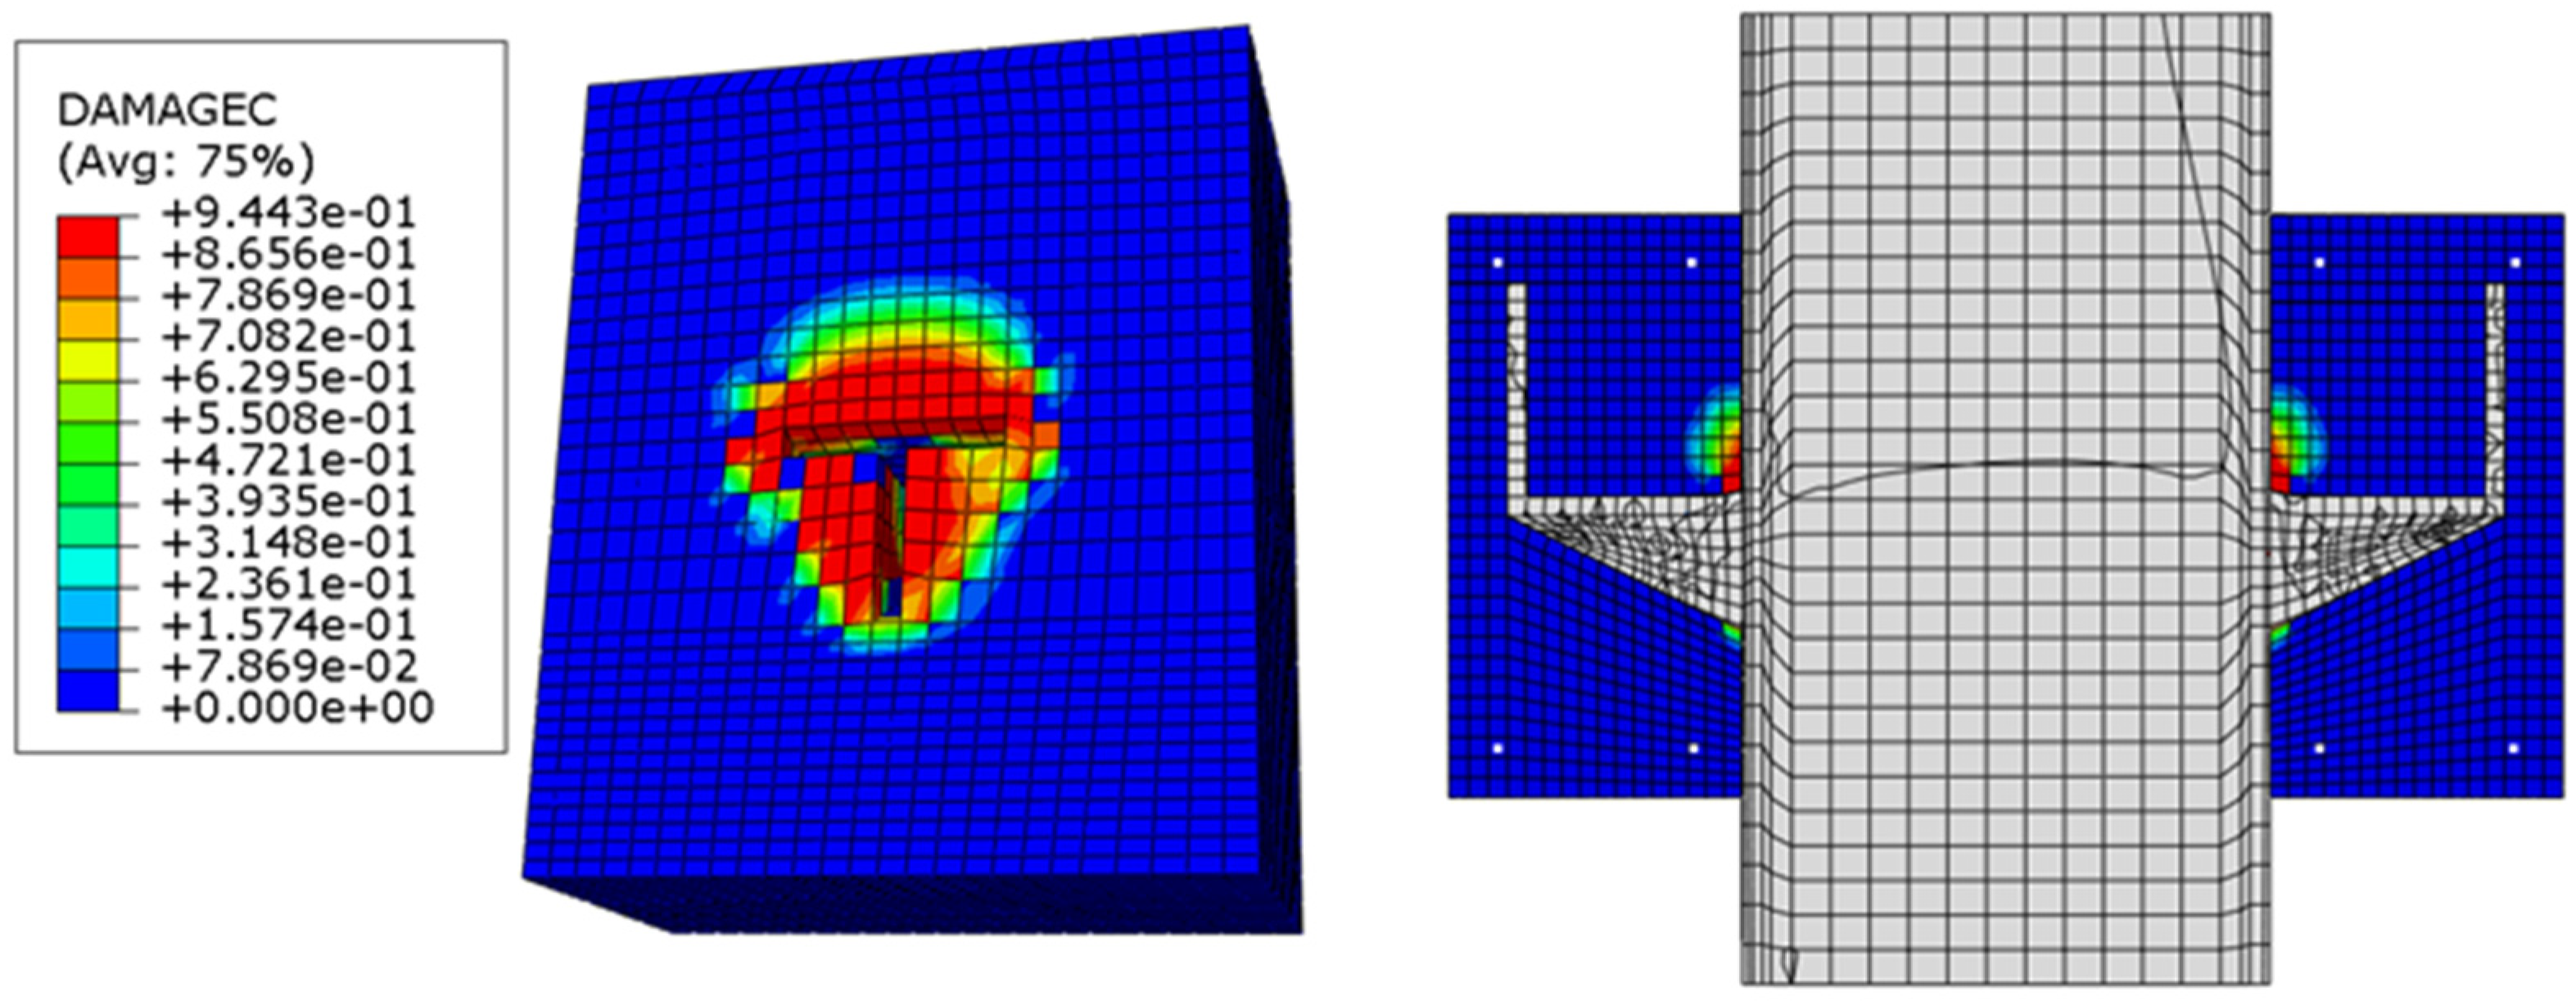
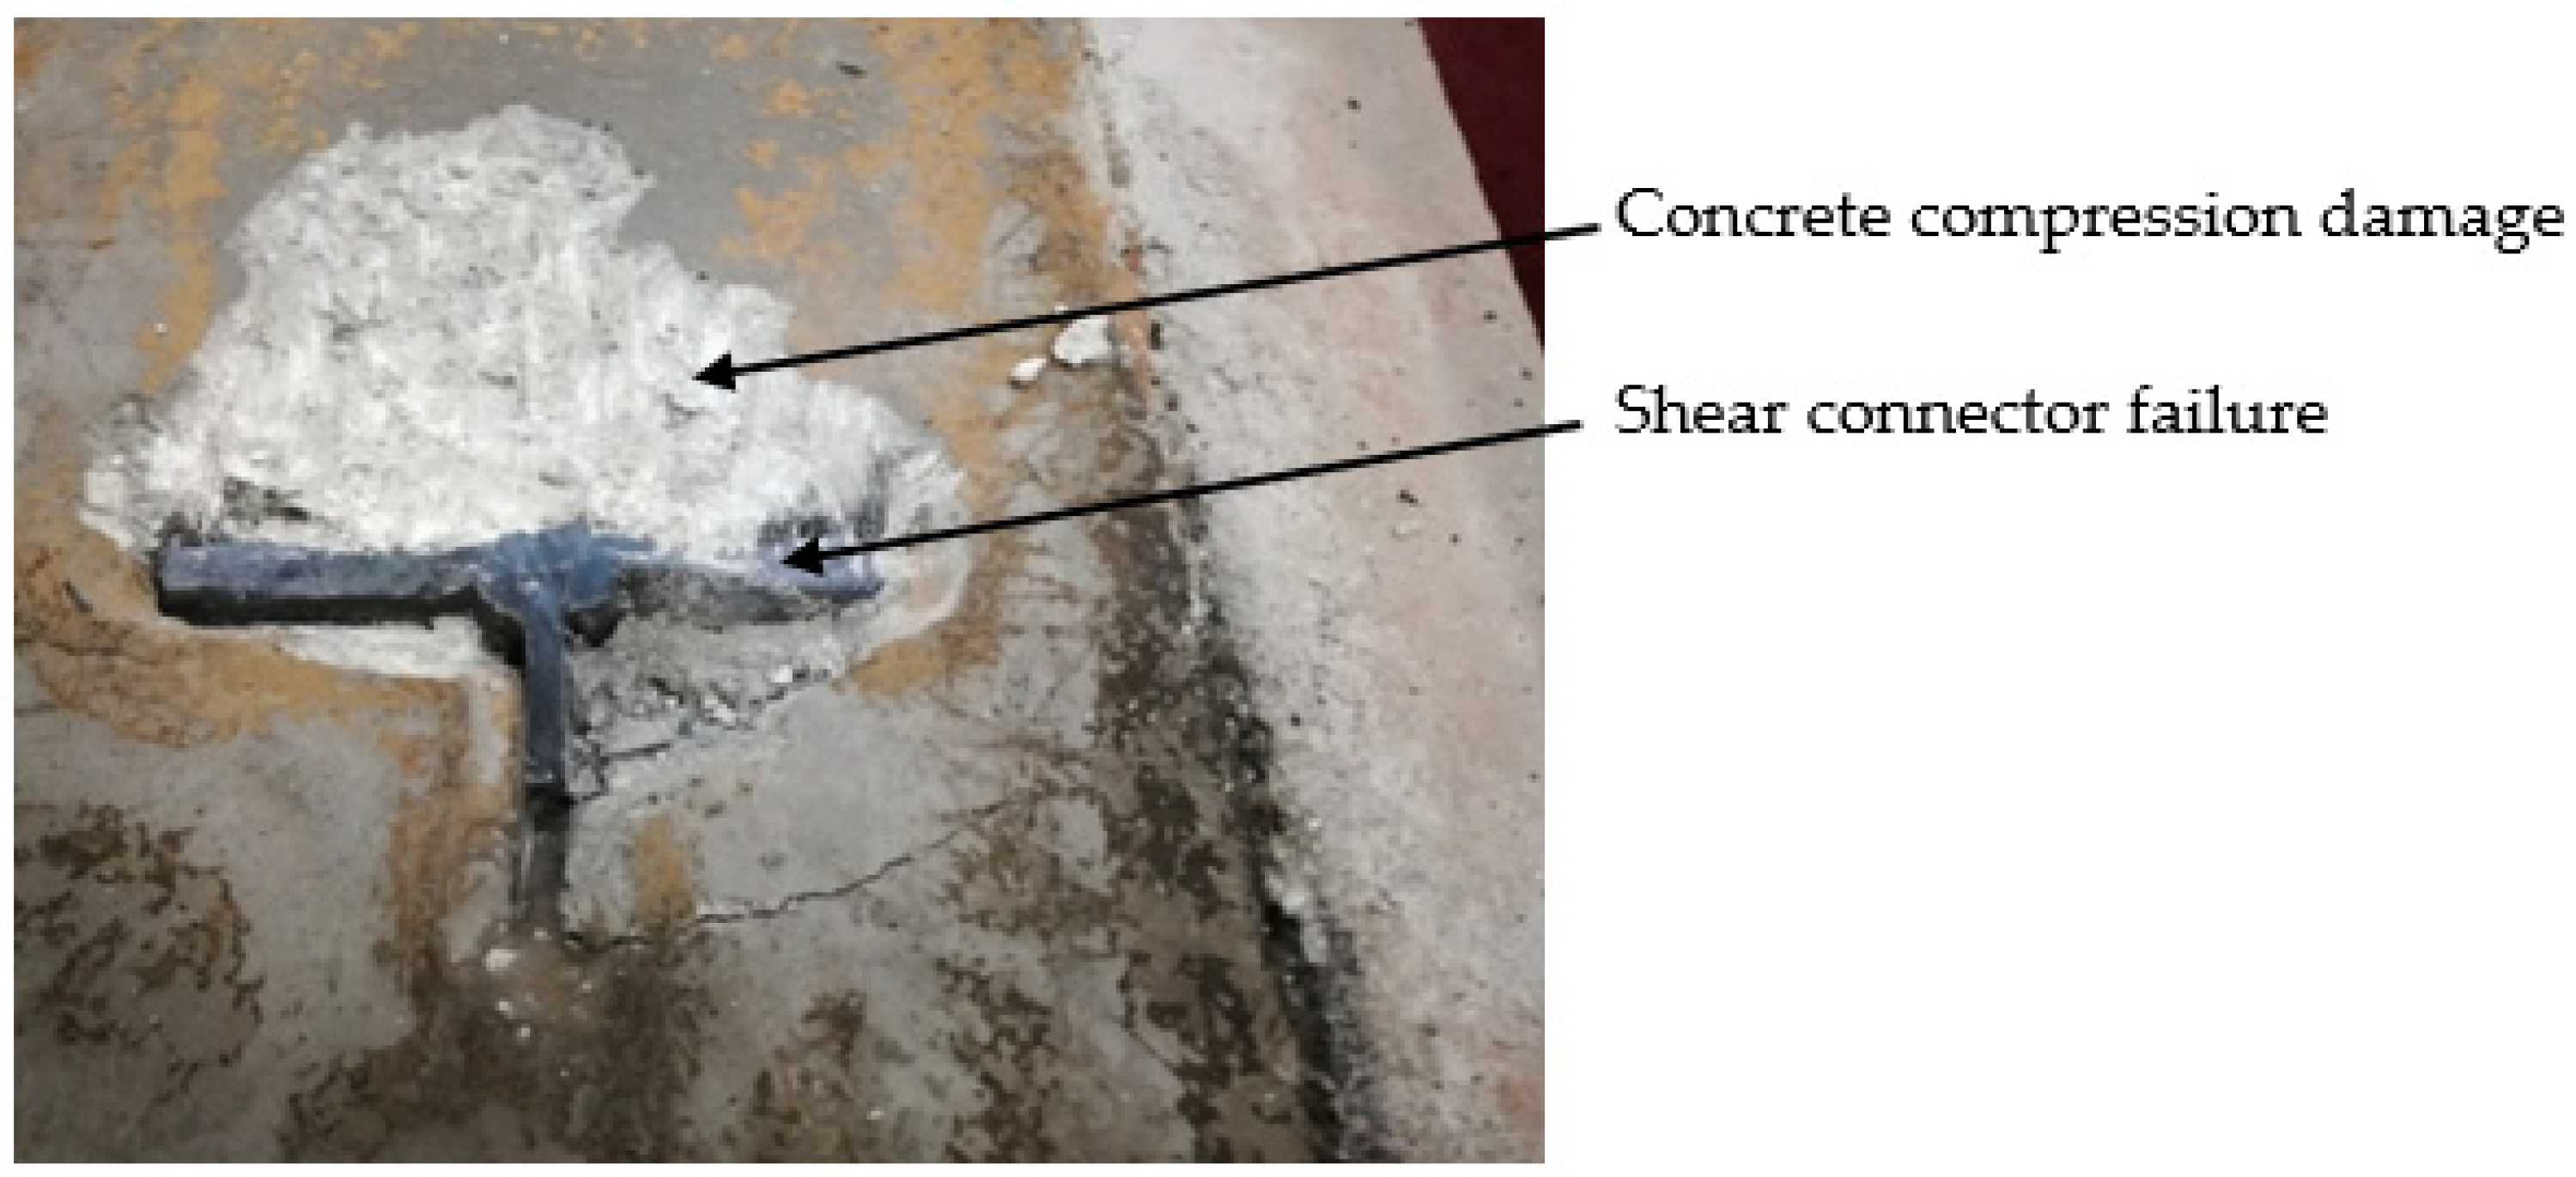
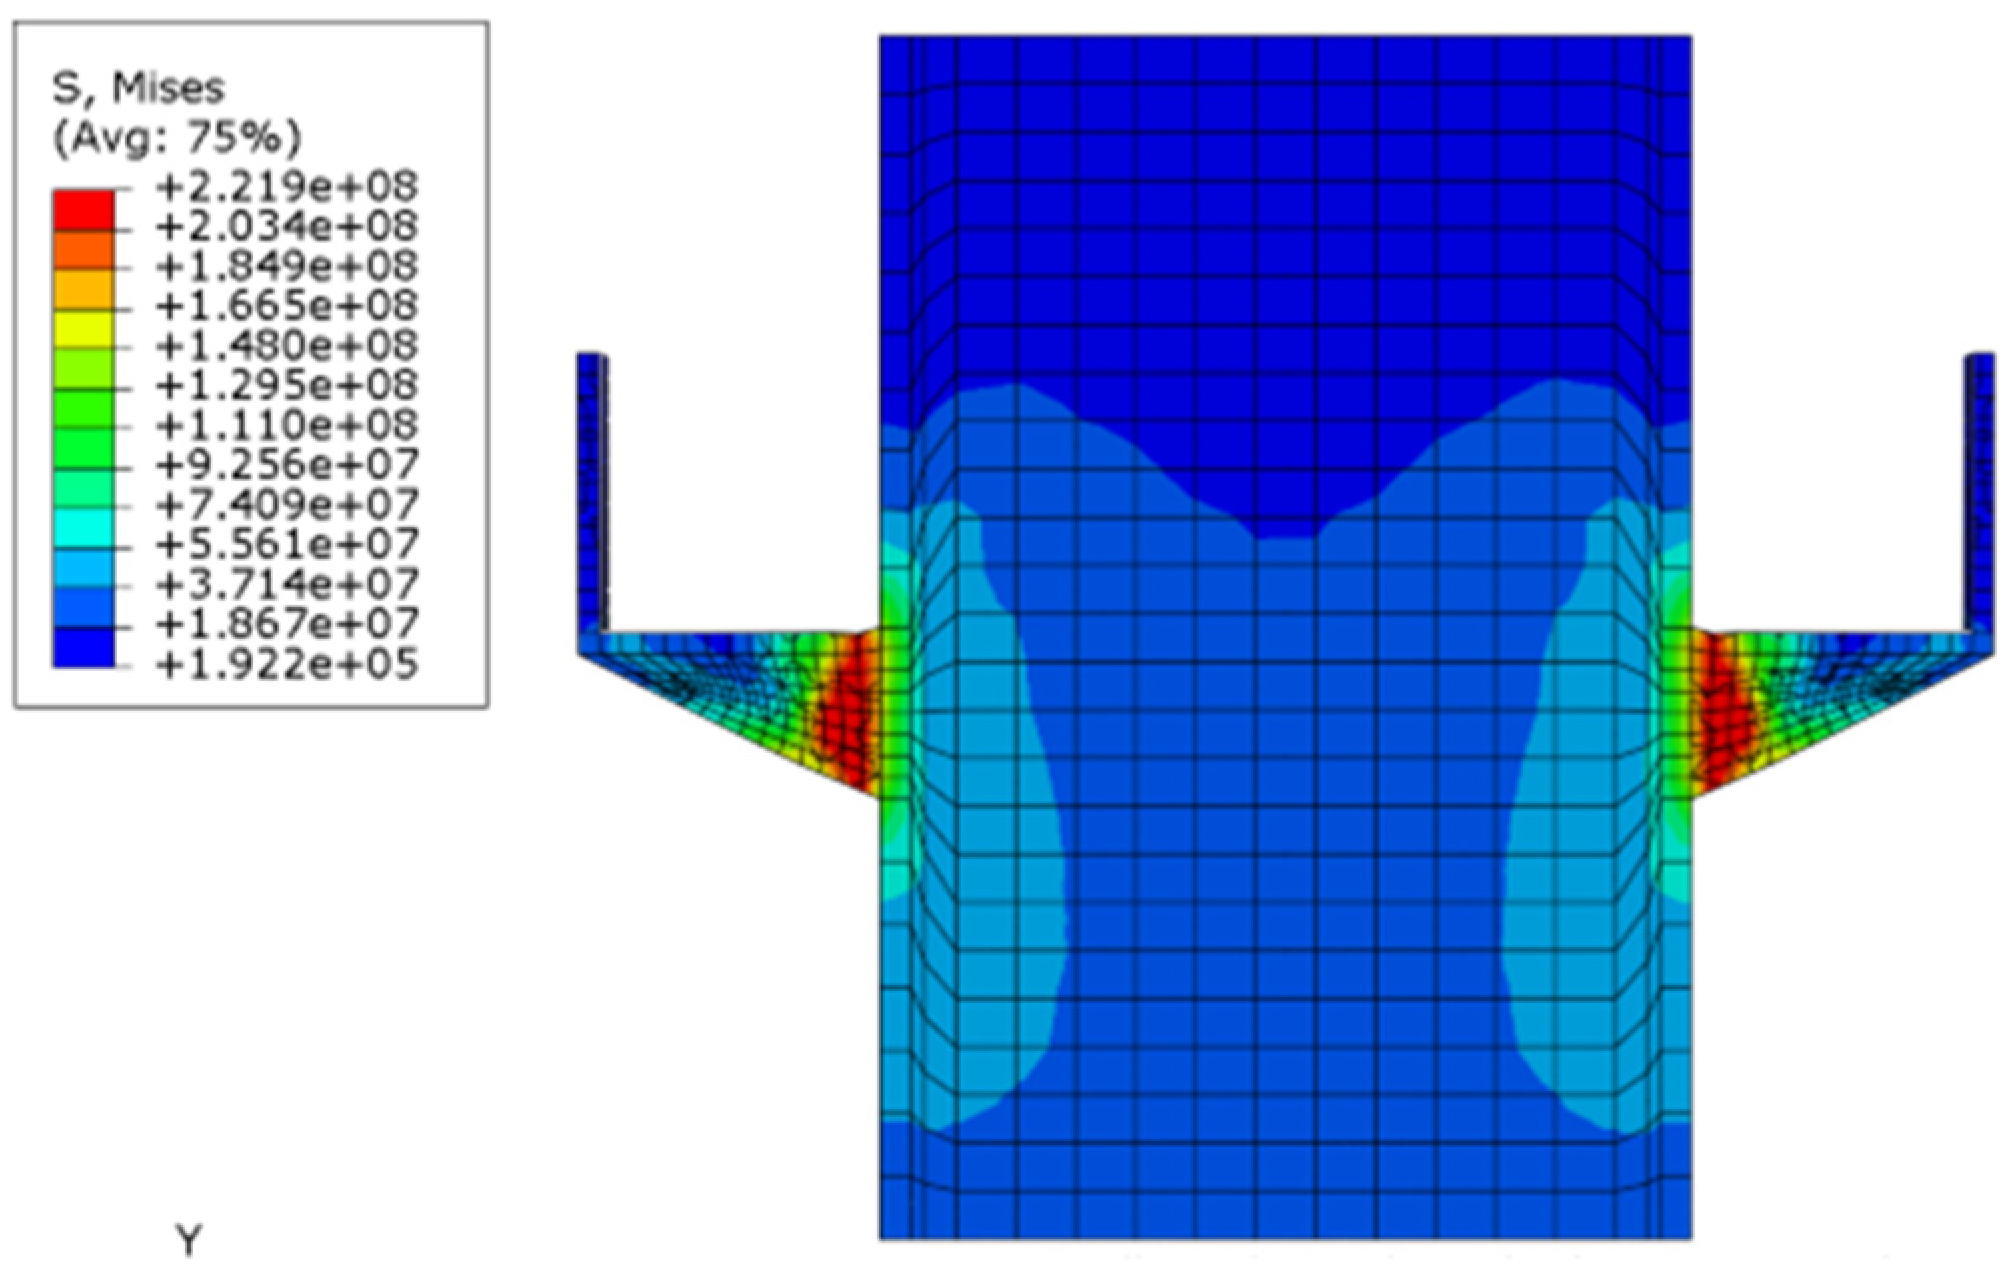
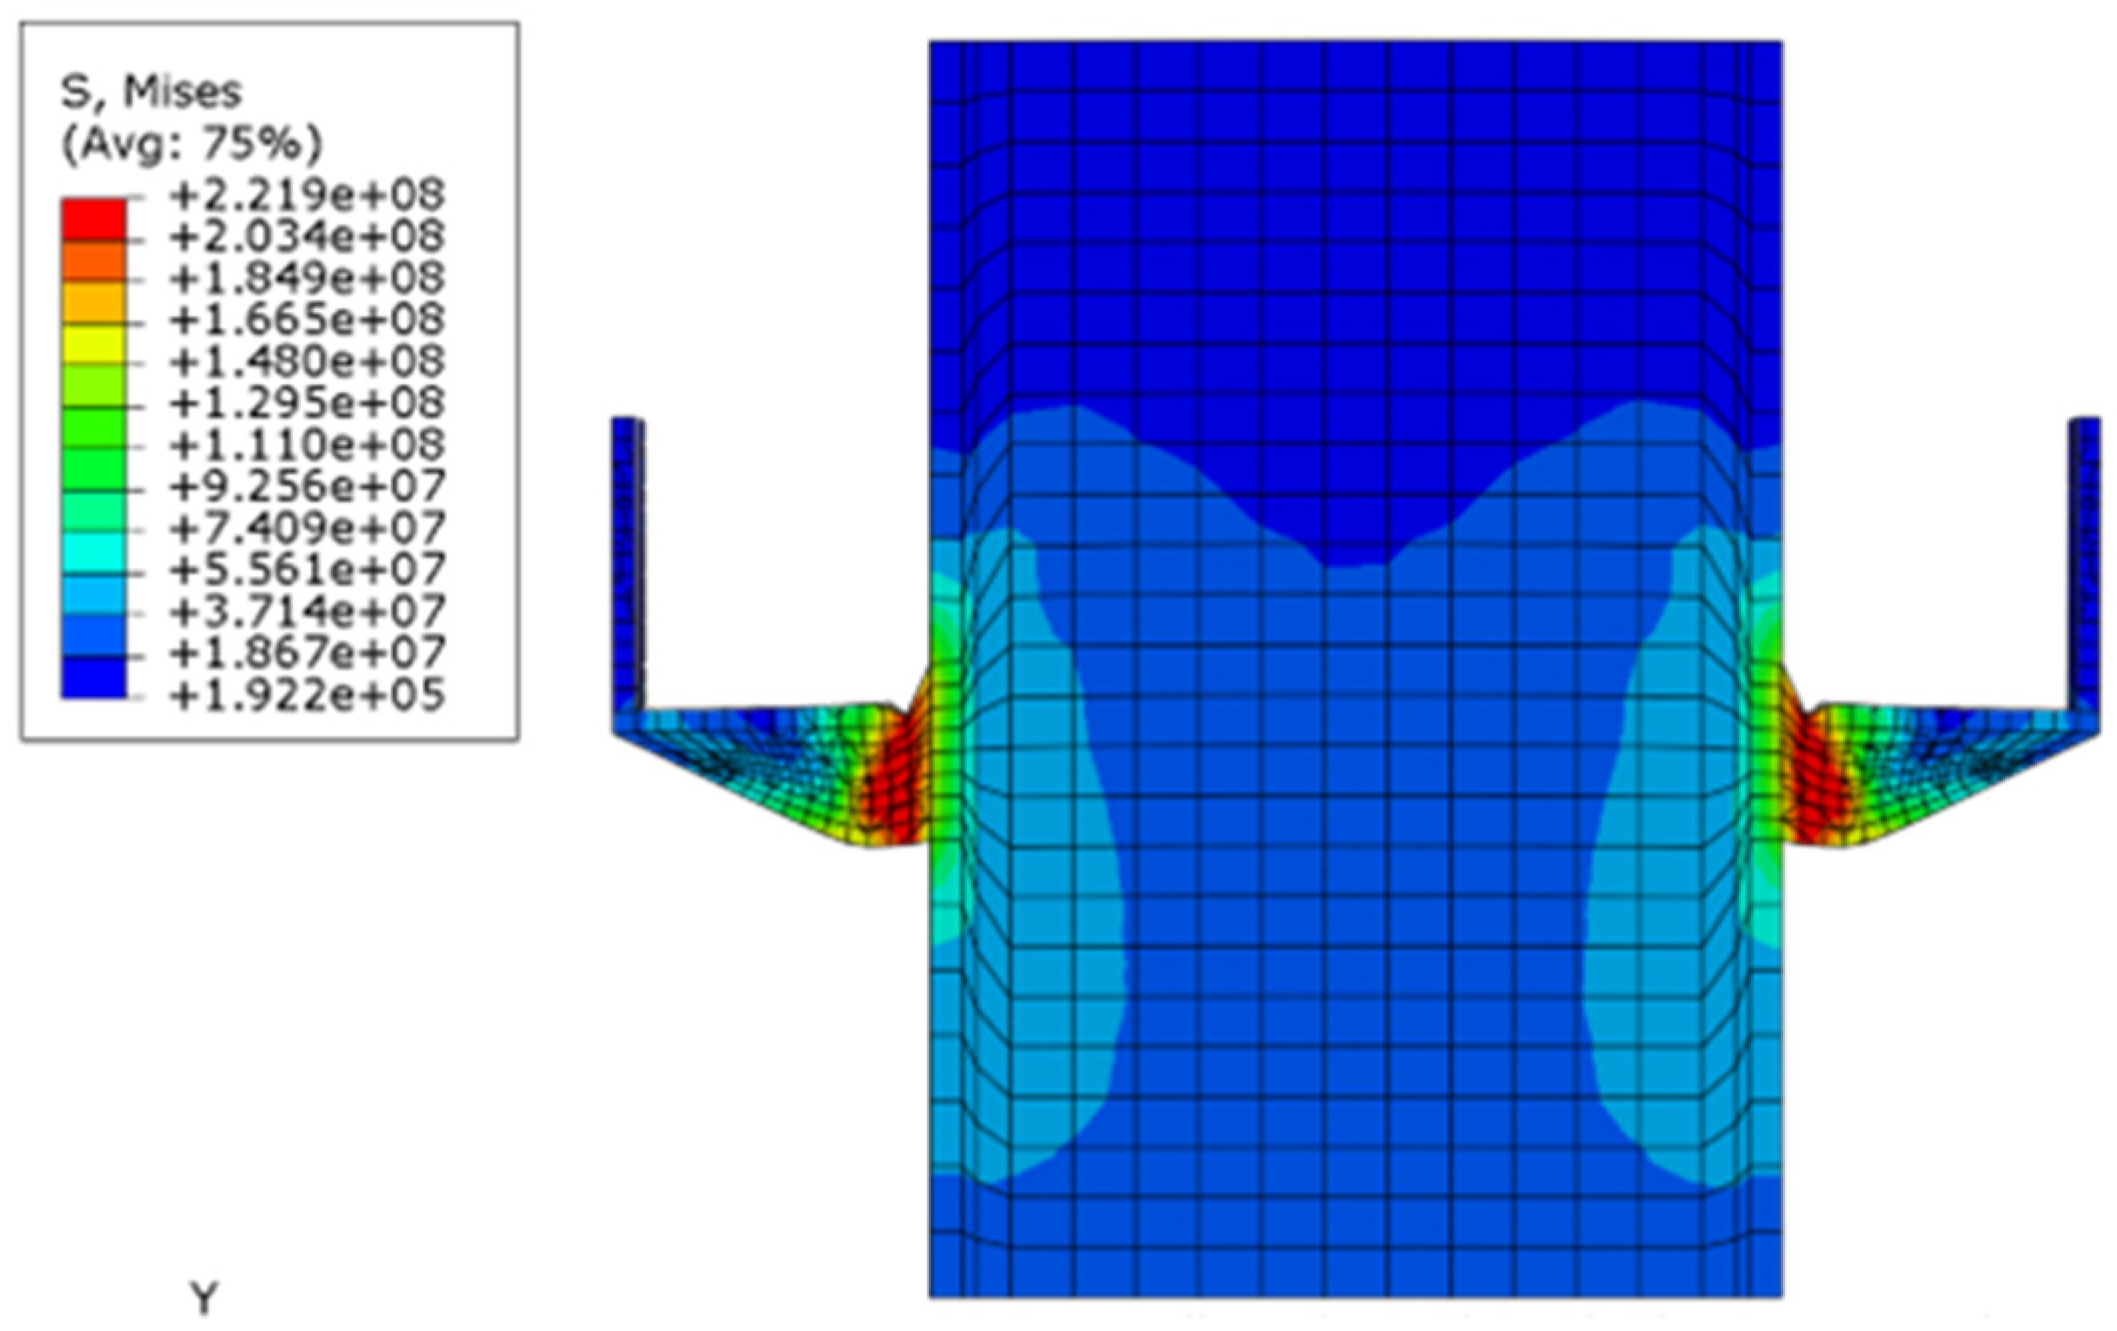
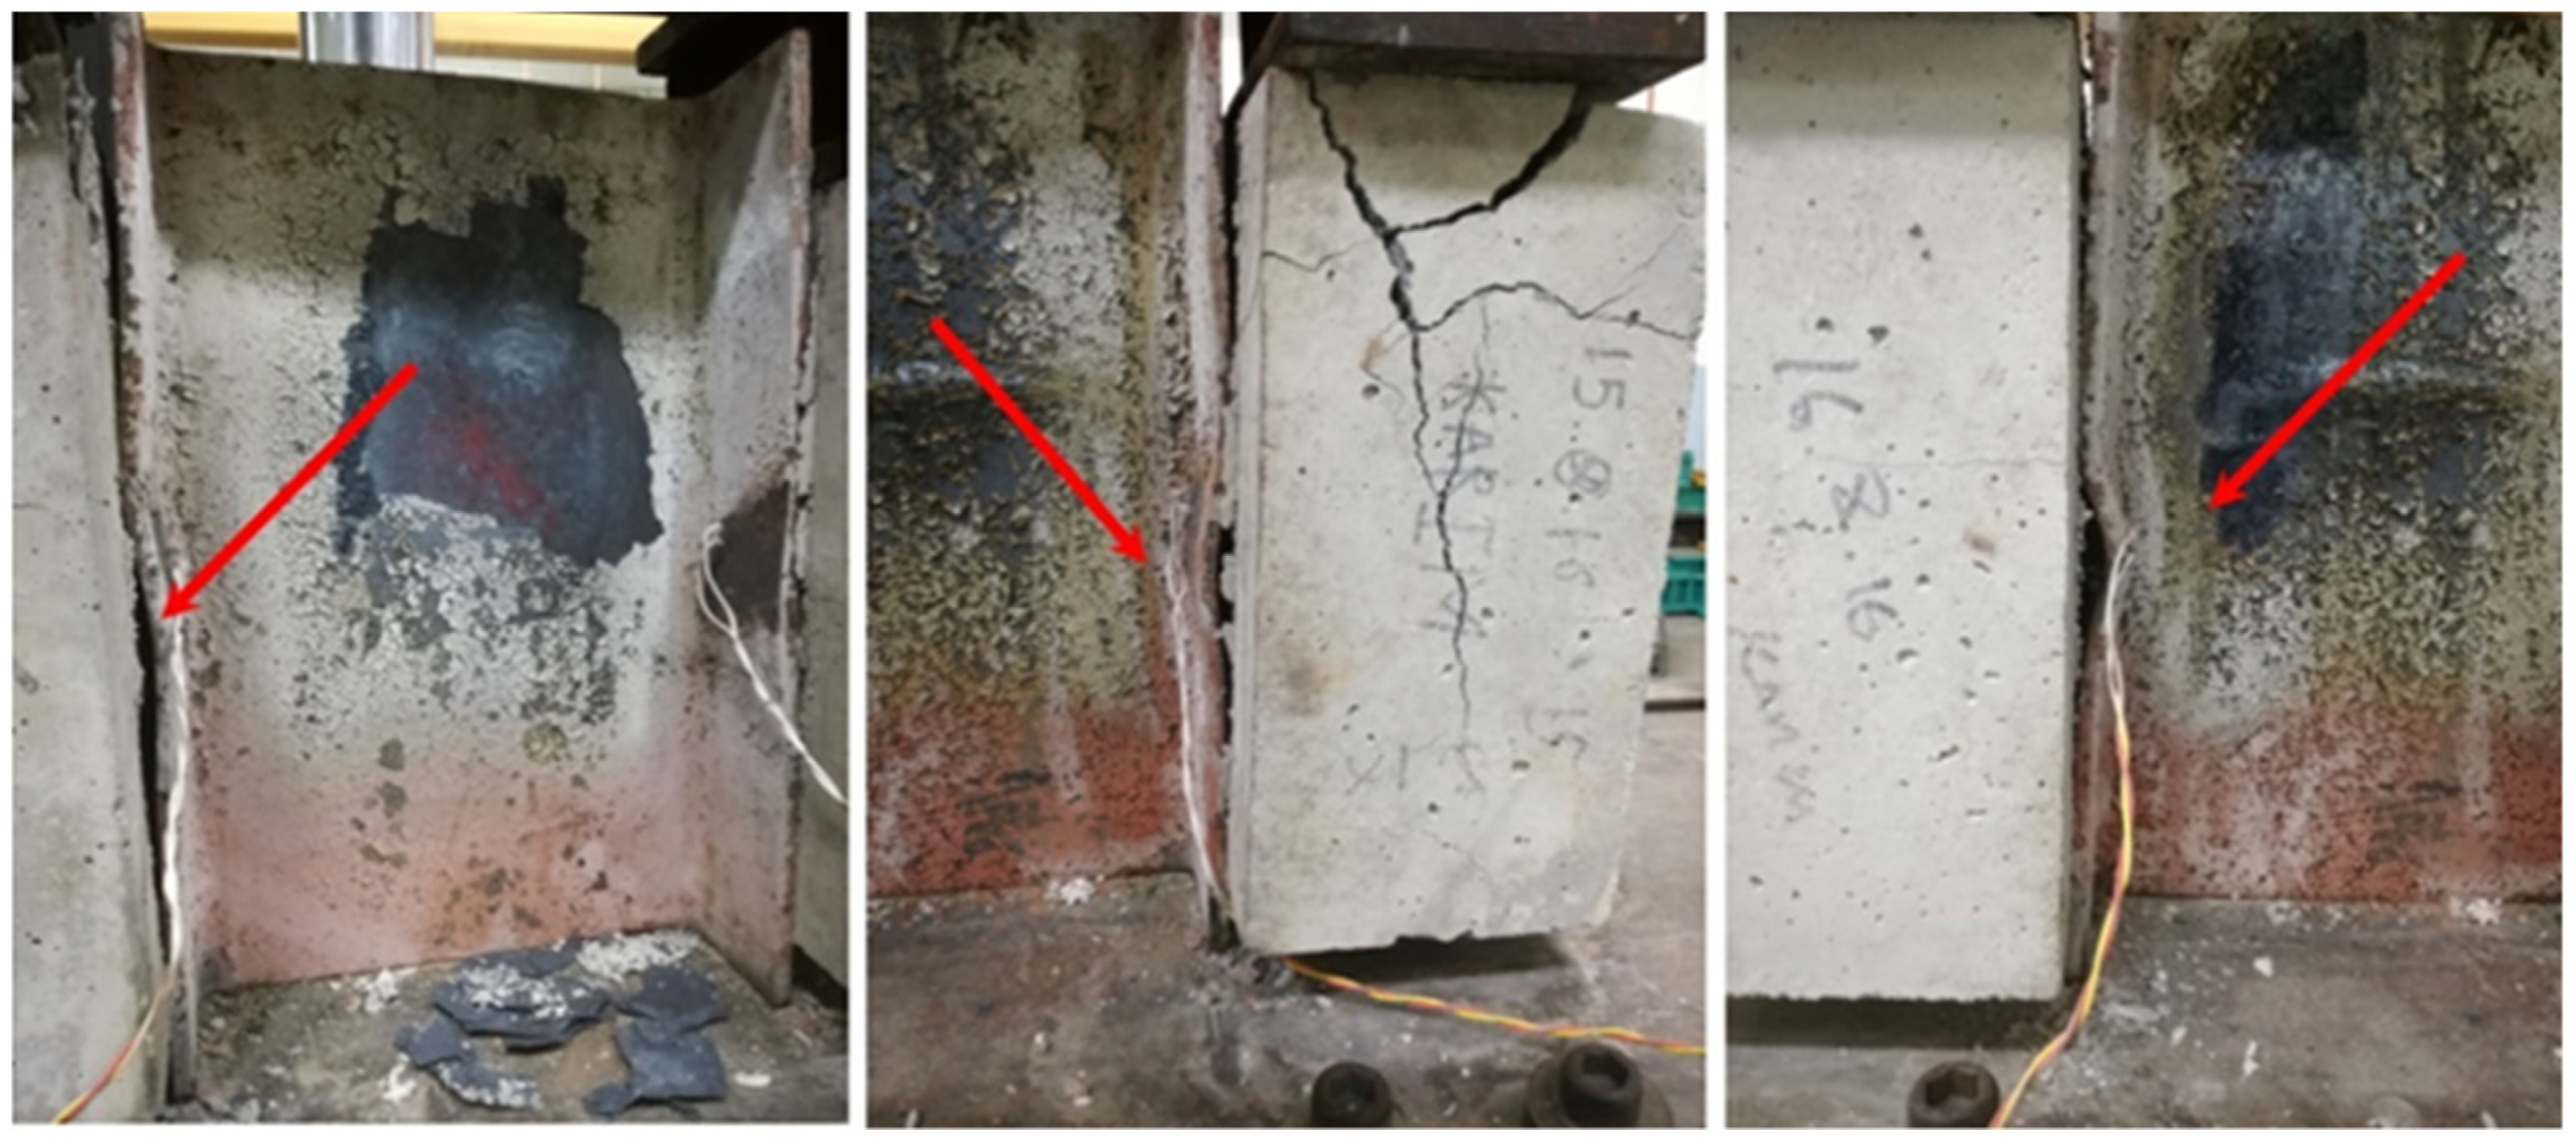
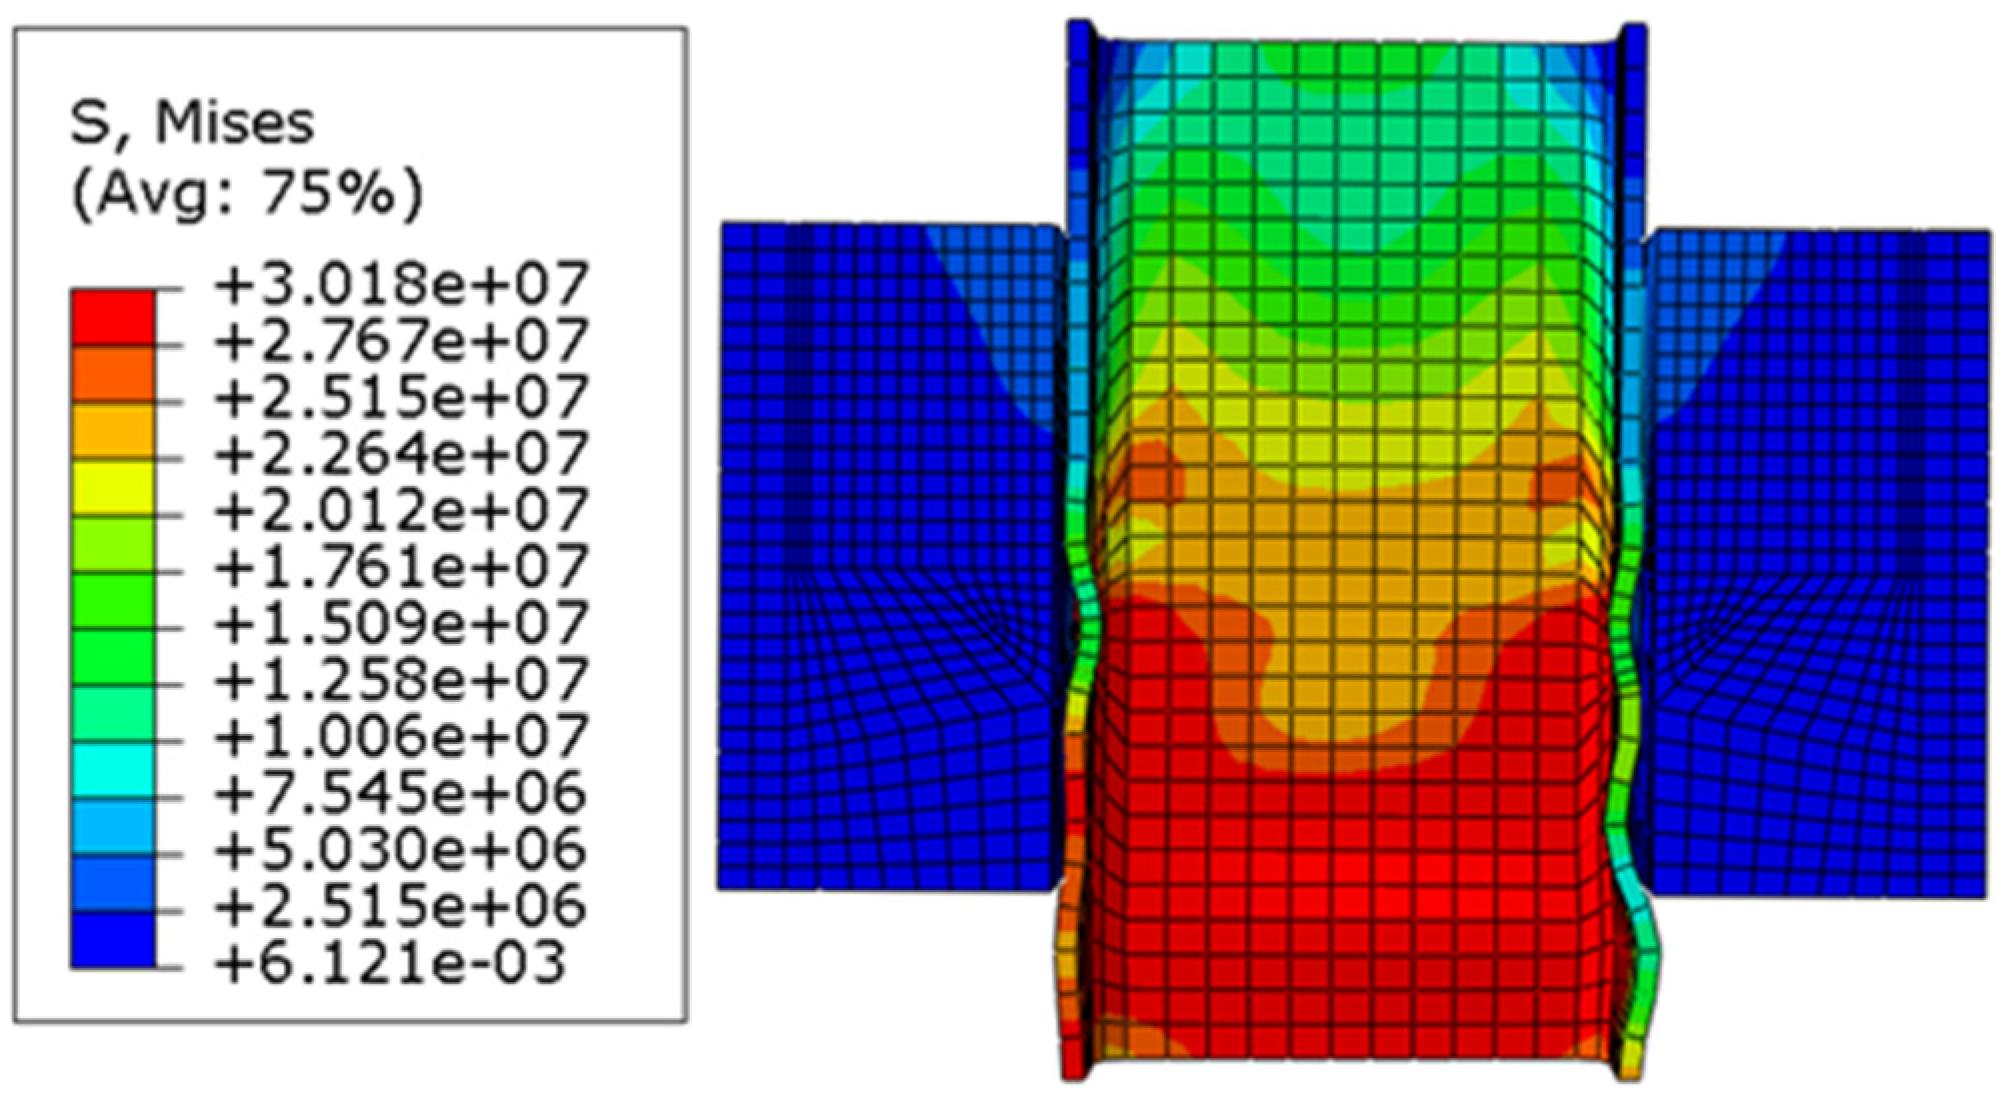
To ensure modeling accuracy, the FE modeling was verified with experimental results that are presented in paper [17,31]. Based on the results of the experimental study and comparison with FE modeling, FE modeling exhibited reasonable elastic and plastic behavior of the stiffened shear connector. Figure 10 presents the von Mises stress of stiffened shear connector and concrete, that shows the stresses exceeded the yield strength of steel where shear connector failure occurred. Concrete compression damage is unitless by referring to Equation (24), and its values are in the range of 0 to 1, where 1 represents concrete crushed. Figure 11 presents the concrete compression damage in FEA around the stiffener and the front leg of the angle where experimental work concrete compression damage happened, as shown in Figure 12. The leg of the shear connector is the weakest zone of the traditional C-shaped shear connector that is supported by a stiffener-like truss shape to enhance the bending moment capacity of the shear connector, similar to supporting the cantilever beam by truss. Figure 13 demonstrates the deformation of the steel I-beam at 850 °C in the experimental work due to local buckling, and the same deformation occurred in FEA, as shown in Figure 14. However, FE modeling assumed the perfect condition of push-out tests, whereas the perfect condition in the laboratory cannot be achieved in reality; thus, slight differences in results are expected.

6.2. Investigation of Finite Element Method Results

The evaluation mostly deliberated on the shear capacity of the stiffened shear connector at ambient and elevated temperatures with different dimensions of shear connectors at different temperatures.
As distinguished in the literature review, different sizes of angle shear connectors were studied. Thus, heights of 75 and 100 mm were more effectual than others considering the previous research investigations. In this paper, in addition, a 120 mm height was selected because unlike an ordinary C-shaped shear connector, which is a non-stiffened shear connector with the same dimensions, the height of the stiffened shear connector is a crucial parameter. Besides, the shear width of the angle profile plays a vital role in the shear capacity of the stiffened shear connector; therefore, 30, 50, 80, and 100 mm widths were investigated. The results show that temperature has a destructive effect on the strength of materials. Consequently, a temperature up to 1050 °C was selected to be applied on all specimens for two reasons. Firstly, an elevated temperature causes a remarkable drop in the shear capacity of stiffened shear connector. Secondly, conducting this test at this temperature requires costly specific equipment.

6.2.1. Failure Mode

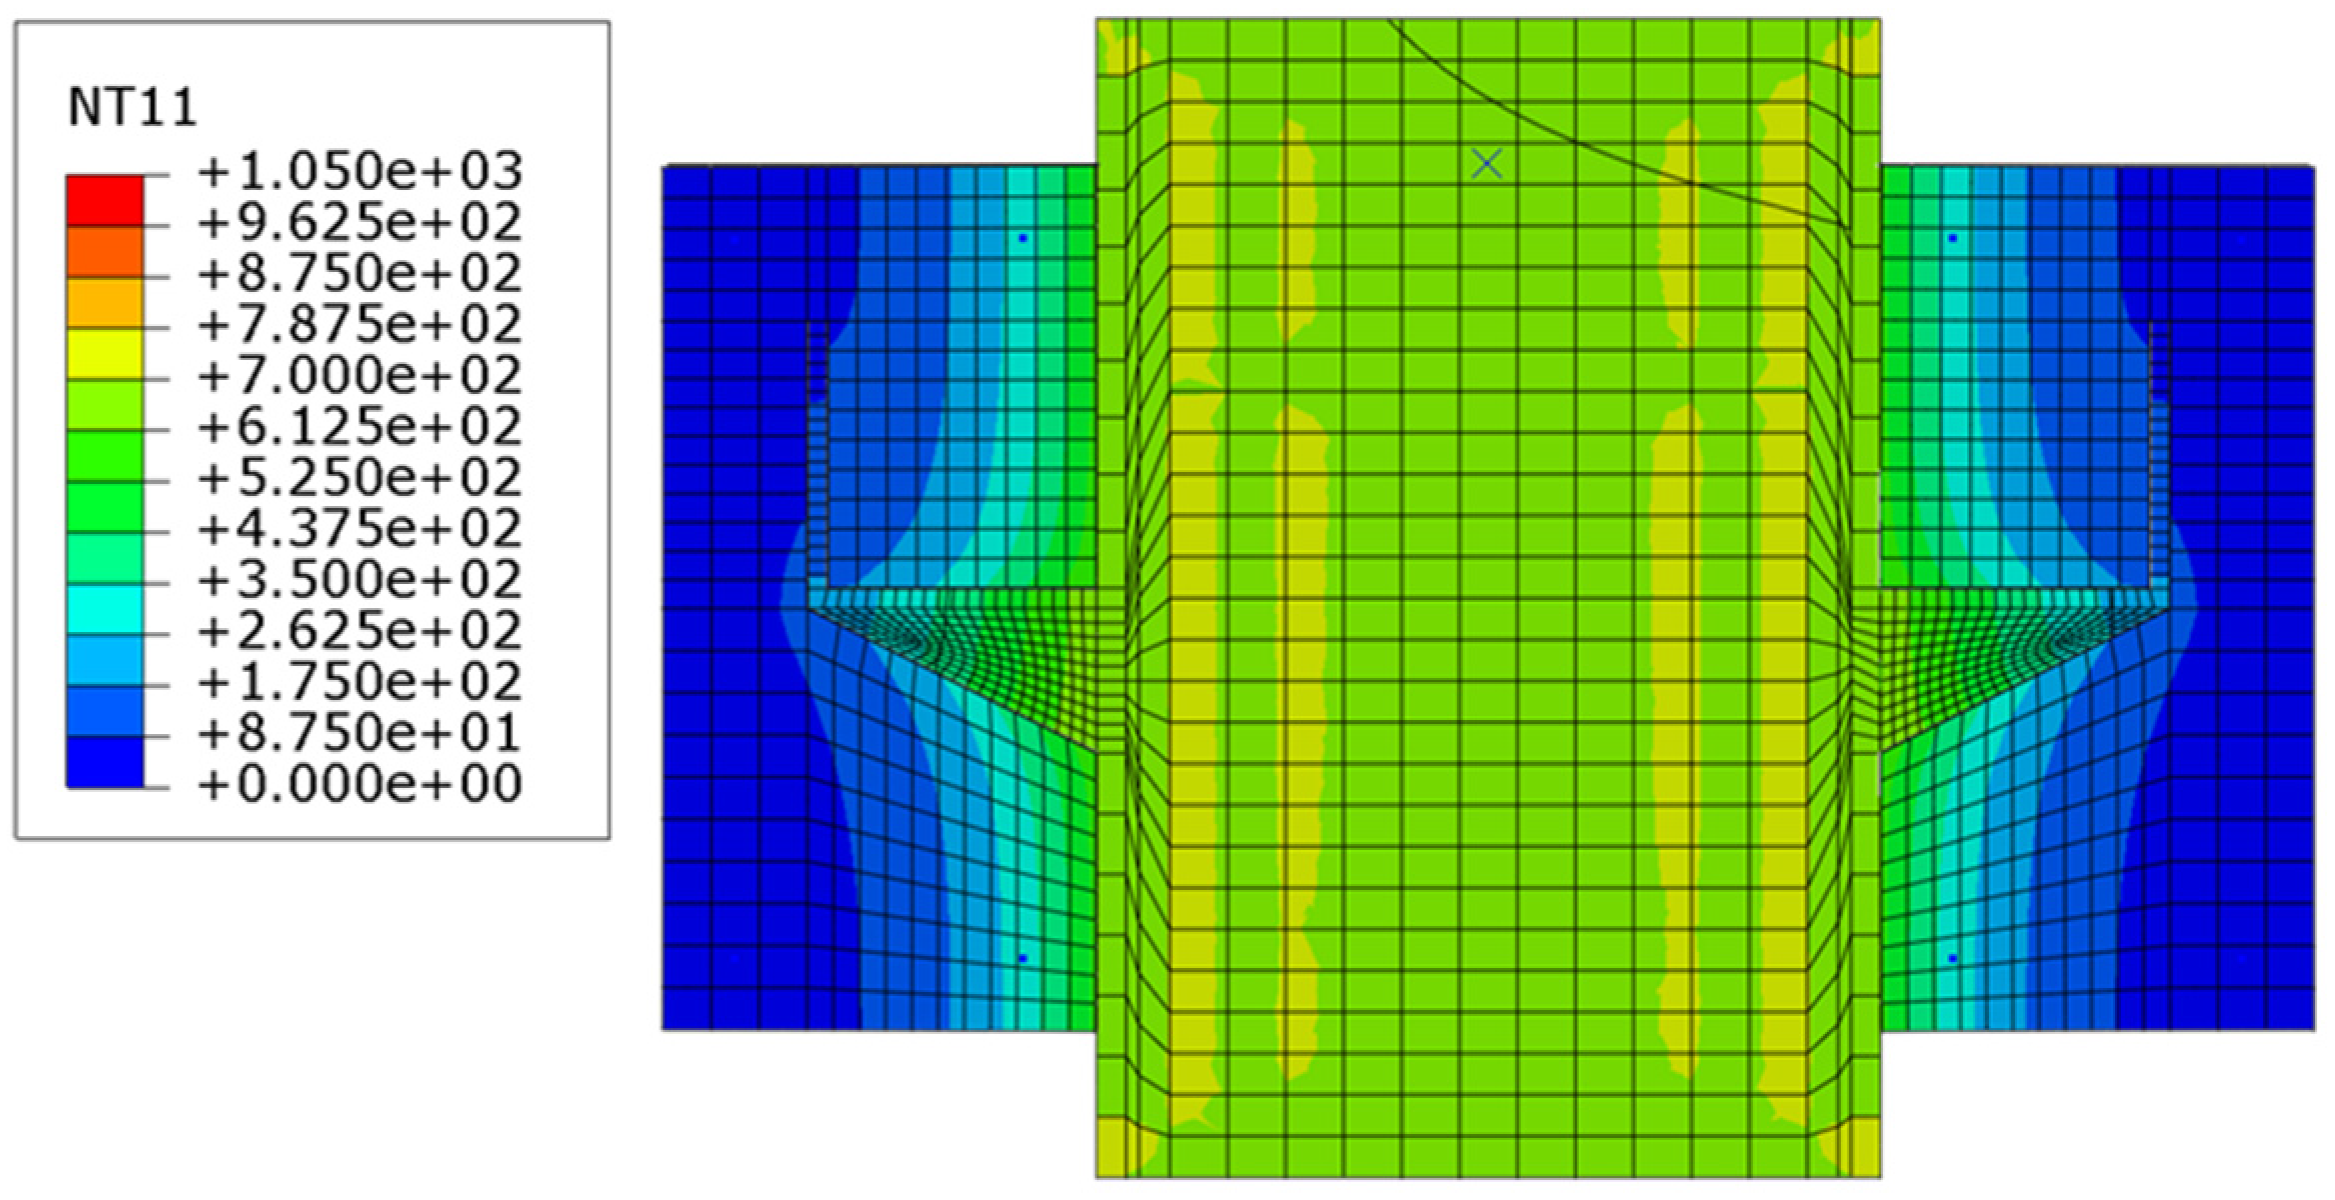
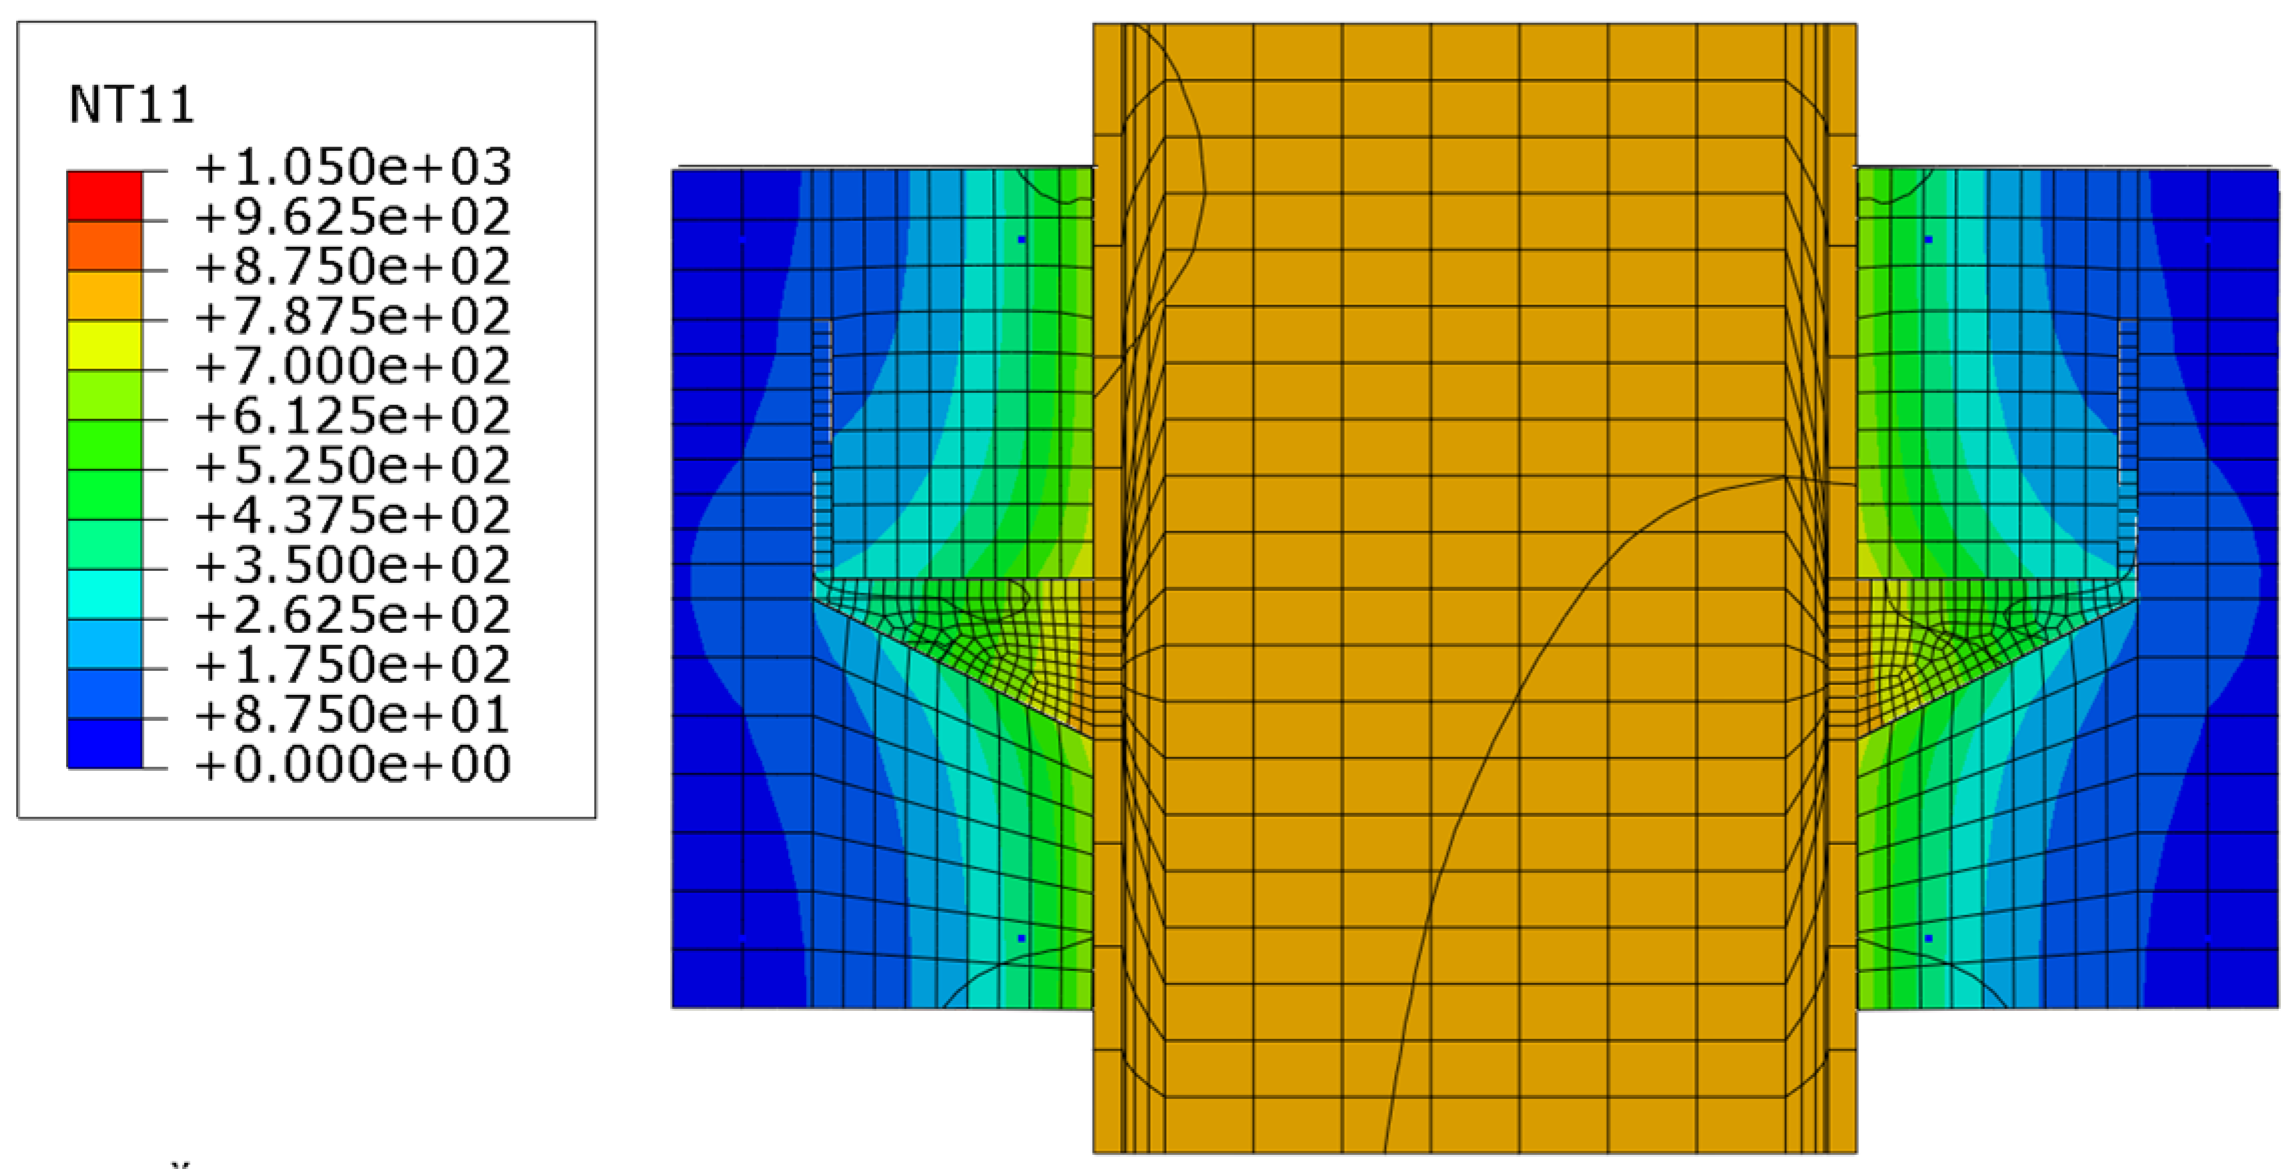
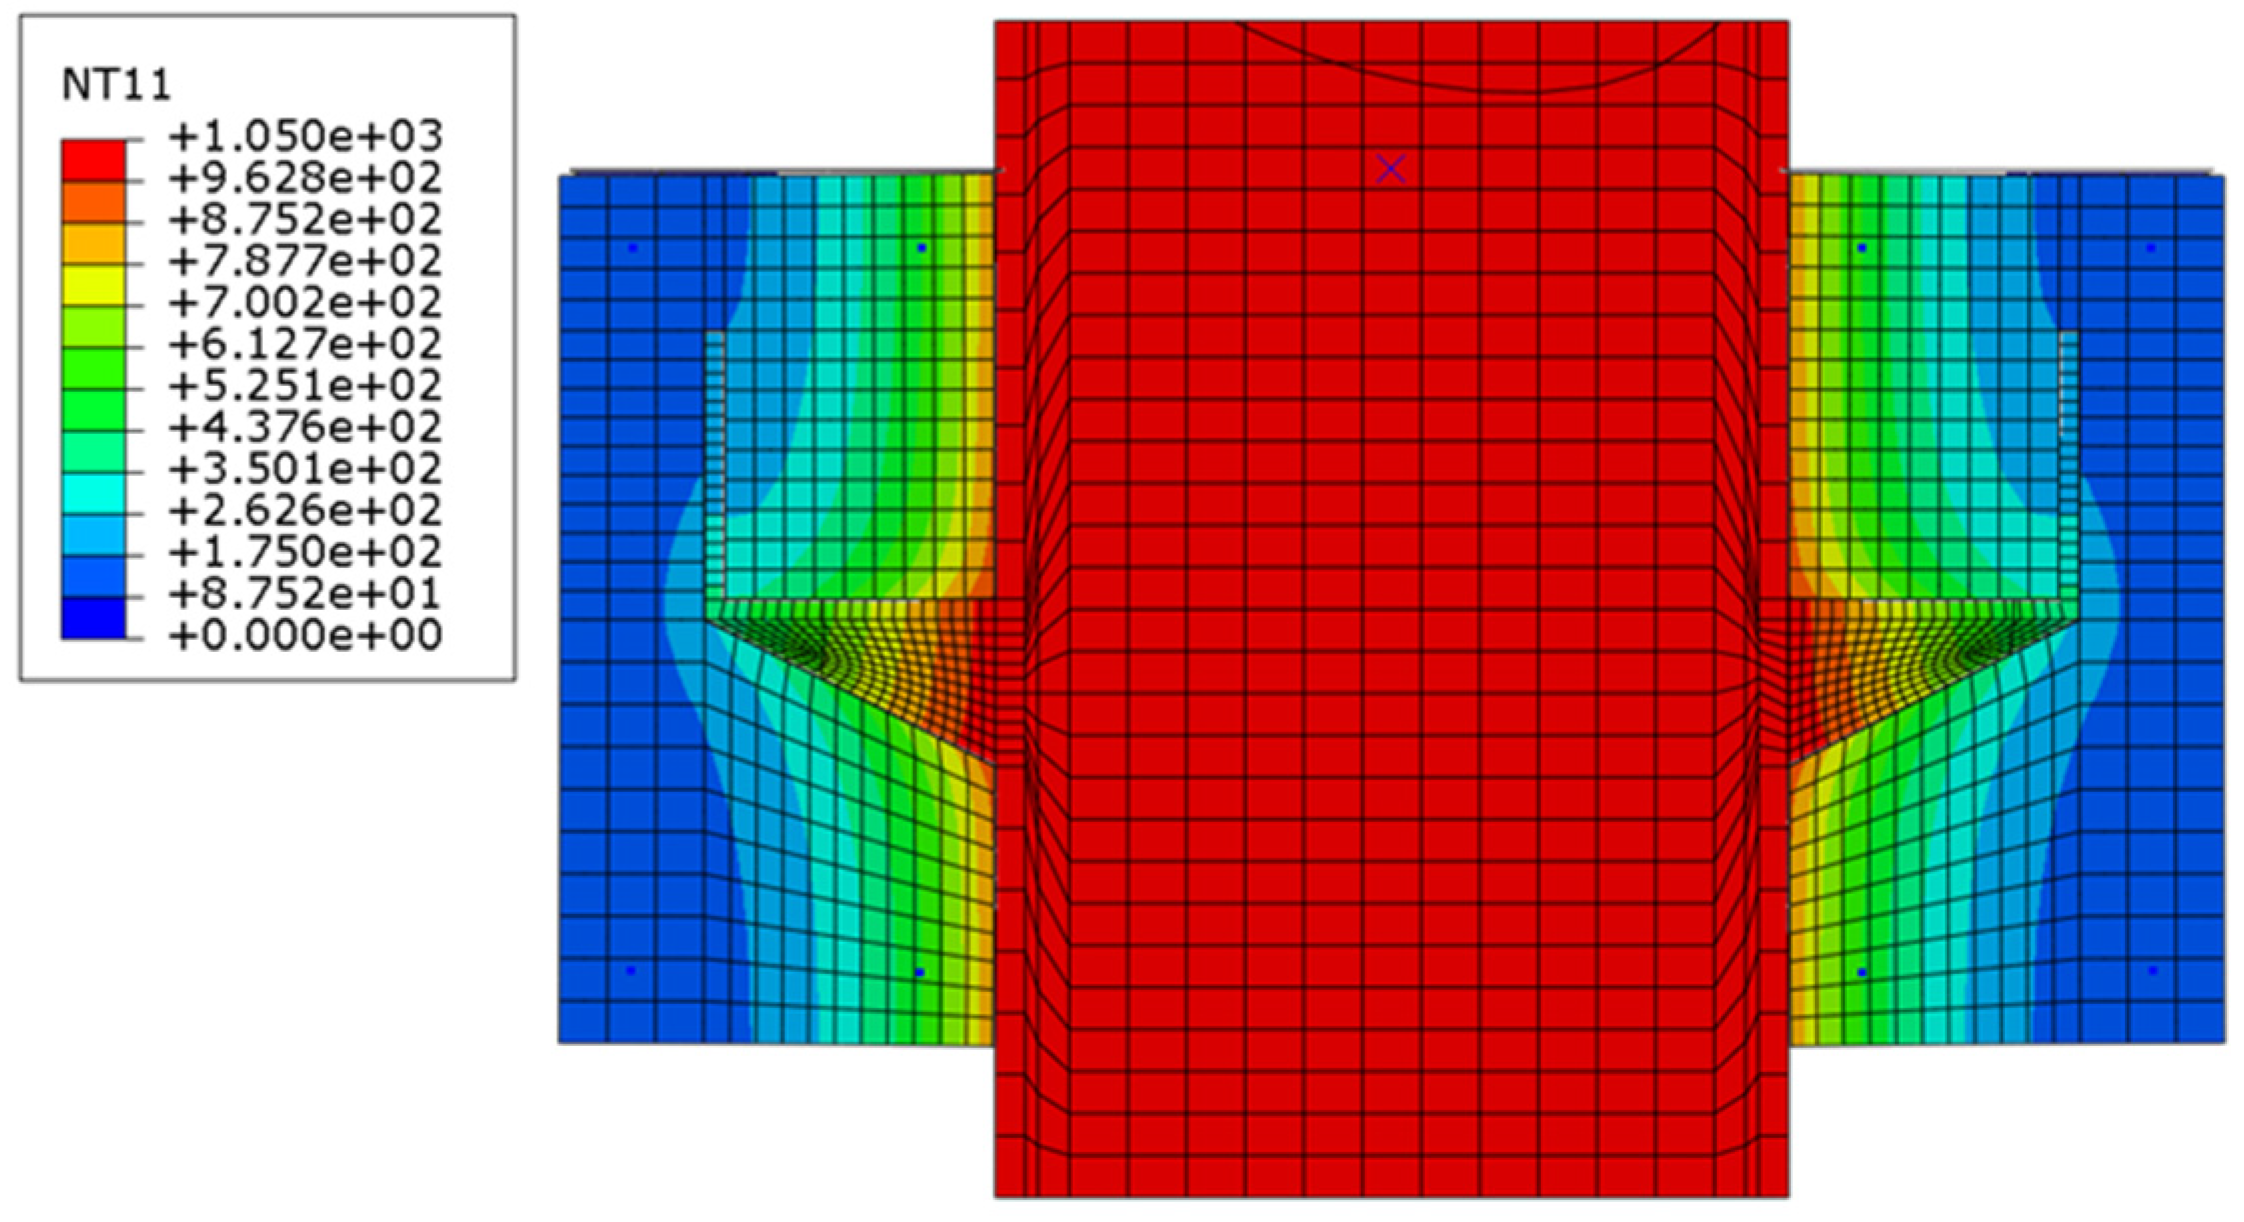
As earlier studies illustrated, due to the unequal thermal conductivity of steel and concrete, the temperature of concrete is typically lower than that of shear connectors by approximately 100–150 °C [14,32,33]. The detailed investigation in this study reveals the same pattern, as shown in Figure 15, Figure 16, Figure 17 and Figure 18, which causes the strength of the shear connector to drop faster than the surrounding concrete. Thus, concrete crushing failure mode at an elevated temperature is less likely, and failure is most likely governed by steel failure. The potential damage to strength caused by heating must be considered. Heating included the vaporization of free water at approximately 100 °C, which meant that humidity had no effect on the concrete strength during the test; several aggregates underwent quartz transformation above 600 °C; concrete started sweating and cracking at approximately 450 °C [34]. The failure mode observed under monotonic loading at elevated temperatures for the stiffened angle shear connectors was accompanied by a longitudinal crack throughout the slab. The observed cracks were due to concrete and steel isotropic essence. The thermal increase of the concrete depended on temperature alteration. Several cracks formed around the surface of the connectors and in a direction parallel to the steel I-beam [17]. Bazant and Kaplan (1996) [35] observed that cracking occurs due to structural stresses in concrete caused by inhomogeneous thermal increases, which are expressed as a temperature function based on Eurocode 2 [21].
By observing the experimental results and FE model results at elevated temperatures due to reduction of steel strength, the stiffened shear connector slightly bended before failure and then sheared off (shear connector failure). Figure 10 and Figure 12 illustrated the base of the shear connector that exceeded the yield strength of steel, that caused failure of the shear connector and concrete damage occurrence at this area. Concrete crushing failure was observed at ambient temperatures where the width of the shear connector was 80 mm and occurred at elevated temperatures with the full-length stiffened shear connector of 80 mm width at lower temperatures where the stiffness of steel did not yet drop considerably [17]. Most specimens failed with the same type of failure at ambient and elevated temperatures. At elevated temperatures, the shear connectors’ behavior was more ductile due to the reduction in steel strength, and the failure was more ductile than that at ambient temperatures. The width and the height of the novel stiffened shear connector play a vital role in terms of its strength. Therefore, the connector area facing the force was enhanced by increasing the width and the height of the angle profile.

6.2.2. Investigation of FE Results at Ambient Temperatures

In recent studies, comparing the results of 60–120 mm heights of typical shear connectors found that the height of the angle shear connector does not play a vital role on shear strength, but heights of 75 and 100 mm were optimal [36,37,38,39,40,41,42]. Thus, in this paper, 75, 100, and 120 mm heights were used to conduct the FE model. The results prove that due to the existence of the stiffener, the height of the shear connector was effective. Table 3 presents the results of FE modeling at ambient temperatures.
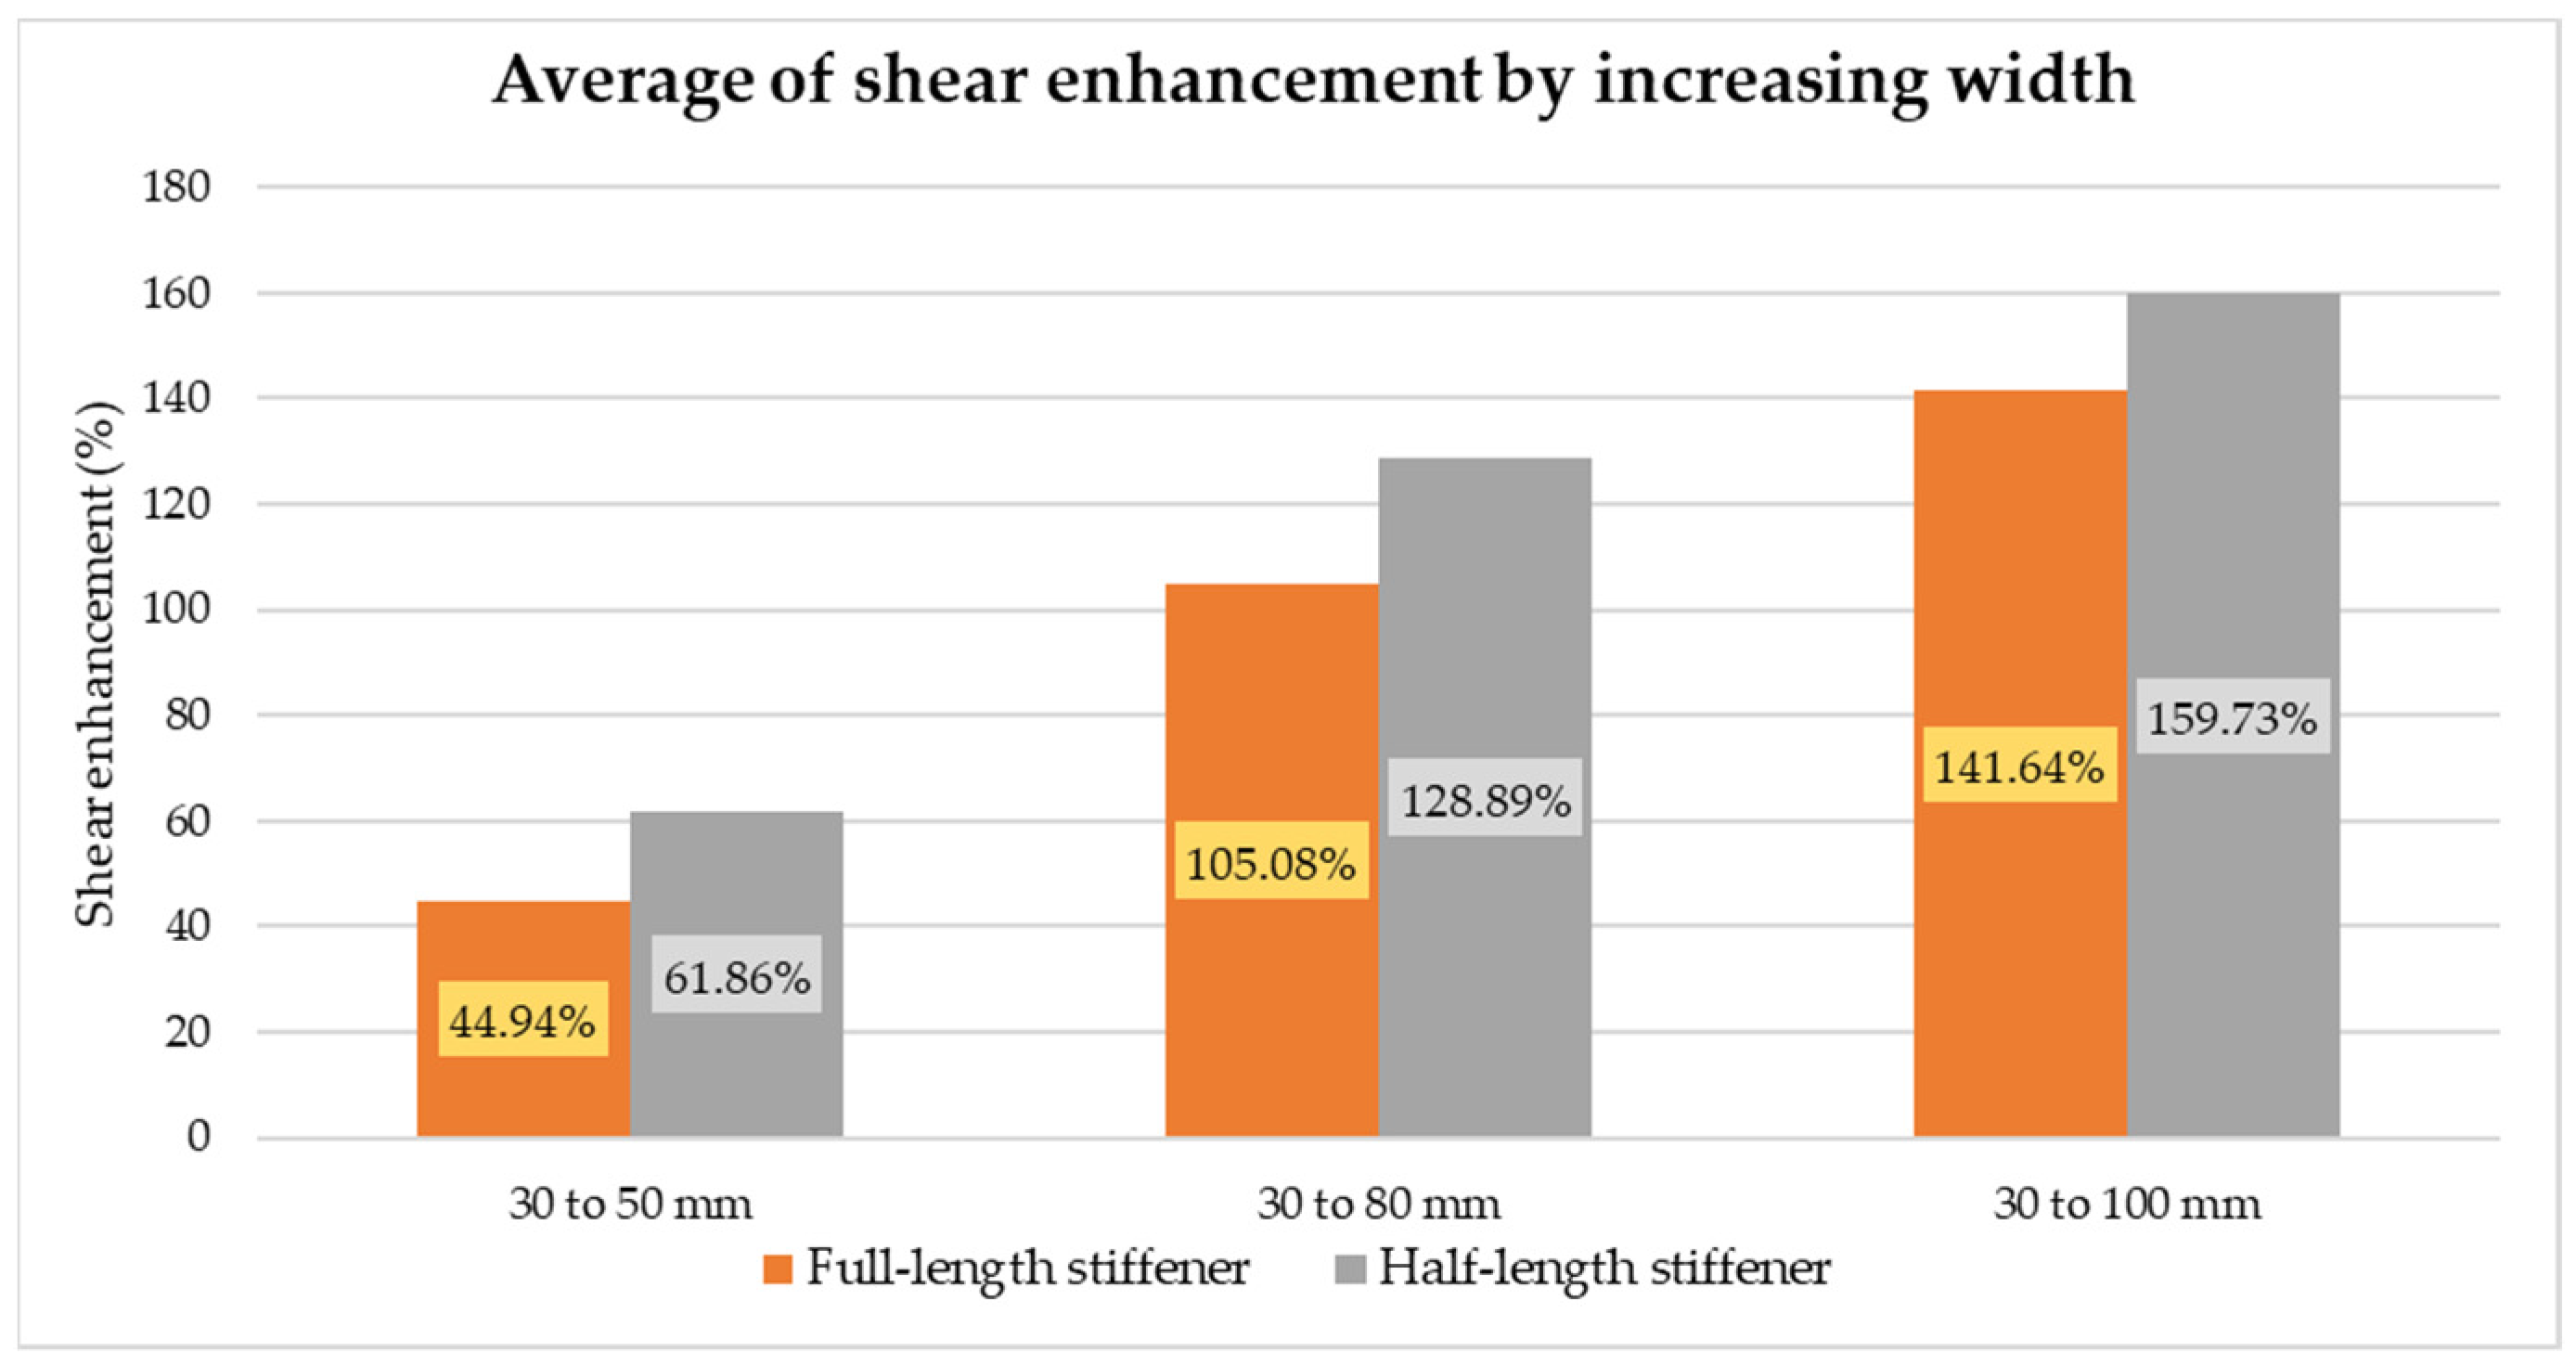
Table 3 illustrates the close relation between the experimental work and FE modeling. Table 3 also presents the shear strength capacity of the stiffened shear connector and determined that by enhancing the height of the shear connector from 75 mm to 100 mm; the enhancement shear capacity of the full-length stiffened shear connector was approximately similar to experimental work [17] with slight differences of 36%, 28%, 28%, and 43% for widths of 30, 50, 80, and 100 mm, respectively. Likewise, for the half-length stiffened shear connector, the shear capacity increments were approximately 16.4%, 8.2%, 40.3%, and 42.8% for widths of 30, 50, 80, and 100 mm, respectively. The FE results show that the shear strength from 75 mm height to 120 mm height was more enhanced. For instance, for the full-length stiffened shear connector, 84%, 46.9%, 63.6%, and 69.9% enhancements were observed for widths of 30, 50, 80, and 100 mm, respectively. This increment for the half-length stiffened shear connector was almost in the same range with slight differences of 78.3%, 41.6%, 58.3%, and 69.5% for widths of 30, 50, 80, and 100 mm. The importance of the novel stiffened shear connector was caused by the presence of a stiffener to support, carry load, and reduce bending moments in the shear connector, unlike the typical shear connector in previous studies. As mentioned earlier, the width of the shear connector has a remarkable contribution in the enhancement of the stiffened angle shear connector. Thus, width is more crucial than height in terms of increasing the strength of the shear connector, as shown in Table 4. For instance, shear strength increased by 44.9% and 61.9% on average for widths from 30 mm to 50 mm for full and half-length stiffened shear connectors, respectively, whereas these average increments from widths of 50 mm to 80 mm were equivalent to 42.1% for full-length and 41.7% for half-length stiffened shear connectors. Unexpectedly, 105.1% for full-length and 128.9% for half-length were averages of shear enhancement by changing the width of the stiffened shear connector from 30 mm to 80 mm. This figure for increasing the width from 30 mm to 100 mm increased to 128.9% for full-length and 152.9% for half-length stiffener on average. By increasing the width, the area of the facing load was enhanced, which led to reduced pressure under certain loads. Thus, by referring to the fundamental pressure equation ( σ = F / A ), where σ is the pressure, F is the force, and A is the loading area, when the loading area increases to reach a certain pressure, the load is also enhanced.

6.2.3. Investigation of FE Results at Elevated Temperature

  • Heat distribution
As earlier studies illustrated, due to the unequal thermal conductivity of steel and concrete, the temperature of concrete is typically lower than that of the shear connector by approximately 100–150 °C [14,30,32]. The detailed investigation in this paper reveals the same pattern, as shown in Figure 15, Figure 16, Figure 17 and Figure 18, which causes the strength of the shear connector to drop faster than the surrounding concrete. Thus, concrete crushing failure mode at an elevated temperature is less likely, and failure is most likely governed by steel failure.
  • Shear strength reduction at elevated temperature
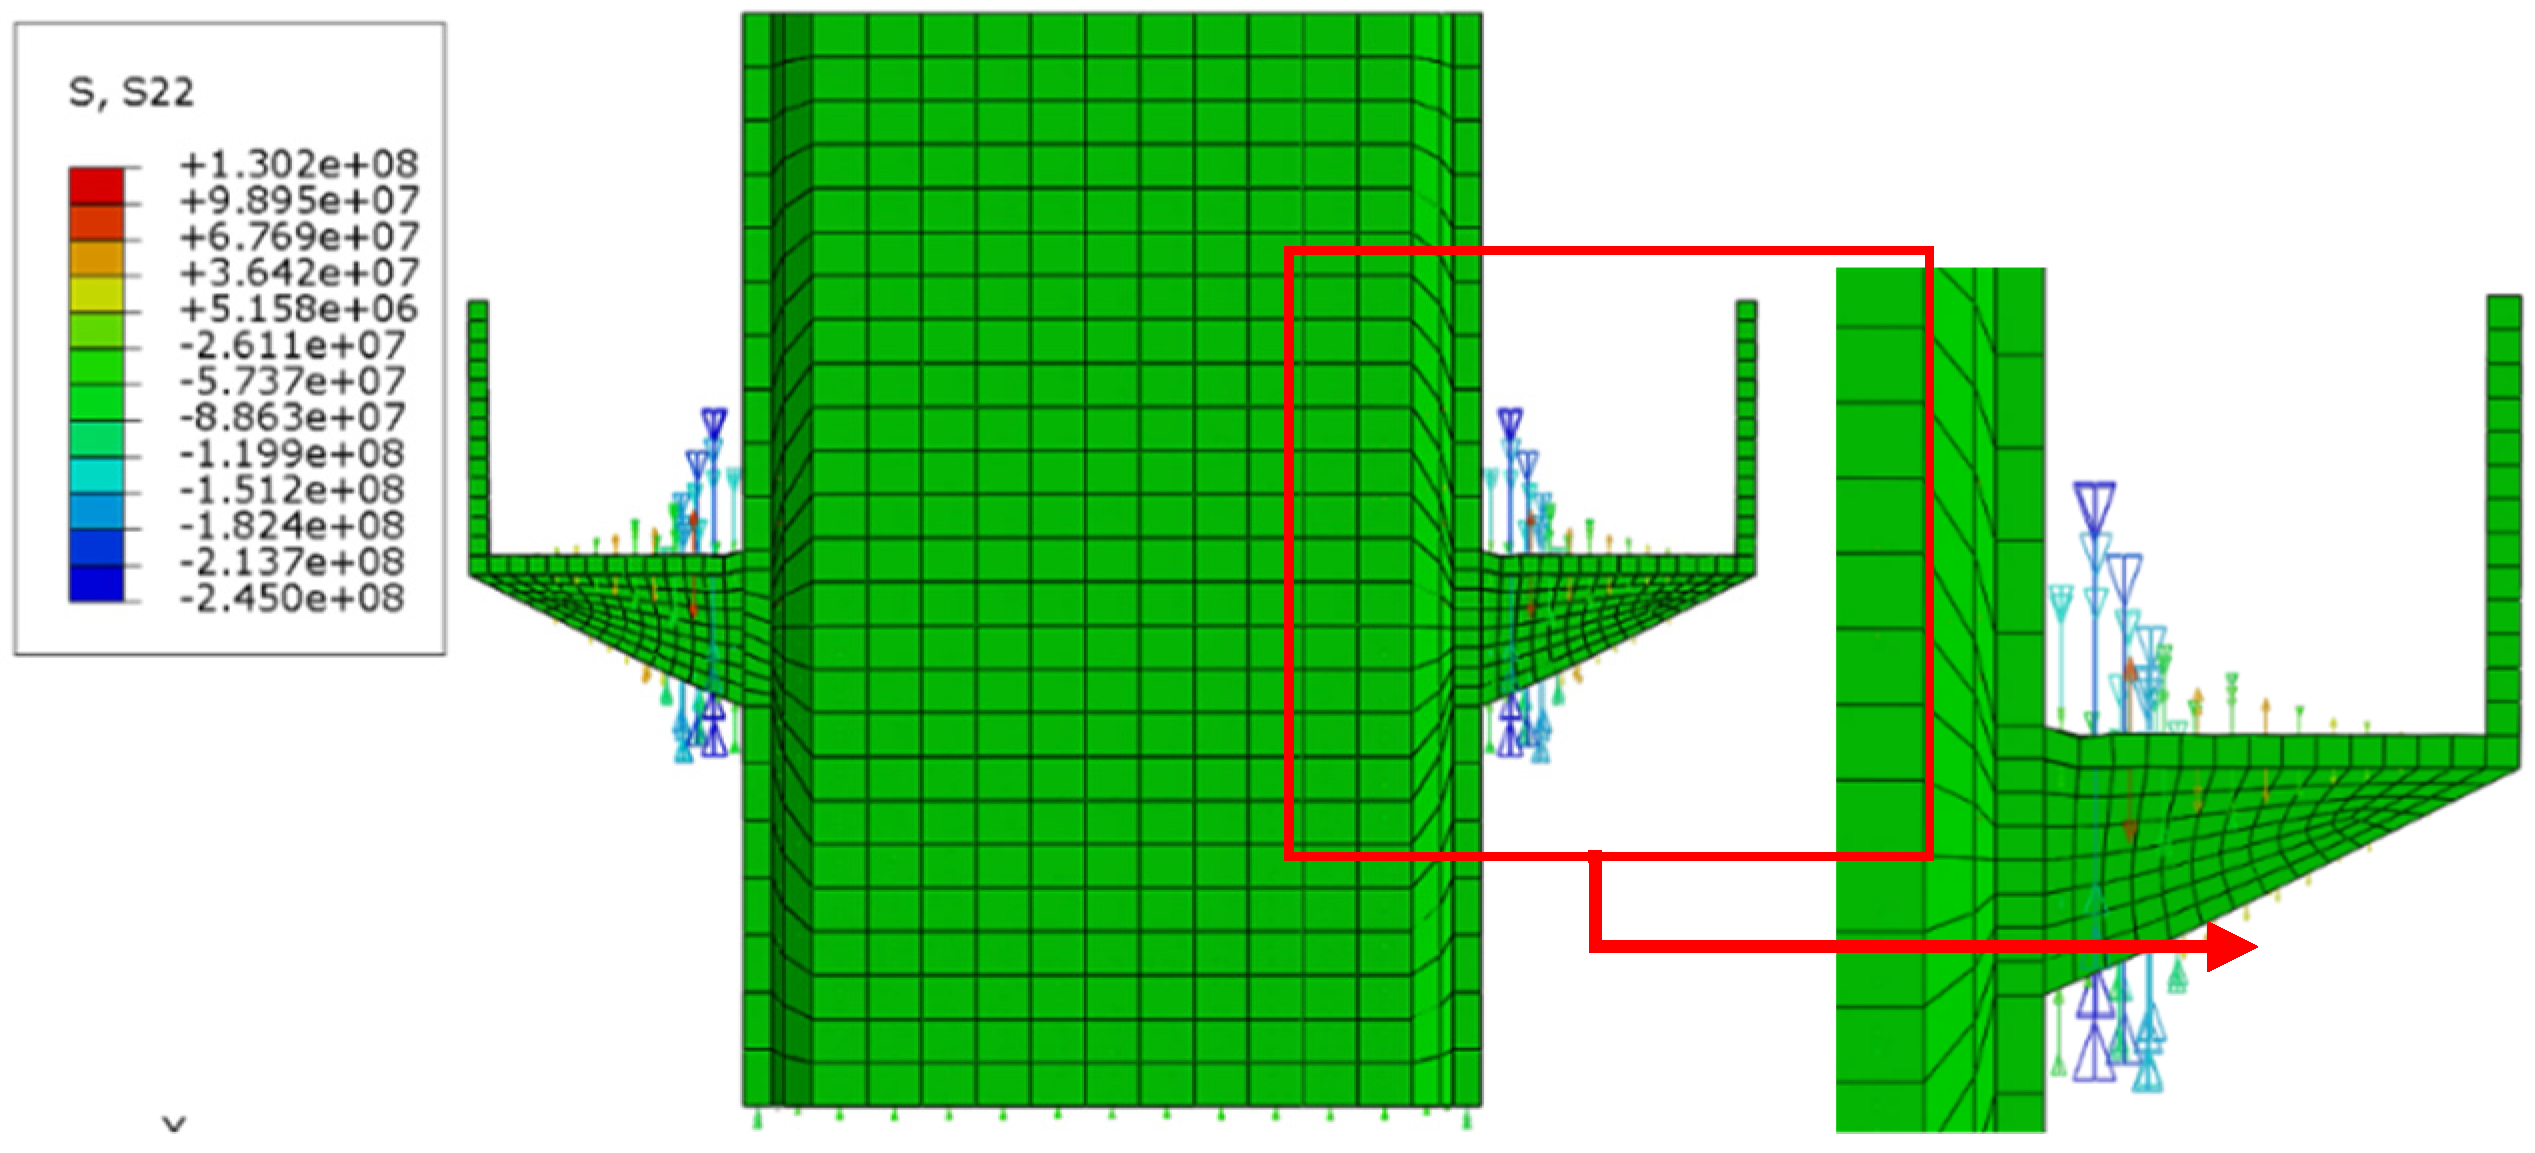
The strength of the angle profile dropped more than that of concrete because the temperature in the steel profile is higher by 100–150 °C, as discussed in the previous section. Thus, the shear connector is expected to fail before concrete at an elevated temperature. Deep, detailed investigation of the FE results found that failure in shear connectors occurred. The stiffened shear connector failed at the bottom of the stiffened shear connector leg or on the other hand, upper line of welding line, where the value of von Mises stress is highest (Figure 19), and the value of S22 stress is highest (stress in Y direction) is in the loading direction (Figure 20). Shariati et al. 2020 [42] also found that the bottom of the typical shear connector suffers from a high bending moment, and failure occurs. For instance, for a better visualization, the distorted photo by a scale factor of 8 shows the failure line in the stiffened shear connector, as illustrated in Figure 21.
Subsequently, the temperature enhancement caused the reduction in the shear strength of the shear connector, which was between 7.85% and 91.84% in the stiffened angle shear connectors with 75 mm height, 3.37% to 92.14% in those with 100 mm height, and for 120 mm height, was in the range of 7.58% and 93.33% at all temperatures. The reduction factor of material strength at an elevated temperature controls the dropping load-carrying capacity of the stiffened shear connector. In experimental study [17] and FE modeling, local buckling failure was observed for stiffened shear connectors with heights of 100 and 120 mm and widths of 80 and 100 mm at 850 °C and 1050 °C, as shown in Figure 14 and Figure 15. Local buckling failure occurred due to the considerable reduction of strength of steel at elevated temperatures. Figure 15, Figure 16, Figure 17 and Figure 18 present the heat distribution in specimens, and the temperature in the web and the flange of the steel I-beam was higher than those of the stiffened shear connector; thus, the stiffness reduction in the web and the flange was more than those of the shear connector, which means stiffness of the stiffened shear connector is higher than the flange and the web of the steel I-beam at elevated temperatures. Therefore, under loading, the steel I-beam buckled first before the shear connector failed. To avoid local buckling, using stiffener to increase stiffness in the steel I-beam at elevated temperatures is recommended.
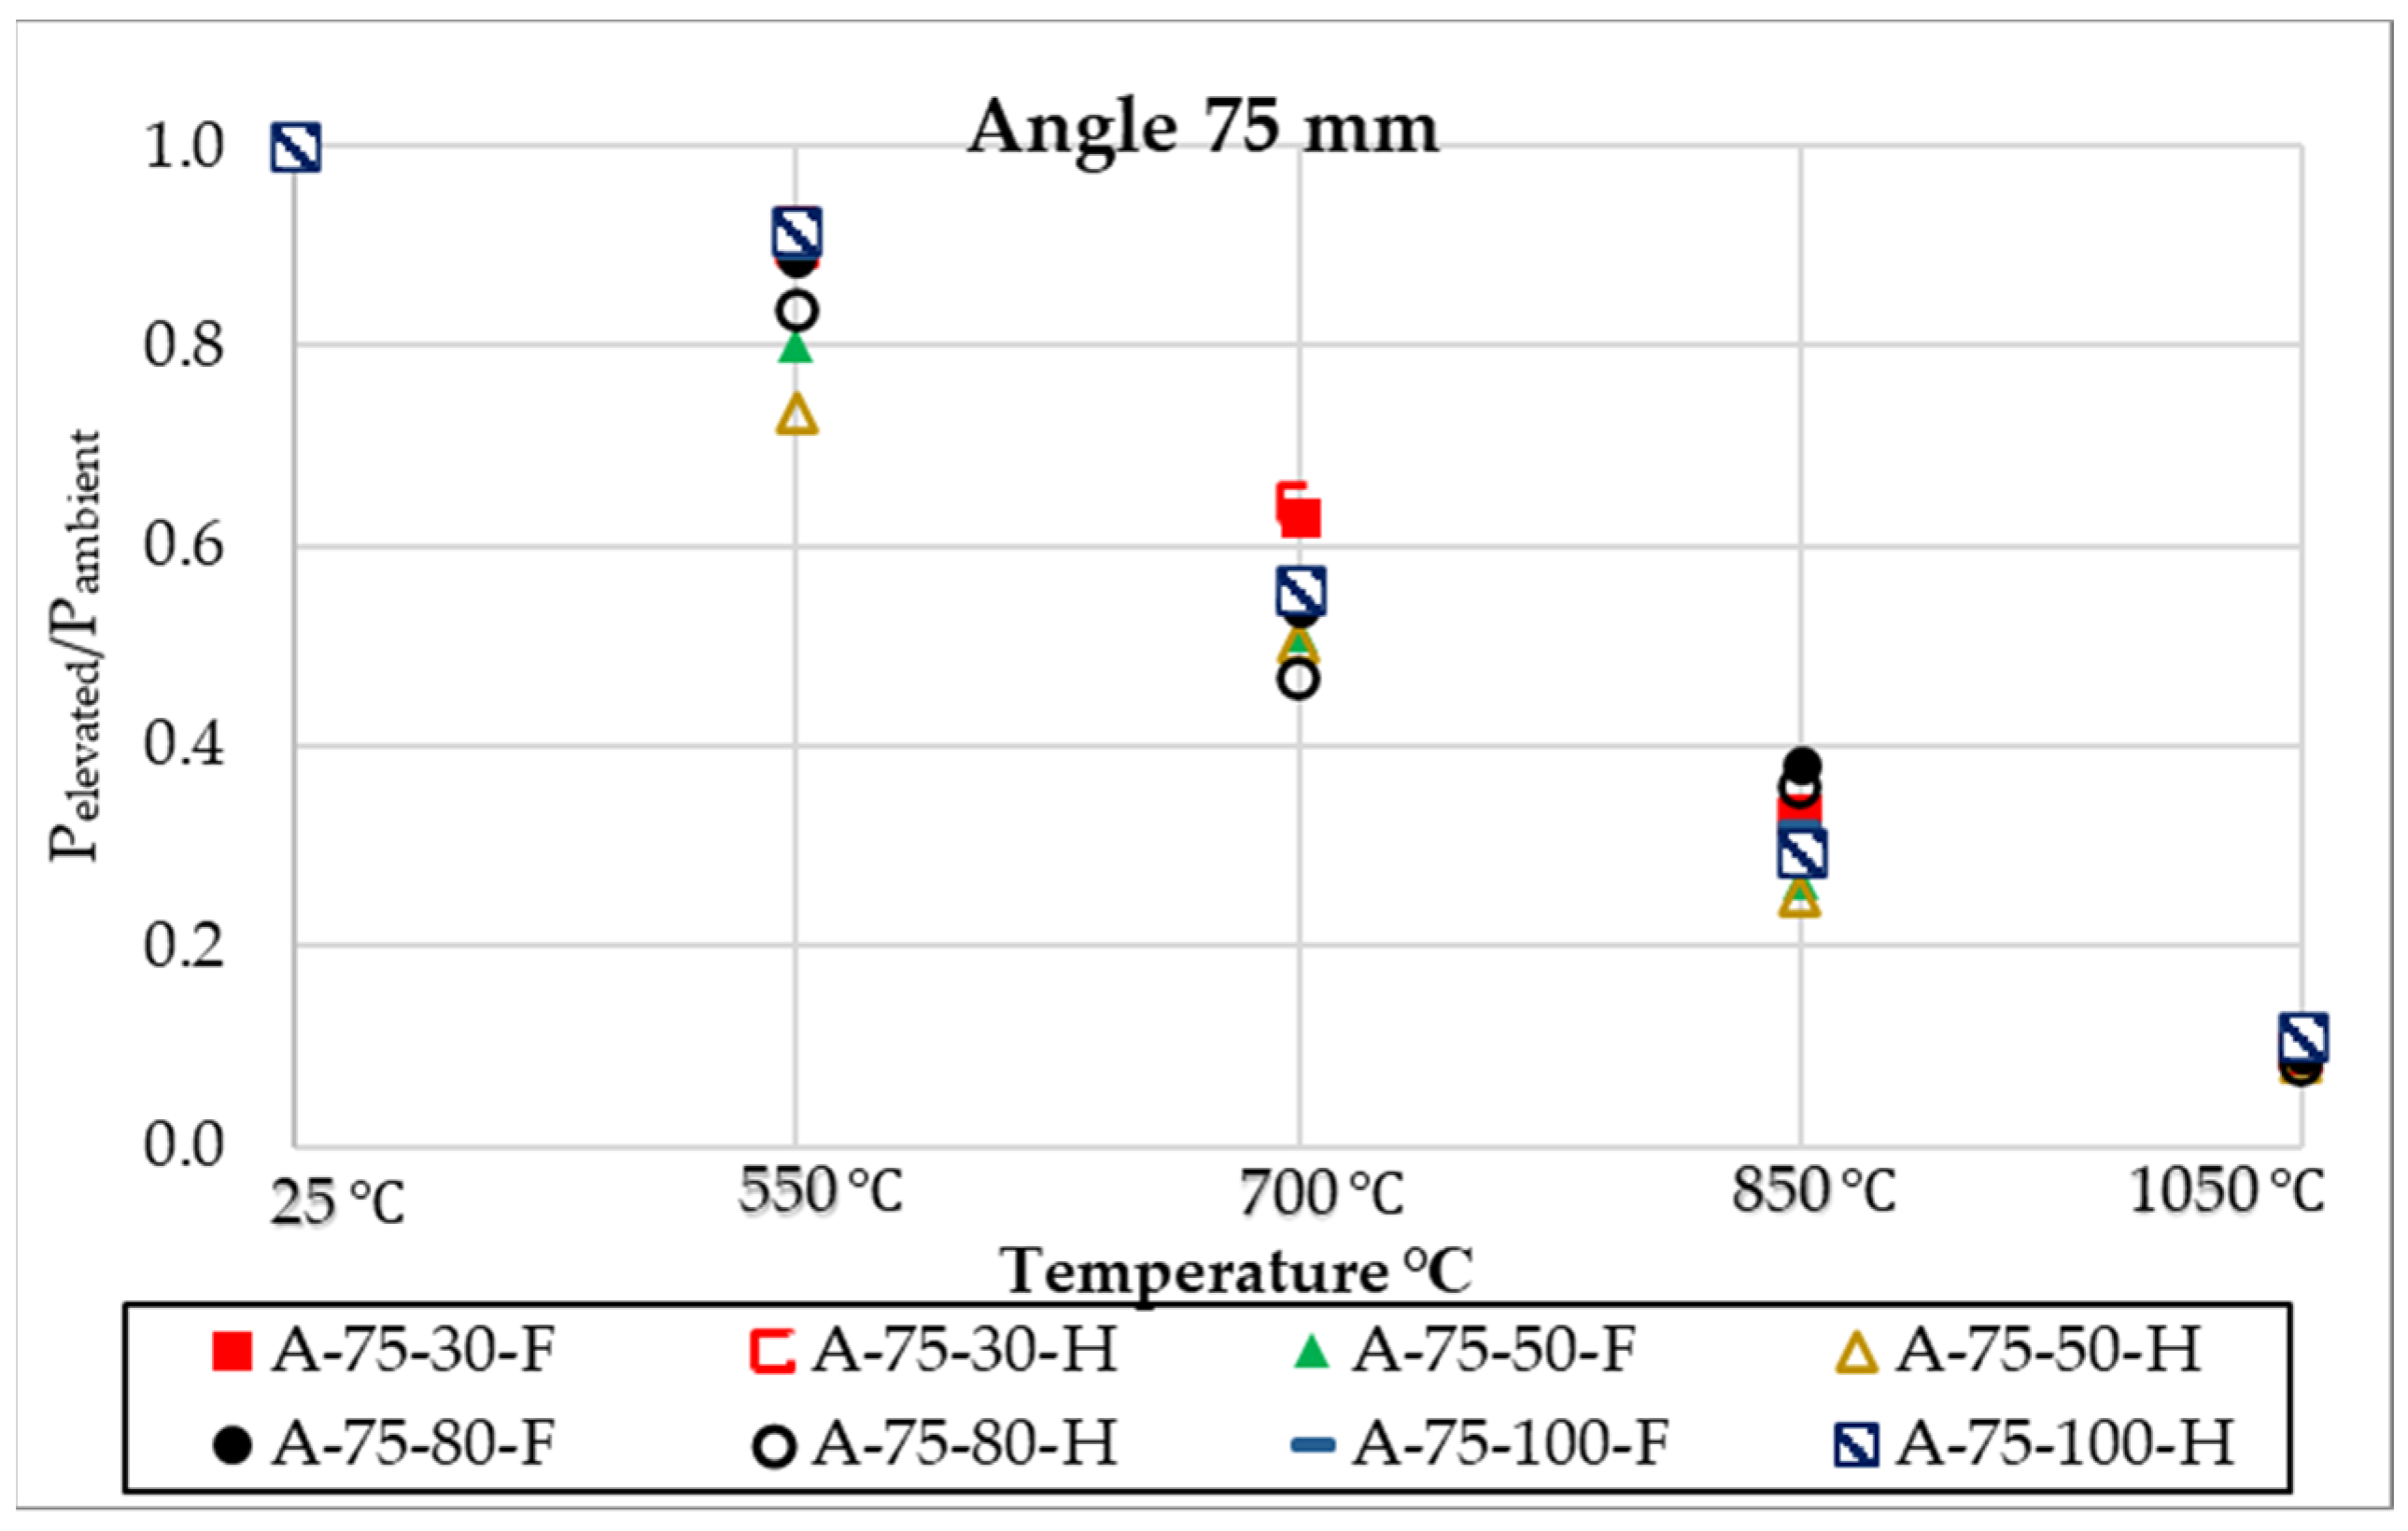
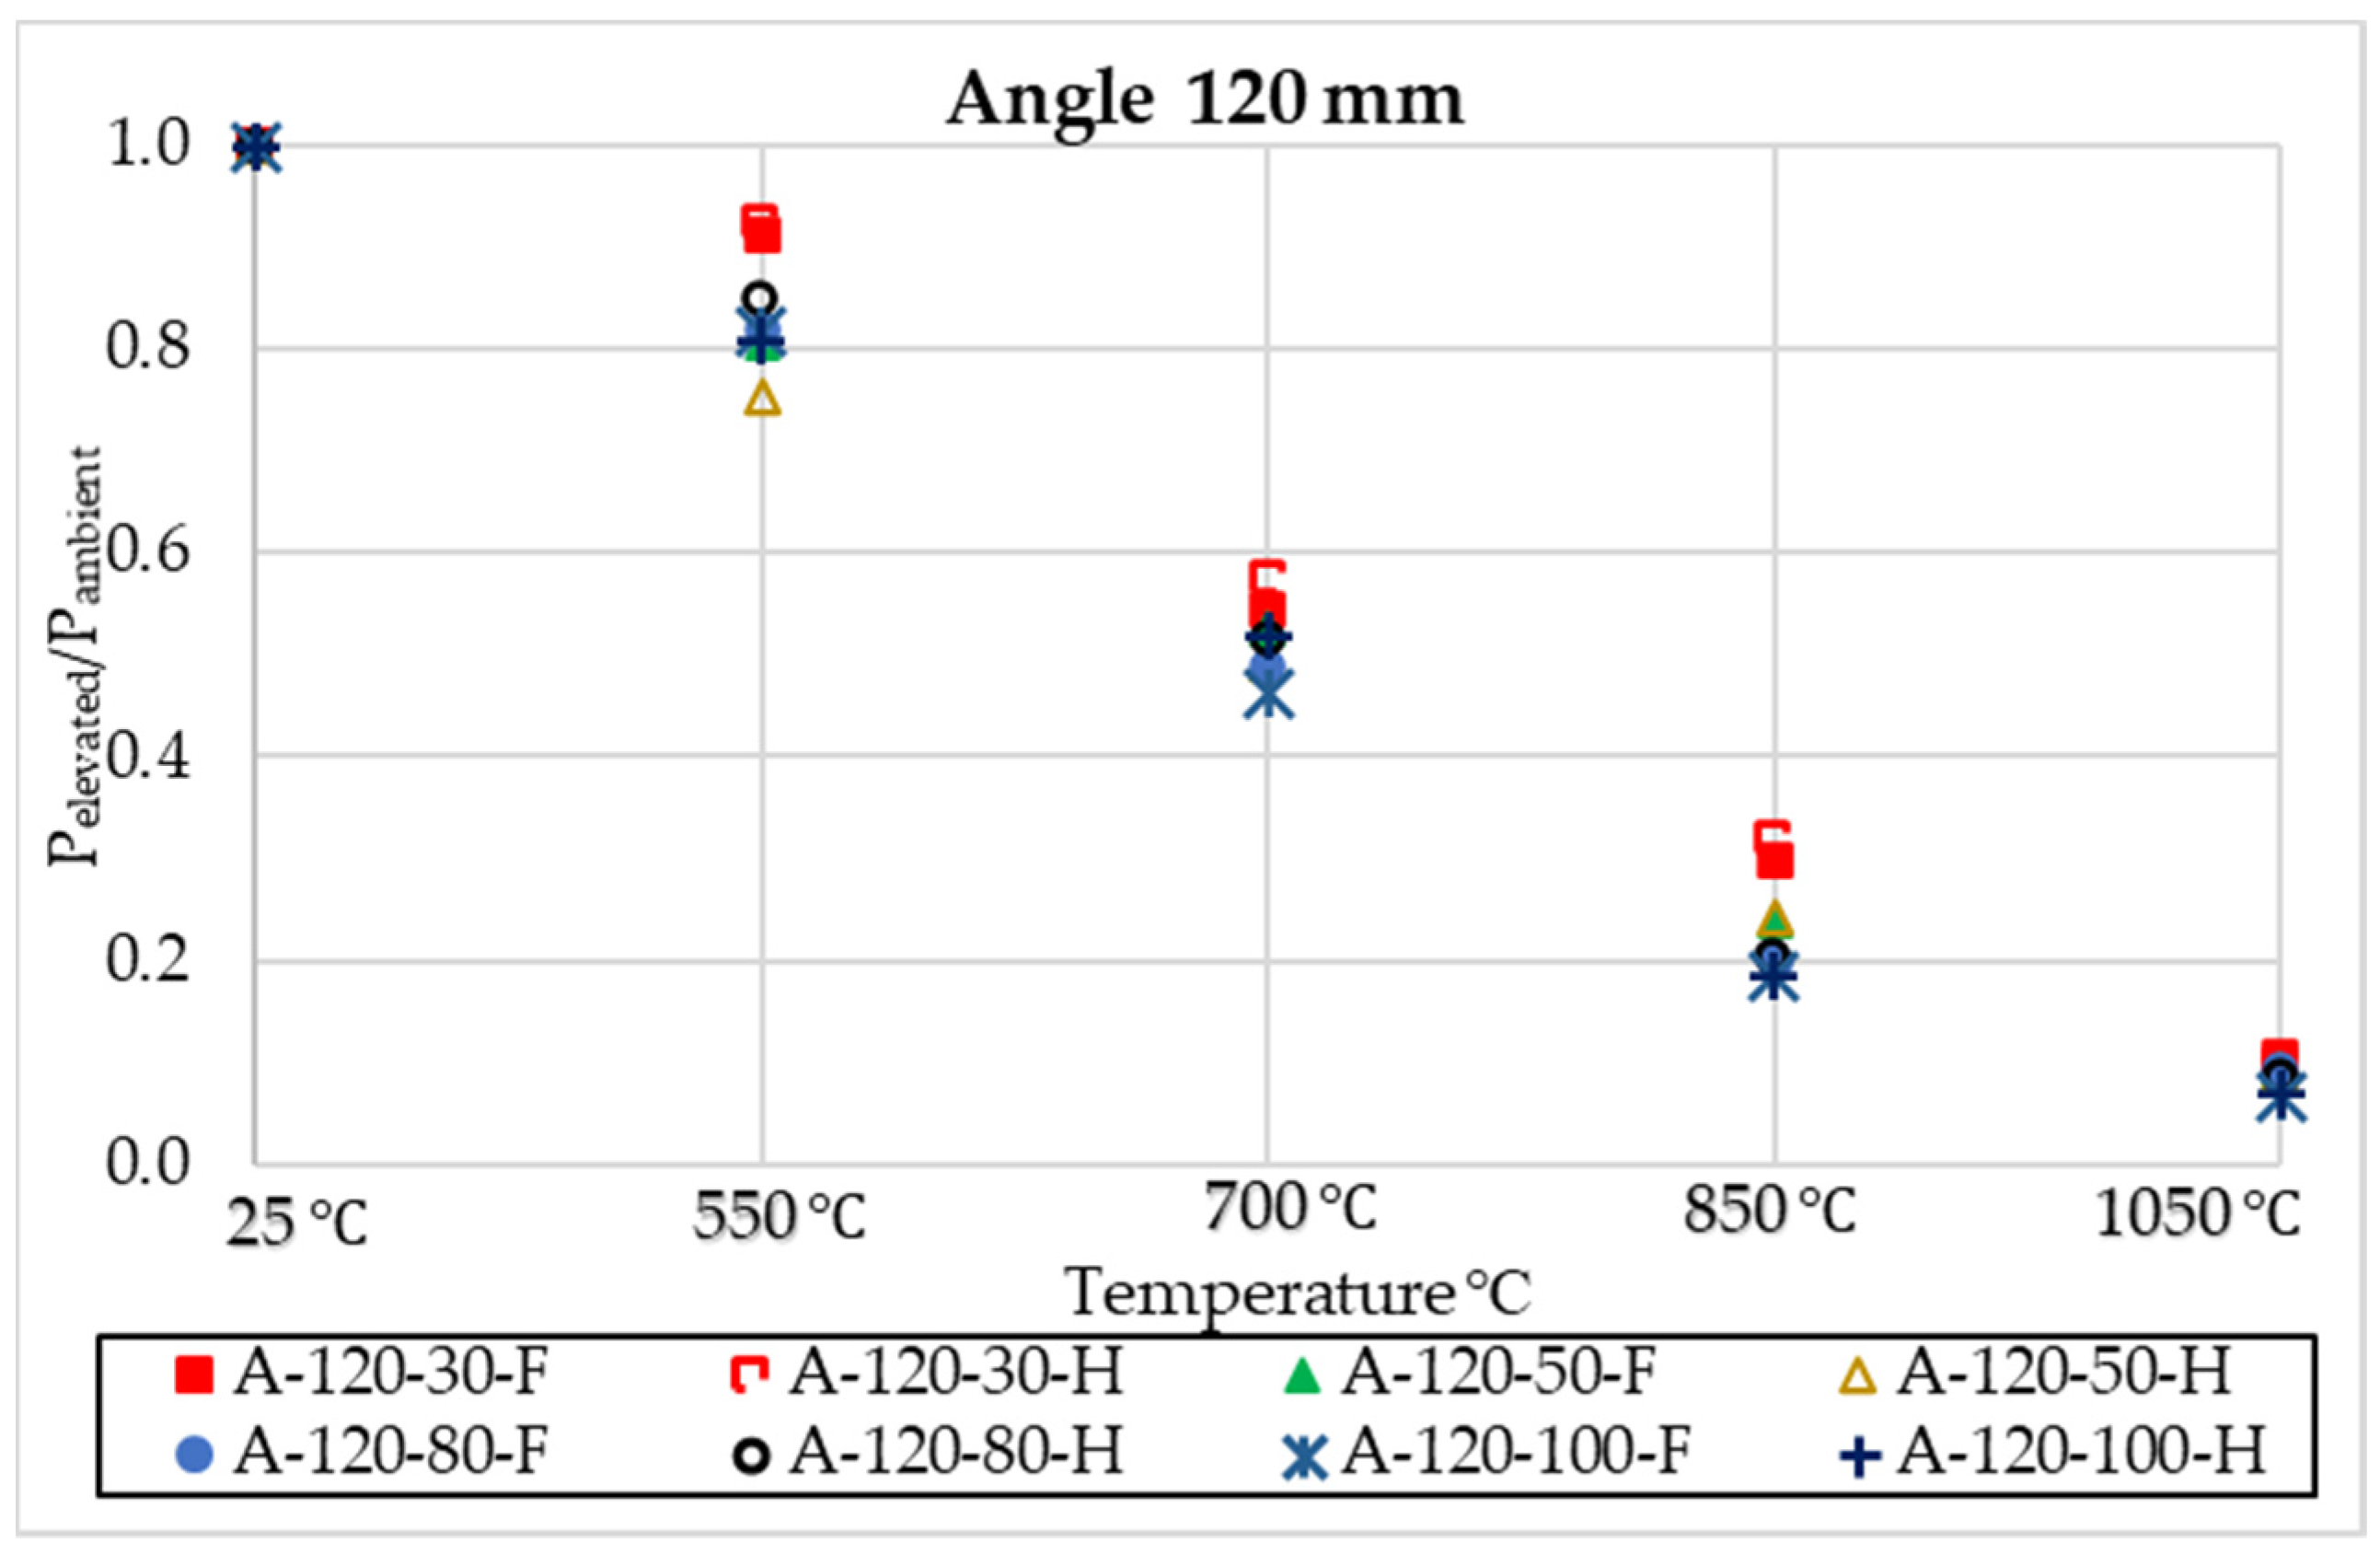
Table 5, Table 6 and Table 7 compare the ultimate loads for 75, 100, and 120 mm heights based on the FE findings. Figure 22, Figure 23 and Figure 24 show how high temperatures impact the load-carrying capacity of shear connections in comparison to those obtained at ambient temperatures, and how high temperatures degrade the resistance and stiffness of stiffened angle shear connectors. At different temperatures, the angle shear connector’s ultimate load-carrying capacity fell by about 7.85–93.33% for the full-length stiffener, and roughly 3.37–92.94% for the half-length stiffener. At 1050 °C, the strength of the 120 mm-high connector was reduced by up to 90% for 30 mm, 91% for 50 mm and 80 mm widths, and 93% for 100 mm widths. As with the stiffened angle shear connector, the strength decreases for the 100 mm wide connector were 89%, 90%, 91%, and 92% for 30 mm, 50 mm, 80 mm, and 100 mm widths, respectively. Strength loss was essentially same for all types of shear connectors, regardless of temperature, and the stiffened shear connectors’ geometry and form had a little influence on their strength when compared to shear strength at room temperature. According to the Eurocode 1994 standard, increasing the temperature immediately affects the steel’s specific heat. Slight decreases in stiffening angle shear connection characteristic resistance (Pelevated/Pambient) were seen at temperatures up to 1050 °C, as illustrated in Figure 22, Figure 23 and Figure 24 for heights of 75 mm, 100 mm, and 120 mm, respectively, as the temperature rose.
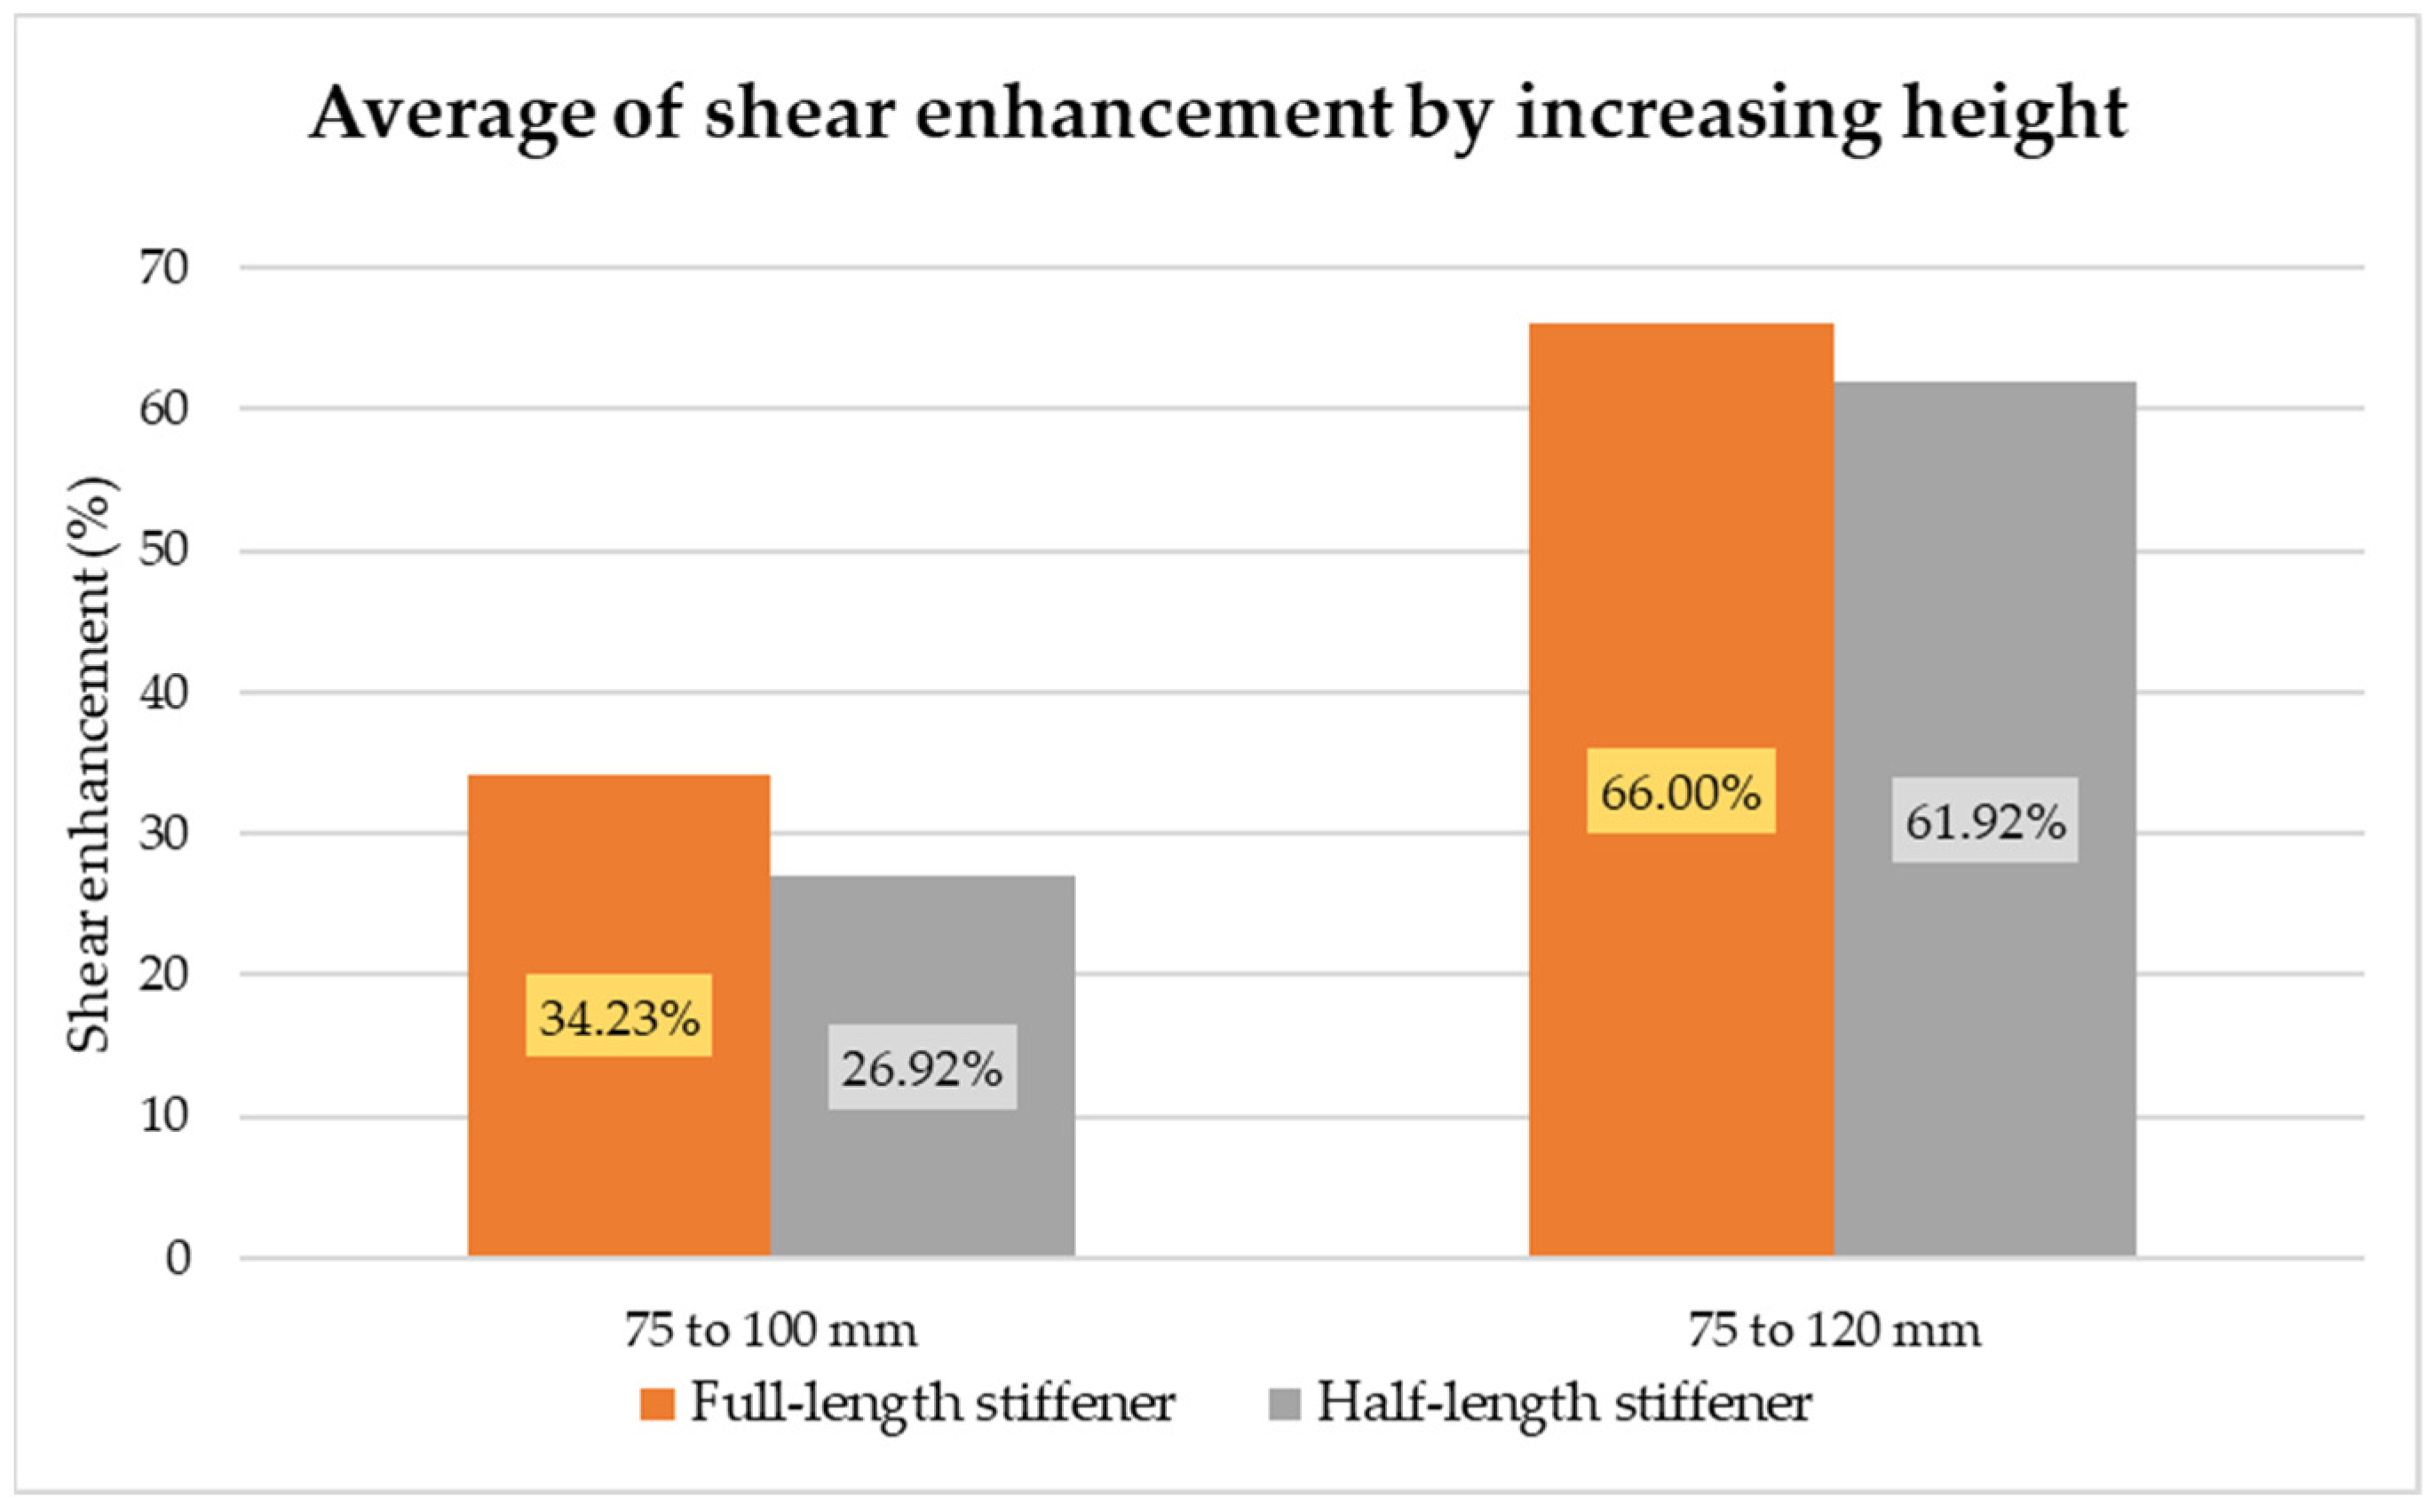
The novel stiffened shear connector perfectly overcomes the weakness of the ordinary C-shaped shear connector, which is high bending moment at the root of the shear connector, because bending moment is one of the vital criteria of the shear connector to resist shear force. The shear connector in composite under lateral loads behaves like a cantilever beam and suffers from a high amount of bending moment, and a truss-shaped stiffener reduces the bending moment in the shear connector. Thus far, two stiffeners were designed, full-length and half-length, and their height was equivalent to that of the shear connector, leading the height of the shear connector to become one of the crucial parameters to increasing the shear capacity of the shear connector, unlike the ordinary C-shaped shear connector whose height has no momentous contribution in terms of shear enhancement. Therefore, by increasing the height of the shear connector for the full-length of the shear, more shear enhancement was observed. In addition, the half-length stiffened shear connector’s behavior was slightly more flexible compared with that of the full-length stiffened one. Figure 25 presents the efficiency of height to enhance the shear strength of the shear connector.
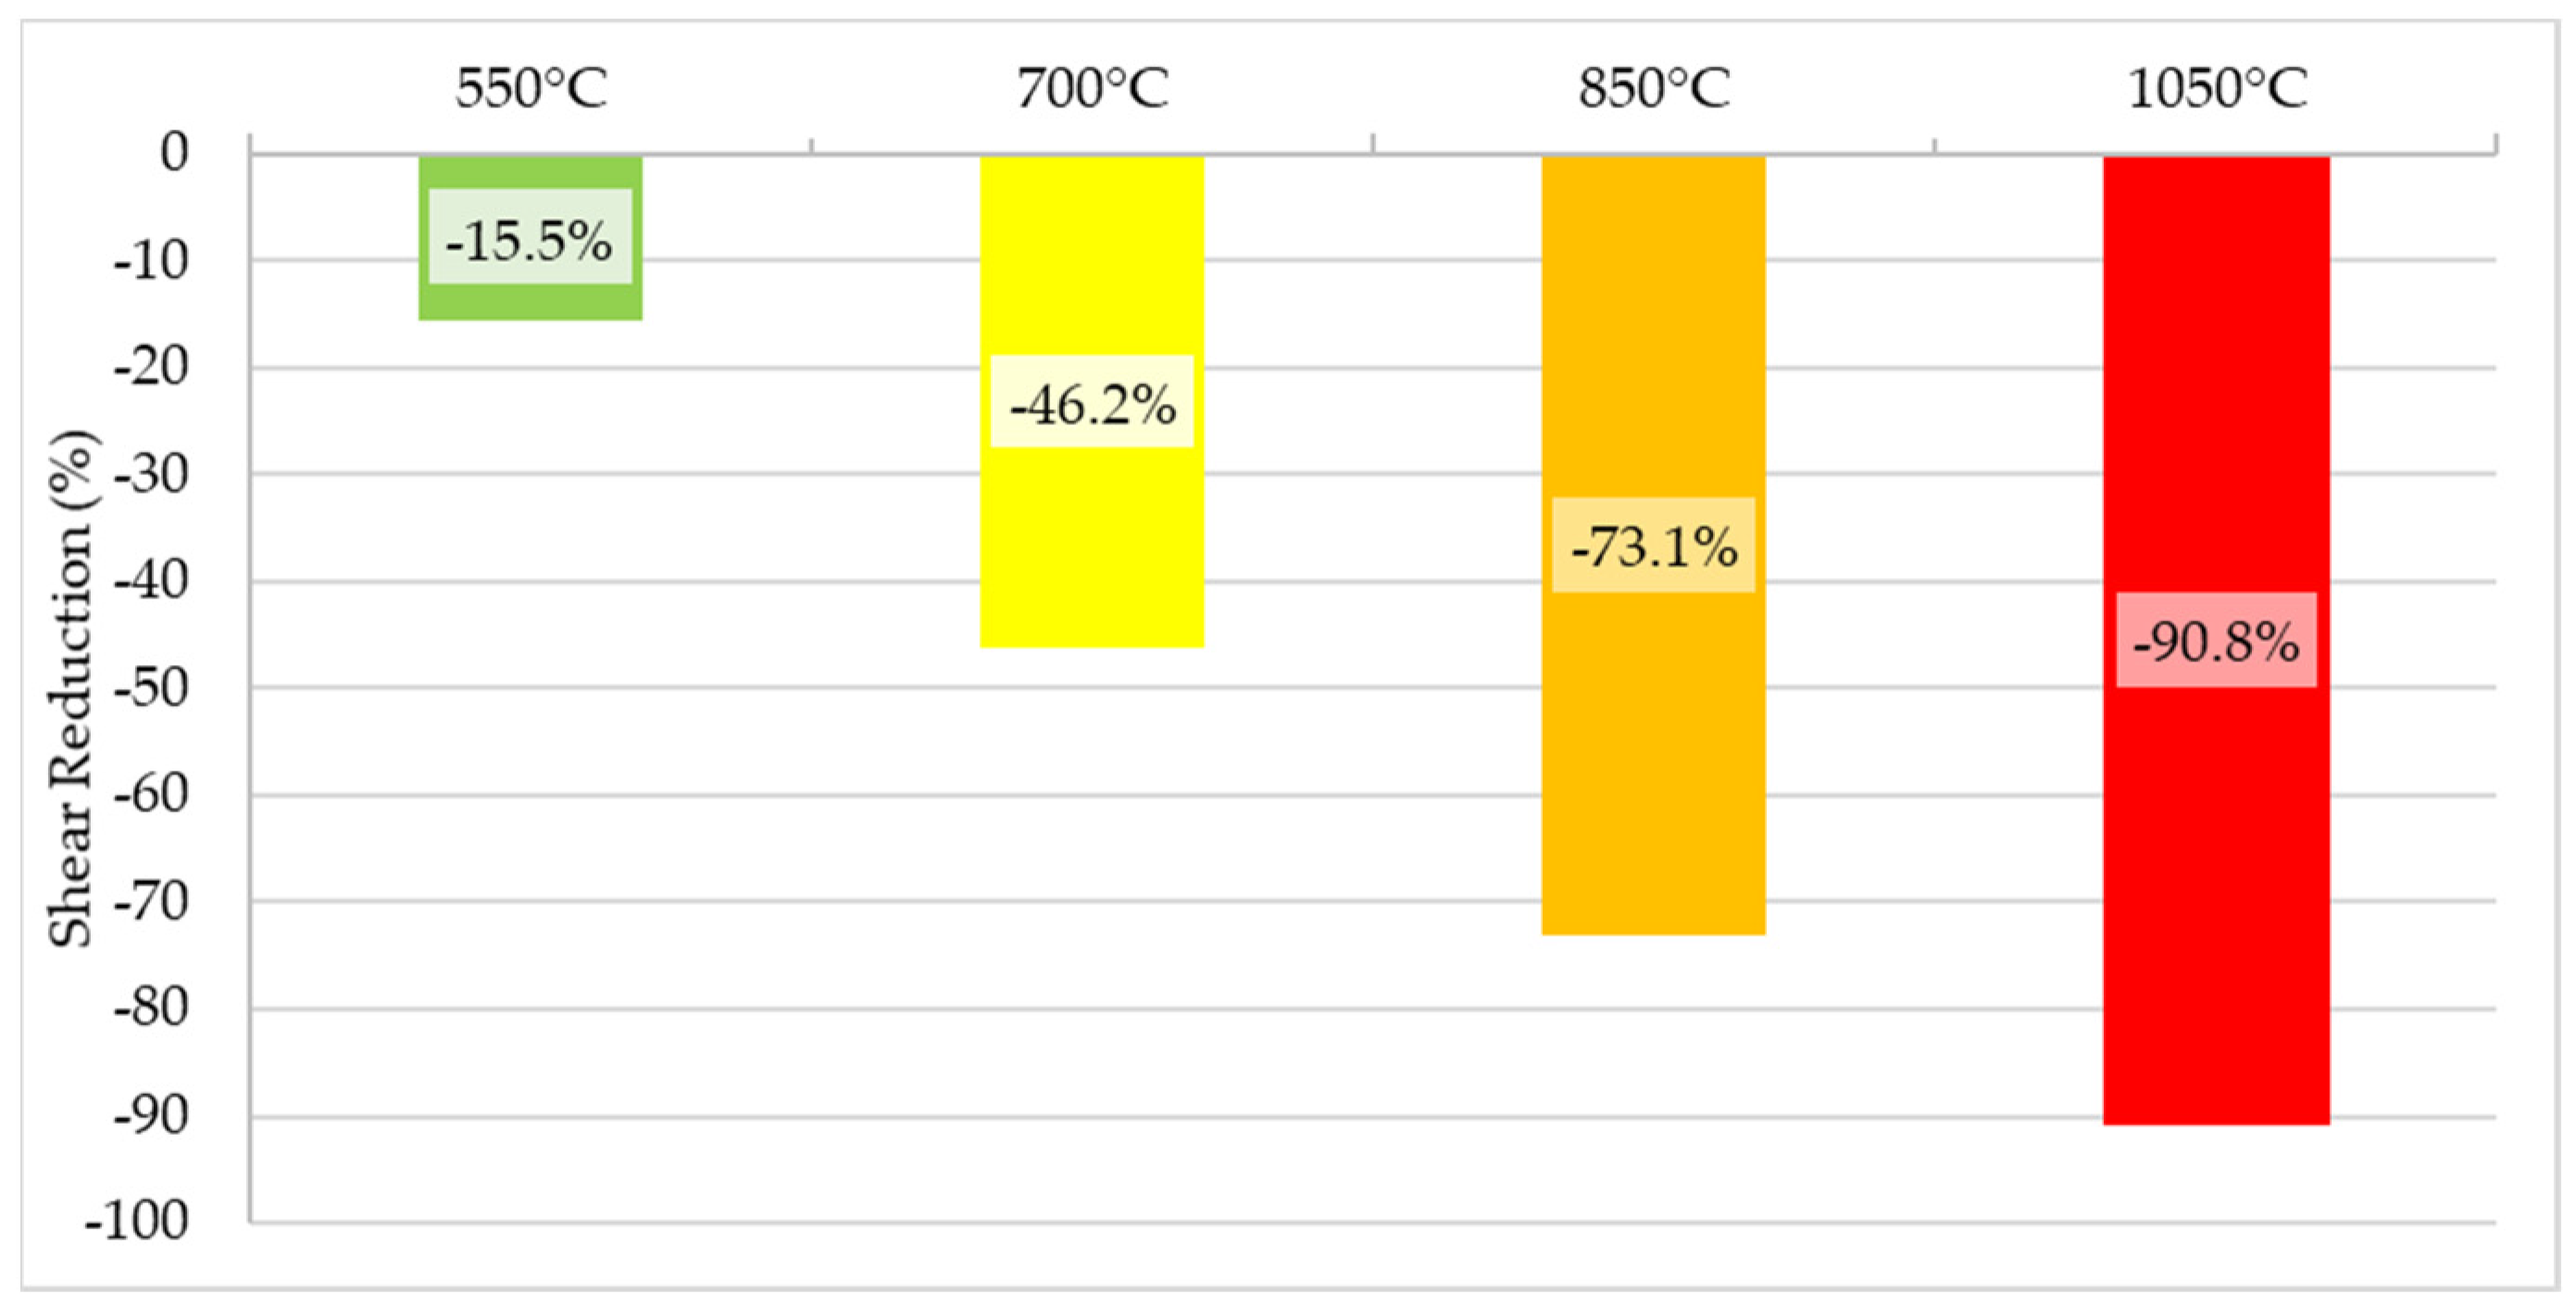
The width of the shear connector in the stiffened shear connector and ordinary shear connector has a vital role in enhancing the shear strength of the shear connector. Increasing the width of the steel angle profile bearing area of force at the root of the shear connector rises, as mentioned in the previous section, by increasing the area the pressure drops that resulted in bearing higher forces. Moreover, using a longer width of angle profile enhanced the welding line where the shear connector was attached to the steel girders, resulting in more welding line and more fixity of the shear connector against lateral forces. Figure 26 demonstrates the shear enhancement in terms of increasing the width. The stiffened shear connector at ambient temperatures behaves much better and safer compared with the existing C-shaped shear connector, and the shear strength of the stiffened shear connector was higher by 126%, compared with the same geometry of the ordinary C-shaped shear connector. Therefore, its behavior in the event of a fire was investigated. According to the literature review and material properties, elevated temperature has a destructive effect on the strength of materials. The shear strength of the stiffened shear connector at elevated temperature dropped substantially, but its shear strength at a 700–850 °C temperature was equal to that of the ordinary C-shaped shear connector at ambient temperatures with the same geometry. Thus, the stiffened shear connector is extremely safer in ambient and especially elevated temperatures. The shear reduction of shear strength at elevated temperatures could reach up to an average of 91% at a temperature of 1050 °C. Figure 27 shows the average shear reduction at different levels of elevated temperatures.

6.3. Comparing Stiffened Angle Shear Connector with No Stiffened Angle Shear Connector

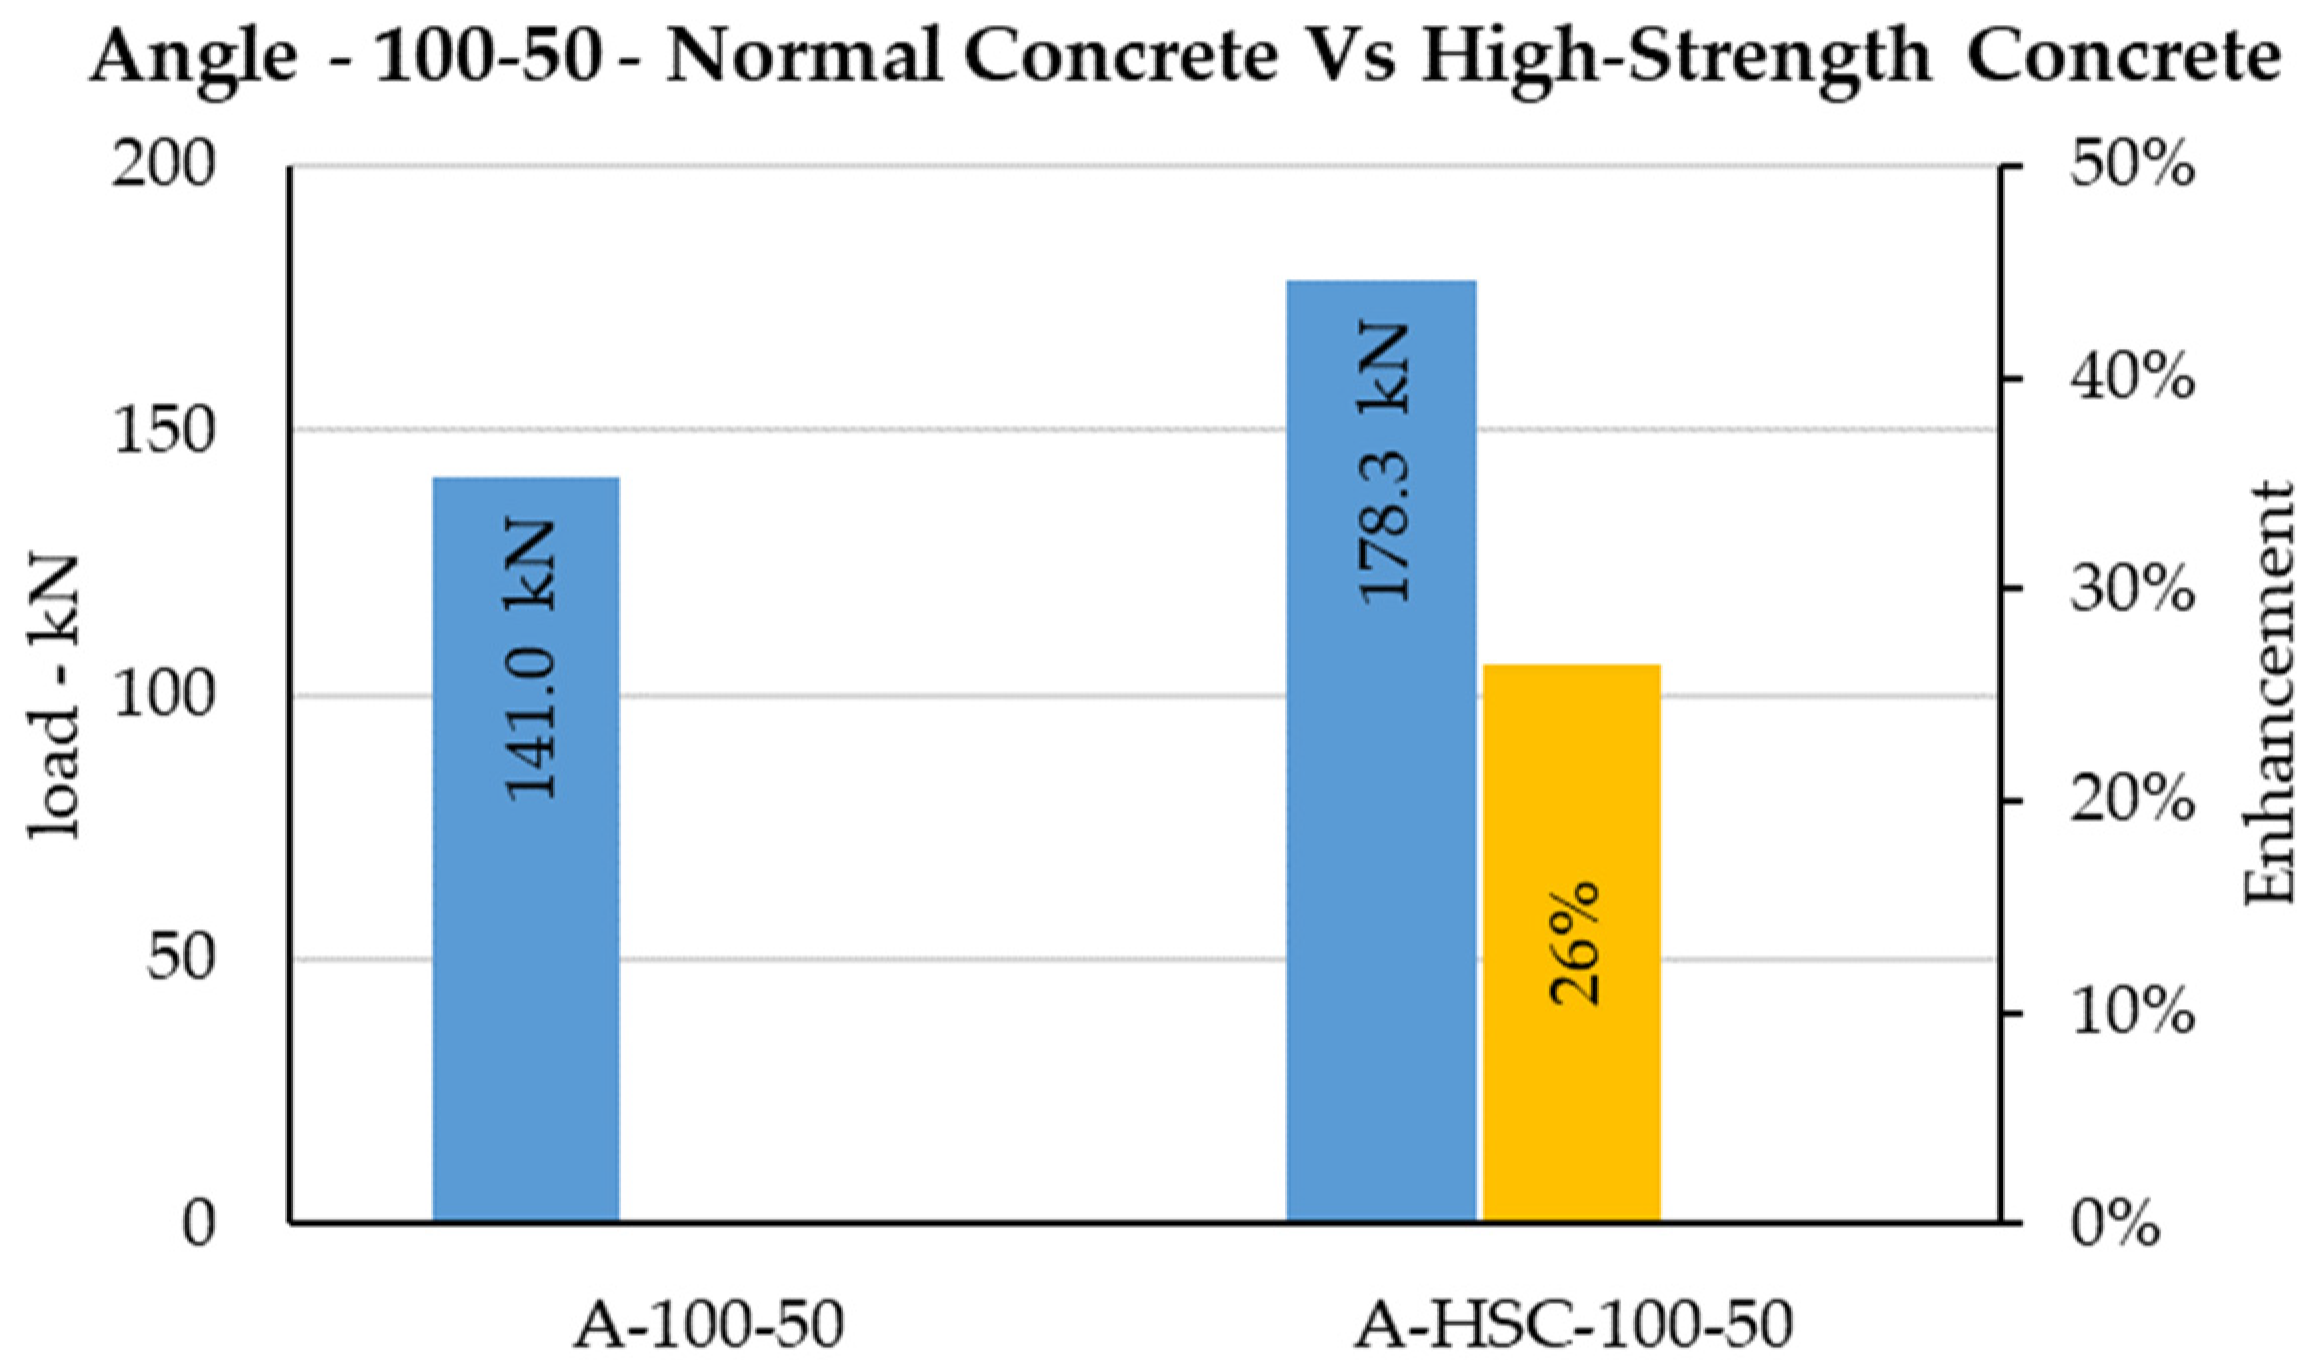
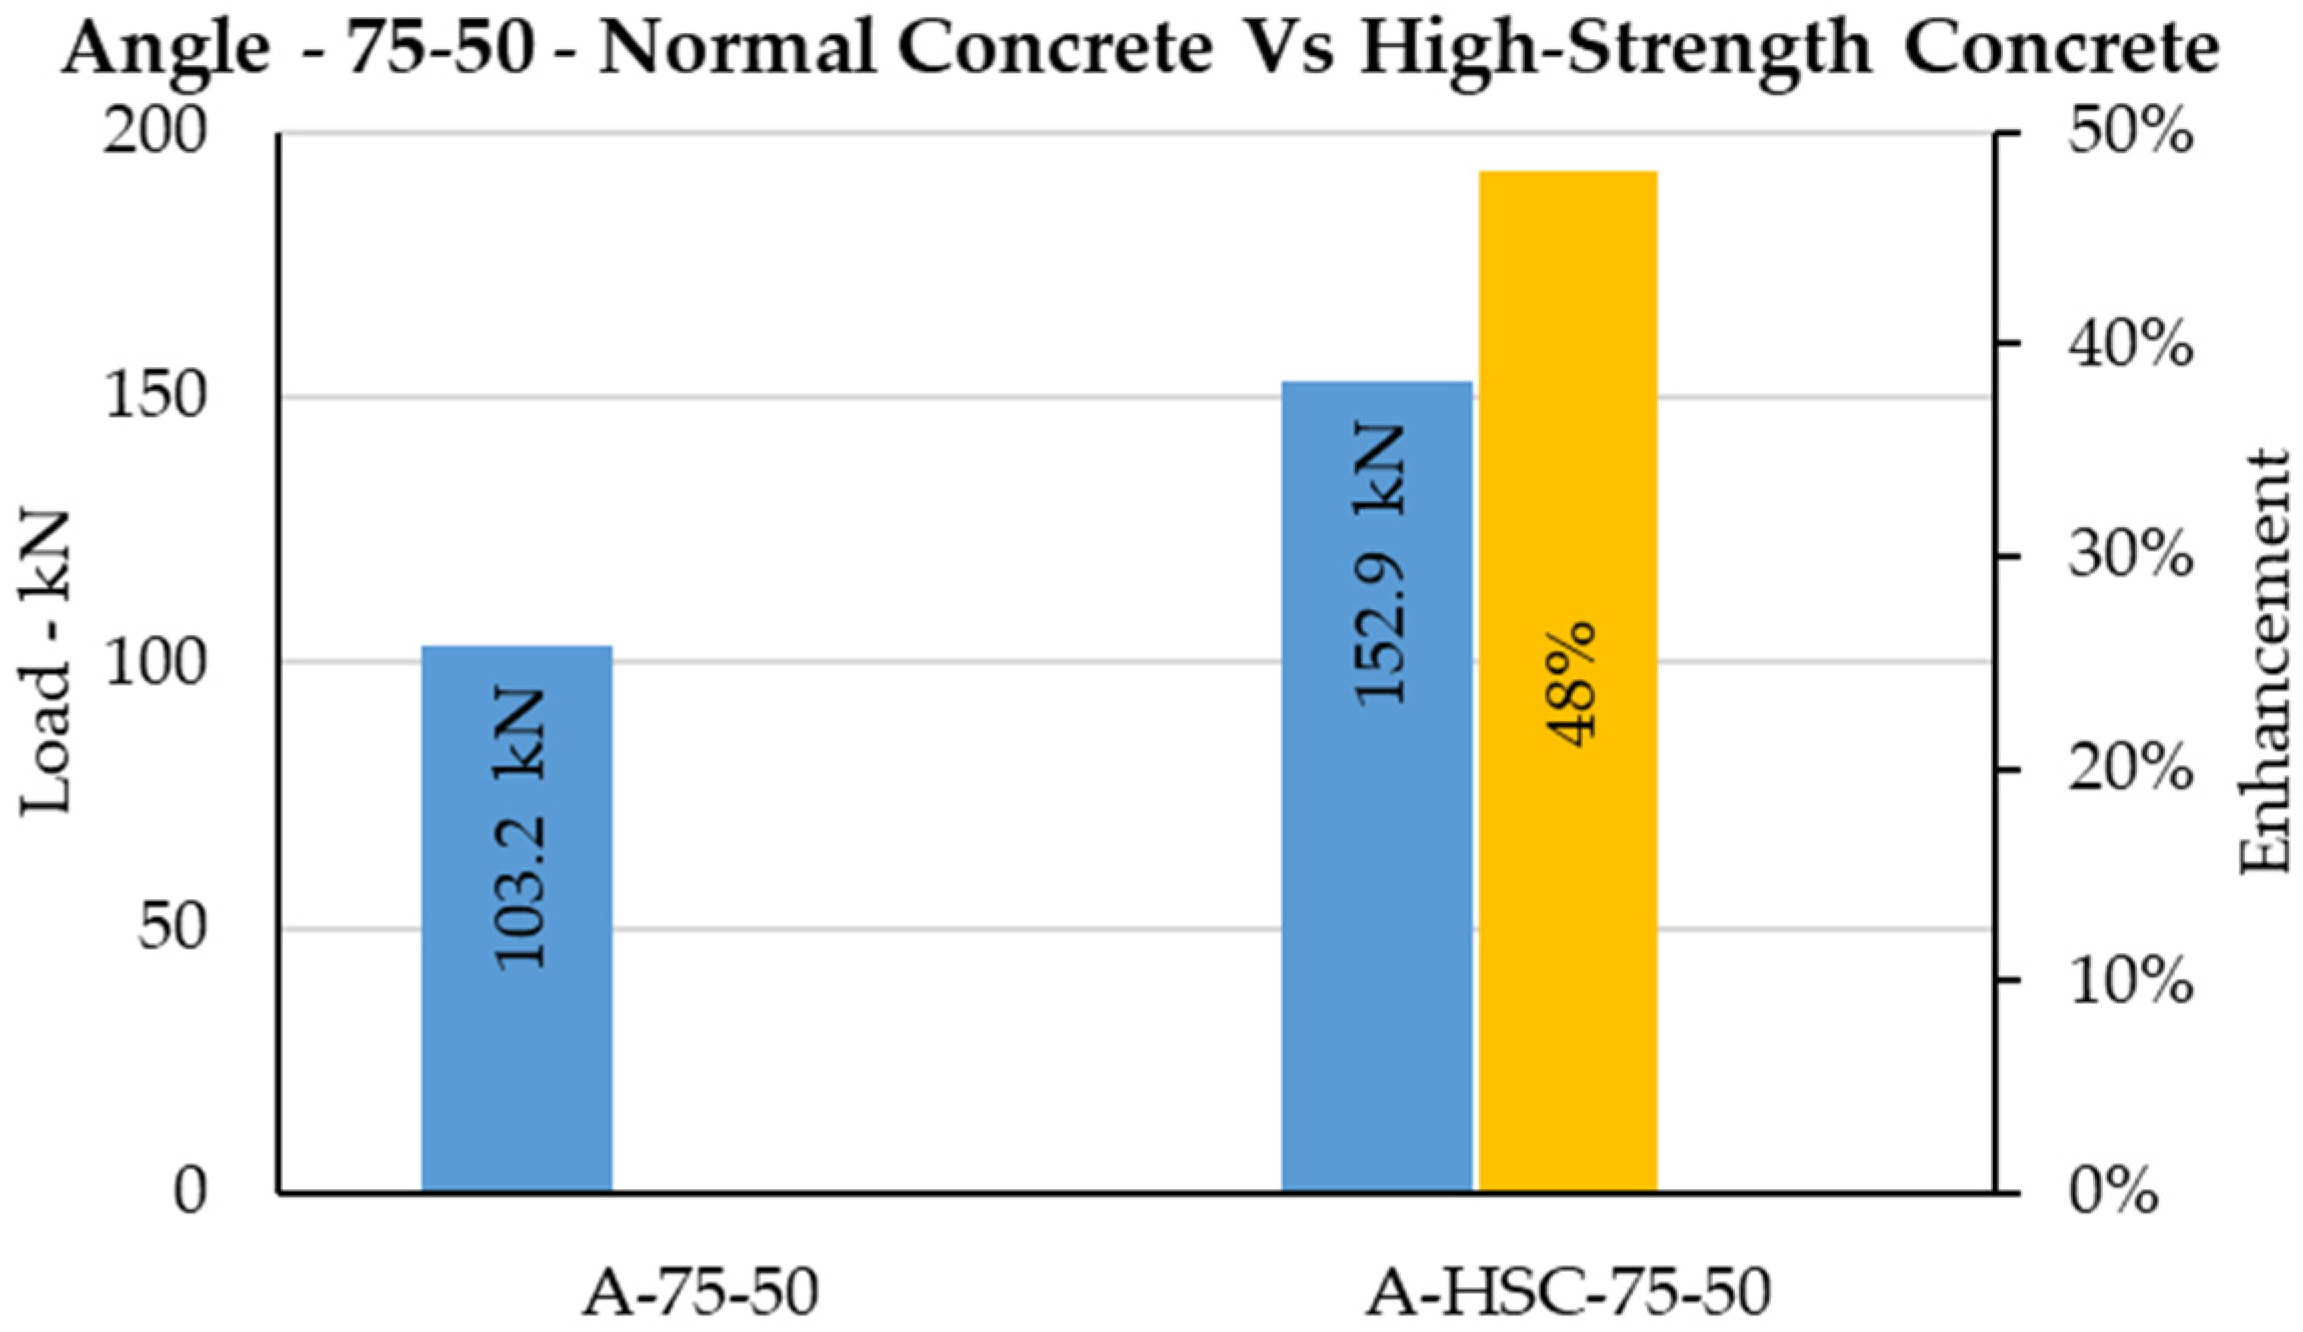
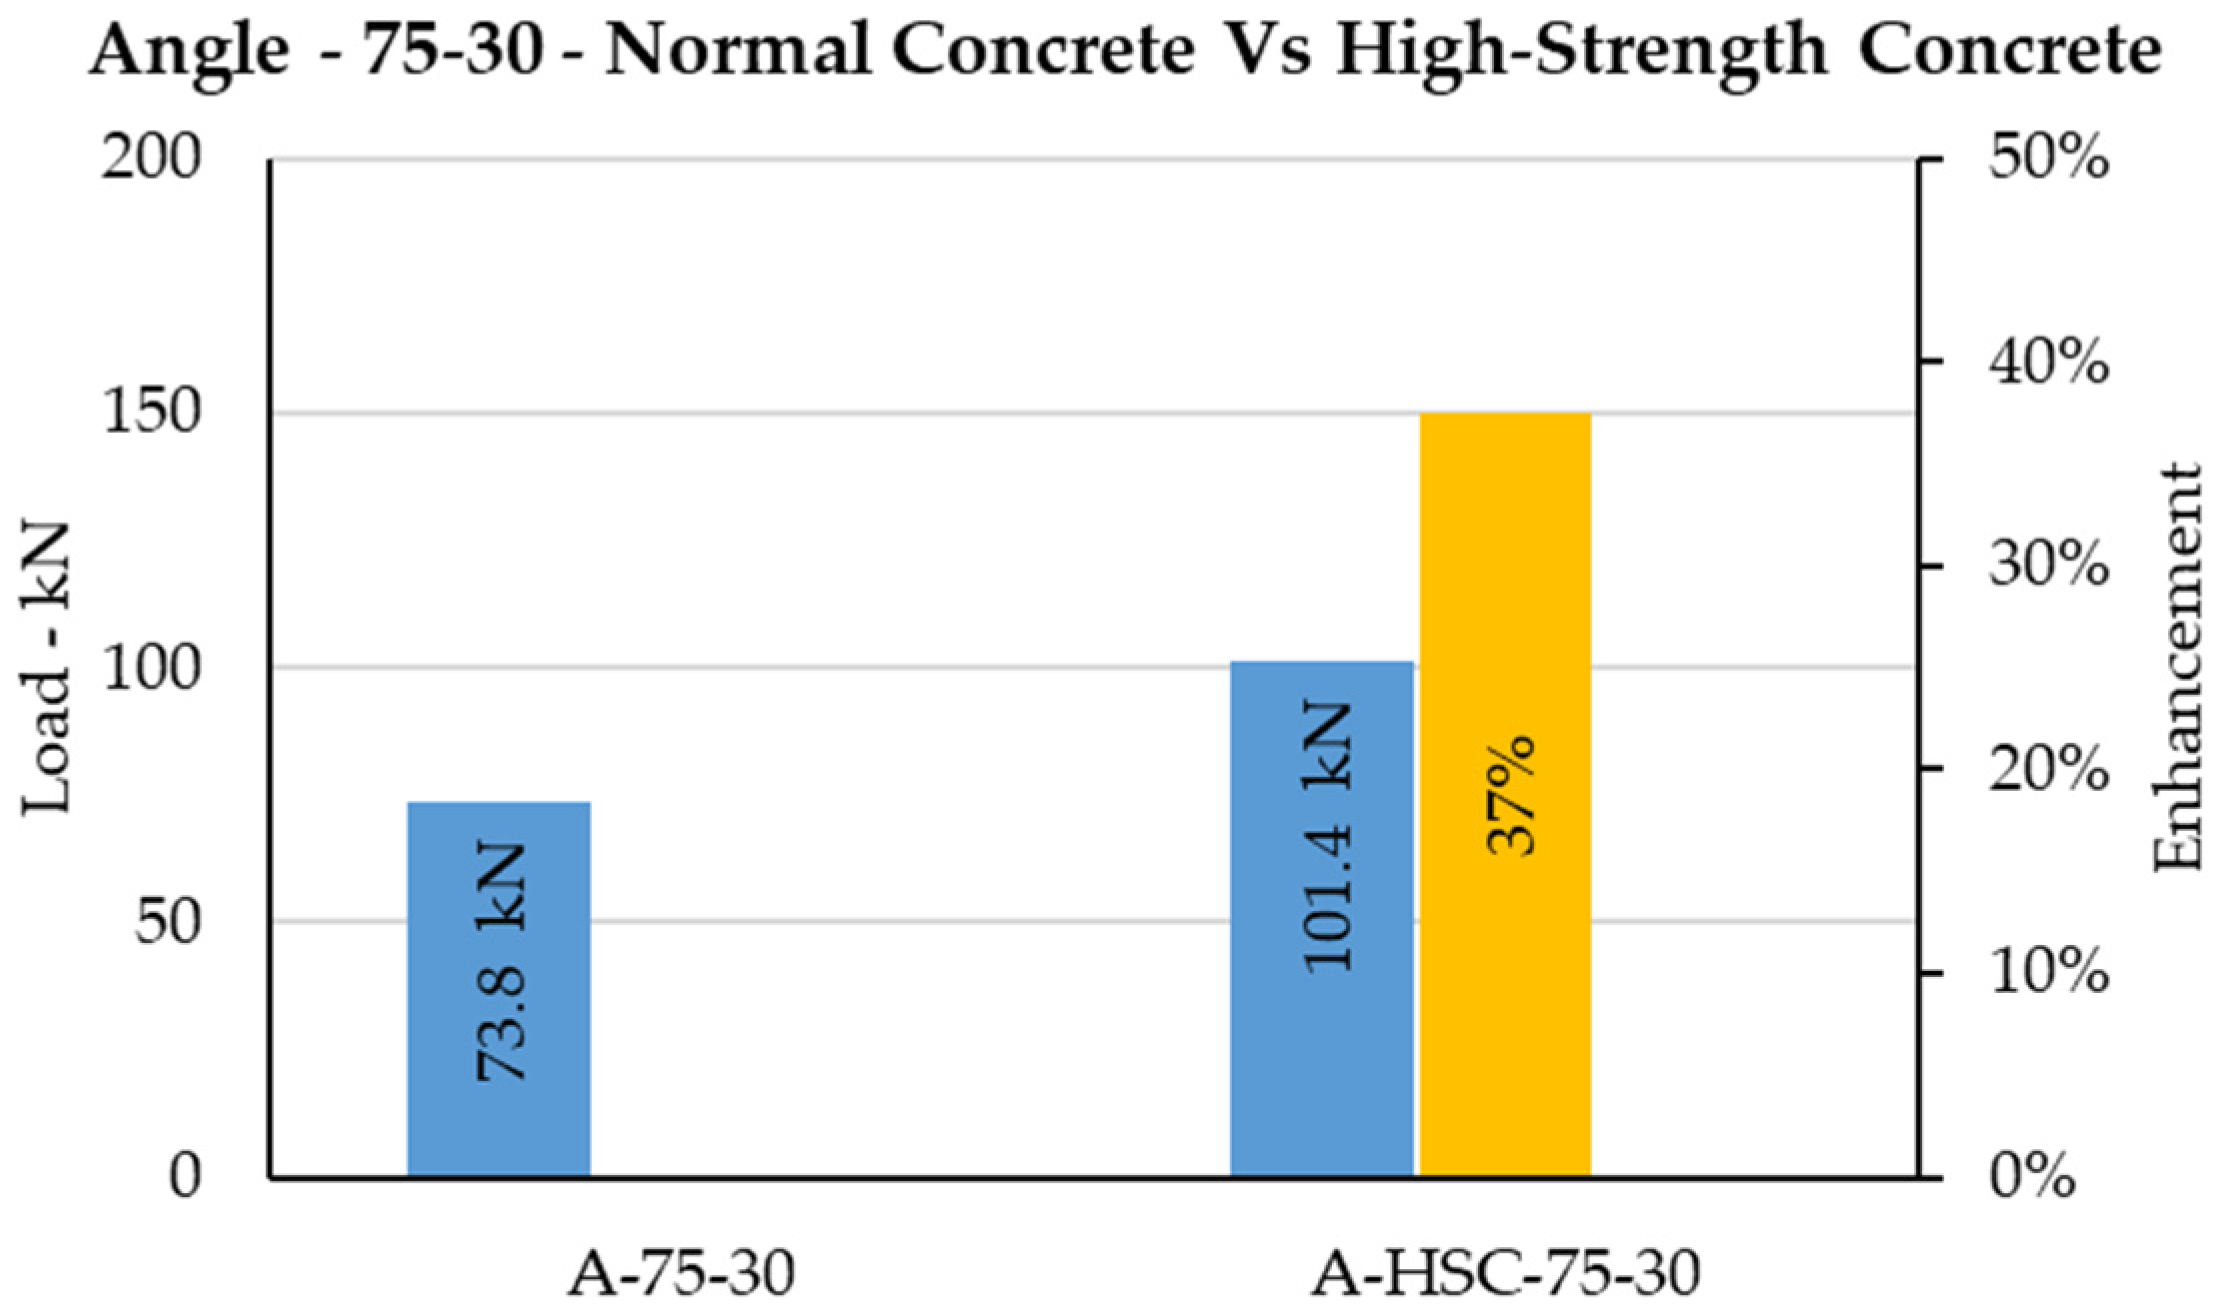
The C-shaped angle shear connector has been investigated, and its behavior embedded to normal concrete and high-strength concrete has been studied [33,36,37,38]. Using high-strength concrete instead of using normal concrete enhanced the shear capacity of the typical angle shear connector by 38% on average, as shown in Figure 28, Figure 29, Figure 30 and Figure 31. Thus, high strength concrete with grade ( f c ) 80 MPa [37,39,40] can only increase the capacity by 38% on average whilst casting high-strength concrete is challenging and costly.
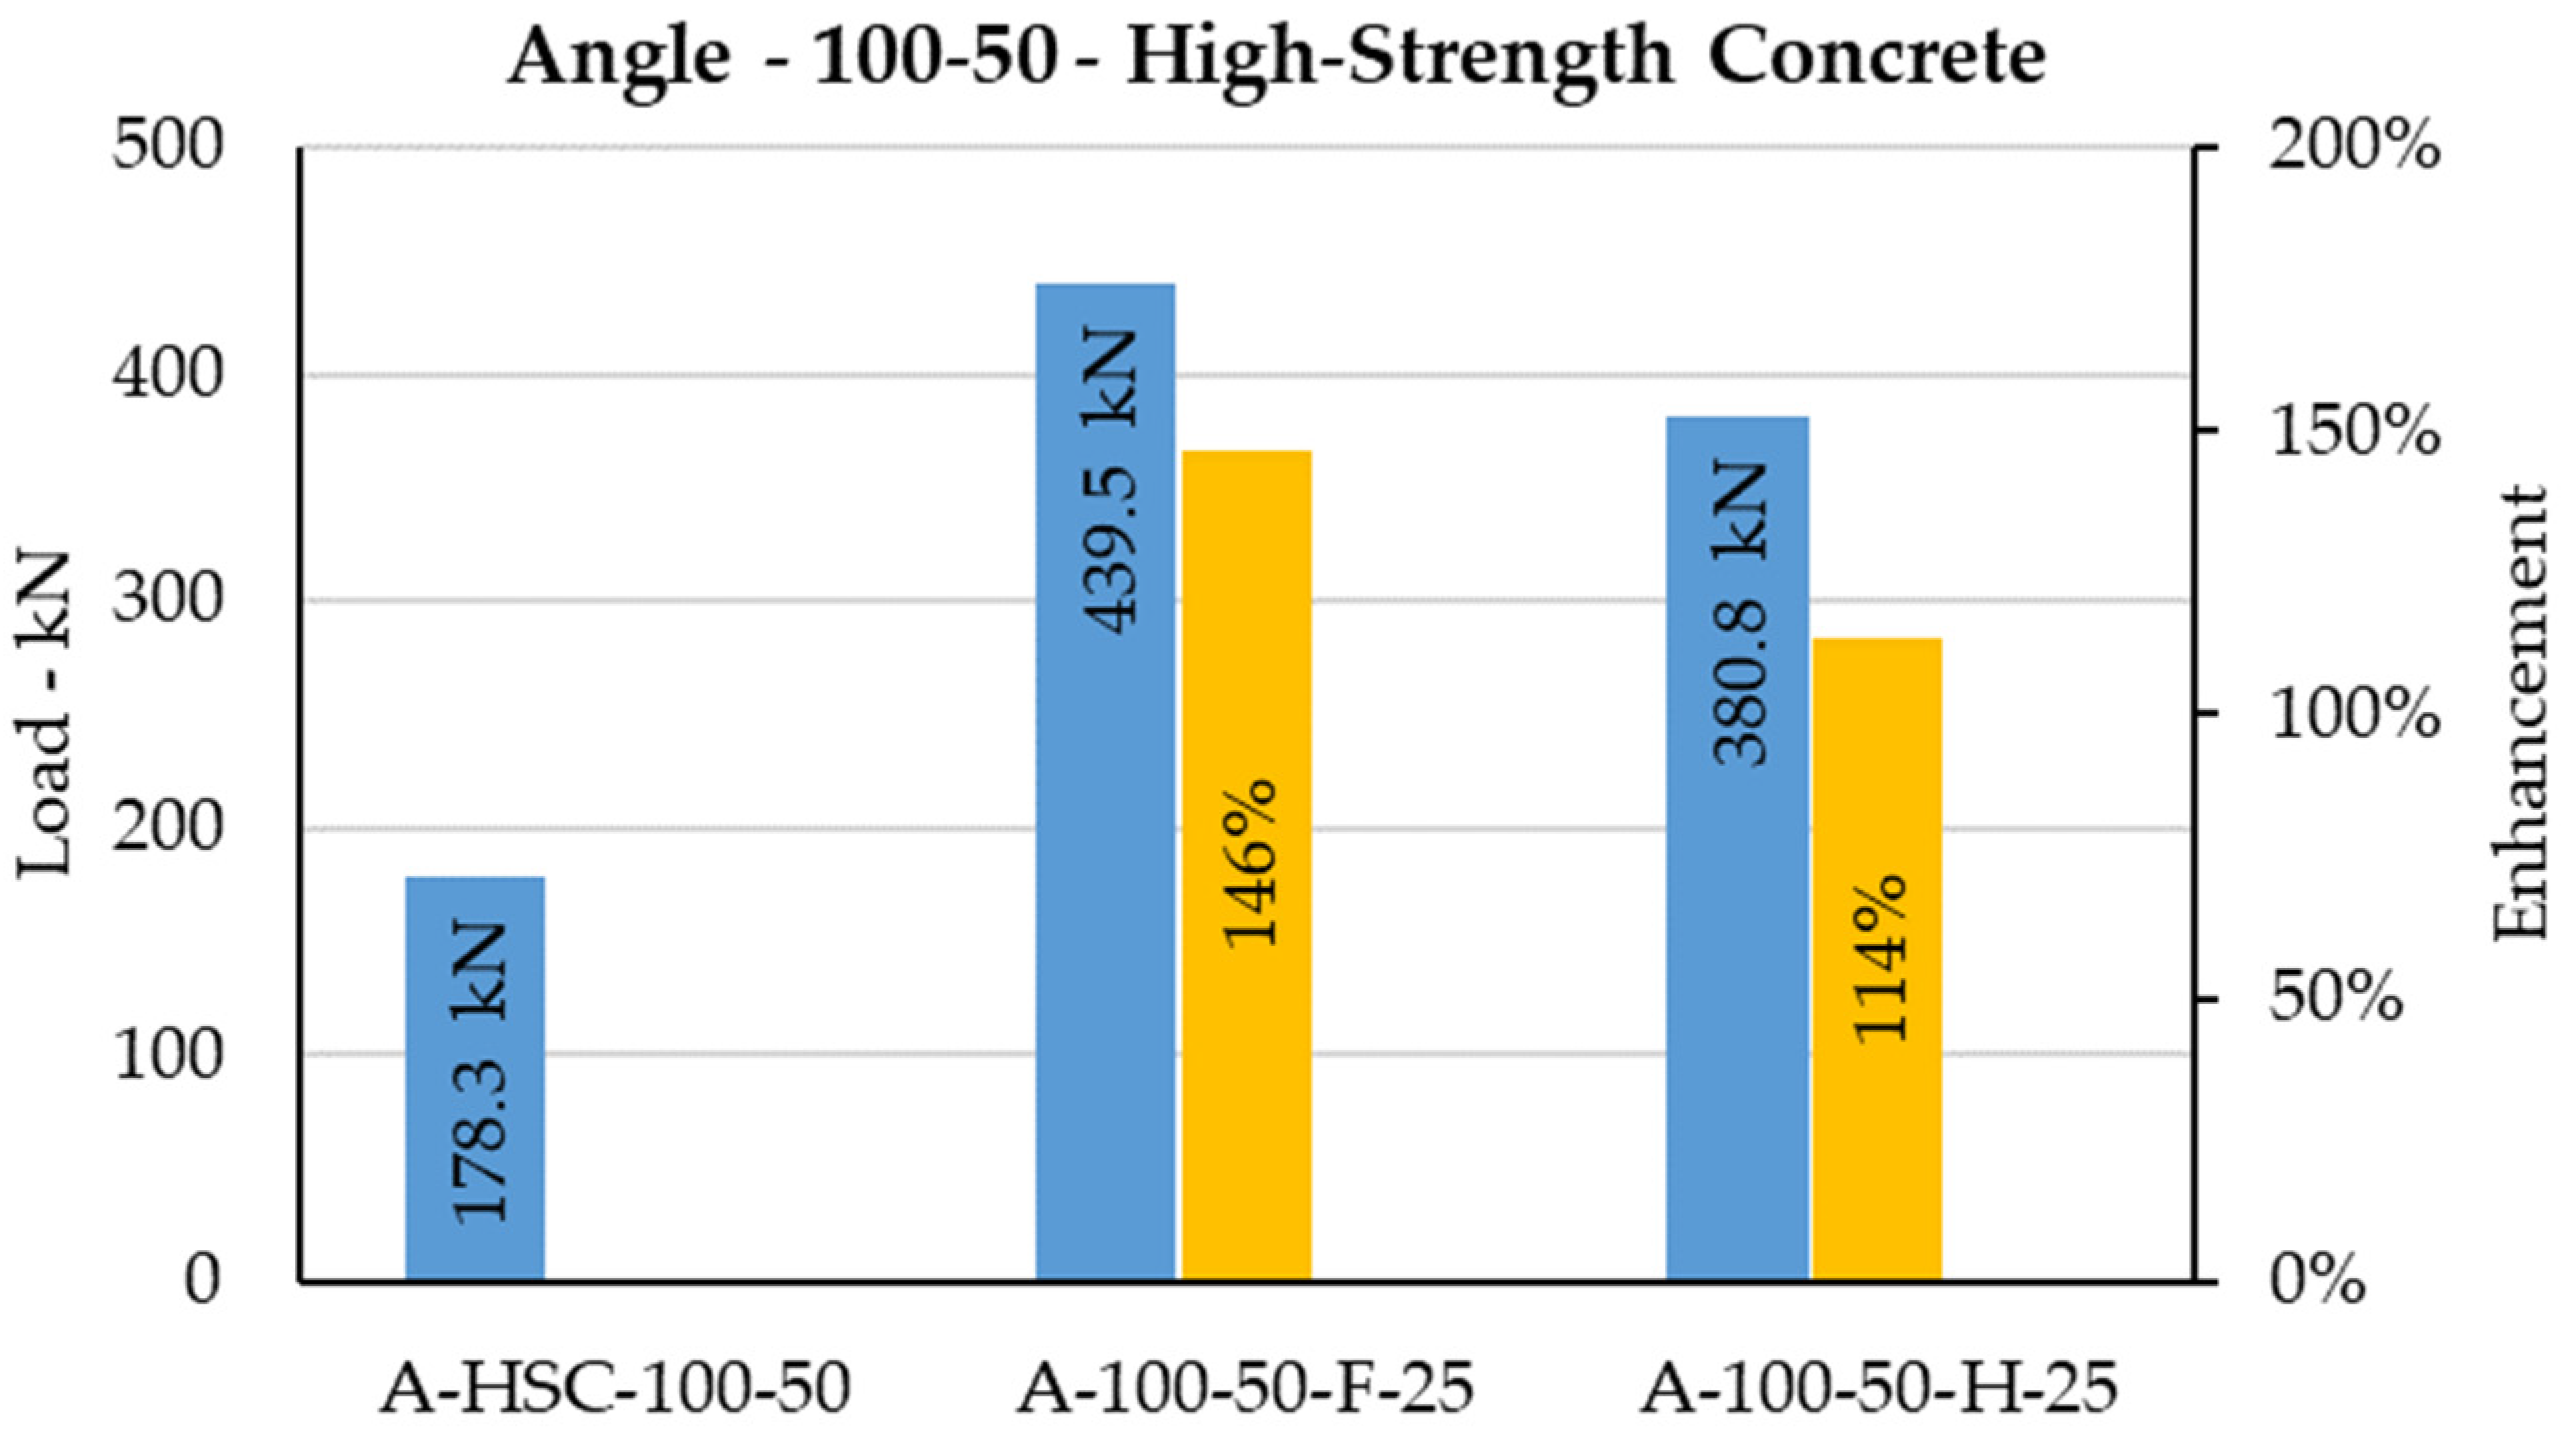
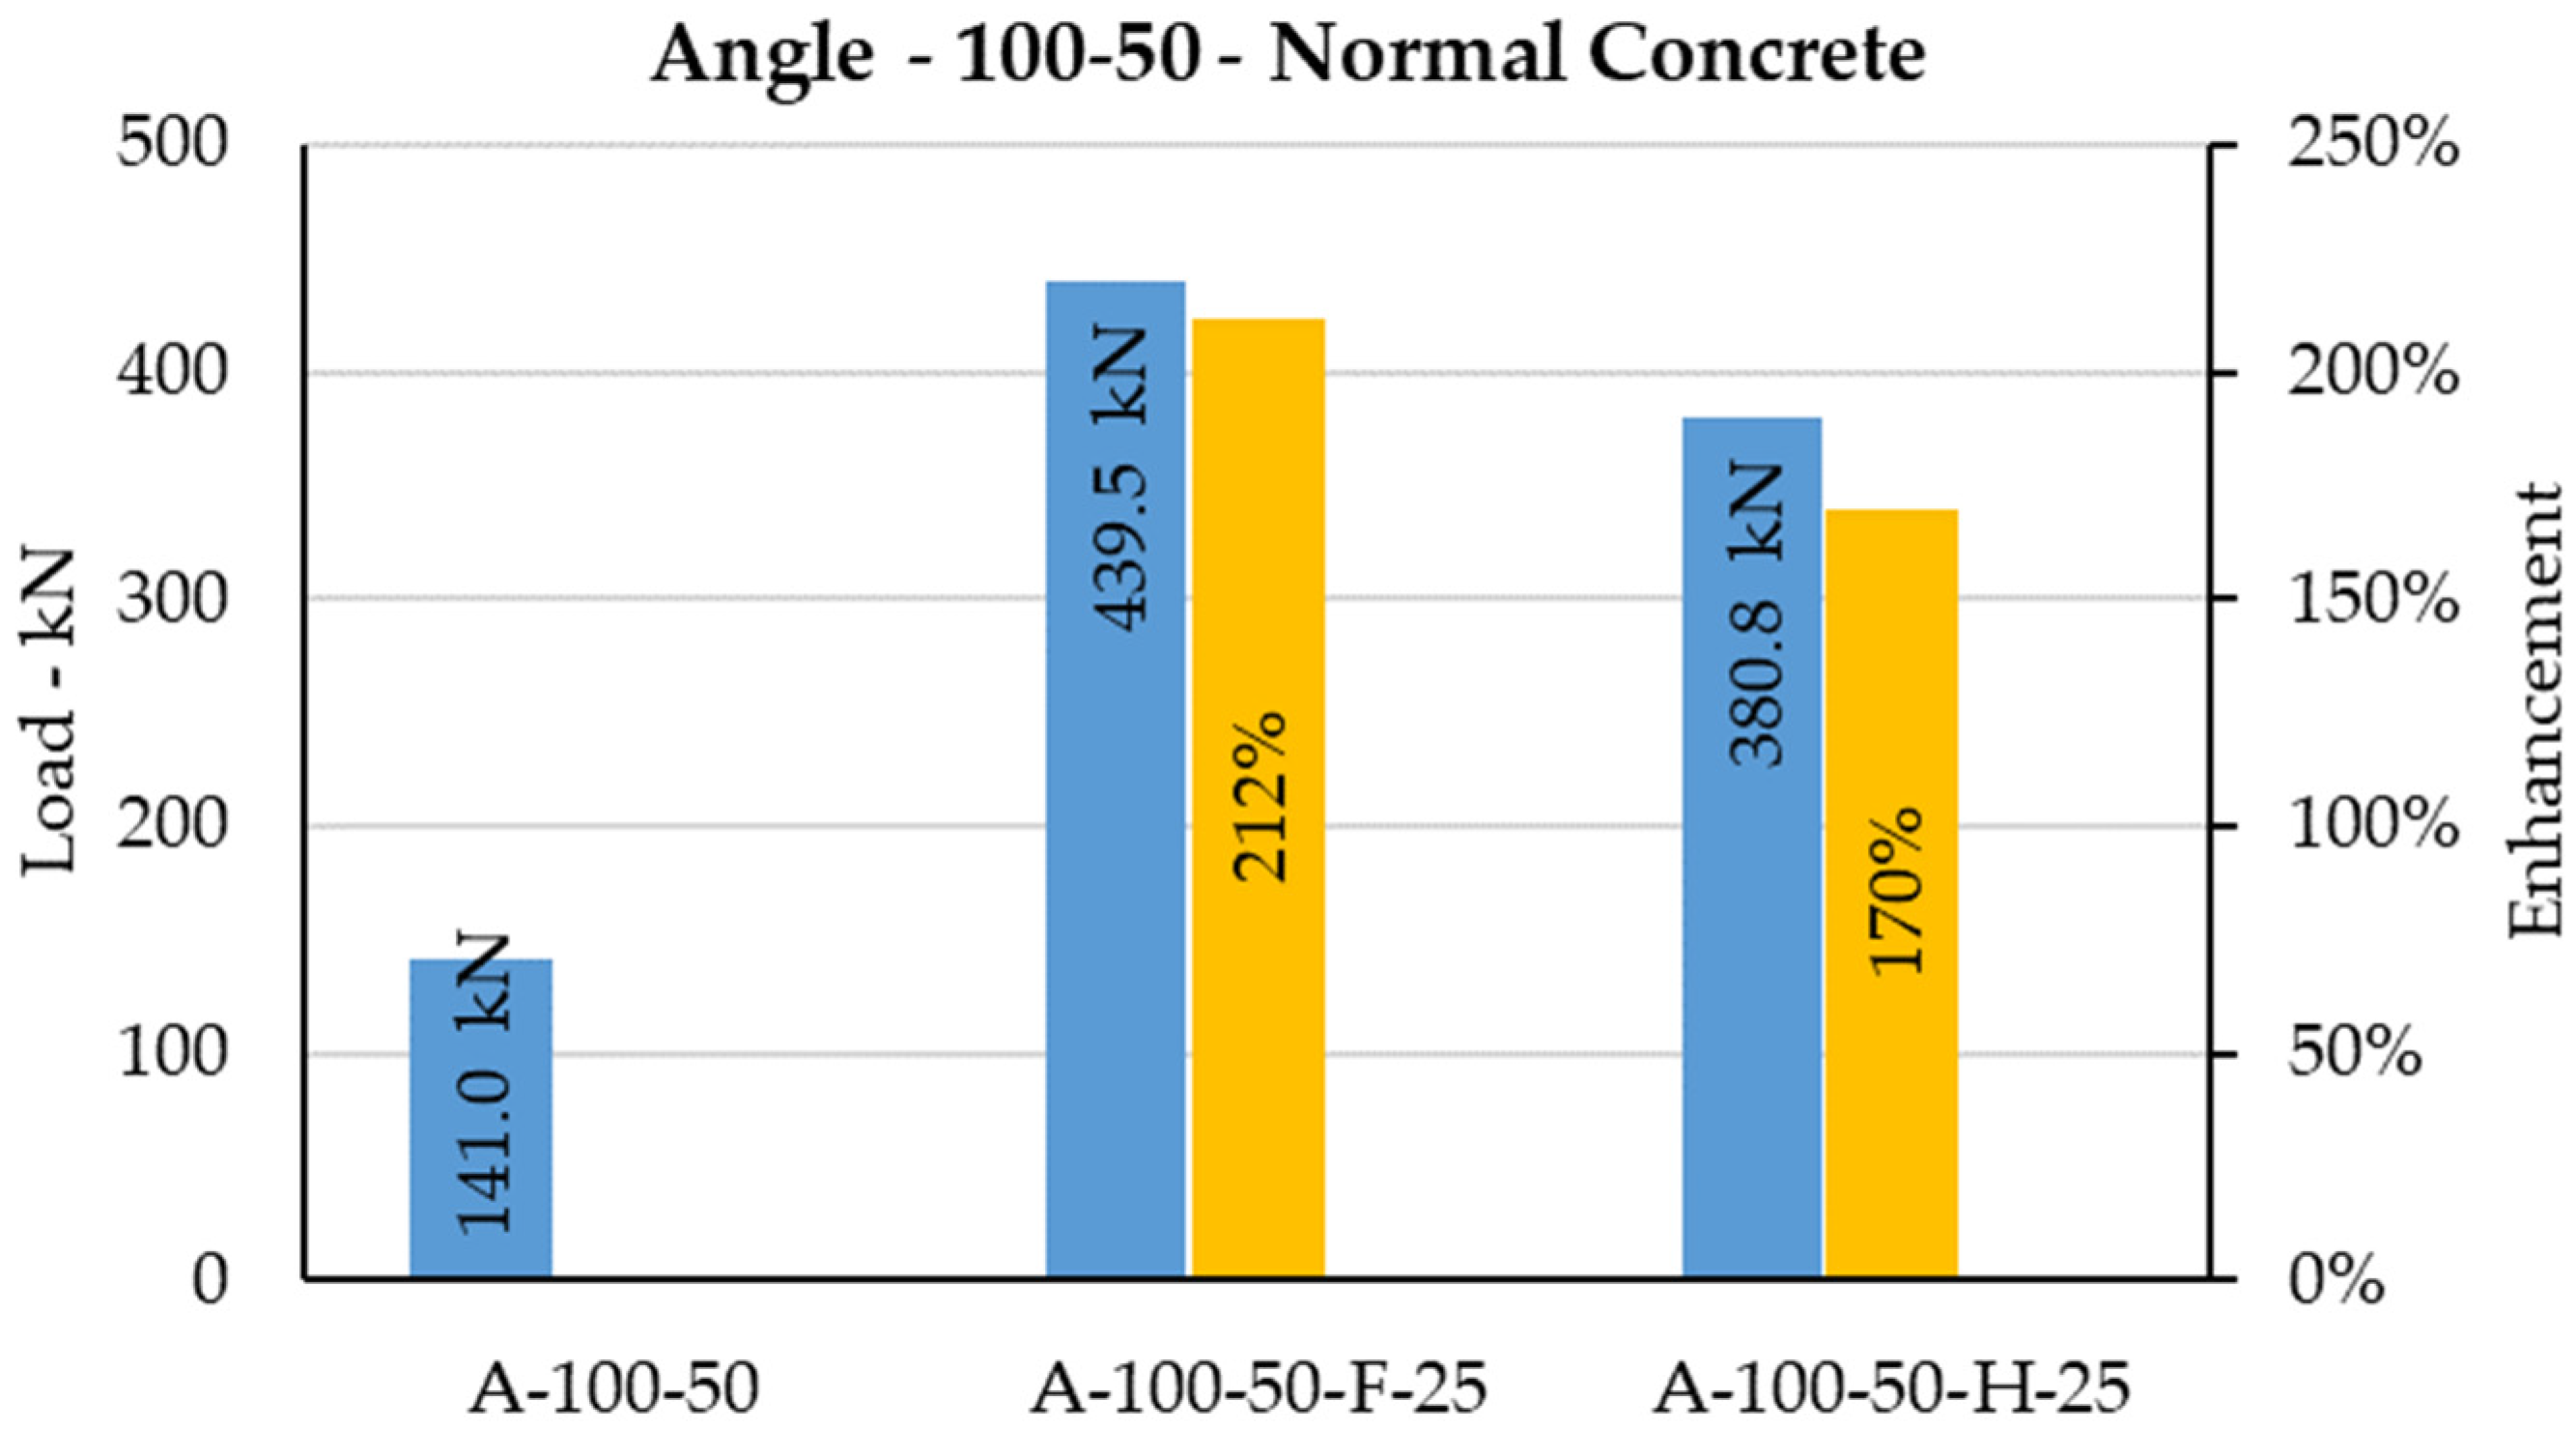
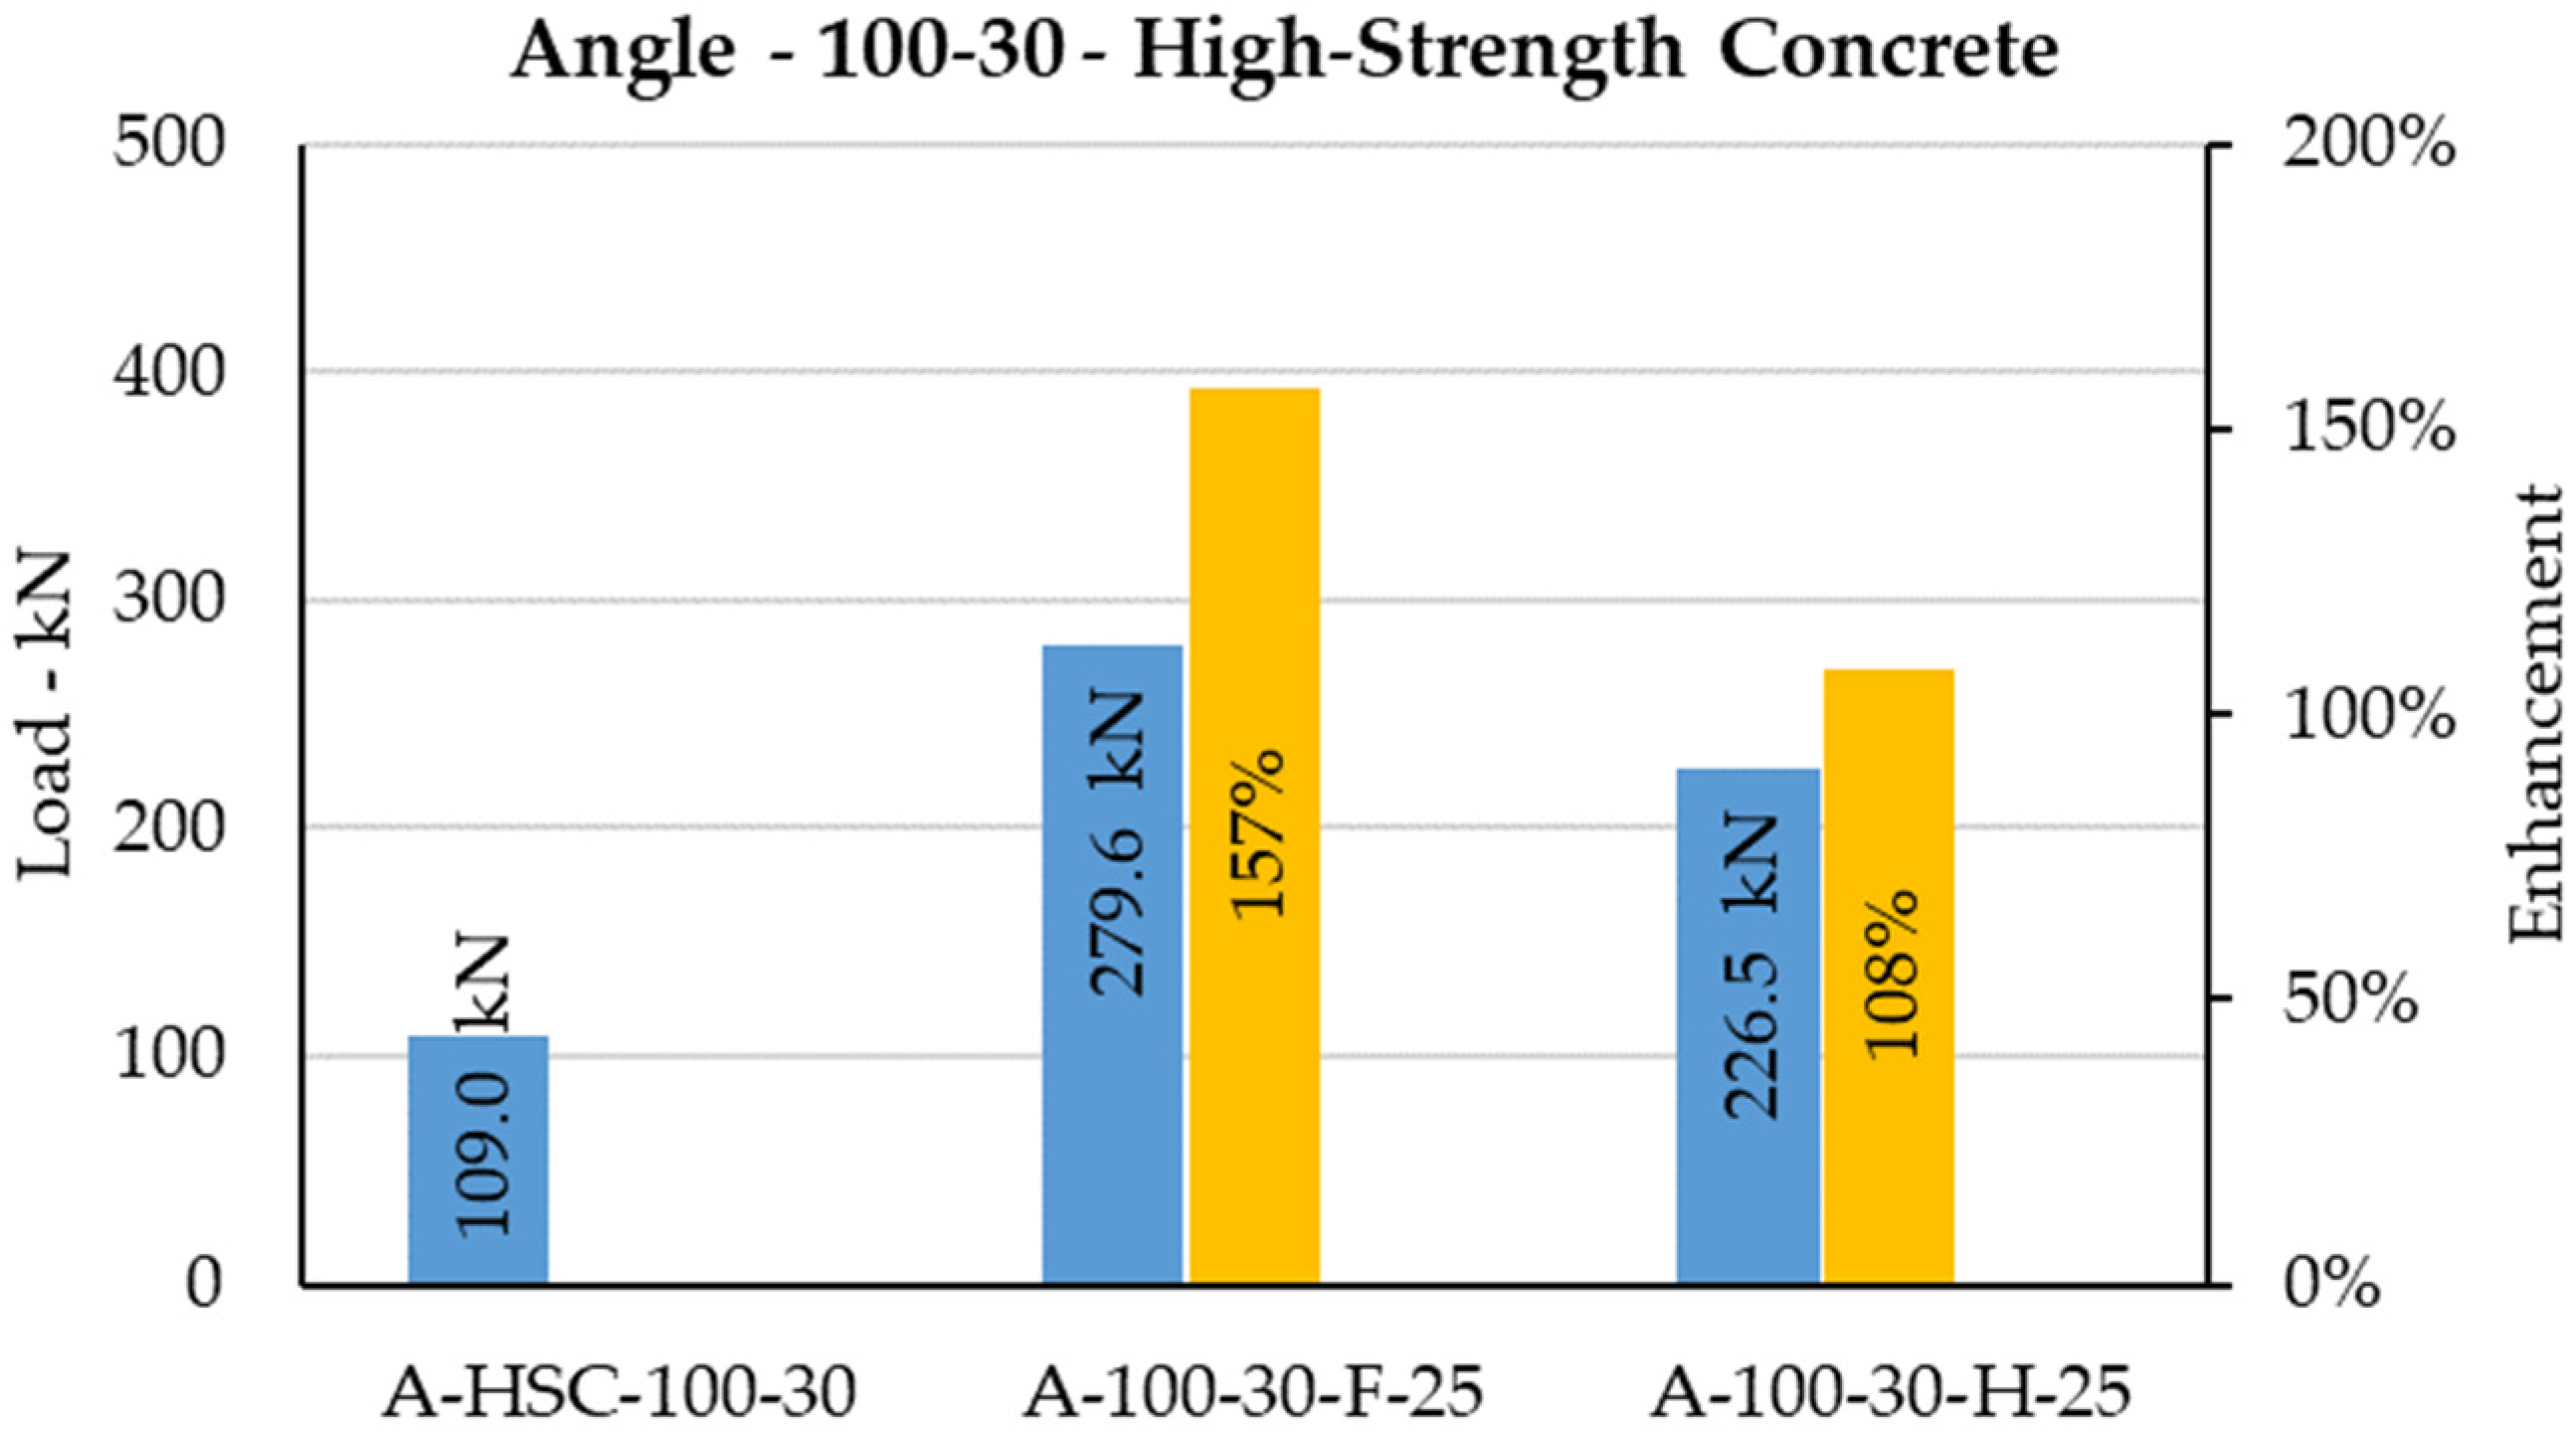
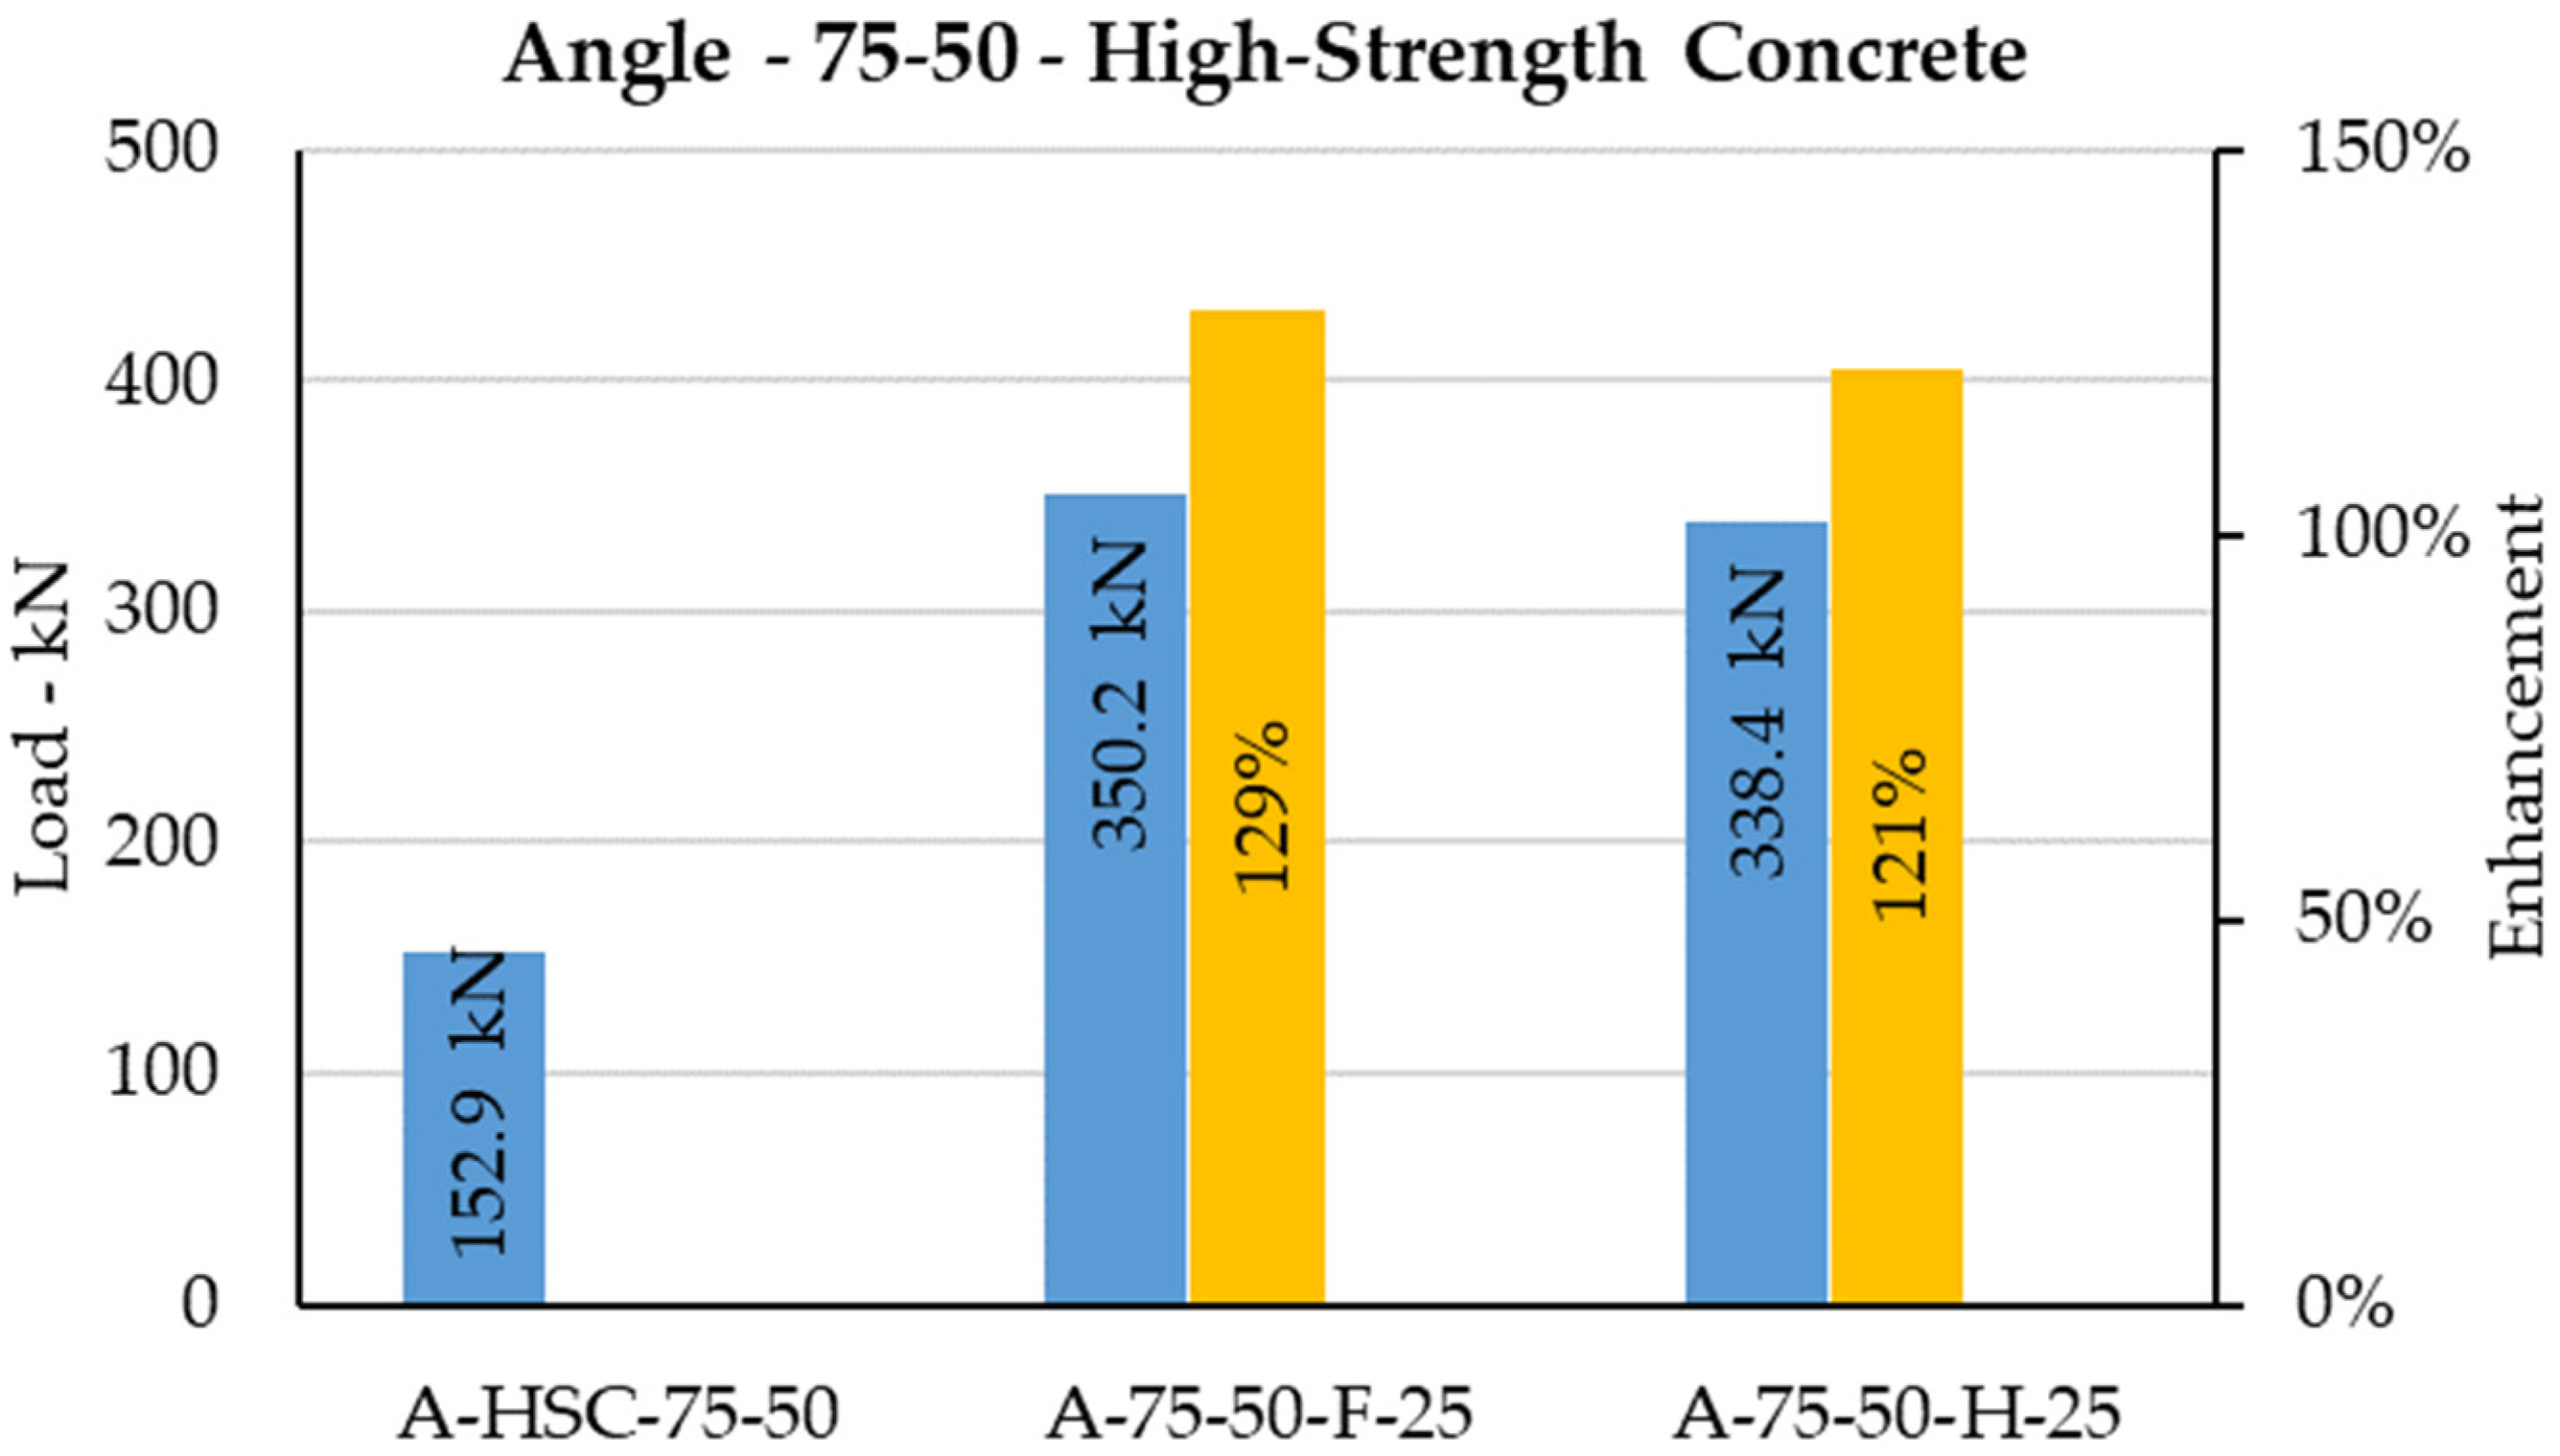
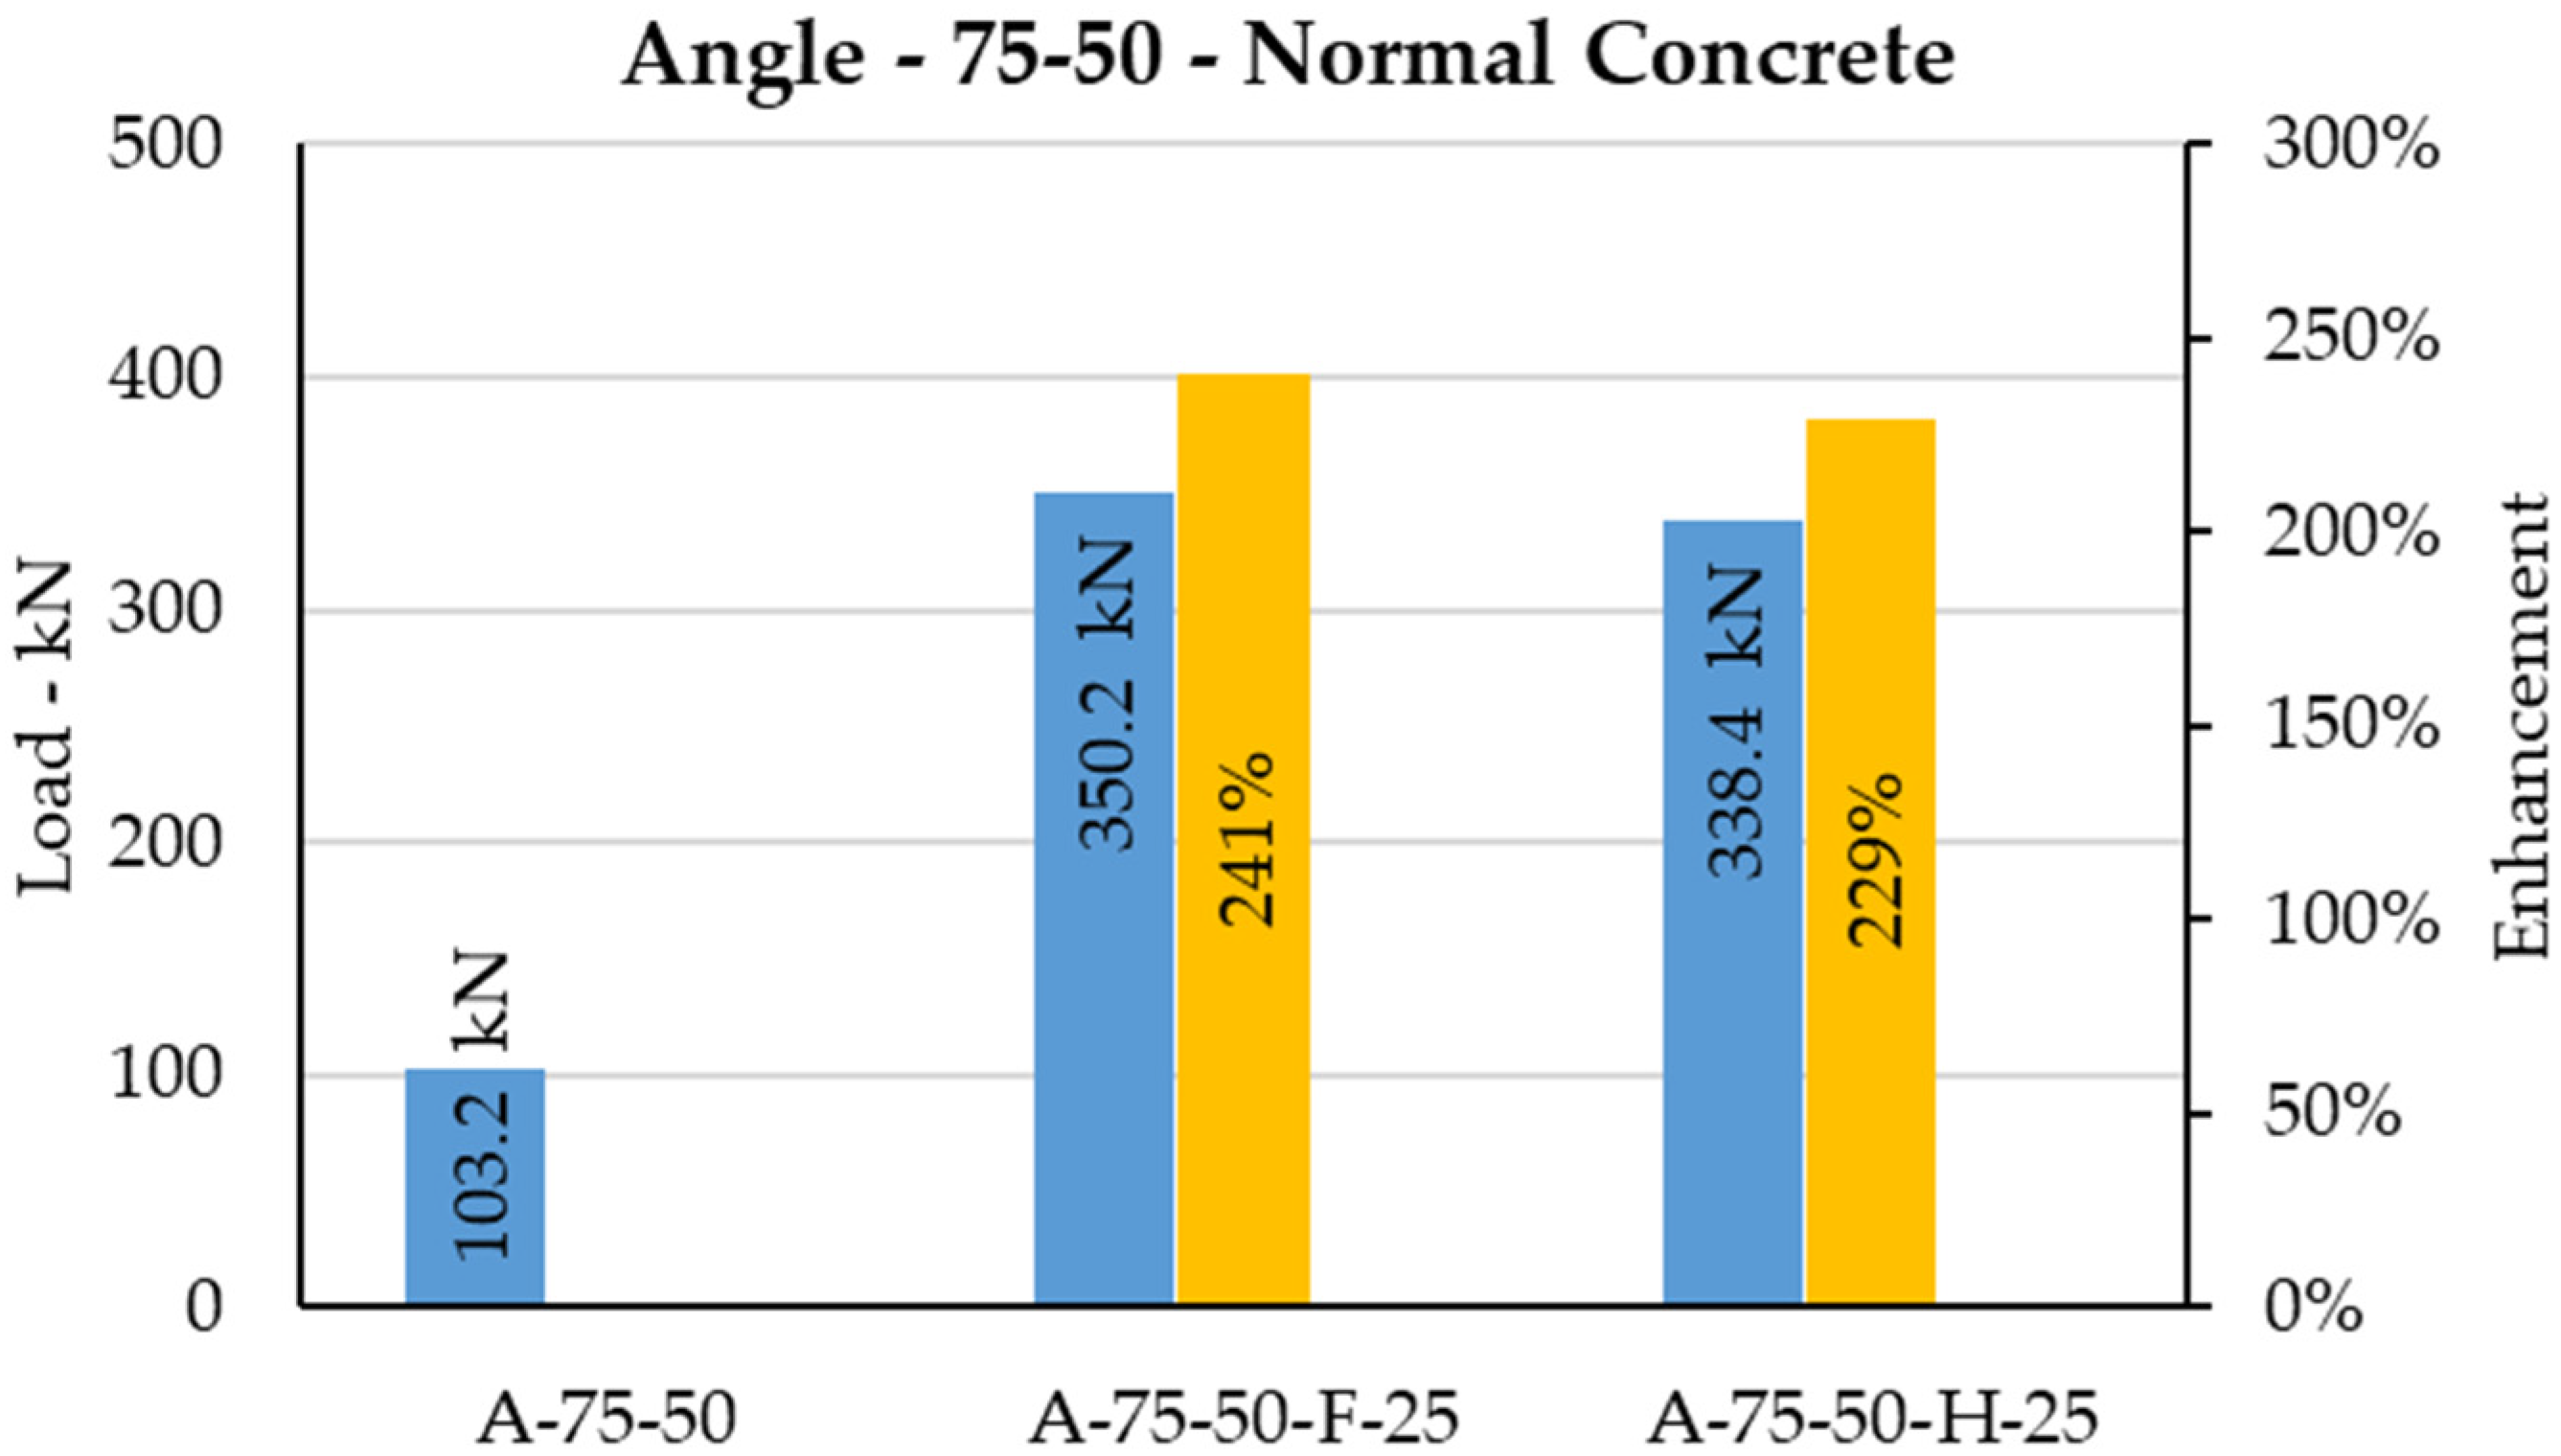
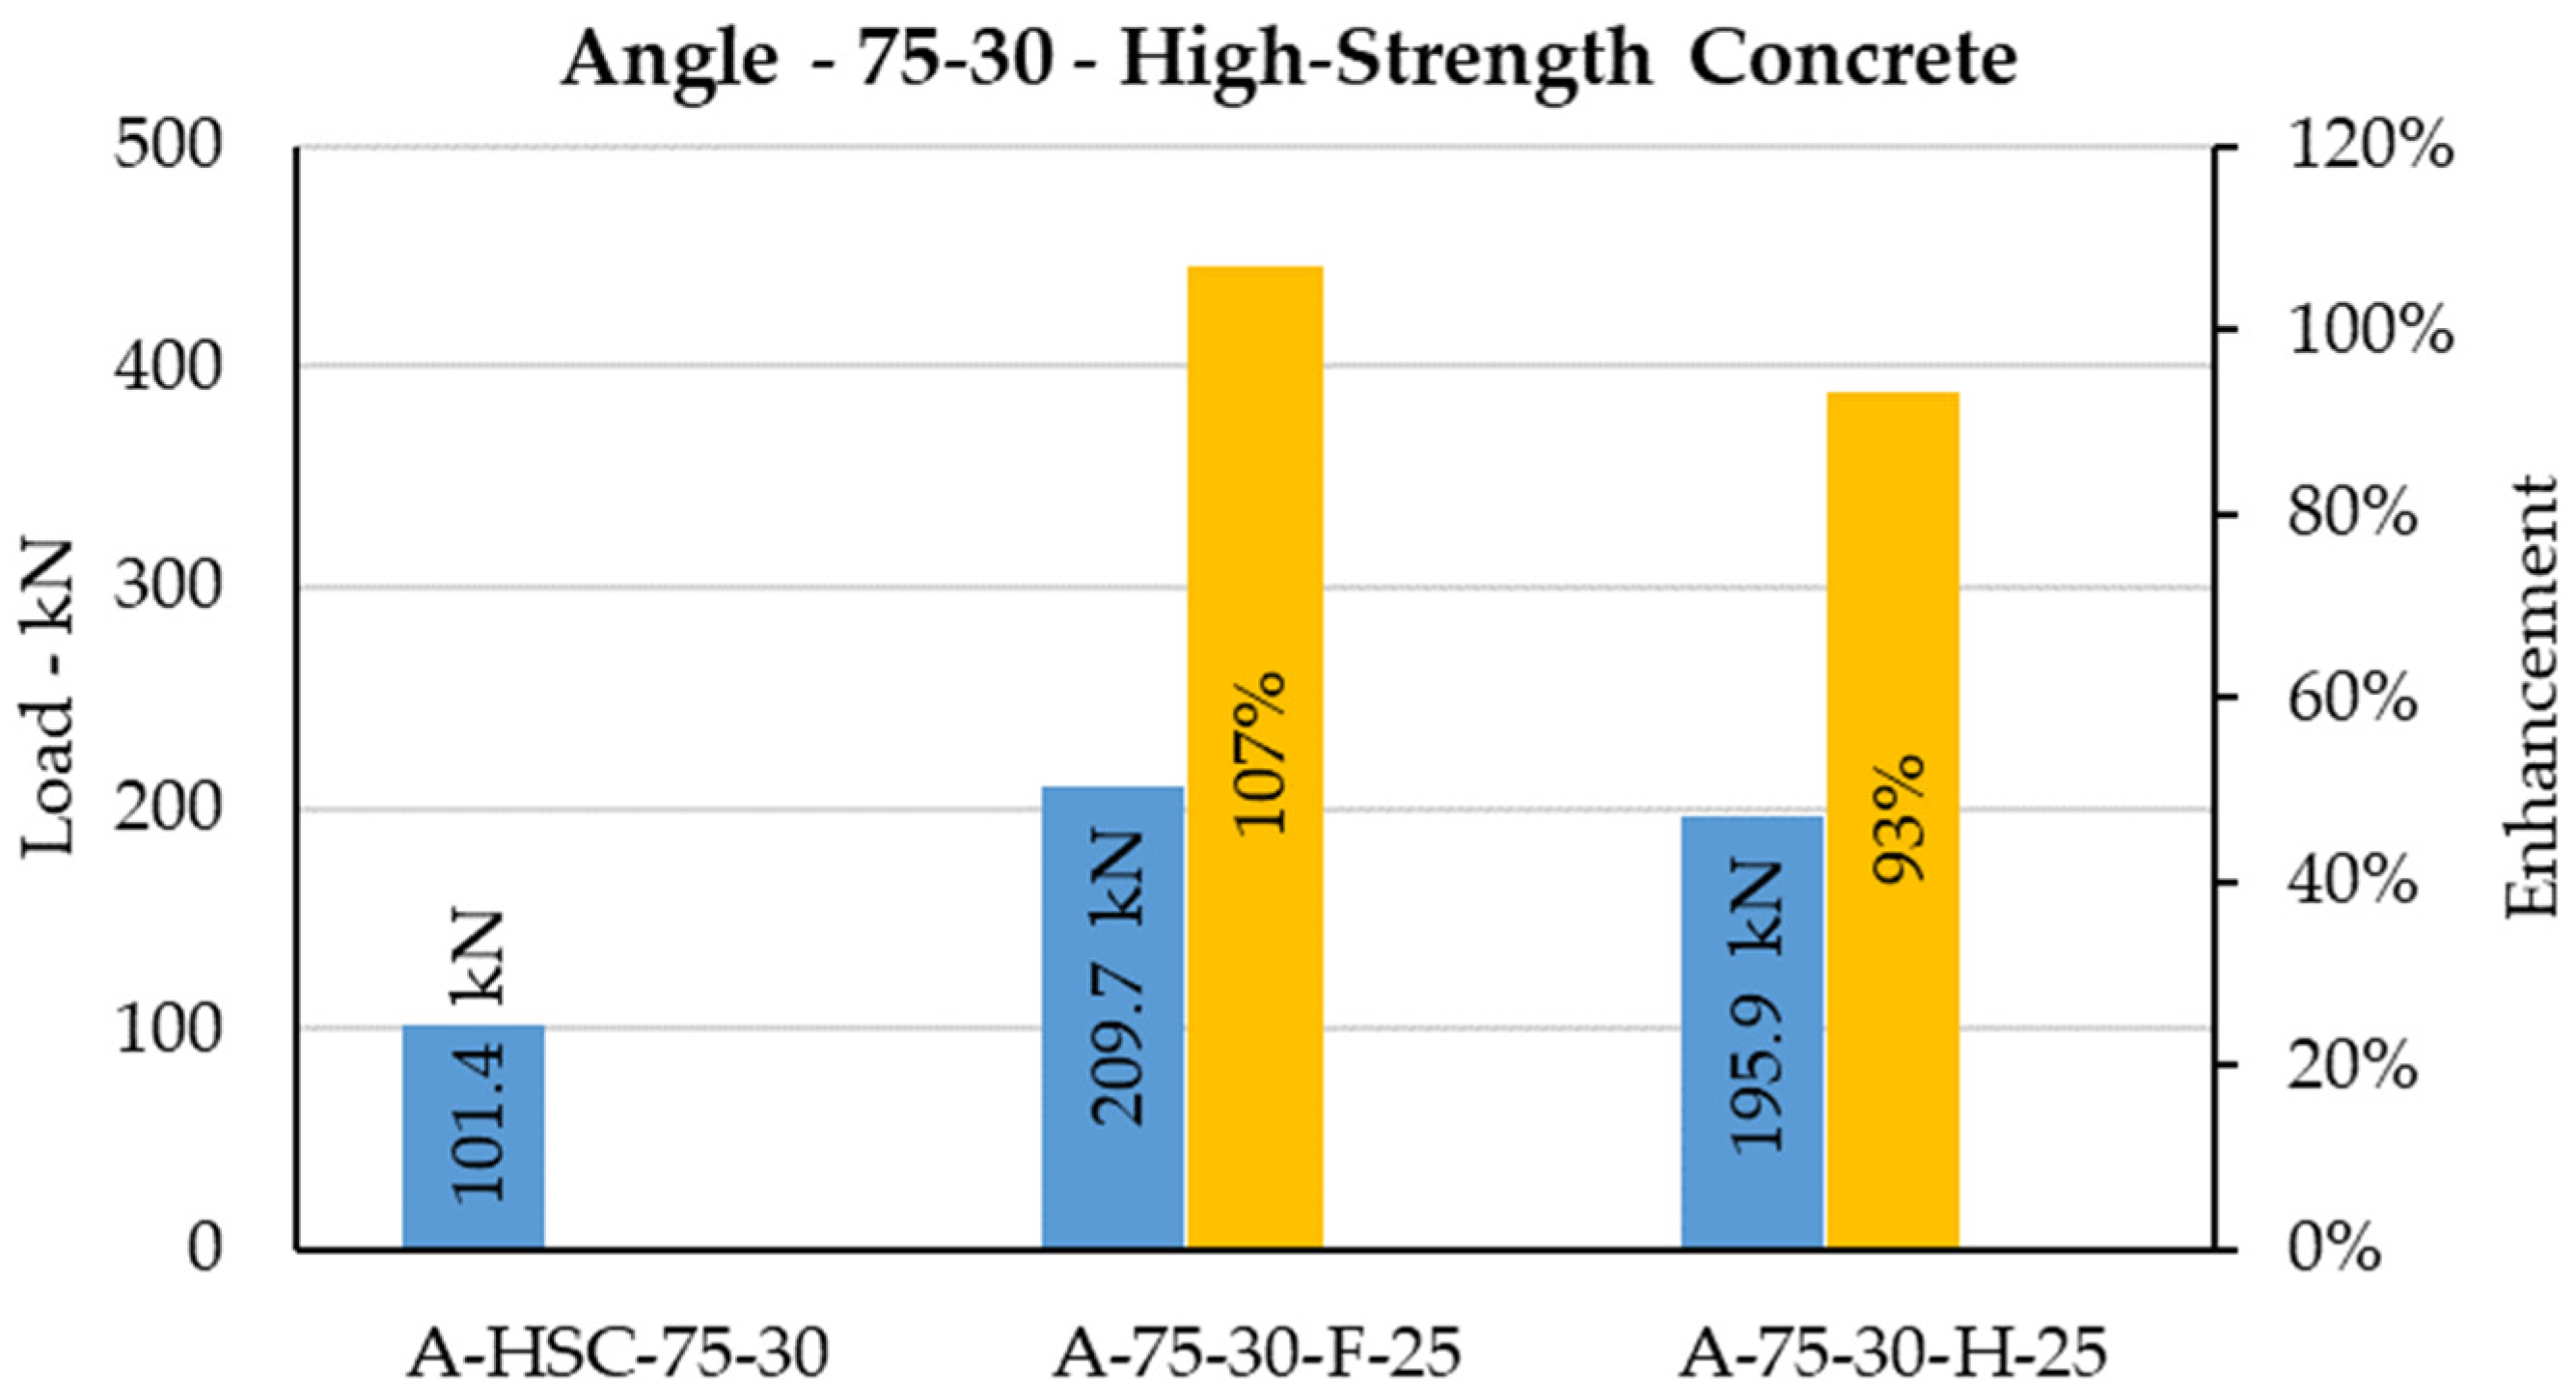
The novel stiffened angle shear connector was compared with the non-stiffened shear connector. Figure 32, Figure 33, Figure 34, Figure 35, Figure 36, Figure 37, Figure 38 and Figure 39 show the comparison of previous studies [33,34,35,39,43,44] of typical shear connectors embedded to normal concrete and high-strength concrete versus the novel stiffened shear connectors embedded to normal concrete. The novel stiffened shear connector embedded in normal concrete enhanced the shear capacity from 93% to 259% compared with the C-shaped angle shear connector in normal concrete and high-strength concrete.
Half-length stiffened shear connectors (different heights and widths) embedded in normal concrete enhanced shear capacity by 166–229% and 93–121% compared with typical shear connector in normal concrete and high-strength concrete, respectively. This shear increment for the same size of stiffened shear connectors with full-length stiffener against typical shear connectors in normal concrete and high-strength concrete increased to 185–259% and 107–157%, respectively. Thus, stiffening concrete only obtained 38% enhancement in average for shear strength, whereas stiffening the shear connector, the shear increment reached 164% on average. Comparing results determined that using stiffener instead of using high-strength concrete is remarkably reliable. This improvement in shear capacity proved that the concept of designing novel stiffened shear connectors responds perfectly. Moreover, strength enhancement of the shear connector contributes in terms of saving steel, cost, and time, and is easy to perform and considerably safer compared with typical shear connectors at ambient temperatures, especially in the event of a fire, which will be discussed in the next sections.

6.4. Comparing Novel Stiffened Shear Connector with Former Studies at Elevated Temperature

The importance and novelty of the stiffened shear connector are shown by comparing the results of the novel stiffened shear connector at elevated temperatures, where the strength of materials drops remarkably with the typical shear connector at ambient temperatures. The shear strength of the typical shear connector at ambient temperatures was equivalent to that of the stiffened shear connector (same height and width) at 700 °C to 850 °C. However, the stiffened shear connector was greatly safer than the typical shear connector. Table 8 summarizes the results of former studies against the current study.

7. Conclusions

The height of the shear connector in the novel shear connector plays a vital role in enhancing shear strength, whereas height has a negligible effect in the ordinary shear connector. The shear strength of the ordinary C-shaped shear connector at ambient temperatures is equivalent to that of the novel stiffened shear connector at 700–850 °C, which proves the absolutely better performance of the novel stiffened shear connector. The half-length stiffened shear connector’s behavior is more ductile than that of the full-length one due to lesser fixity of the stiffener. Shear strength is enhanced by 13–43% by increasing the height by 25 mm. At ambient temperatures, by increasing the height of the stiffened shear connector from 75 mm to 120 mm, shear strength is enhanced by 66% and 62% on average for full and half-length stiffeners due to the presence of the stiffener. In terms of width, by increasing the width from 30 mm to 120 mm, shear strength is enhanced by 129% and 153% for full and half-length stiffened shear connectors, respectively. As temperature increases, the mechanical properties of steel drops, especially its strength, which leads to strength reductions of 6.82–80.02% and 8.01–80.20% for full and half-length stiffeners, respectively. The load capacity of the novel stiffened shear connectors at elevated temperatures is considerably lower than at ambient temperatures. As test temperatures increase, the connectors’ flexibility increases. In general, more flexibility is observed for long connectors compared with short connectors at elevated temperatures. At elevated temperatures, shear strength is reduced by up to 93% for various stiffened shear connectors by reaching a temperature of 1050 °C. Additionally, at a temperature of 850 °C and above, local buckling occurs for specimens with widths of 80 and 100 mm and heights of 100 and 120 mm due to the considerable strength reduction of the steel I-beam before failure in the stiffened shear connector.
Author Contributions

Conceptualization, K.N. and N.H.R.S.; methodology, K.N., N.H.R.S. and Z.I.; software, K.N., M.B. and H.E.A.; validation, K.N., N.H.R.S., Z.I., M.B. and H.E.A.; formal analysis, K.N., N.H.R.S., Z.I., M.B. and H.E.A.; investigation, K.N., N.H.R.S., Z.I., M.B. and H.E.A.; resources, K.N., N.H.R.S. and Z.I.; data curation, K.N., N.H.R.S. and Z.I.; writing—original draft preparation, K.N.; writing—review and editing, K.N., N.H.R.S., Z.I., M.B. and H.E.A.; visualization, K.N., N.H.R.S., Z.I., M.B. and H.E.A.; supervision, K.N., N.H.R.S. and Z.I.; project administration, N.H.R.S. and Z.I.; funding acquisition, N.H.R.S. and Z.I. All authors have read and agreed to the published version of the manuscript.

Funding

The authors would like to thank the financial supports provided by National Natural Science Foundation of China (NSFC) (42102307); Open Research Fund of State Key Laboratory of Geomechanics and Geotechnical Engineering, Institute of Rock and Soil Mechanics, Chinese Academy of Sciences Grant (Z2019023); Natural Science Foundation of Jiangsu Province (BK20209992); Jiangsu Province High-level Innovative and Entrepreneurial Talent Introduction Plan. Besides, the authors are also grateful to the anonymous reviewers for their careful reading of our manuscript and their many helpful comments.

Institutional Review Board Statement

Not applicable.

Informed Consent Statement

Not applicable.

Data Availability Statement

Not applicable.

Acknowledgments

This research was funded by UMRG (University of Malaya Research Grant), Project Number: RP004C13AET and IPPP Grant, Project Number: PG084-2016A and the Research Center for Advanced Materials Science (RCAMS), King Khalid University, Saudi Arabia, Grant number: RCAMS/KKU/014-22.

Conflicts of Interest

The authors declare no conflict of interest. The authors certify that they have NO affiliations with or involvement in any organization or entity with any financial interest (such as honoraria; educational grants; participation in speakers’ bureaus; membership, employment, consultancies, stock ownership, or other equity interest; and expert testimony or patent-licensing arrangements), or non-financial interest (such as personal or professional relationships, affiliations, knowledge or beliefs) in the subject matter or materials discussed in this manuscript.

References

  1. O’Connor, M.; Martin, D. Behaviour of a multi-storey steel framed building subjected to fire attack. J. Constr. Steel Res. 1998, 1, 295. [Google Scholar] [CrossRef]
  2. Mäkeläinen, P.; Ma, Z. Fire resistance of composite slim floor beams. J. Constr. Steel Res. 2000, 54, 345–363. [Google Scholar] [CrossRef]
  3. ISO 834; Fire Resistance Tests-Elements of Building Construction. International Organization for Standardization: Geneva, Switzerland, 1999.
  4. Mirza, O.; Uy, B. Behaviour of headed stud shear connectors for composite steel–concrete beams at elevated temperatures. J. Constr. Steel Res. 2009, 65, 662–674. [Google Scholar] [CrossRef]
  5. Specification, B.S. Fire Tests on Building Materials and Structures. BS 1953, 476, 6. [Google Scholar]
  6. Institution, B.S. Fire Tests on Building Materials and Structures; BSI: London, UK, 1987. [Google Scholar]
  7. Schwartz, K.J.; Lie, T.T. Investigating the unexposed surface temperature criteria of standard ASTM E119. Fire Technol. 1985, 21, 169–180. [Google Scholar] [CrossRef]
  8. Quevedo, R.L.; Silva, V.P. Thermal analysis of push-out tests at elevated temperatures. Fire Saf. J. 2013, 55, 1–14. [Google Scholar] [CrossRef]
  9. Muhammad, I.; Uche, O. Reliability Study of Steel Headed Stud Shear Connector Exposed to Fire. In Proceedings of the Conference Dubai UAE, Dubai, United Arab Emirates, 21–22 September 2016. [Google Scholar]
  10. Mirza, O.; Wilkins, K.; Tao, Z.; Uy, B. The effect of carbon nanotubes on the headed stud shear connectors for composite steel-concrete beams under elevated temperatures. In Composite Construction in Steel and Concrete VII, Proceedings of the 2013 International Conference on Composite Construction in Steel and Concrete, North Queensland, Australia, 28–31 July 2013; ASCE: North Queensland, Australia, 2016; pp. 648–660. [Google Scholar]
  11. Sencu, R.; Wang, Y.; Yang, J.; Lam, D. Performance evaluation of demountable shear connectors with collar step at ambient and elevated temperatures. Eng. Struct. 2019, 194, 94–105. [Google Scholar] [CrossRef]
  12. Chen, L.-Z.; Ranzi, G.; Jiang, S.-C.; Tahmasebinia, F.; Li, G.-Q. Behaviour and design of shear connectors in composite slabs at elevated temperatures. J. Constr. Steel Res. 2015, 115, 387–397. [Google Scholar] [CrossRef]
  13. Lim, O.K.; Choi, S.; Kang, S.; Kwon, M.; Choi, J.Y. Fire performance of headed shear studs in profiled steel sheeting. J. Constr. Steel Res. 2020, 164, 105791. [Google Scholar] [CrossRef]
  14. Shahabi, S.; Sulong, N.; Shariati, M.; Mohammadhassani, M.; Shah, S. Numerical analysis of channel connectors under fire and a comparison of performance with different types of shear connectors subjected to fire. Steel Compos. Struct. 2016, 20, 651–669. [Google Scholar] [CrossRef]
  15. Davoodnabi, S.M.; Mirhosseini, S.M.; Shariati, M. Behavior of steel-concrete composite beam using angle shear connectors at fire condition. Steel Compos. Struct. 2019, 30, 141–147. [Google Scholar]
  16. BS5950; Structural use of steelwork in building—Part 4: Code of Practice for Design of Composite Slabs with Profiled Steel Sheeting. BSI: London, UK, 1994.
  17. Nouri, K.; Sulong, N.; Ibrahim, Z.; Shariati, M. Behaviour of novel stiffened angle shear connectors at ambient and elevated temperatures. Adv. Steel Constr. 2021, 17, 28–38. [Google Scholar]
  18. Brunkhorst, S.; Pfenning, S.; Zehfuß, J.; Mensinger, M. Influence of elevated temperatures on the composite joint of a composite beam in fire. Fire Technol. 2019, 55, 1553–1570. [Google Scholar] [CrossRef]
  19. Chahnasir, E.S.; Zandi, Y.; Shariati, M.; Dehghani, E.; Toghroli, A.; Mohamad, E.T.; Shariati, A.; Safa, M.; Wakil, K.; Khorami, M. Application of support vector machine with firefly algorithm for investigation of the factors affecting the shear strength of angle shear connectors. Smart Struct. Syst. 2018, 22, 413–424. [Google Scholar]
  20. Khorramian, K.; Maleki, S.; Shariati, M.; Ramli Sulong, N. Behavior of tilted angle shear connectors. PLoS ONE 2015, 10, e0144288. [Google Scholar] [CrossRef] [PubMed]
  21. CEN. Design of Steel Structures. Part 1.2: Structural Fire Design. 2005. Available online: https://library.um.edu.mo/dissertation/b21618677.pdf (accessed on 6 December 2022).
  22. Manual, A.U. Abaqus theory guide. Version 2014, 6, 281. [Google Scholar]
  23. Shamass, R.; Cashell, K. Behaviour of composite beams made using high strength steel. Structures 2017, 12, 88–101. [Google Scholar] [CrossRef]
  24. Ban, H.; Bradford, M.A. Flexural behaviour of composite beams with high strength steel. Eng. Struct. 2013, 56, 1130–1141. [Google Scholar] [CrossRef]
  25. Baltay, P.; Gjelsvik, A. Coefficient of friction for steel on concrete at high normal stress. J. Mater. Civ. Eng. 1990, 2, 46–49. [Google Scholar] [CrossRef]
  26. Qi, J.; Hu, Y.; Wang, J.; Li, W. Behavior and strength of headed stud shear connectors in ultra-high performance concrete of composite bridges. Front. Struct. Civ. Eng. 2019, 13, 1138–1149. [Google Scholar] [CrossRef]
  27. Qi, J.; Wang, J.; Li, M.; Chen, L. Shear capacity of stud shear connectors with initial damage: Experiment, FEM model and theoretical formulation. Steel Compos. Struct. 2017, 25, 79–92. [Google Scholar]
  28. Xu, C.; Sugiura, K.; Wu, C.; Su, Q. Parametrical static analysis on group studs with typical push-out tests. J. Constr. Steel Res. 2012, 72, 84–96. [Google Scholar] [CrossRef]
  29. Qureshi, J.; Lam, D.; Ye, J. The influence of profiled sheeting thickness and shear connector’s position on strength and ductility of headed shear connector. Eng. Struct. 2011, 33, 1643–1656. [Google Scholar] [CrossRef]
  30. Arévalo, D.; Hernández, L.; Gómez, C.; Velasteguí, G.; Guaminga, E.; Baquero, R.; Dibujés, R. Structural performance of steel angle shear connectors with different orientation. Case Stud. Constr. Mater. 2021, 14, e00523. [Google Scholar] [CrossRef]
  31. Nouri, K. Behaviour of Stiffened Angle Shear Connectors in Steel Concrete Composite Beams at Ambient and Elevated Temperature; Universiti Malaya: Kuala Lumpur, Malaysia, 2022. [Google Scholar]
  32. Wang, A.J. Numerical investigation into headed shear connectors under fire. J. Struct. Eng. 2012, 138, 118–122. [Google Scholar] [CrossRef]
  33. Wang, M.; Hu, Y.; Wang, Q.; Tian, H.; Liu, D. A study on strength characteristics of concrete under variable temperature curing conditions in ultra-high geothermal tunnels. Constr. Build. Mater. 2019, 229, 116989. [Google Scholar] [CrossRef]
  34. Harmathy, T. Thermal properties of concrete at elevated temperatures. J. Mater. 1970, 5, 47–74. [Google Scholar]
  35. Bazant, Z.P.; Kaplan, M.F. Concrete at High Temperature; Material Properties and Mathematical Models; Longman Group Limited: Essex, UK, 1996. [Google Scholar]
  36. Shariati, M.; Ramli Sulong, N.H.; Suhatril, M.; Shariati, A.; Arabnejad Khanouki, M.M.; Sinaei, H. Comparison of behaviour between channel and angle shear connectors under monotonic and fully reversed cyclic loading. Constr. Build. Mater. 2013, 38, 582–593. [Google Scholar] [CrossRef]
  37. Shariati, M.; Ramli Sulong, N.H.; Arabnejad Khanouki, M.M. Experimental assessment of channel shear connectors under monotonic and fully reversed cyclic loading in high strength concrete. Mater. Des. 2012, 34, 325–331. [Google Scholar] [CrossRef]
  38. Shariati, M.; Ramli Sulong, N.H.; Suhatril, M.; Shariati, A.; Arabnejad, K.M.M.; Sinaei, H. Behaviour of C-shaped angle shear connectors under monotonic and fully reversed cyclic loading: An experimental study. Mater. Des. 2012, 41, 67–73. [Google Scholar] [CrossRef]
  39. Shariati, A.; Shariati, M.; Ramli Sulong, N.H.; Suhatril, M.; Arabnejad Khanouki, M.M.; Mahoutian, M. Experimental assessment of angle shear connectors under monotonic and fully reversed cyclic loading in high strength concrete. Constr. Build. Mater. 2014, 52, 276–283. [Google Scholar] [CrossRef]
  40. Shariati, M.; Shariati, A.; Sulong, N.R.; Suhatril, M.; Khanouki, M.A. Fatigue energy dissipation and failure analysis of angle shear connectors embedded in high strength concrete. Eng. Fail. Anal. 2014, 41, 124–134. [Google Scholar] [CrossRef]
  41. Shariati, M.; Sulong, N.R.; Shariati, A.; Khanouki, M.A. Behavior of V-shaped angle shear connectors: Experimental and parametric study. Mater. Struct. 2016, 49, 3909–3926. [Google Scholar] [CrossRef]
  42. Shariati, M.; Tahmasbi, F.; Mehrabi, P.; Bahadori, A.; Toghroli, A. Monotonic behavior of C and L shaped angle shear connectors within steel-concrete composite beams: An experimental investigation. Steel Compos Struct 2020, 35, 237–247. [Google Scholar]
  43. Tahmasbi, F.; Maleki, S.; Shariati, M.; Ramli Sulong, N.; Tahir, M. Shear capacity of C-shaped and L-shaped angle shear connectors. PLoS ONE 2016, 11, e0156989. [Google Scholar] [CrossRef] [Green Version]
  44. Mohammadhassani, M.; Nezamabadi-Pour, H.; Suhatril, M.; Shariati, M. Identification of a suitable ANN architecture in predicting strain in tie section of concrete deep beams. Struct. Eng. Mech. 2013, 46, 853–868. [Google Scholar] [CrossRef]
Figure 1. Stress–strain relationship for steel materials [21].
Sustainability 15 00184 g001
Figure 5. Typical view of the specimens in the experimental test.
Sustainability 15 00184 g005
Figure 6. Geometry of the specimens in the experimental test.
Sustainability 15 00184 g006
Figure 7. Typical meshing of steel part in specimen with stiffened shear connector.
Sustainability 15 00184 g007
Figure 8. Boundary condition and loading in the specimen.
Sustainability 15 00184 g008
Figure 9. Area of applying heat.
Sustainability 15 00184 g009
Figure 10. Von Mises stress (N/m2).
Sustainability 15 00184 g010
Figure 11. Concrete compression damage—FEA.
Sustainability 15 00184 g011
Figure 12. Concrete compression damage—Exp [31].
Sustainability 15 00184 g012
Figure 13. Comparison deformation of steel I-beam at elevated temperature-Exp [31].
Sustainability 15 00184 g013
Figure 14. Comparison deformation of steel I-beam at elevated temperature-FE.
Sustainability 15 00184 g014
Figure 15. Heat distribution at 550 °C.
Sustainability 15 00184 g015
Figure 16. Heat distribution at 700 °C.
Sustainability 15 00184 g016
Figure 17. Heat distribution at 850 °C.
Sustainability 15 00184 g017
Figure 18. Heat distribution at 1050 °C.
Sustainability 15 00184 g018
Figure 19. Von Mises stress (N/m2) of shear connector at 550 °C.
Sustainability 15 00184 g019
Figure 20. Stresses (N/m2) in loading direction at 550 °C.
Sustainability 15 00184 g020
Figure 21. Von Mises stress (N/m2) of shear connector at 550 °C with distortion scale: 8.
Sustainability 15 00184 g021
Figure 22. Relative values of ultimate load-carrying capacity of 75 mm specimens.
Sustainability 15 00184 g022
Figure 23. Relative values of ultimate load-carrying capacity of 100 mm specimens.
Sustainability 15 00184 g023
Figure 24. Relative values of ultimate load-carrying capacity of 120 mm specimens.
Sustainability 15 00184 g024
Figure 25. Average of shear enhancement by increasing the height of stiffened shear connector.
Sustainability 15 00184 g025
Figure 26. Average of shear enhancement by increasing the width of stiffened shear connector.
Sustainability 15 00184 g026
Figure 27. Average of shear reduction in different level of elevated temperature.
Sustainability 15 00184 g027
Figure 28. Strength increment of angle 100–50 shear connector in normal vs. high-strength concrete.
Sustainability 15 00184 g028
Figure 29. Strength increment of angle 100–30 shear connector in normal vs. high-strength concrete.
Sustainability 15 00184 g029
Figure 30. Strength increment of angle 75–50 shear connector in normal vs. high-strength concrete.
Sustainability 15 00184 g030
Figure 31. Strength increment of angle 75–30 shear connector in normal vs. high-strength concrete.
Sustainability 15 00184 g031
Figure 32. Stiffened angle shear connector vs. non-stiffened shear connector in high strength concrete (angle 100–50).
Sustainability 15 00184 g032
Figure 33. Stiffened angle shear connector vs. non-stiffened shear connector in normal concrete (angle 100–50).
Sustainability 15 00184 g033
Figure 34. Stiffened angle shear connector vs. non-stiffened shear connector in high strength concrete (angle 100–30).
Sustainability 15 00184 g034
Figure 35. Stiffened angle shear connector vs. non-stiffened shear connector in normal concrete (angle 100–30).
Sustainability 15 00184 g035
Figure 36. Stiffened angle shear connector vs. non-stiffened shear connector in high strength concrete (angle 75–50).
Sustainability 15 00184 g036
Figure 37. Stiffened angle shear connector vs. non-stiffened shear connector in normal concrete (angle 75–50).
Sustainability 15 00184 g037
Figure 38. Stiffened angle shear connector vs. non-stiffened shear connector in high strength concrete (angle 75–30).
Sustainability 15 00184 g038
Figure 39. Stiffened angle shear connector vs. non-stiffened shear connector in normal concrete (angle 75–30).
Sustainability 15 00184 g039
Table 1. Reduction factors of stress–strain relationship of steel at elevated temperature [21].
Reduction   Factors   at   Temperature   θ a   Relative   to   the   Value   of   f y   or   E a at   20   ° C
Steel
Temperature   θ a
Reduction   Factor   ( Relative   to   f y )   for   Effective   Yield   Strength
k y θ = f y θ / f y
Reduction   Factor   ( Relative   to   f y )   for   Proportional   Limit
k p θ = f p θ / f y
Reduction   Factor   ( Relative   to   E a )   for   the   Slope   of   the   Linear   Elastic   Range
k E θ = E a θ / E a
20 °C1.0001.0001.000
100 °C1.0001.0001.000
200 °C1.0000.8070.900
300 °C1.0000.6130.800
400 °C1.0000.4200.700
500 °C0.7800.3600.600
600 °C0.4700.1800.310
700 °C0.2300.0750.130
800 °C0.1100.0500.090
900 °C0.0600.0380.068
1000 °C0.0400.0250.045
1100 °C0.0200.0130.023
1200 °C0.0000.0000.000
Table 2. Main parameter values of normal weight concrete at elevated temperature, Eurocode 2 [21].
Steel   Temperature   θ a f c θ / f c k ε c 1 , θ ε c u 1 , θ
20 °C1.000.00250.0200
100 °C1.000.00400.0225
200 °C0.950.00550.0250
300 °C0.850.00700.0275
400 °C0.750.01000.0300
500 °C0.600.01500.0325
600 °C0.450.02500.0350
700 °C0.300.02500.0375
800 °C0.150.02500.0400
900 °C0.080.02500.0425
1000 °C0.040.02500.0450
1100 °C0.010.02500.0475
1200 °C0.00--
Table 3. Results of FE modeling at ambient temperature.
IDMax Load–FE (kN)Max Load–Exp (kN)FE/EXP
1A-100-30-F-25293.07279.581.048
2A-100-30-H-25228.30226.541.008
3A-100-50-F-25438.50439.480.998
4A-100-50-H-25378.30380.760.994
5A-100-80-F-25601.40596.391.008
6A-100-80-H-25610.80587.251.040
7A-75-30-F-25215.20209.751.026
8A-75-30-H-25196.10195.901.001
9A-75-50-F-25341.30350.220.975
10A-75-50-H-25349.60338.371.033
11A-75-80-F-25467.10465.131.004
12A-75-80-H-25435.30410.381.061
13A-100-100-F-25752.30
14A-100-100-H-25686.60
15A-75-100-F-25524.30
16A-75-100-H-25480.98
17A-120-30-F-25395.93
18A-120-30-H-25349.59
19A-120-50-F-25501.2.
20A-120-50-H-25494.99
21A-120-80-F-25764.01
22A-120-80-H-25689.20
23A-120-100-F-25889.20
24A-120-100-H-25815.20
Table 4. Shear strength increment in terms of width.
Type of StiffenerWidth Increment75 mm Height100 mm Height120 mm HeightAverage
Full-length stiffenerFrom 30 to 50 mm58.6%49.6%26.6%44.9%
From 50 to 80 mm36.9%37.1%52.4%42.1%
From 80 to 100 mm12.2%25.1%16.4%17.9%
From 30 to 80 mm117.1%105.2%93.0%105.1%
From 30 to 100 mm105.5%156.7%124.6%128.9%
Half-length stiffenerFrom 30 to 50 mm78.3%65.7%41.6%61.9%
From 50 to 80 mm24.5%61.5%39.2%41.7%
From 80 to 100 mm10.5%12.4%18.3%13.7%
From 30 to 80 mm122.0%167.5%97.1%128.9%
From 30 to 100 mm124.8%200.7%133.2%152.9%
Table 5. Summary of FE ultimate load for stiffened angle shear connector at elevated temperature–75 mm height.
Specimen IDMax Load–Exp (kN)Max Load–FE (kN)FE/EXP
1A-75-30-F-550195.44198.31.015
2A-75-30-F-700129.55135.51.046
3A-75-30-F-85070.771.691.014
4A-75-30-F-1050 20.3
5A-75-30-H-550170.93176.51.033
6A-75-30-H-700116.22125.91.083
7A-75-30-H-85065.6364.80.987
8A-75-30-H-1050 18.26
9A-75-50-F-550275.54273.0050.991
10A-75-50-F-700176.62174.980.991
11A-75-50-F-85095.4290.30.946
12A-75-50-F-1050 38.18
13A-75-50-H-550263.67256.70.974
14A-75-50-H-700166.45175.71.056
15A-75-50-H-85081.8187.51.070
16A-75-50-H-1050 29.87
17A-75-80-F-550431.48415.010.962
18A-75-80-F-700255.8251.10.982
19A-75-80-F-850187.41178.110.950
20A-75-80-F-1050 43.61
21A-75-80-H-550375.36363.70.969
22A-75-80-H-700213.29203.10.952
23A-75-80-H-850158.55156.860.989
24A-75-80-H-1050 35.5
25A-75-100-F-550 467.98
26A-75-100-F-700 284.5
27A-75-100-F-850 167.2
28A-75-100-F-1050 51.22
29A-75-100-H-550 440.94
30A-75-100-H-700 267.7
31A-75-100-H-850 141.56
32A-75-100-H-1050 53.1
Table 6. Summary of FE ultimate load for stiffened angle shear connector at elevated temperature–100 mm height.
Specimen IDMax Load–Exp (kN)Max Load–FE (kN)FE/EXP
1A-100-30-F-550258.89264.11.020
2A-100-30-F-700163.21156.10.956
3A-100-30-F-85087.6387.40.997
4A-100-30-F-1050 30.25
5A-100-30-H-550208.38220.61.059
6A-100-30-H-700141.51145.51.028
7A-100-30-H-85079.7786.51.084
8A-100-30-H-1050 26.35
9A-100-50-F-550328.24322.40.982
10A-100-50-F-700270.84266.030.982
11A-100-50-F-850101.59108.41.067
12A-100-50-F-1050 40.22
13A-100-50-H-550310.87328.991.058
14A-100-50-H-700226.28220.20.973
15A-100-50-H-85095.36102.91.079
16A-100-50-H-1050 36.46
17A-100-80-F-550521.35524.71.006
18A-100-80-F-700277.1255.30.921
19A-100-80-F-850119.16117.70.988
20A-100-80-F-1050 50.75
21A-100-80-H-550490.19466.50.952
22A-100-80-H-700332.77334.61.005
23A-100-80-H-850115.75120.151.038
24A-100-80-H-1050 57.39
25A-100-100-F-550 590.95
26A-100-100-F-700 394.5
27A-100-100-F-850 172.3
28A-100-100-F-1050 59.1
29A-100-100-H-550 551.7
30A-100-100-H-700 372.6
31A-100-100-H-850 167.4
32A-100-10-H-1050 60.22
Table 7. Summary of FE ultimate load for stiffened angle shear connector at elevated temperature–120 mm height.
Specimen IDMax Load–FE (kN)
1A-120-30-F-550361.9
2A-120-30-F-700215.8
3A-120-30-F-850117.76
4A-120-30-F-105042.11
5A-120-30-H-550323.1
6A-120-30-H-700200.9
7A-120-30-H-850111.98
8A-120-30-H-105034.25
9A-120-50-F-550404.97
10A-120-50-F-700264.28
11A-120-50-F-850120.6
12A-120-50-F-105047.07
13A-120-50-H-550373.75
14A-120-50-H-700243.53
15A-120-50-H-850120.48
16A-120-50-H-105044.02
17A-120-80-F-550625.9
18A-120-80-F-700373.17
19A-120-80-F-850151.02
20A-120-80-F-105070.25
21A-120-80-H-550585.06
22A-120-80-H-700355.89
23A-120-80-H-850141.08
24A-120-80-H-105057.63
25A-120-100-F-550727.74
26A-120-100-F-700411.43
27A-120-100-F-850163.7
28A-120-100-F-105059.3
29A-120-100-H-550658.5
30A-120-100-H-700421.83
31A-120-100-H-850150.1
32A-120-100-H-105057.57
Table 8. Comparing recent studies with current study.
Previous StudiesCurrent Study
ReferencesShear ConnectorFailure Load-kNShear ConnectorFailure Load-kN
Angle shear connector with 100 mm height and 50 mm length
Paper 1 [33]A-100-50141A-100-50-H-700226.28
Paper 2 [34]A-100-50141A-100-50-H-700226.28
Paper 3 [15]A-100-50126.78A-100-50-H-700226.28
Paper 4 [37]AH-100-50178.3A-100-50-H-700226.28
Paper 5 [39]H1A-100-50178.3A-100-50-H-700226.28
Paper 6 [40]A80-50-C-sahped138.84A-100-50-H-700226.28
A-100-50-C-shaped150.57A-100-50-H-700226.28
A-80-100-C-shaped163.65A-100-50-H-700226.28
A-80-50-L-shaped136.9A-100-50-H-700226.28
A-100-50-L-shaped132.28A-100-50-H-700226.28
A-80-100-Lshaped205.15A-100-50-H-700226.28
Connector with 100 mm height and 30 mm length
Paper 1 [33]A-100-3077.9A-100-30-H-85079.77
Paper 2 [34]A-100-3077.9A-100-30-H-85079.77
Paper 3 [15]A-100-3086.79A-100-30-F-85087.63
Paper 4 [37]AH-100-30112.7A-100-30-H-700141.51
Paper 5 [39]AH-100-30105.2A-100-30-H-700141.51
Connector with 75 mm height and 50 mm length
Paper 1 [33]A-75-5096.8A-75-50-F-85095.42
Paper 2 [34]A-75-50109.6A-75-50-H-700166.45
Paper 3 [15]A-75-50103.36A-75-50-H-700166.45
Paper 4 [37]AH-75-50152.9A-75-50-H-700166.45
Paper 5 [39]AH-75-50152.9A-75-50-H-700166.45
Paper 6 [40]A-60-50-C-shaped153.35A-75-50-H-700166.45
A-60-50-L-shaped119.44A-75-50-H-700166.45
Connector with 75 mm height and 30 mm length
Paper 1 [33]A-75-3069.6A-75-30-F-85070.12
Paper 2 [34]A-75-3077.9A-75-30-H-700116.22
Paper 3 [15]A-75-3095.22A-75-30-H-700116.22
Paper 4 [37]AH-75-30103.7A-75-30-H-700116.22
Paper 5 [39]AH-75-3099A-75-30-H-700116.22
Disclaimer/Publisher’s Note: The statements, opinions and data contained in all publications are solely those of the individual author(s) and contributor(s) and not of MDPI and/or the editor(s). MDPI and/or the editor(s) disclaim responsibility for any injury to people or property resulting from any ideas, methods, instructions or products referred to in the content.