Article

Spatiotemporal Dynamics of the Human Critical Area (HCA) in the “Three Water Lines” Region of Northwest China and the Impact of Socioeconomic Factors between 2000 and 2020

1
Northwest Land and Resource Research Center, Shaanxi Normal University, Xi’an 710119, China
2
Global Regional and Urban Research Institute Natural Resources and National Land Use Research Institute, Shaanxi Normal University, Xi’an 710119, China
3
Institute of Transportation Geography and Spatial Planning, Shaanxi Normal University, Xi’an 710119, China
4
Northwest Key Laboratory of Urbanization and Land Environment Spatial Simulation, Shaanxi Normal University, Xi’an 710119, China
5
State Key Laboratory of Eco-Hydraulics in Northwest Arid Region of China, Xi’an University of Technology, Xi’an 710048, China
6
College of Geology and Environment, Xi’an University of Science and Technology, Xi’an 710054, China
7
Cold and Arid Regions Water Resources and Ecological Water Engineering Research Center, Urumqi 830000, China
*
Author to whom correspondence should be addressed.
Sustainability 2022, 14(9), 5728; https://doi.org/10.3390/su14095728
Submission received: 19 March 2022 / Revised: 5 May 2022 / Accepted: 6 May 2022 / Published: 9 May 2022

Abstract

:
The Human Critical Area (HCA) is an area that characterizes the surface landscape created by human beings in the Anthropocene. Based on the signatures left by major human activities over the Earth′s surface, this research demarcates an arid inland region of Northwest China, the “Three Water Lines”, into four HCA types: Agricultural Area, Built-up Area, Ecological Area, and Bare Area. This paper explores the HCA′s distribution and changes in the “Three Water Lines” region between 2000 and 2020 with land use/cover data, as well as the impact of socioeconomic factors on the HCA dynamics with statistics sourcing from authoritative yearbooks. To achieve this, the Land Use Transition Matrix is used to investigate the changes in area and distribution, while binary linear regression and stepwise multiple linear regression are applied to examine the single and joint effects of the socioeconomic factors. The main findings are as follows: (i) The four HCA types are distinguished quantitatively and by their distribution patterns. Ecological Area and Bare Area cover most (more than 90% in total) of the territory with extensive and continuous distribution. Agricultural Area is mainly found on the eastern and western parts of the region, with flat terrain, abundant water resources, and moderate temperatures. Built-up Area is the most concentrated but has an unbalanced distribution and the lowest quantity. (ii) Despite some discernible spatial and quantity changes at regional and county levels between 2000 and 2020, the general characteristics in HCA’s structure and distribution pattern have mainly remained consistent. (iii) Transitions between HCA types occur constantly, and the primary source type of the transitions differs from one another. Ecological Area and Bare Area form the sources of the most evident transitions. (iv) Agricultural Area and Built-up Area are more prone influence from some socioeconomic dynamics. By contrast, there is no evidence that socioeconomic factors directly affect Bare Area. As the first empirical study of the newly conceived concept, Human Critical Area, this paper sheds light on the renovation of geographic traditions of studying the evolution of the human-environment system through the lens of human activities-driven landscape changes.

1. Introduction

Investigating the interaction between humans and the environment, which constantly evolves with the development of human society [1], is a continuing concern within geography traditions [2,3] and ‘the geographic advantages’ [4]. Previous research has already highlighted the heavy pressure that human beings have been exerting on the planet’s surface layer and the environment as a whole since the Industrial Revolution [5,6]. It has been recognized that the Earth System is confronted with unprecedented threats posed by the booming population, burgeoning demands, intensive human activities, and the massive discharge of pollution and human-induced greenhouse gas emission [7]. The human-induced consequences, including global climate change, terrestrial biosphere alteration [8], ecosystem degradation [9], biodiversity loss [10,11], and more frequent occurrence of major disasters [12,13], are perceived as a reflection of an imbalanced human-environment (or human-Earth) relationship in essence by Earth Science researchers [14]. The narrative of Anthropocene was then emerged [15] and has been rapidly adopted in a range of fields to explore the recent changes in the Earth System and their anthropogenic drivers [16,17]. The Earth’s Critical Zone [18] facilities a systematic understanding of the linkage between matter, energy, and organisms in the human-dominated epoch [19]. The term “critical” refers to life on Earth (including the human species) being dependent upon the Critical Zone’s structures and functions, as well as the significant human impacts on the Critical Zone [20]. This concept brings forward a three-dimensional theoretical framework where the Earth’s surface system is divided into relatively uniform units across different spatial scales [21], shifting the traditional geographical understanding of the human-environment relationship where nature acts as a relatively stable background. Many scholars have also found it to be an effective interdisciplinary tool to investigate human-Earth interactions [22,23] with the inclusion of natural entities, time, and physical depth [24].
However, previous research derived from the Earth’s Critical Zone almost exclusively focused on the chemical, biological, physical, and geological processes of the Earth System in the Anthropocene [22]. The role of human beings in those processes has received scant attention. To highlight the anthropogenic impacts, the Human Critical Area (HCA) [25] was recently conceived based on the fact that human activities have been changing the physical signatures and condition of the Earth’s surface, i.e., extensive cultivation and land cleaning, artificial surface expansion [26], and transportation networks’ construction [27]. HCA refers to an area that characterizes the surface landscape created by human beings in the Anthropocene. It categorizes the Earth’s surface into four types (Built-up Area, Agricultural Area, Ecological Area, and Bare Area), representing the footprints of construction, cultivation, conservation of nature, abandonment of land, and other human-dominated processes [25].
This is the first empirical study applying the concept of HCA, aiming to investigate its effectiveness in revealing and visualizing the Earth’s surface changes of a vulnerable region under anthropogenic impacts in the Anthropocene and detecting the socioeconomic drivers for the changes. The research is conducted in an arid inland region in Northwest China named “Three Water Lines”, which has a diverse landscape, vulnerable environment and unbalanced socioeconomic conditions. The demarcation of the four HCA types is achieved through reclassification of land use/cover (LULC) data, based on which the HCA changes in quantity and spatial pattern are discussed. Moreover, this paper examines human socioeconomic dynamics as a driving force for altering the Earth’s surface by employing regression models.

2. Materials and Methods
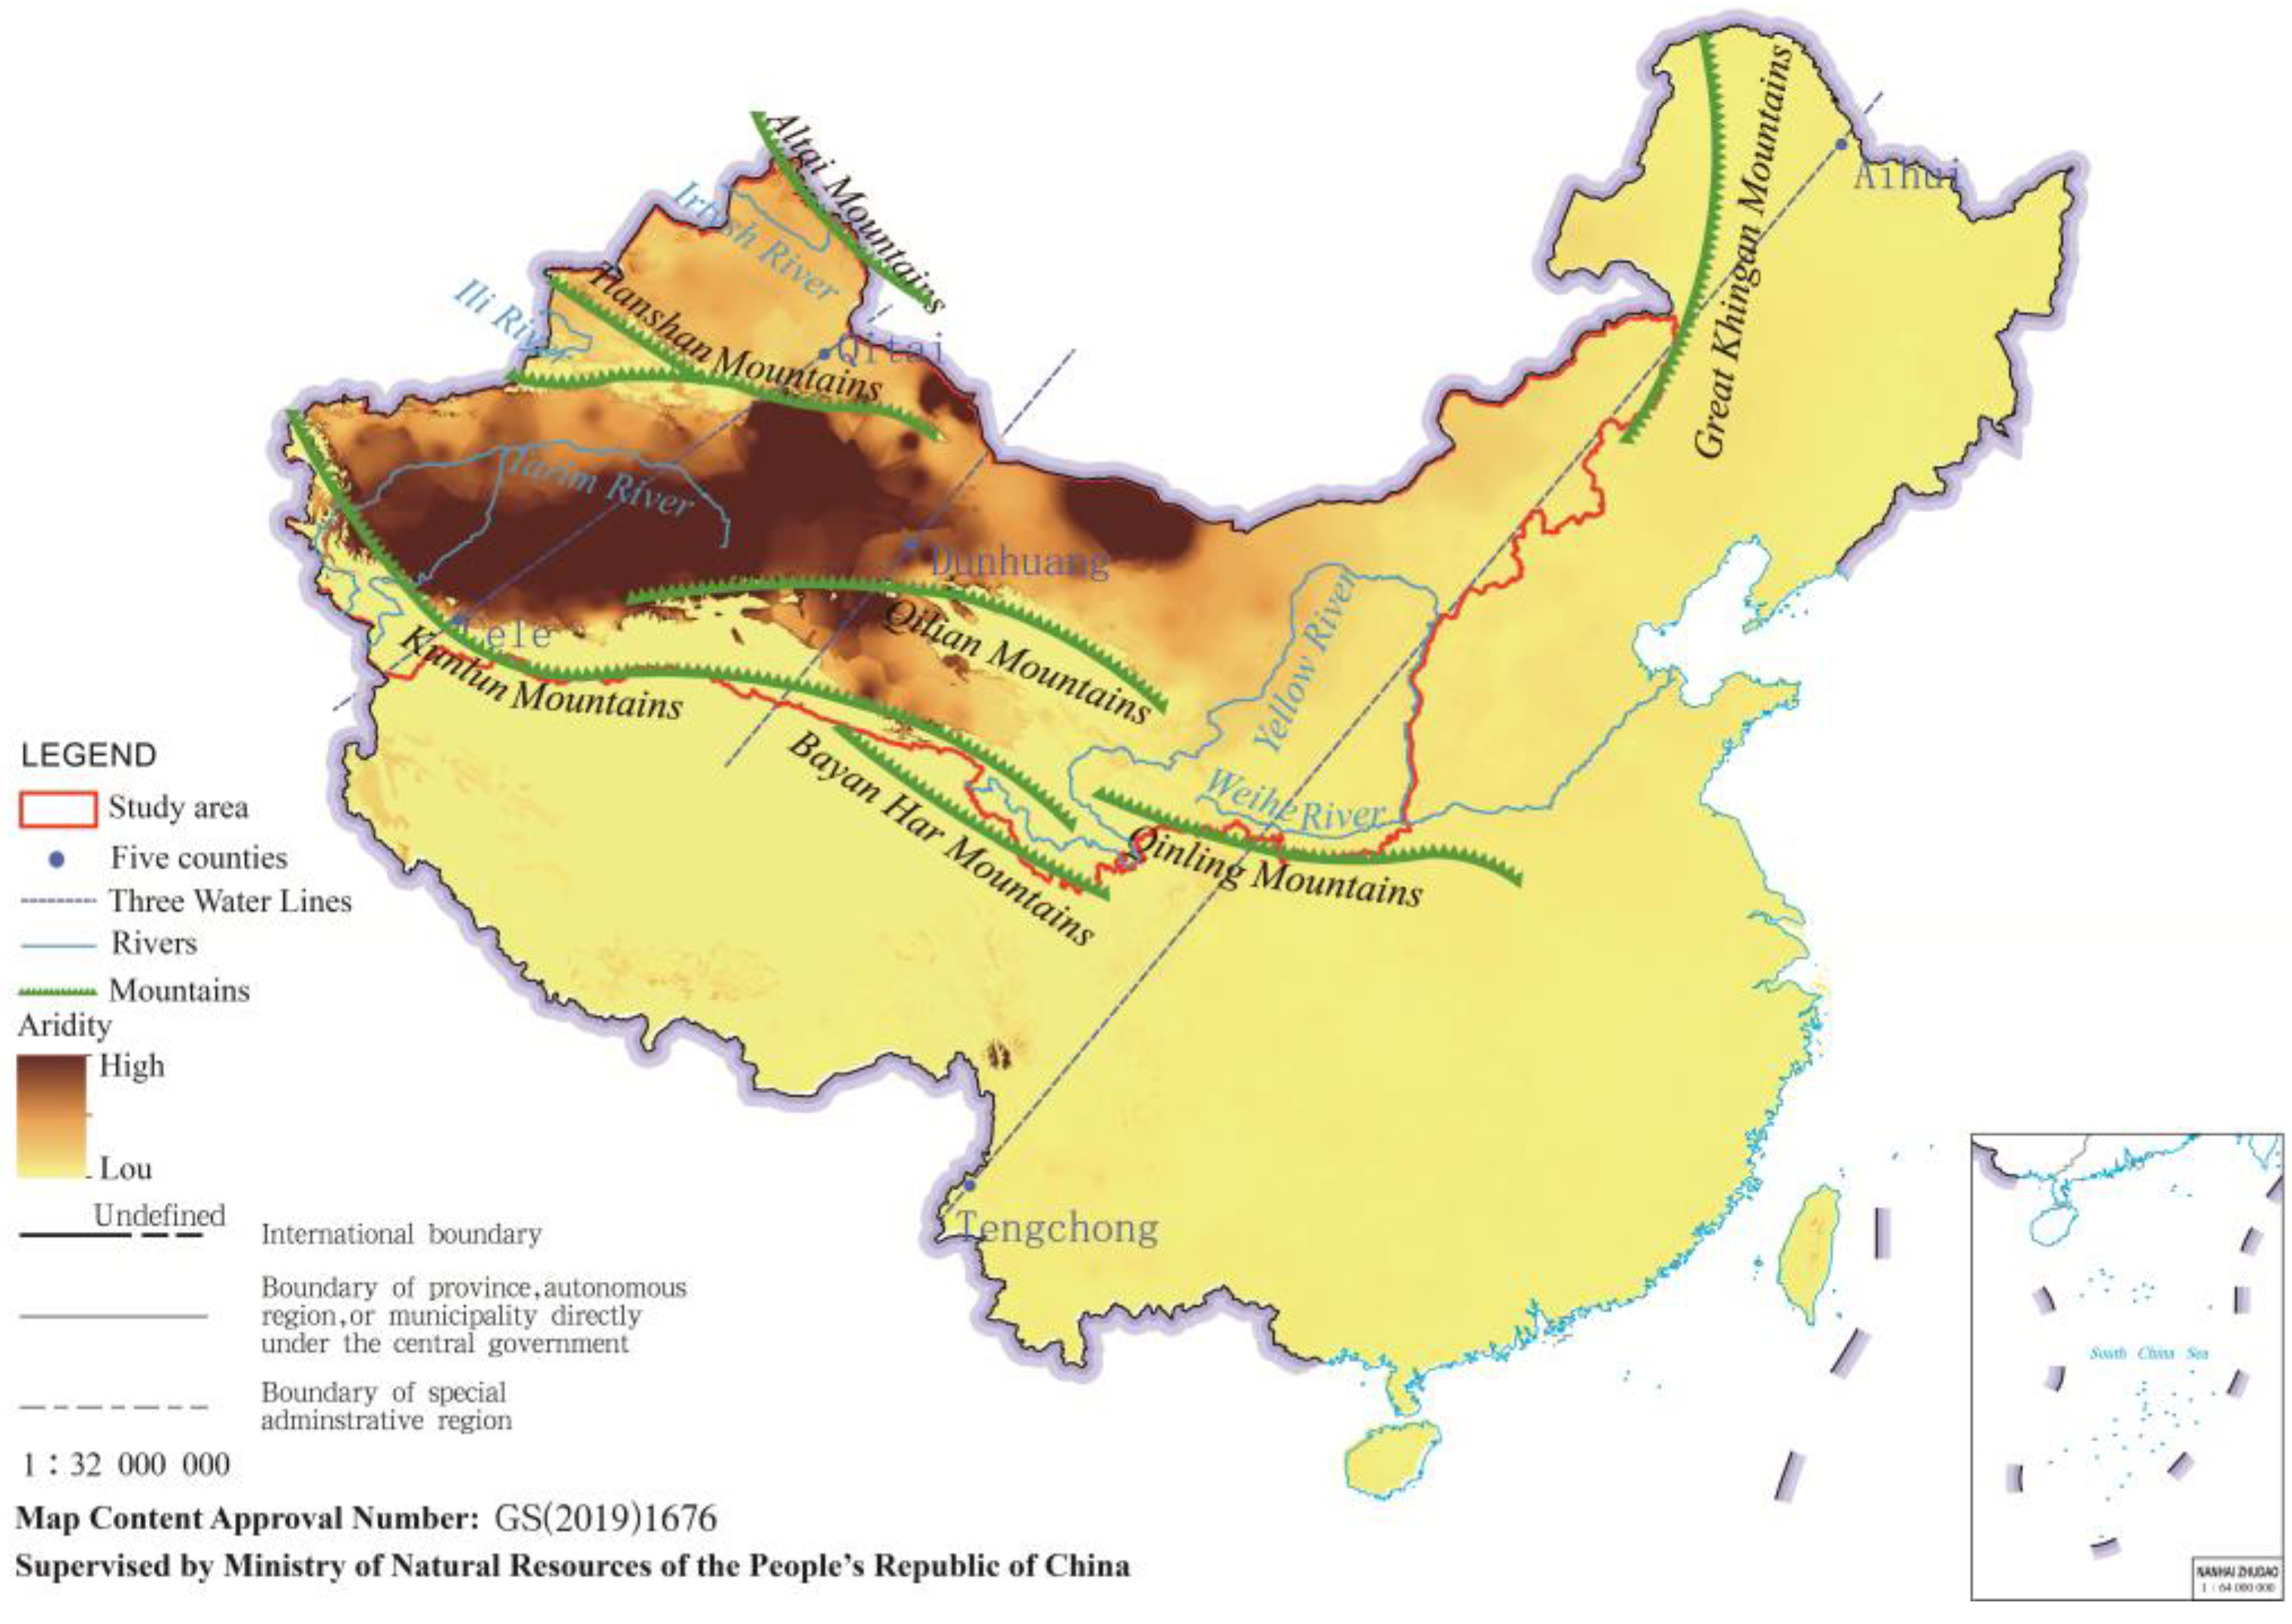
2.1. Study Area

The “Three Water Lines” (Figure 1) refers to a key region in Northwest China of national-class strategic significance for socioeconomic development, ecological preservation, and national security. It was first proposed by an academic of the Chinese Engineering Academy in 2018 in relation to the co-evolution of hydro-meteorology, ecological landscapes, and socioeconomic development [28,29]. The “Three Water Lines” is formed based on three major demarcating lines of socio-ecological significance, namely the Heihe-Tengchong Line, the Yangguan Line, and the Qitai-Cele Line [29]. The Heihe-Tengchong Line, uncovers the longstanding uneven distribution of population and land resources in China, with the sparsely populated western side of the line covering a vast territory [30]. The Yangguan Line, passing through Dunhuang city, is the dividing line of China’s highly arid areas and the arid regions [29]. Xinjiang province is divided into two halves by the Qitai-Cele Line, with the northwest half holding nearly 90% of the population and resources [29]. The study area of this research is roughly bound by the national boundary of China in the west and north, the Great Khingan Mountains in the east, and the Kunlun Mountains, the Bayan Har Mountains, and the Qinling Mountains in the south, covering a total territorial area of about 3,450,000 km2 with 383 county-level administrative units.

2.2. Data Acquisition and Processing

The Land Use/Cover Remote Sensing Monitoring Datasets (2000, 2010, and 2020) were acquired from the Resource and Environment Science and Data Center, Chinese Academy of Sciences. With a resolution of 1 km, the datasets classify the territorial land into seven primary LULC types: cultivated land; forest; grassland; water bodies; urban and rural built-up area; unused land; and unclassified land.
The socioeconomic data used in this study were sourced from the China Statistical Yearbook (county-level) [33], Gansu Development Yearbook [34], Ningxia Statistical Yearbook [35], Inner Mongolia Statistical Yearbook [36], Qinghai Statistical Yearbook [37], Xinjiang Statistical Yearbook [38], Shaanxi Statistical Yearbook [39], and Shaanxi Regional Statistical Yearbook [40]. The data unavailable in the above yearbooks were supplemented according to regional economic and social development statistical communiques. Linear interpolation was used to generate the data missing in the above sources.

2.3. HCA Classification and Methods for Exploring HCA Changes

The seven LULC types in Land Use/Cover Remote Sensing Monitoring Dataset were firstly reclassified into four HCA types according to landscape features and human activities. The classification and basis are shown in Table 1.
Transition Matrix was applied to investigate changes in the area and distribution of HCA by identifying the transitions between each pair of the four types with a cross-tabular matrix [41]. The matrix is generated by the tool ‘Intersect’ in ArcGIS 10.2, the expression of which is:
S i j = { S 11 S 12 S 1 n S 21 S 22 S 2 n S n 1 S n 2 S n n
where S i j refers to the amount of area transited from HCA type i to HCA type j, and n is the number of HCA types (n = 4 in this study). The sum of each row is the total area of one HCA type in the starting year, and the sum of each column is the total area of this type in the ending year. Each value in the matrix illustrates the source and end HCA types as well as the area of transition.

2.4. Methods for Examining Socioeconomic Drivers for HCA Changes

Exploding population and urbanization, along with their corresponding surging demands, have left evident topographic traces on the Earth’s surface through industrial and construction activities, agricultural practices, and the exploitation of natural resources, affecting the geomorphic processes across landscapes [27]. From the lens of landscape, previous studies have confirmed the role of socioeconomic development in changing the Earth’s surface. However, rarely have they considered the combined effects of various socioeconomic factors.
This research first investigated the driving force of a single socioeconomic indicator for HCA changes using binary linear regression and then applied stepwise multiple linear regression to examine the existence of joint effects. The stepwise approach generates the optimum multiple regression equation by examining the statistical significance of each new variable introduced to the model according to specific predetermined criteria, until no independent variables can enter or be removed from the equation, such that the resulting equation reflects the combined effect of all remaining variables. Six socioeconomic indicators were utilized as independent variables due to the limited availability of county-level statistical data: population density, urbanization rate, GDP per capita, value-added per capita of the primary sector, value-added per capita of the secondary sector, and grain yield per square kilometer. The data are normalized with the max-min method before the binary and multiple regression analyses were performed.

3. Results

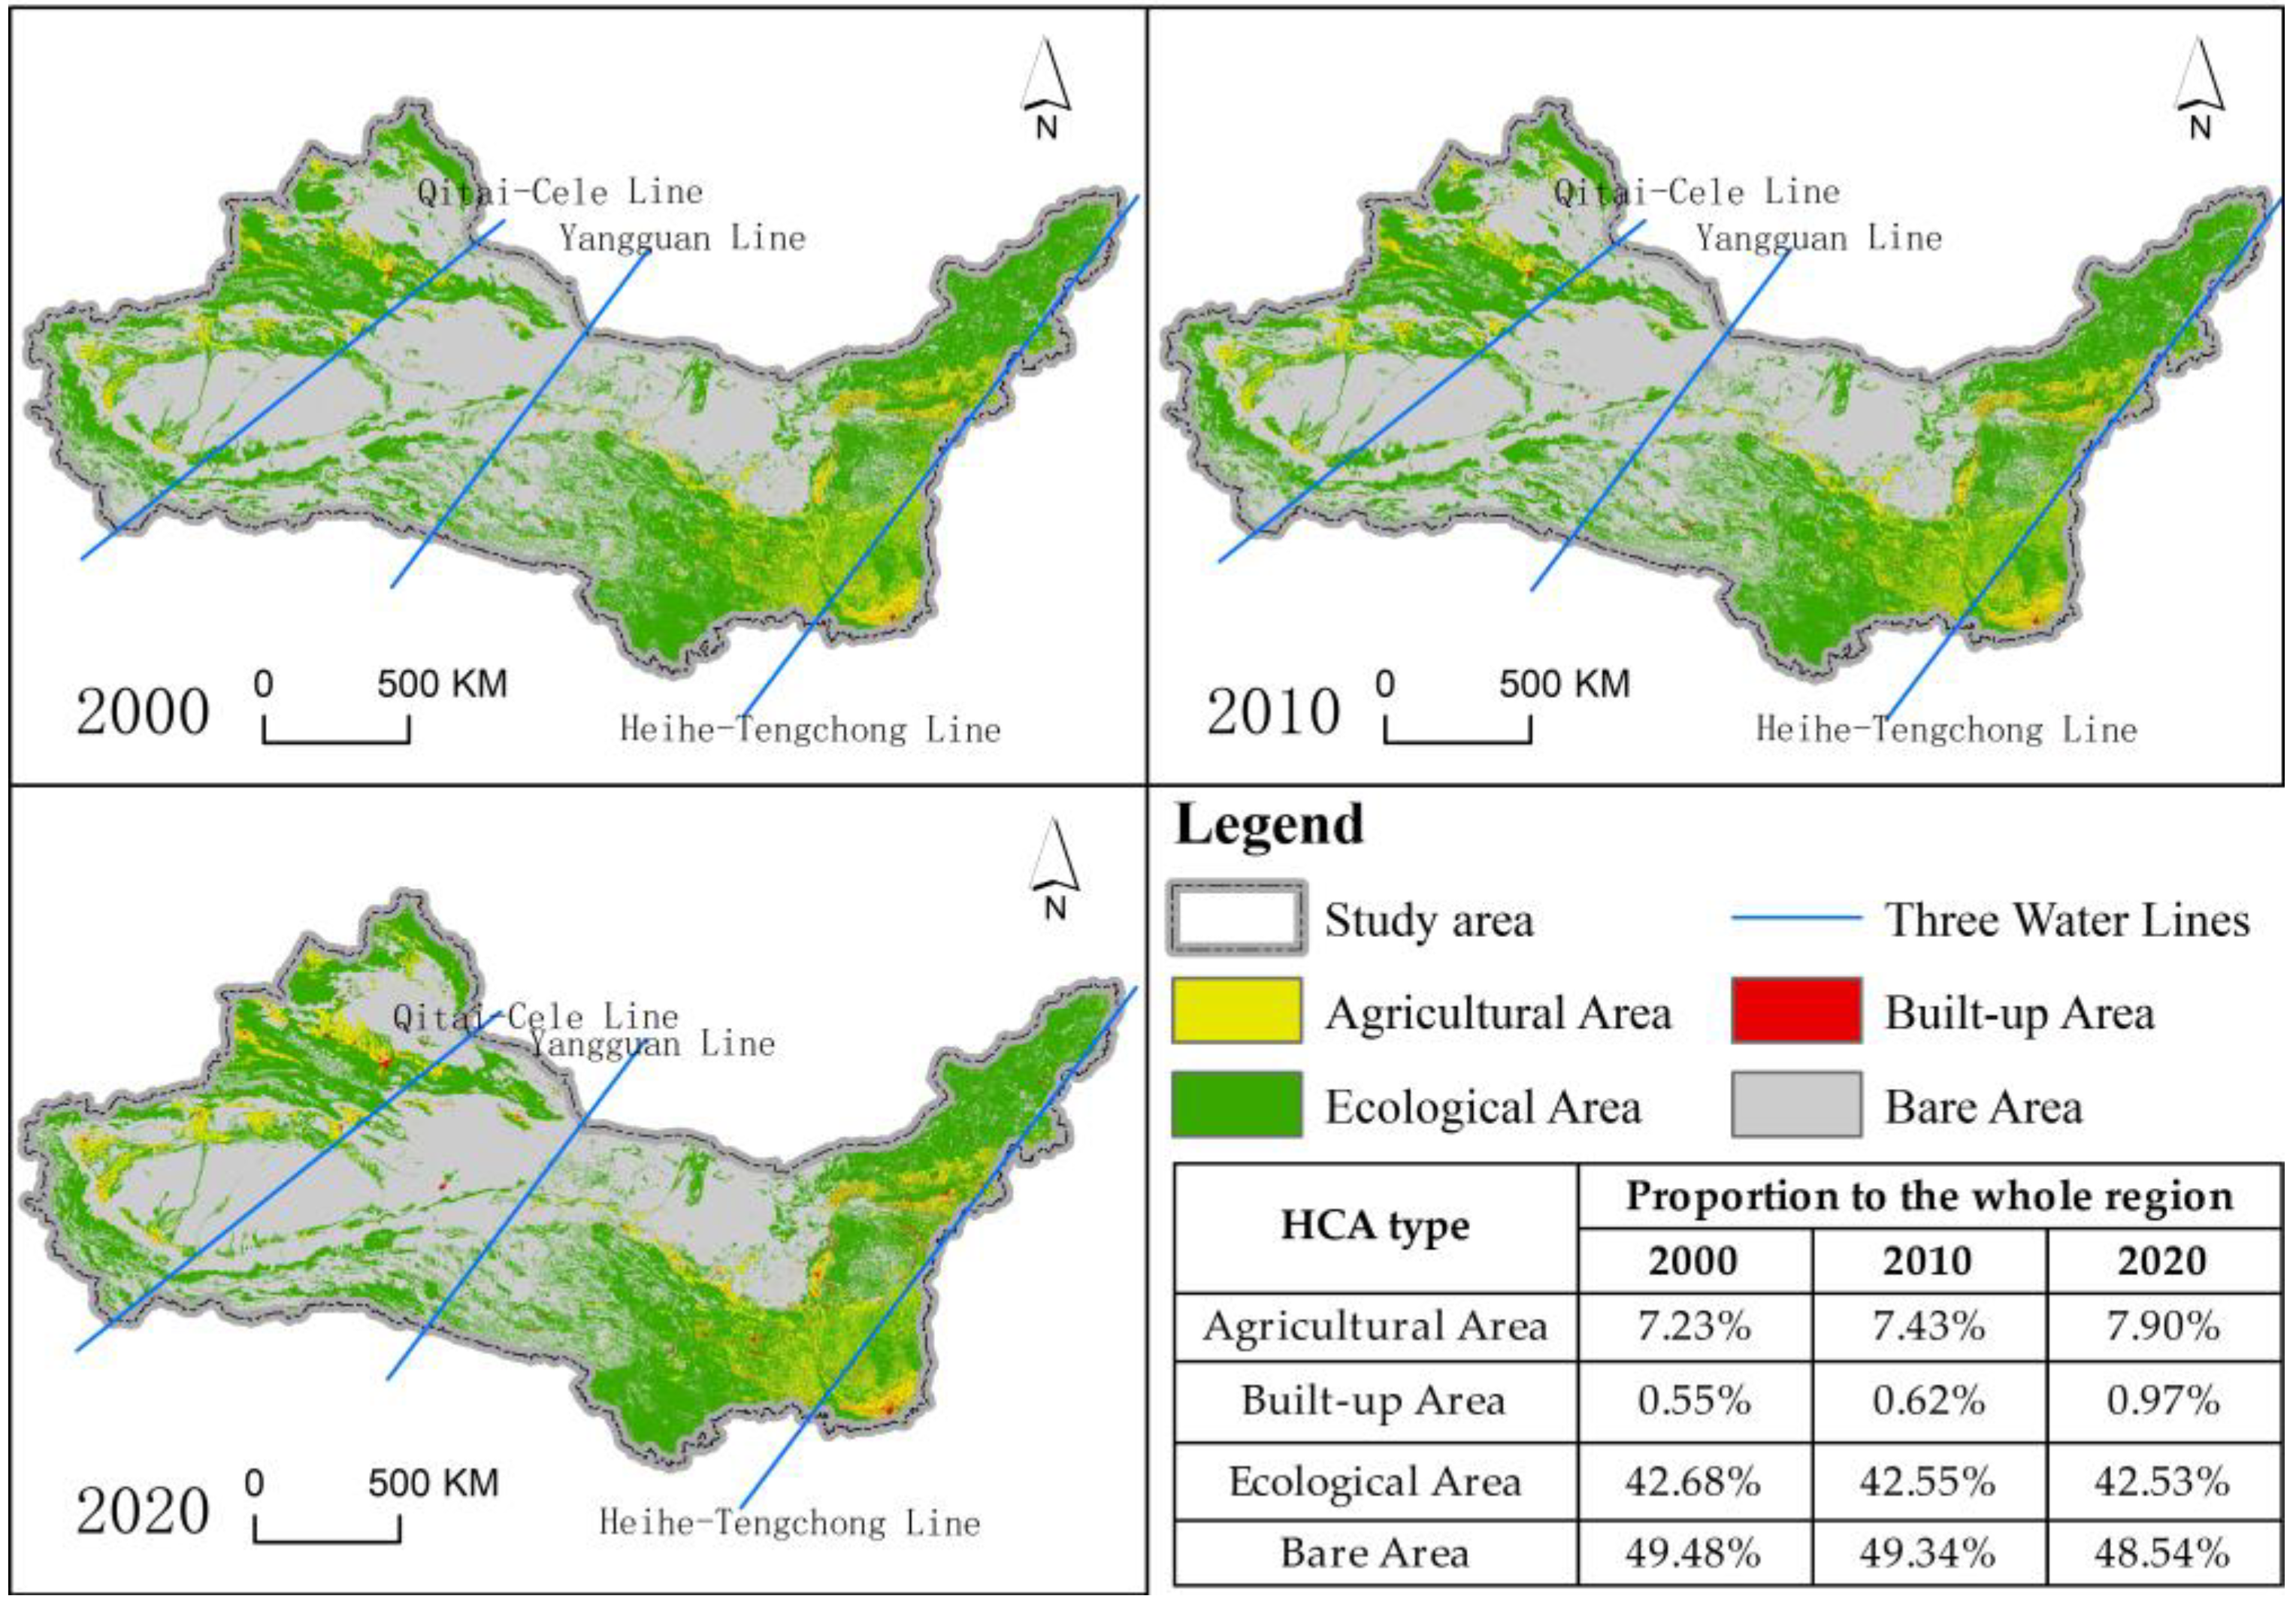
3.1. HCA Structure and Spatial Characteristics in the “Three Water Lines” Region

The HCA structure and spatial features across the entire study area remained essentially unchanged from 2000 to 2020, whereas increases and decreases in the quantities and proportions of individual types of HCA varied (Figure 2 and Table 2).
Bare Area and Ecological Area were the predominant HCA types with vast distributions across the “Three Water Lines” region. While Bare Area continued to hold the majority position, accounting for around 49% of the entire region, both its area and proportion continually diminished over the two decades. Ecological Area, which was ranked second, had a proportion slightly lower than Bare Area (stayed over 42.5% from 2000 to 2020) and continued to decline. With a total proportion of over 7%, Agricultural Area typically spread over flat terrains with ample water supplies and moderate temperatures. Compared with the other HCA types, Built-up Area was highly concentrated and had the highest growth rate (reaching 1.75 times its original size by 2020), although its share had not exceeded 1% by the end of the study period.

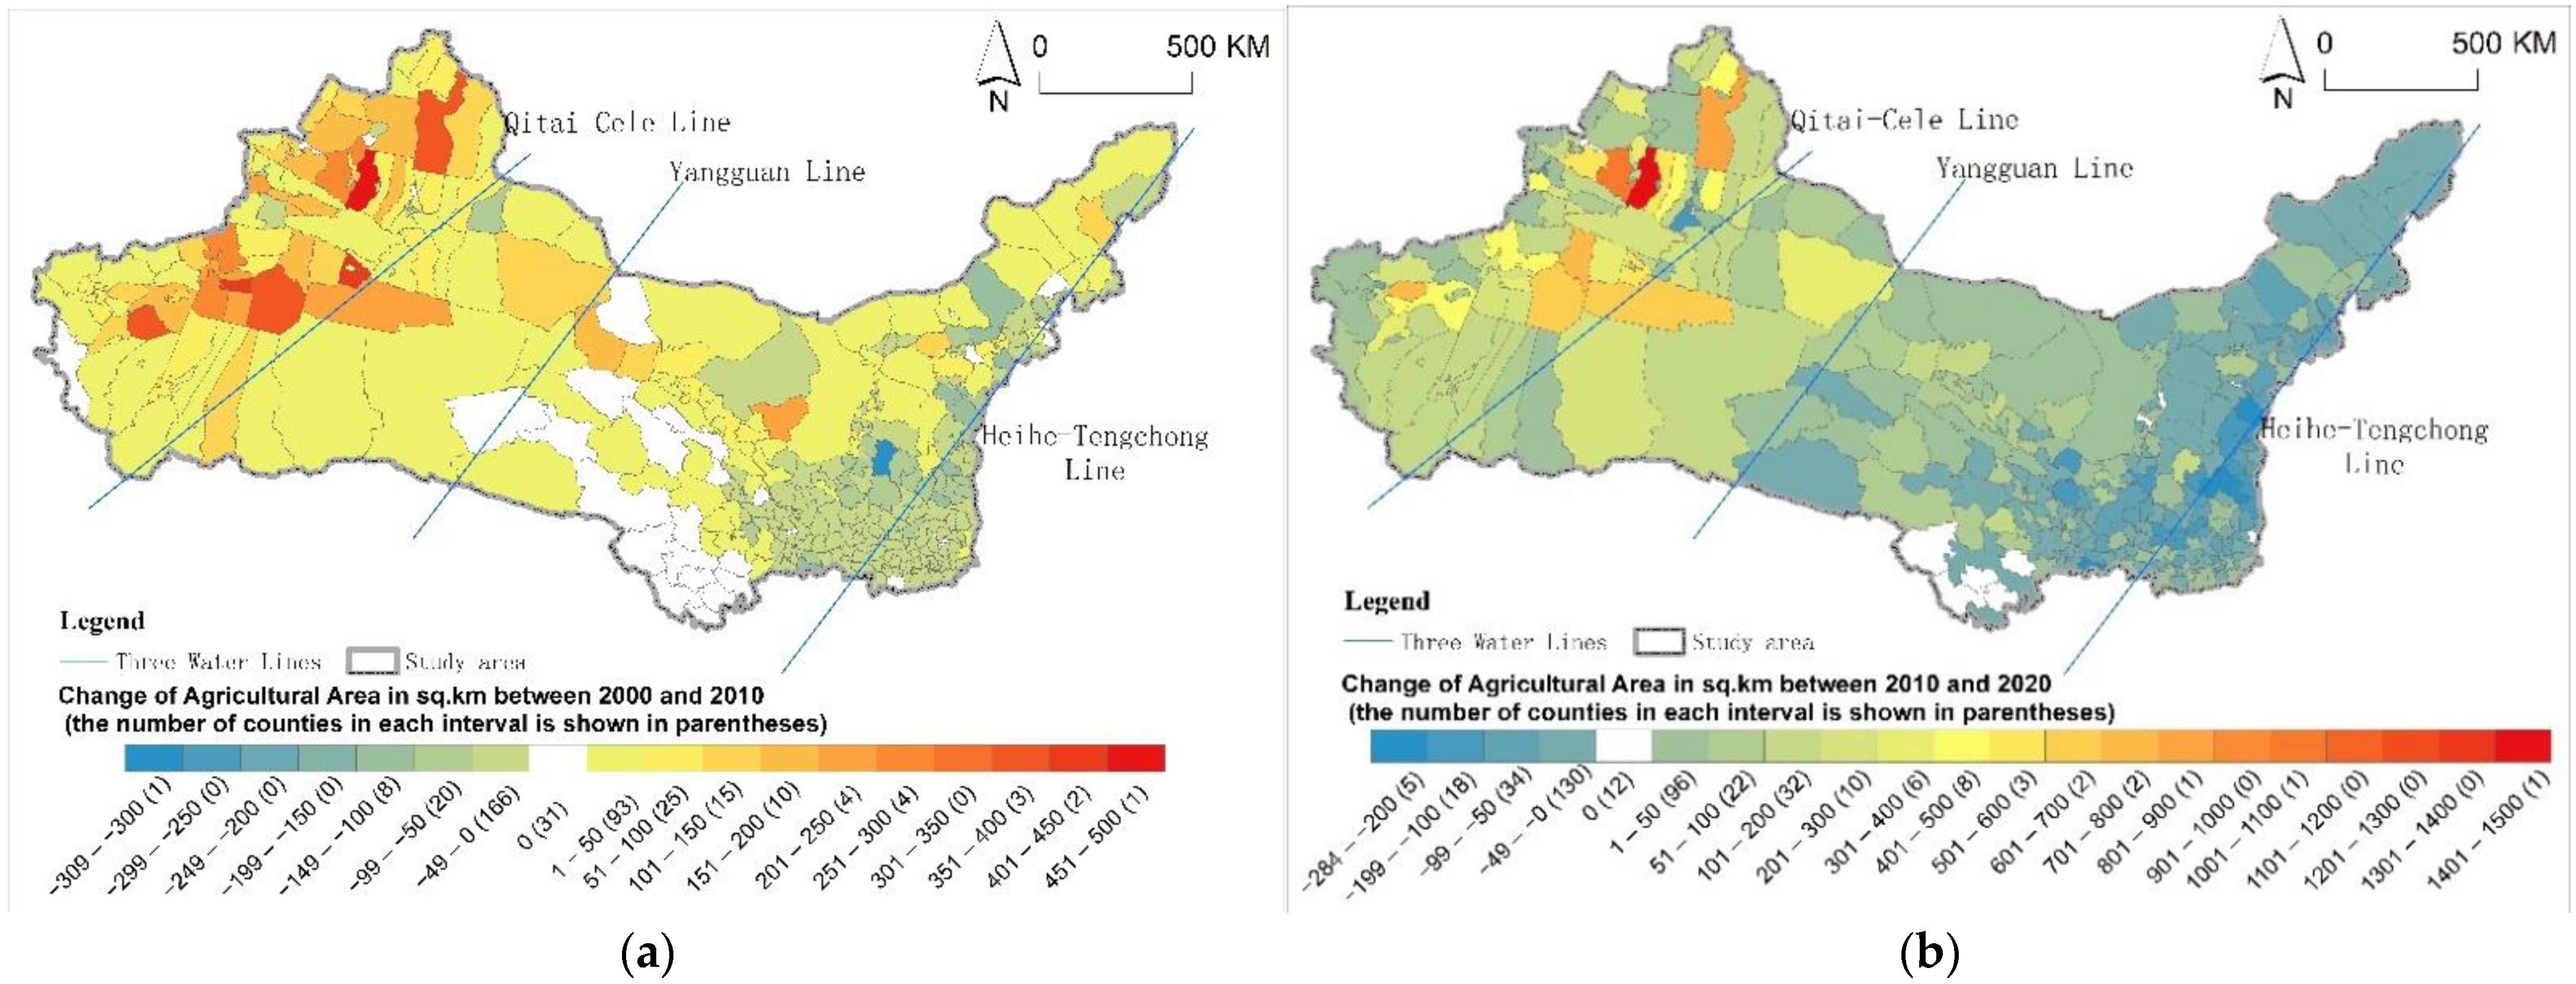
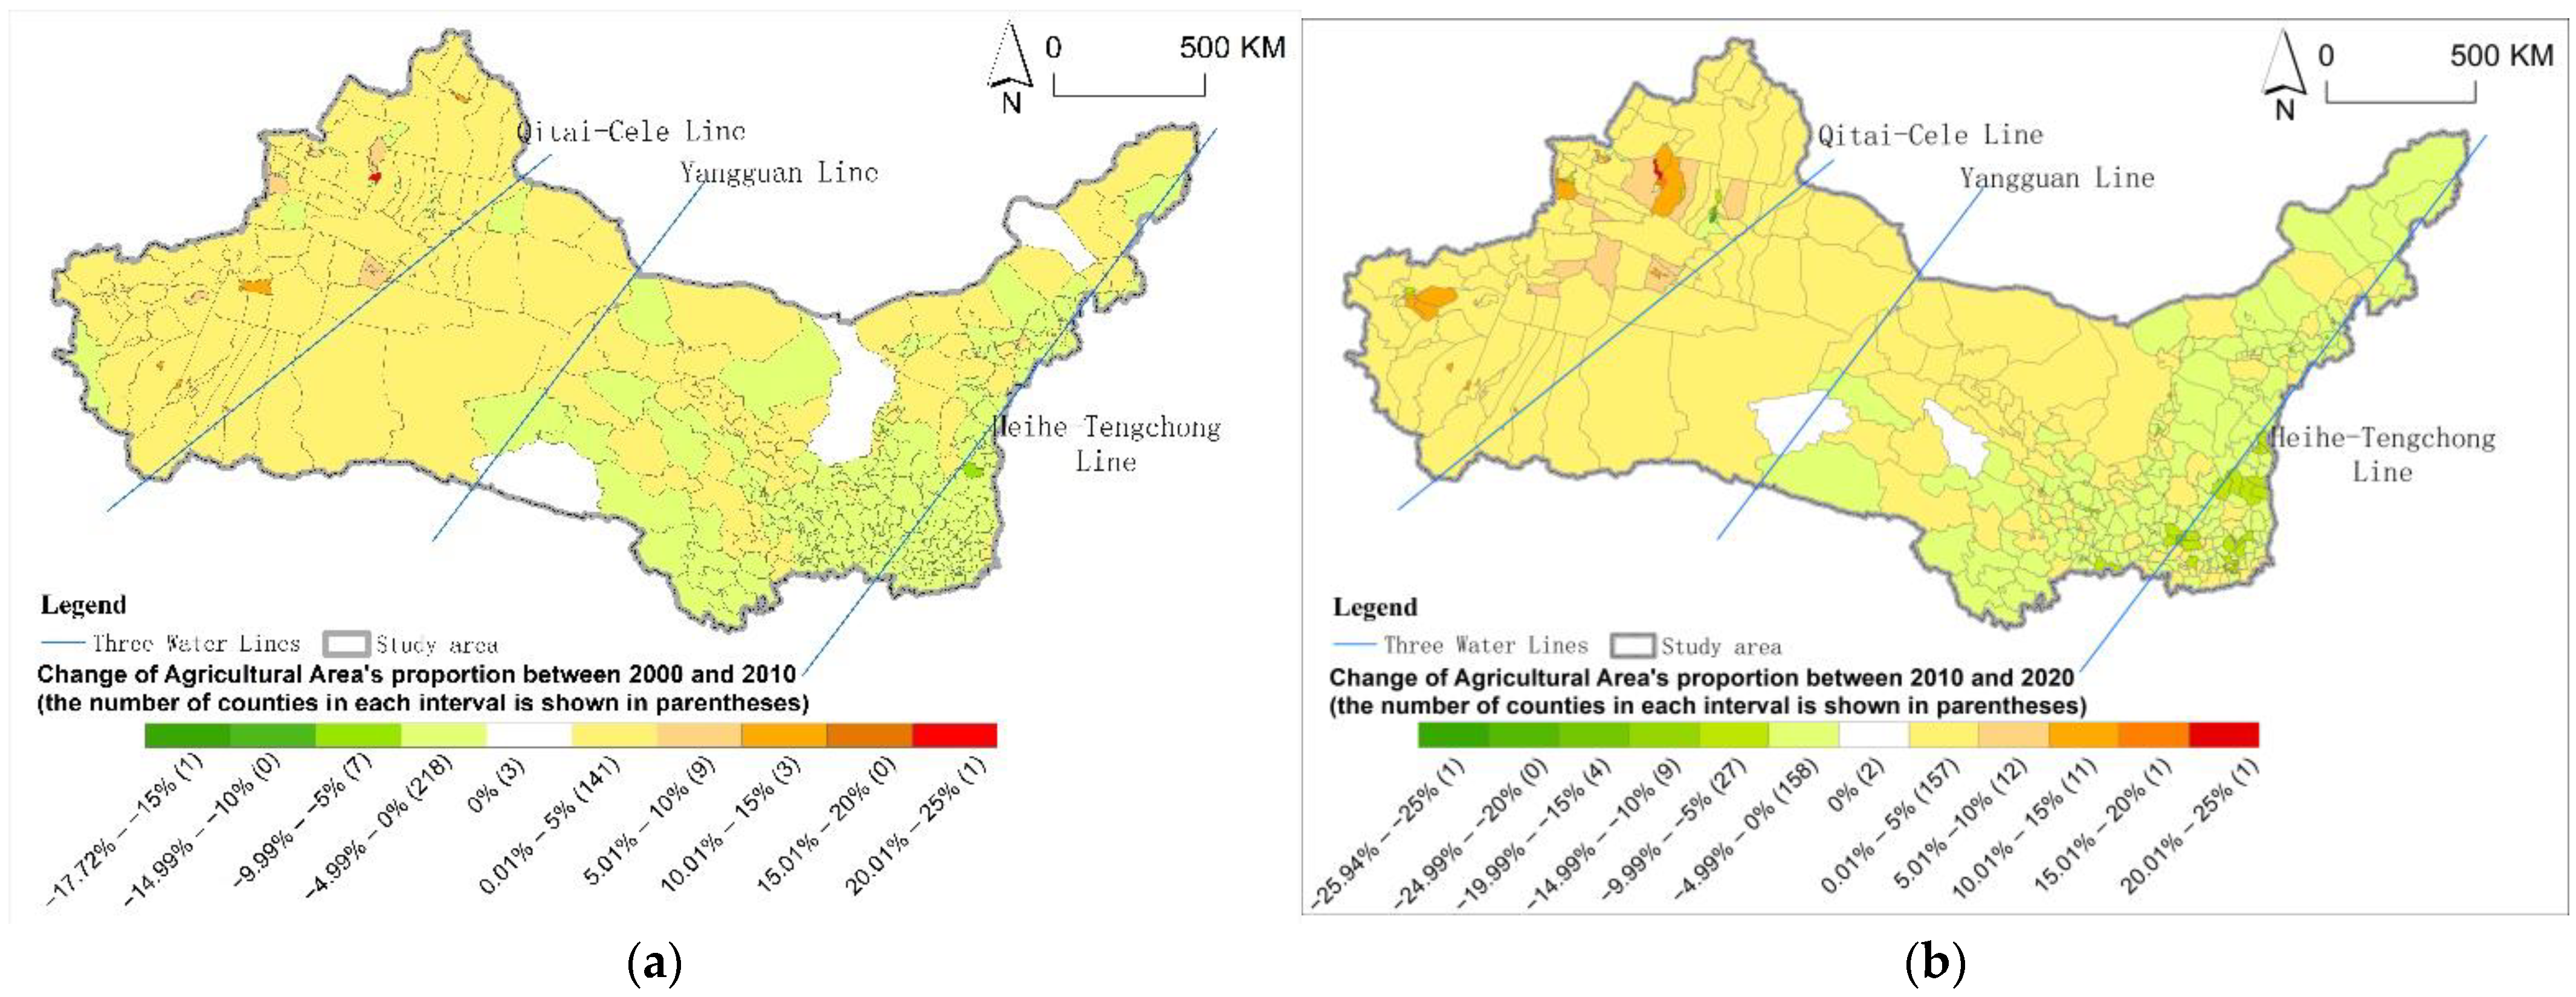
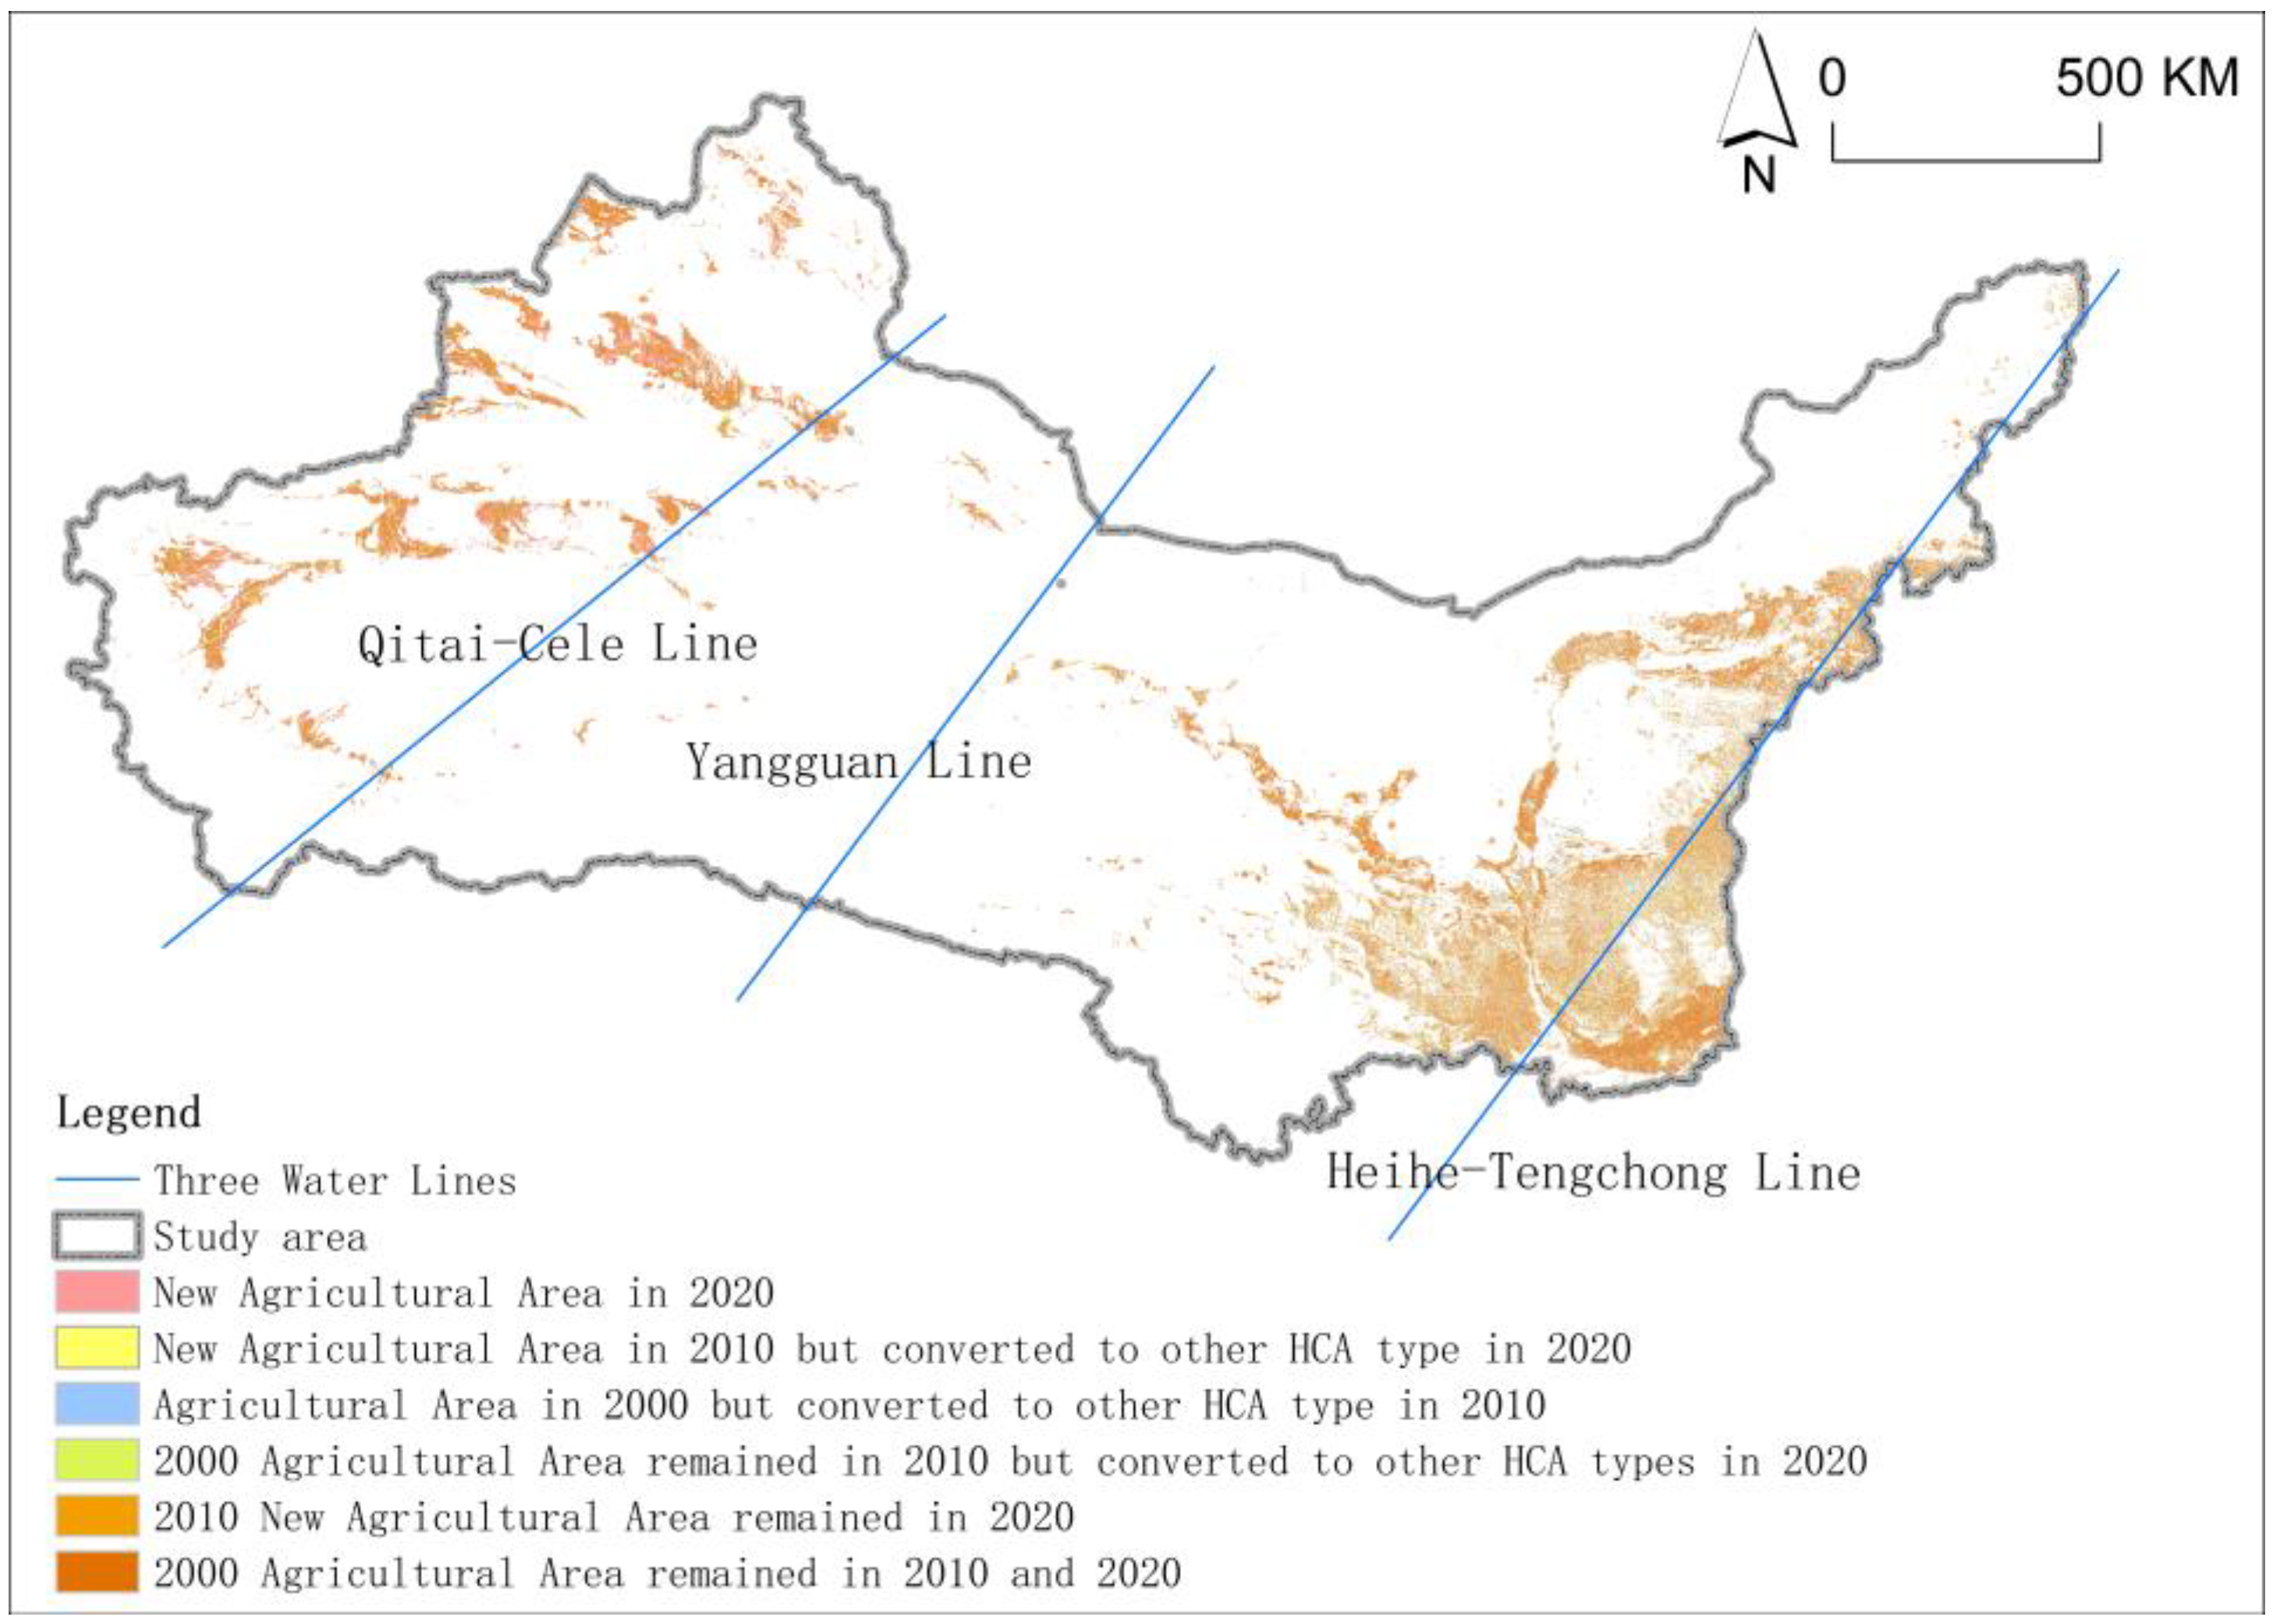
3.1.1. Agricultural Area

Agricultural Area was primarily found in relatively flat areas with rivers and/or abundant precipitations and moderate temperatures, such as the middle reaches of the Yellow River and the north and south sides of the Tianshan Mountains. This distribution pattern remained unchanged over the two decades. Also, an uneven distribution can be observed that in Agricultural Area around the Yangguan Line, which is extremely scarce in comparison to the other two lines (Figure 3).
Agricultural Area covered 263,765 km2 in 2020, accounting for 7.90% of the whole study area. It increased by 22,036 km2 over the two decades, and growth during the second decade was more than double that in the first decade. On a county scale, 27 more counties present an expansion of the Agricultural Area in the second decade, and the greatest increment surged from 468 km2 to 1451 km2. From 2000 to 2010, more than 40% of the counties experienced a shrinkage in Agricultural Area, most of which were located adjacent to the Heihe-Tengchong Line, and the number of counties continued to increase in the next decade while the distribution pattern remained almost the same (Figure 4). During both decades, counties with an area reduction of less than 50 km2 accounted for the majority, but the number of counties decreased slightly during the second decade. By contrast, the number of counties in which the Agricultural Area decreased by more than 100 km2 nearly tripled.
A county-level comparative analysis of the changes in the proportion of Agricultural Area shows that during both decades, the number of counties in which the proportion of agricultural area decreased was higher than that of the increased ones (Figure 5). During the first decade, the vast majority of counties showed a slight change of less than 5% in Agricultural Area proportion, and the number of counties where the proportion decreased was greater than that of the increased ones. In the second decade, the number of counties that experienced a change of a more than 5% grew, especially in the western part of the Qitai-Cele Line.

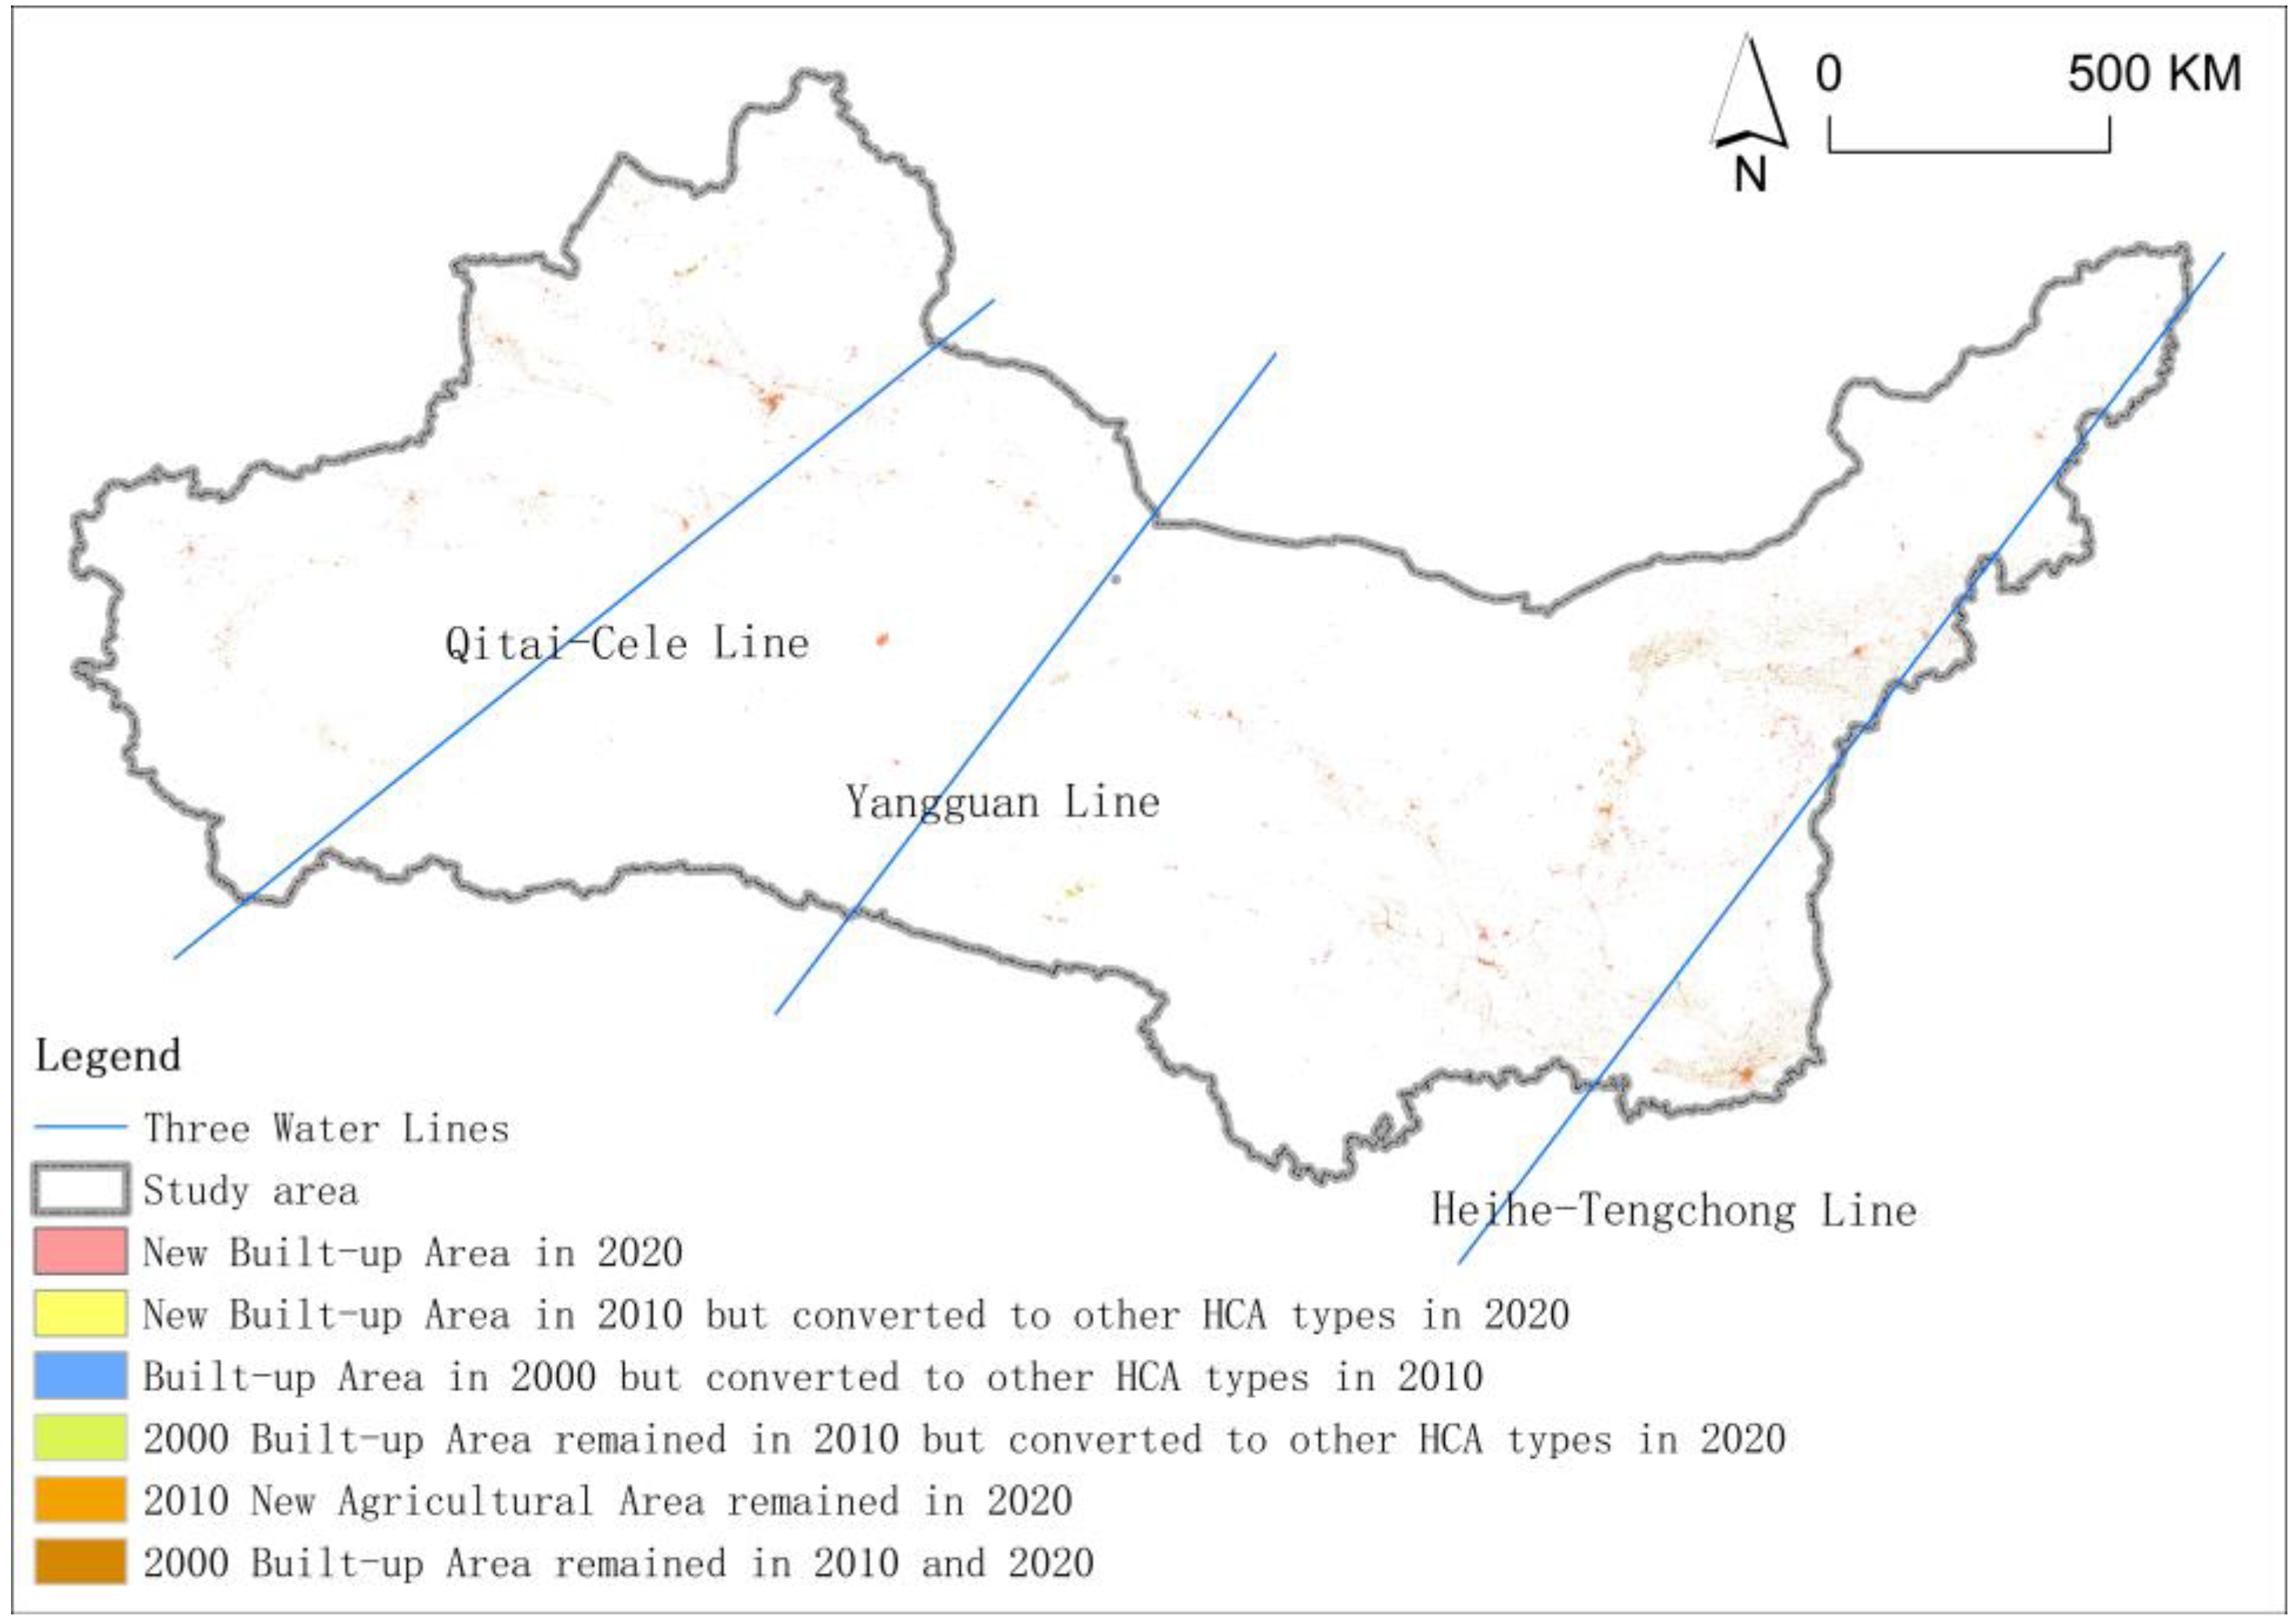
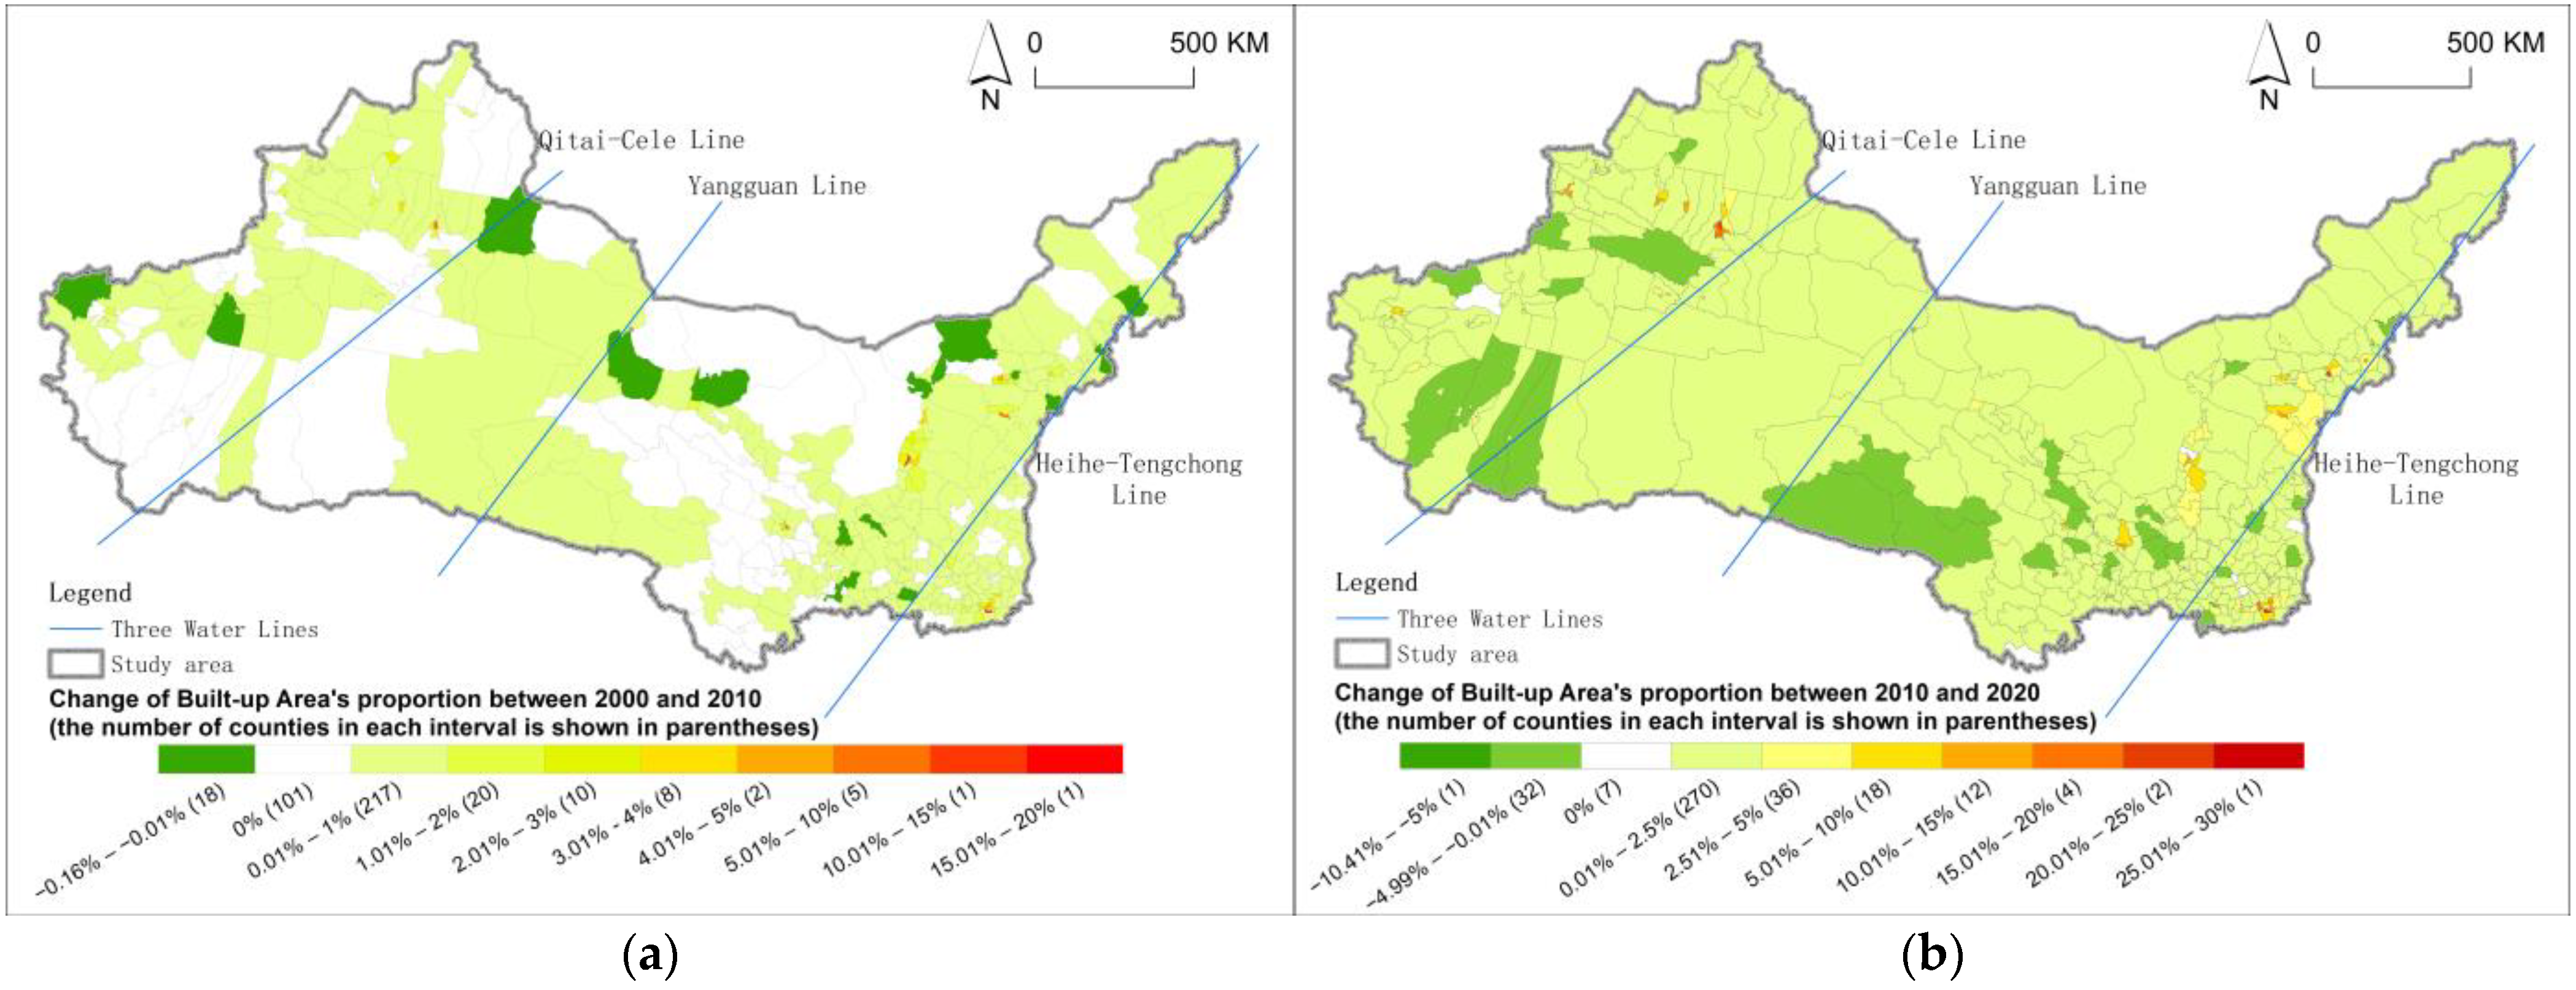
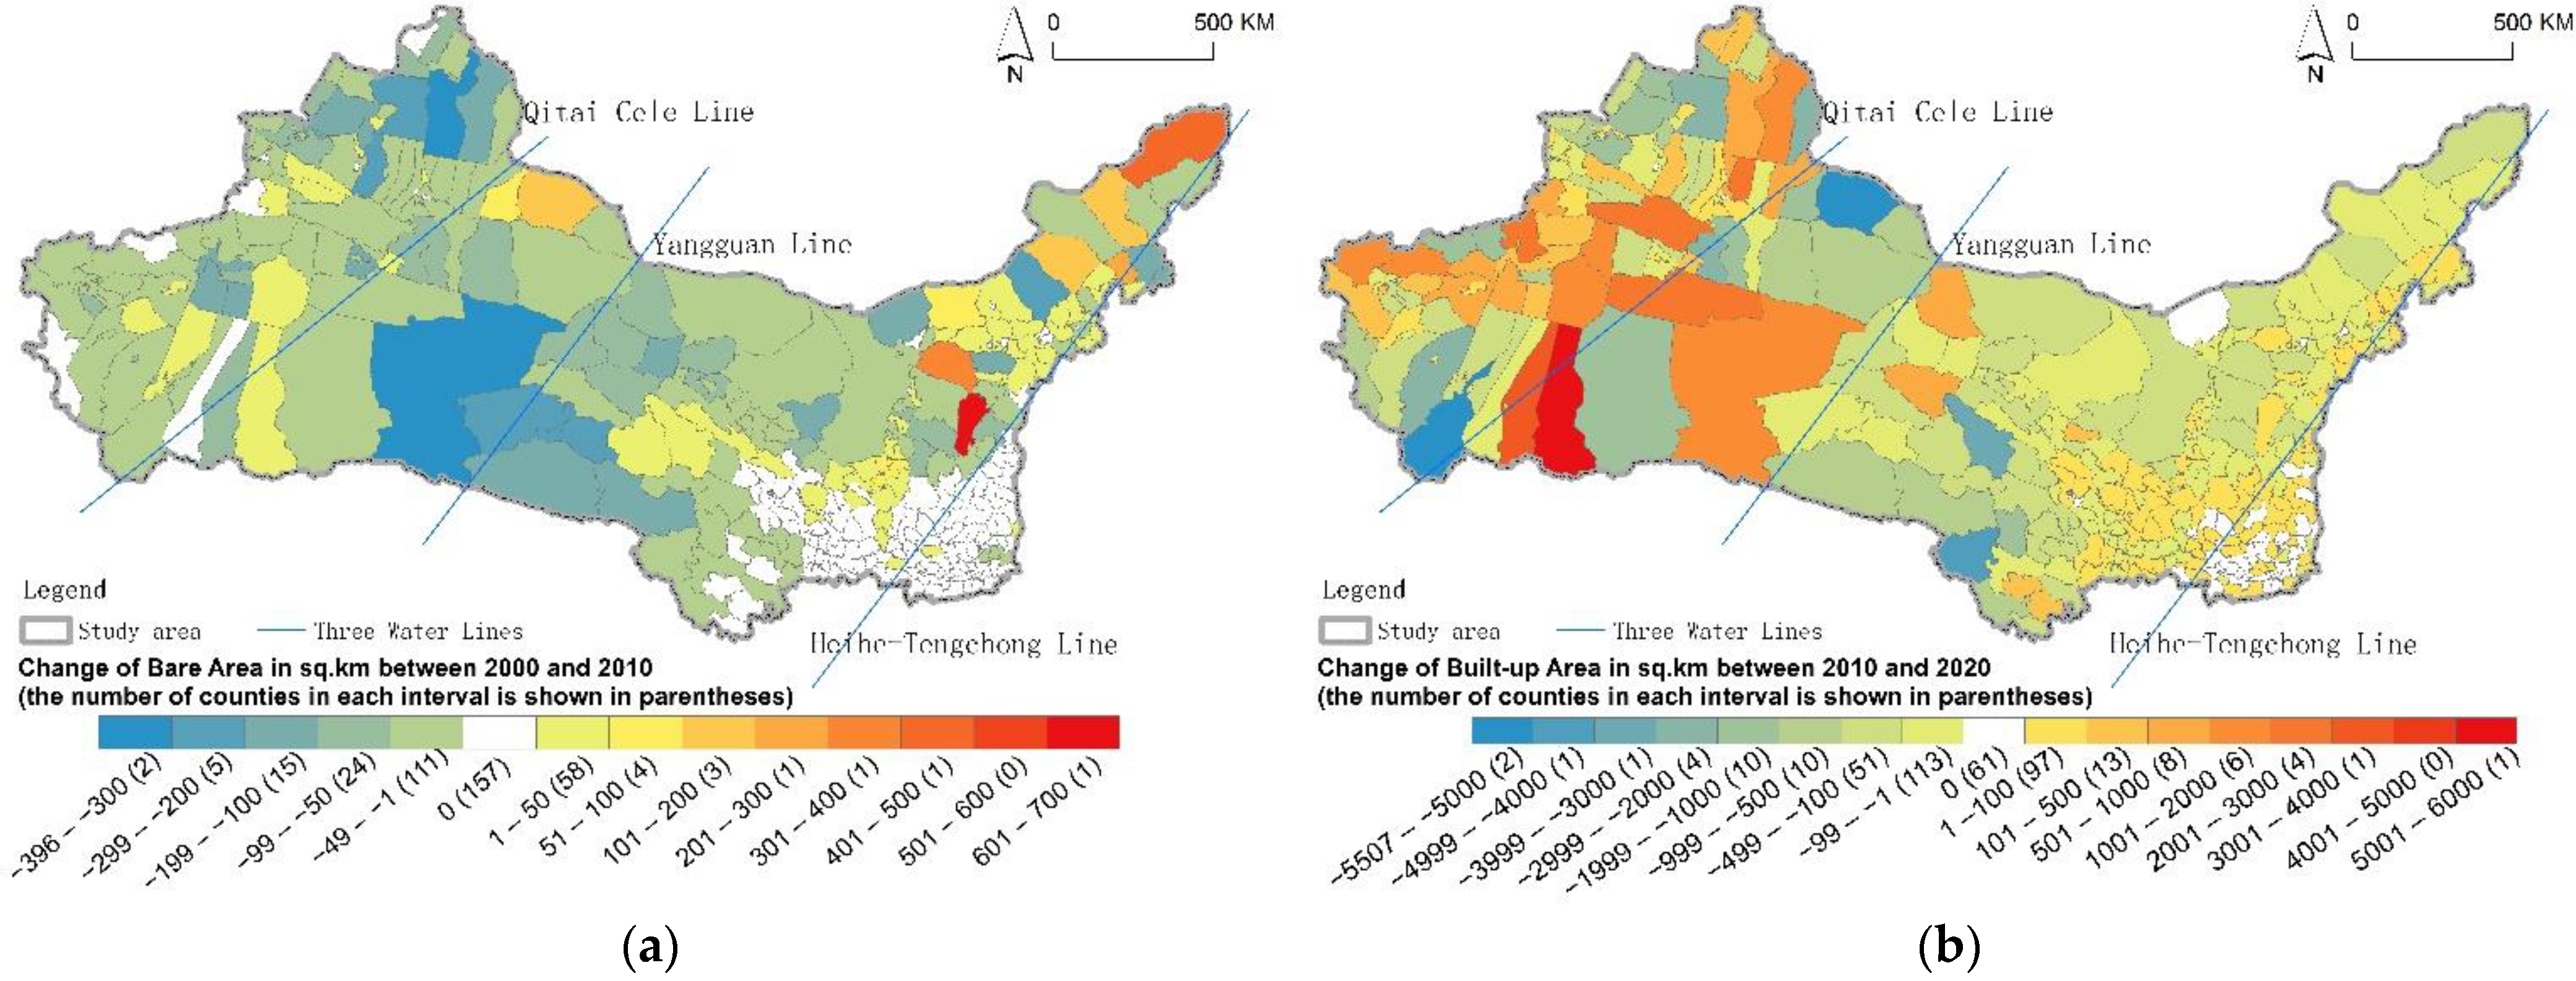
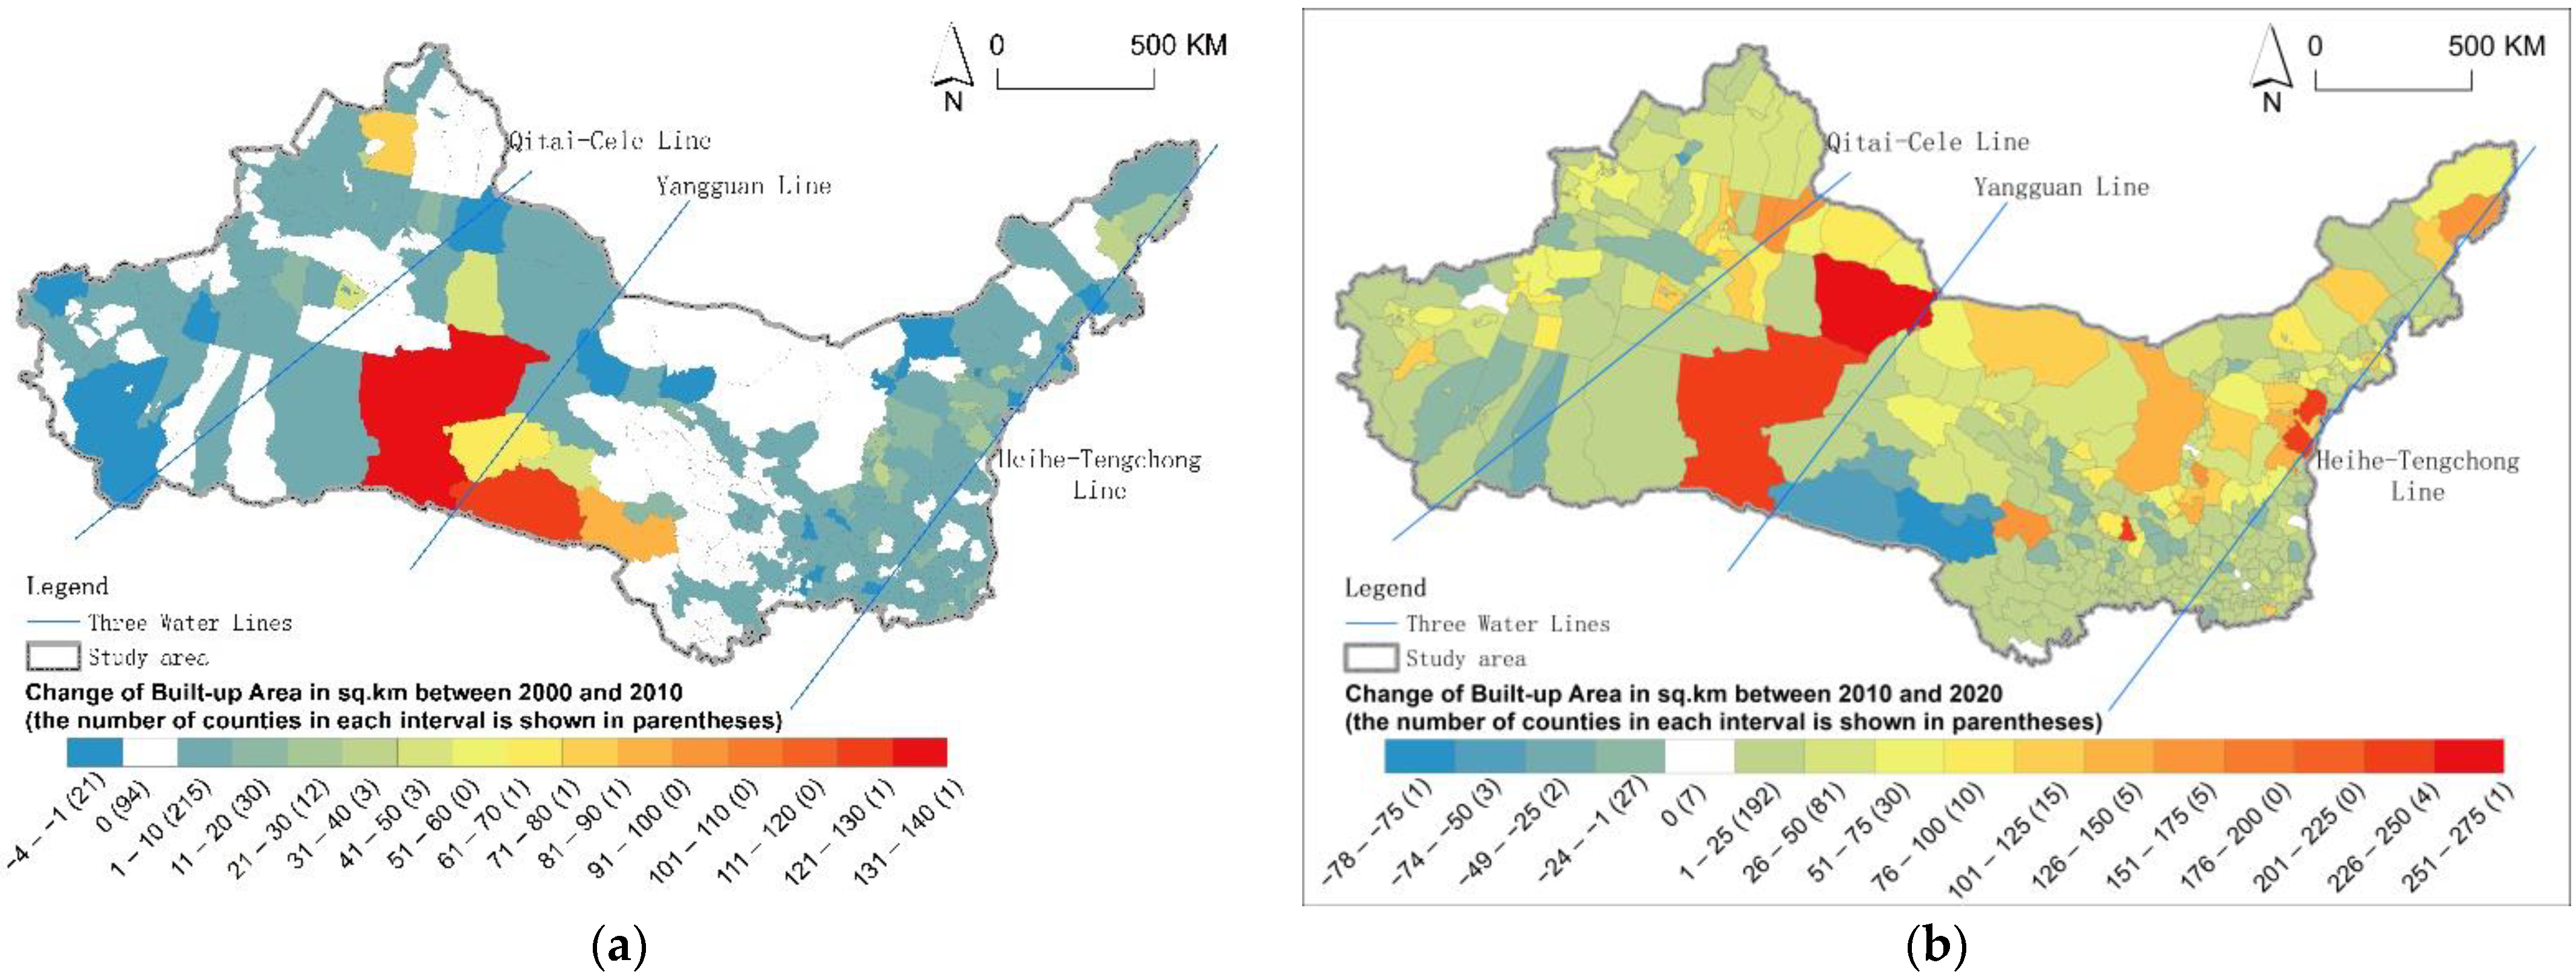
3.1.2. Built-Up Area

Built-up Area, which covers only 0.97% of the “Three Water Lines” region with 32,334 km2 in 2020, shows a highly uneven and concentrated distribution pattern (Figure 6). On a regional scale, Built-up Area occupied remarkably more territory in the region’s southeastern part than in the northwestern part. Generally, Built-up Area was distributed densely in areas with a relatively long history of urban and economic development and in areas where the national urban agglomerations approved by the State Council of China were allocated.
Built-up Area showed a remarkable enlargement during the study period, especially during the second decade, which accounted for more than 80% of the total increment during the 20 years. The counties experienced a Built-up Area increment surge from 69% to about 90% in the second decade and five counties showed noticeable increments of more than 200 km2 (Figure 7).
The county-level comparison of the change in proportion of Built-up Area (Figure 8 also verifies the acceleration of Built-up Area expansion. During the second decade, 30 more counties showed a more-than-5% increment in the proportion of Built-up Area Despite the remarkable growth of Built-up Area across the entire study area, there is an evident disparity in the growth rate between the county-level units in urban areas and those in rural areas.

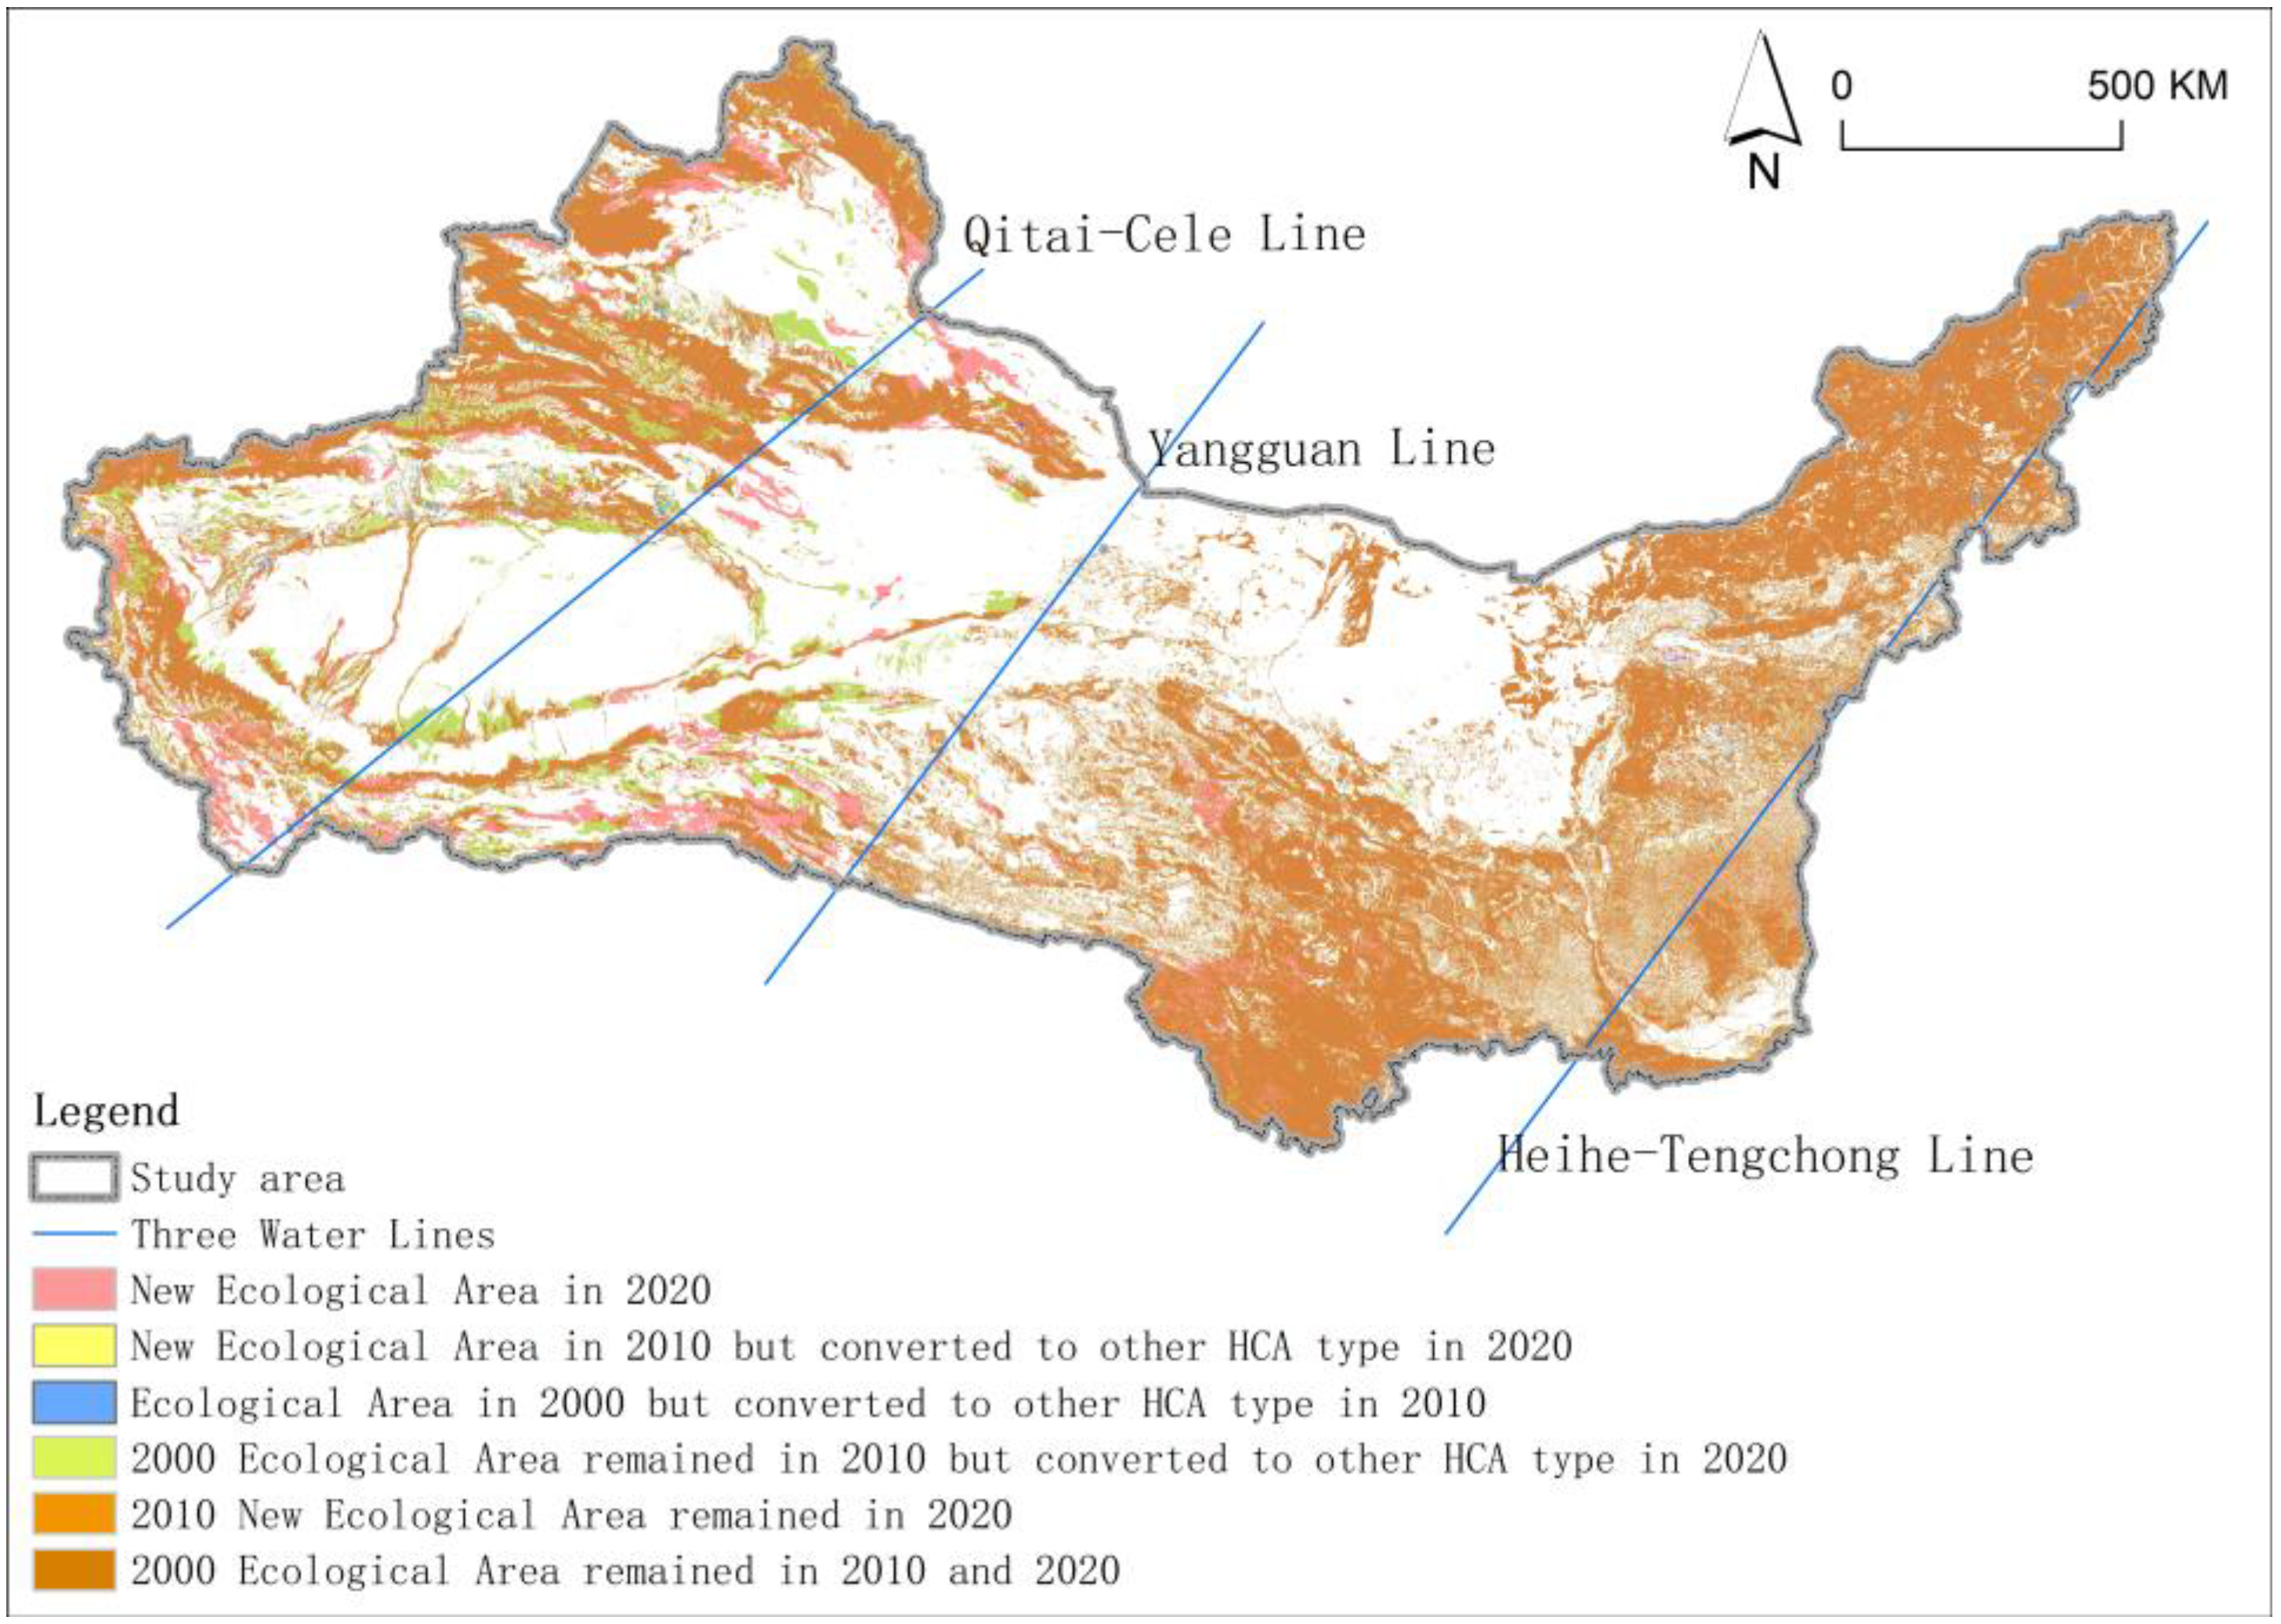
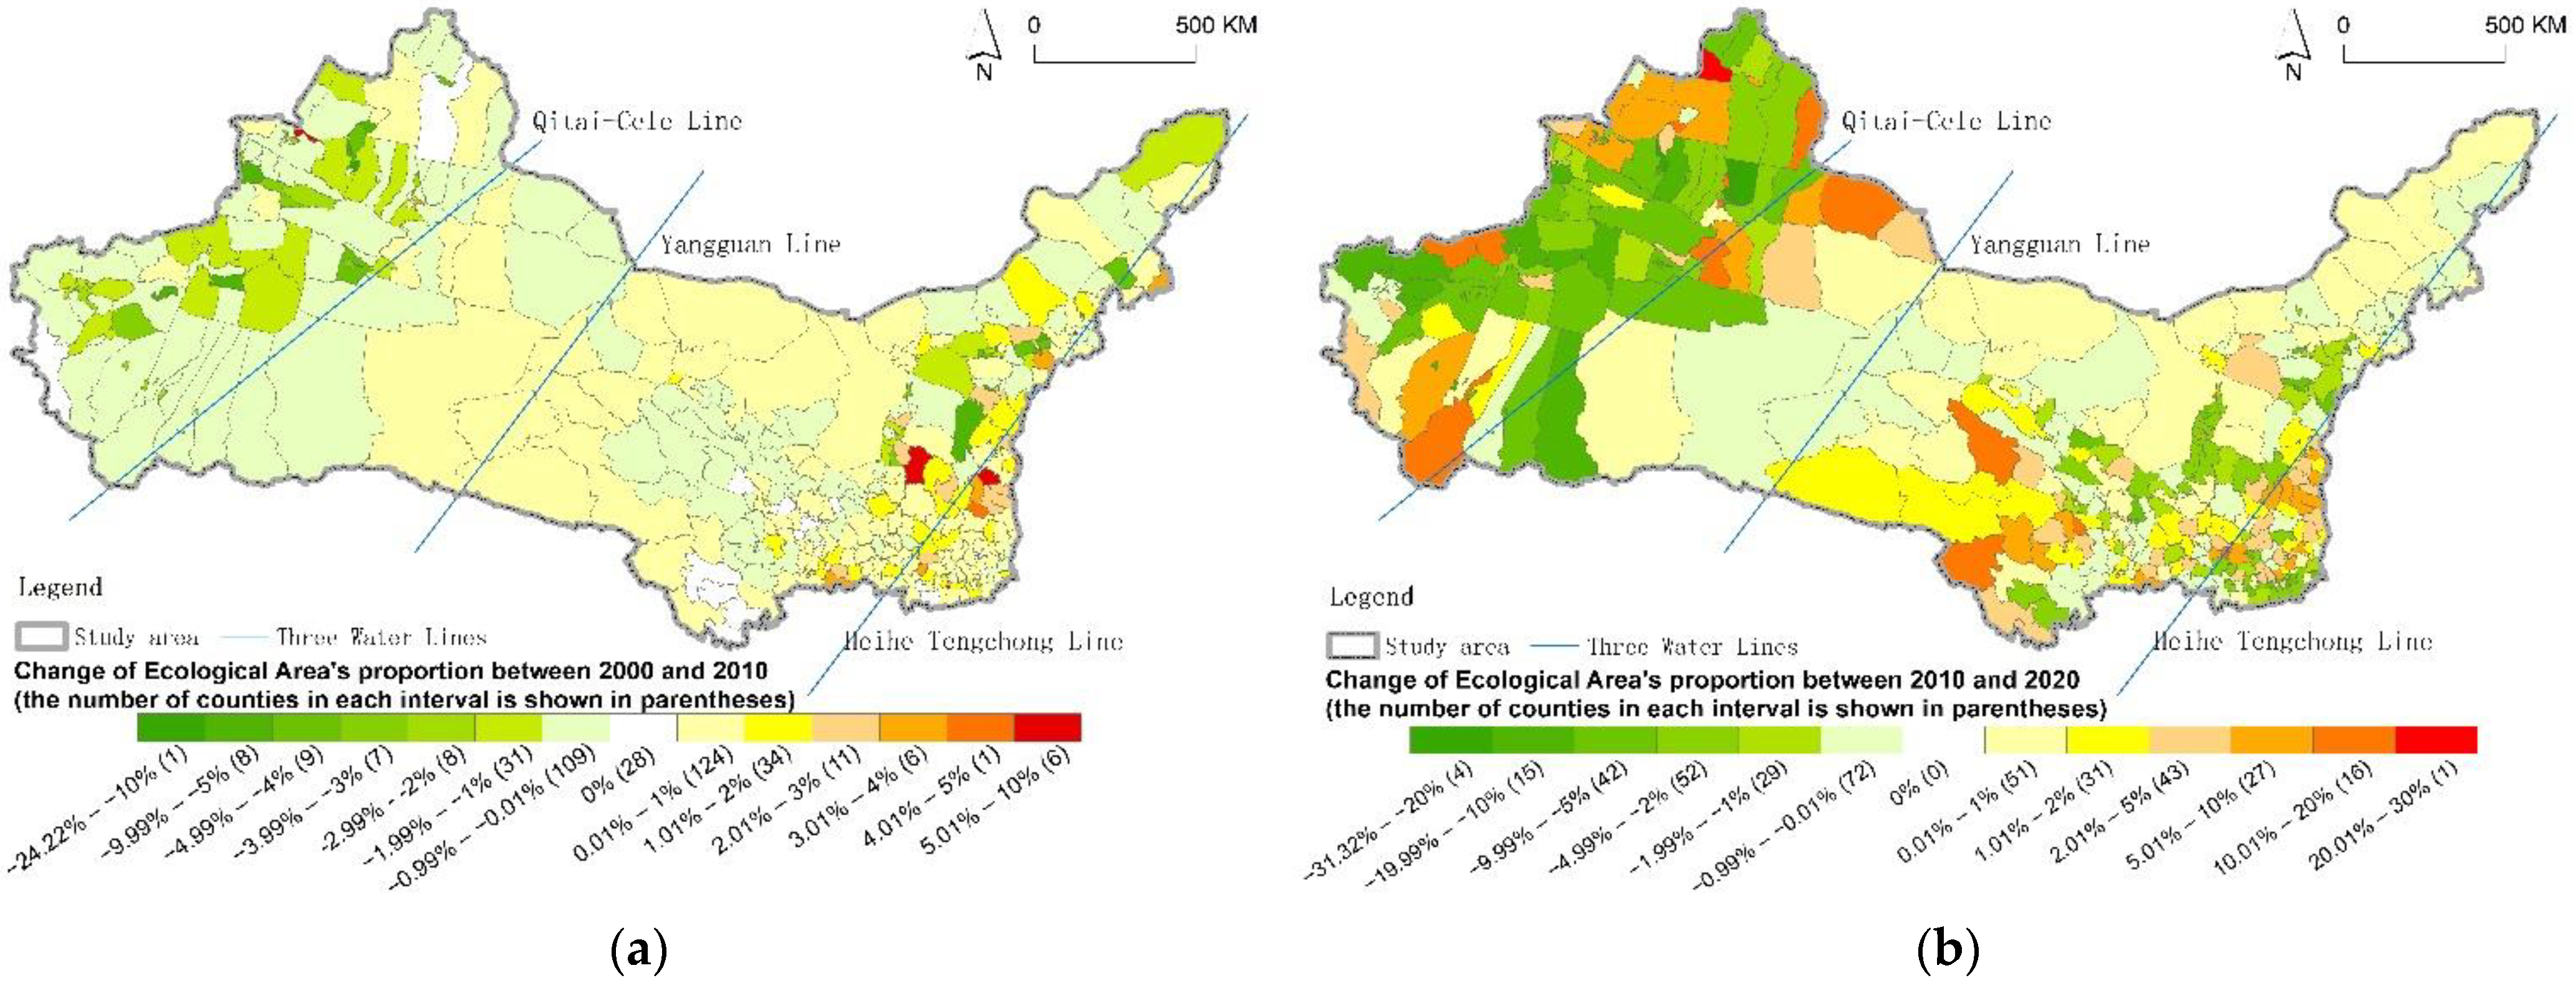
3.1.3. Ecological Area
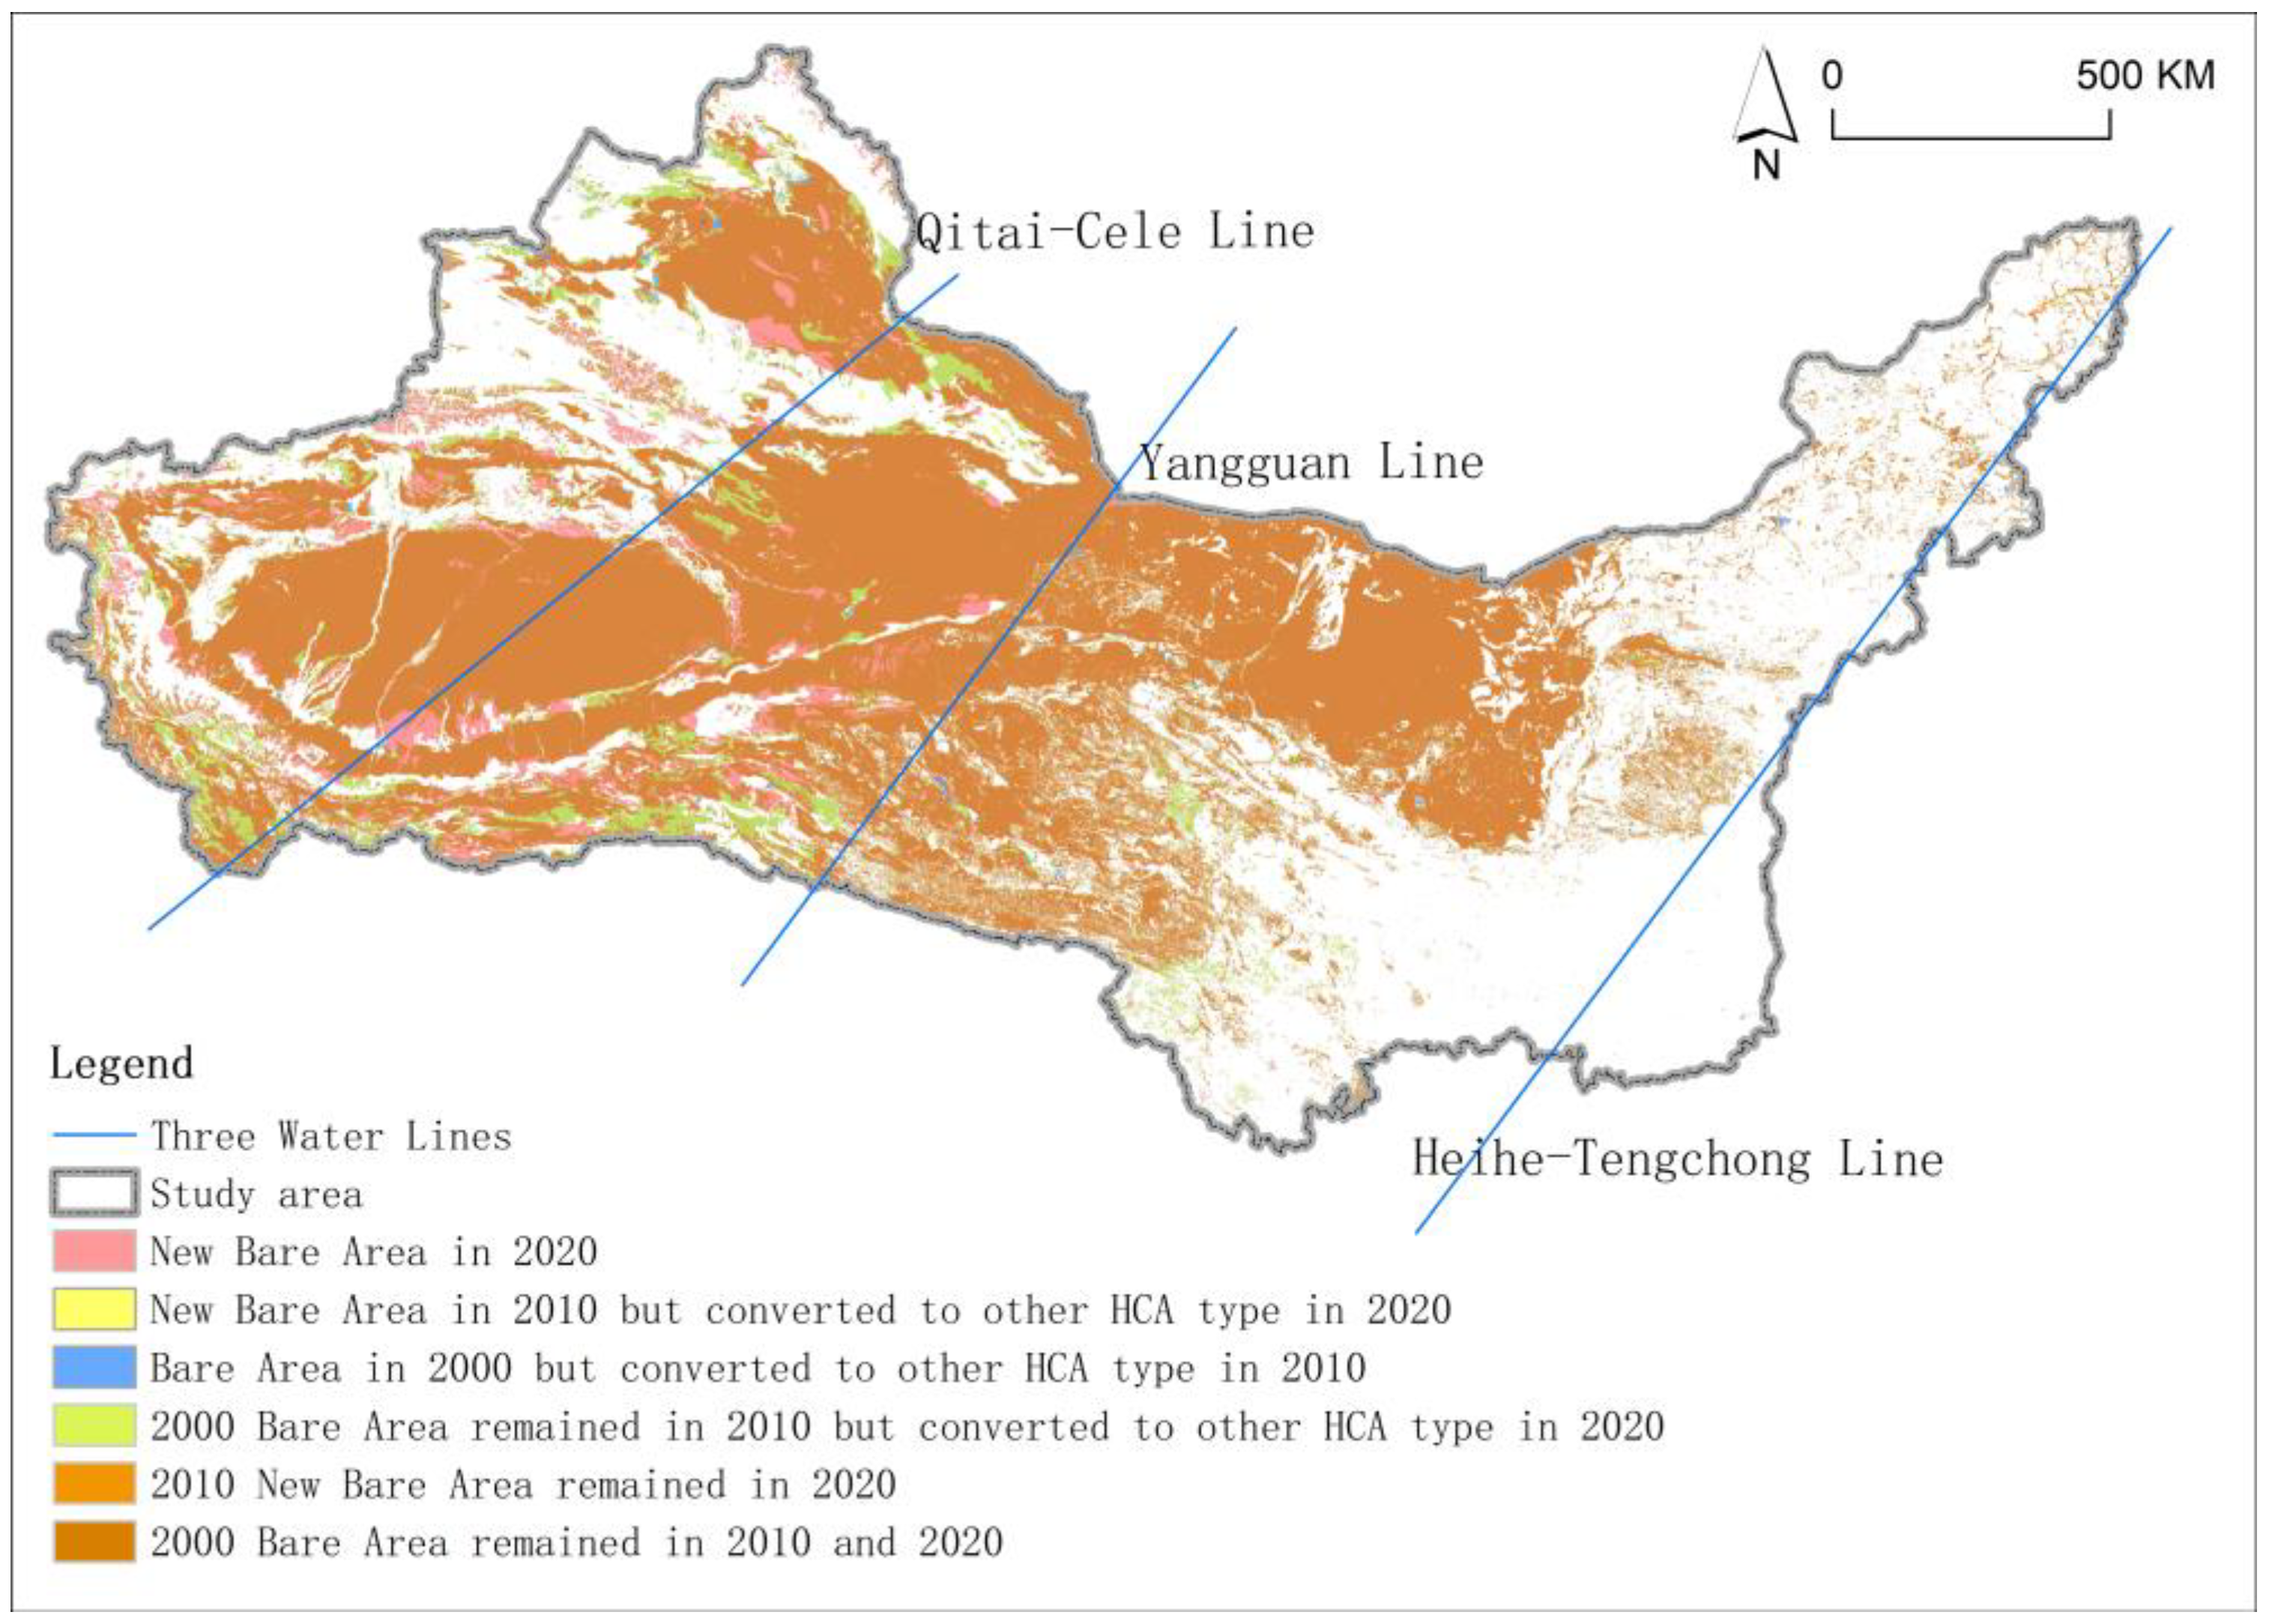
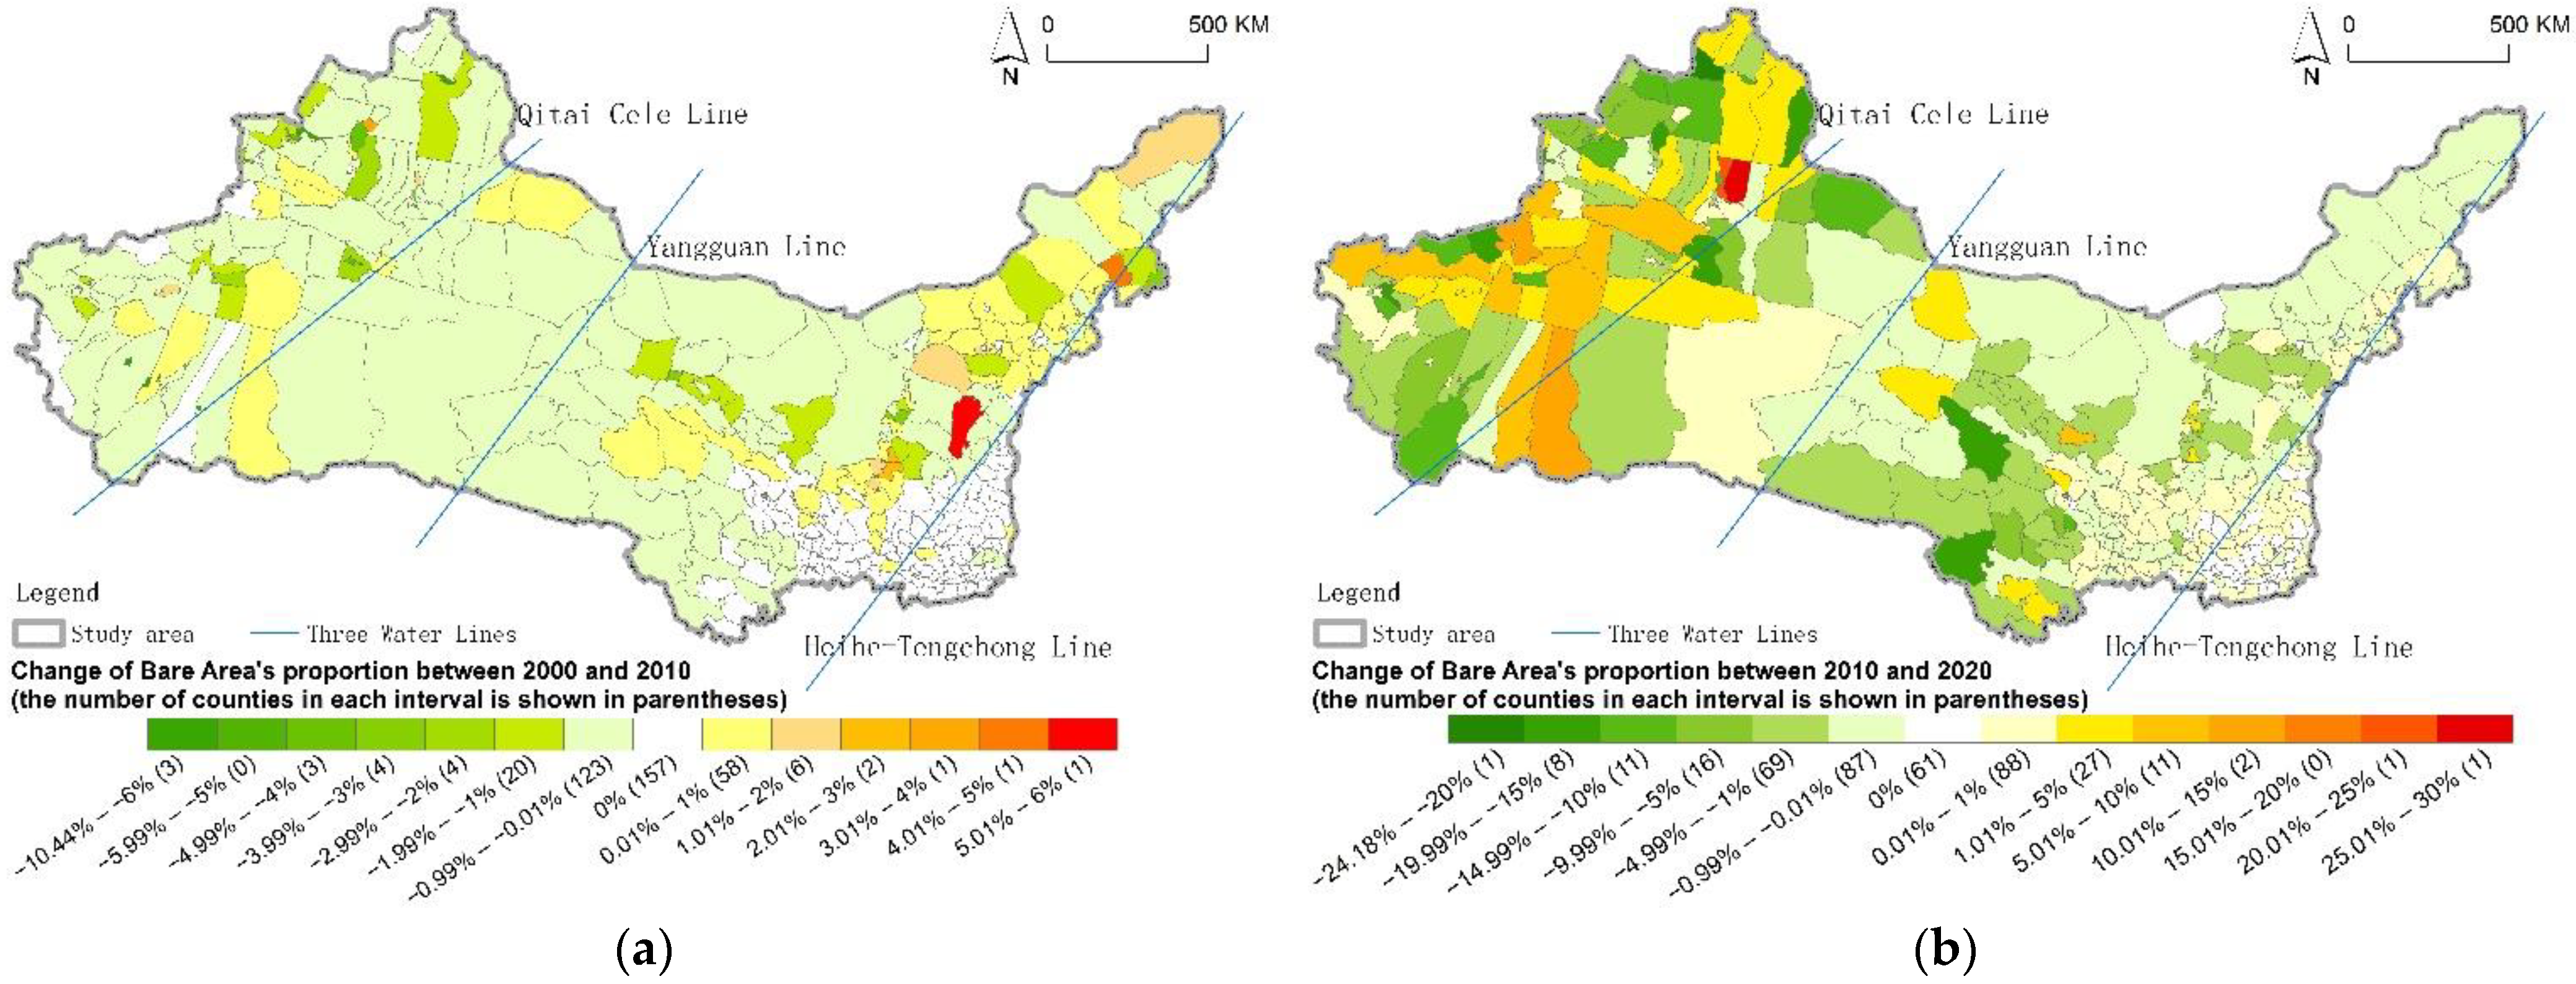
Ecological Area accounts for more than 1,420,000 km2 of the “Three Water Lines” region, and it mainly covers the mountains, rivers, and grasslands in the study area (Figure 9). Between the Heihe-Tengchong Line and the Yangguan Line, Ecological Area is distributed along with the Xilin Gol Grassland in the northeast, the Taihang Mountains in the east, the Qinling Mountains, the Daba Mountains, the Hengduan Mountains in the south, the Bayankla Mountains, and the Qilian Mountains in the west and the Helan Mountains in the middle north. On the west of the Qitai-Cele Line, Ecological Area is distributed along the Altai Mountains, the Irtysh River, the Ili grassland, the Tianshan Mountain, the Tarim River, the Altun Mountains, and the Kunlun Mountains from north to south. The amount and proportion of Ecological Area between the Qital-Cele Line and the Yangguan Line are significantly less than those of other parts of the “Three Water Lines” region, and Ecological Area is strip-distributed along the Qilian Mountains, the Kunlun Mountains, and the Bayankla Mountains.
On a regional scale, Ecological Area continued to shrink from 2000 to 2020, but the reduction rate slowed down. Between 2000 and 2010, Ecological Area across the entire region decreased by 0.3% (4242 km2), and the rate lowered to 0.15% in the next decade. At the county level, compared with 2000–2010, both increment and decrement in Ecological Area increased massively (Figure 10). The greatest increment, which equaled 397 km2 in the first decade increased to 5245 km2 in the next decade. Meanwhile, the most significant reduction rose from 640 to 5737 km2.
The county-level comparison revealed that the spatial significance of the Qitai-Cele Line acted as a dividing line in both decades (Figure 11) that the counties experienced more significant declines in the Ecological Area’s proportion on the western side. Chronologically, the decrement and increment of Ecological Area proportion became much more substantial during the second decade. The greatest increment increased from 9.79% to 23.86%. The number of counties with a more than 5% proportion decline and increment increased by 104 and 38, respectively.

3.1.4. Bare Area

Bare Area is the predominant HCA type in the “Three Water Lines” region with a share of around 49% of the territory. However, the area shrank by 33,104 km2 from 2000 to 2020. Bare Area is unevenly distributed across the study area (Figure 12): the three-quarters of the region to the west has a vast contiguous distribution, while only a small amount of fragmentation could be found in the remaining along the Heihe-Tengchong Line. Although Bare Area accounts for more than 75% of the territory between the Yangguan Line and the Qitai-Cele Line, the total amount reduced by 7933 km2 during the two decades.
On the county level, more than 40% of the counties experienced a reduction of Bare Area during 2000 to 2010 (Figure 13) and the number gradually increased in the next decade to more than 50%. The most significant reduction rose from 396 km2 to as large as 5507 km2. The prominent Bare Area growth of the first decade occurred in the northeast of the study area during the first decade, while in the next decade, it transferred to the western half of the region. The second decade also witnessed larger changes in the proportion of Bare Area, especially in the counties along the Qitai-Cele Line and in the southwest corner of the region (Figure 14). In 2000–2010, 157 counties had an unchanged Bare Area proportion, and 222 counties showed an inconspicuous reduction of less than 5%. The number of counties with a change (including reduction and increment) of more than 5% rocketed from 4 to 51.

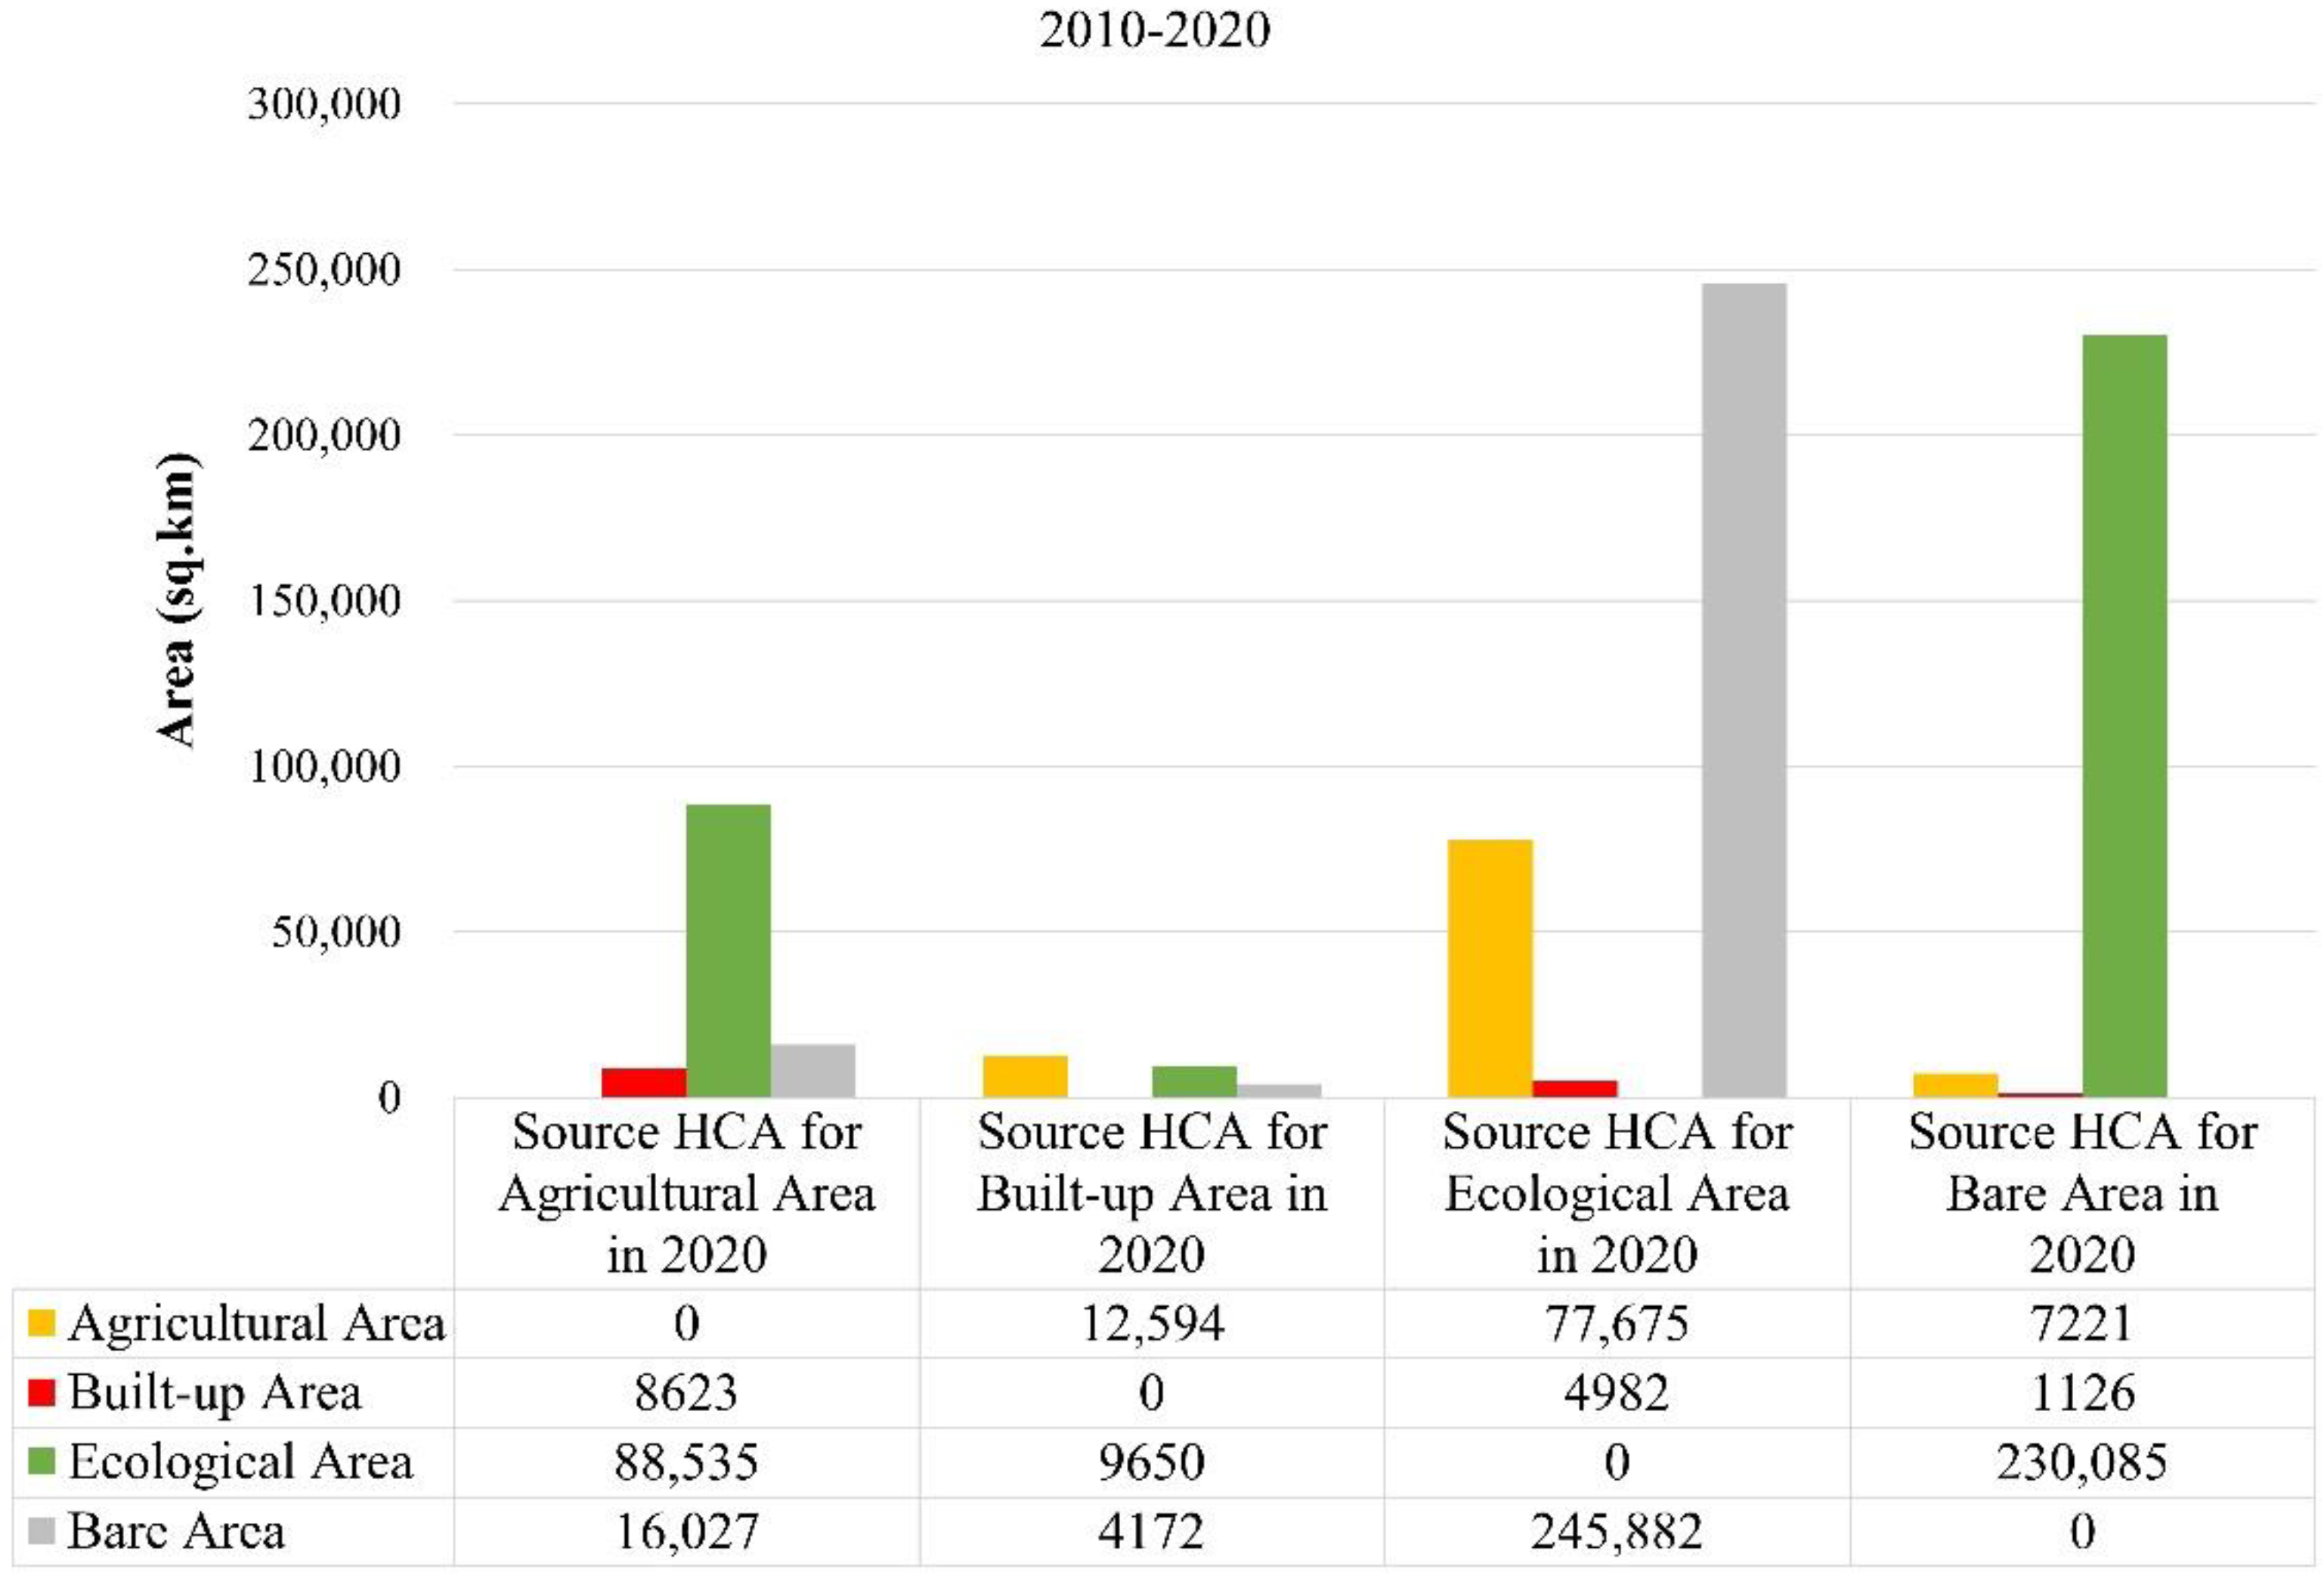
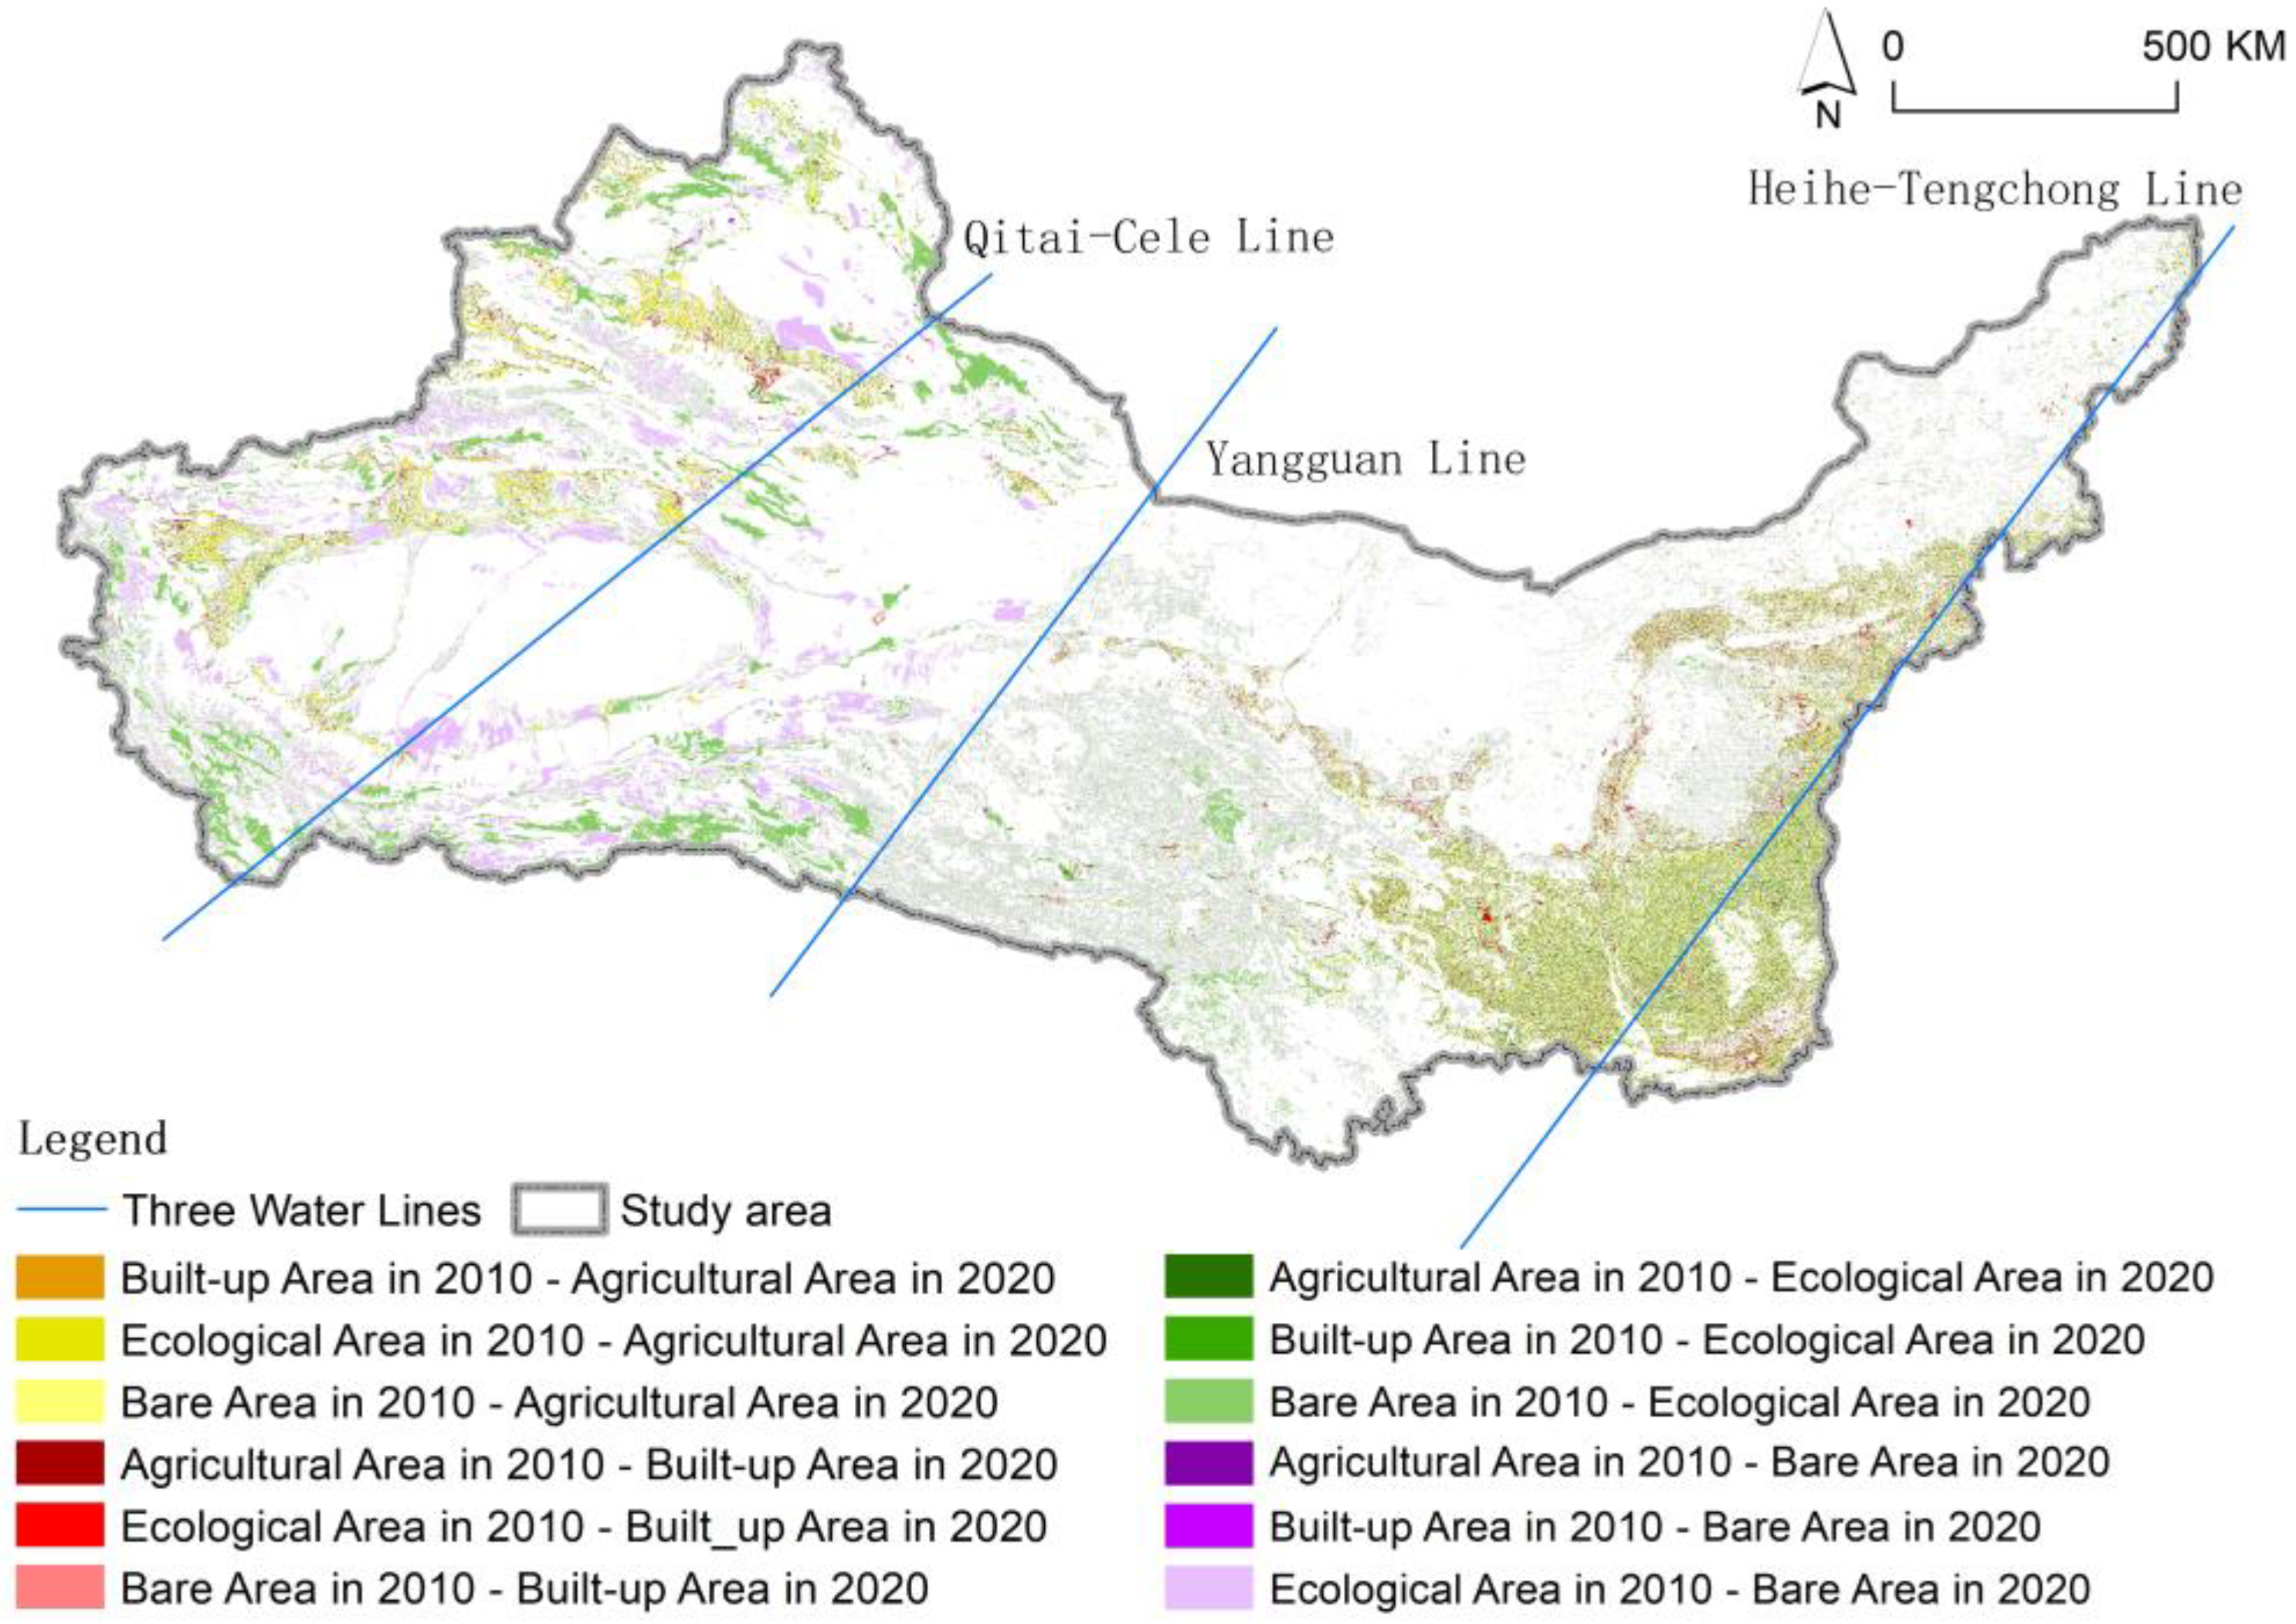
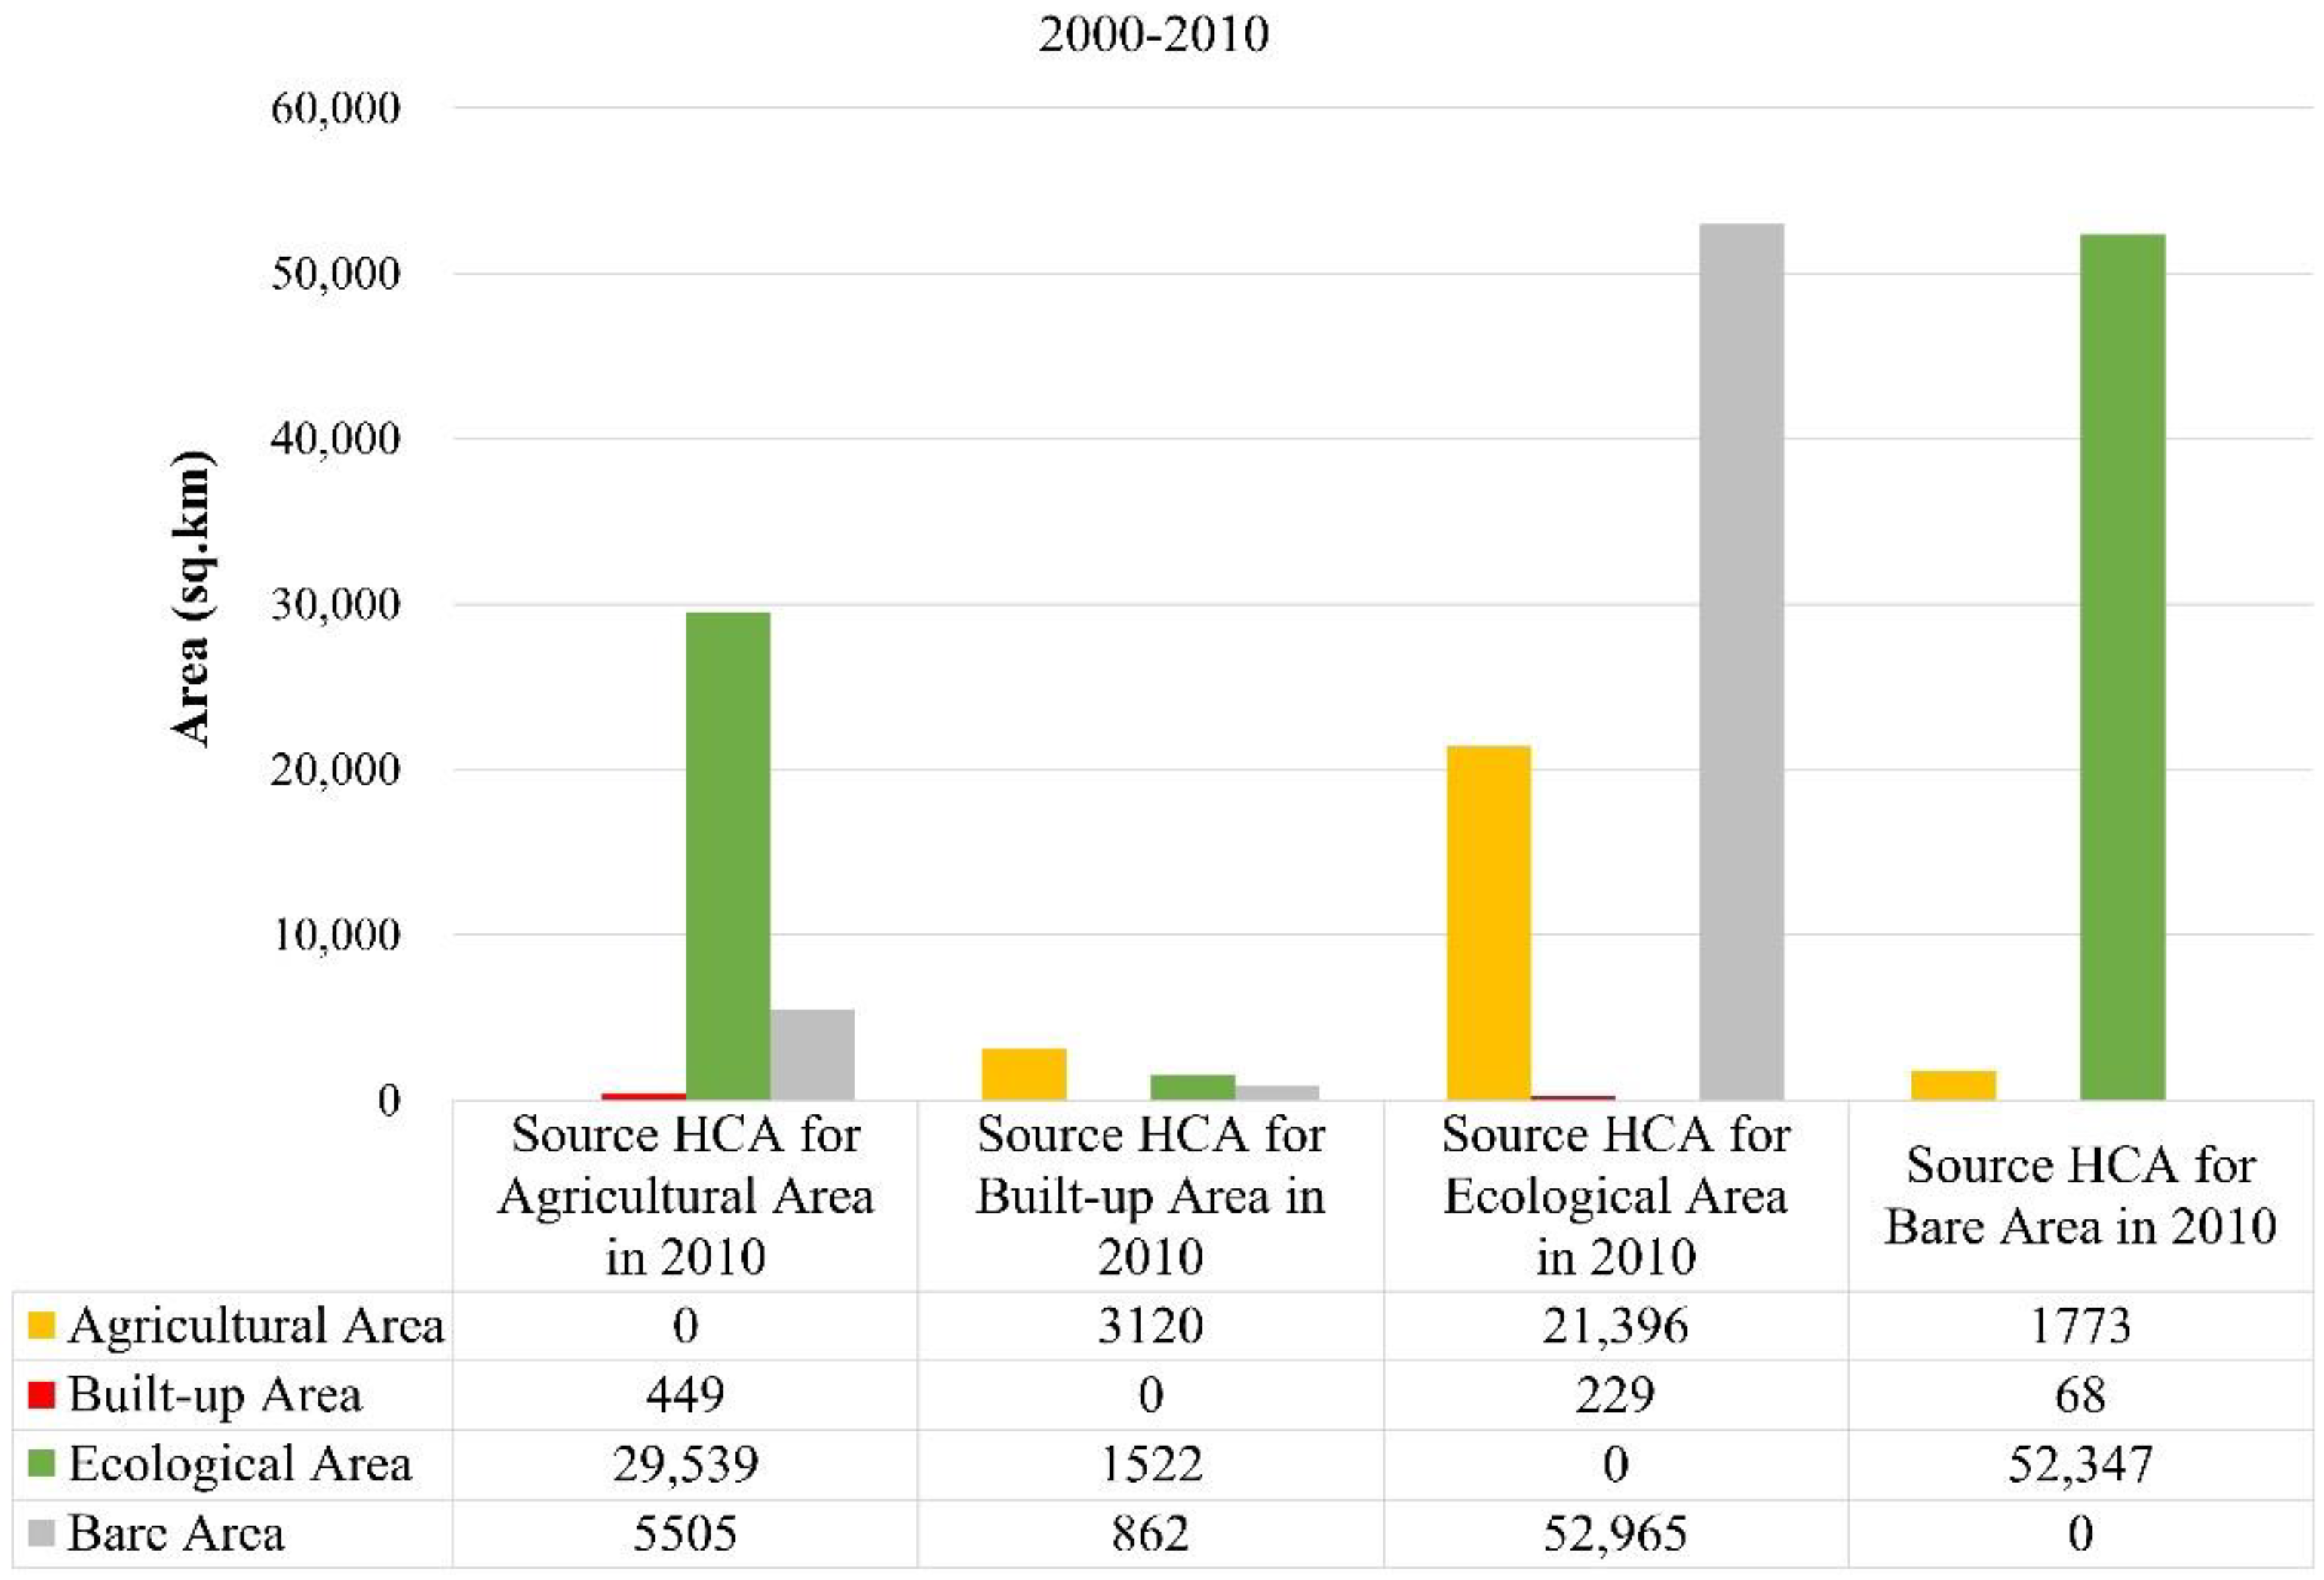
3.2. Transitions between HCA Types in the “Three Water Lines”

Between 2000 and 2010, 169,776 km2 (about 5%) of territory experienced transitions of HCA types, with the mutual transitions between Ecological Area and Bare Area being the most significant (105,312 km2) (Figure 15 and Table 3). Additionally, there was a considerable mutual transition between Ecological Area and Agricultural Area. Approximately 5505 km2 of territory had been developed into Built-up Area, most of which are Agricultural and Ecological Areas. The two source types accounted for over 84% of newly-developed Built-up Area, with Agricultural Area contributing nearly twice as much territory as Ecological Area.
Compared with the previous decade, HCA-type transitions more than quadrupled between 2010 and 2020, but the transition source structure was essentially intact (Figure 16 and Table 4). Ecological Area continued to be the primary source of transitions. Despite a slight drop in share, it still made up 46.46% of the sources, with 328,270 km2 being transformed into other HCA types. Meanwhile, Bare Area changing to Ecological Area remained the predominant transition during 2010–2020 with a slight growth. By contrast, the proportion of the transition from Ecological Area to Agricultural Area fell by 5%.
From a spatial perspective, in the period 2000–2020, the main transitions that occurred to the west of the Qitai-Cele Line were those from Ecological and Bare Areas to Agricultural Area (Figure 17 and Figure 18). Those transitions took place mainly along the Irtysh River, north of the Tianshan Mountains, the Ili River Valley, the Tarim River, and the Yerqiang River (from south to north). In addition, there was a substantial mutual transition between Bare Area and Ecological Area in the center and the south of the “Three Water Lines” region.

3.3. Socioeconomic Factors Influencing the HCA Changes in the “Three Water Lines” Region

A total of 24 binary linear regression analyses were performed to explore the six socioeconomic indicators’ role in changing the coverage of four HCA types. However, only eight models’ independent variables were found to have significant impacts on the dependent variables (p-value ≥ 0.05) as shown in Table 5. The eight models all passed the tests on nonlinearity and nonconstant error of variance (using the scatterplot of the standardized predicted value against the standardized residuals) and the tests on normality of residuals (using Q-Q plot). Among the six socioeconomic indicators, the value-added per capita of the primary sector is the most influential one related to the three HCA types’ area changes (Agricultural Area, Built-up Area, and Ecological Area). In contrast, the indicator population density (Variable a) shows no significant influence on the area change of any HCA type.
The change in Agricultural Area is influenced by three socioeconomic variables, which are population urbanization rate, the value-added per capita of the primary sector and the value-added per capita of the secondary sector, of which the value-added of the primary sector has the most significant impact (positively), followed by grain output per square kilometer (negatively). The three variables, along with GDP per capita, play a positive role in changing Built-up Area. It is worth noting that the value-added per capita of the primary sector is the most influential one among the four contributing factors with a positive effect, while the population urbanization rate has minimal influence. Compared with Agricultural Area and Built-up Area, Ecological Area changes are less related to socioeconomic factors. The value-added per capita of the primary sector is the only factor influencing its change, that the higher the added value of primary industry per capita, the smaller the increment in Ecological Area. By contrast, the change in Bare Area is impervious to socioeconomic factors, with the p-values of all six variables being larger than 0.005.
Stepwise multiple linear regressions indicated that several socioeconomic factors are jointly responsible for the changes of some HCA types. The detailed results are shown in Table 6 and all models passed the test on multicollinearity with the final variables’ VIF < 10. From 2000 to 2020, the change in Agricultural Area was influenced collectively by the development and interactions between primary industry, secondary industry, and grain production. The value-added per capita of the primary sector is the principal component of this joint force with a positive contribution. Conversely, both secondary industry and grain production play a negative role of roughly equal magnitude.
On the other hand, a combination of GDP per capita and the value-added per capita of the primary sector positively propelled the changes in Built-up Area, in which GDP per capita plays a more significant part. The result of the multiple regression for Ecological Area is the same as that of binary regression, where the value-added per capita of the primary sector is the only factor affecting its changes. There is neither a single factor nor the combined force of multiple factors that correlate with the change in Bare Area.

4. Discussion

The results present the distinct HCA spatial features of the inland and arid “Three Water Lines” Region including the vastness of Bare Area and Ecological Area, the contiguous distribution of Agricultural Area in flat terrains with favorable temperatures and water supplies, and the supreme concentration of Built-up Area. The four HCA types have undergone changes over the past two decades. Although the changes in total area and proportion of each HCA type are insignificant, the transitions between HCA types are substantial. Previous studies have shown not only changes in the overall structure of the land use and cover (LUCC) system but also that the LULC transitions affects ecosystem [42,43], biodiversity [44], morphology [45] and the Earth surface physical-chemical processes [46,47]. Therefore, future research is expected to explore the ecological consequences and the spillover effects of HCA changes on the regional human-Earth system.
Contrary to the findings of previous studies that the alterations of Earth’s surface are often accompanied by socioeconomic development [48], population growth [49], and urbanization [50], we found that HCA changes did not correlate well with those anthropogenic dynamics in the “Three Water Lines” region. Despite the effect of sample size on the analysis results, one reason for such results could be that the region suffers the natural disadvantages of limited water resources and a fragile environment as well as long-standing socioeconomic problems including slow economic development, a backward industrial structure, and continuous population loss [51,52,53].
Besides, national policies and their constant adjustments have to be verified to play a leading role during the Earth’s surface alteration process in underdeveloped areas of China [49,54]. The industries in the studied region are developing and mainly rely on the support of national policies introducing enterprises from developed regions into southeastern China [55], rather than spontaneous industry upgrading. The increase in population urbanization rate is primarily due to the government’s changing of the county-level administrative units’ identity from rural to urban, or the simultaneous reduction of total and rural populations, rather than being driven by true-sense urban development [56,57]. In addition, the expansion of Built-up Area and the reduction of Bare Area are mostly results of the government’s investment in promoting the region’s development, rather than an essential increase in demand for built-up areas. However, the impact of policies on changes in HCA was not considered in this study, and further such investigations are expected in future research.
Additionally, it is important to highlight the role of the scale of measuring human activities. Previous research has demonstrated the impacts of specific local human activities on LUCC and the environment, i.e., construction of accommodations and transportation facilities [58], and abandonment of croplands. By contrast, human activities are represented in a broader context by statistical data in this study. Thus, future investigations could continue to explore the variation of the relationship between HCA changes and human activities on finer scales.

5. Conclusions

This research has shown that the new concept of Human Critical Area provides an efficient and intuitive approach to identify regional-scale Earth’s surface dynamics caused by diverse human activities. The overall HCA spatial patterns across the “Three Water Lines” changed insignificantly during the past two decades, however, it is noteworthy that Bare Area kept decreasing while Built-up Area expanded by 1.75 times. Substantial transitions were detected, especially between Ecological Area and Bare Area, and between Agricultural Area and Ecological Area. At the county level, the HCA changes were not susceptible to socio-economic dynamics in general, inferring a strong impact of national development strategies and local management over the Earth’s surface changes in this region.
This study is expected to support sustainable regional planning on rational arrangement of human activities over the Earth’s surface in a vulnerable region of arid climate, fragile environment, yet socioeconomic significance.

Author Contributions

Conceptualization, X.C., M.D., Z.C., P.L. and X.D.; methodology, Z.C.; validation, T.Z., X.H., P.L. and X.D.; formal analysis, Z.C. and Q.R.; investigation, Z.C.; resources, T.Z., P.L. and X.D.; data curation, Z.C., Q.R. and T.Z.; writing—original draft preparation, Z.C., Q.R. and Z.K.; writing—review and editing, Z.C.; visualization, Z.C. and Q.R.; supervision, X.C. and M.D.; project administration, M.D.; funding acquisition, X.C. All authors have read and agreed to the published version of the manuscript.

Funding

This research was funded by Key Program of National Natural Science Foundation of China, grant number 41831284.

Institutional Review Board Statement

Not applicable.

Informed Consent Statement

Not applicable.

Data Availability Statement

Publicly available datasets were analyzed in this study. Remote Sensing Monitoring Dataset 2000 could be found here: [https://www.resdc.cn/data.aspx?DATAID=97], accessed on 18 April 2021. Remote Sensing Monitoring Dataset 2010 could be found here: [https://www.resdc.cn/data.aspx?DATAID=99], accessed on 19 April 2021. Remote Sensing Monitoring Dataset 2020 could be found here: [https://www.resdc.cn/data.aspx?DATAID=335], accessed on 16 April 2021. GANSU STATISTICAL YEARBOOK 2001, 2011 and 2021 could be found here: [http://tjj.gansu.gov.cn/tjj/c117468/info_disp.shtml], accessed on 20 June 2021. NINGXIA STATISTICAL YEARBOOK 2001, 2011 and 2021 could be found here: [http://www.nx.gov.cn/zwgk/zfxxgk/fdzdgknr/tjxx_40901/tjnj/], accessed on 20 June 2021. INNER MONGOLIA STATISTICAL YEARBOOK 2001, 2011 and 2021 could be found here: [http://tj.nmg.gov.cn/tjyw/jpsj/], accessed on 20 June 2021. QINGHAI STATISTICAL YEARBOOK 2001, 2001 and 2021 could be found here: [http://tjj.qinghai.gov.cn/tjData/qhtjnj/], accessed on 20 June 2021. XINJIANG STATISTICAL YEARBOOK 2001, 2011, and 2021 could be found here: [http://tjj.xinjiang.gov.cn/tjj/zhhvgh/list_nj1.shtml], accessed on 20 June 2021. SHAANXI STATISTICAL YEARBOOK 2001, 2011 and 2021 could be found here: [http://tjj.shaanxi.gov.cn/tjsj/ndsj/tjnj/index.html], accessed on 20 June 2021. Restrictions apply to the availability of these data. CHINA STATISTICAL YEARBOOK (COUNTY-LEVEL) and SHAANXI REGIONAL STATISTICAL YEARBOOK were obtained from [China National Knowledge Infrastructure (CNKI)] and are available [from https://data.cnki.net/yearbook/Navi] with the permission of [CNKI], accessed on 20 June 2021.

Acknowledgments

We would like to thank the National Natural Science Foundation of China for supporting this research. We appreciate Xinliang Xu and Yaqing Zhang for providing the valuable aridity data in Figure 1. We would also want to thank the Resource and Environment Science and Data Center, Institute of Geographic Sciences and Natural Resources Research, Chinese Academy of Sciences, for providing the Land Use/Cover Remote Sensing Monitoring Datasets 2000, 2010, and 2020.

Conflicts of Interest

The authors declare no conflict of interest.

References

  1. Biermann, F.; Bai, X.M.; Bondre, N.; Broadgate, W.; Chen, C.T.A.; Dube, O.P.; Erisman, J.W.; Glaser, M.; van der Hel, S.; Lemos, M.C.; et al. Down to Earth: Contextualizing the Anthropocene. Glob. Environ. Chang.-Hum. Policy Dimens. 2016, 39, 341–350. [Google Scholar] [CrossRef] [Green Version]
  2. Hopkin, J. Progress in geography. Geography 2011, 96, 116–123. [Google Scholar] [CrossRef]
  3. Murphy, A.B. Geography’s Crosscutting Themes: Golden Anniversary Reflections on “The Four Traditions of Geography”. J. Geogr. 2014, 113, 181–188. [Google Scholar] [CrossRef]
  4. Hanson, S. Who are “we”? An important question for geography’s future. Ann. Assoc. Am. Geogr. 2004, 94, 715–722. [Google Scholar]
  5. Barbante, C.; Spolaor, A.; Cairns, W.R.L.; Boutron, C. Man’s footprint on the Arctic environment as revealed by analysis of ice and snow. Earth-Sci. Rev. 2017, 168, 218–231. [Google Scholar] [CrossRef]
  6. Iagnemma, K.; Kang, S.W.; Shibly, H.; Dubowsky, S. Online terrain parameter estimation for wheeled mobile robots with application to planetary rovers. IEEE Trans. Robot. Autom. 2004, 20, 921–927. [Google Scholar] [CrossRef] [Green Version]
  7. Ellis, E.C.; Kaplan, J.O.; Fuller, D.Q.; Vavrus, S.; Goldewijk, K.K.; Verburg, P.H. Used planet: A global history. Proc. Natl. Acad. Sci. USA 2013, 110, 7978–7985. [Google Scholar] [CrossRef] [Green Version]
  8. Ellis, E.C. Anthropogenic transformation of the terrestrial biosphere. Philos. Trans. R. Soc. A Math. Phys. Eng. Sci. 2011, 369, 1010–1035. [Google Scholar] [CrossRef]
  9. Steffen, W.; Persson, A.; Deutsch, L.; Zalasiewicz, J.; Williams, M.; Richardson, K.; Crumley, C.; Crutzen, P.; Folke, C.; Gordon, L.; et al. The Anthropocene: From Global Change to Planetary Stewardship. Ambio 2011, 40, 739–761. [Google Scholar] [CrossRef] [Green Version]
  10. Dirzo, R.; Young, H.S.; Galetti, M.; Ceballos, G.; Isaac, N.J.B.; Collen, B. Defaunation in the Anthropocene. Science 2014, 345, 401–406. [Google Scholar] [CrossRef]
  11. Newbold, T.; Hudson, L.N.; Hill, S.L.L.; Contu, S.; Lysenko, I.; Senior, R.A.; Borger, L.; Bennett, D.J.; Choimes, A.; Collen, B.; et al. Global effects of land use on local terrestrial biodiversity. Nature 2015, 520, 45–50. [Google Scholar] [CrossRef] [PubMed] [Green Version]
  12. Opitz, T.; Bonneu, F.; Gabriel, E. Point-process based Bayesian modeling of space-time structures of forest fire occurrences in Mediterranean France. Spat. Stat. 2020, 40, 100429. [Google Scholar] [CrossRef] [Green Version]
  13. Yin, H.F.; Li, C.G. Human impact on floods and flood disasters on the Yangtze River. Geomorphology 2001, 41, 105–109. [Google Scholar] [CrossRef]
  14. Liu, Y. Modern Human-Earth Relationship and Human-Earth System Science. Sci. Geogr. Sin. 2020, 40, 1221–1234. [Google Scholar] [CrossRef]
  15. Lewis, S.L.; Maslin, M.A. Defining the Anthropocene. Nature 2015, 519, 171–180. [Google Scholar] [CrossRef]
  16. Ellis, E.; Maslin, M.; Boivin, N.; Bauer, A. Involve social scientists in defining the Anthropocene. Nature 2016, 540, 192–193. [Google Scholar] [CrossRef]
  17. Hamilton, C. Define the Anthropocene in terms of the whole Earth. Nature 2016, 536, 251. [Google Scholar] [CrossRef] [Green Version]
  18. Minor, J.; Pearl, J.K.; Barnes, M.L.; Colella, T.R.; Murphy, P.C.; Mann, S.; Barron-Gafford, G.A. Critical Zone Science in the Anthropocene: Opportunities for biogeographic and ecological theory and praxis to drive earth science integration. Prog. Phys. Geogr.-Earth Environ. 2020, 44, 50–69. [Google Scholar] [CrossRef]
  19. Lin, H. Earth’s Critical Zone and hydropedology: Concepts, characteristics, and advances. Hydrol. Earth Syst. Sci. 2010, 14, 25–45. [Google Scholar] [CrossRef] [Green Version]
  20. Richter, D.B.; Billings, S.A. ‘One physical system’: Tansley’s ecosystem as Earth’s critical zone. New Phytol. 2015, 206, 900–912. [Google Scholar] [CrossRef]
  21. Zhang, G.; Song, X.; Wu, K. Classification Methods of Earth’s Critical Zones and Case Study of China. Sci. Sin. 2021, 51, 1681–1692. [Google Scholar]
  22. Brantley, S.L.; Goldhaber, M.B.; Ragnarsdottir, K.V. Crossing disciplines and scales to understand the Critical Zone. Elements 2007, 3, 307–314. [Google Scholar] [CrossRef]
  23. Lin, H.; Hopmans, J.W.; Richter, D.d. Interdisciplinary Sciences in a Global Network of Critical Zone Observatories. Vadose Zone J. 2011, 10, 781–785. [Google Scholar] [CrossRef]
  24. Arenes, A. Inside the Critical Zone. Geohumanities 2021, 7, 131–147. [Google Scholar] [CrossRef]
  25. Cao, X. The Scientific Logic and Research Trends of Human Critical Area. Sci. Geogr. Sin. 2022, 42, 31–42. [Google Scholar] [CrossRef]
  26. Kuang, W.; Chen, L.; Liu, J.; Xiang, W.; Chi, W.; Lu, D.; Yang, T.; Pan, T.; Liu, A. Remote sensing-based artificial surface cover classification in Asia and spatial pattern analysis. Sci. China-Earth Sci. 2016, 59, 1720–1737. [Google Scholar] [CrossRef]
  27. Tarolli, P.; Sofia, G. Human topographic signatures and derived geomorphic processes across landscapes. Geomorphology 2016, 255, 140–161. [Google Scholar] [CrossRef] [Green Version]
  28. Bi, W.; Dang, X.; Ma, H.; Deng, M.; Li, P.; Cao, X.; Shi, P. Evaluation of arable land suitability and potential from the perspective of Food Crop Production Strategy based on Farmland Management in northwest China. Trans. Chin. Soc. Agric. Eng. 2021, 37, 235–243. [Google Scholar]
  29. Deng, M. “ThreeWater Lines” strategy: Its spatial patterns and effects on water resources allocation in northwest China. Acta Geogr. Sin. 2018, 73, 1189–1203. [Google Scholar]
  30. Li, J.; Lu, D.; Xu, C.; Li, Y.; Chen, M. Spatial heterogeneity and its changes of population on the two sides of Hu Line. Acta Geogr. Sin. 2017, 72, 148–160. [Google Scholar]
  31. Xu, X.; Zhang, Y. China Meteorological Background Dataset. 2017. Available online: https://www.resdc.cn/DOI/doi.aspx?DOIid=39 (accessed on 4 December 2021). [CrossRef]
  32. Ministry of Natural Resources of the People’s Republic of China. Map of the People’s Republic of China; Sinomap Press: Beijing, China, 2019. [Google Scholar]
  33. Rural Socioeconomic Investigation Department of National Bureau of Statistics of the People’s Republic of China. China Statistical Yearbook (County-Level); China Statistics Press and Beijing Info Press: Beijing, China, 2021. [Google Scholar]
  34. Gansu Provincial Bureau of Statistics; Gansu Survey Office of the National Bureau of Statistics of the People’s Republic of China. Gansu Development Yearbook; China Statistics Press and Beijing Info Press: Beijing, China, 2021. [Google Scholar]
  35. Statistics Bureau of Ningxia Hui Autonomous Region; Ningxia Survey Office of the National Bureau of Statistics of the People’s Republic of China. Ningxia Statistical Yearbook; China Statistics Press and Beijing Info Press: Beijing, China, 2021. [Google Scholar]
  36. Statistics, I.M.A.R.B.O. Inner Mongolia Statistical Yearbook; China Statistics Press and Beijing Info Press: Beijing, China, 2021. [Google Scholar]
  37. Qinghai Provincial Bureau of Statistics; Qinghai Survey Office of the National Bureau of Statistics of the People’s Republic of China. Qinghai Statistical Yearbook; China Statistics Press and Beijing Info Press: Beijing, China, 2021. [Google Scholar]
  38. Statistics Bureau of Xinjiang Uygur Autonomous Region; Xinjiang Survey Office of the National Bureau of Statistics of the People’s Republic of China. Xinjiang Statistical Yearbook; China Statistics Press and Beijing Info Press: Beijing, China, 2021. [Google Scholar]
  39. Shaanxi Provincial Bureau of Statistics; Shaanxi Survey Office of the National Bureau of Statistics of the People’s Republic of China. Shaanxi Statistical Yearbook; China Statistics Press and Beijing Info Press: Beijing, China, 2021. [Google Scholar]
  40. Shaanxi Provincial Bureau of Statistics. Shaanxi Regional Statistical Yearbook; China Statistics Press: Beijing, China, 2018. [Google Scholar]
  41. Zhang, B.; Zhang, Q.; Feng, C.; Feng, Q.; Zhang, S. Understanding Land Use and Land Cover Dynamics from 1976 to 2014 in Yellow River Delta. Land 2017, 6, 20. [Google Scholar] [CrossRef] [Green Version]
  42. Ibarra-Bonilla, J.S.; Villarreal-Guerrero, F.; Prieto-Amparán, J.A.; Santellano-Estrada, E.; Pinedo-Alvarez, A. Characterizing the impact of Land-Use/Land-Cover changes on a Temperate Forest using the Markov model. Egypt. J. Remote Sens. Space Sci. 2021, 24, 1013–1022. [Google Scholar] [CrossRef]
  43. Fang, Z.; Ding, T.; Chen, J.; Xue, S.; Zhou, Q.; Wang, Y.; Wang, Y.; Huang, Z.; Yang, S. Impacts of land use/land cover changes on ecosystem services in ecologically fragile regions. Sci. Total Environ. 2022, 831, 154967. [Google Scholar] [CrossRef] [PubMed]
  44. Abera, W.; Tamene, L.; Kassawmar, T.; Mulatu, K.; Kassa, H.; Verchot, L.; Quintero, M. Impacts of land use and land cover dynamics on ecosystem services in the Yayo coffee forest biosphere reserve, southwestern Ethiopia. Ecosyst. Serv. 2021, 50, 101338. [Google Scholar] [CrossRef]
  45. Kang, C.S.; Kanniah, K.D. Land use and land cover change and its impact on river morphology in Johor River Basin, Malaysia. J. Hydrol. Reg. Stud. 2022, 41, 101072. [Google Scholar] [CrossRef]
  46. Caballero, C.B.; Ruhoff, A.; Biggs, T. Land use and land cover changes and their impacts on surface-atmosphere interactions in Brazil: A systematic review. Sci. Total Environ. 2022, 808, 152134. [Google Scholar] [CrossRef]
  47. Odongo, V.O.; van Oel, P.R.; van der Tol, C.; Su, Z. Impact of land use and land cover transitions and climate on evapotranspiration in the Lake Naivasha Basin, Kenya. Sci. Total Environ. 2019, 682, 19–30. [Google Scholar] [CrossRef]
  48. John, R.; Chen, J.Q.; Lu, N.; Wilske, B. Land cover/land use change in semi-arid Inner Mongolia: 1992–2004. Environ. Res. Lett. 2009, 4, 045010. [Google Scholar] [CrossRef]
  49. Chen, L.; Wang, Q. Spatio-temporal evolution and influencing factors of land use in Tibetan region: 1995–2025. Earth Sci. Inform. 2021, 14, 1821–1832. [Google Scholar] [CrossRef]
  50. Murtugudde, R. Regional Earth System prediction: A decision-making tool for sustainability? Curr. Opin. Environ. Sustain. 2009, 1, 37–45. [Google Scholar] [CrossRef]
  51. Gao, Y.; Zhang, Y.; Yang, M. 20 Years of China’s Western Development: A Comparison of the Northwest Regions and Southwest Regions. Reg. Econ. Rev. 2020, 5, 36–51. [Google Scholar] [CrossRef]
  52. Li, T.; Chen, X.; Rui, Y.; Yang, K. Strategy and Path of Cooperative Promotion of Ecological Protection and High-quality Development in Northwest China. Econ. Geogr. 2021, 41, 154–164. [Google Scholar] [CrossRef]
  53. Zhang, Y.; Cen, Q. Spatial Patterns of Population Mobility and Determinants of Inter-provincial Migration in China. Popul. Res. 2014, 38, 54–71. [Google Scholar]
  54. Tian, J.; Wang, B.; Zhang, C.; Li, W.; Wang, S. Mechanism of regional land use transition in underdeveloped areas of China: A case study of northeast China. Land Use Policy 2020, 94, 104538. [Google Scholar] [CrossRef]
  55. Commission, G.P.D.P. Regional Economic Policy and Regional Economic Development in Northwest China. Res. Dev. 2002, 2, 18–29. [Google Scholar] [CrossRef]
  56. Liu, K. A Research on the Developing Model of Rural Urbanization in Northwest China; Northwest Sci-Tech University of Agriculture and Forestry: Yangling, China, 2004. [Google Scholar]
  57. Song, F.; Feng, M. In-situ Urbanization Path of “Town-level City” In Northwest China. Planners 2018, 34, 92–97. [Google Scholar]
  58. Bettinger, P.; Merry, K. Land cover transitions in the United States South: 2007–2013. Appl. Geogr. 2019, 105, 102–110. [Google Scholar] [CrossRef]
Figure 1. Study area (Data of aridity adapted with permission from Xu and Zhang, China Meteorological Background Dataset [31]; published by the Institute of Geographic Sciences and Natural Resources Research, Chinese Academy of Sciences, 2017. Base map acquired from Ministry of Natural Resources of the People’s Republic of China [32]. The boundaries of “Three Water Lines” Region were developed based on Deng’s proposal [29]. Other features were developed by the authors).
Sustainability 14 05728 g001
Figure 2. Distribution of four HCA types across the “Three Water Lines” region in 2000, 2010, and 2020.
Sustainability 14 05728 g002
Figure 3. Agricultural Area’s distribution and changes from 2000 to 2020.
Sustainability 14 05728 g003
Figure 4. Change in the area of Agricultural Area at the county level during 2000–2010 (a) and 2010–2020 (b).
Sustainability 14 05728 g004
Figure 5. Change in the proportion of Agricultural Area at the county level during 2000–2010 (a) and 2010–2020 (b).
Sustainability 14 05728 g005
Figure 6. Built-up Area’s distribution and changes from 2000 to 2020.
Sustainability 14 05728 g006
Figure 7. Change in the area of Built-up Area at the county level during 2000–2010 (a) and 2010–2020 (b).
Sustainability 14 05728 g007
Figure 8. Change in the proportion of Built-up Area at the county level during 2000–2010 (a) and 2010–2020 (b).
Sustainability 14 05728 g008
Figure 9. Ecological Area’s distribution and changes from 2000 to 2020.
Sustainability 14 05728 g009
Figure 10. Change in the area of Ecological Area at the county level during 2000–2010 (a) and 2010–2020 (b).
Sustainability 14 05728 g010
Figure 11. Change in the proportion of Ecological Area at the county level during 2000–2010 (a) and 2010–2020 (b).
Sustainability 14 05728 g011
Figure 12. Bare Area’s distribution and changes from 2000 to 2020.
Sustainability 14 05728 g012
Figure 13. Change in the area of Bare Area at the county level during 2000–2010 (a) and 2010–2020 (b).
Sustainability 14 05728 g013
Figure 14. Change in the proportion of Bare Area’s proportion at the county level during 2000–2010 (a) and 2010–2020 (b).
Sustainability 14 05728 g014
Figure 15. Areas of the transitions between different HCA types from 2000 to 2010.
Sustainability 14 05728 g015
Figure 16. Areas of the transitions between different HCA types from 2010 to 2020.
Sustainability 14 05728 g016
Figure 17. Distribution of the transitions with different source and end HCA types between 2000 and 2010.
Sustainability 14 05728 g017
Figure 18. Distribution of the transitions with different source and end HCA types between 2010 and 2020.
Sustainability 14 05728 g018
Table 1. Classification and description of four HCA types.
HCA TypeLand Use/Cover TypeDescription
Agricultural AreaCultivated landLand for planting crops, including mature cultivated land and newly opened wasteland.
Built-up AreaUrban and rural built-up areaUrban and rural residential areas, industrial, mining, and transportation land.
Ecological AreaForestThe land where trees, shrubs, bamboos, and coastal mangroves grow.
GrasslandAll kinds of grasslands are dominated by growing herbs with a coverage of more than 5%, including shrub grassland dominated by grazing and sparse forest grassland with a canopy density of less than 10%.
Water bodiesNatural inland water bodies and land used for water conservancy facilities, including rivers, canals, lakes, reservoirs, pits and ponds, permanent glaciers and snow, and tidal-flat areas.
Bare AreaUnused landLands currently unused or difficult to develop include sand-covered lands, Gobi, saline, and alkaline lands, soil-covered bare lands, rock/gravel-covered bare lands, and alpine deserts.
Table 2. Areas and changes of four HCA types from 2000 to 2020.
HCA TypeArea (km2)Area Changes from 2000 to 2020
200020102020by km2by %
Agricultural Area241,729248,446263,76522,0369.12%
Built-up Area18,44920,65032,33413,88575.26%
Ecological Area1,427,3011,423,0591,420,836−6465−0.45%
Bare Area1,654,5821,649,9071,621,478−33,104−2.00%
Table 3. Transition structure of different source and end types between 2000 and 2010.
End HCA Type in 2010Source HCA Type in 2000
Agricultural AreaBuilt-Up AreaEcological AreaBare Area
Agricultural Area0.00%0.26%17.40%3.24%
Built-up Area1.84%0.00%0.90%0.51%
Ecological Area12.60%0.13%0.00%31.20%
Bare Area1.04%0.04%30.83%0.00%
Sum15.49%0.44%49.13%34.95%
Table 4. Transition structure of different source and end types between 2010 and 2020.
End HCA Type in 2020Source HCA Type in 2010
Agricultural AreaBuilt-Up AreaEcological AreaBare Area
Agricultural Area0.00%1.22%12.53%2.27%
Built-up Area1.78%0.00%1.37%0.59%
Ecological Area10.99%0.71%0.00%34.80%
Bare Area1.02%0.16%32.56%0.00%
Sum13.80%2.08%46.46%37.66%
Table 5. Results of the binary regression analyses with regression significance ≤0.05.
ModelDependent VariableIndependent VariablesUnstandardized CoefficientsStandardized CoefficientstSig.
BStd. ErrorBeta
1Changes in Agricultural Area during 2000 to 2020Constant0.2130.013 16.493<0.001
Variable b−0.0540.0250.117−2.1430.033
2Changes in Agricultural Area during 2000 to 2020Constant0.1820.006 30.500<0.001
Variable d0.3720.0910.2194.089<0.001
3Changes in Agricultural Area during 2000 to 2020Constant0.2030.007 27.832<0.001
Variable f−0.1180.037−0.173−3.2110.001
4Changes in Built-up Area during 2000 to 2020Constant0.1340.013 10.162<0.001
Variable b0.0830.0260.1763.2570.001
5Changes in Built-up Area during 2000 to 2020Constant0.1200.007 16.449<0.001
Variable c0.3730.0370.48610.158<0.001
6Changes in Built-up Area during 2000 to 2020Constant0.1600.006 27.628<0.001
Variable d0.6680.0880.3837.566<0.001
7Changes in Built-up Area during 2000 to 2020Constant0.1350.006 21.371<0.001
Variable e0.3870.0370.50210.587<0.001
8Changes in Ecological Area during 2000 to 2020Constant0.5320.004 122.485<0.001
Variable d−0.1480.066−0.122−2.2390.026
Variable b, c, d, e, and f refer to urbanization rate, GDP per capita, the value-added per capita of the primary sector, the value-added per capita of the secondary sector and grain yield per square kilometer in 2020 respectively.
Table 6. Results of stepwise multiple regression analyses.
Dependent VariableIndependent VariablesUnstandardized CoefficientsStandardized CoefficientstSig.VIFRR2Adjusted R2Std. Error of the Estimate
BStd. ErrorBeta
Changes in Agricultural Area during 2000 to 2020Constant0.2050.009 23.999<0.001 0.2920.0850.0770.1036
Variable d0.3570.0910.2103.914<0.0011.042
Variable e−0.1040.040−0.138−2.5830.0101.030
Variable f−0.1060.036−0.156−2.9100.0041.043
Changes in Built-up Area during 2000 to 2020Constant0.1280.006 21.575<0.001 0.5960.3550.3510.0891
Variable c0.5650.0780.3247.2858<0.0011.017
Variable d0.3550.0340.46010.355<0.0011.017
Changes in Ecological Area during 2000 to 2020Constant0.5320.004 122.485<0.001 0.1220.0150.0120.0767
Variable d−0.1480.066−0.122−2.2390.0261.000
Changes in Bare Area during 2000 to 2020 No variables were entered into the equation under the stepwise criteria.
Variable c, d, e, and f refer to urbanization rate, GDP per capita, the value-added per capita of the primary sector, the value-added per capita of the secondary sector and the grain yield per square kilometer in 2020 respectively. The Stepwise Criteria is ‘Probability-of-F-to-enter ≤0.050, Probability-of-F-to-remove ≥0.100’.
Publisher’s Note: MDPI stays neutral with regard to jurisdictional claims in published maps and institutional affiliations.

