Article

Biomethanation of Rice Straw: A Sustainable Perspective for the Valorisation of a Field Residue in the Energy Sector

1
Dipartimento Energia “Galileo Ferraris”, Politecnico di Torino, Corso Duca degli Abruzzi 24, 10129 Torino, Italy
2
Dipartimento Scienza Applicata e Tecnologia, Politecnico di Torino, Corso Duca degli Abruzzi 24, 10129 Torino, Italy
*
Authors to whom correspondence should be addressed.
These authors contributed equally to this work.
Sustainability 2022, 14(9), 5679; https://doi.org/10.3390/su14095679
Submission received: 7 April 2022 / Revised: 4 May 2022 / Accepted: 6 May 2022 / Published: 8 May 2022

Abstract

:
Rice straw represents a field waste. Indeed, only 20% of the rice straw produced is used in the pulp and paper industry. The larger amount of this field residue is burned or left in the field, which has very important environmental consequences. Recently, analogous to a barrel of oil, a metric approach to rice straw, the rice straw barrel, was introduced in order to assign economic value to this waste. In this paper, potential annual biomethane production from anaerobic digestion is evaluated, resulting in a range of biomethane created for each rice straw barrel depending on volatile solid ( V S ) content as a percentage of total solid ( T S ) content and on biomethane yield: 23.36 m 3 ( V S = 73.8 % T S , 92 L kg V S 1 ), 26.61 m 3 ( V S = 84.08 % T S , 186 L kg V S 1 ), 29.27 m 3 ( V S = 95.26 % T S , 280 L kg V S 1 ). The new concept of the rice straw barrel is improved based on a new indicator for sustainability, the Thermodynamic Human Development Index (THDI), which was introduced within the last three years. The improvement in sustainability by using rice straw barrels for different countries is analysed based on the THDI.

1. Introduction

Energy represents a fundamental resource in industrial and modern society, and a consequent fundamental topic of investigation for sustainability. The increase in world population and the related improvement in economic activities determine the increase in energy demand, with related consequences for the Earth’s environment [1]. Indeed, the demand for energy is continuously increasing, with pressing problems for our societies including climate change, energy crises, and food security for a growing population [2]. Technical and socio–economic solutions are required for these challenges, with the aims of providing environmentally sustainable answers and cost-effectiveness for large-scale applications. In this context, waste-to-energy conversion of agricultural residues into renewable energy contribute to reduce global methane emissions and preserve valuable land resources for food production [3]. Thus, unused agricultural waste could represent one of the most stable sources of energy to support countries reaching a long-term energy strategy [3]: wheat straw and rice straw can play an important role in meeting growing energy demand based on a sustainable approach [4]; in this way, biomass, from field residue could become a resource in the energy sector.
Field residues are what remain after crop harvesting, whereas process residues are the waste of the crop after its harvesting [5]. In particular, rice straw is considered a field residue because it doesn’t find use in industry or agriculture. Every kg of harvested rice produces about 0.70–1.50 kg of rice straw [3,6]: 1.35 kg of rice straw for each kg of rice grain is considered the usual mean value for reference in technical studies [7,8,9,10]. Lignocellulosic biomass can represent an economical and renewable substrate to process biofuels [5,11], particularly biogas and biomethane. Indeed, these products can be obtained by anaerobic microorganism digestion of lignocellulosic substrates [12]. Consequently, bioenergy production could represent an efficient approach to reduce waste generation [13]. Moreover, the related digestate can also be used as an organic fertiliser due to its phosphorus and nitrogen content [14]. In summary, valorisation of rice straw could reduce pollution related to its disposal and be used to produce second-generation biofuels and/or biodegradable plastics [15], specifically microbial polyesters, currently the biodegradable bio-based plastics most attractive for replacing fossil-fuel-based plastics [16,17,18].

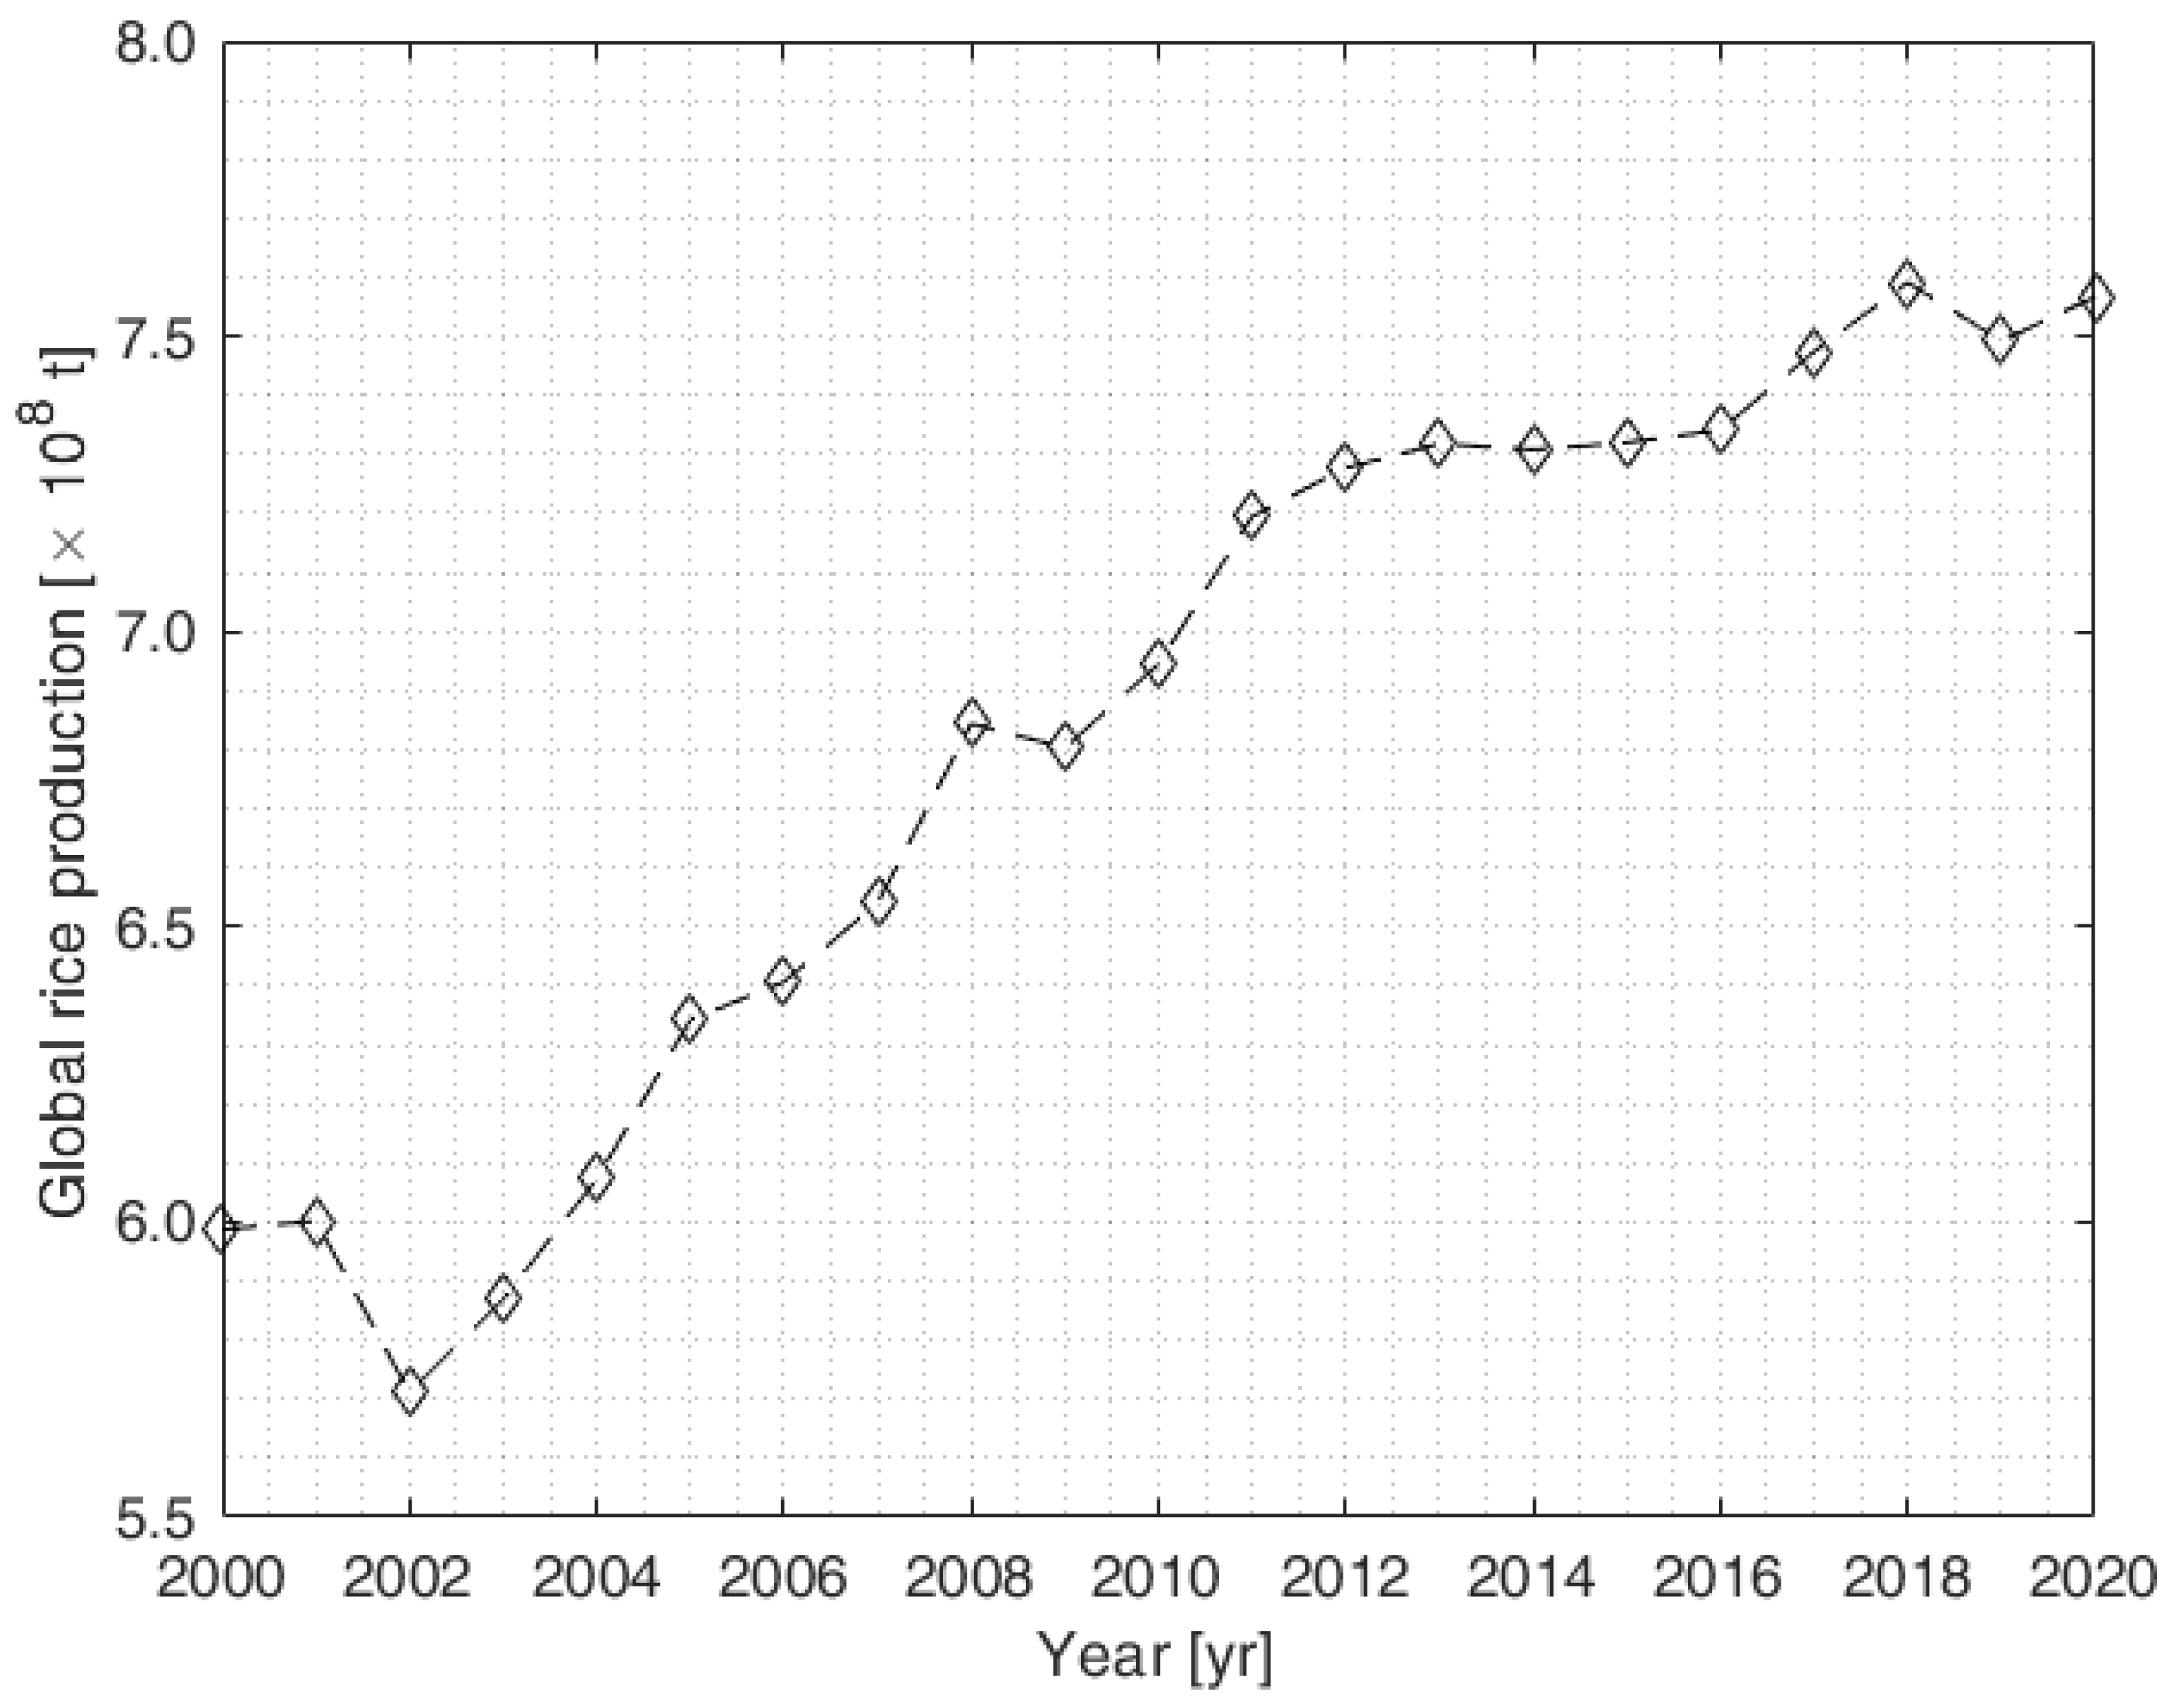
1.1. Rice as an Agricultural Commodity

Rice is the third most popular agricultural crop grown in the world, after wheat and corn, with a total cultivated area estimated at 164.2 Mha and a gross grain yield production of 756.7 Mt yr 1 in 2020 [19,20]. Figure 1 shows total global rice production from 2000 to 2020. A continuous increase in global rice production can be highlighted during the 21st century: an overall increase of 26 % from 2000 to 2020 is shown, increasing a total of 250 % from 1961 to 2020.
Table 1 reports the area, plant height, and rice yield in different regions in order to summarise global rice production.
In Table 2, rice production for the year 2020 is summarised by continent. In Table 3, rice production of some of the largest rice-producing countries for different continents is reported from the years 2000 to 2020. In 2017, dry lignocellulosic biomass related to rice production was estimated to be 905 Mt yr 1 [4,26].

1.2. Rice Straw: A Residual Waste of Rice Production—A Potential Energy Source

Rice is a crucial food crop, relevant to global food security and socio–economic stability [27]. However, rice cultivation creates pollution due to irrigation and fertilization methods. Indeed, during the growth phase of the rice plant, relevant amounts of CH 4 and N 2 O are emitted into the atmosphere [28,29]: methanogenesis is the result of the bacterial transformation of soil organic carbon under anaerobic conditions. Moreover, fertilisation also contributes to air pollution [30] because of the interaction between the fertilizer and the soil. Last, irrigation creates pollution [31].
As the result of rice cultivation, husk, chaff, and rice straw are produced in the following average quantities depending on the variety of rice:
  • Husk: 20% by weight of the rice;
  • Chaff: 10% by weight of the rice;
  • Rice straw: 700–1500 kg for every ton of rice grain.
However, husk and chaff have economic value due to their use in some industrial sectors, such as energy, food, and pharmaceutics, while only 20% of the rice straw can be used as a raw material for the pulp and paper industry, especially if it is collected without machinery [21]. Consequently, rice straw is considered a field waste due to its high silica (SiO 2 ) content (around 13% by weight). Usually, there are two disposal methods for rice straw, estimated to be responsible for around 10–15% of worldwide anthropogenic emissions [3]:
  • Open-field burning— at least 50% of total rice straw is burned globally [21], generating atmospheric pollution equivalent to approximately 11 t ha 1 yr 1 of CO 2 [32];
  • Incorporation by the soil (up to 12 t ha 1 yr 1 ) increases CH 4 and N 2 O emissions [33].
On the other hand, these disposal methods allow the reintroduction of elementary substances into the lithosphere (C, K, N, P, etc.) and eliminate weeds from the soil, with the favourable result of avoiding compromising the quality of the next harvest [34]. However, rice straw removal from flooded rice fields has been shown to not reduce the level of soil organic matter [35].
Here, consideration of carbon dioxide emissions due to open-field burning of the biomass must be introduced. Indeed, biomass is considered carbon neutral [36,37] due to the biospheric carbon cycle, i.e., the carbon that is released during combustion is the same that had been sequestered by the plant during its life cycle. However, based on exergetic analysis, a resource (including energy) presents a quality [38,39], which consists of the number of uses to which it can be subjected before becoming waste. Thus, rice straw open-field burning generates heat, pollution, and CO 2 emissions that are dissipated into the environment [40]. Heat, pollution, and CO 2 emissions represent exergetic losses. On the contrary, if the rice straw is converted into biofuels (or other useful by-products), it becomes a resource to obtain useful work; consequently, an equal amount of CO 2 emissions and heat are released, but with the production of useful work. In this second process, the rice straw presents a higher quality (i.e., exergy) because, though it still produces carbon dioxide and heat, it now also generates useful work.
In energy terms, one of the fundamental properties of biomasses is its heating value, which depends on its composition. Table 4 reports the heating value of rice straw from different countries.
Bioenergy production from crop residues can be done by thermal conversion (combustion, pyrolysis, and gasification) or by biochemical conversion (anaerobic digestion or co-digestion, fermentation, and transesterification) [1]. In particular, the organic substrate can be degraded into biogas and digestate by using anaerobic digestion [41]. Rice straw could represent a low-cost choice for the bio-based economy because it is a field residue of rice cultivation that would otherwise be burned or left in the soil without any economic value. However, its use in the energy sector has recently been highlighted, along with techniques for its collection and baling [42].
Anaerobic digestion of rice straw is considered the best route to exploit its energy potential [43]. The composition of rice straw can be summarised as follows [4,43]:
  • Cellulose (C 6 H 10 O 5 ) x : the main constituent (29–80%) of lignocellulosic biomass. It is a polysaccharide consisting of a linear chain of D-glucose linked by β bonds. The cellulose strains are associated to make cellulose fibrils. Cellulose fibres are linked by intra–molecular and inter-molecular hydrogen bonds. Cellulose is insoluble in water and most organic solvents;
  • Hemicelluloses (C 5 H 8 O 4 ) m (10–45%): heterogeneous branched biopolymers, relatively easy to hydrolyze due to their amorphous and branched structure, with short lateral chains, and their lower molecular weight;
  • Lignin [C 9 H 10 O 3 (OCH 3 ) 0.9 1.7 ] n (5–25%): an aromatic polymer.
In particular, lignin cannot easily be digested by microbes [44]. To overcome this difficulty, lignocellulosic residues must be mechanically, thermally, biologically, and/or chemically pretreated [45]. Notably, mechanical pretreatments reduce the biomass into particles, increasing porosity, which improves degradation by anaerobic bacteria [34]. Table 5 summarises the densities of different forms of processed rice straw [21].
Moreover, high lignin content slows anaerobic digestion of lignocellulosic biomass waste. Indeed, this increases the time required for degradation. Consequently, the efficiency of the process must be improved in order to decrease the cost to use biomass [46]. Cellulose, hemicellulose, and lignin are the fundamental components of rice straw, and their proportions affect the rate of degradation of the substrate [5]: in aerobic decomposition, cellulose is depolymerized to produce glucose, which is then oxidized into CO 2 and H 2 O. Consequently, the biomass is reduced over time: rice straw in the soil has been estimated to have a half-life of two years, and around the 80–90% of it is decomposed during the first year [3].
Thus, in a recent analysis of the Novara district [42], following the concept of oil barrel, cylindrical bales of rice straw were suggested as a metric unit for the use of rice straw for energy [42]. The barrel of rice straw was proposed based on having the same energy potential as a barrel of oil.
In relation to the analogy between the rice straw barrel and the oil barrel, it is important to highlight that rice straw is composed of polysaccharides and lignin, and it is relatively easily degradable, with the consequence that at the end of the season around 80–90% of the added rice straw disappears [47]: this natural degradation points out the difficulty of using rice straw barrels as energy storage, making it suitable for local, quick use. Indeed, rice straw has lower energy and density than fossil fuels; consequently, more biomass is required to obtain the same amount of energy [48]. Moreover, the economic feasibility of solid biomass transport limits rice straw use to distances within 200 km of the source [49].
At present, great attention is given to the anaerobic conversion of lignocellulosic biomass in bio-methane, with particular regards to the kinetic characteristics of the digestion process, related to the lag phase, hydrolysis rate, methane production rate, and methane yield [1]. Moreover, from this energy route, it is possible to obtain fertilizer as by-product [50].

1.3. Anaerobic Digestion

Anaerobic digestion of biomass is one of the viable conversion processes of rice straw into energy. Indeed, it has been highlighted to be the most favourable route to use the rice straw energy potential [43]. Anaerobic digestion is a natural process in which specific microorganisms degrade organic matter into intermediate products that are converted into methane (CH 4 ). Based on the concentration of total solids (TS), anaerobic digestion can be wet (total solid concentration less than 15%), semi-dry (total solid concentration from 15–20%), or dry (total solid concentration greater than 20%) [3]. In [51], advantages and disadvantages of different biomass pretreatments and anaerobic straw digestion processes are highlighted. Anaerobic digestion of rice straw occurs faster in wet conditions, even though the related methane yield is approximately the same in any condition [52]. Wet systems have advantages related to decreased water use, elimination of wastewater disposal, and reuse of the solid residue as fertilizers [3].
Biomethanation is a complex biological process composed of four phases [41]:
  • Hydrolysis phase: During this phase, cellulose and other carbohydrates, proteins, and fats are broken down into monomers by hydrolase enzymes of anaerobic bacteria; this takes from a few hours for the hydrolysis of carbohydrates, to several days for the hydrolysis of proteins and lipids;
  • Acidogenic phase: The results of hydrolysis are monomers, which can be degraded into short-chain organic acids, alcohols, hydrogen, and carbon dioxide by anaerobic bacteria;
  • Acetogenic phase: The results of the acidogenic process become the substrates for bacteria in the acetogenic phase, which uses H 2 and CO 2 to form acetic acid. Methanogenic bacteria grow concurrently with acetogenic bacteria. Acetate production decreases if hydrogen partial pressure is great enough;
  • Methanogenic phase: Methane is generated in anaerobic conditions; based on the substrate, methanogenesis can be divided into the following categories [41]:
    -
    Acetoclastic Methanogenesis: Acetate → CH 4 + CO 2
    -
    Hydogenotrophic Methanogenesis: H 2 + CO 2 → CH 4
    -
    Methyltrophic Methanogenesis: Methanol → CH 4 + H 2 O
Anaerobic digestion results in biogas composed of 50–65% biomethane (CH 4 ) and 35–40% carbon dioxide (CO 2 ), with the balance consisting of nitrogen (N 2 ) and trace amounts of hydrogen sulphide (H 2 S) and water vapour (H 2 O).
Anaerobic digestion systems are designed in two possible configurations [3]:
  • Batch reactors, in which all the substrate/inocula mixture is added at the beginning: They are much simpler and 40% less expensive, but with larger volume requirements and a related larger footprint for the reactors;
  • Continuously-fed reactors, in which the substrate/inocula mixture is added incrementally over time.

1.4. The Aim of the Paper

In this paper, we develop a first analysis of rice straw as a resource for energy use by considering the concept of the rice straw barrel, recently developed by Bressan et al. [42]. Afterwards, some considerations on the sustainable use of rice straw based on the Thermodynamic Human Development Index (THDI) will be introduced. A comparison is developed between the present issue of open-field rice straw burning and biomethane production via anaerobic digestion. In this context, potential biomethane production is estimated.

2. Materials and Methods

In this section, we introduce all of the elements required to evaluate the number of rice straw barrels, the potential biomethane production, and all the fundamental quantities to assess the sustainability of biomethanation from anaerobic digestion. To do this, we introduce the Thermodynamic Human Development Index (THDI).
First, we obtain the amount of rice straw available for energy use, evaluated in terms of rice straw barrels. Moreover, it has been considered that only 20% of the total amount of rice straw is usually used for other purposes, such as the pulp and paper industry [21]; consequently, we considered only 80% of the total amount of rice straw as available.
Once the average number of rice straw barrels is obtained and the proportion dedicated to other uses is deducted, the amount of biomethane produced from anaerobic digestion can be evaluated. Figure 2 shows the flow of the processes considered.
Lastly, the effect of using at least 50% of the total amount of rice straw for anaerobic digestion is compared with the current practice of open-field burning. To develop this comparison, an indicator of sustainability, THDI, is introduced.

2.1. Rice Straw Availability

In order to evaluate the total amount of rice straw available on fields prior to bailing, m r s , we consider that it is proportional to the amount of milled rice, m r , produced in a specific region:
m r s = k m r
where m denotes the mass, and the subscripts r s and r are, respectively, rice straw and rice, k is the empirical coefficient that gives the amount of rice straw with respect to the amount of rice.

2.2. The Rice Straw Barrel

This study considers the concept of rice straw barrels, recently introduced by Bressan et al. [42], in order to evaluate the potential use of rice straw to produce by-products such as methane and the related digestate.
To do so, the first step is to analyse the rice straw barrel as introduced in [42], improving this approach by using recently developed thermoeconomics [53,54,55,56,57].
The rice straw barrel has been introduced in the analysis of rice production in the Novara district, Italy. This district has an area of 134,025 ha, with a temperate climate characterised by cold winters (minimum temperatures often below 0 C between December and February) and quite hot summers (frequently 30 C). Mean rainfall amounts to approximately 1000 mm yr 1 , characterised by two maximums (148.9 mm in November and 110.7 mm in May) and two minimums (52.5 mm in July and 56.5 mm in January). Winter averages approximately 35 cm of snow. According to Torrion Quartara Geophysical Observatory data [58] (meteorological archive dating back to August 1999), the average annual temperature during the 21st century is 13.9 C [59]. In this area, the rice variety mostly cultivated is Baldo: it is characterised by round, thick, hard grains; the cultivation season is from January to October; it is carried out by submersion and high levels of agricultural mechanization [42]: all agricultural processes are carried out by medium-power tractors and specific equipment, and the fields are flooded using water irrigation canals [42].
The rice straw barrel contains the rice straw, which is removed as soon as its moisture content has dropped from 50% to below 20% in order to prevent fermentation [42]: usually, rice straw is removed 3–4 days after harvest, depending on the local climate [7]. The biomass left in the field decomposes, which decreases available biomass. The reduction in biomass can be evaluated as follows [60]:
m ( t ) = m r + m d · e k t
where m ( t ) is the mass of the rice straw over time, m r is the remaining mass after time t, m d is the difference between the initial mass m 0 = m r + m d and the remaining mass m r , t is the time in month, k is the decomposition rate (month 1 ). The values of the coefficients for the case study in Novara are summarised in Table 6: the value of the exponent in Equation (2) for Novara district for rice straw removal after 4 days or 1 month is m = m r + 0.024 m d 5765.4 kg ha 1 or 4177.3 kg ha 1 , respectively.
The barrel considered is a cylinder 1.8 m in diameter and 1.2 m in height, wrapped in a nylon film, weighing 430 kg and having a density of 141 kg m 3 —which is in agreement with the values reported in Table 5—and with an energy content of around 6020 MJ.
In Northern Italy, the major environmental impact from cultivation has been estimated to be related to field emissions for 68.0%, to fertilizers for 9.2%, to transportation for 6.1%, to refining and packing for 4.7%, and to field operations for 3.6% [3]. Consequently, removing rice straw will contribute to environmental mitigation of the cultivating process.
In order to obtain the number of rice straw barrels available to be used as energy, the average decrease in moisture content is considered to be from 50% to 20%. This must occur prior to bailing and excludes the 20% of the total amount of rice straw that can be used for the pulp and paper industry. Thus, the characteristics of the barrel have been adopted as introduced in [42]. We assume to use the total number of barrels for anaerobic digestion to obtain biomethane.

2.3. Biomethanation

Here, the evaluation of biomethane production by rice straw is developed. To do so, the results of Meraj et al. [1] are considered. Rice straw substrates were air-dried and mechanically pretreated in order to reduce their size to 0.1 mm, and then put in anaerobic bioreactors maintained at a temperature of ( 35 ± 1 ) C and pH in the range of 7.0–7.5 [1]. Table 7 shows cellulose content based on particle size.
Meraj et al. [1] proved experimentally that biogas production kinetics are well-modelled by the Logistic Function Model [61]:
m ( t ) = m 0 1 + exp 2 + 4 m ˙ m a x ( t ) m 0
where m ( t ) is methane mass production (mL g V S 1 ), V S means volatile solids, m 0 is the methane yield potential (mL g V S 1 ), is the lag phase (d), which is the minimum time required for methane production, t is the time (d), and m ˙ m a x is the maximum methane production rate (mL g V S 1 d 1 ) [1]. The amount of methane yield in terms of total solids (TS) was evaluated to be in the range of 193–240 L kg T S 1 , while Table 8 summarises methane yield based on volatile solids (VS) for different pretreatments [3].
Starting from these considerations, we evaluate the average amount of total solids ( T S ) and volatile solids ( V S ) available in relation to an R S B . These quantities allow us to assess annual biomethane potential. To do so, we consider the average values of the proximate analysis of rice straw, summarised in [43] and biomethane yields, V ˙ CH 4 , summarised in [3]. These average values depend on different inocula, pretreatments, and working temperatures. The values considered in this paper are summarised in Table 9.

2.4. Open-Field Burning

At least 50% of the rice straw produced is open-field burned, with notorious negative impacts both on the environment due to atmospheric pollution and agronomy through reducted soil quality [63]. However, open-field burning is a cheap disposal method; thus, it is the one most adopted by farmers around the world [7]. This disposal method is a major contributor to damaging levels of air pollution, with related health issues, and a high contributor to greenhouse gas emissions, especially in Asia countries [64]. Hence, research is ongoing for the development of alternative uses of rice straw, turning it into a commodity with sustainable value chains to benefit rural people [64].
In order to evaluate the effects of emissions due to open field burning versus anaerobic digestion and biomethanation, we considered the results of Refs. [43,65]. The emissions for each 1000 kg of rice straw can be summarised as follows [43]:
  • Open field burning:
    -
    1460.00 kg CO 2 (carbon dioxide);
    -
    34.70 kg CO (carbon monoxide);
    -
    13.00 kg PM (particulate matter);
    -
    3.10 kg NO x (oxides of nitrogen);
    -
    2.00 kg SO 2 (sulphur dioxide);
    -
    1.20 kg CH 4 (methane).
  • Anaerobic digestion:
    -
    2.05 kg CO 2 (carbon dioxide);
    -
    0.67 kg CO (carbon monoxide);
    -
    0.01 kg H 2 S (hydrogen sulphide);
    -
    0.04 kg NO x (oxides of nitrogen);
    -
    1.07 kg CH 4 (methane).

2.5. The Thermoeconomic Approach

Here, we introduce a recently developed thermodynamic index in order to analyse the sustainable use of rice straw barrels by considering biomethane production by anaerobic digestion.
The indicator, introduced to quantify a country’s conditions, is an improvement of the United Nations Human Development Index ( H D I ), which is based on three quantities: Education Index, E I , Income Index I I , and Life Expectancy Index, L E I . Thus, H D I quantifies the development level and well-being of a country with regards to education, health, and earnings [66]. It is the geometric mean of three normalised indices that are representative of each dimension [67], and its analytical definition is [68]:
H D I = ( L E I · E I · I I ) 1 / 3
with L E I being the Life Expectancy Index, while E I represents the Education Index, and I I stands for the Income Index.
The Life Expectancy Index L E I is expressed as [68]:
L E I = L E 20 85 20
where L E denotes the Life Expectancy at birth, indicative of the overall mortality level of a country, and it corresponds to the years that a newborn is expected to live at current mortality rates [69]. The UN has set its minimum and maximum values to 20 and 85 years, respectively [70].
The Education Index, E I , has been defined by the United Nations Development Program (UNDP) as follows [68]:
E I = M Y S I + E Y S I 2
where M Y S I = M Y S / 15 is the Mean Years of Schooling Index and E Y S I = E S I / 18 is the Expected Years of Schooling Index [68].
The United Nations defined the Normalised Income Index I I as:
I I = ln ( G N I p c / 100 ) ln ( 75000 / 100 )
where G N I p c is the gross national income per capita at purchasing power parity (PPP), with minimum and maximum values set by the UN [68] as USD 100 and USD 75,000.
However, the H D I does not take into account the country’s technological level and the environmental impact of the country. Aiming to incorporate the technological stage, an improvement of the H D I [71] was recently introduced, which puts forward an irreversible thermodynamic approach [53,57] as follows:
T H D I = L E I · E I I T 1 / 3
where [54]:
I T = T 0 S ˙ g W ˙ · G N I p c = 0.01 · T 0 S ˙ g W ˙ · 750 I I
and [55,72,73,74]:
T 0 S ˙ g = T 0 m ˙ CO 2 s g
where m ˙ CO 2 is the CO 2 mass flow rate emitted for obtaining the required effect W ˙ , and s g is the specific entropy generation.
In relation to these considerations, it is possible to evaluate the thermodynamic indicator THDI [75] in the case of rice straw T H D I r s a d used for biomethane production and the present-condition THDI. This ratio results:
T H D I r s , a d T H D I = m CO 2 m CO 2 m CO 2 r s · 750 ( I I r s I I ) 3
where m C O 2 r s is the amount of CO 2 saved by production of biomethane from rice straw.
Thus, we analyse the effect on sustainability derived from substituting the current practice of burning rice straw on open fields with anaerobic digestion and biomethanation by using the THDI Equation (11), considering the results of [43,65].

3. Results

The analysis is first focused on the Novara district and then extended to Italy. The Italian values are compared to those of other major rice producing countries (Bangladesh, Brazil, China, India, Pakistan, Spain, Thailand, United States of America, and Vietnam). The rice production for those countries is shown in Table 3.

3.1. The Novara Case and the Italian Context

In 2020, 220,000 t of rice were harvested in the Novara area; representing approximately 15% of total Italian rice production.
Starting from rice quantity, it is possible to obtain the mass of rice straw available for energy ( m r s , A D ), the number of rice straw barrels available ( R S B ), the total amount of volatile solids (total solids minus ash content) in the biomass ( m V S ), and the annual biomethane yield ( V ˙ CH 4 ). The numerical values of these quantities are reported in Table 10. In the worst case (the amount of rice straw around 70% of the mass of the rice grain collected, k = 0.70 ), 200,558 rice straw barrels ( R S B ) are theoretically available for energy. This corresponds to an annual biomethane yield ranging from (1.09–3.32) × 10 7 m 3 . Considering k = 1.50 , R S B equals 429,767, with a potential annual biomethane yield of (2.93–8.90) × 10 7 m 3 .
If we expand these results to the entirety of Italian, the total amount of R S B and the related potential amount of biomethane from rice straw can be obtained. The time period considered is from the years 2000 to 2020, as summarised in Table 3. Table 11 shows the minimum, average, and maximum values for Italy based on data from Table 9. The average annual biomethane yield is in the range of (0.71–2.15) × 10 8 m 3 . The rice straw yield of 1.35 is based on milled rice in the year 2020. In 2019, in Italy, the total amount of biomethane produced from agricultural and zootechnical effluents has been estimated to be 2.2 × 10 9 m 3 , producing a gross of 987 MW electrical power across 1629 different power plants [76]. The agricultural and zootechnical sectors represents around 82% of electrical production from biogas.
Thus, biogas from rice straw can improve the production of biogas, which is useful for green energy production. This can be facilitated by increasing the number of anaerobic digestion plants within 200 km of rice crops. This can improve the circular economic framework by using field waste without a second use and preventing its burning on fields. Moreover, the digestate obtained from anaerobic digestion can be employed as a fertilizer [3].

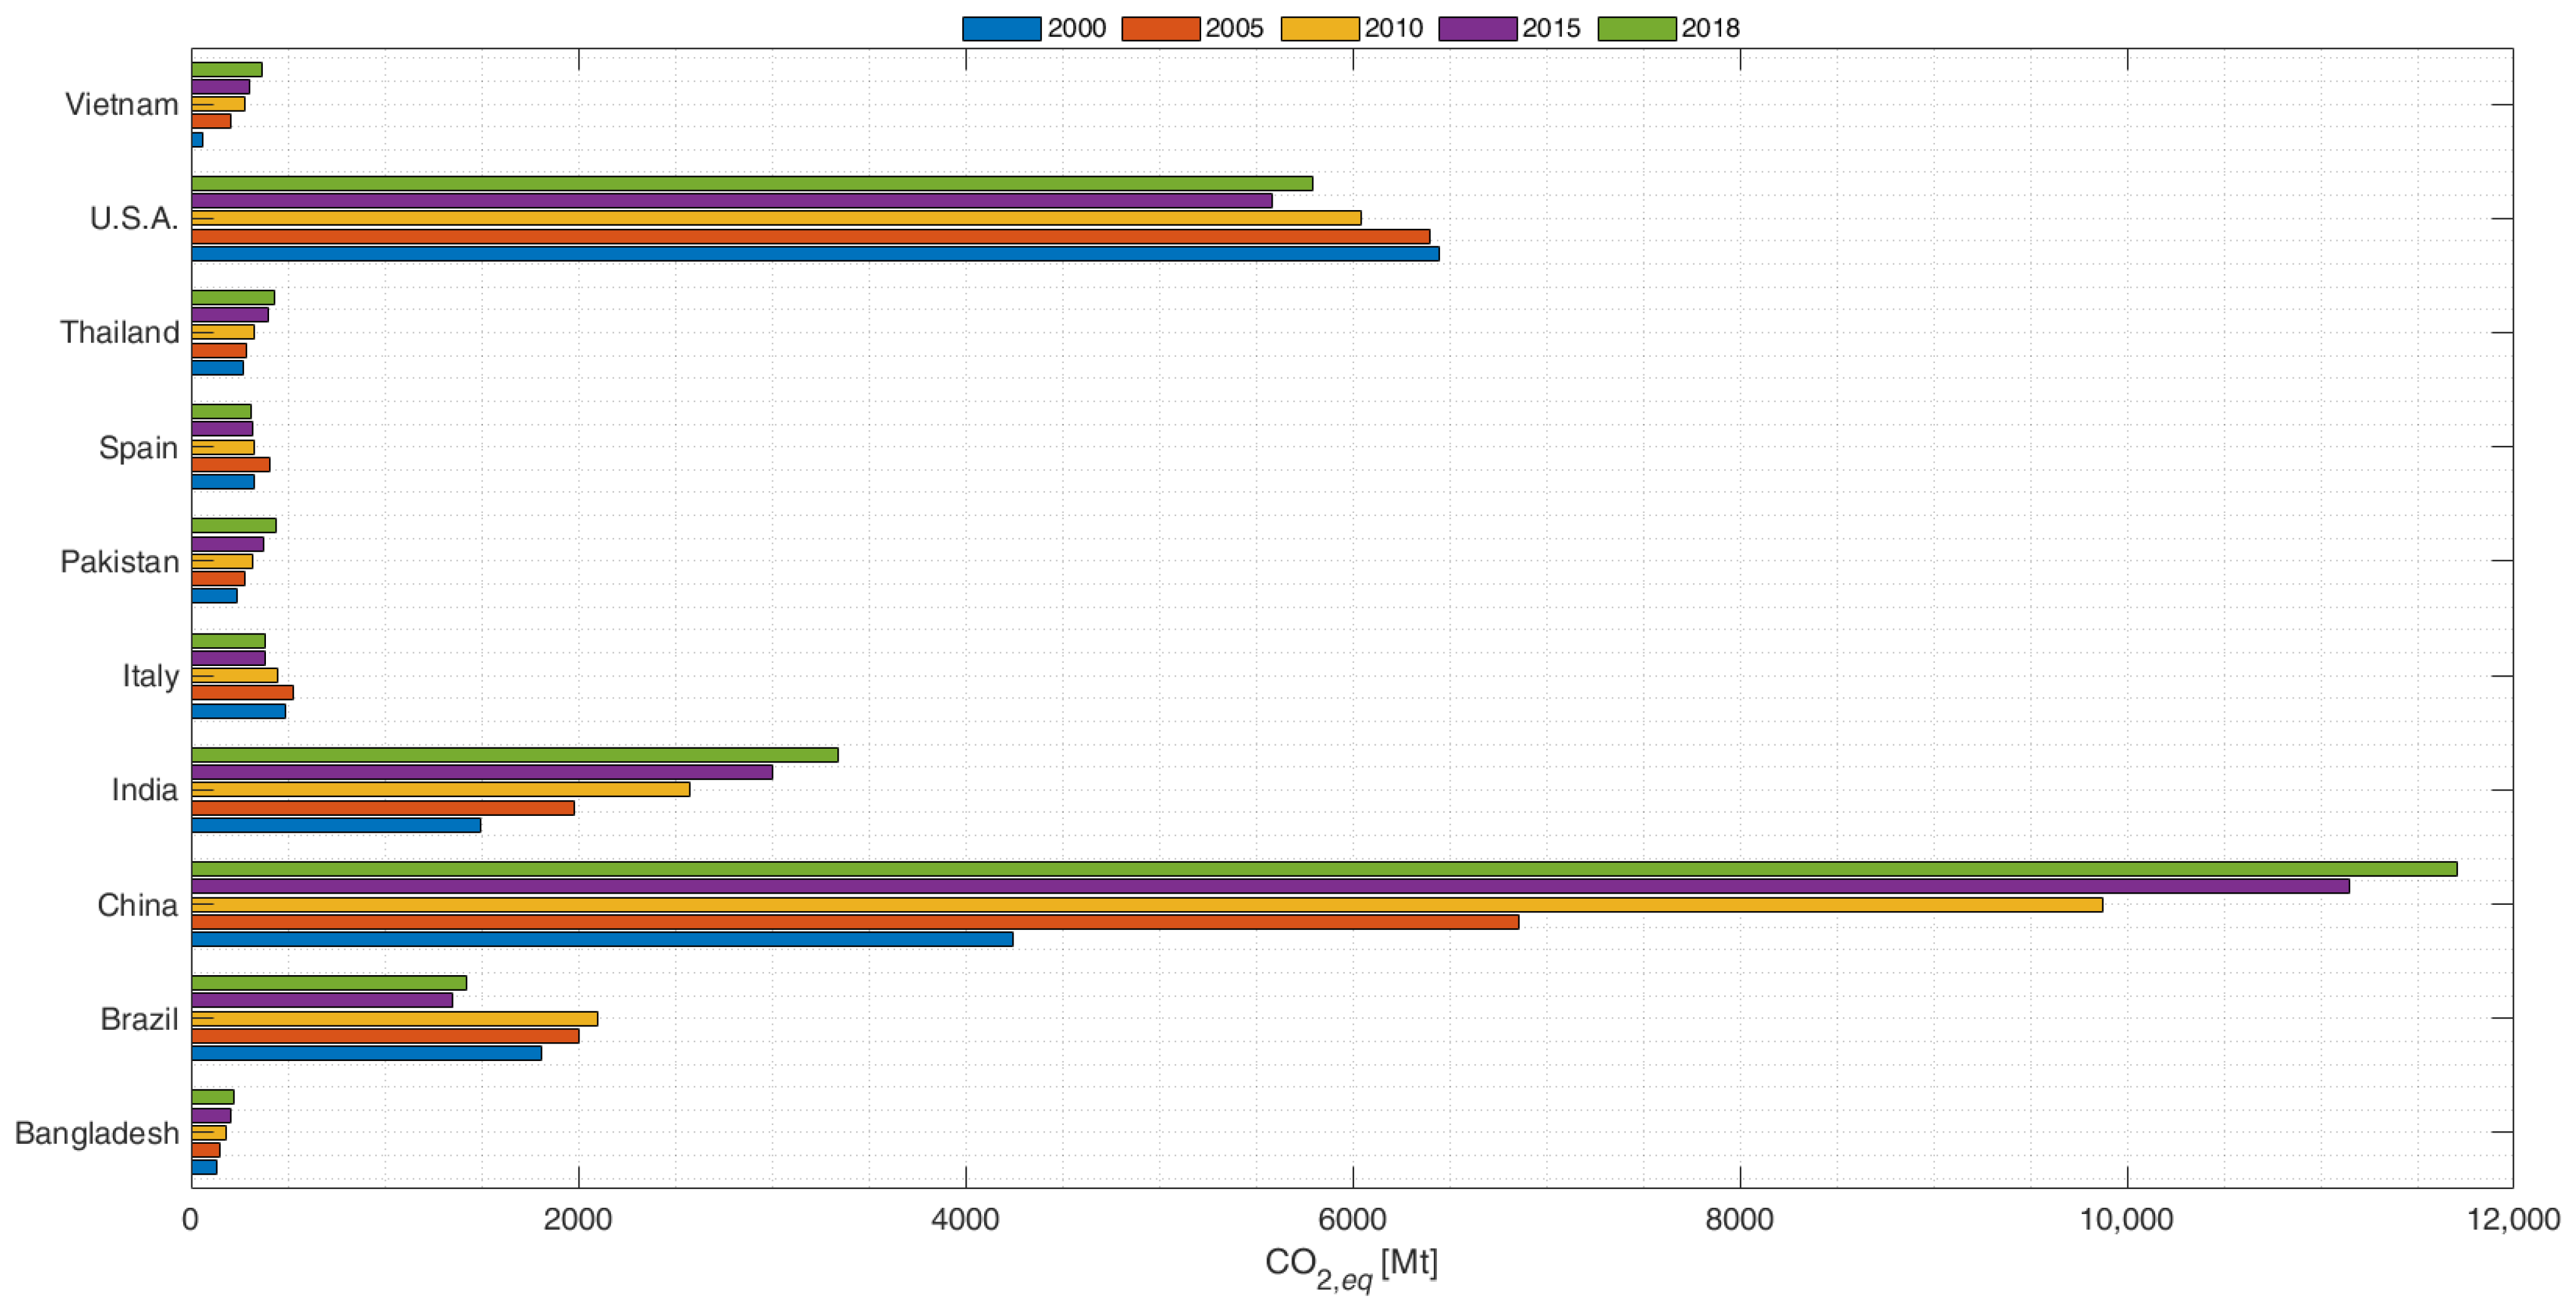
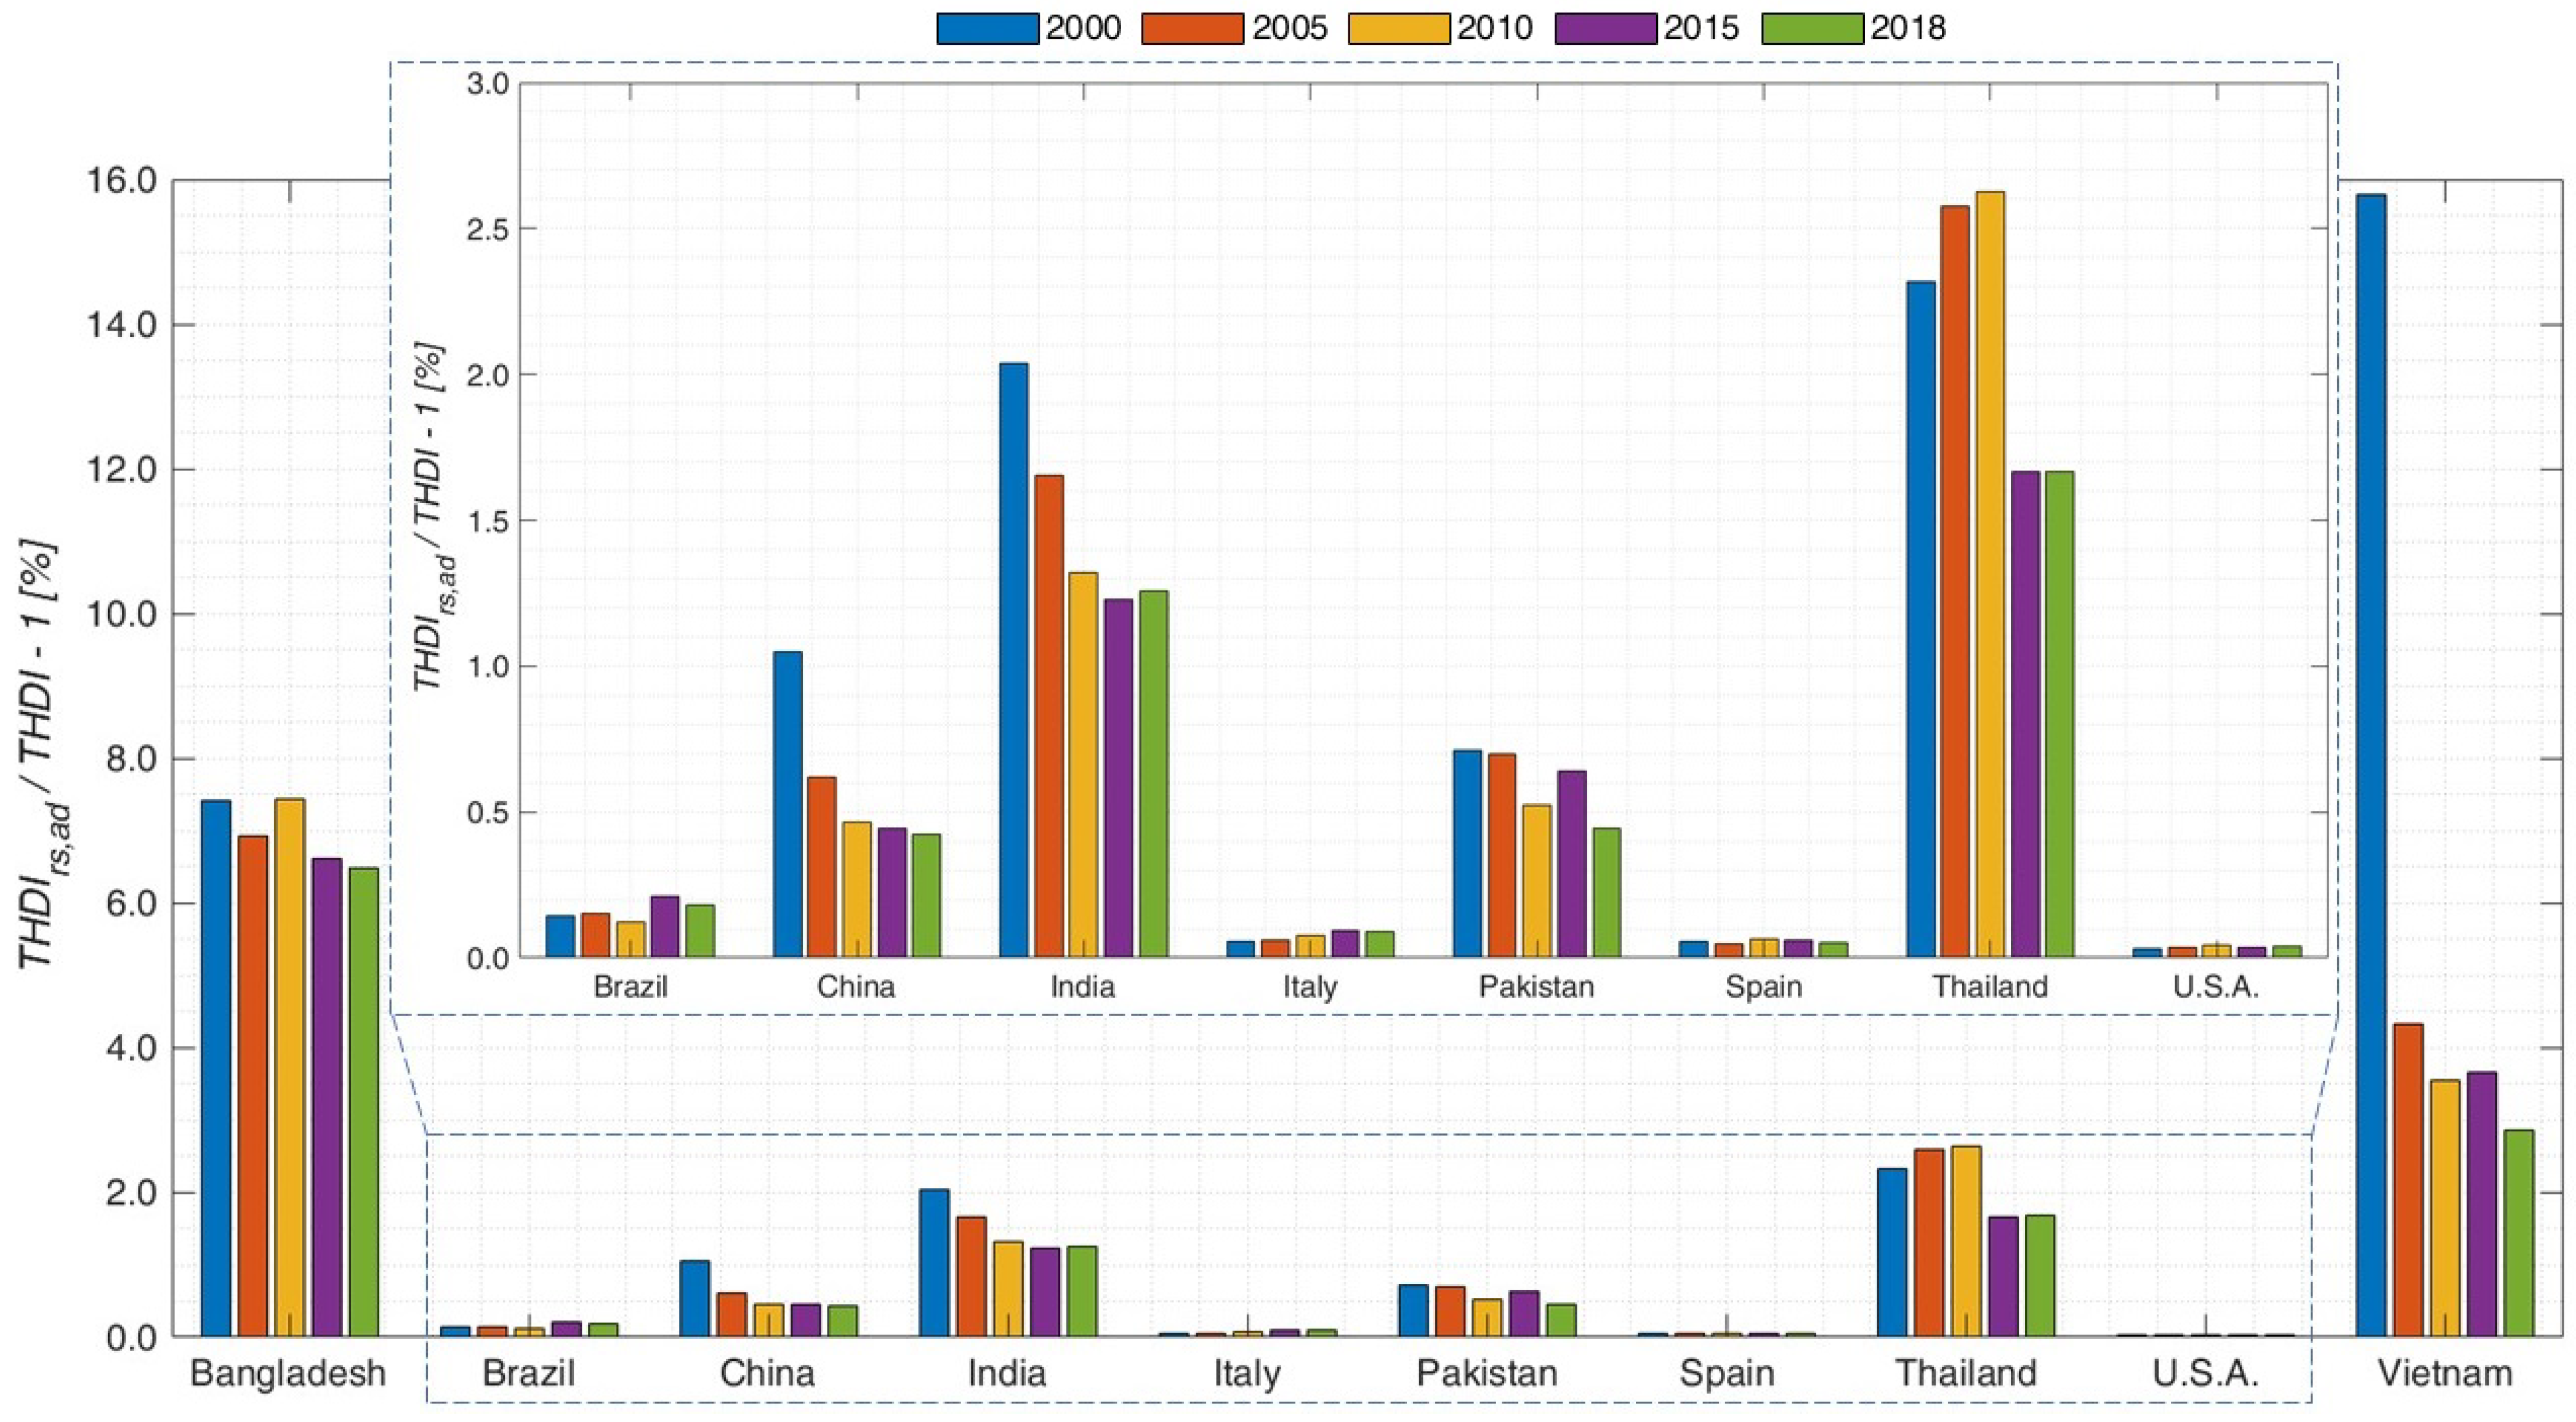
3.2. Some of the Major Rice-Producing Countries

Table 12 shows the results of the previous approach extended to some of the major rice-producing countries for the period 2000–2020. The total number of R S B and the potential biomethane yield per year are shown. The minimum, average, and maximum biomethane yields are based on the literature and are, respectively, 92, 186, and 280 L kg V S 1 [3].
Several studies have reported higher biomethane yields (e.g., 325.76 L kg V S 1 [77]). The difference between the data used in the present paper and the literature is due only to different pretreatments (in this paper only mechanical pretreatments are considered).

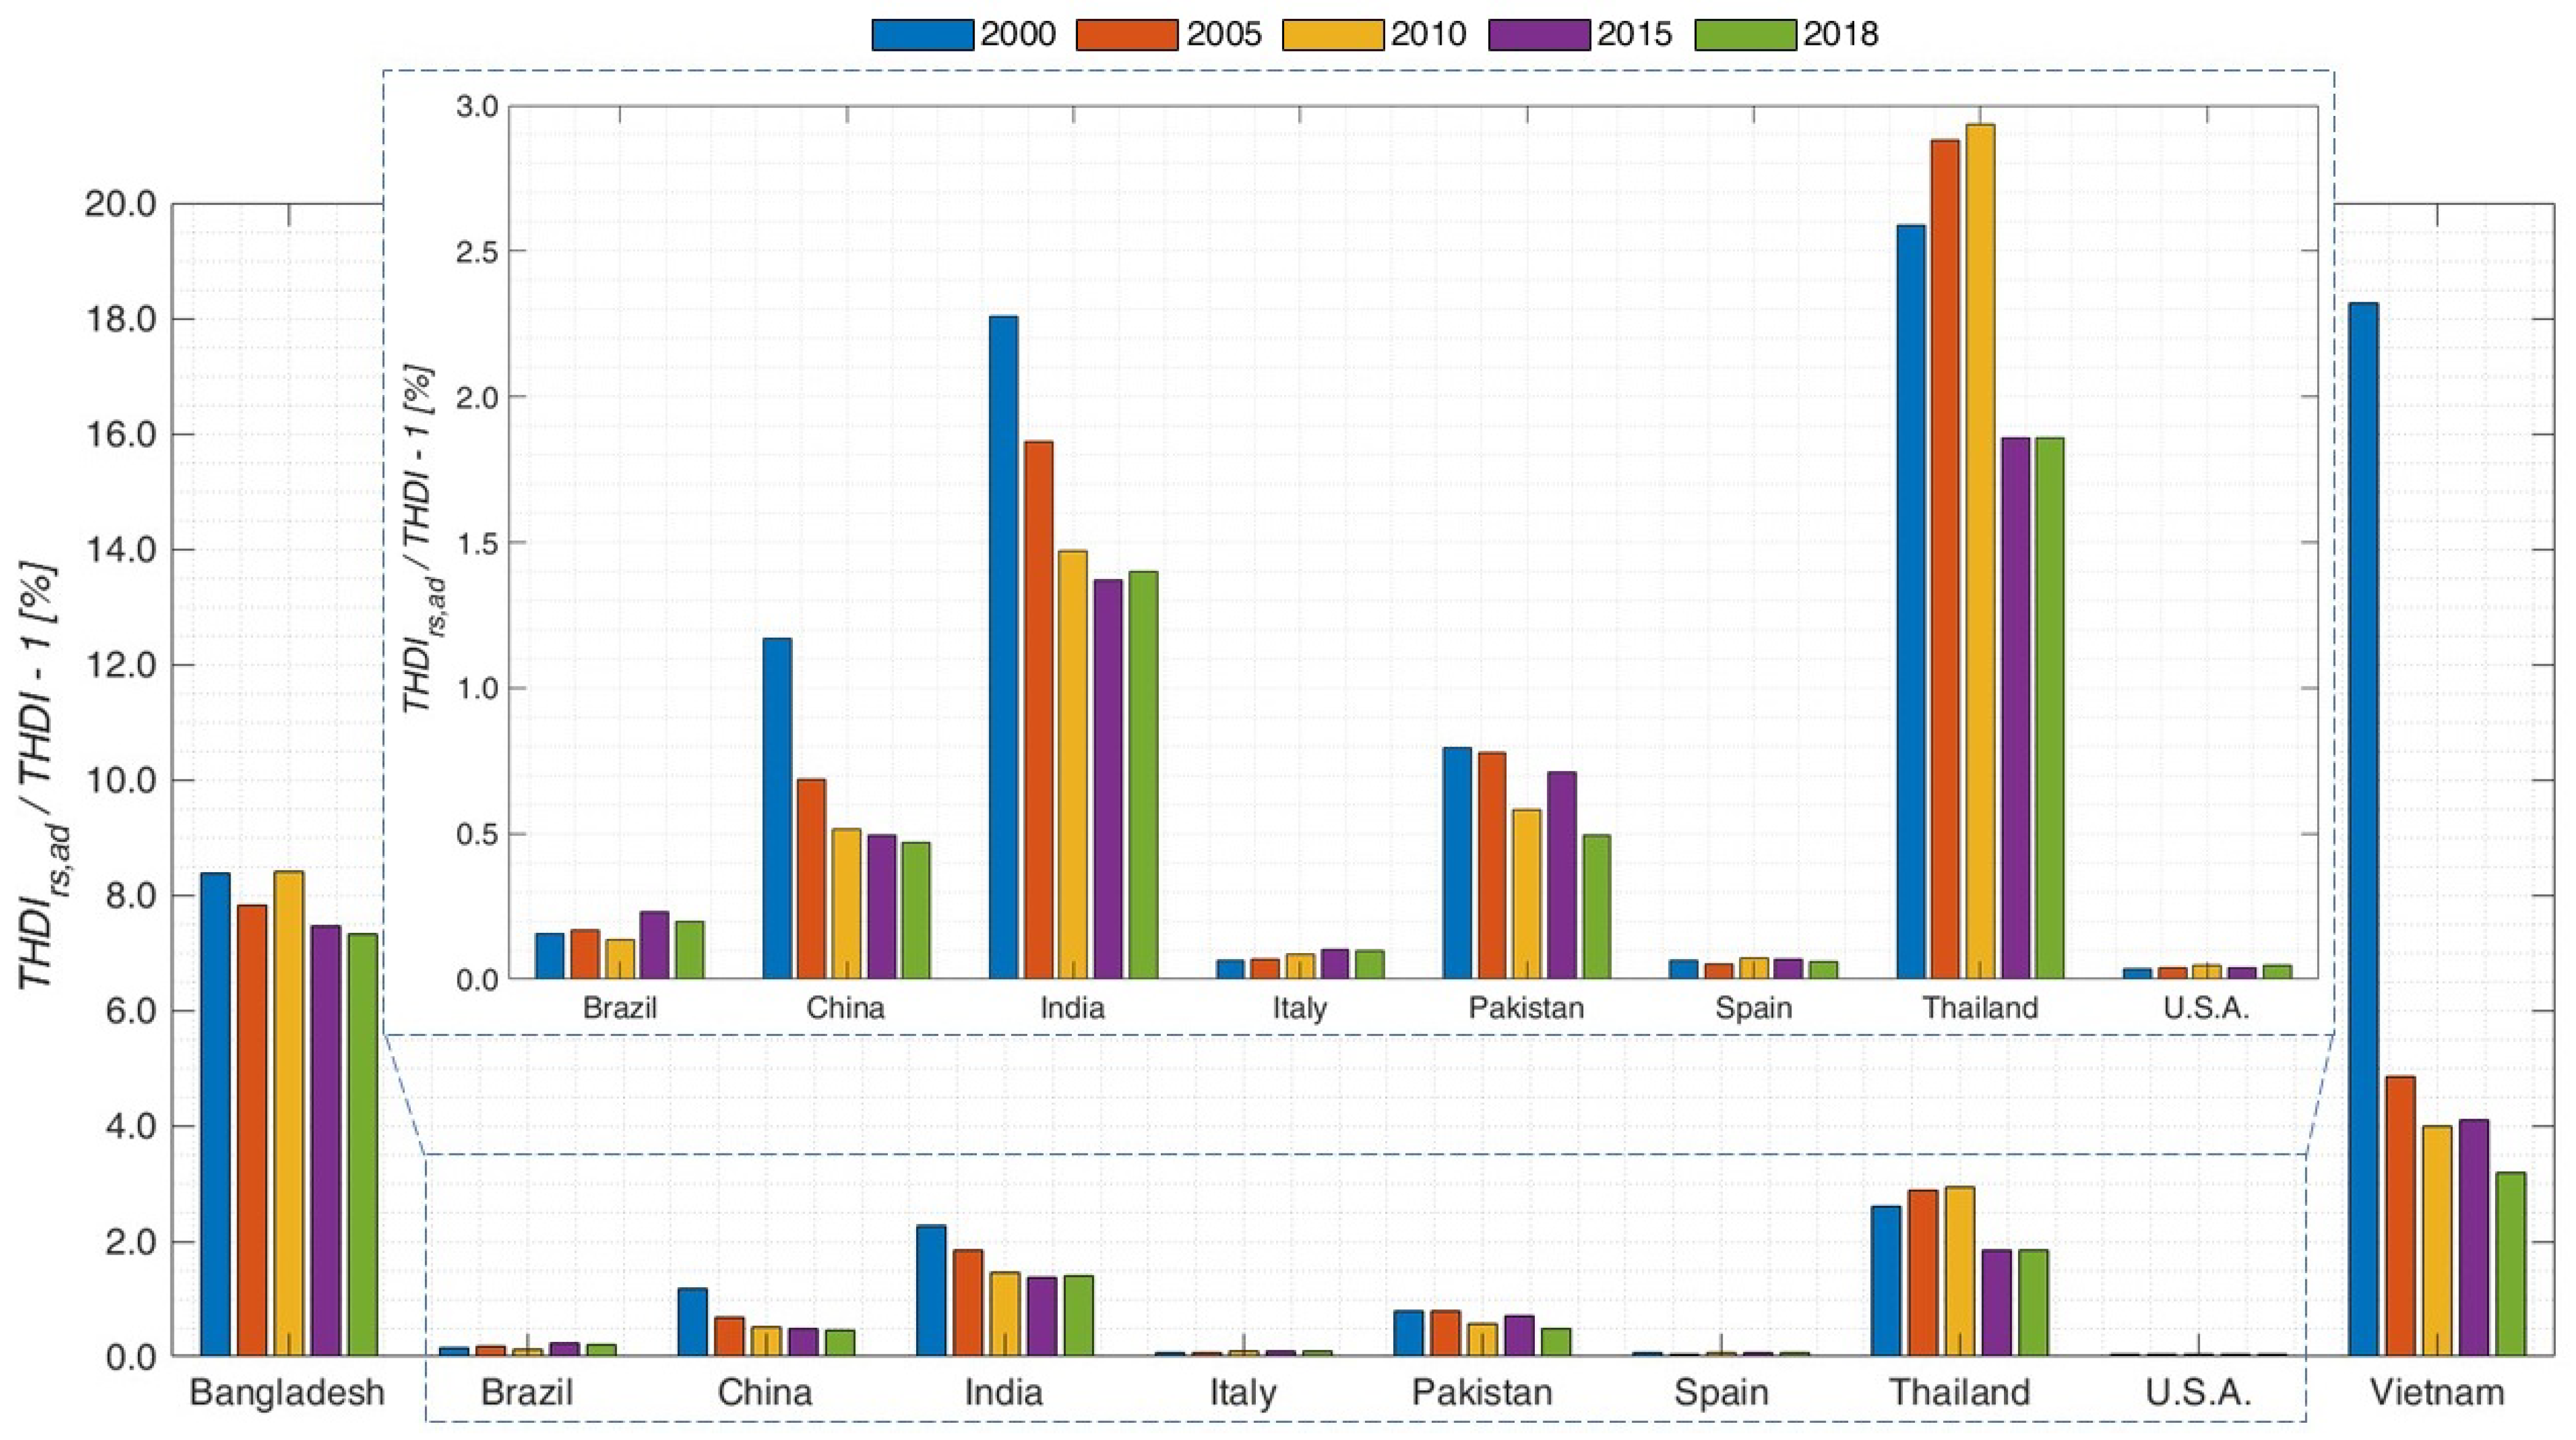
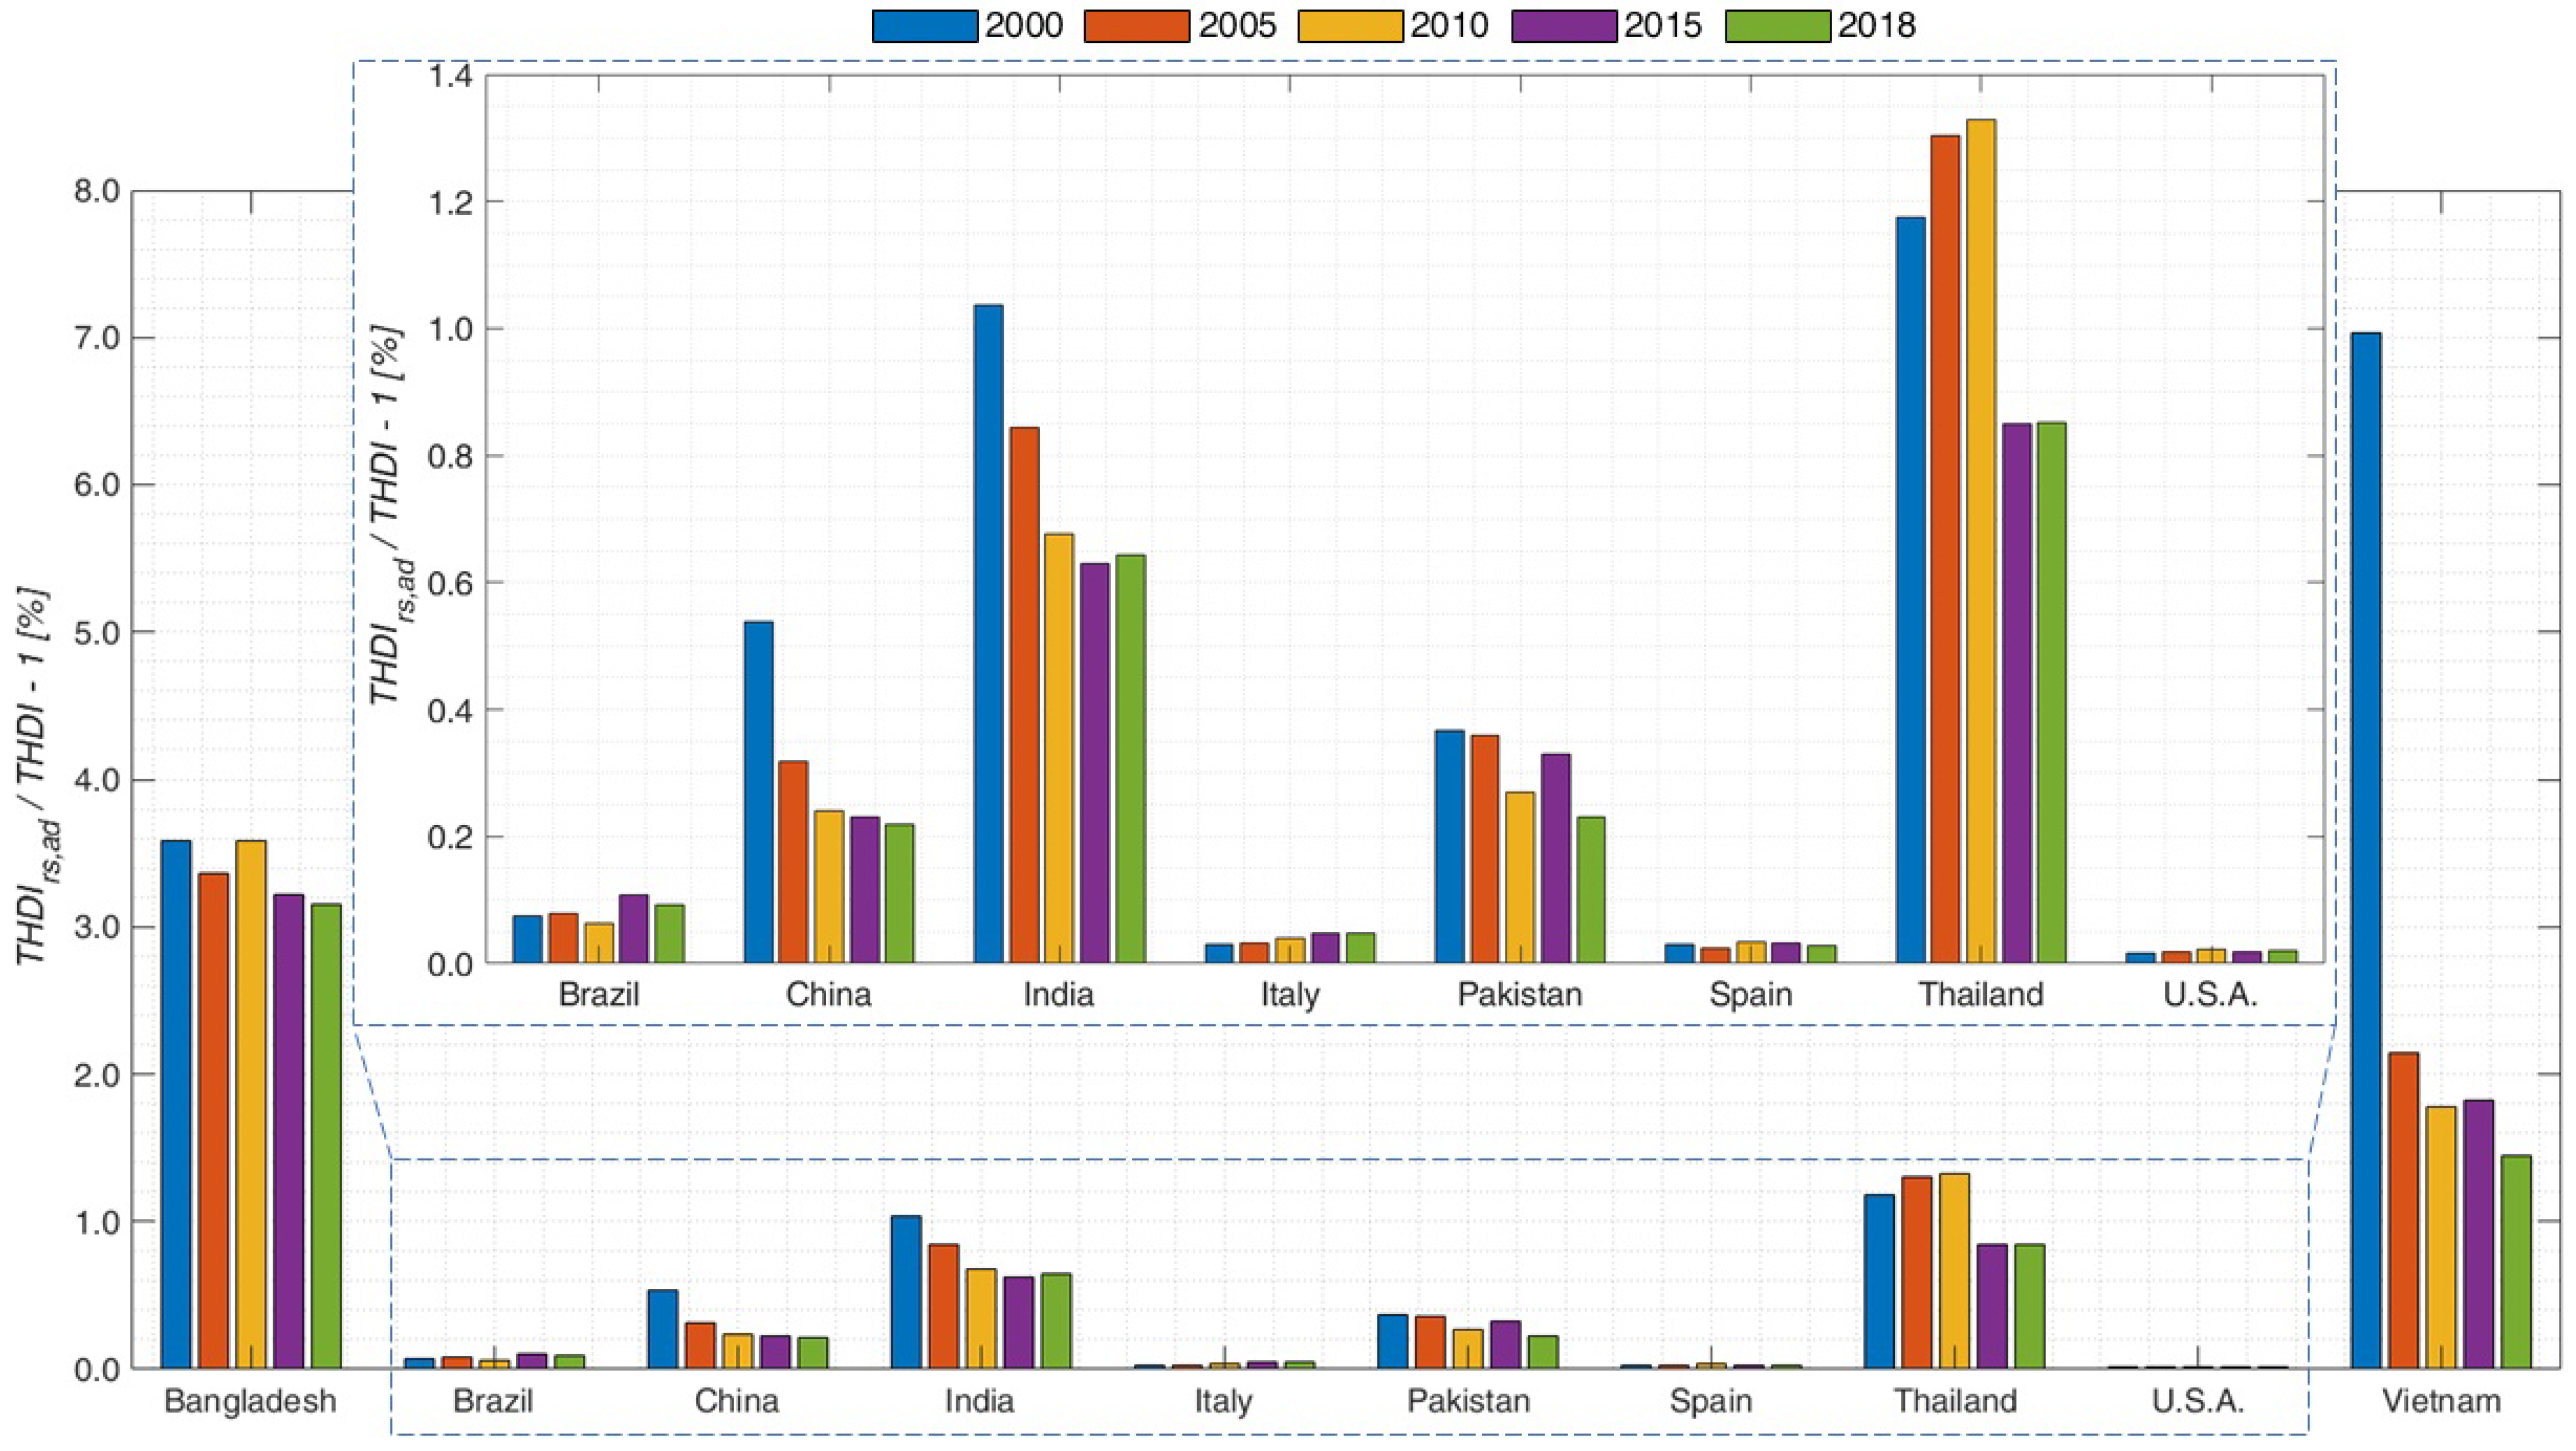
Improvements in Sustainability Due to Avoiding Rice Straw Burning on Field

In this paper, biomethanation by anaerobic digestion has been considered as a sustainable alternative to burning rice straw on field. Thus, the related possible CO 2 , e q reduction has been analysed by considering the data summarised in [43,65] together with the AR5 Global Warming Potentials ( G W P ). Then, the sustainability of the biomethanation was analysed by introducing the THDI indicator. This index has been evaluated using Equations (8) and (9).
We must highlight that the countries considered presented different trends in carbon dioxide equivalent emissions, CO 2 , e q , during the period 2000–2018, as shown in Figure 3. Indeed, if we consider the overall ratio ( CO 2 , e q 2018 CO 2 , e q 2000 ) / CO 2 , e q 2000 , the values are positive (increased emissions) for most developing countries, such as: Bangladesh +64%, China +175%, India +123%, Pakistan +86%, Thailand +61%, and Vietnam +477%, while it is negative (decreased emissions) for the following countries: Brazil −21%, Italy −21%, Spain −4%, and U.S.A. −10%.
On the other hand, all the countries improved their Life Expectancy Index ( L E I ), Income Index ( I I ), and Educational Index ( E I ) during the time period considered, as shown in Table 13.
Thus, we calculated the THDI (Equation (11)) in order to quantify the effect on sustainability of biomethanation by anaerobic digestion. The amount of rice straw considered was half that available in each country, which corresponds to the amount actually burned in open fields. In Figure 4, Figure 5 and Figure 6, the ratio ( T H D I r s T H D I ) / T H D I is reported, considering, respectively, the previous k coefficient values (from Equation (1)) of 0.70, 1.35, and 1.50. THDI was evaluated only in relation to the reduction in carbon dioxide equivalent emissions due to anaerobic digestion of rice straw; indeed, at first approximation, the socio–economic effect of biomethane production from anaerobic digestion of rice straw should result in income redistribution. Rice straw barrels represent a new source of income for farmers and a reduction in sales of fossil-fuel-derived methane. Consequently, in this introductory approach the income index is considered unchanged for all the continents.
A more detailed analysis requires designing the biomethane production chain, which can be developed by a local techno–economic analysis because agricultural processes are different across continents and are locally dependent. For instance, in Italy, biomethane production from agricultural and zootechnic wastes has been estimated to have generated approximately 12,000 new jobs through the year 2019 [76].
The results highlight how the use of rice straw could be very interesting from a sustainable viewpoint, but also from a socio-economic one. However, we are unable to estimate the economic value of rice straw barrels due to cost fluctuations in the energy market. This could be the next step, but it must be based on local energy market constraints.

4. Discussion

Biofuels from renewable organic biomass could represent an interesting resource to decrease the use of fossil fuels and greenhouse gas emissions (particularly related to transportation) and to improve local economies [79]; the production of sustainable fuels has been estimated to eliminate the 68% of the global warming potential [3]. Recently, great effort has been put into research to establish biofuel production from not only second-generation biomass, but also third-generation biomass. In this context, straw or wood residues represent field residue [80].
Rice is the most important staple food, providing nutrition and calories for over half of the world’s human population [81]. Consequently, rice straw could represent an ideal resource for biofuel production because it is a waste product of food production; consequently, it does not compete with food availability [82]. Indeed, in 2009, 915 Mt of rice straw were produced [3]; this amount represents great potential for bio-methane, biofuel, and bioplastic production. In some areas of the world, the surplus of rice straw is frequently removed from fields by open-field burning, which consequently increases environmental pollution, even if it is economically convenient for the farmer.
Thus, biofuel production from rice straw is a way to assign economic value to this residue, allowing farmers to use it in a more sustainable way. In this context, the rice straw barrel [42] could represent a metric for the financial market, analogous to a barrel of oil for fossil fuels.
Waste rice straw can be converted into biofuels by biological processes that use bacteria to convert the biomass into biofuel in anaerobic digestion conditions for methane production or fermentation of sugars for ethanol generation [3]. In particular, anaerobic digestion is a useful technology to treat animal and agro–industrial wastes and municipal sludge containing high organic content [5]. During anaerobic degradation of organic substrates, CO 2 and CH 4 are obtained as end products, with biomethane productivity depending on the reduced amount of organic carbon [83]. Among the variety of field residues available, rice straw presents an interesting capability for conversion into biomethane [12]. However, anaerobic digestion is conditioned by some constraints, as outlined in [84,85]:
  • The high C/N ratio of rice straw: This is a favourable nutrient balance both for anaerobic bacteria and for maintaining a steady environment. The C/N ratio can be in the range of 20–30 for anaerobic digestion and methanogenesis, 16–45 for hydrolysis, and 20–30 for methanogenesis [86];
  • The lignin, hemicellulose, and cellulose percentages of rice straw affect the microorganisms effects on the substrate;
  • The volatile fatty acids, temperature, and the pH. Volatile fatty acids (acetic acid, propionic acid, butyric acid, valeric acid, lactic acid, and formic acid) represent the most crucial intermediaries produced in anaerobic digestion and affect its stability [85]. They are generated when acids produced from hydrolysis and acidification cannot be consumed by methanogenic bacteria (for example Clostridium thermosuccinogenes and Clostridium cellulovorans [3]), resulting in a pH decrease and process destabilisation [5]. Indeed, the pH range for anaerobic digestion is from 6.8–7.2, with 6.5–7.3 providing the best results, 7.0 required for methanogenesis [3], and hydrolysis and acidogenesis occurring in the range of 5.5–6.5 [87]. Temperature affects the reaction velocity, the transport phenomena (diffusion), and chemical dissociation. Acceptable temperature ranges for digestion by anaerobic microorganism are 10–20 C for psychrophilic, 30–40 C for mesophilic, and 50–60 C for thermophilic microorganisms, with thermophilic conditions preferred to inactivate pathogenic populations [5];
  • The quality of inoculum, the feedstock-to-inoculum ratio, and the organic loading rate;
  • The pretreatment involved, mainly classified as: physical pretreatments (e.g., particle size reduction [3]), chemical pretreatments (e.g., alkaline pretreatment [50]), and biological pretreatments (e.g., fungal pretreatment [88]).
Thus, due to the complex organic structure of rice straw, it requires different catalytic activities by several enzymes to be broken down. The efficiency of cellulose degradation can be improved by symbiotic cooperation between cellulolytic and noncellulolytic bacteria [89]. In this context, it has been experimentally proven that microbial communities cultivated in mixtures of rice straw, chicken feces, pig feces, cattle feces, and sugar cane dregs are able to degrade more than 60% of the rice straw within four days [90]. The bacterium able to initiate degradation have been identified by polymerase chain reaction Clostridium thermosuccinogenes. It is a strict anaerobe that lives in manure, beet pulp, soil, and mud [3]. A synergist effect has been shown during the degradation of rice straw by Clostridium cellulovorans involving both cellulosome and non-cellulosome enzymes working under mesophilic conditions [89]. The result of this symbiotic cooperation is the degradation of the rice straw in around 10 days without any type of pretreatement [3].
In order to improve anaerobic digestion, novel two-stage digesters have been developed [50], such as a novel, continuous anaerobic digester that uses hyacinth water as feedstock [91]. Moreover, some analytical models have been developed to optimise and control the anaerobic digestion process [92].
Rice straw conversion into biofuels has a long history, dating back to the 1930s when Richards and Norman [93] analysed the factors influencing anaerobic decomposition of rice straw, and Acharya [94] improved the study of anaerobic decomposition of rice straw. However, the current growing interest in anaerobic rice straw digestion is driven by the requirements of a more efficient use of renewable energy sources in order to reduce greenhouse gas emissions and to mitigate climate change. Indeed, rice straw can be utilized to produce biofuels (e.g., a potential of 205 GL yr 1 of ethanol to replace 147 GL yr 1 of gasoline [3]) and bioplastics, but it requires pretreatment in order to alter the interactions of cellulose, hemicellulose, and lignin and to increase the accessibility of cellulose, to remove the lignin–carbohydrates complexes, and to reduce the cellulose crystallinity.
Lastly, we wish to highlight that the sustainable use of rice straw must consider the needs of some countries where 20% of the rice straw is used for the pulp and paper industry: this rice straw cannot be used for energy because of the social and economic needs of people in these countries. For example, in rural China, out of a total of 740 Mt of rice straw in 2006, an estimated 47% was used for household cooking and heating [3]. When rice straw is stolen from these people, preferable access to sustainable energy systems should be ensured for them.

5. Conclusions

Methanization of rice straw is considered one of the most environmentally friendly processes to convert this biomass into biofuels, as it reduces greenhouse gas emissions and mitigates climate change. Indeed, less energy input is required compared to other conversion or feedstock processes [3].
In this paper, we evaluated the number of rice straw barrels available from defined areas. Then, we calculated the total annual biomethane yield for these areas by considering the specific biomethane yield potential in the range of 92–280 L kg V S 1 (depending on different inocula, pretreatments, and working temperature) [3].
For each straw barrel, depending on the specific biomethane yield, we obtained the following quantities: 23.36 m 3 ( V S = 73.8 % T S , 92 L kg V S 1 ), 26.61 m 3 ( V S = 84.08 % T S , 186 L kg V S 1 ), and 29.27 m 3 ( V S = 95.26 % T S , 280 L kg V S 1 ). Moreover, equivalent carbon dioxide emissions can be reduced by approximately 754 kg for each R S B by substituting the current practice of burning rice straw in open fields with methanation via anaerobic digestion. In this context, the THDI index was introduced in order to evaluate the effect on sustainability of converting rice straw into biomethane instead of its open-field burning for the major rice producing countries.

Author Contributions

Conceptualization, U.L. and G.G.; methodology, U.L. and G.G.; software, G.G.; validation, D.F.; formal analysis, U.L.; investigation, G.G.; resources, D.F.; data curation, G.G.; writing—original draft preparation, U.L. and G.G.; writing—review and editing, U.L., D.F. and G.G.; visualization, G.G.; supervision, D.F.; project administration, U.L. and D.F.; funding acquisition, U.L. and D.F. All authors have read and agreed to the published version of the manuscript.

Funding

This research received no external funding.

Institutional Review Board Statement

Not applicable.

Informed Consent Statement

Not applicable.

Data Availability Statement

Data were collected from the references quoted in the text.

Acknowledgments

Two of the authors (U.L. and G.G.) must thank M. Bressan (DENERG, Politecnico di Torino, Italy) for all the discussions with him on his previous results on rice straw barrels obtained together with V. Giaretto and E. Campagnoli.

Conflicts of Interest

The authors declare no conflict of interest.

Abbreviations

The following abbreviations and quantities are used in this manuscript:
ADAnaerobic Digestion
E I Educational Index
G W P Global Warming Potential
H D I Human Development Index
I I Income Index
kCoefficient
L E I Life Expectancy Index
mMass (kg)
rRice
r s Rice Straw
R S B Rice Straw Barrel
THDIThermodynamic Human Development Index
TSTotal Solids
V ˙ CH 4 Annual biomethane potential yield ( m 3 yr 1 )
VSVolatile Solids

References

  1. Meraj, S.; Liaquat, R.; Naqvi, S.R.; Sheikh, Z.; Zainab, A.; Khoja, A.H.; Juchelkova, D.; Atabani, A. Enhanced Methane Production from Anaerobic Co-Digestion of Wheat Straw Rice Straw and Sugarcane Bagasse: A Kinetic Analysis. Appl. Sci. 2021, 11, 6069. [Google Scholar] [CrossRef]
  2. Hathaway, M.; Boff, L. The Tao of Liberation. Exploring the Ecology of Transformation; Orbis Book: Maryknoll, NY, USA, 2009. [Google Scholar]
  3. Mussoline, W.; Esposito, G.; Giordano, A.; Lens, P. The Anaerobic Digestion of Rice Straw: A Review, Critical Reviews. Crit. Rev. Environ. Sci. Technol. 2013, 43, 895–915. [Google Scholar] [CrossRef]
  4. Sari, F.P.; Budiyono, B. Enhanced biogas production from rice straw with various pretreatment: A review. Waste Technol. 2014, 2, 17–25. [Google Scholar] [CrossRef]
  5. Mothe, S.; Polisetty, V.R. Review on anaerobic digestion of rice straw for biogas production. Environ. Sci. Pollut. Res. 2021, 28, 24455–24469. [Google Scholar] [CrossRef] [PubMed]
  6. Dehghani, M.; Karimi, K.; Sadeghi, M. Pretreatment of rice straw for the improvement of biogas production. Energy Fuels 2015, 29, 3770–3775. [Google Scholar] [CrossRef]
  7. Kadam, K.L.; Forrest, L.H.; Jacobson, W.A. Rice straw as a lignocellulosic resource: Collection, processing, transportation, and environmental aspects. Biomass Bioenergy 2003, 18, 369–389. [Google Scholar] [CrossRef]
  8. Liu, Z.; Xu, A.; Zhao, T. Energy from Combustion of Rice Straw: Status and Challenges to China. Energy Power Eng. 2011, 3, 325–331. [Google Scholar] [CrossRef] [Green Version]
  9. Nizamuddin, S.; Qureshi, S.S.; Baloch, H.A.; Siddiqui, M.T.H.; Takkalkar, P.; Mubarak, N.M.; Dumbre, D.K.; Griffin, G.J.; Madapusi, S.; Tanksale, A. Microwave Hydrothermal Carbonization of Rice Straw: Optimization of Process Parameters and Upgrading of Chemical, Fuel, Structural and Thermal Properties. Materials 2019, 12, 403. [Google Scholar] [CrossRef] [Green Version]
  10. Robles-Jimarez, H.R.; Sanjuan-Navarro, L.; Jornet-Martínez, N.; Primaz, C.T.; Teruel-Juanes, R.; Molins-Legua, C.; Ribes-Greus, A.; Campíns-Falcó, P. New silica based adsorbent material from rice straw and its in-flow application to nitrate reduction in waters: Process sustainability and scale-up possibilities. Sci. Total Environ. 2022, 805, 150317. [Google Scholar] [CrossRef]
  11. Lucia, U.; Grisolia, G. Cyanobacteria and microalgae: Thermoeconomic considerations in biofuel production. Energies 2018, 11, 156. [Google Scholar] [CrossRef] [Green Version]
  12. Pore, S.D.; Shetty, D.; Arora, P.; Maheshwari, S.; Dhakephalkar, P.K. Metagenome changes in the biogas producing community during anaerobic digestion of rice straw. Bioresour. Technol. 2015, 213, 50–53. [Google Scholar] [CrossRef] [PubMed]
  13. Gao, J.; Chen, L.; Yuan, K.; Huang, H.; Yan, Z. Ionic liquid pretreatment to enhance the anaerobic digestion of lignocellulosic biomass. Bioresour. Technol. 2013, 150, 352–358. [Google Scholar] [CrossRef] [PubMed]
  14. Chen, Y.; Cheng, J.J.; Creamer, K.S. Inhibition of anaerobic digestion process: A review. Bioresour. Technol. 2008, 99, 4044–4064. [Google Scholar] [CrossRef] [PubMed]
  15. Goodman, B.A. Utilization of waste straw and husks from rice production: A review. J. Bioresour. Bioprod. 2020, 5, 143–162. [Google Scholar] [CrossRef]
  16. Yadav, B.; Talan, A.; Tyagi, R.D.; Drogui, P. Concomitant production of value-added products with polyhydroxyalkanoate (PHA) synthesis: A review. Bioresour. Technol. 2021, 337, 125419. [Google Scholar] [CrossRef]
  17. Saratale, G.D.; Saratale, R.G.; Varjani, S.; Cho, S.K.; Ghodake, G.S.; Kadam, A.; Mulla, S.I.; Bharagava, R.N.; Kim, D.S.; Shin, H.S. Development of ultrasound aided chemical pretreatment methods to enrich saccharification of wheat waste biomass for polyhydroxybutyrate production and its characterization. Ind. Crops Prod. 2020, 150, 112425. [Google Scholar] [CrossRef]
  18. Thuoc, D.V.; Chung, N.T.; Hatti-Kaul, R. Polyhydroxyalkanoate production from rice straw hydrolysate obtained by alkaline pretreatment and enzymatic hydrolysis using Bacillus strains isolated from decomposing straw. Bioresour. Bioprocess. 2021, 8, 98. [Google Scholar] [CrossRef]
  19. FAO–Food and Agriculture Organization of the United Nations. Rice Market Monitor; Technical Report; FAO: Rome, Italy, 2017. [Google Scholar]
  20. Food and Agriculture Organization of the United Nations. Crops and Livestock Products–Rice, Paddy. 2022. Available online: https://www.fao.org/faostat/en/#data/QCL (accessed on 6 March 2022).
  21. Satlewal, A.; Agrawal, R.; Bhagia, S.; Das, P.; Ragauskas, A.J. Rice straw as a feedstock for biofuels: Availability, recalcitrance, and chemical properties. Biofuels Bioprod. Biorefin. 2017, 12, 83–107. [Google Scholar] [CrossRef]
  22. Sadimantara, G.R.; Nuraida, W.; Suliartini, N.W.S.; Muhidin, M. Evaluation of some new plant type of upland rice (Oryza sativa L.) lines derived from cross breeding for the growth and yield characteristics. In IOP Conference Series: Earth and Environmental Science; IOP Publishing Ltd.: Bristol, UK, 2018; Volume 157, p. 012048. [Google Scholar] [CrossRef]
  23. Purwanto, O.D.; Palobo, F.; Tirajoh, S. Growth and yield of superior rice (Oryza sativa L.) varieties on different planting systems in Papua, Indonesia. SVU-Int. J. Agric. Sci. 2020, 2, 242–255. [Google Scholar] [CrossRef]
  24. Phung, H.P.; Nguyen, L.D.; Nguyen-Huy, T.; Le-Toan, T.; Apan, A.A. Monitoring rice growth status in the Mekong Delta, Vietnam using multitemporal Sentinel-1 data. J. Appl. Remote Sens. 2020, 14, 1–23. [Google Scholar] [CrossRef] [Green Version]
  25. Thuan, D.T.; Nguyen, D.T.; Nguyen, H.T. Deepwater rice in northern Vietnam. In Proceedings of the 1981 International Deeppwater Rice Workshop, Bangkok, Thailand, 2–6 November 1981; IRRI: Los Banos, CA, USA, 1981. [Google Scholar]
  26. Binod, P.; Sindhu, R.; Singhania, R.R.; Vikram, S.; Devi, L.; Nagalakshmi, S.; Kurien, N.; Sukumaran, R.K.; Pandey, A. Bioethanol production from rice straw: An overview. Bioresour. Technol. 2010, 101, 4767–4774. [Google Scholar] [CrossRef] [PubMed]
  27. Zeigler, R.S.; Barclay, A. The Relevance of Rice. Rice 2008, 1, 3–10. [Google Scholar] [CrossRef] [Green Version]
  28. Romasanta, R.R.; Sander, B.O.; Gaihre, Y.K.; Alberto, M.C.; Gummert, M.; Quilty, J.; Nguyen, V.H.; Castalone, A.G.; Balingbing, C.; Sandro, J.; et al. How does burning of rice straw affect CH4 and N2O emissions? A comparative experiment of different on-field straw management practices. Agric. Ecosyst. Environ. 2017, 239, 143–153. [Google Scholar] [CrossRef]
  29. Yuan, Q.; Huang, X.; Rui, J.; Qiu, S.; Conrad, R. Methane production from rice straw carbon in five different methanogenic rice soils: Rates, quantities and microbial communities. Acta Geochim. 2020, 39, 181–191. [Google Scholar] [CrossRef]
  30. Linquist, B.A.; Adviento-Borbe, M.A.; Pittelkow, C.M.; van Kessel, C.; van Groenigen, K.J. Fertilizer management practices and greenhouse gas emissions from rice systems: A quantitative review and analysis. Field Crops Res. 2012, 135, 10–21. [Google Scholar] [CrossRef]
  31. Meier, E.A.; Thorburn, P.J.; Kragt, M.E.; Dumbrell, N.P.; Biggs, J.S.; Hoyle, F.C.; Rees, H. Greenhouse gas abatement on southern Australian grains farms: Biophysical potential and financial impacts. Agric. Syst. 2017, 155, 147–157. [Google Scholar] [CrossRef]
  32. Sarkar, N.; Ghosh, S.K.; Bannerjee, S.; Aikat, K. Bioethanol production from agricultural wastes: An overview. Renew. Energy 2011, 37, 19–27. [Google Scholar] [CrossRef]
  33. Liu, C.; Lu, M.; Cui, J.; Li, B.; Fang, C.M. Effects of straw carbon input on carbon dynamics in agricultural soils: A meta-analysis. Glob. Chang. Biol. 2014, 20, 1366–1381. [Google Scholar] [CrossRef]
  34. Gummert, M.; Hung, N.; Chivenge, P.; Douthwaite, D. Sustainable Rice Straw Management; Springer: Cham, Switzerland, 2019. [Google Scholar]
  35. Singh, B.; Shan, Y.; Johnson-Beebout, S.; Singh, Y.; Buresh, R. Chapter 3 Crop Residue Management for Lowland Rice-Based Cropping Systems in Asia. Adv. Agron. 2008, 98, 117–199. [Google Scholar] [CrossRef]
  36. IEA Bioenergy. Carbon Neutrality. 2022. Available online: https://www.ieabioenergy.com/iea-publications/faq/woodybiomass/carbon-neutrality/ (accessed on 17 March 2022).
  37. Johnson, E. Goodbye to carbon neutral: Getting biomass footprints right. Environ. Impact Assess. Rev. 2009, 29, 165–168. [Google Scholar] [CrossRef]
  38. Kotas, T.J. The Exergy Method of Thermal Plant Analysis; Butterworth-Heinemann: Oxford, UK, 1985. [Google Scholar]
  39. Amini, S.H.; Remmerswaal, J.A.M.; Castro, M.B.; Reuter, M.A. Quantifying the quality loss and resource efficiency of recycling by means of exergy analysis. J. Clean. Prod. 2007, 15, 907–913. [Google Scholar] [CrossRef]
  40. Jacobson, M.Z. Effects of biomass burning on climate, accountingfor heat and moisture fluxes, black and browncarbon, and cloud absorption effects. J. Geophys. Res. Atmos. 2014, 119, 8980–9002. [Google Scholar] [CrossRef]
  41. Boontian, B. Conditions of the Anaerobic Digestion of Biomass. Int. J. Environ. Ecol. Eng. 2014, 8, 1036–1040. [Google Scholar] [CrossRef]
  42. Bressan, M.; Campagnoli, E.; Ferro, C.G.; Giaretto, V. Rice straw: A waste with a remarkable green energy potential. Energies 2022, 15, 1355. [Google Scholar] [CrossRef]
  43. Kumar, S.; Casper D’ Silva, T.; Chandra, R.; Malik, A.; Vijay, V.K.; Misra, A. Strategies for boosting biomethane production from rice straw: A systematic review. Bioresour. Technol. Rep. 2021, 15, 100813. [Google Scholar] [CrossRef]
  44. Wang, S.; Sun, X.; Yuan, Q. Strategies for enhancing microbial tolerance to inhibitors for biofuel production: A review. Bioresour. Technol. 2018, 258, 302–309. [Google Scholar] [CrossRef]
  45. Zheng, Y.; Zhao, J.; Xu, F.; Li, Y. Pretreatment of lignocellulosic biomass for enhanced biogas production. Prog. Energy Combust. Sci. 2014, 42, 35–53. [Google Scholar] [CrossRef]
  46. Hobbs, S.R.; Landis, A.E.; Rittmann, B.E.; Young, M.N.; Parameswaran, P. Enhancing anaerobic digestion of food waste through biochemical methane potential assays at different substrate: Inoculum ratios. Waste Manag. 2018, 71, 612–617. [Google Scholar] [CrossRef] [Green Version]
  47. Neue, H.U.; Scharpenseel, H.W. Decomposition pattern of 14C-labeled rice straw in aerobic and submerged rice soils of the Philippines. Sci. Total Environ. 1987, 62, 431–434. [Google Scholar] [CrossRef]
  48. Adahama, A.B.; Adeleke, A.O.; Olulana, A.O.; Ibitoye, S.A. Effects of stamped charging on the strength of coke from the weakly caking australian agro-allied coal blend mixed with coke breeze. J. Miner. Mater. Charact. Eng. 2008, 7, 347–353. [Google Scholar] [CrossRef]
  49. Staffas, L.; Tufvessan, L.; Scvenfelt, A.; Toren, J.; Arushanyan, Y. Alternative Sources for Products Competing with Forest-Based Biofuel, a Pre-Study; Technical Report; Swedish Environmental Research Institute: Stockholm, Swden, 2013. [Google Scholar]
  50. Chau Ngan, N.V.; Chan, F.M.S.; Sy Nam, T.; Van Thao, H.; Maguyon-Detras, M.C.; Vuong Hung, D.; Cuong, D.M.; Hung, N.V. Anaerobic Digestion of Rice Straw for Biogas Production. In Sustainable Rice Straw Management; Gummert, M., Hung, N.V., Chivenge, P., Douthwaite, B., Eds.; Springer Open: Cham, Switzerland, 2020; Chapter 5. [Google Scholar]
  51. Fu, Y.; Luo, T.; Mei, Z.; Li, J.; Qiu, K.; Ge, Y. Dry Anaerobic Digestion Technologies for Agricultural Straw and Acceptability in China. Sustainability 2018, 10, 4588. [Google Scholar] [CrossRef] [Green Version]
  52. Tait, S.; Tamis, J.; Edgerton, B.; Batstone, D.J. Anaerobic digestion of spent bedding from deep litter piggery housing. Bioresour. Technol. 2009, 100, 2210–2218. [Google Scholar] [CrossRef] [PubMed]
  53. Lucia, U.; Grisolia, G. The Gouy-Stodola Theorem–From Irreversibility to Sustainability—The Thermodynamic Human Development Index. Sustainability 2021, 13, 3995. [Google Scholar] [CrossRef]
  54. Lucia, U.; Grisolia, G. Irreversible Thermodynamics and Bioeconomy: Toward a Human-Oriented Sustainability. Front. Phys. 2021, 9, 659342. [Google Scholar] [CrossRef]
  55. Lucia, U.; Fino, D.; Grisolia, G. Thermoeconomic analysis of Earth system in relation to sustainability: A thermodynamic analysis of weather changes due to anthropic activities. J. Therm. Anal. Calorim. 2021, 145, 701–707. [Google Scholar] [CrossRef]
  56. Lucia, U.; Grisolia, G. Biofuels Analysis Based on the THDI Indicator of Sustainability. Front. Energy Res. 2021, 9, 794682. [Google Scholar] [CrossRef]
  57. Lucia, U.; Fino, D.; Grisolia, G. A thermoeconomic indicator for the sustainable development with social considerations (A thermoeconomy for sustainable society). Environ. Dev. Sustain. 2022, 24, 2022–2036. [Google Scholar] [CrossRef]
  58. Available online: http://www.osservatorionovara.it (accessed on 17 March 2022).
  59. Available online: http://www.arpa.piemonte.it (accessed on 17 March 2022).
  60. Wang, J.; Chen, X.; Wei, J. Decomposition of Rice Straw and Corn Straw Under Aerobic and Anaerobic Conditions. J. Agric. Resour. Environ. 2017, 34, 59–65. [Google Scholar] [CrossRef]
  61. Wachenheim, D.E.; Patterson, J.A.; Ladisch, M.R. Analysis of the logistic function model: Derivation and applications specific to batch cultured microorganisms. Bioresour. Technol. 2003, 86, 157–164. [Google Scholar] [CrossRef]
  62. Chen, X.; Zhang, Y.L.; Gu, Y.; Liu, Z.; Shen, Z.; chu, H.; Zhou, X. Enhancing methane production from rice straw by extrusion pretreatment. Appl. Energy 2014, 122, 34–41. [Google Scholar] [CrossRef]
  63. Allen, J.; Pascual, K.S.; Romasanta, R.R.; Trinh, M.V.; Thach, T.V.; Hung, N.V.; Sander, B.O.; Chivenge, P. Rice Straw Management Effects on Greenhouse Gas Emissions and Mitigation Options. In Sustainable Rice Straw Management; Gummert, M., Hung, N.V., Chivenge, P., Douthwaite, B., Eds.; Springer Open: Cham, Switzerland, 2020; Chapter 9. [Google Scholar]
  64. Van Hung, N.; Maguyon-Detras, M.C.; Migo, M.V.; Quilloy, R.; Balingbing, C.; Chivenge, P.; Gummert, M. Rice Straw Overview: Availability, Properties, and Management Practices. In Sustainable Rice Straw Management; Gummert, M., Hung, N.V., Chivenge, P., Douthwaite, B., Eds.; Springer Open: Cham, Switzerland, 2020; Chapter 1. [Google Scholar]
  65. Singh, R.; Kumar, S. A review on biomethane potential of paddy straw and diverse prospects to enhance its biodigestibility. J. Clean. Prod. 2019, 217, 295–307. [Google Scholar] [CrossRef]
  66. Javaid, A.; Akbar, A.; Nawaz, S. A Review on Human Development Index. Pak. J. Humanit. Soc. Sci. 2018, 6, 357–369. [Google Scholar] [CrossRef]
  67. UNDP Human Development Report Office. Concept and Measurement of Human Development; Human Development Report 1990; UNDP (United Nations Development Programme): New York, NY, USA, 1990. [Google Scholar]
  68. United Nations Development Program. Calculating the Human Development Indices–Graphical Presentation; Technical Notes HDR; United Nations: New York, NY, USA, 2020. [Google Scholar]
  69. World Bank Group. Life Expectancy at Birth, Total (Years). 2021. Available online: https://data.worldbank.org/indicator/SP.DYN.LE00.IN (accessed on 17 March 2021).
  70. Torchio, M.F.; Lucia, U.; Grisolia, G. Economic and human features for energy and environmental indicators: A tool to assess countries’ progress towards sustainability. Sustainability 2020, 12, 9716. [Google Scholar] [CrossRef]
  71. Hickel, J. The sustainable development index: Measuring the ecological efficiency of human development in the anthropocene. Ecol. Econ. 2020, 167, 106331. [Google Scholar] [CrossRef]
  72. Bejan, A. Advanced Engineering Thermodynamics; John Wiley: Hoboken, NJ, USA, 2006. [Google Scholar]
  73. Grisolia, G.; Fino, D.; Lucia, U. Thermodynamic optimisation of the biofuel production based on mutualism. Energy Rep. 2020, 6, 1561–1571. [Google Scholar] [CrossRef]
  74. Lucia, U.; Grisolia, G. Unavailability percentage as energy planning and economic choice parameter. Renew. Sust. Energ. Rev. 2017, 75, 197–204. [Google Scholar] [CrossRef]
  75. Lucia, U.; Grisolia, G. Exergy inefficiency: An indicator for sustainable development analysis. Energy Rep. 2019, 5, 62–69. [Google Scholar] [CrossRef]
  76. Consorzio Italiano Biometano. Indagine Conoscitiva Sulle Prospettive di Attuazione e di Adeguamento della Strategia Energetica Nazionale al Piano Nazionale Energia e Clima per il 2030 (Italian). 2019. Available online: https://www.camera.it/application/xmanager/projects/leg18/attachments/upload_file_doc_acquisiti/pdfs/000/002/595/Memoria_CIB.pdf (accessed on 2 April 2022).
  77. Kainthola, J.; Shariq, M.; Kalamdhad, A.S.; Goud, V.V. Enhanced methane potential of rice straw with microwave assisted pretreatment and its kinetic analysis. J. Environ. Manag. 2019, 232, 188–196. [Google Scholar] [CrossRef]
  78. World Bank Group. Total Greenhouse Gas Emissions (kt of CO2 Equivalent). 2022. Available online: https://data.worldbank.org/indicator/EN.ATM.GHGT.KT.CE (accessed on 17 March 2022).
  79. Passoth, V.; Sandgren, M. Biofuel production from straw hydrolysates: Current achievements and perspectives. Appl. Microbiol. Biotechnol. 2019, 103, 5105–5116. [Google Scholar] [CrossRef] [Green Version]
  80. Gnansounou, E. Production and use of lignocellulosic bioethanol in Europe: Current situation and perspectives. Bioresour. Technol. 2010, 101, 4842–4850. [Google Scholar] [CrossRef]
  81. Arvanitoyannis, I.S.; Tserkezou, P. Corn and rice waste: A comparative and critical presentation of methods and current and potential uses of treated waste. Int. J. Food Sci. Technol. 2008, 43, 958–988. [Google Scholar] [CrossRef]
  82. Townsend, T.J.; Sparkes, D.L.; Wilson, P. Food and bioenergy: Reviewing the potential of dual-purpose wheat crops. Glob. Chang. Biol. Bioenergy 2017, 9, 525–540. [Google Scholar] [CrossRef]
  83. Rajagopal, R.; Massé, D.I.; Singh, G. A critical review on inhibition of anaerobic digestion process by excess ammonia. Bioresour. Technol. 2013, 143, 632–641. [Google Scholar] [CrossRef] [PubMed]
  84. Terashima, M.; Goel, R.; Komatsu, K.; Yasui, H.; Takahashi, H.; Li, Y.Y.; Noike, T. Bioresource Technology CFD simulation of mixing in anaerobic digesters. Bioresour. Technol. 2009, 100, 2228–2233. [Google Scholar] [CrossRef]
  85. Luo, L.; Gong, W.; Qin, L.; Ma, Y.; Ju, W.; Wang, H. Influence of liquidand solid-state coupling anaerobic digestion process on methane production of cow manure and rice straw. J. Mater. Cycles Waste Manag. 2018, 20, 1804–1812. [Google Scholar] [CrossRef]
  86. Atelge, M.R.; Krisa, D.; Kumar, G.; Eskicioglu, C.; Nguyen, D.D.; Chang, S.W.; Atabani, A.E.; Al-Muhtaseb, A.H.; Unalan, S. Biogas production from organic waste: Recent progress and perspectives. Waste Biomass Valorization 2020, 11, 1019–1040. [Google Scholar] [CrossRef]
  87. Shetty, D.J.; Kshirsagar, P.; Tapadia-Maheshwari, S.; Lanjekar, V.; Singh, S.K.; Dhakephalkar, P.K. Alkali pretreatment at ambient temperature: A promising method to enhance biomethanation of rice straw. Environ. Sci. Pollut. Res. 2017, 226, 80–88. [Google Scholar] [CrossRef]
  88. Zanellati, A.; Spina, F.; Rollé, L.; Varese, G.C.; Dinuccio, E. Fungal Pretreatments on Non-Sterile Solid Digestate to Enhance Methane Yield and the Sustainability of Anaerobic Digestion. Sustainability 2020, 12, 8549. [Google Scholar] [CrossRef]
  89. Tamaru, Y.; Miyake, H.; Kuroda, K.; Ueda, M.; Doi, R.H. Comparative genomics of the mesophilic cellulosome-producing Clostridium cellulovorans and its application to biofuel production via consolidated bioprocessing. Environ. Technol. 2010, 31, 889–903. [Google Scholar] [CrossRef]
  90. Haruta, S.; Cui, Z.; Huang, Z.; Li, M.; Ishii, M.; Igarashi, Y. Construction of a stable microbial community with high cellulose-degradation ability. Appl. Microbiol. Biotechnol. 2002, 59, 529–534. [Google Scholar] [CrossRef]
  91. Barua, V.B.; Kalamdhad, A.S. Biogas production from water hyacinth in a novel anaerobic digester: A continuous study. Process Saf. Environ. Prot. 2019, 127, 82–89. [Google Scholar] [CrossRef]
  92. Emebu, S.; Pecha, J.; Janáčová, D. Review on anaerobic digestion models: Model classification & elaboration of process phenomena. Renew. Sustain. Energy Rev. 2022, 160, 112288. [Google Scholar] [CrossRef]
  93. Richards, E.H.; Norman, A.G. The biological decomposition of plant materials: Some factors determining the quantity of nitrogen immobilised during decomposition. Biochem. J. 1931, 25, 1769–1778. [Google Scholar] [CrossRef] [PubMed] [Green Version]
  94. Acharya, C.N. Studies on the anaerobic decomposition of plant materials. III Comparison of the course of decomposition of rice straw under anaerobic, aerobic and partially aerobic conditions. Biochem. J. 1935, 29, 1116–1120. [Google Scholar] [CrossRef] [Green Version]
Figure 1. Global rice production (tons) from 2000–2020 based on FAO data [20].
Sustainability 14 05679 g001
Figure 2. Schematic assumptions used in our analysis, considering rice production, the related average rice straw production, its possible second use in the pulp and paper industry ( 20 % by weight) and the remainder (for which the available R S B are evaluated) that can be anaerobically digested in order to obtain biomethane.
Sustainability 14 05679 g002
Figure 3. Carbon dioxide equivalent emissions CO 2 , e q (Mt) in Bangladesh, Brazil, China, India, Italy, Pakistan, Spain, Thailand, United States of America, and Vietnam from 2000 (bottom bar for each country, red colour) to 2018 (top bar for each country, green colour); data from [78].
Sustainability 14 05679 g003
Figure 4. Yearly annual variation of the sustainability indicator THDI using Equation (11) to compare the current situation (50% of total rice straw burned on field) with anaerobic digestion of the same amount of rice straw to obtain biomethane using k = 0.70 in Equation (1).
Sustainability 14 05679 g004
Figure 5. Yearly annual variation of the sustainability indicator THDI by using Equation (11) to compare the current situation (50% of total rice straw burned on field) with anaerobic digestion of the same amount of rice straw to obtain biomethane, using k = 1.35 in Equation (1).
Sustainability 14 05679 g005
Figure 6. Yearly annual variation of the sustainability indicator THDI by using Equation (11) to compare the current situation (50% of total rice straw burned on field) with anaerobic digestion of the same amount of rice straw to obtain biomethane, using k = 1.50 in Equation (1).
Sustainability 14 05679 g006
Table 1. Area, plant height, and rice yield by region [20,21,22,23,24,25] for the year 2020. Rice yield is the ratio of overall rice grain production to harvested area.
CountryAreaPlant HeightYield
[Mha][mm][t ha 1 ]
China30.34362–4837.04
India45.00900–13003.96
Indonesia10.66701–9985.13
Japan1.461020–11706.64
Malaysia0.656313.60
Thailand10.401000–60002.91
United States1.21950–18808.54
Vietnam7.22900–17505.92
World164.19n.d.4.61
Table 2. Rice production by macro-area for the year 2020 [20].
ContinentRice Production
[Mt yr 1 ]
Africa37.9
Asia676.6
Australia0.1
Central America1.4
Europe4.1
Northern America10.3
Russian Federation1.1
South America25.0
World756.5
Table 3. Rice production by some of the leading countries on different continents; data from Ref. [20].
YearRice Production
BangladeshBrazilChinaIndiaItalyPakistanSpainThailandUSAVietnam
[ × 10 7 t][ × 10 7 t][ × 10 8 t][ × 10 8 t][ × 10 6 t][ × 10 6 t][ × 10 5 t][ × 10 7 t][ × 10 7 t][ × 10 7 t]
20003.761.111.901.271.237.208.272.580.873.25
20053.981.321.821.381.418.328.243.061.013.58
20105.011.121.971.441.527.239.283.571.104.00
20155.181.232.141.571.521.028.472.770.874.51
20205.491.112.141.781.518.427.393.021.034.28
Table 4. Calorific values of rice straw from different countries [21].
CountryCalorific Value
[ 10 6 J kg 1 ]
China18.0
India12.3–28.5
Malaysia15.1
Thailand11.7–16.3
United States11.5–15.3
Table 5. Densities of different forms of processed rice straw [21].
FormDensity
[kg m 3 ]
Baled110–200
Chopped40–80
Cubed320–640
Hammer milled40–100
Loose20–40
Pelleted560–720
Table 6. Numerical values of the coefficients in Equation (2) for Novara area during rice harvesting [42].
QuantityValueUnit of Measurement
m r 1828.8kg ha 1
m d 4262.2kg ha 1
k0.596month 1
Table 7. Cellulose content in relation to particle size [1].
SizeCellulose Content
[ mm ] [ % ]
<0.1584
0.15–0.1883
0.18–0.2176
0.21–0.2568
0.25–0.3061
0.30–0.4256
>0.4250
Table 8. Methane yield in term of volatile solids for different pretreatments [3,62].
Type of PretreatmentMethane YieldDigestion TemperatureTime Period
[ 10 3 m 3 kg VS 1 ] [ C][d]
Cut (3–5 mm)28022120
Pulverized21535120
Extrusion (<50 mm)2273545
2% NH 3 1903524
Table 9. Values used to perform the calculations: empirical coefficient k (Equation (1)), amount of volatile solids ( V S ) with respect to total solids ( % T S ), biomethane yield ( V ˙ CH 4 ).
QuantityMinimumAverageMaximumReferences
k0.701.351.50[3,6,7,8,9,10]
V S ( % T S )73.8084.0895.26[43]
V ˙ CH 4 ( × 10 3 m 3 kg V S 1 )92186280[3]
Table 10. Results for the Novara area in the year 2020. The minimum, average, and maximum values are based on data from Table 9. Subscripts A, B, and C in V ˙ CH 4 refer to biomethane yields of 92, 186, and 280 L kg V S 1 , respectively.
QuantityMin.Avg.Max.
m r s , A D (t)86,240166,320184,800
R S B ( × 10 5 ) 2.013.874.30
m V S (t)118,410260,171317,959
V ˙ CH 4 , A ( × 10 7 m 3 yr 1 )1.092.392.93
V ˙ CH 4 , B ( × 10 7 m 3 yr 1 )2.204.845.91
V ˙ CH 4 , C ( × 10 7 m 3 yr 1 )3.327.288.90
Table 11. Rice straw barrels ( R S B ) and potential annual biomethane production ( V ˙ CH 4 ) in Italy. Subscripts A, B, and C refer to biomethane yields of 92, 186, and 280 L kg V S 1 , respectively.
QuantityYear
20002005201020152020
Min.Avg.Max.Min.Avg.Max.Min.Avg.Max.Min.Avg.Max.Min.Avg.Max.
R S B ( × 10 6 ) 1.122.162.401.292.482.761.382.672.961.382.672.971.372.652.94
V ˙ CH 4 , A ( × 10 7 m 3 yr 1 ) 2.625.757.033.016.618.083.237.098.673.237.108.683.217.058.62
V ˙ CH 4 , B ( × 10 8 m 3 yr 1 ) 0.531.161.420.611.341.630.651.431.750.651.441.750.651.431.74
V ˙ CH 4 , C ( × 10 8 m 3 yr 1 ) 0.801.752.140.922.012.460.982.162.640.982.162.640.982.152.62
Table 12. Rice straw barrels ( R S B ) and potential annual biomethane production ( V ˙ CH 4 ) for major rice-producing countries. Subscripts A, B, and C refer to biomethane yields of 92, 186, and 280 L kg V S 1 , respectively.
QuantityYear
20002005201020152020
Min.Avg.Max.Min.Avg.Max.Min.Avg.Max.Min.Avg.Max.Min.Avg.Max.
Bangldesh
R S B ( × 10 7 ) 3.436.627.353.637.007.774.568.809.784.729.1110.125.019.6510.75
V ˙ CH 4 , A ( × 10 9 m 3 yr 1 ) 0.801.762.150.851.862.281.072.342.861.102.422.961.172.573.14
V ˙ CH 4 , B ( × 10 9 m 3 yr 1 ) 1.623.564.351.713.764.602.154.735.792.234.905.992.365.196.35
V ˙ CH 4 , C ( × 10 9 m 3 yr 1 ) 2.445.366.552.585.676.923.247.138.713.367.389.013.567.829.55
Brazil
R S B ( × 10 7 ) 1.021.962.181.202.322.581.021.982.191.122.162.401.011.952.17
V ˙ CH 4 , A ( × 10 8 m 3 yr 1 ) 2.375.216.372.816.177.542.395.266.422.625.757.032.365.196.34
V ˙ CH 4 , B ( × 10 9 m 3 yr 1 ) 0.481.051.290.571.251.520.481.061.300.531.161.420.481.051.28
V ˙ CH 4 , C ( × 10 9 m 3 yr 1 ) 0.721.591.940.861.882.300.731.601.960.801.752.140.721.581.93
China
R S B ( × 10 8 ) 1.733.343.711.663.203.561.803.473.851.953.764.181.953.764.17
V ˙ CH 4 , A ( × 10 10 m 3 yr 1 ) 0.400.891.090.390.851.040.420.921.130.461.001.220.461.001.22
V ˙ CH 4 , B ( × 10 10 m 3 yr 1 ) 0.821.802.190.781.722.100.851.872.280.922.022.470.922.022.47
V ˙ CH 4 , C ( × 10 10 m 3 yr 1 ) 1.232.703.301.182.593.171.282.813.431.383.043.721.383.043.72
India
R S B ( × 10 8 ) 1.162.242.491.262.422.691.312.532.811.432.753.061.633.133.48
V ˙ CH 4 , A ( × 10 9 m 3 yr 1 ) 2.715.967.292.936.447.873.076.748.233.337.328.953.808.3410.20
V ˙ CH 4 , B ( × 10 10 m 3 yr 1 ) 0.561.211.470.591.301.590.621.361.660.671.481.810.771.692.06
V ˙ CH 4 , C ( × 10 10 m 3 yr 1 ) 0.831.812.220.891.962.400.932.052.511.012.232.721.162.543.10
Pakistan
R S B ( × 10 7 ) 0.661.271.410.761.461.630.661.271.410.931.791.990.771.481.64
V ˙ CH 4 , A ( × 10 8 m 3 yr 1 ) 1.533.374.121.773.894.761.543.384.142.174.775.831.793.944.81
V ˙ CH 4 , B ( × 10 8 m 3 yr 1 ) 3.106.818.333.587.879.623.116.848.364.399.6511.843.627.969.73
V ˙ CH 4 , C ( × 10 9 m 3 yr 1 ) 0.471.031.250.541.181.450.471.031.260.661.451.780.551.201.47
Spain
R S B ( × 10 6 ) 0.751.451.620.751.451.610.861.631.810.771.491.650.671.301.44
V ˙ CH 4 , A ( × 10 7 m 3 yr 1 ) 1.763.874.731.753.864.711.984.345.301.803.964.841.573.464.23
V ˙ CH 4 , B ( × 10 7 m 3 yr 1 ) 3.567.829.563.557.799.533.998.7810.703.658.019.793.186.998.54
V ˙ CH 4 , C ( × 10 8 m 3 yr 1 ) 0.541.181.440.531.171.430.601.321.610.551.211.470.481.051.29
Thailand
R S B ( × 10 7 ) 2.364.545.052.795.395.993.256.286.972.534.875.412.765.325.91
V ˙ CH 4 , A ( × 10 9 m 3 yr 1 ) 0.551.211.480.651.431.750.761.672.040.591.301.580.641.411.73
V ˙ CH 4 , B ( × 10 9 m 3 yr 1 ) 1.112.442.991.322.903.541.543.384.131.192.623.201.302.863.49
V ˙ CH 4 , C ( × 10 9 m 3 yr 1 ) 1.673.684.501.994.365.332.315.086.211.803.944.821.964.305.26
U.S.A.
R S B ( × 10 7 ) 0.791.521.690.921.781.971.011.942.150.801.531.700.941.812.02
V ˙ CH 4 , A ( × 10 8 m 3 yr 1 ) 1.844.054.952.154.735.782.355.166.301.864.084.992.204.835.90
V ˙ CH 4 , B ( × 10 9 m 3 yr 1 ) 0.370.821.000.440.961.170.481.041.270.480.831.010.440.981.19
V ˙ CH 4 , C ( × 10 9 m 3 yr 1 ) 0.5611.231.510.661.441.760.721.571.920.571.241.520.671.471.80
Vietnam
R S B ( × 10 7 ) 2.975.726.353.276.307.003.657.037.824.117.938.813.907.528.35
V ˙ CH 4 , A ( × 10 9 m 3 yr 1 ) 0.691.521.860.761.682.050.851.872.290.962.112.580.912.002.44
V ˙ CH 4 , B ( × 10 9 m 3 yr 1 ) 1.403.083.761.543.394.141.723.784.621.944.265.211.844.044.94
V ˙ CH 4 , C ( × 10 9 m 3 yr 1 ) 2.114.635.662.325.106.242.595.706.962.926.427.852.776.097.44
Table 13. Variation of the indicators L E I , I I , and E I during the period 2000–2018. The percentage variation was evaluated by ( I 2018 I 2000 ) / I 2000 [ % ] .
IndicatorVariation in the Period 2000–2018 [%]
IBangladeshBrazilChinaIndiaItalyPakistanSpainThailandUSAVietnam
L E I 3821163112181114710
I I 4378946315722756
E I 11150627832964176781
Publisher’s Note: MDPI stays neutral with regard to jurisdictional claims in published maps and institutional affiliations.

