Article

Mapping Sustainability across the World: Signs, Challenges and Opportunities for Democratic Countries

by
Bogdan Ștefanachi
1,
Silviu-Petru Grecu
1,* and
Horia Costin Chiriac
2,*
1
Department of Political Sciences, International Relations and n European Studies, “Al.I.Cuza” University of Iași, 700506 Iași, Romania
2
Department of Communication Sciences and Public Relations, “Al.I.Cuza” University of Iași, 700506 Iași, Romania
*
Authors to whom correspondence should be addressed.
Sustainability 2022, 14(9), 5659; https://doi.org/10.3390/su14095659
Submission received: 2 April 2022 / Revised: 28 April 2022 / Accepted: 4 May 2022 / Published: 7 May 2022

Abstract

:
This article aims to create the nexus between sustainable development and the quality of the political regime. The study aims to respond to the following research questions: “how could influence the quality of the democracy the dynamics of the Sustainable Development Goals (SDGs 17)?” and “what are the premises for sustainable development in the new political context, characterized by democratic recession?” The purpose of the study is to underline the fact that democratic regimes are inclined to create both participative and deliberative frames for achieving the SDGs in accordance with UN 2030 Agenda. The research methodology used in this study is based on descriptive and inferential statistics. The research data are collected from secondary sources in the years between 2015 and 2021, from 193 countries covering all the geographical areas. The empirical results suggest two models of development: the Asian model of sustainable development characterized by economic growth and the Western democratic model based on democratic institutions, fair justice and mechanisms for preserving peace. We noticed that the key-variables for explaining the dynamics of sustainability in correlation with democratic index are represented by the functioning of the governments and the political participation. Through civic engagement and political accountability, democracy could be seen as a pre-requisite for achieving an optimal level of the SDGs. All these empirical results could prove valuable for the scholars interested in the relation between democracy and sustainability and for the political decision makers involved in shaping strategies for social, economic and environmental development.

1. Introduction

This paper aims to present the evolution of sustainable development in relation with the quality of the political regimes across the world. Together with the economic, social and environmental factors, the quality of the political regimes could predict the evolution of the sustainable development in accordance with UN-17 goals. This section of the paper presents some of the most significant theoretical directions emphasized by the academic literature regarding the sustainable development and the nexus between the Sustainable Development Goals (SDG) on one hand and the quality and stability of the democratic regimes on the other hand.

1.1. Sustainability Agenda at the Beginning of the XXI-st Century

One of the main challenges of the global society is represented by the future of the sustainable development. Defined as an “umbrella concept” relevant for the development and the heritage of the future generations, sustainability can be analyzed from the social, economic and environmental points of view. The challenges generated by the COVID-19 pandemic are related to societal and environmental factors. For the first time in the contemporary history humanity had to face a global threat represented by the globally spreading of the virus. This fact is related to governmental strategies and health policies for reducing the impact of the pandemic context in economic, social and medical spheres. Governmental measures based on “lock-down” policies and economic assistance for vulnerable economic sectors are related to “economic degrowth” in the most part of the world [1,2]. This fact could be seen in the field of young adults and vulnerable groups (by gender and primary and secondary education), where an increased level of poverty and material deprivation were registered from 2020 to 2021 [3,4,5,6]. The context of the current research is related to 2015–2021, period characterized by a series of economic, political and military crisis [7,8,9,10,11,12,13].
In this section, we aim to analyze several theoretical and historical perspectives concerning the evolution of the concept of sustainability. Traditional perspectives on sustainability present the concept in terms of development and economic growth [14]. Starting from 1993 and 2002 both United Nations Conference on Environment and Development (UNECD) and United Nations (UN) have defined the concept of sustainability by referring to the social, economic and environmental pillars of development. Beyond the classical pillars of the sustainable development scholars have emphasized the role played by institutions in obtaining an optimal level of social and economic development [15]. In the first decade of the XXI-st century, theorists from different epistemological and methodological fields have tried to create an adequate statistical tool for measuring various intersections and interactions between the components of the sustainable development. In accordance with the methodological guidelines and requests, statistical indicators reflect the linkage between environmental-economic perspectives, socioeconomic frameworks and socio-environmental dimensions and institutional design [15] (p. 29). The historical origin of the sustainability dates from the early of the 1980s. In 1983, the World Commission on Environment and Development (WCED) headed by Gro Harlem Brundtland defined sustainability in terms of interrelations between people, resources, environment and development. In this context, Bruntland Report from 1987 defined sustainable development as “development that meets the needs of the present without compromising the ability of the future generations to meet their own needs” [16] (p. 17). The Worldwatch Institute’s Report from 1984 regarding the relation between resources and environment and the United Nations Conference on Environment and Development from Rio de Janeiro (1992) could be seen as the main pillars for strengthening the future paradigm of sustainable development [16] (pp. 17–20). In accordance with these perspectives, sustainable development is analyzed through: environment/ecology, economy/employment and equity/equality [16] (pp. 20–23).
In practice, all these components and educational perspectives were used within different quantitative and non-linear models for creating a robust and objective index for measuring the sustainable development across the world [17]. These quantitative measures are useful for understanding and explaining the socio-economic dynamics and the quality of sustainable development in different geographical areas. Moreover, for mapping the sustainable development we agree the fact that “specifically, a system will tend toward sustainability if the (a) ecological systems exhibit balance and resilience; (b) economic production and consumption account for efficiency and equity; (c) governance involves participation and responsiveness; and (d) institutions demonstrate adaptation and feed-back. In short, if—and only if—prevailing trends point toward these conditions will a social system tend toward sustainability” [18] (p. 12). From the economic perspective, sustainable development could be seen as a manner for developing social responsibility, emphasizing the role played by business freedom and entrepreneurship [19,20].
Empirical findings suggest that there is a middle positive association between entrepreneurship, cultural factors and sustainable development. Business and economic freedom could be seen as important vectors for obtaining an optimal level of economic development and sustainability [21]. Also, scholars have demonstrated that circular economy and other macro-economic processes relevant for Global Economy could be integrated in the sphere of sustainability. International trade, foreign investment and private capital flows could be associated with the economic dimension of the sustainable development [22,23,24,25,26].
The social basis of the sustainable development could be explained through a high quality of life, education, community development, equal opportunities and fair justice. In correlation with the social pillar of the sustainable development, the economic aspects are based on smart economic growth, cost savings and long range planning. Moreover, the environmental perspective is integrated in this socio-economic field, being structured on environmental protection and preservation and a real management of natural resources. Sustainability could be seen as the common point of the following three dimensions: fair trade and economic ethics, human rights and governmental spending [27]. In accordance with this perspective, we agree with the fact that “sustainable development cannot be achieved through isolated initiatives, but rather integrated efforts at various levels, comprising social, environmental and economic aspects. The successful implementation of the SDGs will rely upon disentangling complex interactions among the goals and their targets. An integrated approach towards sustainability would require realizing the potentials of its key dimensional pillars simultaneously, as well as managing the tensions, trade-offs and synergies among these dimensions” [27] (p. 15). Thus, this integrated approach is related to a high degree of human development and human security, emphasizing the role played by educational factors, social stability and human rights in shaping premises for the future development of the next generations [28,29,30,31,32]. In this sphere, new technologies and digital tools could create premises for social, organizational and economic progress [33].
An important role for achieving the main goals of sustainability could be played by cultural and educational variables. In this interconnected, multicultural and global context, education for sustainable development could be seen as “the duty of achieving equality, and social and environmental justice in the world” [34] (p. 184). Interdisciplinary practices, educational actors and non-governmental International Organizations (UNESCO and UN) could be seen as vectors for spreading both ideas and practices related to sustainable development. UNESCO developed several guidelines for education and development. Thus, the Guidelines on Sustainability Science in Research and Education underlines the importance of “interdisciplinary in research and in education as a means of promoting sustainability science and its integration in educational programs at large” [35] (p. 134). The educational actors’ design and practices facilitate the implementation of the sustainability goals in the spheres of equality, literacy, social inclusion, human and resources development and preservation [36,37,38].
The “milestone” in the conceptual and empirical approach related to sustainability and development could be considered the year 2015, when global political leaders from UN have adopted 17 Sustainable Development Goals (SDGs), aiming to “free humanity from poverty, secure a healthy planet for future generations, and build peaceful, inclusive societies as a foundation for ensuring lives of dignity for all” [39]. The current SDGs continue the development perspectives proposed and implemented through the eight Millennium Development Goals (MDGs, Millennium Summit of the UN, 2000), the actual outcomes of SDG agenda being “legacies from the past, competing worldviews and different readings of the sustainable development challenge” [37] (pp. 35–36). Reducing poverty, equitable economy, sustainable environment, life on land, social satisfaction and well-being are several variables which are integrated in the quantitative models for measuring both sustainability and the objective level of achieving the SDGs developed by UN in 2015 [40,41]. Since the beginning of the UN deliberation regarding the SDGs, scholars have proposed a scientific tool for measuring the level of achieving the real goals using five priorities: devise metrics, establish monitoring mechanisms, evaluate process, enhance infrastructure, standardize and verify data [42]. Moreover, academic studies uses SDGs in various research fields for observing and estimating the real impact in achieving UN objectives in different countries or geographical areas [43,44].
In this context, good governance for achieving SDGs is based on forth principles as: accountability, transparency, participation and “polluter pays principle” [45] (pp. 502–505). An optimal level of sustainable development, especially focused on economic and environmental issues, could be based on a solid partnership and institutions for monitoring and assessing the progress [46]. Also, beyond the traditional perspectives related to good governance and inter-governmental mechanisms for managing SDGs, scholars emphasized the active role played by social community and citizens in shaping models and practices of sustainability [47]. Academic literature underlines the fact that the main innovation in the field of sustainability could be realized at the social and environmental level, “while the economic dimension must not be ignored, but become subservient to the other two primary dimensions” [48]. Quantitative studies demonstrate a strong linear statistical correlation between SDGs, fact which could open new perspectives on the development of strategies and policies for preserving the ecosystems, social progress and economic growth [49]. Current researches analyze the impact of SDGs across the world in accordance with 2030 Agenda. Through 2030 Agenda political decision-makers are interested in managing “the major challenges we face, recognizing that poverty eradication requires strategies that can work on economic growth by ensuring environmental protection and managing a series of social needs including health, education, and gender equality [50]. Moreover 2030 Agenda and SDGs should be applied in accordance with national, historical and cultural patterns, in conditions in which “differences in geography, governance and technology make it dangerous to rely on generalized knowledge” [51] (p. 321). Empirical analyses underline the fact that there are significant differences in applying 2030 Agenda which depend on the geographical areas, political culture, traditional perspectives or civic engagement in changing the society [52]. Moreover, we agree the fact that global sustainability could be achieved through the integration of the social, economic and environmental perspectives, related with “fight to poverty and human well-being” [53]. Regarding this perspective, we agree the fact that community, economy and environment should be seen as an interactive and complex system, characterized by moments of equilibrium and entropy [54].
The COVID-19 seems to have a significant impact in the sphere of sustainable development [55] (p. 10). In this respect, goals as: “zero hunger”, “clean water and sanitation”, “affordable and clean energy”, “decent work and economic growth”, “reduced inequalities” and “climate action” could be affected by the pandemic context. Moreover, “industry innovation and infrastructure” is threatened and aggravated by the economic policies implemented by governmental actors during the pandemic [56]. The new medical challenge determined the shaping of new perspectives on various dimensions of the sustainable development. In this context, researchers have introduced a forth pillar for understanding sustainability: human health. The introduction of this pillar is justified by “the fact that health is no longer only a demographic or an individual-level issue, but rather a global pandemic, shows the true nature of its importance, and its impact helps create a fourth pillar of global sustainability” [57] (p. 3).
Synthetizing, this section presents several theoretical and historical perspectives related to the evolution of sustainability until 1980’s and the current COVID-19 pandemic. Despite the conceptual and theoretical design, sustainability should be understood in terms of social development, economic growth and stability and environmental protection. UN goals and government’s intervention in the field of reducing social inequalities, economic imbalances and environmental conservation should be remodeled in accordance with the socio-economic context, global threats and regional and historical heritage of the political systems. Thus, an important predictor for understanding and explaining the dynamics of sustainability in the global world could be represented by the quality of the political regime and by the level of the political stability.

1.2. Sustainability Nexus Democracy: Theoretical Challenges and Political Issues

This theoretical part emphasizes the role played by democracy in shaping different patterns of sustainable development. Our theoretical perspective aims to improve the level of knowledge related to sustainability through the integration into the equation of the sustainable development of several variables related to the quality of the democratic regimes. The nexus between sustainable development and democratic order is quite complex, being based on multiple interconnections among political stability, functioning of the governments, multilevel governance, political participation and civic engagement, strong civil society and political culture. Within this frame, the issue of sustainability requires both civic and societal accountability and a high level of governmental implication for achieving the goals. Scholars have analyzed the fact that the main pillars of sustainable development should be completed by the democratic governance. Economic growth, social justice, equality and environmental protection could be completed by public participation and transparent governance for achieving an optimal level of the sustainable development [58] (p. 185). Beyond political legitimacy and governance, the relation between sustainable development and democracy could be analyzed starting from the political participation and civic culture [59].
In the early of 1960–1970’s, scholars specialized in political sciences had demonstrated that there is a linear statistical correlation between the quality of democracy and the economic development. However in practice the democratic regimes are based on symbolic elements such as political culture and historical heritage or on material elements represented by governmental and nongovernmental political actors, political institutions, rule of law, transparency, electoral competition and human rights (political rights and civil liberties). For explaining the relation between democracy and sustainable development, theoretical studies underline the interaction among “supportive participation”, governmental stability and socio-economic equality [60]. In spite of the fact that the theoretical approach emphasizes the correlation between participatory democracy and sustainable development, in practice intervene a lot of limitations generated by the endogenous or exogenous variables which compound the sphere of democracy: lack of political motivation, parochial or subjective political culture, political instability, the type of political regime (presidential, parliamentary or hybrid regime), economic perspectives and other political relevant variables which are interposed between citizens and political decision-makers [60]. Thus, we argue the fact that “we need to understand mutual interdependence and vital linkage between democracy and development. Without democratization, development will not be sustainable. At the same time, without progress in human development and economic growth, democratization will rest on very fragile foundations” [61] (p. 41). In the same time, empirical studies based on civic negotiation and intervention in the field of policy-makers demonstrate a moderate impact of the social actors in shaping different forms of strategies for achieving SDGs [62].
In this context, econometric studies based on the economic dimension of the democratic regimes present a strong linear correlation among political stability, GDP growth and macro-economic indicators such as employability, inflation rate and the level of achieving the SDGs [63,64,65].
In this part of the paper we argue that the nexus between democracy and sustainable development consists in civic implications, civil society and economic growth. Beside these possible interactions, we introduce the level of governance and the implications of the good governance and political stability for creating an optimal framework for achieving SDGs. Several endogenous variables for democracy are involved in the process of achieving sustainability goals. In this respect, civil liberties, “public participation in decision-making, accountability of decision-makers to citizens, and the quality of public deliberation” can be considered as significant factors which explain the complex relation and interaction between sustainable development and democracy [66,67]. Policy coherence, political participation for good governance and democratic institutions could represent a coherent and robust political model for assuring an optimal level of sustainable goals achievement in democratic regimes [68]. Related to democracy, we admit the fact that the electoral and the participative components of democracy could increase the level of accountability and government interest in the sphere of social justice and environmental issues. “In addition to electoral democracy, civil society empowerment might emerge from citizens’ communication and collective actions to perform the checks and balances of both state and corporate elites” [69,70]. Also, other scholars have presented the positive role played by the civic associations or NGO’s for protecting and conserving the environment in achieving the sustainable development goals in democratic countries. In this context, we can mention a positive and strong correlation between the number of NGOs for environmental protection and the level of democracy and sustainability index [71].
For measuring the impact of the democratic regimes in the sphere of sustainable development, both political decision-makers and scholars have developed a quantitative measure entitled Global State of Democracy (GSoD). The political utility of the statistical measures consist in the fact that these “indices can make to the review of progress on the United Nations’ 2030 Agenda for Sustainable Development and the Sustainable Development Goals (SDGs)” [72] (p. 1). The main pillars for measuring the relation between democratic regimes and the level of SDGs are represented by: representative governments, fundamental rights, checks on government, impartial administration, and participatory engagement [72] (pp. 2–3). Moreover, all these components could be synthetized in a single variable: accountability. In this respect, democratic regimes are characterized by governmental responsibility and civic engagement and accountability. This way, the deliberative and participative components of democracy could explain the evolution of political system and the real level of achieving sustainability goals.
An important finding for exploring the relation between sustainability and democracy is represented by the principle of subsidiarity. We argue, as scholars have already emphasized, that local governance “is unique because usually citizens and other stakeholders are relatively close to city governors (compared with the distance they usually have to the national government). This makes governance in cities and neighborhoods suitable for participatory governance approaches” [73] (p. 53).
The interaction between sustainable development and the quality of the political regime should be translated in a high level of public participation and deliberation. Since 1992 UN pointed the fact that an optimal level of development could be achieved through an active implication of the citizens at the various levels of the political decision. Citizens’ involvement in decision-making process is an important pre-requisite for accountability, social and economic stability and environmental protection. Related to public participation, the vital role for implementing public policies in the field of sustainable development is played by the civil society and NGOs sector. Social responsibility and the constructive role played by NGOs within the social sphere legitimate their public interventions in shaping models for good governance and sustainable development. As we have already argued, civil society could play a catalyst role in creating premises for various policies implementation. In this respect, the nexus between UN goals for development and the regime type could be seen within the field of deliberative and participatory democracy. Also, other variables as electoral democracy and political competition, political culture, historical heritage and social stability, political rights and civil liberties play an important role for creating models for public participation and deliberation as well. This type of interaction is a quite complex one, being based on the “spill over” effect generated by the civic engagement and participation in the public affairs. We support the idea of a centrifugal model, where the citizen and the local community play an important role for spreading and securing social and political practices related to development. Starting from these theoretical premises, we argue that good governance, participatory and deliberative democracy represent the main values and pillars for creating an adequate model of the sustainable development. The theories of social capital and the associative democracy are related to sustainability. Theorists argued that institutional changes and the associative dimension are involved in creating premises for development [74].
The last decade is characterized by “democratic recession”, whilst Democratic Index (with different quantitative measures) has registered decreased values. The problems related to human rights or political stability are negatively statistically correlated with the evolution of the democratic regimes. We consider that the main feature of the democratic order should be represented by good governance. This concept is related to economic prosperity, fair justice and tolerance [75]. Moreover, it depends on the quality of the political staff, free elections and historical heritage which could be framed in the sphere of participative political culture. Authoritarian leadership associated with political populism represent a syndrome of the contemporary illiberal democracy [75]. Since 2016, democracy has registered decreased values in the sphere of civil liberties, transparency and rule of law [76]. Thus, international statistical reports present decreased levels of democratic index. Particularly, this index has decreased statistical values in the field of deliberation and political participation. Moreover, we can emphasize the idea of hybrid political regimes or flawed democracies. Scholars present this phenomenon in terms of democratic recession or “twilight of democracy”. They argued that high level of political polarization, social injustice and economic imbalances are related to the new populist or radical movements and authoritarian practices [77,78]. The current social and political context, dominated by the COVID-19 pandemic, has augmented this complex and dangerous syndrome of “democratic recession” through different social and economic interventions in the field of political liberties and civil rights.
Synthetizing, this section presented the complex and dynamic relation between democratic regimes and sustainable development. In this context, the interaction between development and political regime could be placed within the sphere of deliberative and participative democracy.

2. Research Methods

In accordance with the brief academic literature review, this article presents the relation between sustainability and democracy across the world, using a quantitative design in a long-terms statistical series. In this respect, the article underlines that full and flawed democracy prove to be more compatible with UN sustainable goals. In this respect, the 2030 Agenda could be fulfilled in democratic countries characterized by civic engagement, active civil society, participative political culture and public interests for social, economic and environmental development and preservation. This part of the study presents the theoretical research design, statistical data and procedures, research methods and tools.

2.1. Theoretical Research Design. Objectives, Questions and Hypothesis

For a better understanding of sustainability and democracy correlation, we start the current analytical approach from several research questions as: 1. “How could influence the quality of the democracy the dynamics of the Sustainable Development Goals (SDGs 17)? 2. What is the impact of the stability and functioning of the democratic governments and the level of achieving the UN sustainable goals? 3. What is the relation between democratic institutions and the level of national sustainable development? 4. What are the premises for sustainable development in the new political context, characterized by “democratic recession”?
At the normative level, this paper aims to create a comprehensive model for a better understanding of the political impact of democratic regimes within the sphere of sustainable development, as it is measured in the academic and political practices through UN Sustainable Development Goals (SDGs 17). Starting from these premises, the research objectives of the study are:
Objective1 (O1): to map the particularities of the sustainable development in a global and dynamic world through a longitudinal quantitative approach.
O2: to measure the correlation between the quality of democracy and the level of achieving the SDGs.
O3: to estimate the particularities of the sustainable development in the field of non-democratic countries (authoritarian, dictatorship and hybrid political regimes).
O4: to identify the relation between SDGs and the democratic institutional design, rule of law and strategic partnership as predictors for democratic governance.
O5: to predict the further evolutions of the sustainable development conditioned by the quality of the democratic regimes (flawed and full democracies).
Related to the theoretical approach, this study aims to test several hypotheses as:
Hypothesis 1 (H1).
There are statistical significant differences between democratic and nondemocratic countries in achieving the UN Sustainable Development Goals (17 SDGs).
Hypothesis 2 (H2).
An increased level of Democratic Index is strongly related to a high level of sustainable development.
Hypothesis 3 (H3).
Economic development could predict the evolution of sustainable development in nondemocratic political regimes (authoritarian or hybrid political regimes).
Hypothesis 4 (H4).
Institutional design and civic engagement from democratic regimes are strongly related to a high level of achieving the UN Sustainable Development Goals.
Hypothesis 5 (H5).
Democratic regimes are prone to strategic partnerships for shaping models of good governance and sustainable development.

2.2. Data, Methods and Quantitative Design

Related to the theoretical and methodological guidelines, we propose a quantitative design for exploring and explaining the dynamics of sustainability in correlation with the quality of democracy across the world. As research methods, we use the comparative case studies between countries from different geographical areas with democratic or nondemocratic political regimes. Data are collected from secondary sources, official statistics and indicators generated by think-thanks as The Economist. In this context, data related to sustainable development are collected from Sustainable Development Report in accordance with UN SDGs 17. Data are measured by a ratio level between 0–100, where SDG Index score is calculated as an average between the levels of achievement for every sustainable goal from 1 to 17. Data which reflect the level and quality of the national democracy are collected from The Economist Intelligence Unit (EIU), an international think-tank which deliver data regarding democracy and its components for governments, academics, corporates or financial services through a complex report based on statistical estimations. Data are measured at a ratio level between 0–10, with several significances like: i. [0; 4]—Authoritarian regimes; ii. [4.01; 6]—Hybrid regimes; iii. [6.01; 8.00]—Flawed democracy; iv. [8.01; 10]—Full democracy. In this respect, in Table 1 are represented the research variables:
The dependent variables are represented by the sustainable development index (SD) and the main sustainable development goals (SDG 1–SDG 17), while the main factors (independent variables) which could explain and predict the dynamics of the sustainable development are represented by democracy (DI) and by the main components of the democratic regimes (EP; FG; PP; PC; CL). Thus, we are interested to analyze the relation between the sustainable and development goals in correlation with the deliberative and participative components of democracy for emphasizing the role played by civic community and political accountability in creating premises for social, economic and environmental sustainability.
The sample of analysis is represented by 193 nations registered and recognized by United Nations as independent countries. We use all the countries and territories for creating both a comprehensive and descriptive radiography of the evolution of the sustainable development and democratic regimes across various geographical areas. The statistical data were collected in a long-term statistical series among 2015–2021. We use this period of time starting from the fact that in 2015 UN adopted The 2030 Agenda for Sustainable Development which “provides a shared blueprint for peace and prosperity for people and the planet, now and into the future. At its heart are the 17 Sustainable Development Goals (SDGs), which are an urgent call for action by all countries—developed and developing—in a global partnership” [81]. Statistical series are limited to 2021 because for the current year (2022) there are no available statistical reports and data related to sustainability and democracy. For generating maps of sustainable development and democracy we used the average of the statistical values for the period 2015–2021.
Statistical design and procedures are based on both elements of descriptive and inferential statistics. In accordance with these procedures, we used various quantitative elements from the probability theory, integral calculus and differential equations. In the first part of the statistical analysis we used descriptive statistics for estimating central tendency (measures as mean, median, mode and percentiles), dispersion (variance, standard deviance, range) and measures for statistical distribution for the main research variables (Pearson’s moment of the coefficient of Skewness for asymmetry and the Kurtosis of the statistical distribution). All this statistical measure of the central tendency are useful for creating an adequate image and radiography of the dynamics of sustainable development and democracy both at the global and regional level. Moreover, throughout these quantitative measures we were able to estimate current and further tendencies for the interaction between sustainability and the quality of the political regimes. Another important statistical dimension we took into account consisted in estimating several predictors of sustainability in accordance with the dynamics of the democratic index. In this respect, we used multiple equations of regression with the stepwise method.
Let be X, Y—variables and
X = { x 1 x n }   a n d   Y = { y 1 y n }   a n d   X ,   Y R ,
Y = f(X), where Y—dependent variable and X—independent variable
Y = α + β x i + u i j , where Y—dependent variable, X—independent variable
u i j residuals
From (1) and (2) we use as strategy for analysis the Multiple Linear Regression Equation as follows:
Y = α + β 1 x 1 + β 2 x 2 + + β n x n + u i j
In accordance with the research variables, the mathematical models which we propose to test through the multiple equations of regression are:
S D = α + β 1 E P + β 2 F G + β 3 P P + β 4 P C + β 5 C L + u i j
For estimating the predictors of the democratic index associated with the sustainable development goals, we use as multilinear equation:
D I = α + β 1 S D G 1 + β 2 S D G 2 + + β 17 S D G 17 + u i j
Giving the fact that the association between democracy and sustainable development is non-linear, we test several linear and polynomial equations as quadratic, cubic and logarithmic models:
S D = a + b D I ,   w h e r e   a , b R
S D = a + b D I 2 + c D I + d ,   w h e r e   a , b , c , d R
S D = a + b D I 3 + c D I 2 + d D I + e ,   w h e r e   a , b , c , d , e R
S D = l o g a D I
For testing the variation rate (entropy of the model) of the sustainability index by time and by democracy, we propose the following model:
Δ   S D = S D 2021 S D 2015 ,   Δ D I = D I 2021 D I 2015 ,   Δ T = T n T 0
V = 0 1 Δ   S D Δ   T
V—variation rate;
SD—sustainability index;
T—time of observation
V = 0 n Δ   S D Δ   D I
where V—variation rate; SD—sustainability index; DI—democratic index
Related to the predictive models, our statistical approach uses probabilities with:
f : x [ 0 ; 1 ] ,     f ( x ) 0 ,
and
+ f ( x ) d x = 1
with:
f ( x ) = 1 σ 2 π e 1 2 ( x μ σ ) 2 ,   f o r   x R   a n d   f : R R
In the same time, for the last part of the paper we are interested in estimating through conditional probabilities the relation between sustainable development index and democratic index:
P ( S D | D I ) = P ( S D D I ) P ( D I )
Starting from these methodological perspectives, this paper presents the main findings related to the sustainability dynamics among 2015–2021, emphasizing the importance of democracy in configuring various patterns of social and economic development. Moreover, the following section details the empirical findings and the correlations between statistical results and the theoretical perspectives presented in the first section of the paper. Empirical results are configured according to the methodological guidelines. For explanations and argumentation we used only significant statistical results with a very high level of likelihood. All the empirical results presented within the paper are significant, with p   0.1 .

3. Results

This section presents the empirical findings and the main statistical results according to the research methodology, in order to underline the importance of democratic regimes for achieving an optimal level of sustainable development. We consider as an optimal level of the sustainable development a statistical value upper than the average of the SD score during 2015–2021 in all 193 countries. In this respect, this section presents the evolution of sustainability and democracy across the world during 2015–2021, the relation between economy, solid institutions, fair justice and strategic partnership for achieving SDGs 17. Beyond this quantitative directions, this part presents a forecast regarding the sustainable development conditioned by the quality of the national democracy within the most entropic geographical areas in maintaining or achieving social, economic and environmental sustainability.

3.1. Mapping Sustainability across the World: Challenges for Democratic Regimes

This part of the article underlines the dynamics of sustainable development and democracy using long-term statistical series. Sustainable development could be seen as a continuous and incremental process with middle values in many geographical areas. Regarding the central tendency of the variables, we can notice that SD has the average 66.18, with σ = 11.13 . This fact reflects the image of a partial sustainable world. Moreover, high values of σ 2 = 123.96 and σ = 11.13 could signify that there are significant differences between units of analysis and a very high rate of variability between the minimum and maximum values registered in our statistical series. This fact is emphasized by the increased values measured through the interquartile range of the values. The smallest values are registered during 2015–2021 in Africa, in countries like Central African Republic (38.12), South Sudan (38.54) and Chad (40.81). In contrast, the highest values related to sustainable development are registered in Scandinavia, in countries like Denmark (84.78), Sweden (85.58) and Finland (85.81). The significant statistical differences between these geographical areas could be explained through historical, political and socio-cultural factors. Regarding the evolution of democracy during 2015–2021, the descriptive results reflect the image of the “hybrid political regimes”, with the mean of 5.55 and σ = 2.18 . While SD can be characterized by a high rate of variability, democracy could be seen, on its turn, as a constant model, with several deterioration of the quantitative parameters in the last years. This fact could be explained for 2020–2021 by the political measures associated with COVID-19 pandemic. Governments’ efforts for reducing the spreading of the virus could be associated with economic imbalances, as we have already pointed out in the theoretical section, and with political deterioration of the deliberative and participatory components of the democratic regimes. For both variables we can estimate symmetrical and normal distributions reflected in Skewness (−0.62; −0.12) and Kolmogorov-Smirnov Test (p   0.05 ). If SD has a geographical distribution with the lowest values in Africa and the highest values in Northern Europe, DI is much better geographically spread, with minimum values in Asia (North Korea, Syria, Afghanistan, China), Africa (Central Africa, Chad, Eritrea), Europe (Russian Federation, Belarus) or Latin America (Venezuela). In contrast, the highest values of democracy are registered in Northern and Western Europe, North America (Canada), Australia and New Zeeland. The Table 2 presents the main statistical indicators for central tendency, dispersion and distribution for SD and DI.
Although UN has set The 2030 Agenda, in practice only 24.95% of the analyzed countries could be placed in the sphere of sustainable development. However, we can increase this proportion by adding the number of partial sustainable countries, which is incident in the most part of the world (49.09%). In the Figure 1 we estimate the proportion of the sustainable countries among 2015–2021.
The same statistical distribution can be found in the sphere of democratic regimes. For the research sample, the average of the values during 2015–2021 reflects that 18.19% of the countries are integrated in the sphere of full democracies and 30.3% are placed in the sphere of flawed democracies. The Figure 2 presents the proportion of each type of political regime in accordance with the significances terminology used by The Economist Intelligence Unit.
At the empirical level, we can observe that in 2015 the world average of the SD = 65.64, with the standard deviation 10.6. In 2021, the world average for SD = 66.92 with similar values of the standard deviation (10.5). This finding reflect the fact that SD has an incremental evolution with the stagnation period 2019–2021. In this context, we can mention that SD has a positive evolution, measured through the ratio between 2021 and 2015, with small values (1.48%). In contrast, statistical measures related to democracy suggest the image of the democratic recession. In 2015 DI has the median value across the world 5.79 with σ = 2.17 . The most part of the political systems could be placed on the boarder of hybrid political regimes and flawed democracies. In 2021, the world average of the DI = 5.25, with σ = 2.25 . Starting from these statistical measures we can underline the fact that most part of the political systems could be labeled as hybrid political regimes, with several elements of autocracy. Moreover, we can underline that there is a weak-middle (r = 0.32, p < 0.001) impact of the DI in the sphere of sustainable development during COVID-19 health crises, economic crises and regional instability (2019–2021).
In accordance with the research objectives (O1), the geographical distribution of the SD reflects two main contrasts in shaping models of social, economic and environmental development. Thus, the Northern Europe, North America, Australia and New Zeeland can be considered the most important sustainable poles. In contrast, Africa has the lowest values of the SD associated with high levels of inequality, hungry and malnutrition, health systems, quality of education, economic growth and democratic political institutions for sustaining strategic partnership and environmental protection. Except the Central and Southern Asia, in China, Philippines and many countries from Latin America the values of the SD indicator reflect the image of partial sustainable systems, with values between 63.86 and 71.11. The highest values of the SD indicator are incident in Finland (85.81), Sweden (85.58), Denmark (84.78), Germany (82.4), Norway (81.76), Austria (81.76) and France (81.49). Scandinavian and Western countries, placed in the sphere of democratic countries, are prone to configure mechanisms for social justice, quality in educational systems, economic growth and stability and partnership for achieving the SDGs. In this context, we can observe the fact that Europe, particularly EU-27, can be seen as a sustainable development pole. In North America, significant values are incident in Canada (79.07) and USA (75.91). The geographical cleavage of sustainable development might be represented on the axis North- South. Thus, the lowest values of sustainable development are found in most part of the African continent. Central African Republic (38.12), South Sudan (38.54), Chad (40.81), Somalia (44.81), Nigeria (48.58) and Republic Democratic of Congo (48.65) have registered the lowest average of the SD index in the last 7 years. Beside this cleavage, we observe that Asia (Middle and Central Asia) and Latin America can be integrated in the sphere of the partial sustainable geographical areas. From Southern and Central Asia, India (59.2), Yemen (52.71), Pakistan (56.92), Afghanistan (52.65) and Syrian Arab Republic (57.91) have values under the world average. From Latin America we can underline the fact that Venezuela (61.64) and Paraguay (66.2) registered values in proximity of the world average and Chile (76.69) can be placed in the sphere of sustainable developed countries. Historical and political heritage, parochial or subject political culture and the severe limitations of the democratic order could be involved in explaining the geographical cleavage between different world regions. All these empirical findings are mapped in Figure 3. Thus, in Figure 3 we estimate the Moran and Geary Index with values > 0.5, a fact which reflects the tendency of grouping the phenomenon in several clusters. Moran Index (0.83) demonstrates this tendency for grouping sustainable development in clusters as: more sustainable regions (Western Europe and Scandinavia), sustainable regions (North America, Central Europe, Australia and New Zeeland), partial sustainable regions (several parts from Northern and Eastern Asia and Latin America) and non-sustainable regions (Central and Southern part of Asia and Africa).
An important geographical distribution which can explain differences in achieving sustainable development goals is represented by the spreading of the democratic index across all the 193 countries. The Figure 4 presents the dynamics of democracy and the main cleavages related to the political regimes in different world regions. As we have already emphasized in the first section of the paper, the current statistical data shows the image of a “democratic recession”. Moreover, this “twilight of democracy” can be observed in the cleavage between Western and Eastern world regions. While sustainability presents contrasting development poles on the axis North-South, democracy cleavage can be observed on both geographical axis North (Scandinavia and Northern Europe)—South (Africa and Southern Asia) and Western countries (North America) and Eastern part of the world (Asia). The map presented in Figure 4 emphasizes the fact that most part of the world might be framed in the sphere of hybrid political regimes. In this context, we could remember that political regimes are characterized by a mix among authoritarian rule and several elements specific to democracy (the imitation of electoral competition and decorative democratic institutions such as National Assembly or Parliaments). Scholars have argued that hybrid political regimes are a syndrome of incomplete transitions from authoritarian rule to democratic order. As we have estimated above, 51.51% of the world countries are integrated in the sphere of non-democratic and hybrid regimes. As the map in Figure 4 indicates, the majority of democracies is represented by Northern Europe (Norway-9.86, Iceland-9.48, Sweden-9.36 and Finland-9.13), Canada (9.12), Australia (9.02) and New Zeeland (9.27). In contrast, Asia and Africa can be considered as regions characterized by dictatorship, autocracy and hybrid political regimes. North Korea (1.08), Syria (1.43), Saudi Arabia (1.96), Turkmenistan (1.74) or Central African Republic (1.47) have the lowest average of DI during 2015–2021. Russian Federation (3.18) and China (2.77) are quite representative for the category of authoritarian regimes, being important poles of power as far as contemporary International Relations are concerned. Central and Eastern Europe and most part of the Latin America are framed in the field of “flawed democracy”. Regarding the spatial analysis of the democratic index, we can observe that Moran and Geary Index have middle values (0.56; 0.58). This fact reflects a middle tendency of grouping countries depending on the quality of the political regime. Moreover, the East-West cleavage could be significant for understanding that political culture, international context, the dynamics of regional powers and the political values are involved in shaping two different and tensioned spheres: full and flawed democracies in the West and authoritarian regimes in the East.
In accordance with these empirical findings, we are interested to estimate the impact of the political regime on sustainable development. In this respect, related to the objectives of the research (O2 and O3), this article underlines the fact that democratic countries are prone to achieve SDGs 17 in comparison with authoritarian and hybrid political regimes. Thus, the statistical correlation between DI and SD reflects a middle linear association between the quality of democracy and the sustainability index, measured through Pearson correlation with R = 0.648 and p < 0.01. In this context, we analyzed the nonlinear relation between democracy and sustainable development through a polynomial equation of regression with R2 = 0.456, p < 0.01. Thus, we can state that there is a middle positive association between the quality of democracy and the SDGs’ achievement degree. Beside the social, economic and environmental factors, sustainable development could be explained through the quality of national democracy. As we have pointed out in the theoretical part of the paper, deliberative and participative components of democracy could be considered good predictors for a high level of sustainable development. We have split the data by the regime type and we have observed that in the non-democratic countries there is no statistical correlation between the score of the DI and the level of sustainable development index. In this respect, the Pearson correlation between DI and SD in the case of nondemocratic or hybrid political regimes is R = 0.04, p < 0.05. The Figure 5 presents the nonlinear relation between the quality of democracy and sustainable development. Thus, in the case of full democracies we observe a strong linear association with a high level of sustainable development. Countries as Norway, Sweden, Finland, Ireland, Iceland, Germany, Switzerland, Australia and New Zeeland are full democracies with a very high score for the sustainable development index (SD > 80). In the case of flawed democracies, we observe a middle linear association with sustainable development in countries from Central and Eastern Europe and Latin America. In authoritarian regimes from Central Asia and Africa the lowest values of the democratic score are related to the lack of sustainable development. In this context, we have to mention the fact that for several ex-soviet countries (Russian Federation, Georgia and other republics from Central Asia) and China the model of sustainable development couldn’t be explained exclusively through the quality of the political regime. Other economic factors might be involved in shaping a better understanding of the sustainability in these countries. The economic determinants for sustainable development are analyzed in the following section of this research paper.
The main predictor of the sustainable development related to the quality of democracy is represented by the functioning of the government. Thus, governmental strategies for reducing socio-economic inequalities (gender, employability, economic deprivation etc.), for eliminating the malnutrition and material deprivation, for creating health social systems and for preserving the environment could be seen as representing several important guidelines for the political sphere. The functioning of the government is middle positive correlated with the sustainable development index, with β = 0.608 ,   T = 5.34 ,   p < 0.01 . For the current statistical data, we estimate a positive but weak correlation between political participation and sustainable development with β = 0.316 ,   T = 3.13 ,   p = 0.02 . The main predictors of sustainability related to the current model of hybrid regimes might be explained through a linear equation of regression like:
S D = 2.45 + 0.608 × F G + 0.316 × P P 0.22 × E P 0.07 × P C 0.09 × C L
A better understanding of sustainable development could be based on the interpretation of the role played by political stability and functioning of the governments within the democratic regimes. In this context, we have to integrate the role played by political participation and civic engagement for shaping a social and political model based on deliberation and accountability within the aforementioned equation.

3.2. Two Models of Sustainable Development: Asian Economic Strategy and Western Democratic Partnership for Goals

Quantitative results support two main models for sustainable development in contemporary global system: (1) a model based on economic growth specific to Asian countries and (2) a model based on democratic institutional design, justice and partnership specific to Western flawed or full democracies. For testing the relation between SDGs 17 and democratic index we split the data using the scores related to the quality of democracy as basic criterion. In the first quantitative model, specific to non-democratic countries, we estimated a middle positive association between the economic dimension and the level of democracy. The first quantitative model underlines, with probabilistic limits, that low scores related to democracy (especially within the hybrid regimes) are associated with a model of sustainable development based on the role of decent work and economic growth. Table 3 displays the synthesis of the mathematical model related to sustainable development in non-democratic countries, with economic growth as the main predictor ( β = 0.439 ,   T = 3.316 ,   p = 0.002 ).
This model is specific for authoritarian and hybrid political regimes from ex-soviet space, Russian Federation, Central Asia and China. Statistical indicators reflect the fact that high levels of achievement related to economic growth and decent work (SDG 8 > 70) are incident in Russian Federation (75.40), Qatar (76.89), Kazakhstan (70.2), China (71.63), Saudi Arabia (71.17). Most part of the ex-soviet countries, characterized by hybrid regimes have registered upper values in the field of economic growth. Beside these countries, we can integrate in this model two ex-soviet countries: Ukraine (71.7) and Republic of Moldova (70). In this respect, countries like Belarus (67.80), Azerbaijan (65.78), Georgia (68.74), Turkmenistan (65.36) and Kyrgyz Republic (65.49) are characterized by middle values of economic growth and sustainable development index and very low scores associated to democracy. African countries are characterized, with several exceptions from the Northern part, by low values of both statistical indices.
The second model observed in correlation with the quality of the national democracy is more specific to Western European countries, EU-28, North America and a significant part of Latin America. In accordance with the research objectives (O4) we present the importance of the institutional design, justice and peace in relation with democracy. In this respect, the quantitative model has R2 = 0.838, p < 0.001. Both statistical models, for nondemocratic regimes and for flawed and full democracies, have normal statistical values related to collinearity diagnostics (Tolerance < 1, VIF < 10.00). Table 4 presents the main statistical findings for the association between democratic index (DI) and sustainable development goals (SDGs 17).
Starting from the general equation of regression based on SDGs 17 variables and using the stepwise method, we can emphasize the fact that the relation between democracy and the level of achieving the goals in democratic countries is:
D I = 11.38 + 0.457 × S D G 16 + 0.218 × S D G 17 0.469 × S D G 12
The main differences in sustainability approach between non-democratic and democratic countries are represented by the importance of institutional design, fair justice and partnership for achieving the goals. In the same time, peace can be considered an important variable for democratic order and one of the main prerequisites for guarantying a secure environment for individual well-being, social justice and economic prosperity. The statistical model shows us a middle negative association with rational consumption and production. In this respect, we emphasize the role played by fair justice and democratic institutions in creating political transparency, political stability, functioning of the government and a robust model of good governance. Partnership for achieving the goals reflects both the participatory and deliberative components of the democratic regimes. Strong endogenous and exogenous partnerships could increase the level of participation and interactions among states, political actors, stakeholders and civic community. The partnership could be seen in terms of cooperation, being an essential condition for associational democracy. Only in democratic regimes we observe a complex interaction between different civic, social, political and scientific networks. This type of interconnectivity could create premises for good governance and an optimal political framework for implementing The 2030 Agenda.
Concerning the impact of democracy in the sphere of peace, justice and strong institutions we estimate a linear statistical correlation with R = 0.753, p < 0.001. In democratic countries, sustainable development is perceived in terms of democratic and representative institutions, rule of law, social justice and a model for guarantying peace. Democratic countries are prone to transitional perspective and cooperation. Scholars have emphasized both in normative and empirical theory that a world based on democratic regimes is less inclined towards conflicts and war. Figure 6 shows the association between democratic index and the level of achieving SDG 16: peace, justice and strong institutions. In this context, Scandinavian countries can be considered representative for a model of sustainable development based on institutional design, social justice and social security. Moreover, this fact is incident in Western European countries, United States, Japan, Canada, Australia and New Zeeland. Starting from these quantitative findings, we argue that democratic regimes are more interested in achieving a high level of sustainable development through partnership, cooperation, civic engagement, institutional design and political accountability. All these features could be integrated in the sphere of the good governance and socio-economic stability.
The second model of the sustainable development could be seen as more adequate for responding to a complex interaction between social, economic and environmental dimensions. Related to geographical areas, sustainable development index registered high values in EU-28, Europe, North America, Australia and New Zeeland. The lowest values of sustainable development are registered in Asia and Africa. Figure 7 presents the dynamic of the sustainable development index by geographical areas during 2015–2021.
For achieving the research objective O5, we try to forecast the dynamics of sustainable development conditioned by the quality of democracy. In this respect, the confidence level ( 1 α ), with p = 0.05 for the relation between sustainability and flawed democracy has values between [71.91; 75.43]. In the case of the full democracy, ( 1 α ) , with p = 0.05, has values between [77.20; 81, 11]. Figure 8 displays the forecast of sustainable development in correlation with the quality of democracy. The period of forecast is for the next 7 years. In this context, the upper bound of the sustainable development might be over 81.11 and the lowest bound might be placed at 72. In the context of Bayesian statistics analysis we can estimate with p = 0.05 that the quality of democracy could increase the level of sustainable development index with the average around 76.5. Our forecast estimates that democratic political regimes are prone to create patterns of sustainable development. As we emphasized in the first part of this section, democracy could be seen as an important catalyst for achieving the SDGs in accordance with The 2030 Agenda.
Through conditional probabilities associated with the dynamics of sustainable development in correlation with democratic regimes, we estimate that the proportion of the countries with democratic regimes and high level of sustainable development is 91%. In contrast, in hybrid regimes we can estimate that 51% of the countries could create premises for sustainable development. Statistical results underline the fact that the quality of the political regime creates premises for social justice, economic welfare and environmental protection and preservation. Moreover, in this part we are interested to analyze the maximum level of variation (as measure for disorder) in every geographical area. The level of variation is estimated through the differential ratio between the dynamics of the sustainable development index and time. In the same time, we estimated this measure using the differential ratio between the dynamics of sustainable development index and the quality of the national democracy.
Table 5 presents the disorder in maintaining an optimal level of sustainability in different geographical areas. This measure of disorder is inspired by entropy (seen as a function of disorder within an open physical systems). We used the same differential ratio as it is used in thermodynamics, changing the physical variables with our research indicators. In this context, we were interested in estimating the variation of sustainability in dependence with both time and democratic index. In accordance with these assumptions, our quantitative estimations reflect a high level of disorder related to sustainable development in two geographical areas: Africa and Asia. This geographical regions are more prone to disequilibrium and entropy than other continents. The quality of democracy has an important impact in maintaining this fragile equilibrium for further socio-economic evolutions. Authoritarian rule and hybrid regimes generate a high level of entropy in achieving SDGs. In contrast, Europe, Australia and New Zeeland are relevant for homeostatic processes. These regions are characterized by both flawed and full democracy. Middle values are registered in North and Latin America, regions characterized by the incidence of flawed democracy. These estimations reflect the fact that sustainability is an incremental process characterized by a specific dynamics in time. When we take into account the quality of the political regime, we can observe that non-democratic countries are more prone to entropy than democratic political regimes.
Synthetizing, in this section we have presented the main empirical findings regarding the dynamics of sustainable development and democratic regimes. Statistical results show a positive non-linear relation between democracy and sustainable development. This relation could be explained through several predictors as functioning of the governments and political participation. These empirical findings emphasize the role played by participatory democracy and good governance for shaping models of sustainable development across the world.

4. Discussion

With regard to the academic literature, this empirical study presents the relation between the sustainable development and the quality of the national democracy. Political regime could be seen as an important predictor for the level of achievement associated with sustainable development goals. The complex model of interaction between social, political and nongovernmental actors could explain the current evolutions related to social, economic and environmental pillars. As we have already pointed out in the theoretical part of the paper, sustainability is a complex and dynamic concept. Educational and political cultural variables could be involved in creating an optimal frame for achieving the goals from The 2030 Agenda. The current international context, characterized by COVID-19 pandemic, economic imbalances and regional military conflicts, influences the dynamics of sustainable development in most part of the world. Our research thesis is that democratic regimes are prone to create an optimal frame for sustainable development. This fact is argued on the basis of academic literature. Scholars have emphasized the role played by good governance in achieving sustainable development goals. Good governance is analyzed in terms of political participation, civic engagement, active civil society and decision-makers’ interest in creating models for social justice, economic prosperity and environmental preservation. This complex interaction between citizens, stakeholders and political actors is specific to democratic regimes. Both participatory and deliberative components of the democratic order are relevant for sustainable development [19,20,27]. Cultural and educational variables associated with political transparency and human rights are important markers for good governance [36,37,38]. Recent theoretical perspectives on SDGs emphasize the active role which could be played by civic community and associative democracy [66,67,68,69,70,71]. In this context, scholars argued that subsidiarity is quite important for implementing different policies related to economic development and environmental preservation. Environmental NGOs and local business affairs have an important role in achieving the environmental and economic goals. These facts are relevant for sustaining the correlation between participatory democracy and sustainability [72,73,74].
Our empirical findings underline the complex and relevant interconnections between democracy and sustainability. The statistical relation between sustainable development index (SD) and democratic index (DI) is nonlinear but positive, suggesting the fact that democratic countries are more related with a high level of achievement regarding the sustainable development goals. The map of sustainability suggests that Scandinavia and North America could be considered models of “good practice” in achieving the guidelines of The 2030 Agenda. The most important finding related to both areas consist in good governance, social responsibility, fair justice and respect for human rights and civil liberties. In this context, the Scandinavian model creates the synthesis between economic and social responsibility and a good level for economic growth and environmental preservation. Our empirical findings confirms the fact that “Scandinavia is routinely cited as a global leader in corporate social responsibility (CSR) and sustainability […] We consider the deep-seated traditions of stakeholder engagement across Scandinavia including the claim that the recent concept of ‘creating shared value’ has Scandinavian origins, institutional and cultural factors that encourage strong CSR and sustainability performances.” [82] (p. 1). Beside Scandinavia and Western European countries, empirical findings suggest the fact that Canada, USA, Australia and New Zeeland could be integrated on the same path with sustainable developed countries. For researchers involved in analyzing the implications of sustainability in different geographical regions, Canada could be seen as an important pole of development based on four values: “equity and neighborliness, as well as health and environment” [83]. One of the most affected regions by the low level of sustainable development is represented by African continent. As we have shown through the statistical results, Africa has the lowest average of the economic, social and environmental indicators. Related to our empirical results since 2010, both OECD experts and academics had identified several constraints in the evolution of African continent towards a sustainable model of development. Northern Africa is characterized by political instability, economic degrowth and social inequalities. Middle values for sustainable development are registered in Central and Southern Africa. Regarding South Africa, academic literature emphasized several constraints for sustainable development as: uncertainty of the investment projects, problems with infrastructure investment, market distortions, rigid labor market, low rates of employability, inadequate human capital and resources, financial imbalances and unequal distribution of the public expenditure [84]. The Asian model of sustainable development is based on economic strategies. China’s strategy for development is based on economic growth, international trade and a mix between market and governmental regulations within the field of economic dynamics. Thus, protectionism, financial risks and income inequalities are several constraints for implementing the sustainable model in this geographical region. Furthermore we can mention in this context the environmental costs. [85]. These environmental costs have to be correlated with ecological deterioration and environmental pollution. “Global warming [CDP1] will increase international pressure on China to do more to reduce pollution” [85].
An important result of this paper is based on the middle positive statistical correlation between sustainability (SD) and democratic index (DI). Statistical results suggest the fact that democratic political regimes are more involved in political partnerships for achieving the SDGs. The current problems related to democracy could suggest the incidence of the “hybrid regimes” and the real symptoms of “democratic recession” [75,76,77,78]. In these conditions, the map of democracy across 193 countries among 2015–2021 seems to indicate a cleavage between Western political systems (characterized by full or flawed democracies) and Eastern hybrid or authoritarian regimes. This finding could be put in contrast with the cleavage regarding the sustainable development, where the main differences manifest on the axis North-South.
Related to the research methodology, statistical results suggest the existence of fundamental differences between democratic and non-democratic countries in achieving a reasonable level of sustainable development goals [75,76,77,78,79,80,81,82,83,84]. Moreover, for the research objectives O1 and O2 we can confirm that, in accordance with H1, there are significant social, economic and environmental differences between countries, if we take into consideration the quality of the political regime. We have observed that democracies are more adequate for sustaining both economic progress and social justice through a strong, but flexible mechanism of democratic institutions [58,59,60,61,62,63,64,65,66,67,68,69,70].
Our empirical findings confirm, with a middle value of Pearson’ correlation, the fact that the quality of the democracy (measured through Democratic Index) could positively influence the level of sustainable development (measured through Sustainability Index Score). In this respect, we can confirm H2, which is based on the positive, but middle, association between democracy level and sustainable development. Both theoretical perspectives and statistical results are related with O3, which indicates that there are different paths for sustainable development in nondemocratic and democratic regimes. Through our quantitative estimations, we demonstrated H3 and H4. In this respect, we underline two models of development: a specific model for autocracy and hybrid regimes (incident in China and ex-soviet countries) and a model based on solid democratic institutions, rule of law, fair justice and preservation of peace (specific for USA, Canada, Western European democracies, Scandinavia, Australia and New Zeeland). In accordance with the research thesis, we argue that participatory and associative democracy could be an important vector and catalyst for achieving the SDGs. The research hypothesis H4 is admitted in accordance with the empirical findings, which suggest that civic engagement, participation and accountability could increase the level of achieving the UN goals for social, economic and environmental development. The multilinear equations of regression show that in both flawed and full democracies the main predictors for development are represented by the quality of education, rational consumption, global partnership and democratic institutional design. Thus, the research objectives O2 and O4, covered by the research hypothesis H2 and H4, are detailed and explained in both theoretical and empirical sections of the paper [16,17,18,19,20,22,23,27,28,29,30,32,33,35,36,37,38,41,42,43,44,45,46,47,48,49,58,59,60,61,62,63,64]. According to these authors, Western and Scandinavian democracies are characterized by a high level of civic engagement and participative culture. This fact is obvious when decision-makers are interested in shaping new strategies or policies related to the main pillars of sustainable development. An increased number of NGOs for covering both social and environmental issues could explain both the increased level of achieving SDGs and the high scores for democracy index. Political participation and functioning of the governments could be considered predictors for the dynamics of development in democratic countries. Thus, political stability and the governmental interest for the quality of citizens’ life is an important feature of the good governance. For the research objective O5, covered by the research hypothesis H5, our quantitative results suggest with p < 0.05 that in democratic countries (DI > 8.00) the level of achieving SDGs could have increased values (SD > 80). Moreover, this fact is confirmed by the confidence level with values between [77.20; 81, 11]. In the same time, our statistical results reflect that more than 91% of the democratic countries are associated with an upper score of the sustainable development index. The map of sustainable development illustrates, in accordance with the integral and differential calculus, that the most entropic geographical areas are represented by the African and Asian continents. This aspect could be related to the presence of authoritarian and hybrid political regimes. Less entropic regions are represented by Europe, North America, Australia and New Zeeland. All these regions and political systems are characterized by a mix between flawed and full democracies. This way, our results confirm the fact that democratic institutions, rule of law, fair justice, participative culture and the respect for human rights are features of good governance and sustainable development [67,68,73]. Historical heritage, political culture, accountability and social responsibility together with civic engagement could explain the differences in the distribution of sustainability and democracy in different geographical areas [42,47,51,53].
Synthetizing, the quantitative results are correlated with both theoretical and methodological guidelines of the current paper. The maps of sustainability and democracy reflect two main types of geographical cleavages. Sustainable development could be interpreted and discussed starting from the North-South geographical differences. The distribution of democracy continue the Cold War geographical cleavage between Western democratic countries and Eastern hybrid and authoritarian regimes. In this respect, we have observed that in several Asian countries the model of sustainable development is related to economic growth. In contrast, democratic countries emphasize the role played by citizens, education, institutions and partnership for achieving the UN sustainable goals. The main limits of the research are represented by the period of time analyzed and the lack of other research variables like human capital, human security or environmental variables. Further directions of the research will be focused on the implications of the human capital in refining the relation between sustainable development and the civic engagement in the context of democratic regimes.

5. Conclusions

Concluding, the main goal of this paper is to stress the importance of democracy in achieving the UN 2030 Agenda for Sustainable Development. Apart from the economic, social and environmental pillars, we argue that the quality of the political regime could explain and predict the evolution of SDGs in different geographical regions. For mapping the evolution of the sustainable development in relation with democratic order, this article uses secondary data which measure the SDGs in terms of Sustainable Development Index (SD) and the quality of national democracy through Democratic Index (DI). In accordance with the normative assumptions of sustainability, our research findings focus on the importance of civic engagement, democratic institutions, accountability and good governance for achieving the SDGs 17. We observe the existence of a partial sustainable world, with middle values related to SDGs. However, this fact could be completed by a kind of “democratic recession” which characterizes the second decade of the XXI-st century. In this context, we estimate a middle positive association between democracy and the level of achievement of the SDGs 17 in full and flawed democracies. Quantitative results emphasize the fact that there is no linear nor non-linear association between dictatorship, authoritarian, hybrid political regimes on one hand and the level of achieving the SDGs on the other hand. In most part of the nondemocratic countries SDGs score has minimum values. In contrast, upper values related to the level of SDGs achievement are incident in Western Europe, Scandinavia, USA, Canada, Australia and New Zeeland. Moreover, we can observe two main statistical models which could explain the differences in the geography of sustainable development. The first model, related to economic growth, could be associated with several Asian autocracies and ex-soviet countries. The second model of development, associated with democratic regimes, emphasizes the role played by institutions, justice, partnerships and peace in maintaining an optimal level of social and economic development. All these features can be considered representative for good governance. Thus, our paper underlines the fact that democracy could be seen as an important predictor and catalyst for the further sustainable development processes. The empirical findings might be considered useful for those involved in elaborating a theoretical approach addressing the issue of sustainable development and for political decision-makers interested in achieving the main guidelines and requests of UN in the sphere of sustainability.

Author Contributions

The authors have contributed and collaborated for the whole manuscript. However, the theoretical approach and conceptualization were realized by B.Ș. and H.C.C. The methodological part, formal analysis and empirical results were realized by S.-P.G. The introduction part, discussions and conclusions were realized by B.Ș., S.-P.G. and H.C.C. The supervision and coordination of the research project was realized by S.-P.G. and B.Ș. All authors have contributed substantially to the research work and paper. All authors have read and agreed to the published version of the manuscript.

Funding

Authors are thankful to the Romanian Ministry of Research, Innovation and Digitization, within Program 1—Development of the national RD system, Subprogram 1.2—Institutional Performance—RDI excellence funding projects, Contract no. 11PFE/30.12.2021, for financial support.

Institutional Review Board Statement

Not applicable.

Informed Consent Statement

Not applicable.

Data Availability Statement

Quantitative data were extracted and collected from secondary sources and archives as follows: Democratic Index, Functioning of Government, Political Participation, Electoral Process, Political Culture and Civil Liberties: 2015: https://www.eiu.com/public/topical_report.aspx?campaignid=DemocracyIndex2015, (accessed on 20 January 2022); 2016: https://www.eiu.com/public/topical_report.aspx?campaignid=DemocracyIndex2016 (accessed on 23 January 2022); 2017: https://pages.eiu.com/rs/753-RIQ-438/images/Democracy_Index_2017.pdf (accessed on 30 January 2022); 2018: https://www.eiu.com/public/topical_report.aspx?campaignid=Democracy2018 (accessed on 1 February 2022); 2019: https://www.in.gr/wp-content/uploads/2020/01/Democracy-Index-2019.pdf (accessed on 5 February 2022); 2020: https://pages.eiu.com/rs/753-RIQ-438/images/democracy-index-2020.pdf (accessed on 5 February 2022); 2021: https://www.idea.int/gsod/sites/default/files/2021-11/the-global-state-of-democracy-2021_0.pdf (accessed on 5 February 2022); Sustainable Development Index: https://dashboards.sdgindex.org/profiles (accessed on 5–10 February 2022); SDGs: https://dashboards.sdgindex.org/downloads (accessed on 5 February 2022).

Conflicts of Interest

The authors declare no conflict of interest.

References

  1. Tisdell, C.A. Economic, social and political issues raised by the COVID-19 pandemic. Econ. Anal. Policy 2020, 68, 17–28. [Google Scholar] [CrossRef]
  2. Ashraf, N.B. Economic impact of government interventions during the COVID-19 pandemic: International evidence from financial markets. J. Behav. Exp. Financ. 2020, 27, 100371. [Google Scholar] [CrossRef]
  3. Li, Y.; Mutchler, J.E. Older Adults and the Economic Impact of the COVID-19 Pandemic. J. Aging Soc. Policy 2020, 32, 477–487. [Google Scholar] [CrossRef]
  4. Buheji, M.; da Costa Cunha, M.; Beka, G.; Mavrić, B.; De Souza, Y.L.; da Costa Silva, S.S.; Hanafi, M.; Yein, T.C. The Extent of COVID-19 Pandemic Socio-Economic Impact on Global Poverty. A Global Integrative Multidisciplinary Review. Am. J. Econ. 2020, 10, 213–224. [Google Scholar] [CrossRef]
  5. McBride, O.; Murphy, J.; Shevlin, M.; Gibson-Miller, J.; Hartman, T.K.; Hyland, P.; Levita, L.; Mason, L.; Martinez, A.P.; McKay, R.; et al. Monitoring the psychological, social, and economic impact of the COVID-19 pandemic in the population: Context, design and conduct of the longitudinal COVID-19 psychological research consortium (C19PRC) study. Int. J. Methods Psychiatr. Res. 2020, 30, e1861. [Google Scholar] [CrossRef]
  6. Hevia, C.; Neumeyer, A. A Conceptual Framework for Analyzing the Economic Impact of COVID-19 and its Policy Implications. UNDP Lac COVID-19 Policy Doc. Ser. 2020, 1, 29. [Google Scholar]
  7. McKee, M.; Murphy, A. Russia invades Ukraine again: How can the health community respond? Join others in calling for an immediate end to the fighting. BMJ 2022, 376, 1–2. [Google Scholar] [CrossRef]
  8. Leon, D.A.; Jdanov, D.; Gerry, C.G.; Grigoriev, P.; Jasilionis, D.; McKee, M.; Meslé, F.; Penina, O.; Twigg, J.; Vallin, J.; et al. The Russian invasion of Ukraine and its public health consequences. Lancet Reg. Health Eur. 2022, 15, 1–2. [Google Scholar] [CrossRef]
  9. Oxford Analytica. Evidence tilts towards Ukraine war likelihood. Exp. Brief. 2022. [Google Scholar] [CrossRef]
  10. Boese, V.A.; Edgell, A.B.; Hellmeier, S.; Maerz, S.F.; Lindberg, S.I. How democracies prevail: Democratic resilience as a two-stage process. Democratization 2021, 28, 885–907. [Google Scholar] [CrossRef]
  11. Guasti, P. The Impact of the COVID-19 Pandemic in Central and Eastern Europe. The Rise of Autocracy and Democratic Resilience. Democr. Theory 2020, 7, 47–60. [Google Scholar] [CrossRef]
  12. Lührmann, A. Disrupting the autocratization sequence: Towards democratic resilience. Democratization 2021, 28, 1017–1039. [Google Scholar] [CrossRef]
  13. Merkel, W.; Lührmann, A. Resilience of democracies: Responses to illiberal and authoritarian challenges. Democratization 2021, 28, 869–884. [Google Scholar] [CrossRef]
  14. López, R.; Toman, M.A. Economic Development and Environmental Sustainability. In New Policy Options; Oxford University Press: New York, NY, USA, 2006. [Google Scholar]
  15. Hák, T.; Moldan, B.; Dahl, A.L. Sustainability Indicators. A Scientific Assessment; Island Press: Washington, DC, USA, 2007. [Google Scholar]
  16. Edwards, A.R. The Sustainability Revolution. Portrait of a Paradigm Shift; New Society Publishers: Gabriola Island, BC, Canada, 2005. [Google Scholar]
  17. Bell, S.; Morse, S. Sustainability Indicators Measuring the Immeasurable? 2nd ed.; Earthscan: London, UK, 2008. [Google Scholar]
  18. Choucri, N.; Mistree, D.; Haghseta, F.; Mezher, T.; Baker, W.R.; Ortiz, C.I. Mapping Sustainability Knowledge e-Networking and the Value Chain; Springer: Dordrecht, The Netherlands, 2007. [Google Scholar]
  19. Steger, U. The Business of Sustainability. Building Industry Cases for Corporate Sustainability; Palgrave Macmillan: New York, NY, USA, 2004. [Google Scholar]
  20. Hawkins, D.E. Corporate Social Responsibility. In Balancing Tomorrow’s Sustainability and Today’s Profitability; Palgrave Macmillan: New York, NY, USA, 2006. [Google Scholar]
  21. Méndez-Picazo, M.T.; Galindo-Martín, M.A.; Castaño-Martínez, M.S. Effects of sociocultural and economic factors on social entrepreneurship and sustainable development. J. Innov. Knowl. 2020, 6, 69–77. [Google Scholar] [CrossRef]
  22. Dalevska, N.; Khobta, V.; Kwilinski, A.; Kravchenko, S. A model for estimating social and economic indicators of sustainable development. Entrep. Sustain. Issues 2019, 6, 1839–1860. [Google Scholar] [CrossRef]
  23. Schroeder, P.; Anggraeni, K.; Weber, U. The Relevance of Circular Economy Practices to the Sustainable Development Goals. J. Ind. Ecol. 2019, 23, 77–95. [Google Scholar] [CrossRef] [Green Version]
  24. Suárez-Eiroa, B.; Fernández, E.; Méndez-Martínez, G.; Soto- Oñate, D. Operational principles of circular economy for sustainable development: Linking theory and practice. J. Clean. Prod. 2019, 214, 952–961. [Google Scholar] [CrossRef]
  25. Polasky, S.; Kling, C.L.; Levin, S.A.; Carpenter, S.R.; Daily, G.C.; Ehrlich, P.R.; Heal, G.M.; Lubchenco, J. Role of economics in analyzing the environment and sustainable development. Proc. Natl. Acad. Sci. USA 2019, 116, 5233–5238. [Google Scholar] [CrossRef] [Green Version]
  26. Morozova, I.A.; Popkova, E.G.; Litvinova, T.N. Sustainable development of global entrepreneurship: Infrastructure and perspectives. Int. Entrep. Manag. J. 2019, 15, 589–597. [Google Scholar] [CrossRef]
  27. Mensah, J. Sustainable development: Meaning, history, principles, pillars, and implications for human action: Literature review. Cog. Soc. Sci. 2019, 5, 1683296. [Google Scholar] [CrossRef]
  28. Neumayer, E. Human Development and Sustainability. J. Hum. Dev. Capab. 2012, 13, 561–579. [Google Scholar] [CrossRef]
  29. Neumayer, E. The human development index and sustainability—A constructive proposal. Ecol. Econ. 2001, 39, 101–114. [Google Scholar] [CrossRef]
  30. Wilkinson, A.; Hill, M.; Gollan, P. The sustainability debate. IJOPM 2001, 21, 1492–1502. [Google Scholar] [CrossRef]
  31. Spreitzer, G.; Porath, C.; Gibson, C. Toward human sustainability: How to enable more thriving at work. Organ. Dyn. 2012, 41, 155–162. [Google Scholar] [CrossRef]
  32. Nilashi, M.; Rupani, P.F.; Rupani, M.M.; Kamyab, H.; Shao, W.; Ahmadi, H.; Rashid, T.A.; Aljojo, N. Measuring sustainability through ecological sustainability and human sustainability: A machine learning approach. J. Clean. Prod. 2019, 240, 118162. [Google Scholar] [CrossRef]
  33. Secundo, G.; Ndou, V.; Del Vecchio, P.; De Pascale, G. Sustainable development, intellectual capital and technology policies: A structured literature review and future research agenda. Technol. Forecast. Soc. Chang. 2020, 153, 119917. [Google Scholar] [CrossRef]
  34. Handa, N. Education for Sustainability through Internationalisation. In Transnational Knowledge Exchange and Global Citizenship; Palgrave MacMillan: London, UK, 2018. [Google Scholar]
  35. Gomez Martins, A. Teaching and researching on sustainability: The case of an interdisciplinary initiative at a higher education institution. In Higher Education and Sustainability Opportunities and Challenges for Achieving Sustainable Development Goals; Azeiteiro, U.M.M., Davim, J.P., Eds.; CRC Press Taylor & Francis Group: New York, NY, USA, 2020; pp. 133–150. [Google Scholar]
  36. Nhamo, G.; Mjimba, V. Sustainable Development Goals and Institutions of Higher Education; Springer Nature: Basel, Switzerland, 2020. [Google Scholar]
  37. Steele, W.; Rickards, L. Higher Education, A Transformative Agenda? Palgrave Macmillan: Cham, Switzerland, 2021. [Google Scholar]
  38. McCowan, T. Higher Education for and beyond the Sustainable Development Goals; Palgrave Macmillan: Cham, Switzerland, 2021. [Google Scholar]
  39. The United Nations Development Programme. UNDP—The Sustainable Development Goals Report 2017. Available online: https://unstats.un.org/sdgs/report/2017/ (accessed on 2 February 2022).
  40. Alaimo, L.; Ciacci, A.; Ivaldi, E. Measuring Sustainable Development by Non-aggregative Approach. Soc. Ind. Res. 2021, 157, 101–122. [Google Scholar] [CrossRef]
  41. Van Zanten, J.A.; Van Tulder, R. Towards nexus-based governance: Defining interactions between economic activities and Sustainable Development Goals (SDGs). Int. J. Sustain. Dev. World Ecol. 2020, 28, 210–226. [Google Scholar] [CrossRef]
  42. Lu, Y.; Nakicenovic, N.; Visbeck, M.; Stevance, A.S. Five priorities for the UN Sustainable Development Goals. Nature 2015, 520, 432–433. [Google Scholar] [CrossRef] [Green Version]
  43. Dvarioniene, J.; Grecu, V.; Lai, S. Four Perspectives of Applied Sustainability: Research Implications and Possible Integrations. In Proceedings of the Computational Science and Its Applications—ICCSA 201, 17th International Conference Trieste, Proceedings, Part VI, Trieste, Italy, 3–6 July 2017. [Google Scholar]
  44. Moyer, J.; Hedden, S. Are we on the right path to achieve the sustainable development goals? World Dev. 2020, 127, 104749. [Google Scholar] [CrossRef]
  45. Sachs, J.D. The Age of Sustainable Development; Columbia University Press: New York, NY, USA, 2015. [Google Scholar]
  46. Nerini, F.F.; Sovacool, B.; Hughes, N.; Cozzi, L.; Cosgrave, E.; Howells, M.; Tavoni, M.; Tomei, J.; Zerriffi, H.; Milligan, B. Connecting climate action with other Sustainable Development Goals. Nat. Sustain. 2019, 2, 674–680. [Google Scholar] [CrossRef]
  47. Fritz, S.; See, L.; Carlson, T.; Haklay, M.M.; Oliver, J.L.; Fraisl, D.; Mondardini, R.; Brocklehurst, M.; Shanley, L.A.; Schade, S.; et al. Citizen science and the United Nations Sustainable Development Goals. Nat. Sustain. 2019, 2, 922–930. [Google Scholar] [CrossRef]
  48. Silvestre, B.S.; Tîrca, D.M. Innovations for sustainable development: Moving toward a sustainable future. J. Clean. Prod. 2019, 208, 325–332. [Google Scholar] [CrossRef]
  49. Fonseca, L.M.; Domingues, J.P.; Dima, A.M. Mapping the Sustainable Development Goals Relation-ships. Sustainability 2020, 12, 3359. [Google Scholar] [CrossRef] [Green Version]
  50. Miola, A.; Schiltz, F. Measuring sustainable development goals performance: How to monitor policy action in the 2030 Agenda implementation? Ecol. Econ. 2019, 164, 106373. [Google Scholar] [CrossRef]
  51. Nilsson, M.; Griggs, D.; Visbeck, M. Policy: Map the interactions between Sustainable Development Goals. Nature 2016, 534, 320–322. [Google Scholar] [CrossRef]
  52. Salvia, A.L.; Filho, W.L.; Brandli, L.L.; Griebeler, J.S. Assessing research trends related to Sustainable Development Goals: Local and global issues. J. Clean. Prod. 2019, 208, 841–849. [Google Scholar] [CrossRef] [Green Version]
  53. Griggs, D. Sustainable development goals for people and planet. Nature 2013, 495, 305–307. [Google Scholar] [CrossRef]
  54. Lucia, U.; Fino, D.; Grisolia, G. A thermoeconomic indicator for the sustainable development with social considerations. A thermoeconomy for sustainable society. Environ. Dev. Sustain. 2022, 24, 2022–2036. [Google Scholar] [CrossRef]
  55. Filho, W.L.; Brandli, L.L.; Salvia, A.L.; Rayman-Bacchus, L.; Platje, J. COVID-19 and the UN Sustainable Development Goals: Threat to Solidarity or an Opportunity? Sustainability 2020, 12, 5343. [Google Scholar] [CrossRef]
  56. Naidoo, R.; Fisher, B. Sustainable Development Goals: Pandemic reset. Nature 2020, 583, 198–201. [Google Scholar] [CrossRef]
  57. Hakovirta, M.; Denuwara, N. How COVID-19 Redefines the Concept of Sustainability. Sustainability 2020, 12, 3727. [Google Scholar] [CrossRef]
  58. Pohoryles, R.J. Sustainable development, innovation and democracy and democracy. What role for the regions? Innovation 2007, 20, 183–190. [Google Scholar] [CrossRef]
  59. Joseph, J. Sustainable development and democracy in the megacities. Dev. Pract. 2001, 11, 218–231. [Google Scholar] [CrossRef]
  60. Munslow, B.; Ekoko, F.E. Is democracy necessary for sustainable development? Democratization 1995, 2, 158–178. [Google Scholar] [CrossRef]
  61. Mangesh, A. Democracy and sustainable development. IOSR-JHSS 2014, 19, 40–42. [Google Scholar] [CrossRef]
  62. Sénit, C.A. Leaving no one behind? The influence of civil society participation on the Sustainable Development Goals. EPC Politics Space 2020, 38, 693–712. [Google Scholar] [CrossRef] [Green Version]
  63. Imran, S.; Javaid, F. Interlinkage between Democracy and Sustainable Development. Rev. Econ. Dev. Stud. 2017, 3, 159–166. [Google Scholar] [CrossRef] [Green Version]
  64. Söderbaum, P. Democracy and sustainable development: Implications for science and economics. Real-World Econ. Rev. 2012, 60, 107–119. [Google Scholar]
  65. Söderbaum, P. Reconsidering economics in relation to sustainable development and democracy. J. Philos. Econ. 2019, 13, 19–38. [Google Scholar]
  66. Lindberg, S.I.; Teorell, J.; Coppedge, M.; Gerring, J. V-Dem: A new way to measure democracy. J. Dem. 2014, 25, 159–169. [Google Scholar] [CrossRef]
  67. Pickering, J.; Hickmann, T.; Backstrand, K.; Kalfagianni, A.; Bloomfield, M.; Mert, A.; Ransan-Cooper, H.; Lo, A. Democratising sustainability transformations: Assessing the transformative potential of democratic practices in environmental governance. Earth Syst. Gov. J. 2022, 11, 100131. [Google Scholar] [CrossRef]
  68. Glass, L.M.; Newig, J. Governance for achieving the Sustainable Development Goals: How important are participation, policy coherence, reflexivity, adaptation and democratic institutions? Earth Syst. Gov. J. 2019, 2, 100031. [Google Scholar] [CrossRef]
  69. Ting, Y.C.; Lin, T.H. For security or sustainability? Investigating the global nexus of nuclear power, democracies, and civil society. Energy Res. Soc. Sci. 2021, 81, 102284. [Google Scholar] [CrossRef]
  70. Fung, A. Associations and Democracy: Between Theories, Hopes, and Realities. Annu. Rev. Sociol. 2003, 29, 515–539. [Google Scholar] [CrossRef] [Green Version]
  71. Hammond, J.M. Sustainability as a cultural transformation: The role of deliberative democracy. Environ. Pol. 2020, 29, 173–192. [Google Scholar] [CrossRef]
  72. International Institute for Democratic and Electoral Assistance (IDEA). The Sustainable Development Goals and the Global State of Democracy Indices, The Global State of Democracy in Focus. Available online: https://www.idea.int/publications/catalogue/sustainable-development-goals-and-global-state-democracy-indices (accessed on 5 March 2022).
  73. Monkelbaan, J. Governance for the Sustainable Development Goals Exploring an Integrative Framework of Theories, Tools, and Competencies; Springer Nature: Singapore, 2019. [Google Scholar]
  74. Achterberg, W. Sustainability, community and democracy. In Democracy and Green Political Thought. Sustainability, Rights and Citizenship; Doherty, B., De Geus, M., Eds.; Routledge: London, UK; New York, NY, USA, 1996. [Google Scholar]
  75. Diamond, L. Ill Winds: Saving Democracy from Russian Rage, Chinese Ambition, and American Complacency; Penguin Press: New York, NY, USA, 2019. [Google Scholar]
  76. Diamond, L. Facing up to the democratic recession. J. Dem. 2015, 26, 141–155. [Google Scholar] [CrossRef]
  77. Applebaum, A. Twilight of Democracy: The Seductive Lure of Authoritarianism; Doubleday, Penguin Random House LLC: New York, NY, USA, 2020. [Google Scholar]
  78. Ayers, A.J.; Saad-Filho, A. The twilight of formal democracy: Contradictions of accumulation and the political crisis of neoliberalism. J. Aust. Political Econ. 2020, 86, 230–255. [Google Scholar] [CrossRef]
  79. The Economist Intelligence Unit. Democracy Index. Available online: https://www.eiu.com/n/campaigns/democracy-index-2020/ (accessed on 5 February 2022).
  80. Sustainable Development Report. Track Progress and Trends on Achieving the Sustainable Development Goals for all 193 UN Member States. Available online: https://dashboards.sdgindex.org/ (accessed on 5 February 2022).
  81. Sustainable Development Report. Sustainable Development Report 2021. Available online: https://sdgs.un.org/goals (accessed on 5 February 2022).
  82. Strand, R.; Freeman, R.E.; Hockerts, K. Corporate Social Responsibility and Sustainability in Scandinavia: An Overview. J. Bus. Ethics 2015, 127, 1–15. [Google Scholar] [CrossRef] [Green Version]
  83. Pierce, J.T.; Dale, D. Communities, Development, and Sustainability across Canada; UBC Press: Vancover, BC, Canada, 1999. [Google Scholar]
  84. Fedderke, J. Sustainable growth in South Africa. In Growth and Sustianability in Brazil, China, India, Indonesia and South Africa; De Mello, L., Ed.; OECD: Washington, DC, USA, 2010; Available online: https://www.oecd.org/economy/growth/chapter5sustainablegrowthinsouthafrica.htm (accessed on 15 February 2022).
  85. Fan, G.; Wang, X. China towards 2020: Growth performance and sustainability. In Growth and Sustianability in Brazil, China, India, Indonesia and South Africa; De Mello, L., Ed.; OECD: Washington, DC, USA, 2010; Available online: https://www.oecd.org/economy/growth/chapter2chinatowards2020growthperformanceandsustainability.htm (accessed on 15 February 2022).
Figure 1. Proportion of Sustainable countries. Average among 2015–2021. Source of data: Sustainable Development Report: Sustainable Development Index: https://dashboards.sdgindex.org/profiles (accessed on 5–10 February 2022).
Sustainability 14 05659 g001
Figure 2. Proportion of democracy in 193 countries. Average among 2015–2021. Source of data: The Economist Intelligence Unit: https://www.eiu.com/n/campaigns/democracy-index-2021/ (accessed on 5 February 2021).
Sustainability 14 05659 g002
Figure 3. Map of Sustainable Development Index in 193 countries. Average among 2015–2021. Author’s map in Philcarto based on available data at: Sustainable Development Index: https://dashboards.sdgindex.org/profiles (accessed on 5–10 February 2022).
Sustainability 14 05659 g003
Figure 4. Map of Democratic Index in 193 countries. Average among 2015–2021. Author’s map in Philcarto based on available data at: The Economist Intelligence Unit: https://www.eiu.com/n/campaigns/democracy-index-2021/ (accessed on 5 February 2021).
Sustainability 14 05659 g004
Figure 5. Polynomial Regression between Sustainable Development Index and Democratic Index. Author’s quantitative determination based on statistical data presented in Section 2 (Research Methods).
Sustainability 14 05659 g005
Figure 6. Correlation between Democracy Index and SDG 16: Peace, Justice and Strong Institutions. Author’s quantitative determination based on statistical data presented in Section 2 (Research Methods).
Sustainability 14 05659 g006
Figure 7. The dynamics of Sustainable Development Index by geographical areas (average among 2015–2021). Author’s quantitative determination based on statistical data presented in Section 2 (Research Methods).
Sustainability 14 05659 g007
Figure 8. Forecast of the Sustainable Development Index conditioned by the quality of democracy. Author’s quantitative determination based on statistical data presented in Section 2 (Research Methods).
Sustainability 14 05659 g008
Table 1. Research Variables.
VariableSymbolMeasureData Source
Democracy IndexDI[0; 10]The Economist Intelligence Unit [79]
SDG Index Score (Sustainable Development Index)SD[0; 100]Sustainable Development Report [80]
Electoral Process and PluralismEP[0; 10]The Economist Intelligence Unit
Functioning of GovernmentFG[0; 10]The Economist Intelligence Unit
Political ParticipationPP[0; 10]The Economist Intelligence Unit
Political CulturePC[0; 10]The Economist Intelligence Unit
Civil LibertiesCL[0; 10]The Economist Intelligence Unit
SDG 1: No povertySDG 1[0; 100]Sustainable Development Report
SDG 2: Zero HungrySDG 2[0; 100]Sustainable Development Report
SDG 3: Good Health and well-beingSDG 3[0; 100]Sustainable Development Report
SDG 4: Quality EducationSDG 4[0; 100]Sustainable Development Report
SDG 5: Gender EqualitySDG 5[0; 100]Sustainable Development Report
SDG 6: Clean Water and SanitationSDG 6[0; 100]Sustainable Development Report
SDG 7: Affordable and Clean EnergySDG 7[0; 100]Sustainable Development Report
SDG 8: Decent Work and Economic GrowthSDG 8[0; 100]Sustainable Development Report
SDG 9: Industry Innovation and InfrastructureSDG 9[0; 100]Sustainable Development Report
SDG 10: Reduced InequalitiesSDG 10[0; 100]Sustainable Development Report
SDG 11: Sustainable cities and coomunitiesSDG 11[0; 100]Sustainable Development Report
SDG 12: Responsible consumption and productionSDG 12[0; 100]Sustainable Development Report
SDG 13: Climate ActionSDG 13[0; 100]Sustainable Development Report
SDG 14: Life below waterSDG 14[0; 100]Sustainable Development Report
SDG 15: Life on landSDG 15[0; 100]Sustainable Development Report
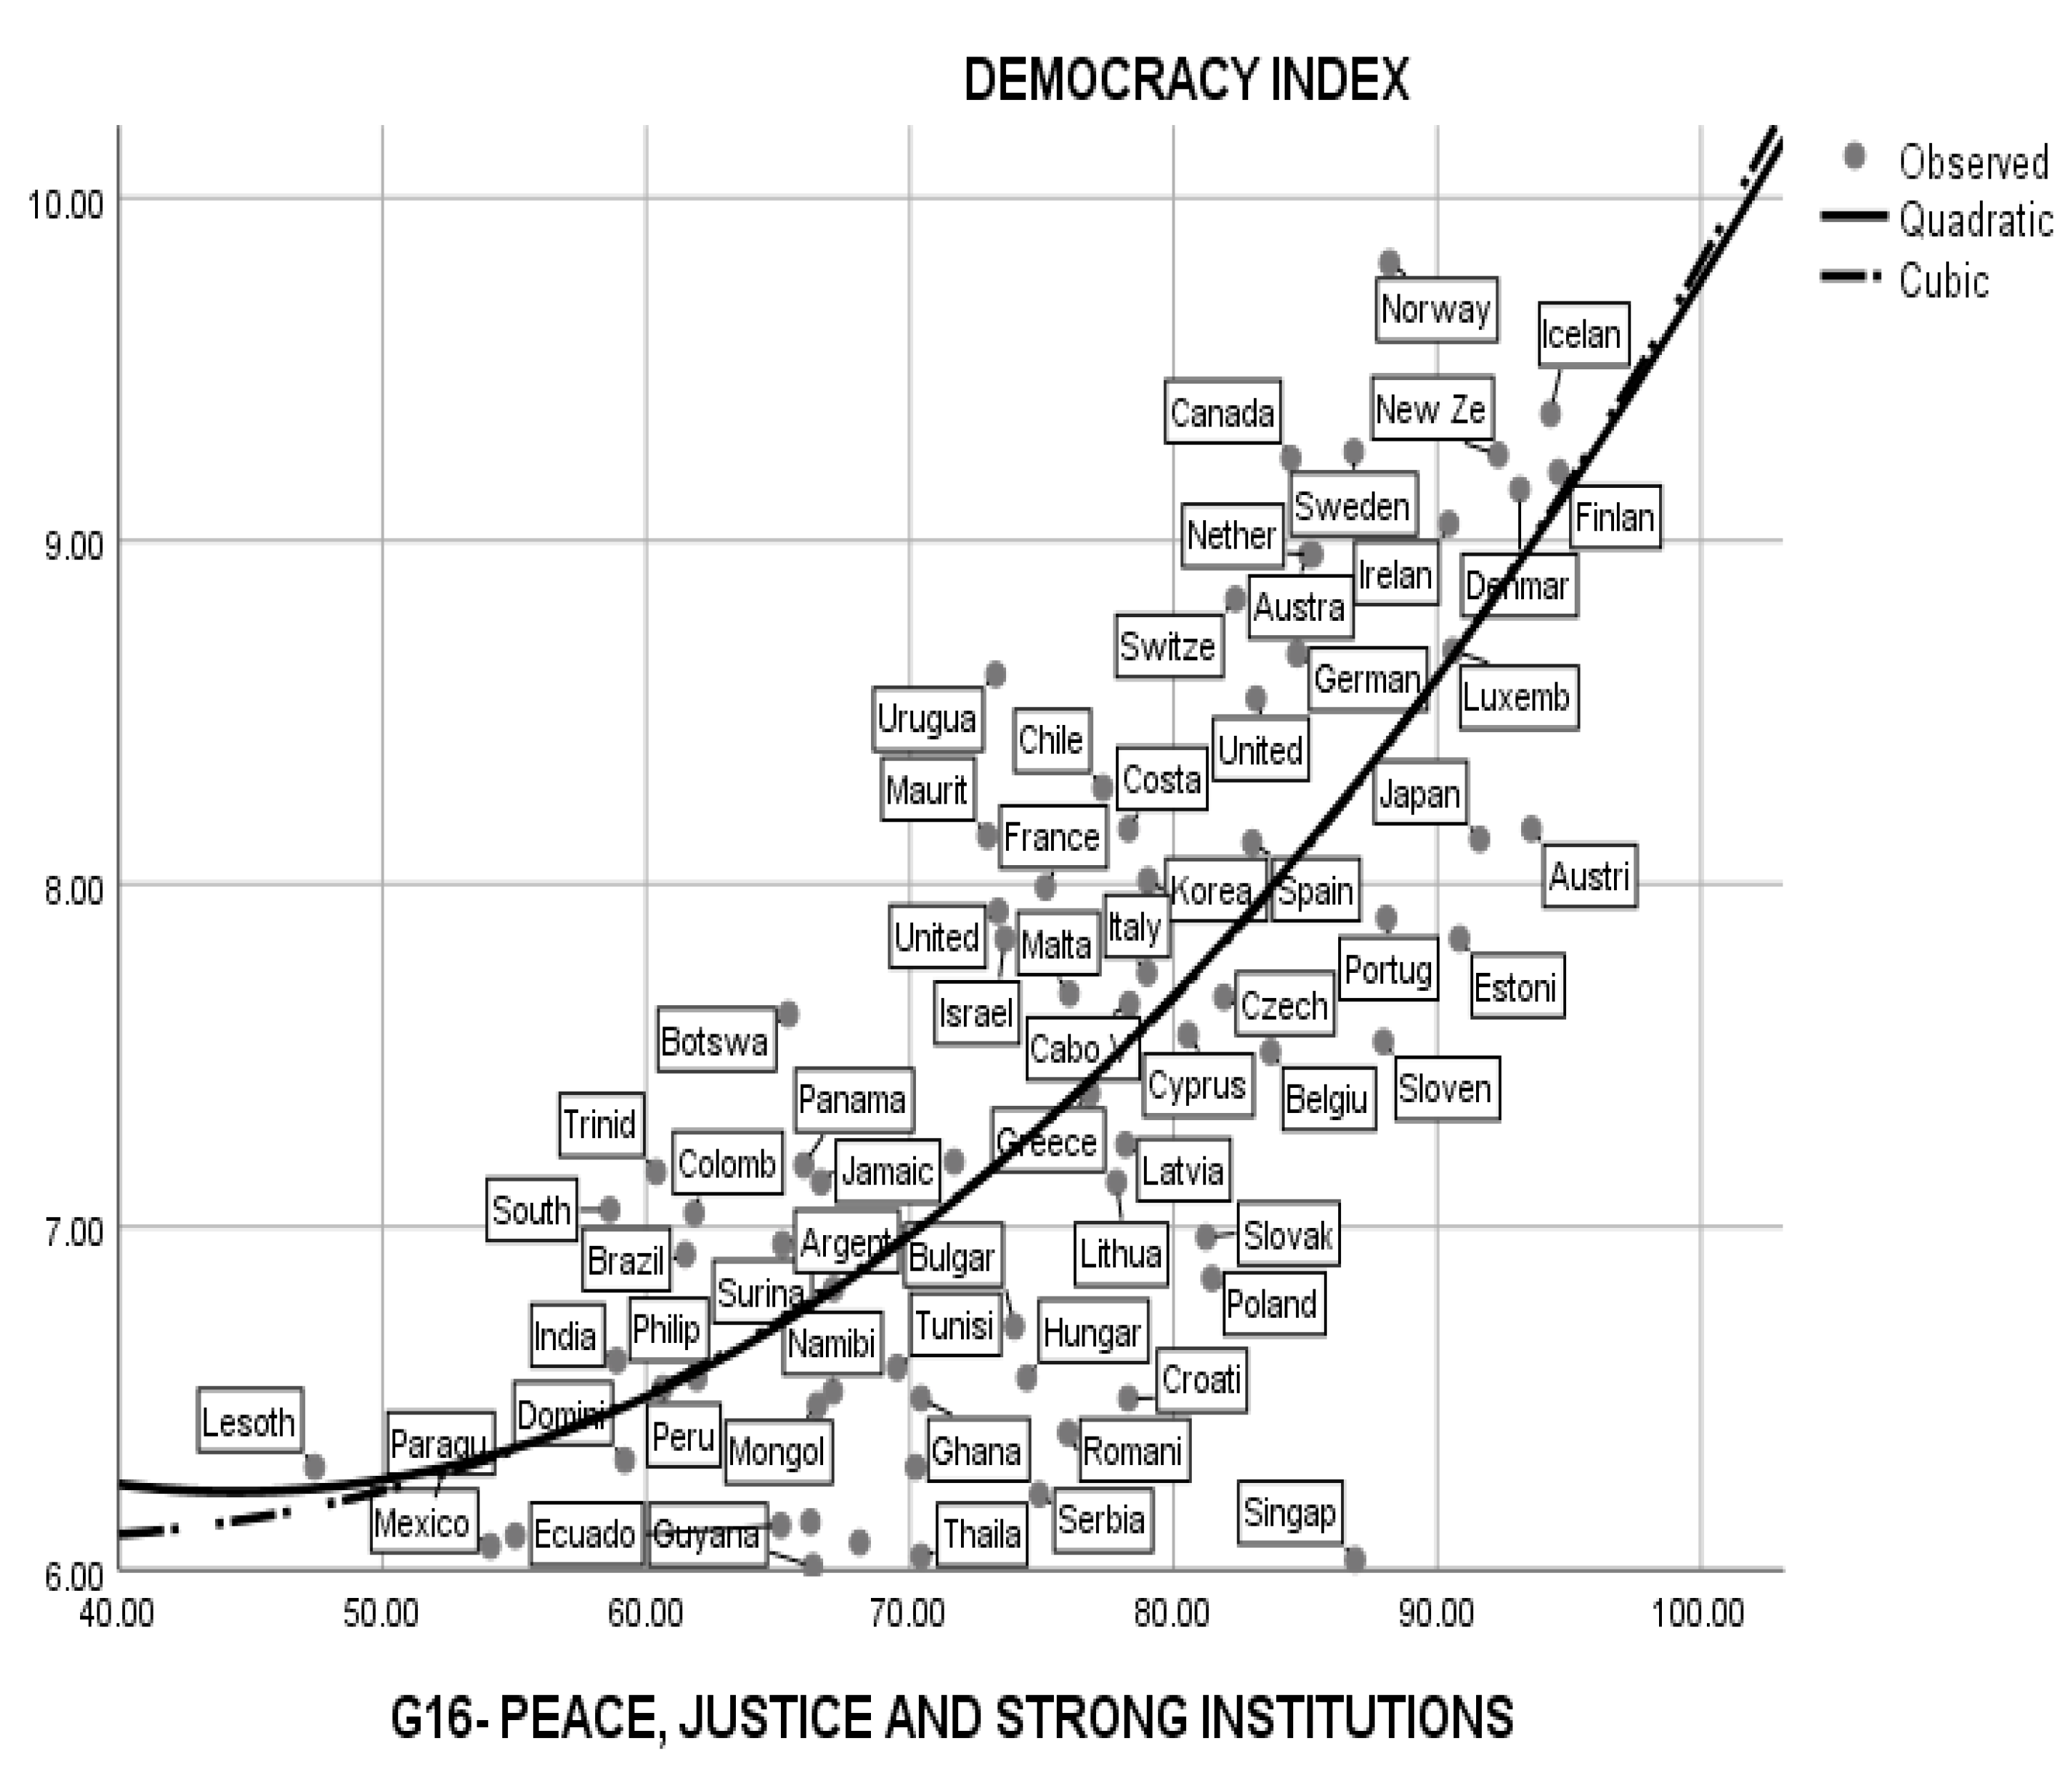
SDG 16: Peace, justice and strong institutionsSDG 16[0; 100]Sustainable Development Report
SDG 17: Partnership for the goalsSDG 17[0; 100]Sustainable Development Report
Table 2. Descriptive Statistics for Sustainable Development Index and Democratic Index in 193 countries among 2015–2021 1.
Sustainable Development IndexDemocracy
Index
Mean66.185.55
Median67.925.75
Mode30.006.21
Std. Deviation11.132.18
Variance123.964.78
Skewness−0.62−0.12
Std. Error of Skewness0.190.19
Kurtosis0.16−1.02
Std. Error of Kurtosis0.370.38
Range55.818.73
Percentiles2558.403.52
5067.925.75
7574.477.28
1 Sources of data: The Economist Intelligence Unit: 2015: https://www.eiu.com/public/topical_report.aspx?campaignid=DemocracyIndex2015, (accessed on 20 January 2022); 2016: https://www.eiu.com/public/topical_report.aspx?campaignid=DemocracyIndex2016 (accessed on 23 January 2022); 2017: https://pages.eiu.com/rs/753-RIQ-438/images/Democracy_Index_2017.pdf (accessed on 30 January 2022); 2018: https://www.eiu.com/public/topical_report.aspx?campaignid=Democracy2018 (accessed on 1 February 2022); 2019: https://www.in.gr/wp-content/uploads/2020/01/Democracy-Index-2019.pdf (accessed on 5 February 2022); 2020: https://pages.eiu.com/rs/753-RIQ-438/images/democracy-index-2020.pdf (accessed on 6 February 2022); 2021: https://www.idea.int/gsod/sites/default/files/2021-11/the-global-state-of-democracy-2021_0.pdf (accessed on 5 February 2022); Sustainable Development Report: Sustainable Development Index: https://dashboards.sdgindex.org/profiles (accessed on 5–10 February 2022).
Table 3. Linear Equation of Regression: Sustainability Development Index in Non-Democratic Countries 1.
PredictorsBStd. ErrorBetaTSig.
SDG 8-DECENT WORK AND ECONOMIC GROWTH0.0630.0190.4393.3160.002
1 Author’s quantitative model based on statistical data presented in Section 2 (Research Methods).
Table 4. Linear Equation of Regression: Sustainability Development Index in Democratic Countries 1.
PredictorsBStd. ErrorBetaTSig.
SDG 12- Responsible consumption and production−0.0320.006−0.469−5.1680.000
SDG 17- Partnership for goals 0.0190.0050.2183.7270.000
SDG 16- Peace, justice and strong institutions0.0450.0040.4574.6870.000
1 Author’s quantitative model based on statistical data presented in Section 2 (Research Methods).
Table 5. Measures of entropy/variation rate in different geographical areas 1.
Geographical AreaSD Variation Rate/Entropy (by Time)SD Variation Rate/Entropy (by the Regime Type)
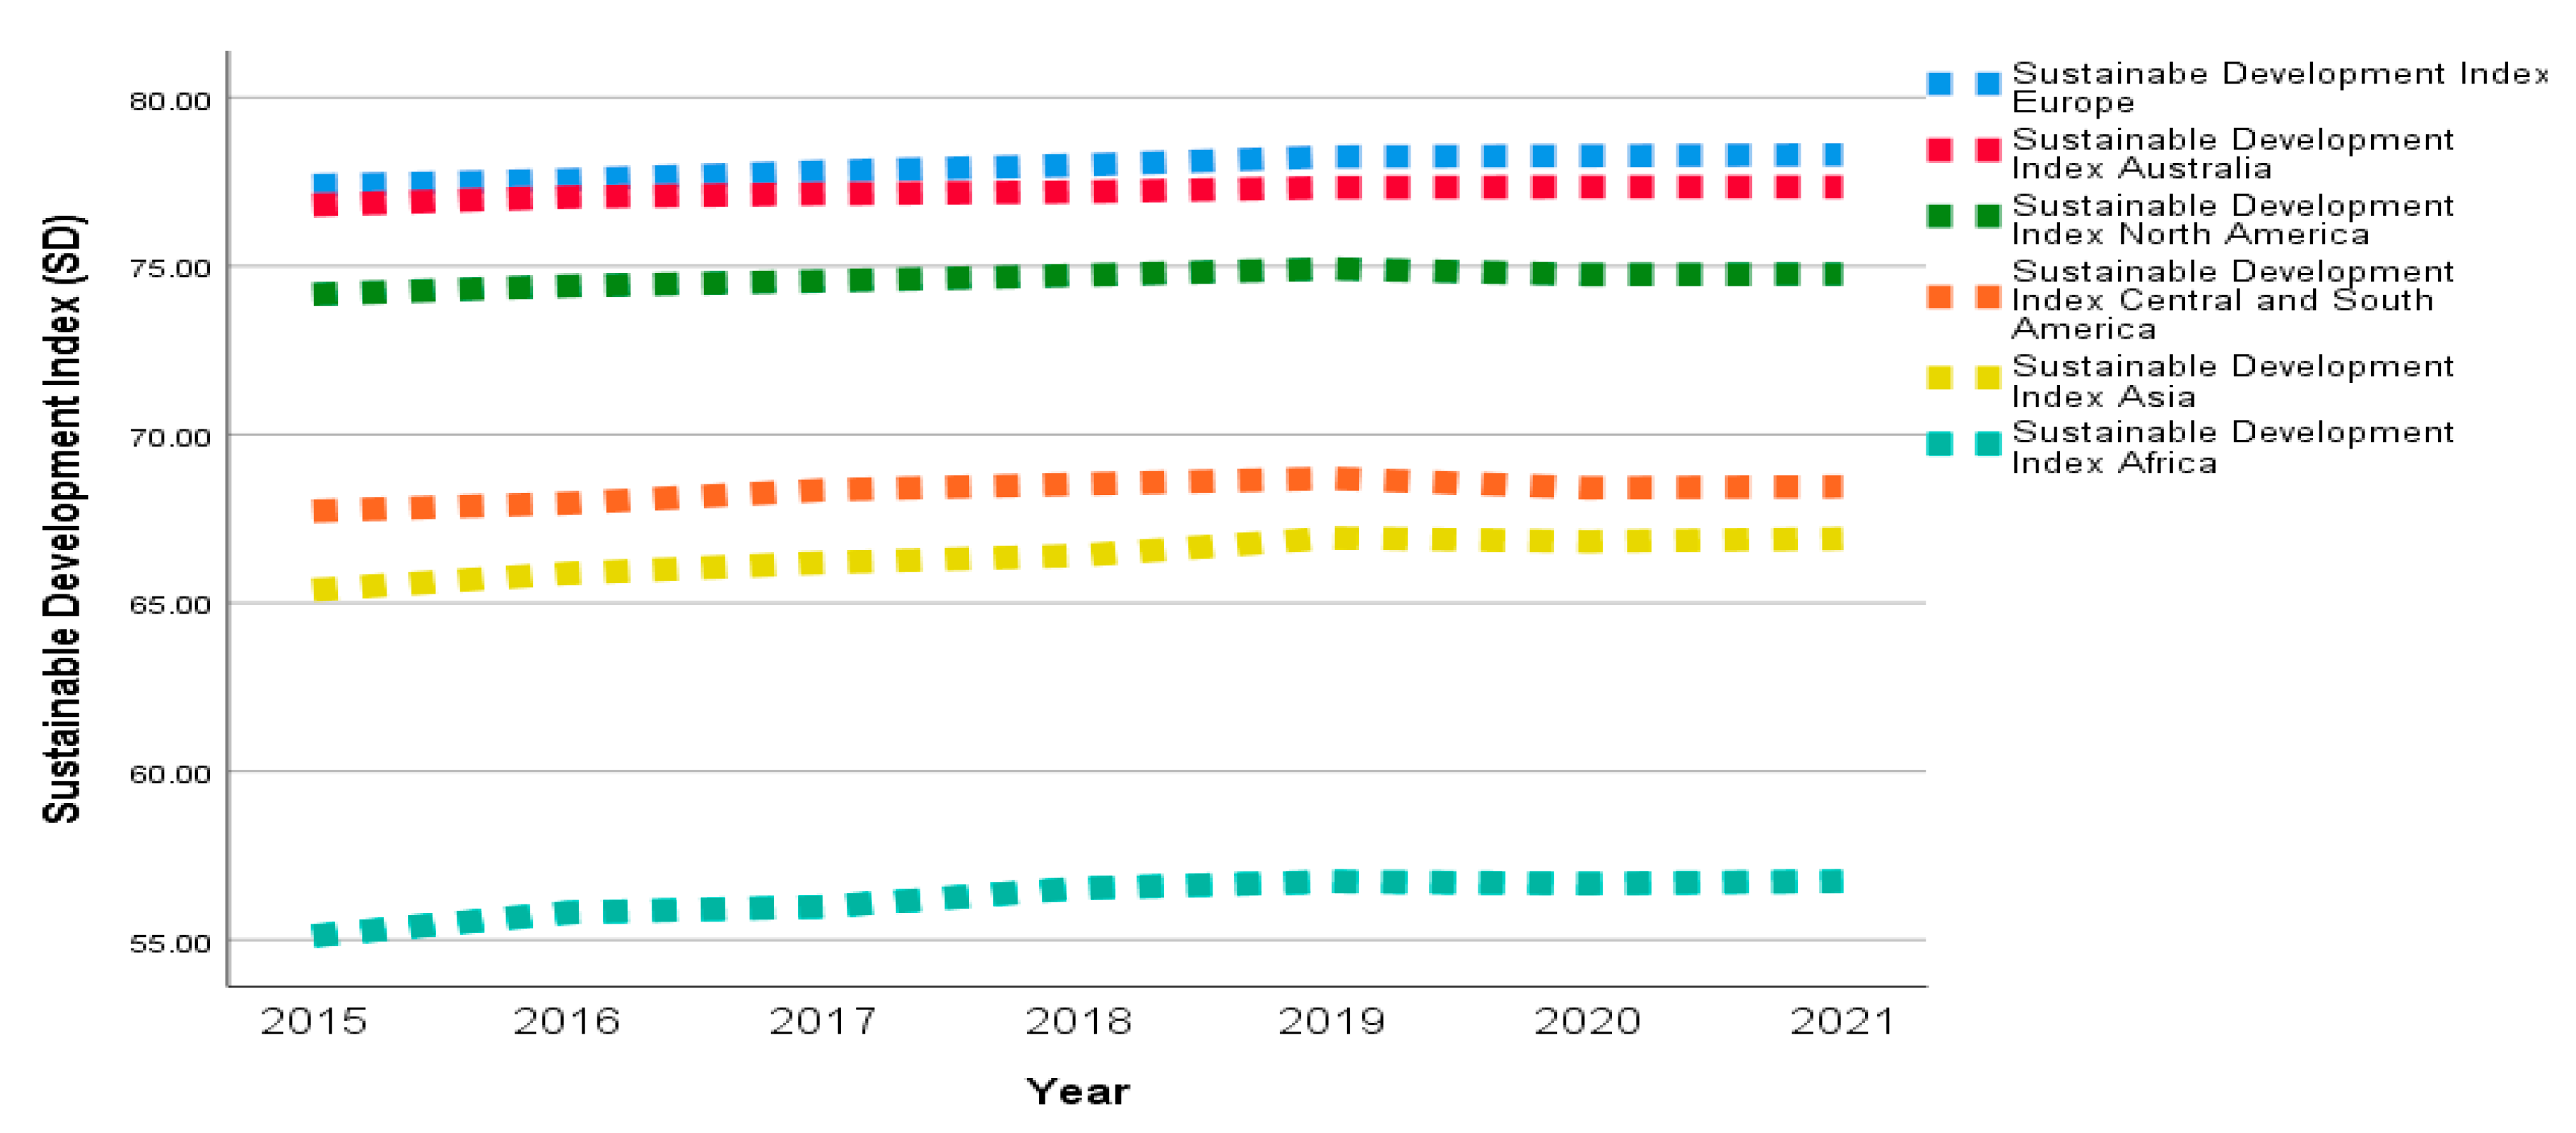
Sustainability Index Africa0.235.75
Sustainability Index Asia0.214.2
Sustainability Index North America0.081.33
Sustianability Index Europe0.130.92
Sustainability Index Central and Latin America0.11.25
Sustianability Index Australia and New Zeeland0.180.01
1 Author’s quantitative model based on statistical data presented in Section 2 (Research Methods).
Publisher’s Note: MDPI stays neutral with regard to jurisdictional claims in published maps and institutional affiliations.

