
Sustainable Groundwater Potential Zoning with Integrating GIS, Remote Sensing, and AHP Model: A Case from North-Central Bangladesh

 ,
,  ,
,  ,
,  ,
,  ,
,  ,
, 
Abstract
:1. Introduction
2. Materials and Methods
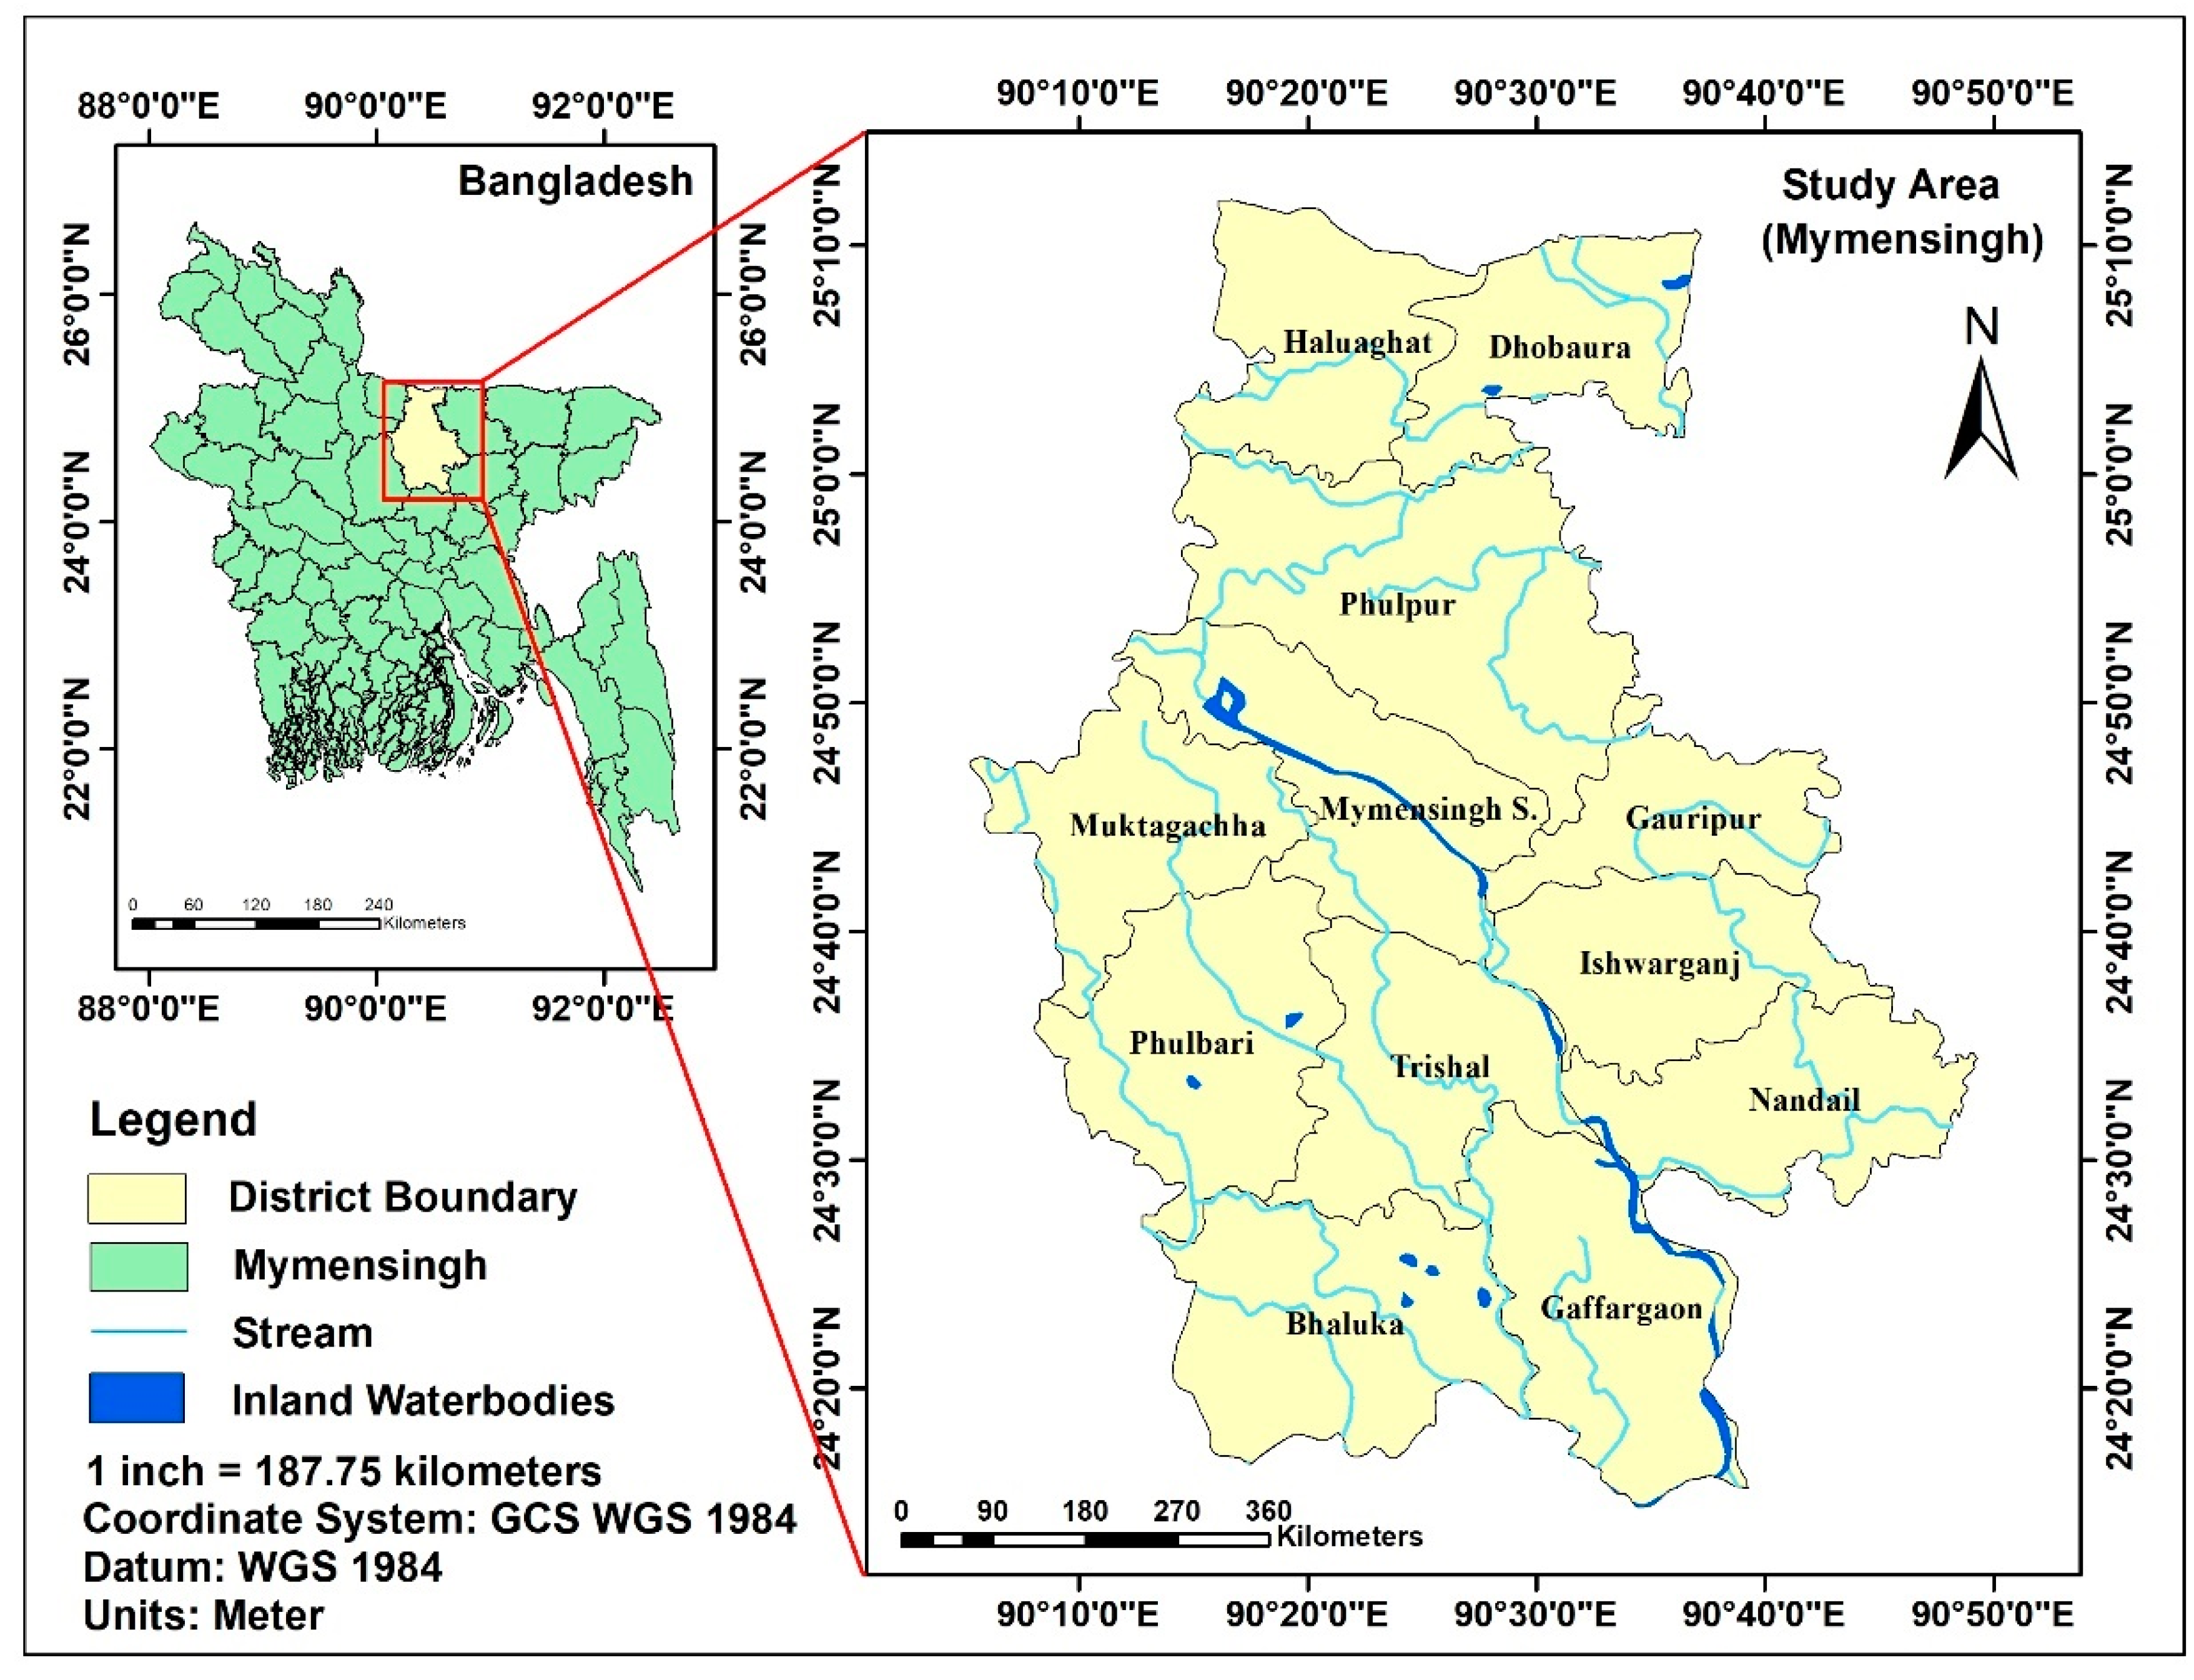
2.1. Description of the Study Area
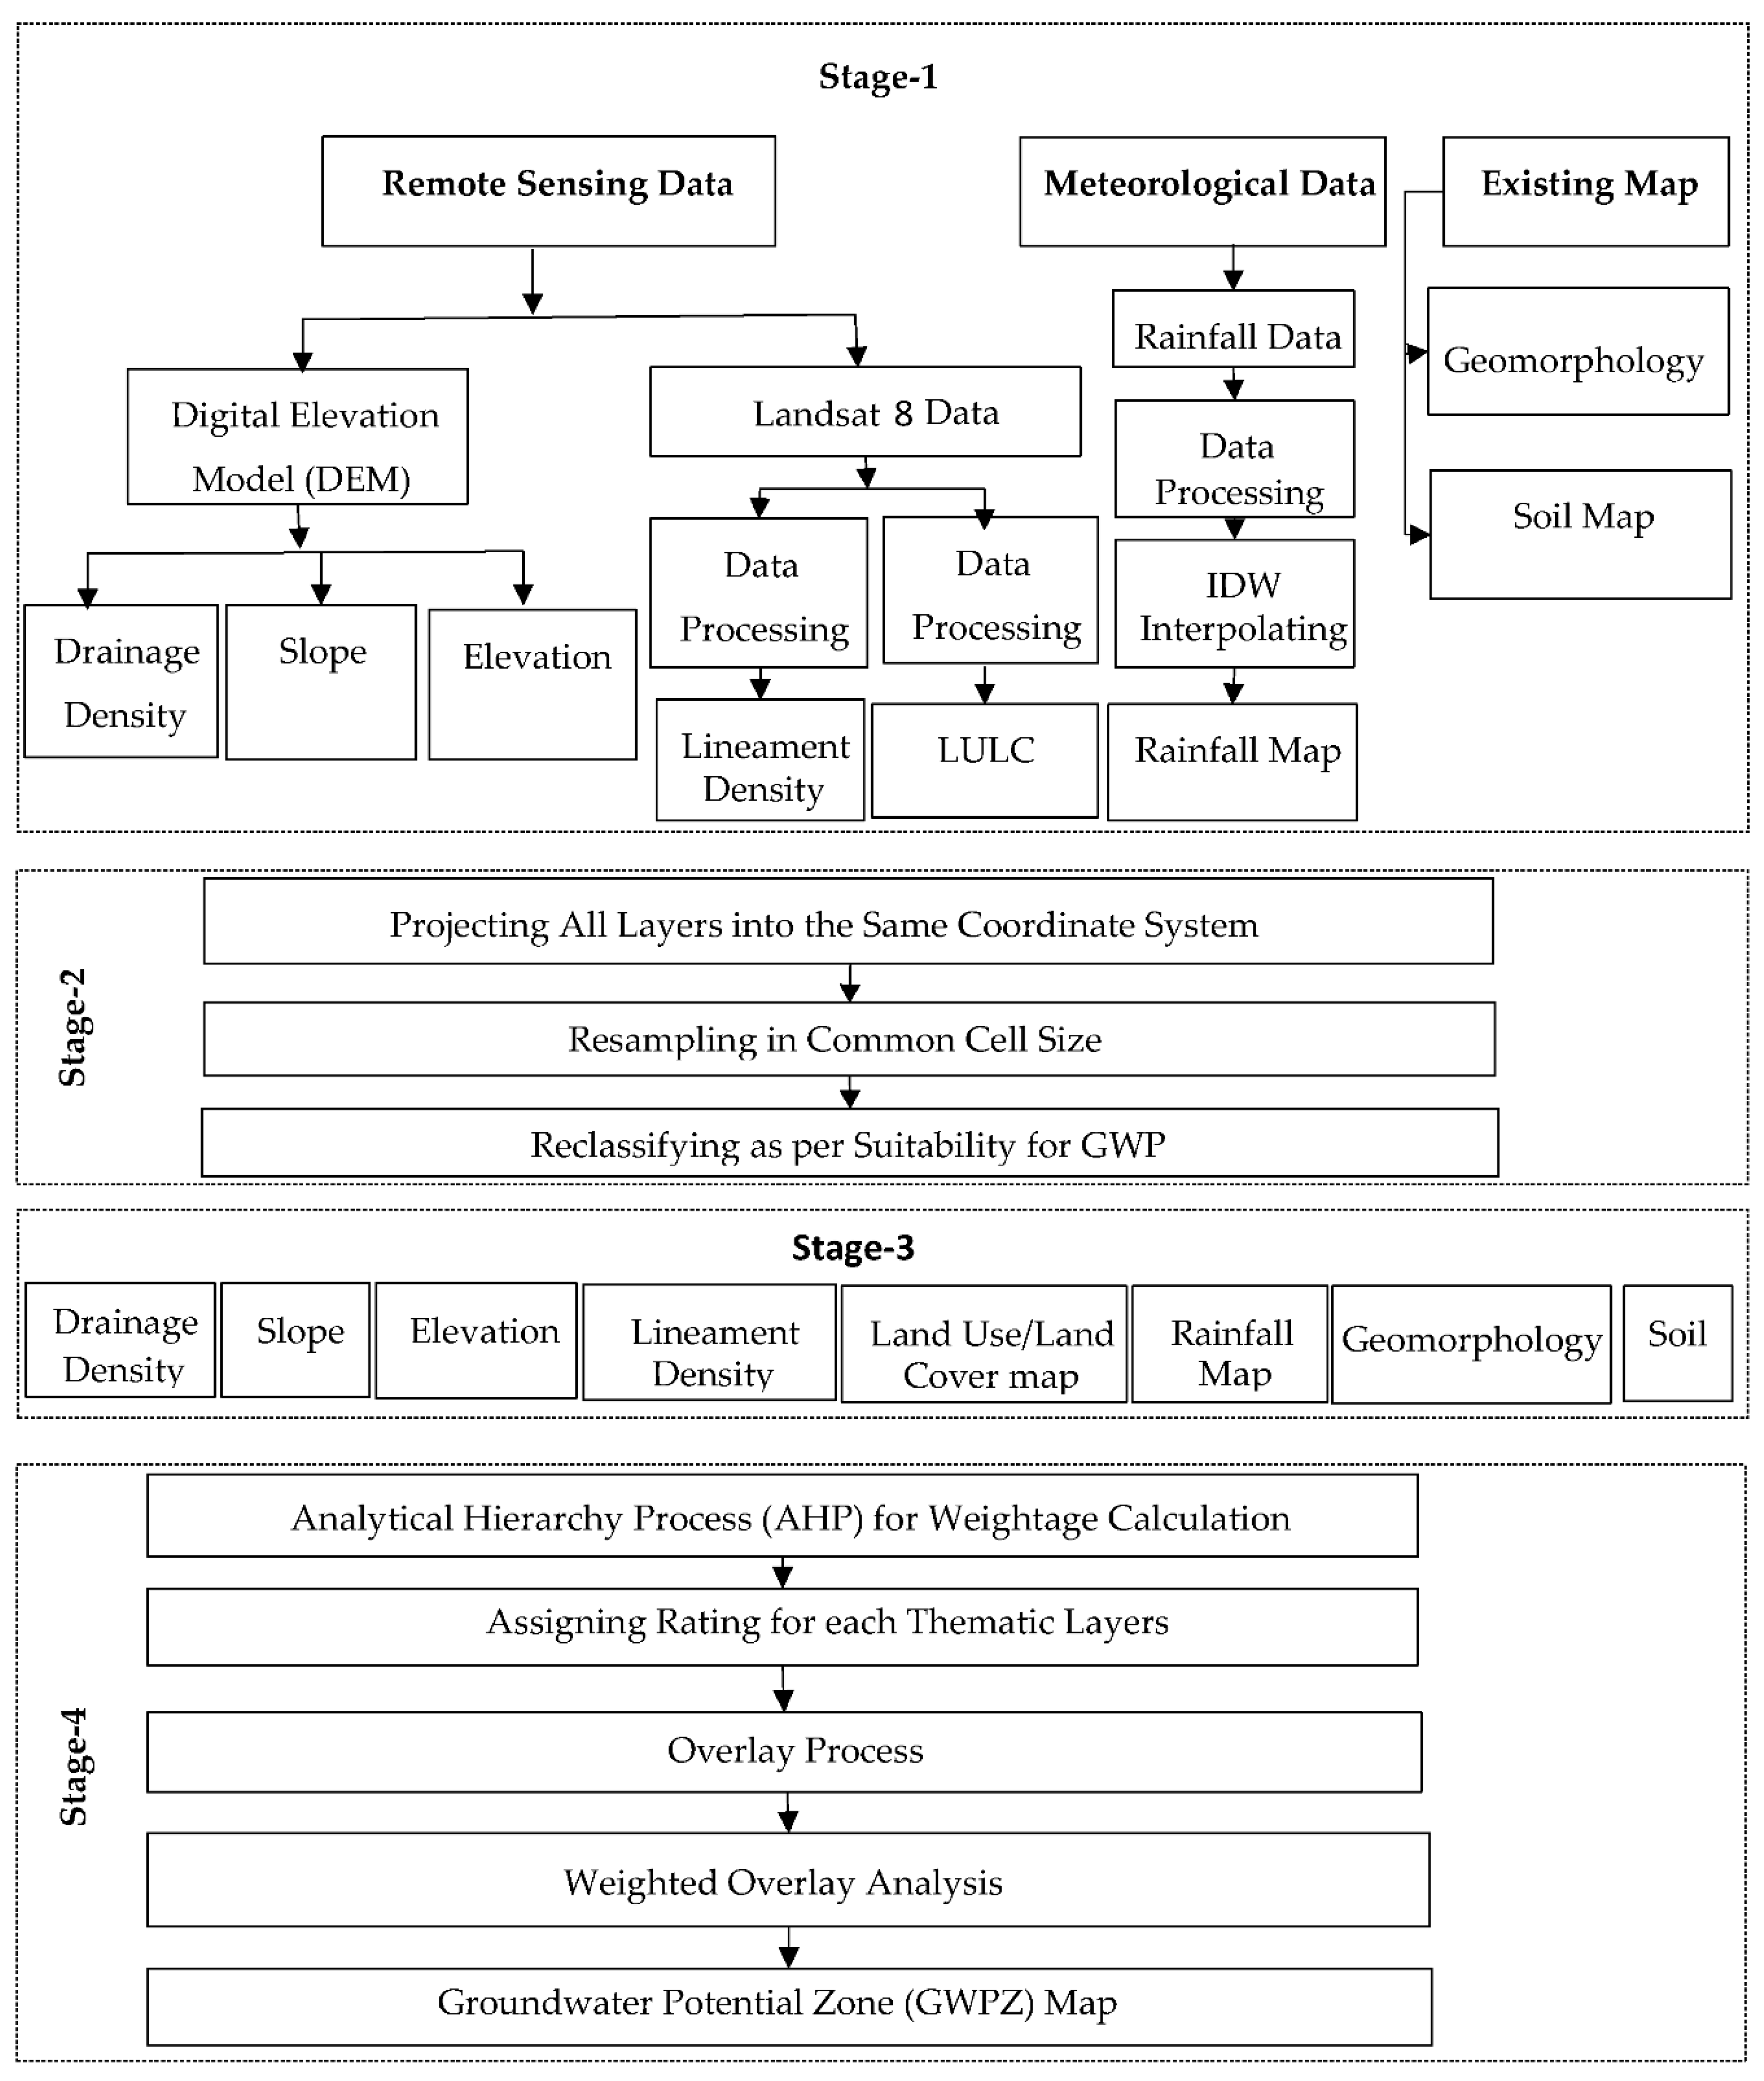
2.2. Description of Data Processing
2.3. Assigning Weight Using Multi-Criteria Decision Making Approach
2.3.1. Weight Assessment
2.3.2. Weight Normalization
2.3.3. Principal Eigen Vector
2.3.4. Consistency Index (CI) and Consistency Ratio (CR) Calculation
2.3.5. Assigning Ratings for the Weighted Overlay Analysis
2.3.6. Weighted Overlay Analysis for Groundwater Potential Zone Mapping
2.4. Validation of Results
3. Results
3.1. Description of Influential Factors
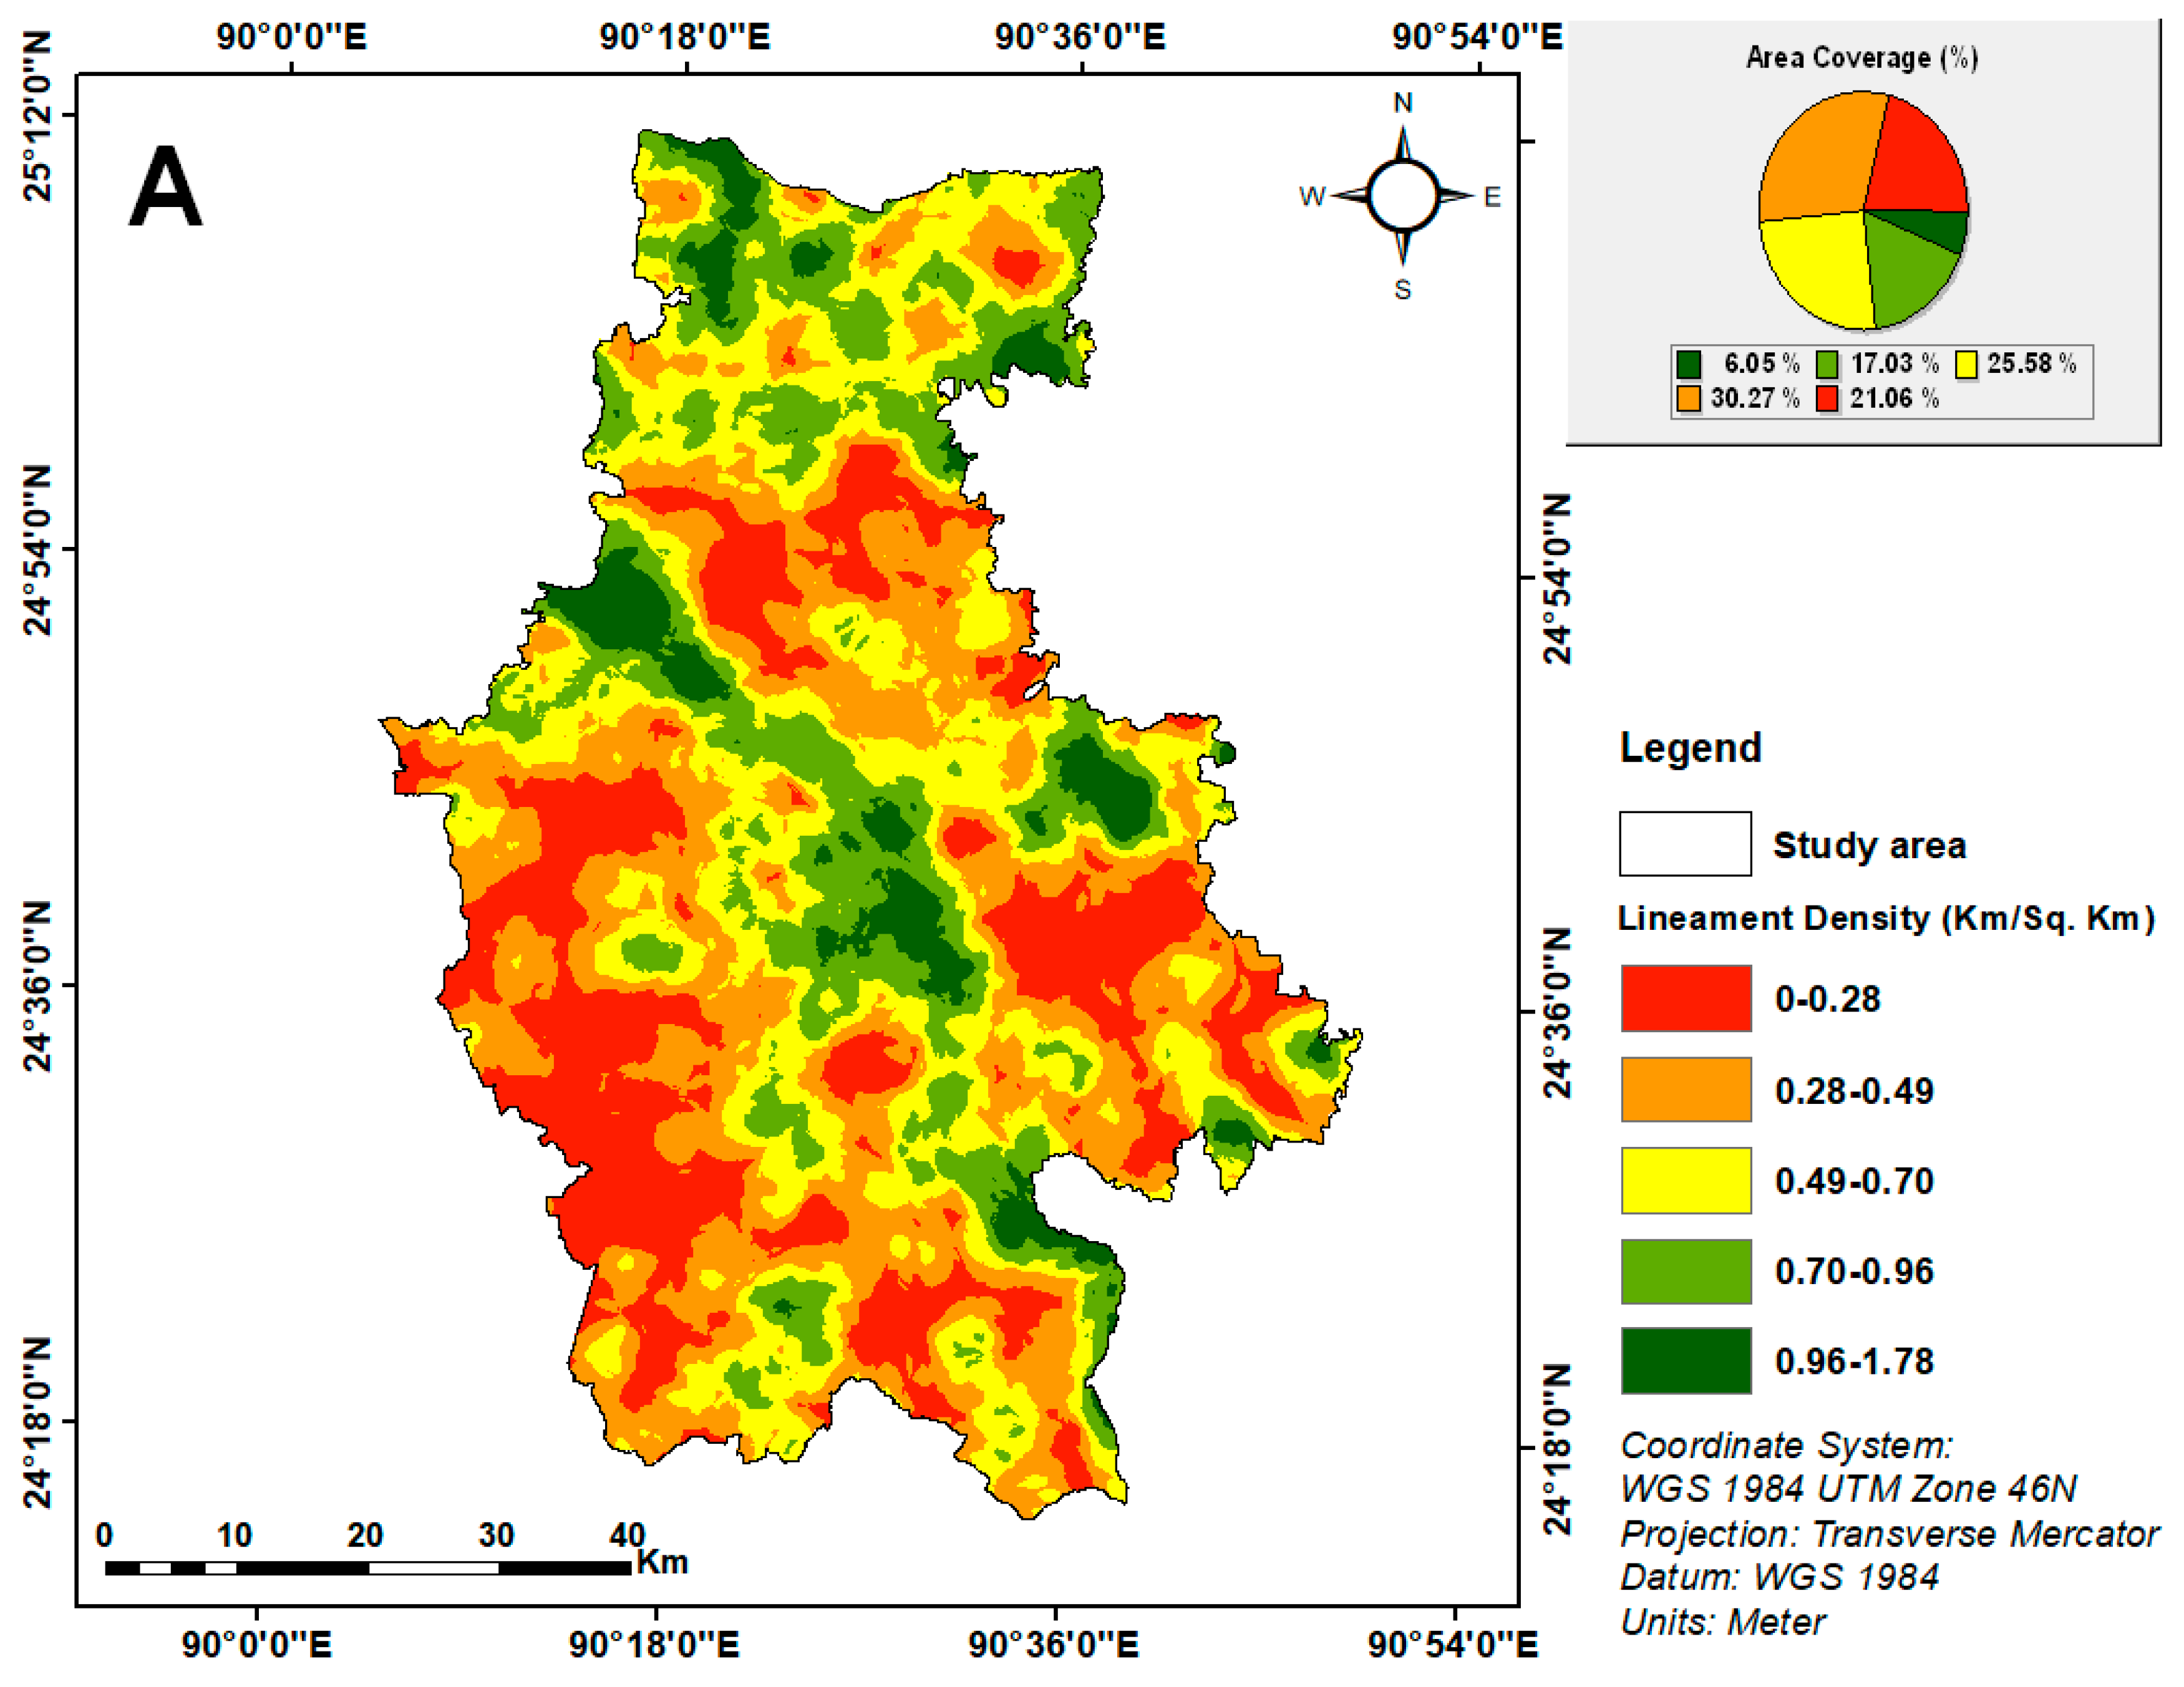
3.1.1. Lineament Density
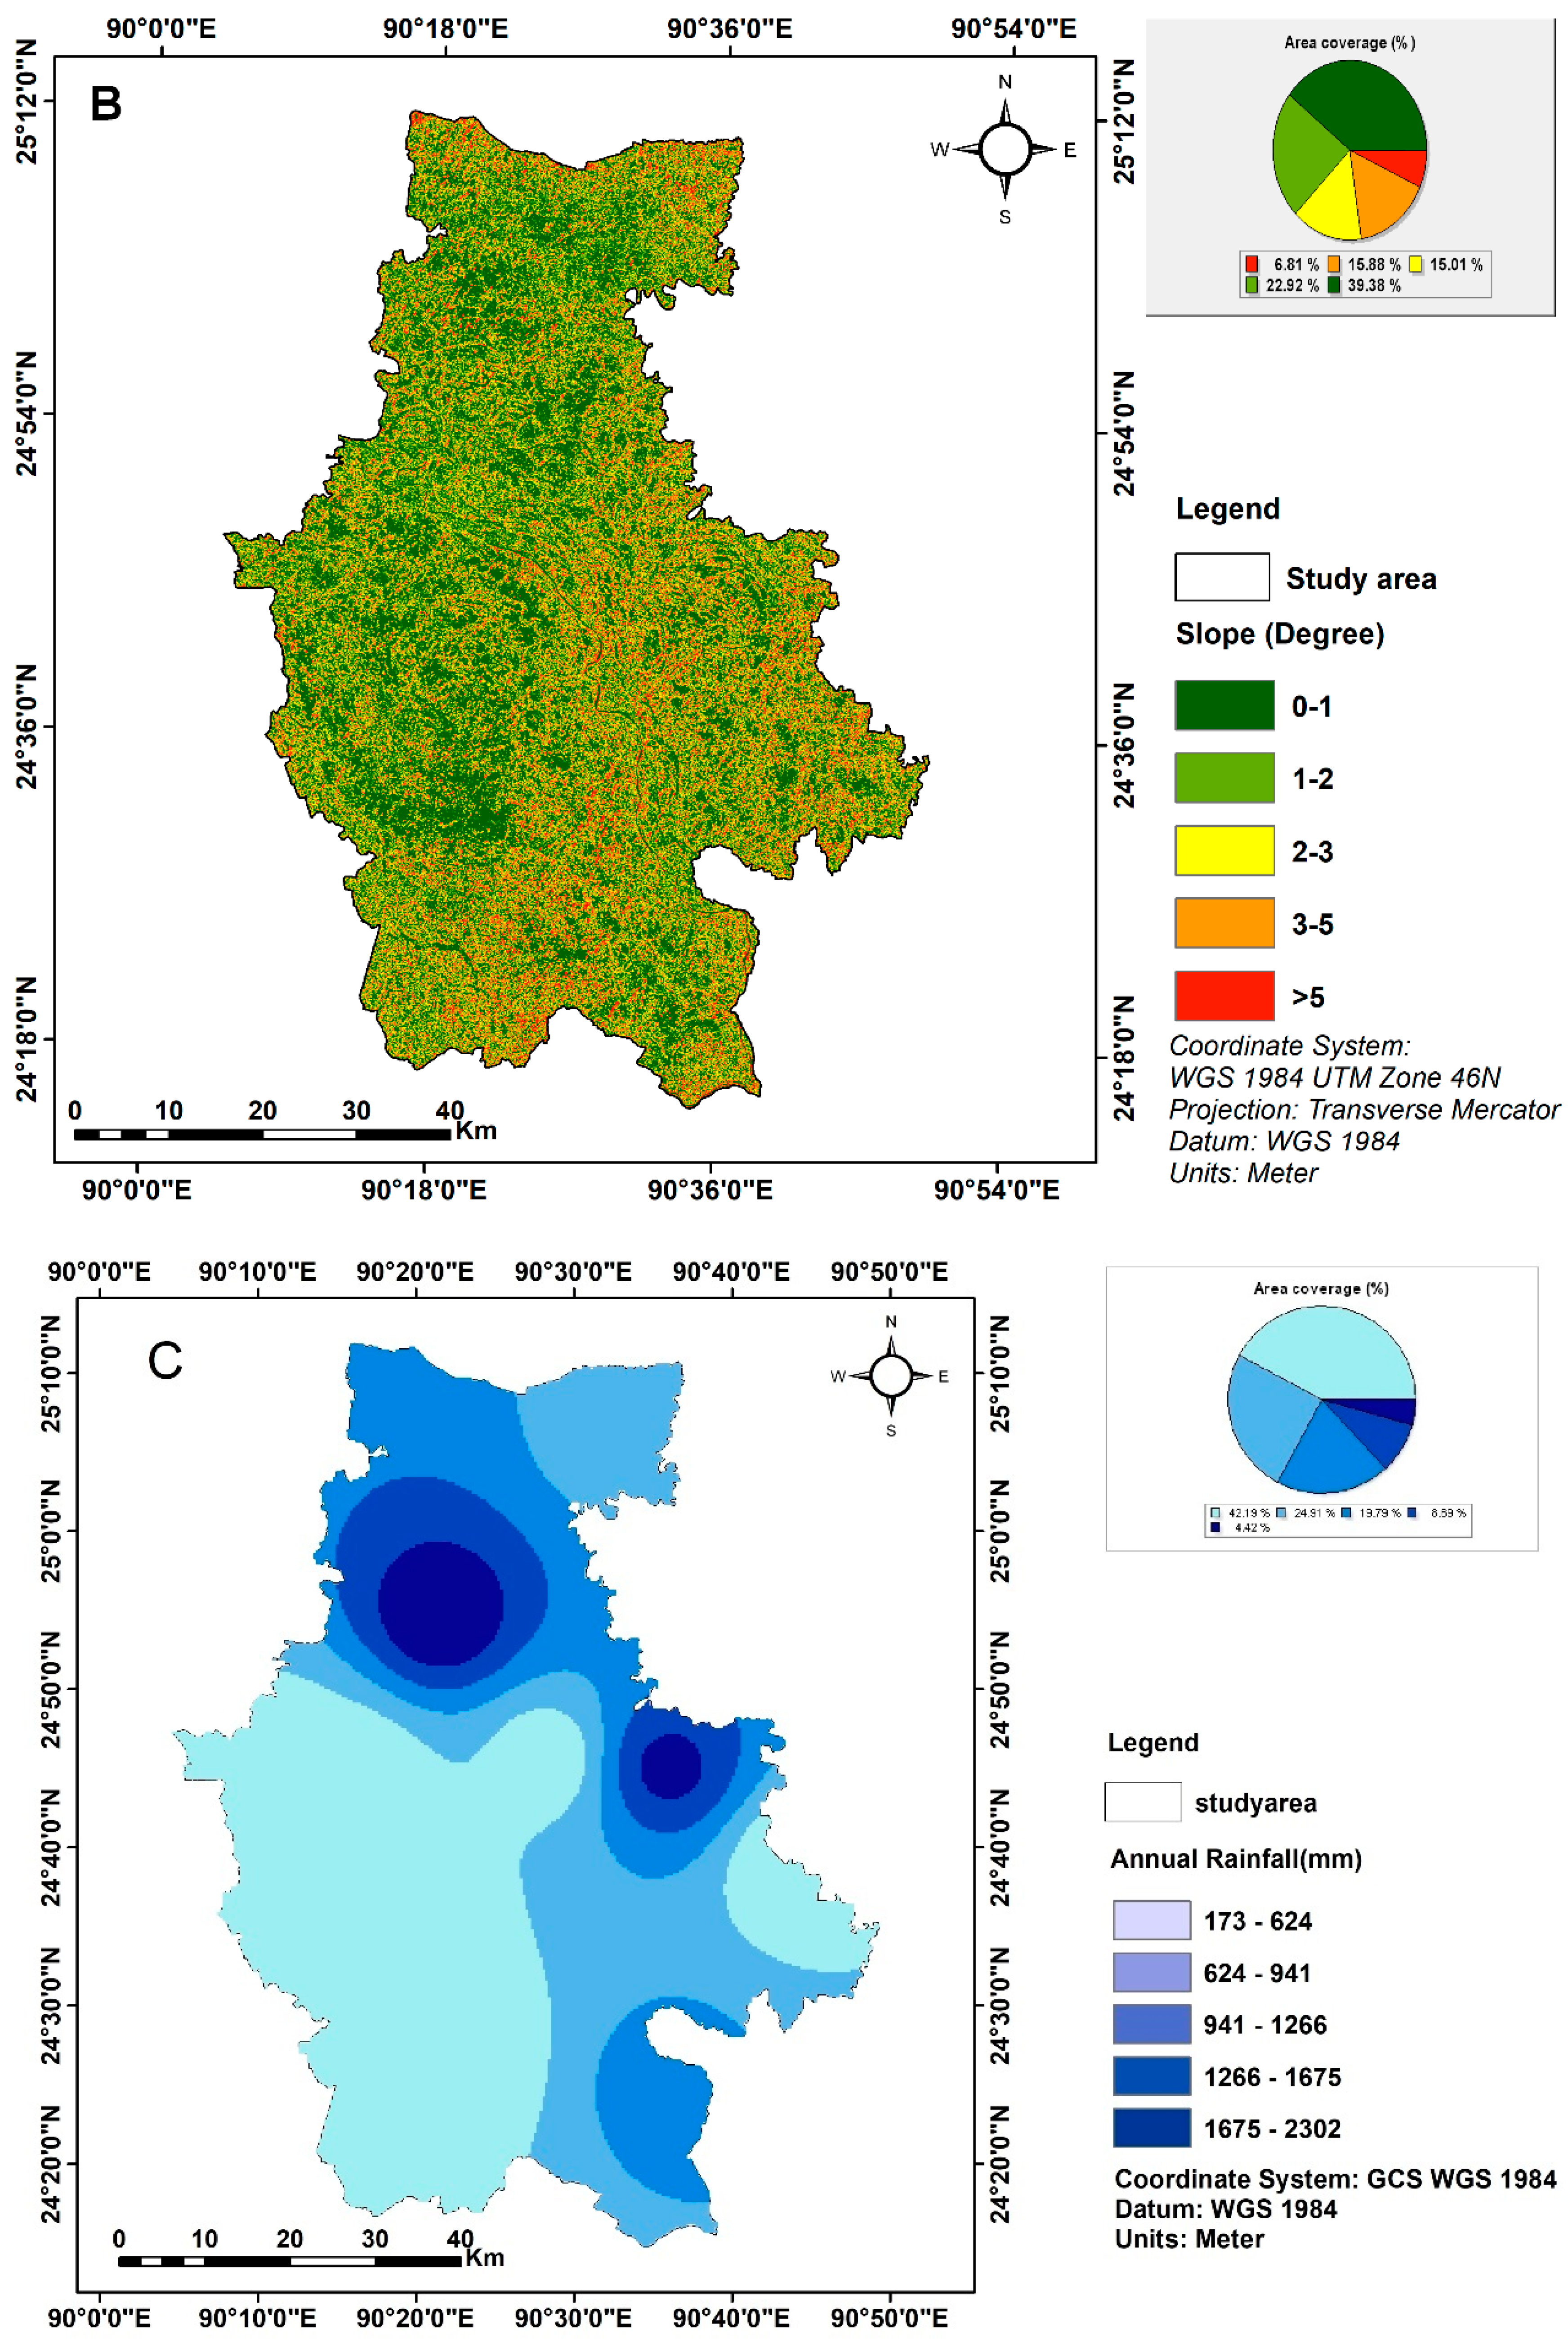
3.1.2. Slope
3.1.3. Rainfall
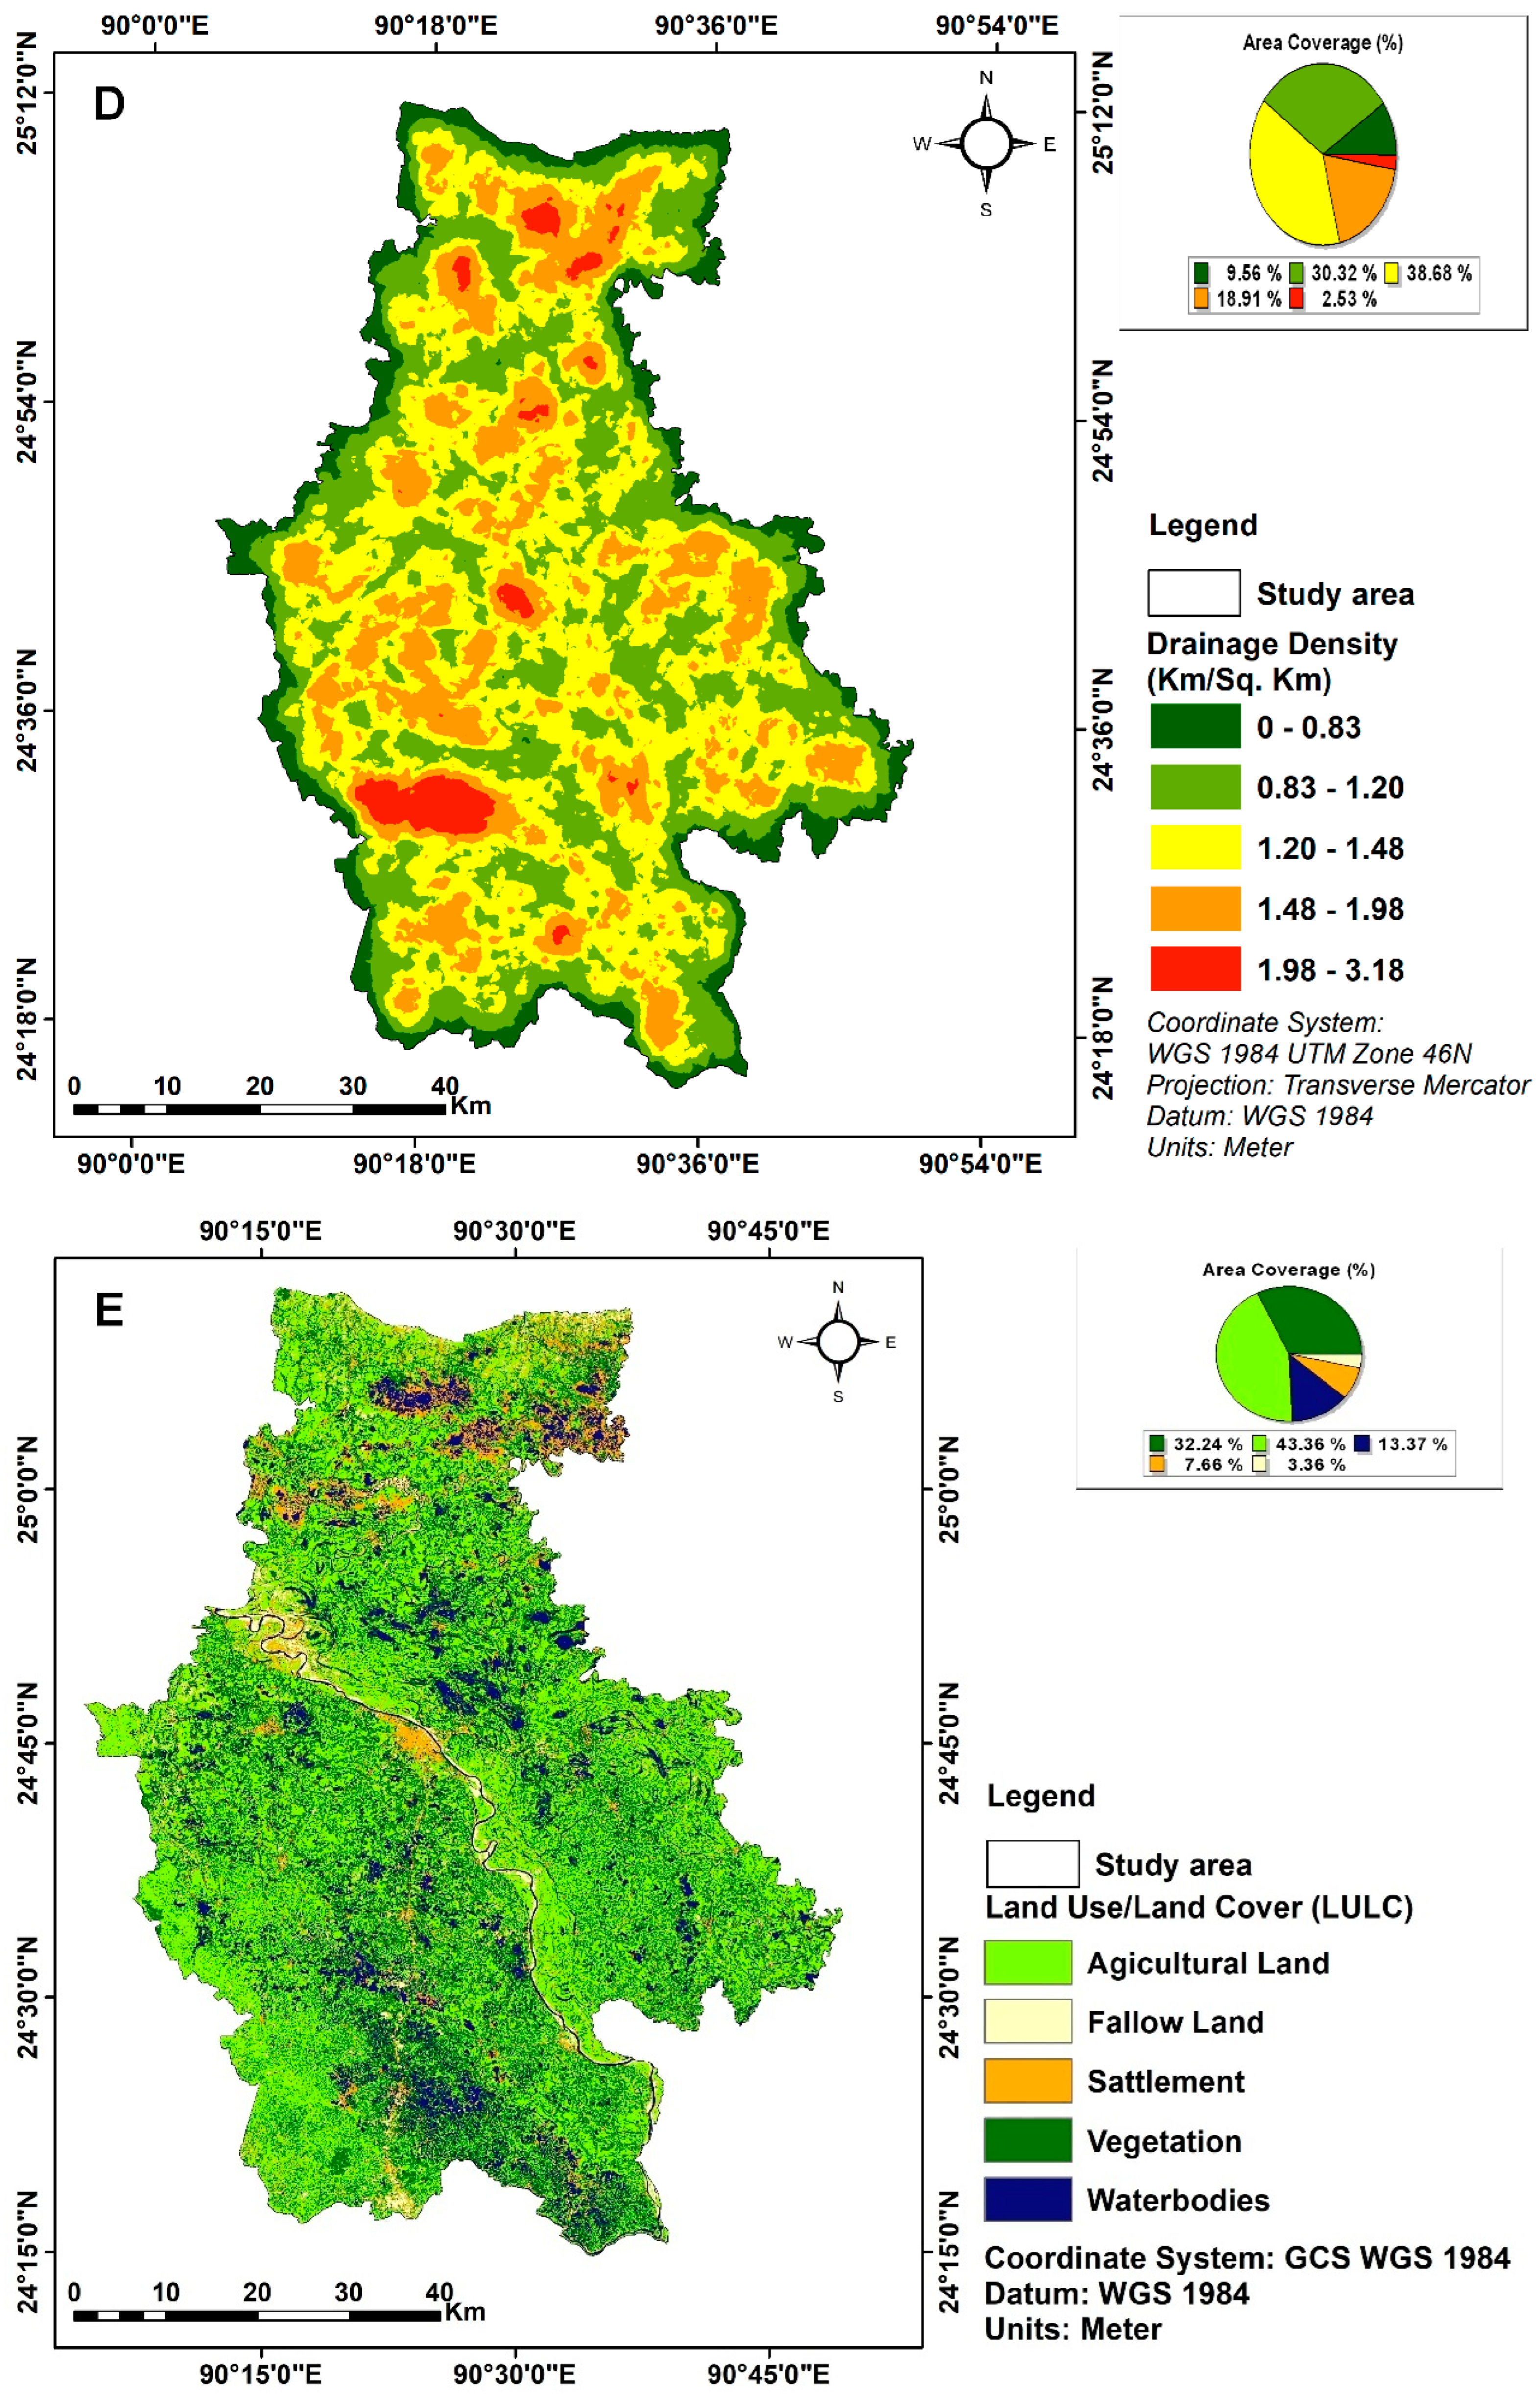
3.1.4. Drainage Density
3.1.5. Land Use/Land Cover
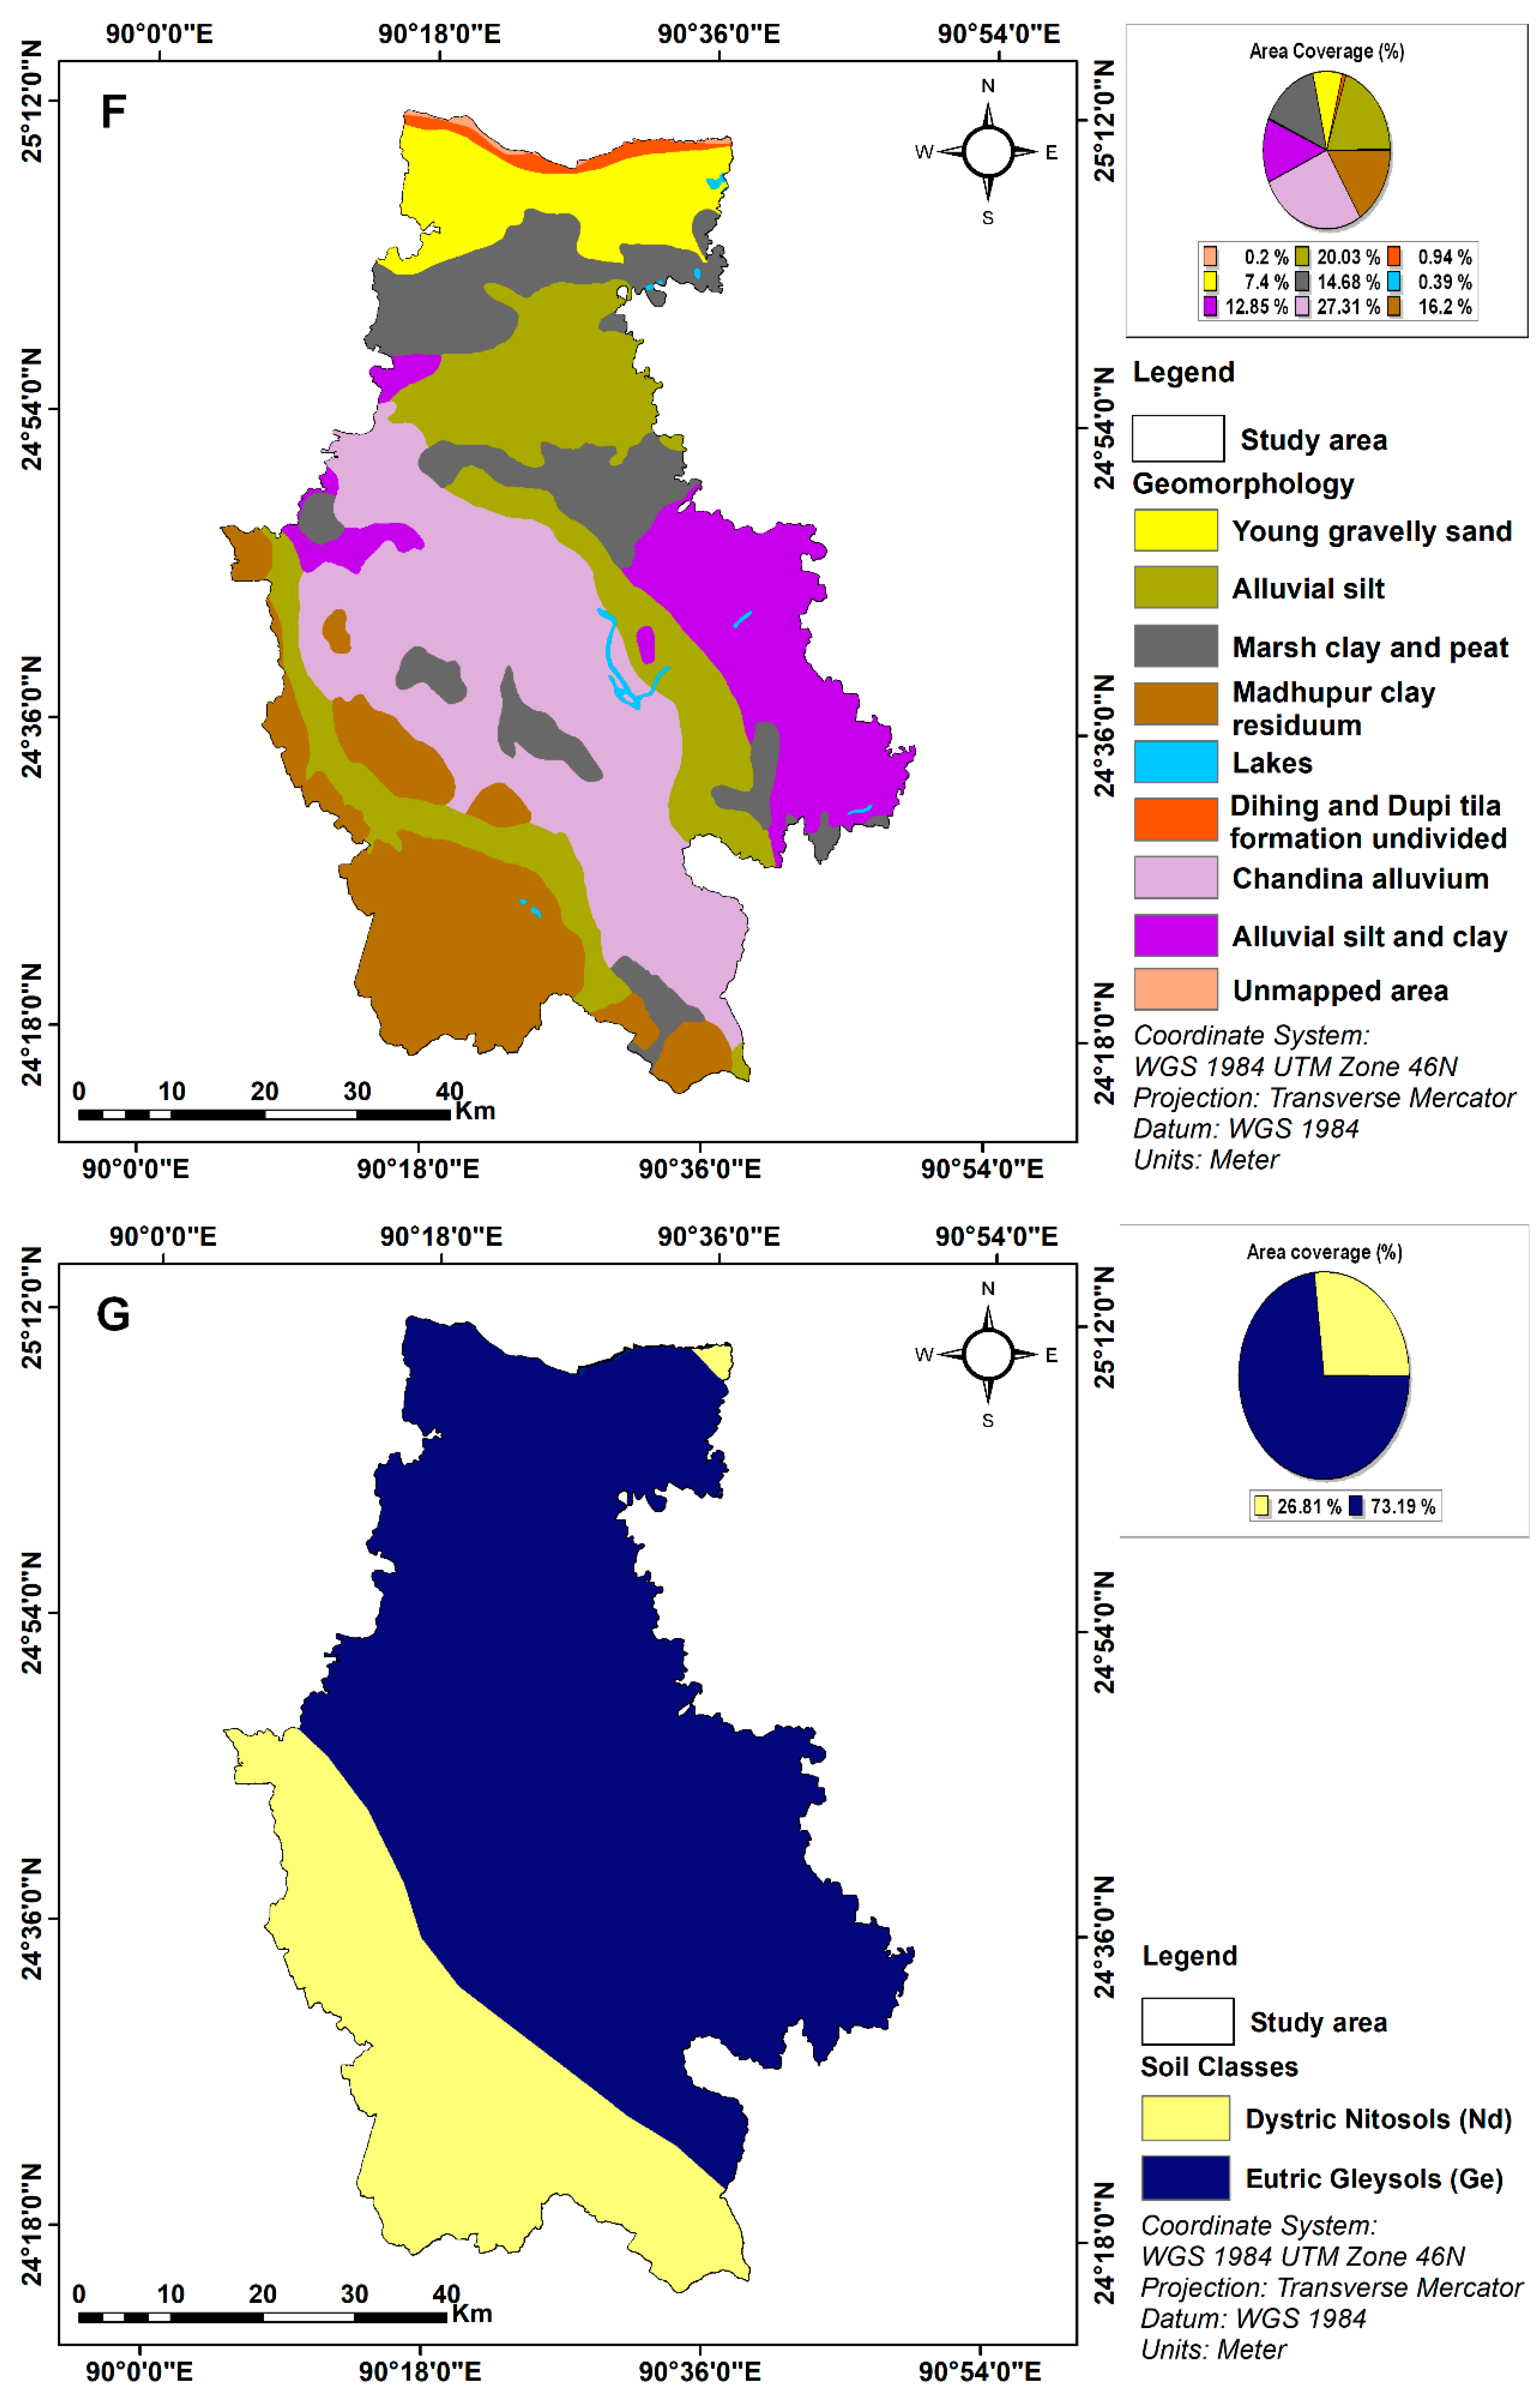
3.1.6. Geomorphology
3.1.7. Soil Texture
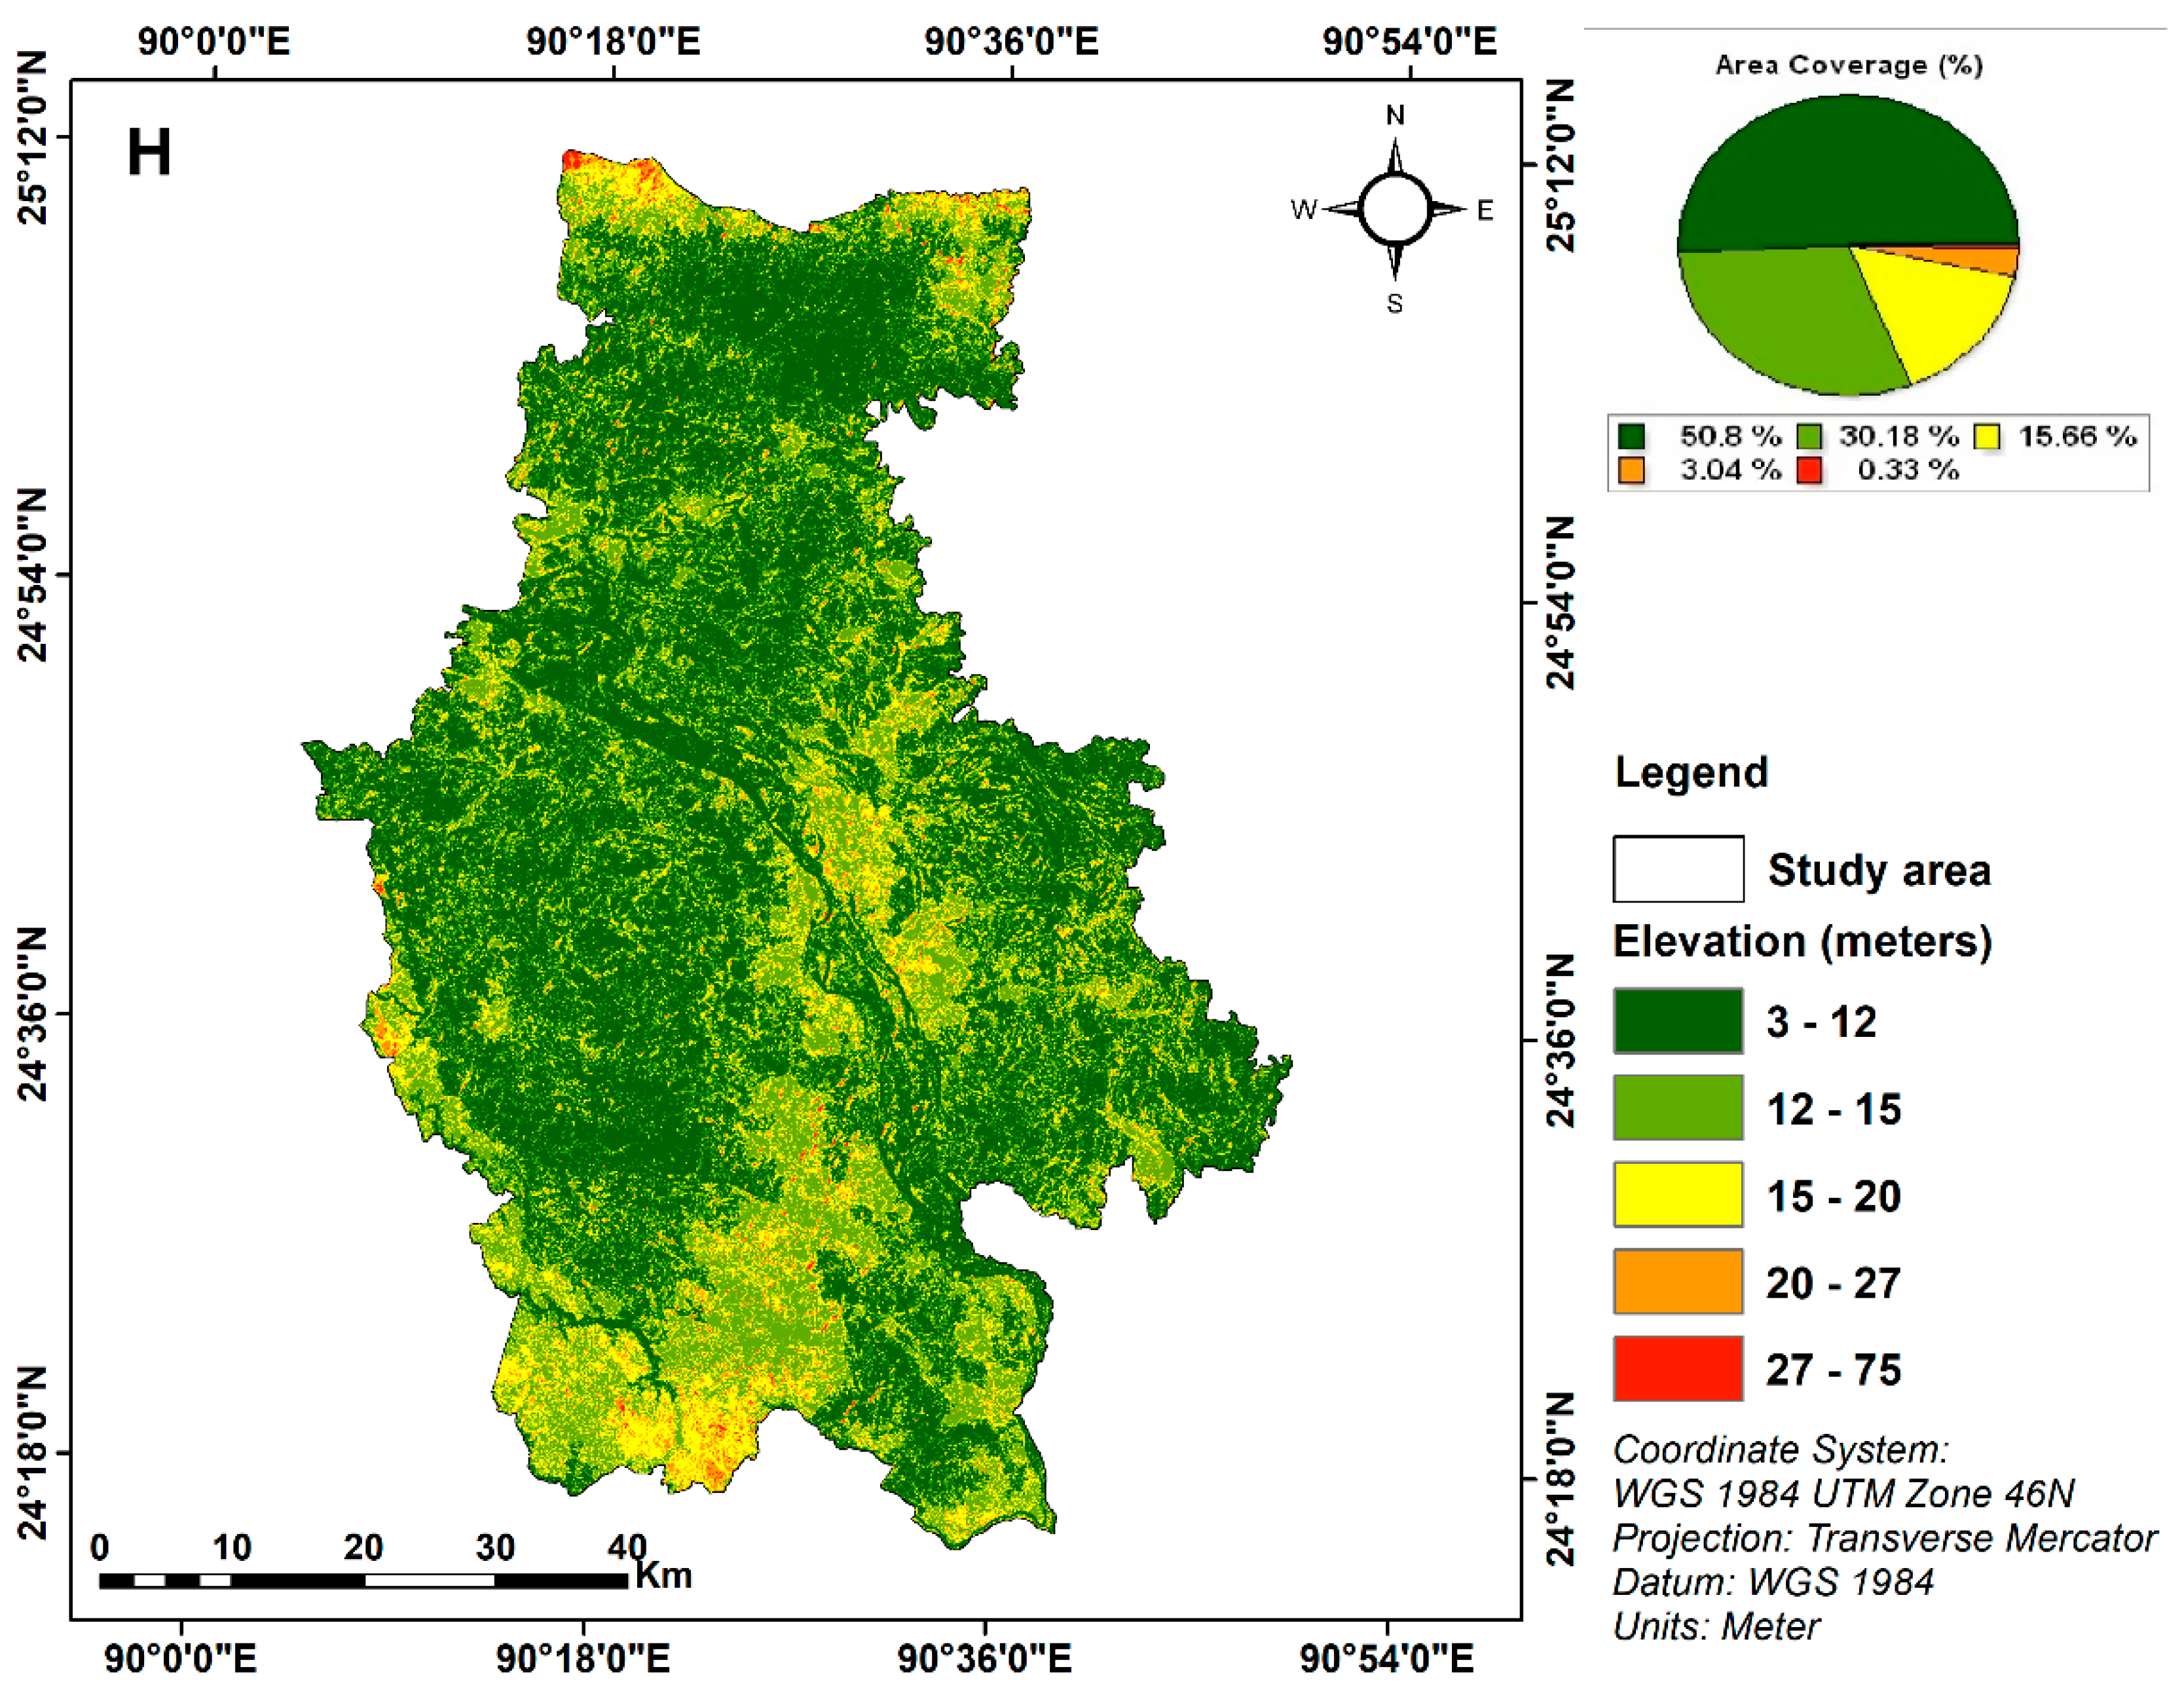
3.1.8. Elevation
3.2. Groundwater Potential Zone
3.3. Validation of Groundwater Potential Zone
4. Discussion
5. Conclusions
Author Contributions
Funding
Institutional Review Board Statement
Informed Consent Statement
Data Availability Statement
Acknowledgments
Conflicts of Interest
References
- Yamazaki, D.; Trigg, M. The dynamics of Earth’s surface water. Nature 2016, 540, 348–349. [Google Scholar] [CrossRef] [Green Version]
- Al-Manmi, D.A.M.; Rauf, L.F. Groundwater potential mapping using remote sensing and GIS-based, in Halabja City, Kurdi-stan, Iraq. Arab. J. Geosci. 2016, 9, 357. [Google Scholar] [CrossRef]
- Manap, M.A.; Nampak, H.; Pradhan, B.; Lee, S.; Sulaiman, W.N.A.; Ramli, M.F. Application of probabilistic-based frequency ratio model in groundwater potential mapping using remote sensing data and GIS. Arab. J. Geosci. 2012, 7, 711–724. [Google Scholar] [CrossRef]
- Basunia, Z.A.; Hossain, M.A.; Sayed, A.; Ali, M.; Rahman, G.M.A. Evaluation of ground water resources in Mymensingh Sadar Upazilla, Bangladesh. Asian J. Agric. Ext. Econ. Soc. 2015, 7, 1–10. [Google Scholar] [CrossRef]
- Fildes, S.G.; Clark, I.F.; Somaratne, N.M.; Ashman, G. Mapping groundwater potential zones using remote sensing and geo-graphical information systems in a fractured rock setting, Southern Flinders Ranges, South Australia. J. Earth Syst. Sci. 2020, 129, 1–25. [Google Scholar] [CrossRef]
- Hasan, M.R.; Mostafa, M.G.; Rahman, N.; Islam, M.S.; Islam, M.M. Groundwater depletion and its sustainable management in barind tract of Bangladesh. Res. J. Environ. Sci. 2018, 12, 247–255. [Google Scholar]
- Mojid, M.A.; Parvez, M.F.; Mainuddin, M.; Hodgson, G. Water table trend—A sustainability status of groundwater development in North-West Bangladesh. Water 2019, 11, 1182. [Google Scholar] [CrossRef] [Green Version]
- Rahman, M.; Mahbub, A. Groundwater Depletion with Expansion of Irrigation in Barind Tract: A Case Study of Tanore Upazila. J. Water Resour. Prot. 2012, 4, 567–575. [Google Scholar] [CrossRef] [Green Version]
- Ahammed, S.; Chung, E.-S.; Shahid, S. Parametric assessment of pre-monsoon agricultural water scarcity in Bangladesh. Sustainability 2018, 10, 819. [Google Scholar] [CrossRef] [Green Version]
- Yin, S.; Xiao, Y.; Han, P.; Hao, Q.; Gu, X.; Men, B.; Huang, L. Investigation of groundwater contamination and health implications in a typical Semiarid Basin of North China. Water 2020, 12, 1137. [Google Scholar] [CrossRef] [Green Version]
- Islam, B.; Firoz, A.B.M.; Foglia, L.; Marandi, A.; Khan, A.R.; Schüth, C.; Ribbe, L. A regional groundwater-flow model for sustainable groundwater-resource management in the south Asian megacity of Dhaka, Bangladesh. Hydrogeol. J. 2017, 25, 617–637. [Google Scholar] [CrossRef]
- Akhter, S.; Sharmin, A.; Islam, T.; Ullah, M. Climatic variability on groundwater recharge of Mymensingh district in Bangladesh. Progress. Agric. 2019, 30, 104–112. [Google Scholar] [CrossRef] [Green Version]
- Mardy, T.; Uddin, M.N.; Sarker, A.; Roy, D.; Dunn, E.S. Assessing coping strategies in response to drought: A micro level study in the North-West region of Bangladesh. Climate 2018, 6, 23. [Google Scholar] [CrossRef] [Green Version]
- Pourghasemi, H.R.; Beheshtirad, M. Assessment of a data-driven evidential belief function model and GIS for groundwater potential mapping in the Koohrang Watershed, Iran. Geocarto Int. 2015, 30, 662–685. [Google Scholar] [CrossRef]
- Chowdhury, A.; Jha, M.K.; Chowdary, V.M.; Mal, B.C. Integrated remote sensing and GIS-based approach for assessing groundwater potential in West Medinipur district, West Bengal, India. Int. J. Remote Sens. 2009, 30, 231–250. [Google Scholar] [CrossRef]
- Ozdemir, A. GIS-based groundwater spring potential mapping in the Sultan Mountains (Konya, Turkey) using frequency ratio, weights of evidence and logistic regression methods and their comparison. J. Hydrol. 2011, 411, 290–308. [Google Scholar] [CrossRef]
- Lee, S.; Kim, Y.S.; Oh, H.J. Application of a weights-of-evidence method and GIS to regional groundwater productivity po-tential mapping. J. Environ. Manag. 2012, 96, 91–105. [Google Scholar] [CrossRef] [PubMed]
- Chenini, I.; Mammou, A.B. Groundwater recharge study in arid region: An approach using GIS techniques and numerical modeling. Comput. Geosci. 2010, 36, 801–817. [Google Scholar] [CrossRef]
- Razandi, Y.; Pourghasemi, H.R.; Neisani, N.S.; Rahmati, O. Application of analytical hierarchy process, frequency ratio, and certainty factor models for groundwater potential mapping using GIS. Earth Sci. Inform. 2015, 8, 867–883. [Google Scholar] [CrossRef]
- Naghibi, S.A.; Pourghasemi, H.R.; Pourtaghi, Z.S.; Rezaei, A. Groundwater qanat potential mapping using frequency ratio and Shannon’s entropy models in the Moghan watershed, Iran. Earth Sci. Inform. 2015, 8, 171–186. [Google Scholar] [CrossRef]
- Rahmati, O.; Pourghasemi, H.R.; Melesse, A.M. Application of GIS-based data driven random forest and maximum entropy models for groundwater potential mapping: A case study at Mehran Region, Iran. CATENA 2016, 137, 360–372. [Google Scholar] [CrossRef]
- Shamsudduha, M.; Joseph, G.; Haque, S.S.; Khan, M.R.; Zahid, A.; Ahmed, K.M.U. Multi-hazard groundwater risks to water supply from shallow depths: Challenges to achieving the sustainable development goals in Bangladesh. Expos. Health 2020, 12, 657–670. [Google Scholar] [CrossRef] [Green Version]
- Saranya, T.; Saravanan, S. Groundwater potential zone mapping using analytical hierarchy process (AHP) and GIS for Kancheepuram District, Tamilnadu, India. Model. Earth Syst. Environ. 2020, 6, 1105–1122. [Google Scholar] [CrossRef]
- Forkuor, G.; Pavelic, P.; Asare, E.; Obuobie, E. Modelling potential areas of groundwater development for agriculture in northern Ghana using GIS/RS. Hydrol. Sci. J. 2013, 58, 437–451. [Google Scholar] [CrossRef] [Green Version]
- Luo, D.; Wen, X.; Zhang, H.; Xu, J.; Zhang, R. An improved FAHP based methodology for groundwater potential zones in Longchuan River basin, Yunnan Province, China. Earth Sci. Inform. 2020, 13, 847–857. [Google Scholar] [CrossRef]
- Allafta, H.; Opp, C.; Patra, S. Identification of groundwater potential zones using remote sensing and GIS techniques: A case study of the Shatt Al-Arab Basin. Remote Sens. 2021, 13, 112. [Google Scholar] [CrossRef]
- Reddy, Y.V.K.; Lakshmi, S.V. Identification of groundwater potential zones using GIS and remote sensing. Water 2018, 119, 3195–3210. [Google Scholar]
- Abuzied, S.M.; Alrefaee, H.A. Mapping of groundwater prospective zones integrating remote sensing, geographic information systems and geophysical techniques in El-Qaà Plain area, Egypt. Hydrogeol. J. 2017, 25, 2067–2088. [Google Scholar] [CrossRef]
- Machiwal, D.; Jha, M.K.; Mal, B.C. Assessment of groundwater potential in a semi-arid region of india using remote sensing, GIS and MCDM techniques. Water Resour. Manag. 2010, 25, 1359–1386. [Google Scholar] [CrossRef]
- Ahirwar, S.; Malik, M.S.; Ahirwar, R.; Shukla, J.P. Application of remote sensing and GIS for groundwater recharge potential zone mapping in upper betwa watershed. J. Geol. Soc. India 2020, 95, 308–314. [Google Scholar] [CrossRef]
- Jhariya, D.C.; Kumar, T.; Gobinath, M.; Diwan, P.; Kishore, N. Assessment of groundwater potential zone using remote sensing, GIS and multi criteria decision analysis techniques. J. Geol. Soc. India 2016, 88, 481–492. [Google Scholar] [CrossRef]
- Andualem, T.G.; Demeke, G.G. Groundwater potential assessment using GIS and remote sensing: A case study of Guna tana landscape, upper blue Nile Basin, Ethiopia. J. Hydrol. Reg. Stud. 2019, 24, 100610. [Google Scholar] [CrossRef]
- Fashae, O.A.; Tijani, M.N.; Talabi, A.O.; Adedeji, O.I. Delineation of groundwater potential zones in the crystalline basement terrain of SW-Nigeria: An integrated GIS and remote sensing approach. Appl. Water Sci. 2013, 4, 19–38. [Google Scholar] [CrossRef] [Green Version]
- Agarwal, E.; Agarwal, R.; Garg, R.D.; Garg, P.K. Delineation of groundwater potential zone: An AHP/ANP approach. J. Earth Syst. Sci. 2013, 122, 887–898. [Google Scholar] [CrossRef] [Green Version]
- Bera, A.; Mukhopadhyay, B.P.; Barua, S. Delineation of groundwater potential zones in Karha river basin, Maharashtra, India, using AHP and geospatial techniques. Arab. J. Geosci. 2020, 13, 693. [Google Scholar] [CrossRef]
- Agarwal, R.; Garg, P.K. Remote sensing and GIS based groundwater potential & recharge zones mapping using multi-criteria decision-making technique. Water Resour. Manag. 2016, 30, 243–260. [Google Scholar] [CrossRef]
- Bangladesh Bureau of Statistics (BBS). Population Census-2011. Preliminary Report. Bangladesh Bureau of Statistics 2011; Ministry of Planning: Dhaka, Bangladesh, 2011.
- Pradhan, N.; Das, P.; Gupta, N.; Shrestha, A. Sustainable management options for healthy rivers in South Asia: The case of Brahmaputra. Sustainability 2021, 13, 1087. [Google Scholar] [CrossRef]
- Akter, S.; Ali, R.M.E.; Karim, S.; Khatun, M.; Alam, M.F. Geomorphological, geological and engineering geological aspects for sustainable urban planning of Mymensingh City, Bangladesh. Open J. Geol. 2018, 8, 737–752. [Google Scholar] [CrossRef] [Green Version]
- Afrin, N.; Habiba, U.; Das, R.; Auyon, S.T.; Islam, M. Impact and vulnerability assessment on climate change of Jessore and Mymensingh districts in Bangladesh. Progress. Agric. 2018, 29, 320–335. [Google Scholar]
- Chakraborty, D.; Khatun, M.M.; Alam, I. Rainfall in Bangladesh. J. Eng. Res. Rep. 2021, 103–112. [Google Scholar] [CrossRef]
- Bangladesh Bureau of Statistics (BBS); Ministry of Planning. Bangladesh Population and Housing Census 2011, District Report: Mymensingh; Government of the People’s Republic of Bangladesh: Dhaka, Bangladesh, 2015; ISBN 978-948-33-8614-4.
- Hussain, M.; Bari, S.H.; Tarif, M.E.; Rahman, T.U.; Hoque, M.A. Temporal and spatial variation of groundwater level in Mymensingh district, Bangladesh. Int. J. Hydrol. Sci. Technol. 2016, 6, 188. [Google Scholar] [CrossRef]
- Rwanga, S.S.; Ndambuki, J.M. Accuracy assessment of land use/land cover classification using remote sensing and GIS. Int. J. Geosci. 2017, 8, 611–622. [Google Scholar] [CrossRef] [Green Version]
- Owolabi, S.T.; Madi, K.; Kalumba, A.M.; Orimoloye, I.R. A groundwater potential zone mapping approach for semi-arid environments using remote sensing (RS), geographic information system (GIS), and analytical hierarchical process (AHP) techniques: A case study of Buffalo catchment, Eastern Cape, South Africa. Arab. J. Geosci. 2020, 13, 1184. [Google Scholar] [CrossRef]
- Saaty, T.L. Decision making with the analytic hierarchy process. Int. J. Serv. Sci. 2008, 1, 83–98. [Google Scholar] [CrossRef] [Green Version]
- Das, B.; Pal, S.C.; Malik, S.; Chakrabortty, R. Modeling groundwater potential zones of Puruliya district, West Bengal, India using remote sensing and GIS techniques. Geol. Ecol. Landsc. 2018, 3, 223–237. [Google Scholar] [CrossRef] [Green Version]
- Atmaja, R.R.S.; Putra, D.P.E.; Setijadji, L.D. Delineation of groundwater potential zones using remote sensing, GIS, and AHP techniques in southern region of Banjarnegara, Central Java, Indonesia. In Proceedings of the Sixth Geoinformation Science Symposium, Yogyakarta, Indonesia, 26–27 August 2019; p. 11311. [Google Scholar] [CrossRef] [Green Version]
- Tolche, A.D. Groundwater potential mapping using geospatial techniques: A case study of Dhungeta-Ramis sub-basin, Ethiopia. Geol. Ecol. Landsc. 2020, 5, 65–80. [Google Scholar] [CrossRef]
- Saaty, T. The Analytic Hierarchy Process; McGraw-Hill: New York, NY, USA, 1980. [Google Scholar]
- Saaty, T.L. How to make a decision: The analytic hierarchy process. Eur. J. Operat. Res. 1990, 48, 9–26. [Google Scholar] [CrossRef]
- Nowreen, S.; Newton, I.H.; Zzaman, R.U.; Islam, A.K.M.S.; Islam, G.M.T.; Alam, S. Development of potential map for groundwater abstraction in the northwest region of Bangladesh using RS-GIS-based weighted overlay analysis and water-table-fluctuation technique. Environ. Monit. Assess. 2021, 193, 24. [Google Scholar] [CrossRef]
- Basavarajappa, H.T.; Dinakar, S.; Manjunatha, M.C. Validation of derived groundwater potential zones (gwpz) using geo-informatics and actual yield from well points in parts of upper cauvery basin of mysuru and chamarajanagara districts, karntaka, India. Int. J. Civil Eng. Technol. 2016, 7, 141–161. [Google Scholar]
- Jensen, J.R. Introductory Digital Image Processing: A Remote Sensing Pers-Pectize, 2nd ed.; Prentice Hall Inc.: Upper Saddle River, NJ, USA, 1996. [Google Scholar]
- Raju, R.S.; Raju, G.S.; Rajasekhar, M. Identification of groundwater potential zones in Mandavi River basin, Andhra Pradesh, India using remote sensing, GIS and MIF techniques. HydroResearch 2019, 2, 1–11. [Google Scholar] [CrossRef]
- Usman, M.; Liedl, R.; Shahid, M.A.; Abbas, A. Land use/land cover classification and its change detection using multi-temporal MODIS NDVI data. J. Geogr. Sci. 2015, 25, 1479–1506. [Google Scholar] [CrossRef]
- Tam, V.T.; De Smedt, F.; Batelaan, O.; Dassargues, A.; Smedt, F. Study on the relationship between lineaments and borehole specific capacity in a fractured and karstified limestone area in Vietnam. Hydrogeol. J. 2004, 12, 662–673. [Google Scholar] [CrossRef] [Green Version]
- Todd, D.K.; Mays, L.W. Groundwater Hydrology, 3rd ed.; John Wiley & Sons: Hoboken, NJ, USA, 2013. [Google Scholar]
- Castillo, J.L.U.; Leal, J.A.R.; Cruz, D.A.M.; Martínez, A.C.; Celestino, A.E.M. Identification of the dominant factors in groundwater recharge process, using multivariate statistical approaches in a semi-arid region. Sustainability 2021, 13, 11543. [Google Scholar] [CrossRef]
- Masoud, A.M.; Pham, Q.B.; Alezabawy, A.K.; Abu El-Magd, S.A. Efficiency of geospatial technology and multi-criteria decision analysis for groundwater potential mapping in a semi-arid region. Water 2022, 14, 882. [Google Scholar] [CrossRef]
- Ahmed, R.; Sajjad, H. Analyzing factors of groundwater potential and its relationship with population in the Lower Barpani Watershed, Assam, India. Nat. Resour. Res. 2018, 27, 503–515. [Google Scholar] [CrossRef]
- Rajaveni, S.P.; Brindha, K.; Elango, L. Geological and geomorphological controls on groundwater occurrence in a hard rock region. Appl. Water Sci. 2017, 7, 1377–1389. [Google Scholar] [CrossRef] [Green Version]
- Lee, B.; Hamm, S.-Y.; Jang, S.; Cheong, J.-Y.; Kim, G.-B. Relationship between groundwater and climate change in South Korea. Geosci. J. 2013, 18, 209–218. [Google Scholar] [CrossRef]
- Kumar, V.A.; Mondal, N.C.; Ahmed, S. Identification of groundwater potential zones using RS, GIS and AHP techniques: A case study in a part of Deccan Volcanic Province (DVP), Maharashtra, India. J. Indian Soc. Remote Sens. 2020, 48, 497–511. [Google Scholar] [CrossRef]
- Landis, J.R.; Koch, G.G. A one-way components of variance model for categorical data. Biometrics 1977, 33, 671–679. [Google Scholar] [CrossRef]
- Inglezakis, V.; Poulopoulos, S.; Arkhangelsky, E.; Zorpas, A.; Menegaki, A. Chapter 3—Aquatic environment. In Environment and Development; Stavros, G., Poulopoulos, S.G., Vassilis, J.I., Eds.; Elsevier: Amsterdam, The Netherlands, 2016; pp. 137–212. [Google Scholar] [CrossRef]
- Salam, M.A.; Kabir, M.M.; Yee, L.F.; Rak, A.A.E.; Khan, M.S. Water quality assessment of Perak River, Malaysia. Pollution 2019, 5, 637–648. [Google Scholar] [CrossRef]
- Hasan, F.; Alam, N.E.; Salam, M.; Rahman, H.; Paul, S.; Rak, A.; Ambade, B.; Islam, A.T. Health risk and water quality assessment of surface water in an urban river of Bangladesh. Sustainability 2021, 13, 6832. [Google Scholar] [CrossRef]
- Salam, M.A.; Paul, S.C.; Zain, R.A.M.M.; Bhowmik, S.; Nath, M.R.; Siddiqua, S.A.; Das Aka, T.; Iqbal, M.A.; Kadir, W.R.; Ahamad, R.B.; et al. Trace metals contamination potential and health risk assessment of commonly consumed fish of Perak River, Malaysia. PLoS ONE 2020, 15, e0241320. [Google Scholar] [CrossRef] [PubMed]
- Wada, Y.; Van Beek, L.P.H.; Van Kempen, C.M.; Reckman, J.W.T.M.; Vasak, S.; Bierkens, M.F.P. Global depletion of groundwater resources. Geophys. Res. Lett. 2010, 37, L20402. [Google Scholar] [CrossRef] [Green Version]
- Guerrero-Morales, J.; Fonseca, C.; Goméz-Albores, M.; Sampedro-Rosas, M.; Silva-Gómez, S. Proportional variation of potential groundwater recharge as a result of climate change and land-use: A study case in Mexico. Land 2020, 9, 364. [Google Scholar] [CrossRef]
- Karlović, I.; Marković, T.; Vujnović, T. Groundwater recharge assessment using multi component analysis: Case study at the NW edge of the Varaždin Alluvial Aquifer, Croatia. Water 2022, 14, 42. [Google Scholar] [CrossRef]
- Da Costa, A.; De Salis, H.; Viana, J.; Pacheco, F.L. Groundwater recharge potential for sustainable water use in urban areas of the Jequitiba River Basin, Brazil. Sustainability 2019, 11, 2955. [Google Scholar] [CrossRef] [Green Version]
- Arulbalaji, P.; Padmalal, D.; Sreelash, K. GIS and AHP techniques based delineation of groundwater potential zones: A case study from Southern Western Ghats, India. Sci. Rep. 2019, 9, 2082. [Google Scholar] [CrossRef] [PubMed]
- Dar, T.; Rai, N.; Bhat, A. Delineation of potential groundwater recharge zones using analytical hierarchy process (AHP). Geol. Ecol. Landsc. 2020, 5, 292–307. [Google Scholar] [CrossRef] [Green Version]
- Qureshi, A.S.; Ahmed, J.; Krupnik, T.J. Groundwater Management in Bangladesh: An Analysis of Problems and Opportunities; Research Report No. 2; Cereal Systems Initiative for South Asia Mechanization, and Irrigation (CSISA-MI): Dhaka, Bangladesh, 2015. [Google Scholar] [CrossRef]
- Aziz, N.; Nilufar, F. Effects of growth on urban morphology and land use pattern in mymensingh: A historic town of Bangladesh. Nakhara J. Environ. Des. Plan. 2019, 16, 53–68. [Google Scholar] [CrossRef]
- Ifediegwu, S.I. Assessment of groundwater potential zones using GIS and AHP techniques: A case study of the Lafia district, Nasarawa State, Nigeria. Appl. Water Sci. 2022, 12, 10. [Google Scholar] [CrossRef]
- Talukdar, S.; Mallick, J.; Sarkar, S.K.; Roy, S.K.; Islam, A.R.M.T.; Praveen, B.; Naikoo, M.W.; Rahman, A.; Sobnam, M. Novel hybrid models to enhance the efficiency of groundwater potentiality model. Appl. Water Sci. 2022, 12, 62. [Google Scholar] [CrossRef]
- Subramani, T.; Santhi, D. Groundwater potential and recharge zone mapping for Namakkal Town using RS & GIS. Int. J. Eng. Technol. 2018, 7, 155. [Google Scholar] [CrossRef] [Green Version]
- Jahan, C.S.; Rahaman, F.; Arefin, R.; Ali, S.; Mazumder, Q.H. Delineation of groundwater potential zones of Atrai–Sib River basin in north-west Bangladesh using remote sensing and GIS techniques. Sustain. Water Resour. Manag. 2018, 5, 689–702. [Google Scholar] [CrossRef]
- Arefin, R. Groundwater potential zone identification using an analytic hierarchy process in Dhaka City, Bangladesh. Environ. Earth Sci. 2020, 79, 268. [Google Scholar] [CrossRef]
- Rana, M.M.S.P.; Hossain, M.A.; Nasher, N.M.R. Identification of groundwater potential zone using geospatial techniques of agriculture dominated area in Dinajpur district, Bangladesh. Environ. Chall. 2022, 7, 100475. [Google Scholar] [CrossRef]
- Babu, M.A.H.; Islam, M.R.; Farzana, F.; Uddin, M.J.; Islam, M.S. Application of GIS and remote sensing for identification of groundwater potential zone in the Hilly Terrain of Bangladesh. Grassroots J. Nat. Resour. 2020, 3, 16–27. [Google Scholar] [CrossRef]
- Ahmed, N.; Hoque, M.A.-A.; Pradhan, B.; Arabameri, A. Spatio-temporal assessment of groundwater potential zone in the drought-prone area of Bangladesh using GIS-based bivariate models. Nat. Resour. Res. 2021, 30, 3315–3337. [Google Scholar] [CrossRef]


| Data Type | Source | Output Layer |
|---|---|---|
| DEM (13 June 2019) | ASTER Global Digital Elevation Model V3, NASA | Drainage density, slope, elevation map |
| Landsat 8 (27 December 2020) | USGS | Land use/land cover, lineament density map |
| Daily Rainfall Data (Year 2020) | Bangladesh Water Development Board (BWDB) | Annual rainfall map |
| Geomorphology (2001) | Geological Survey of Bangladesh (GSB) | Geomorphological map |
| Well Yield & Depth Data (year 2019–2020) | Bangladesh Water Development Board (BWDB) & Water Resources Planning Organization (WARPO) | Used to validate the groundwater potential zones map |
| Parameters | (1) | (2) | (3) | (4) | (5) | Total | Correct Sampled |
|---|---|---|---|---|---|---|---|
| (1) Agricultural Land | 14 | 0 | 0 | 0 | 0 | 14 | 14 |
| (2) Fallow Land | 0 | 11 | 0 | 0 | 0 | 11 | 11 |
| (3) Settlement | 0 | 0 | 10 | 0 | 0 | 10 | 10 |
| (4) Vegetation | 0 | 0 | 1 | 17 | 0 | 18 | 17 |
| (5) Waterbodies | 0 | 0 | 0 | 13 | 1 | 14 | 1 |
| Total | 14 | 11 | 11 | 30 | 1 | 67 | 53 |
| Factors | (1) | (2) | (3) | (4) | (5) | (6) | (7) | (8) |
|---|---|---|---|---|---|---|---|---|
| (1) Lineament Density | 1 | 2 | 4 | 5 | 6 | 7 | 8 | 9 |
| (2) Slope | 0.50 | 1 | 2 | 4 | 5 | 6 | 7 | 8 |
| (3) Rainfall | 0.25 | 0.50 | 1 | 2 | 4 | 5 | 6 | 7 |
| (4) Drainage Density | 0.20 | 0.25 | 0.50 | 1 | 2 | 4 | 5 | 6 |
| (5) LULC | 0.17 | 0.2 | 0.25 | 0.50 | 1 | 2 | 4 | 5 |
| (6) Geomorphology | 0.14 | 0.17 | 0.20 | 0.25 | 0.50 | 1 | 2 | 4 |
| (7) Soil | 0.13 | 0.14 | 0.17 | 0.20 | 0.25 | 0.50 | 1 | 2 |
| (8) Elevation | 0.11 | 0.13 | 0.14 | 0.17 | 0.20 | 0.25 | 0.50 | 1 |
| Total | 2.5 | 4.39 | 8.26 | 13.12 | 18.95 | 25.75 | 33.5 | 42 |
| Factors | (1) | (2) | (3) | (4) | (5) | (6) | (7) | (8) | Weightage | Weightage (%) |
|---|---|---|---|---|---|---|---|---|---|---|
| (1) Lineament Density | 0.4 | 0.456 | 0.484 | 0.381 | 0.317 | 0.272 | 0.239 | 0.214 | 0.345 | 34.53 |
| (2) Slope | 0.2 | 0.228 | 0.242 | 0.305 | 0.264 | 0.233 | 0.209 | 0.19 | 0.234 | 23.39 |
| (3) Rainfall | 0.1 | 0.114 | 0.121 | 0.152 | 0.211 | 0.194 | 0.179 | 0.167 | 0.155 | 15.48 |
| (4) Drainage Density | 0.08 | 0.057 | 0.061 | 0.076 | 0.106 | 0.155 | 0.149 | 0.143 | 0.103 | 10.33 |
| (5) LULC | 0.068 | 0.046 | 0.03 | 0.038 | 0.053 | 0.078 | 0.119 | 0.119 | 0.069 | 6.89 |
| (6) Geomorphology | 0.056 | 0.039 | 0.024 | 0.019 | 0.026 | 0.039 | 0.06 | 0.095 | 0.045 | 4.48 |
| (7) Soil | 0.052 | 0.032 | 0.021 | 0.015 | 0.013 | 0.019 | 0.03 | 0.048 | 0.029 | 2.87 |
| (8) Elevation | 0.044 | 0.03 | 0.017 | 0.013 | 0.011 | 0.01 | 0.015 | 0.024 | 0.02 | 2.03 |
| Total | 1 | 1 | 1 | 1 | 1 | 1 | 1 | 1 | 1 | 100 |
| Parameters | Normalized Principal Eigen Vectors |
|---|---|
| Lineament density | 8.948 |
| Slope | 9.021 |
| Rainfall | 8.915 |
| Drainage density | 8.622 |
| LULC | 8.293 |
| Geomorphology | 8.086 |
| Soil | 8.112 |
| Elevation | 8.221 |
| Λmax | 8.527 |
| n | 1 | 2 | 3 | 4 | 5 | 6 | 7 | 8 | 9 |
|---|---|---|---|---|---|---|---|---|---|
| RI | 0 | 0 | 0.58 | 0.92 | 1.12 | 1.24 | 1.32 | 1.41 | 1.45 |
| Influence/ Weightage (%) | Class | GWSP | Ratings | Area Coverage (km2) |
|---|---|---|---|---|
| Lineament Density (km/km2) | ||||
| 34.53 | No lineament (0–0.28) | Very low | 1 | 916.714 |
| Fractures, short lineament (0.28–0.49) | Low | 2 | 1317.58 | |
| Local faults, frequent fractures (0.49–0.70) | Moderate | 3 | 1113.2 | |
| Interconnected local faults, frequent faults (0.70–0.96) | High | 4 | 741.212 | |
| Major long faults (0.96–1.78) | Very high | 5 | 263.522 | |
| Slope (Degree) | ||||
| 23.39 | 0–1° | Very high | 5 | 1707.94 |
| 1–2° | High | 4 | 993.931 | |
| 2–3° | Moderate | 3 | 651.151 | |
| 3–5° | Low | 2 | 688.963 | |
| >5° | Very low | 1 | 295.438 | |
| Rainfall (mm/year) | ||||
| 15.48 | 1964–2106 | Very low | 1 | 759.143 |
| 2106–2207 | Low | 2 | 1134.4 | |
| 2208–2315 | Moderate | 3 | 992.733 | |
| 2316–2442 | High | 4 | 1115.09 | |
| 2443–2634 | Very high | 5 | 351.268 | |
| Drainage Density (km/km2) | ||||
| 10.33 | Very low density (0–0.83) | Very high | 5 | 416.202 |
| Low density (0.83–1.20) | High | 4 | 1319.48 | |
| Moderate density (1.20–1.48) | Moderate | 3 | 1683.34 | |
| High density (1.48–1.98) | Low | 2 | 823.131 | |
| Very high density (1.98–3.18) | Very low | 1 | 110.13 | |
| LULC | ||||
| 6.89 | Waterbodies | Very high | 5 | 582.07 |
| Vegetation | Moderate | 3 | 1403.19 | |
| Agricultural land | Very high | 5 | 1887.27 | |
| Fallow land | Low | 2 | 146.276 | |
| Settlement | Very low | 1 | 333.469 | |
| Geology | ||||
| 4.49 | Young gravelly sand | Very high | 5 | 322.001 |
| Marsh clay and peat | Very low | 1 | 639.124 | |
| Madhupur clay residuum | Low | 2 | 704.856 | |
| Lakes | Very high | 5 | 17.1666 | |
| Dihing and Dupi Tila formation undivided | Very low | 1 | 40.8996 | |
| Chandina alluvium | Very high | 5 | 1188.56 | |
| Alluvial silt and clay | Moderate | 3 | 559.128 | |
| Alluvial silt | High | 4 | 871.687 | |
| Unmapped area | Very low | 1 | 8.8065 | |
| Soil | ||||
| 2.87 | Eutric Gleysols | High | 4 | 3170.69 |
| Dystric Nitosols | Very high | 5 | 1167.25 | |
| Elevation (meters) | ||||
| 2.03 | 3–12 | Very high | 5 | 2210.89 |
| 12–15 | High | 4 | 1313.39 | |
| 15–20 | Moderate | 3 | 681.433 | |
| 20–27 | Low | 2 | 132.174 | |
| 27–75 | Very low | 1 | 14.4003 | |
| Area | Annual Rainfall (mm/year) | Area Coverage (%) |
|---|---|---|
| Western and south-western part | 1964–2106 | 17.44 |
| Central part | 2106–2207 | 26.06 |
| Northwestern and south-eastern part | 2208–2315 | 22.81 |
| Southeastern and north-western part | 2316–2442 | 25.62 |
| Northern and north-eastern part | 2443–2634 | 8.07 |
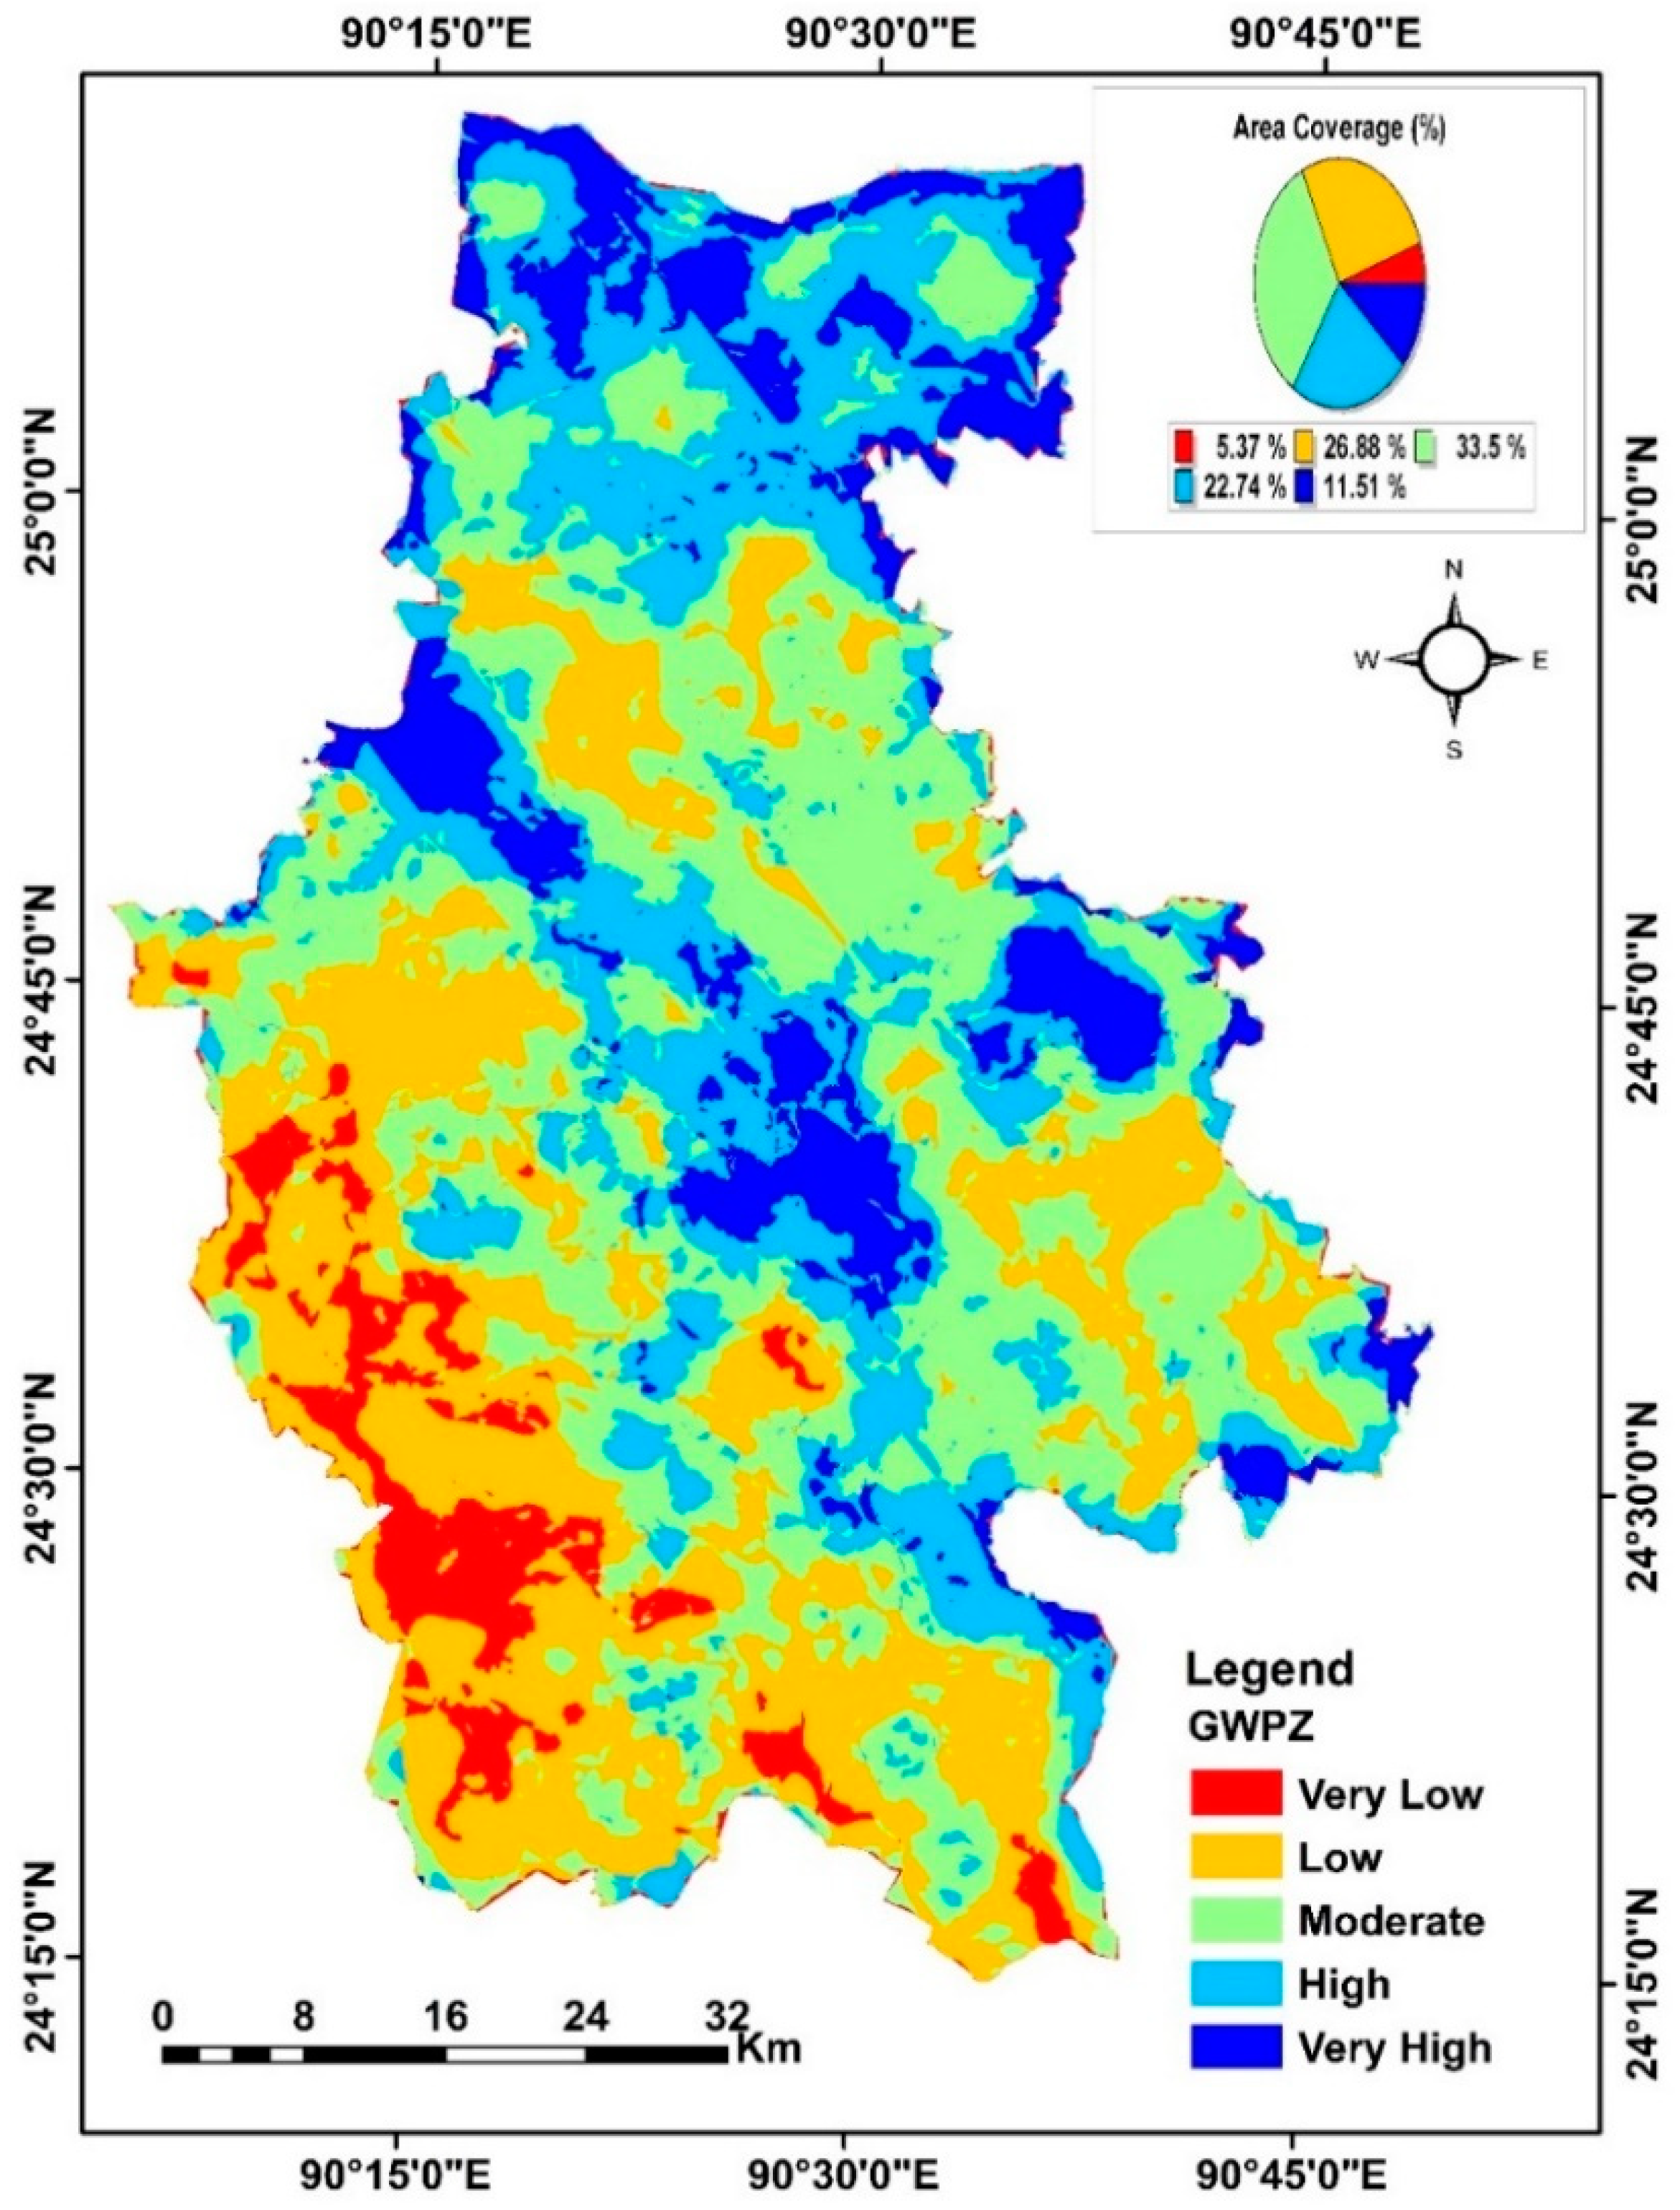
| GW Potentiality | Area Coverage (km2) | Area Coverage (%) |
|---|---|---|
| Very low | 235.17 | 5.37 |
| Low | 1176.84 | 26.88 |
| Moderate | 1466.46 | 33.50 |
| High | 995.58 | 22.74 |
| Very high | 504.09 | 11.51 |
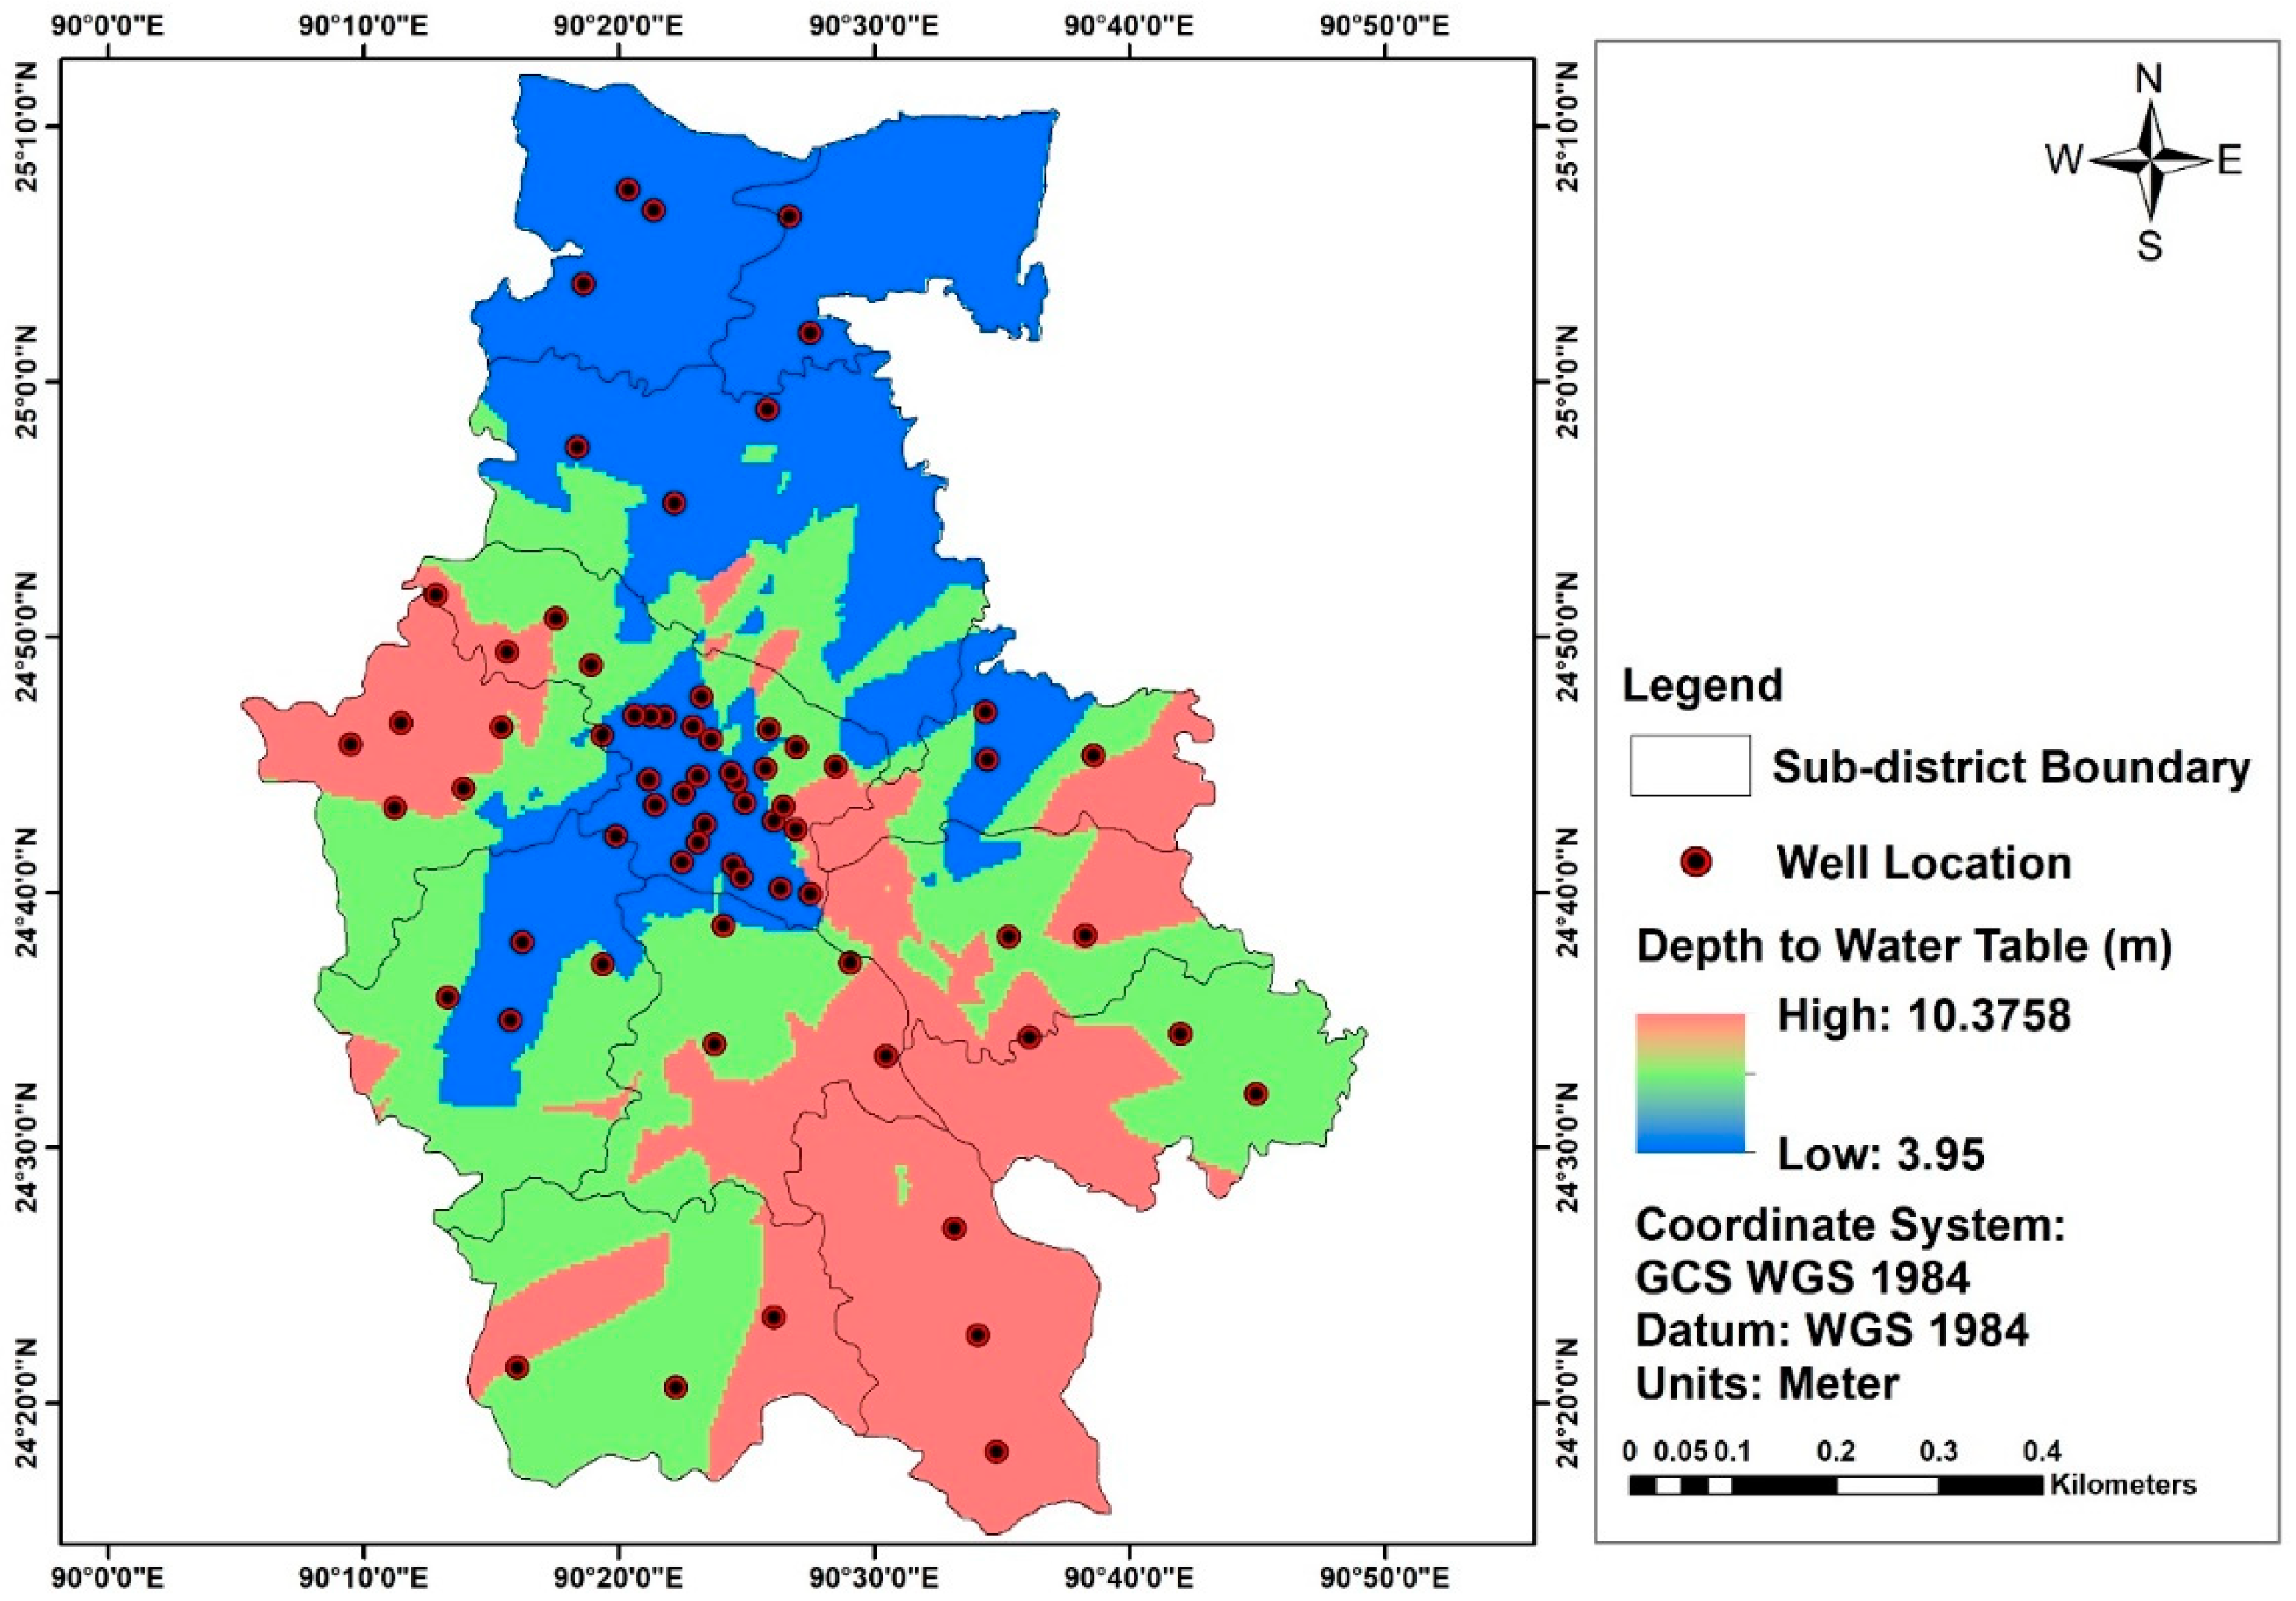
| Well Id | Latitude (DD) | Longitude (DD) | Yield (LPS) | Expected Yield Description | Actual Yield Description | Agreement between Expected and Actual Yield Description |
|---|---|---|---|---|---|---|
| GA6113004 | 24.450001 | 90.370003 | 28.39 | Very low to low | Low | Agree |
| GA6120008 | 24.610001 | 90.339996 | 28.39 | Very low to low | Low | Agree |
| GA6120018 | 24.584000 | 90.256000 | 28.39 | Very low to low | Low | Agree |
| GA6124003 | 25.044000 | 90.382000 | 25.21 | Low to moderate | Very low | Disagree |
| GA6152017 | 24.685000 | 90.378000 | 28.39 | Low to moderate | Low | Agree |
| GA6165005 | 24.853000 | 90.255000 | 37.86 | High to very high | High | Agree |
| GA6181006 | 24.977000 | 90.400000 | 37.86 | High to very high | High | Agree |
| GA6194016 | 24.555000 | 90.437000 | 28.39 | Low to moderate | Low | Agree |
| GWPZs | (1) | (2) | (3) | (4) | (5) | Total | Correct Sampled |
|---|---|---|---|---|---|---|---|
| (1) Very low | 10 | 2 | 1 | 0 | 0 | 13 | 10 |
| (2) Low | 0 | 11 | 1 | 0 | 0 | 12 | 11 |
| (3) Moderate | 1 | 1 | 8 | 0 | 0 | 10 | 8 |
| (4) High | 0 | 0 | 0 | 13 | 2 | 15 | 13 |
| (5) Very high | 0 | 0 | 0 | 1 | 17 | 18 | 17 |
| Total | 11 | 14 | 10 | 14 | 19 | 68 | 59 |
Publisher’s Note: MDPI stays neutral with regard to jurisdictional claims in published maps and institutional affiliations. |
© 2022 by the authors. Licensee MDPI, Basel, Switzerland. This article is an open access article distributed under the terms and conditions of the Creative Commons Attribution (CC BY) license (https://creativecommons.org/licenses/by/4.0/).
Share and Cite
Priya, U.; Iqbal, M.A.; Salam, M.A.; Nur-E-Alam, M.; Uddin, M.F.; Islam, A.R.M.T.; Sarkar, S.K.; Imran, S.I.; Rak, A.E. Sustainable Groundwater Potential Zoning with Integrating GIS, Remote Sensing, and AHP Model: A Case from North-Central Bangladesh. Sustainability 2022, 14, 5640. https://doi.org/10.3390/su14095640
Priya U, Iqbal MA, Salam MA, Nur-E-Alam M, Uddin MF, Islam ARMT, Sarkar SK, Imran SI, Rak AE. Sustainable Groundwater Potential Zoning with Integrating GIS, Remote Sensing, and AHP Model: A Case from North-Central Bangladesh. Sustainability. 2022; 14(9):5640. https://doi.org/10.3390/su14095640
Chicago/Turabian StylePriya, Ujjayini, Muhammad Anwar Iqbal, Mohammed Abdus Salam, Md. Nur-E-Alam, Mohammed Faruque Uddin, Abu Reza Md. Towfiqul Islam, Showmitra Kumar Sarkar, Saiful Islam Imran, and Aweng Eh Rak. 2022. "Sustainable Groundwater Potential Zoning with Integrating GIS, Remote Sensing, and AHP Model: A Case from North-Central Bangladesh" Sustainability 14, no. 9: 5640. https://doi.org/10.3390/su14095640
APA StylePriya, U., Iqbal, M. A., Salam, M. A., Nur-E-Alam, M., Uddin, M. F., Islam, A. R. M. T., Sarkar, S. K., Imran, S. I., & Rak, A. E. (2022). Sustainable Groundwater Potential Zoning with Integrating GIS, Remote Sensing, and AHP Model: A Case from North-Central Bangladesh. Sustainability, 14(9), 5640. https://doi.org/10.3390/su14095640