Article

Ammonium and Phosphate Recovery from Biogas Slurry: Multivariate Statistical Analysis Approach

1
Key Laboratory of Agro-Forestry Environmental Processes and Ecological Regulation of Hainan Province/Center for Eco-Environmental Restoration Engineering of Hainan Province/State Key Laboratory of Marine Resource Utilization in South China Sea/Key Laboratory for Environmental Toxicology of Haikou, College of Ecology and Environment, Hainan University, Haikou 570228, China
2
Department of Soil Science, Faculty of Agriculture, Lasbela University of Agriculture, Water and Marine Science, Uthal 90150, Pakistan
3
Department of Entomology, Faculty of Crop Protection, Sindh Agriculture University Tando Jam, Hyderabad 70060, Pakistan
4
Department of Horticulture, Faculty of Crop Production, Sindh Agriculture University Tando Jam, Hyderabad 70060, Pakistan
*
Author to whom correspondence should be addressed.
Sustainability 2022, 14(9), 5617; https://doi.org/10.3390/su14095617
Submission received: 29 March 2022 / Revised: 29 April 2022 / Accepted: 3 May 2022 / Published: 6 May 2022

Abstract

:
Livestock biogas slurry is an effluent containing nutrients such as ammonium and phosphate that are released by the industries. Therefore, recovery and reuse of ammonium and phosphorus is highly necessary. In recent years, many studies have been devoted to the use of different multivariate statistical analyses to investigate the interrelationship of one factor to another factor. The overall objective of this research study was to understand the significance of phosphate and ammonium recovery from biogas slurry using the multivariate statistical approach. This study was conducted using a range of salts that are commonly found in biogas slurry (ZnCl2, FeCl3, FeCl2, CuCl2, Na2CO3, and NaHCO3). Experiments with a biogas digester and aqueous solution were conducted at pH 9, with integration with NH4+, Mg2+, and PO43− molar ratios of 1.0, 1.2, and 1.8, respectively. The removal efficiency of ammonium and phosphate increased from 15.0% to 71.0% and 18.0% to 99.0%, respectively, by increasing the dose of respective ions K+, Zn2+, Fe3+, Fe2+, Cu2+, and CO32−. The elements were increased from 58.0 to 71.0 for HCO3, with the concentration increasing from 30 mg L−1 to 240 mg L−1. Principal component, regression, path analysis, and Pearson correlation analyses were used to investigate the relationships of phosphate and ammonium recovery under different biochar, pyrolysis temperature, element concentration and removal efficiencies. Multivariate statistical analysis was also used to comprehensively evaluate the biochar and struvite effects on recovery of ammonium and phosphate from biogas slurry. The results showed that combined study of multivariate statistics suggested that all the indicators positively or negatively affected each other. Pearson correlation was insignificant in many ionic concentrations, as all were more than the significant 0.05. The study concluded that temperature, biochar type, and varying levels of components, such as K+, Zn2+, Fe3+, Fe2+, Cu2+, CO32−, and HCO3, all had a substantial impact on P and NH4+ recovery. Temperature and varying amounts of metal salts enhanced the efficacy of ammonium and phosphate recovery. This research elucidated the methods by which biochar effectively reuses nitrogen and phosphate from biogas slurry, presenting a long-term agricultural solution.

1. Introduction

The growth of extensive husbandry has fueled the development of large-scale and medium-scale biogas facilities to cope with agricultural residues. Because of its high concentration of plant nutrients, such as nitrogen, phosphorous, potassium, and a variety of organic materials, biogas slurry is commonly utilized as an organic fertilizer. Traditional land usage, on the other hand, has a hard time using the biogas slurry completely. Because of its poor value-added qualities, biogas sewage, unlike solid fertilizers, is not suitable for long-distance shipment and usage [1]. Furthermore, too much biogas slurry irrigation can hinder agricultural development, pose major environmental dangers to freshwater, ground, and atmosphere, and even cause adverse effects [2]. The handling of methane sludge has become a major hurdle in China’s long-term animal breeding development. This difficulty may be solved by extracting and using the fertilizers in biogas slurry. Membrane filtration, struvite crystallization, plant uptake, and adsorbents are the most common techniques for recovering N and P from biogas slurry [3,4]. Membrane contamination and high processing costs are frequent problems in membrane technologies. Because of the lost crystals, crystallization inevitably causes subsequent scalability and clogging. Plant absorption is both ecologically benign and cost-effective, but it necessitates a large quantity of land. The adsorbent processing of biogas slurry, which is a simple and low-energy technique, can not only prevent nutrient pollution, but the adsorbents can also be employed as fertilizers for soil development [5]. P and NH4+ recovery is important in terms of environmental management because they promote algal blooms [6] and are found in a variety of wastewaters at varying amounts [7,8,9]. Struvite has around 12% N and 51.8% P. Phosphate-rich soils have a P2O5 value of more than 30%. As a result, a high level of P restoration in struvite adds a lot of value [10]. Struvite has high nitrogen and phosphorus content, with a nitrogen content of about 12% and a P2O5 content of 51.8% (P2O5 > 30% is considered to be phosphate-rich ore), so a large amount of phosphorus recovery products in particular (such as aluminum phosphate and iron phosphate), therefore struvite is particularly valued [7,8,9,10,11,12]. Accordingly, this shows that struvite has specific market potential in fertilizer application. The fast urbanization in China has led to waste production at a large volume from various sectors [13,14,15]. Struvite crystallization can reclaim phosphorus from waste streams. Struvite is a highly effective slow-release fertilizer; it has numerous advantages over traditional fertilizers. Struvite has several benefits over traditional fertilizers, i.e., it has minimal leaching levels and a delayed nutrient release [16,17,18]. It is suitable for meadows and backwoods where composts are applied just once like clockwork [19,20]; phosphorus does not hurt developing plants when applied in a solitary high portion [21]; and phosphorus is an option for crops that require magnesium, for example, sugar beet [22]. The method of recovering nitrogen and phosphorus elements in biogas slurry by struvite method is simple, and the reaction is rapid, which has a high nitrogen and phosphorus removal effect and has good economic and environmental benefits. Biochar is a solid substance with high carbon content obtained by pyrolysis carbonization of biomass under anoxic conditions [23]. The biochar adsorption has shown high accuracy of being uncomplicated to use, of cheap expense, with no subsequent contamination, and numerous supplies as a phosphate extraction technique [24]. At normal wastewater pH levels, reactive nitrogen occurs as NH4+ [25]. It is also a major pollutant in household grey water and urine [26,27]. Phosphorus can be found in wastewater as both powerful organic products and decomposed phosphate groups [28]. According to the findings of Luján Facundo [29], the recovery of P was greatest at high pH and optimal temperature. Other research has shown that phosphates may be recovered using biochar generated from metal-contaminated feedstock [30]. Many researchers have been interested in the removal of phosphate from wastewater. Several techniques, such as biological, chemical, and physical treatment procedures, have been investigated [31]. Although these methods yield great results, they are frequently costly and, like fast sand filtering, do not provide an easily recovered supply of phosphorus. Both biogas residue and slurry have a good impact on crop output and quality, as well as on maintaining and boosting soil fertility [32]. The commercialization of methane slurry is critical since it is a form of fertilizer that can be used in a variety of ways. The selection of an appropriate price for biogas slurry is a critical component of the inquiry to carry out and enable biogas slurry commercialization [33]. Biogas slurry produces a lot of P, which is a pollutant in the atmosphere [34]. Phosphorus is the mineral nutrient that is essential for all living organisms and is required for most creatures in a finite supply on earth; therefore, recovery of P from waste material for vital uses must be considered [35]. P is the most trace amounts element for cellulose increase in ecology. As a result, its removal from water is a critical step in reducing the amount of chemicals reaching the surface waters, limiting algae growth and water nutrient enrichment [36]. However, too much P in wastewater bodies, due to untreated sewage waste matter and agricultural run-off, causes an interruption in the food chain [37] and environmental problems such as eutrophication in lakes, rivers, and seas [38]. More than 2000 million tons of wastewater is produced each year in the rare earth industry, with NH3-N concentrations ranging from 300 to 5000 mg L−1, while the pollution emission standard for the rare earth industry requires a directly discharged concentration of less than 25 mg L−1 and an indirectly discharged concentration of less than 50 mg L−1. Because of the microbial degradation of organic nitrogen molecules contained in poultry manure, ammonia (NH3) is a colorless, water-soluble gas form. Because it lacks an ionic charge, it may be easily discharged as a gas into the environment. The generation of NH3 in litter or manure is affected by the pH, heat, humidity levels, and total nitrogen of the waste [39]. Improved efficient P retrieval solutions for both solid and liquid waste are needed [40]. There were two hypotheses of this research study. (1) It was hypothesized that struvite and biochar co-precipitation could be valuable to remove the phosphate and ammonium from biogas slurry to recover ammonium and phosphate as biochar-based nutrient enriched fertilizer; (2) It was hypothesized that multivariate statistical analysis is a useful tool to correlate the ammonium and phosphate recovered nutrients with quality indicators. Therefore, the main objectives of this study were to assess the recovery of phosphate and ammonium nitrate from biogas slurry effluent via struvite and biochar co-precipitation, and to find out the multivariate statistical techniques usefulness in determining the relationships of the recovered nutrient parameters each other. In this way, it is possible to obtain efficient use of the principal component, regression, path analysis, and Pearson correlation to determine the phosphate and ammonium recovery from biogas slurry contents. Such effects are analyzed via an SPSS and R software-based approach aiming at the correlation between two different regimes.

2. Methodology

2.1. Molar Ratio and pH Adjustment

In this study, artificial wastewater came from the Hainan University marine resource use laboratory in Haikou, China, which is located in the South China Sea. The experiment was conducted with an NH4+: Mg2+: PO43− mole fraction adjustment, but the pH was altered to 8.4–9.6 by adding 1 mol L−1 sodium hydroxide. To avoid NH3 emissions, the maximum pH for the duration of the experiment was set to nine [41]. Furthermore, for most waste streams, the pH for low NH4+: Mg2+: PO43− solubility was projected to be 9 [42,43]. At pH 9, the experiment was carried out using 1:1.2:1.8 ratios of NH4+, Mg2+, and PO43−. The solutions were agitated for 20 min and spun at 200 rpm. During the experiments, the pH level was also measured. To evaluate variations in NH4+: Mg2+: PO43− ion concentrations during the crystallization process, the mixture was filtered through a 0.22 µm filter to remove potentially minute NH4+: Mg2+: PO43− particles that may have formed during the sampling procedure.

2.2. Details of the Experiment

2.2.1. Preparation of Biochars

The activated carbon used in this work was acquired at various pyrolysis temperatures from Hainan Province (Haikou). This activated carbon had a particle size range of 0–4 mm. All of the trials took place in China’s premier marine resource use laboratory at Hainan University. There were twelve biochars used in this study, and all the examinations were finished in three replicates and the means were reported. Different biochars were used to prepare the biogas slurry of struvite; the particle size of biochar ranged from 0–4 mm, and 0.2 g of biochar was combined with solutions and mechanically stirred at 200 rpm at 25 °C. The pyrolysis temperature was raised to the aimed values of 300 °C, 500 °C, 700 °C and 900 °C. The list of full name of biochars are given to below.
  • Sample number: Biochar type
  • CK: ——
  • DG: Bean stem biochar
  • SH-1: Water hyacinth root biochar
  • SH-2: Water hyacinth stem and leaf biochar
  • HSK: Peanut shell biochar
  • MG-1: Mushroom soil biochar (first batch)
  • MG-2: Mushroom soil biochar (second batch)
  • SD: Rice biochar
  • JM: Jimei block sludge biochar
  • TA-1: Tongan city sludge biochar
  • TA-2: Tongan hydrothermal sludge biochar
  • TA-3: Tongan hydrogel sludge biochar
  • XJ: Rubber wood biochar

2.2.2. Preparation of Simulated Biogas Slurry

In this research, K2HPO4·3H2O, MgCl2·6H2O, NH4Cl and deionized water were used to arrange simulated livestock biogas fluid according to the calculated data prepare simulated livestock and poultry biogas fluid according to the planned data. According to the chemical equation of struvite precipitation reaction, in order to promote the reaction, the theoretical molar ratio of PO43−, Mg2+, NH4+ in the solution is 1:1:1, but the research proves that when Mg2+, P, N is slightly greater than 1, the phosphorus recovery rate was the highest.

2.2.3. Preparation of Stock Solution

Preparation of K2HPO4 stock solution: 28.5275 g of K2HPO4·3H2O was weighed precisely, dissolved in an appropriate amount of water, and the volume was made up to 250 mL, and then the solution concentration was 0.5 mol L−1. For the MgCl2 stock solution: 25.4125 g MgCl2·6H2O was accurately weighed, dissolved in a certain amount of water, the volume made up to 250 mL, and then the concentration was 0.5 mol L−1. For the NH4Cl stock solution: 6.6863 g NH4Cl was weighed precisely, dissolved in an appropriate amount of water, and the volume made up to 250 mL at this time, making a solution concentration of 0.5 mol L−1.

2.2.4. Analytical Methods

Spectrophotometric analyses of phosphate ions and ammonium ions were carried out using a UV–vis spectrophotometer (UV −650 nm spectrophotometer). Phosphate ion concentration was determined by using the retaining phosphate in the filtrate, computed by ammonium molybedate spectrototometeric methods, while ammonium ion concentration was determined by forming an ultraviolet spectrometer in order to determine the Nessler technique was used to measure NH4-N concentrations of samples the wavelength useful to spectroscopy was (UV −450 nm).

2.2.5. Chemical Analysis

A 0.2-µm filter was used to clarify the chemical solution after 10 min of the experiment. The vitamin C ammonium molybdate method was used to determine (PO43−), and the Nessler technique was used to calculate ammonium nitrate using a spectrometer. All of the trials were repeated three times, with the results provided as means.

2.3. Statistical Analysis

Mathematical expertise aids in the collection of data, the application of reliable analyses, and the efficient presentation of results. Statistics is an important part of how we make scientific discoveries, make data-driven decisions, and make forecasts. In the current study, data were analyzed with the help of analytical tools such as origin 8.5 SPSS version 2020 and R software. Principal component analysis, regression, and Pearson correlation analysis were performed by the SPSS V 2020, and path analysis was performed using the R software [44,45,46]. The principal component analysis (PCA) was used for understanding the data structure and character relations, as it helps derive a small number of independent linear combinations (principal components) from a set of variables, therefore providing ways to explore how several variables relate to each other. The regression coefficients of ammonium and phosphate on the different characters studied were analyzed. The regression analysis was also conducted for the data provided to test the significance of the independent characters affecting the ammonium and phosphate recovery rate. In path analysis, phosphate and ammonium removal was used as the dependent variable, and the other studied characters were use as predictor variables. The Pearson correlation coefficient is a measure of the linear correlation between two random variables X and Y, and was performed for to analyze the relationships between ammonium and phosphate characters accurately. The correlation coefficient (r) was used to measure the strength of relationship between two variables. All the statistical analyses were carried out using SPSS software version 2020.

3. Results

3.1. Principal Component Analysis (PCA) of Phosphate and Ammonium Concentration, and the Removal Effect of Different Biochars, Pyrolysis Temperatures, and Phosphate and Ammonium Different Element and Removal Concentration

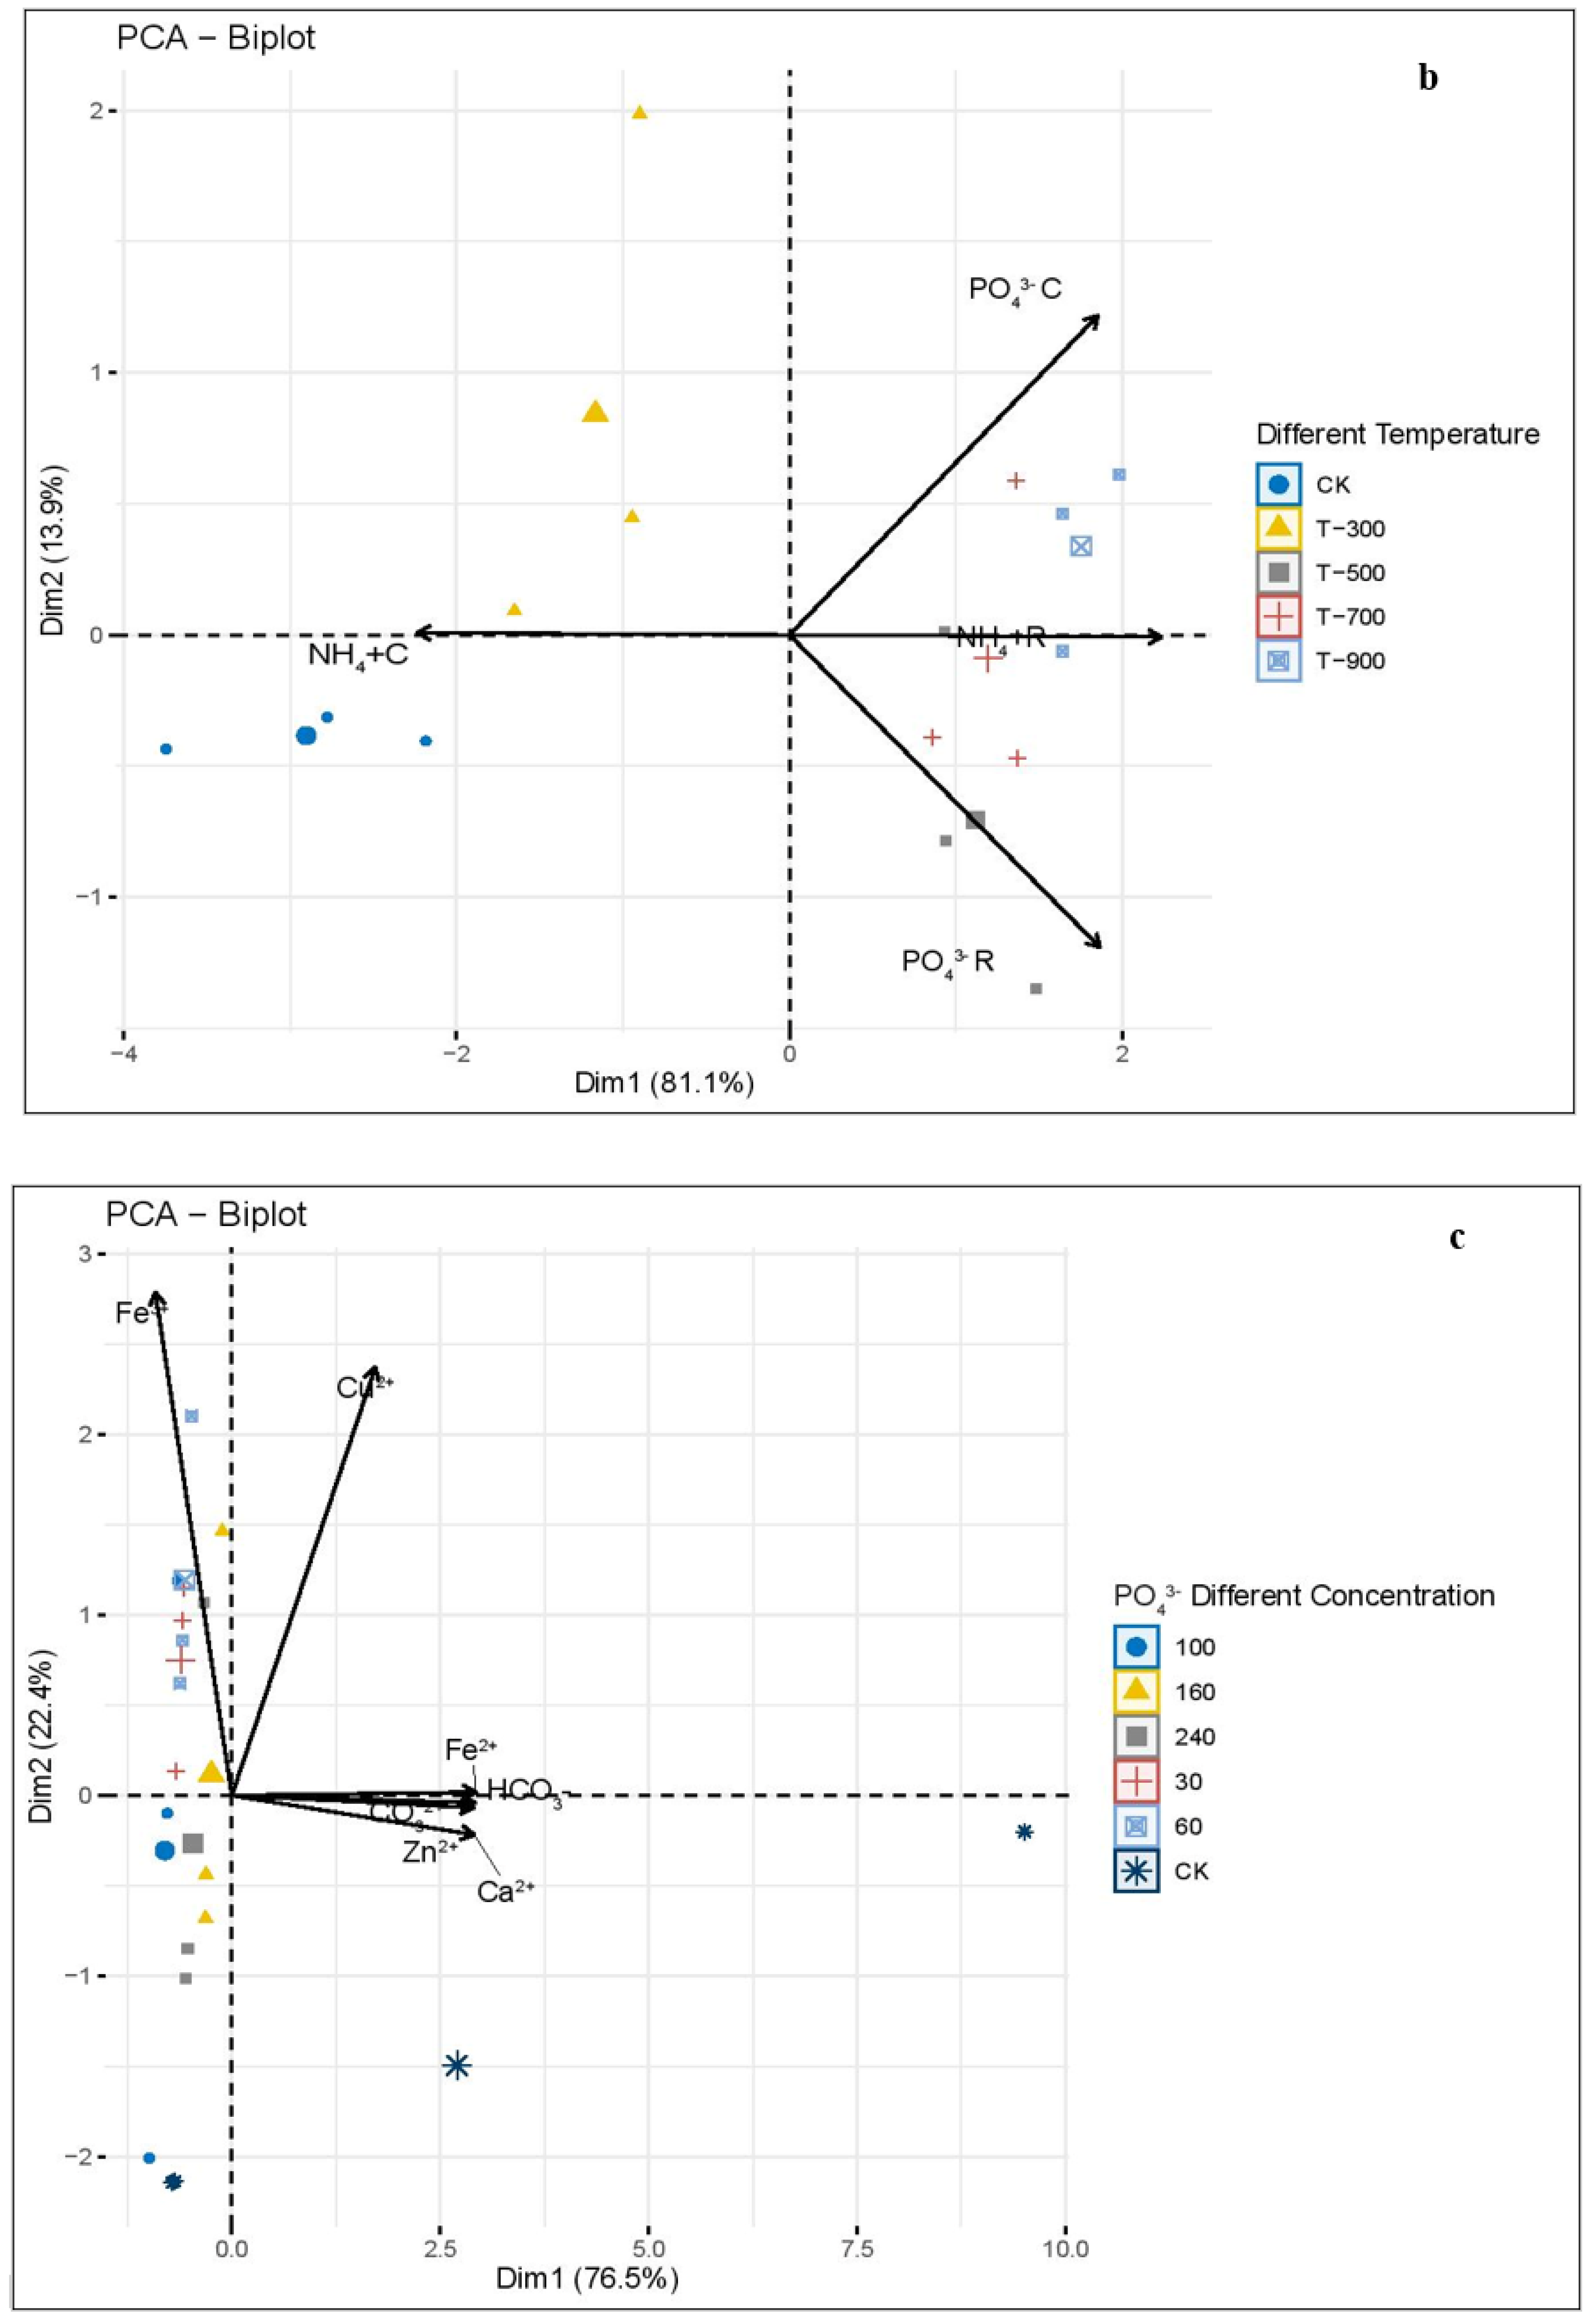
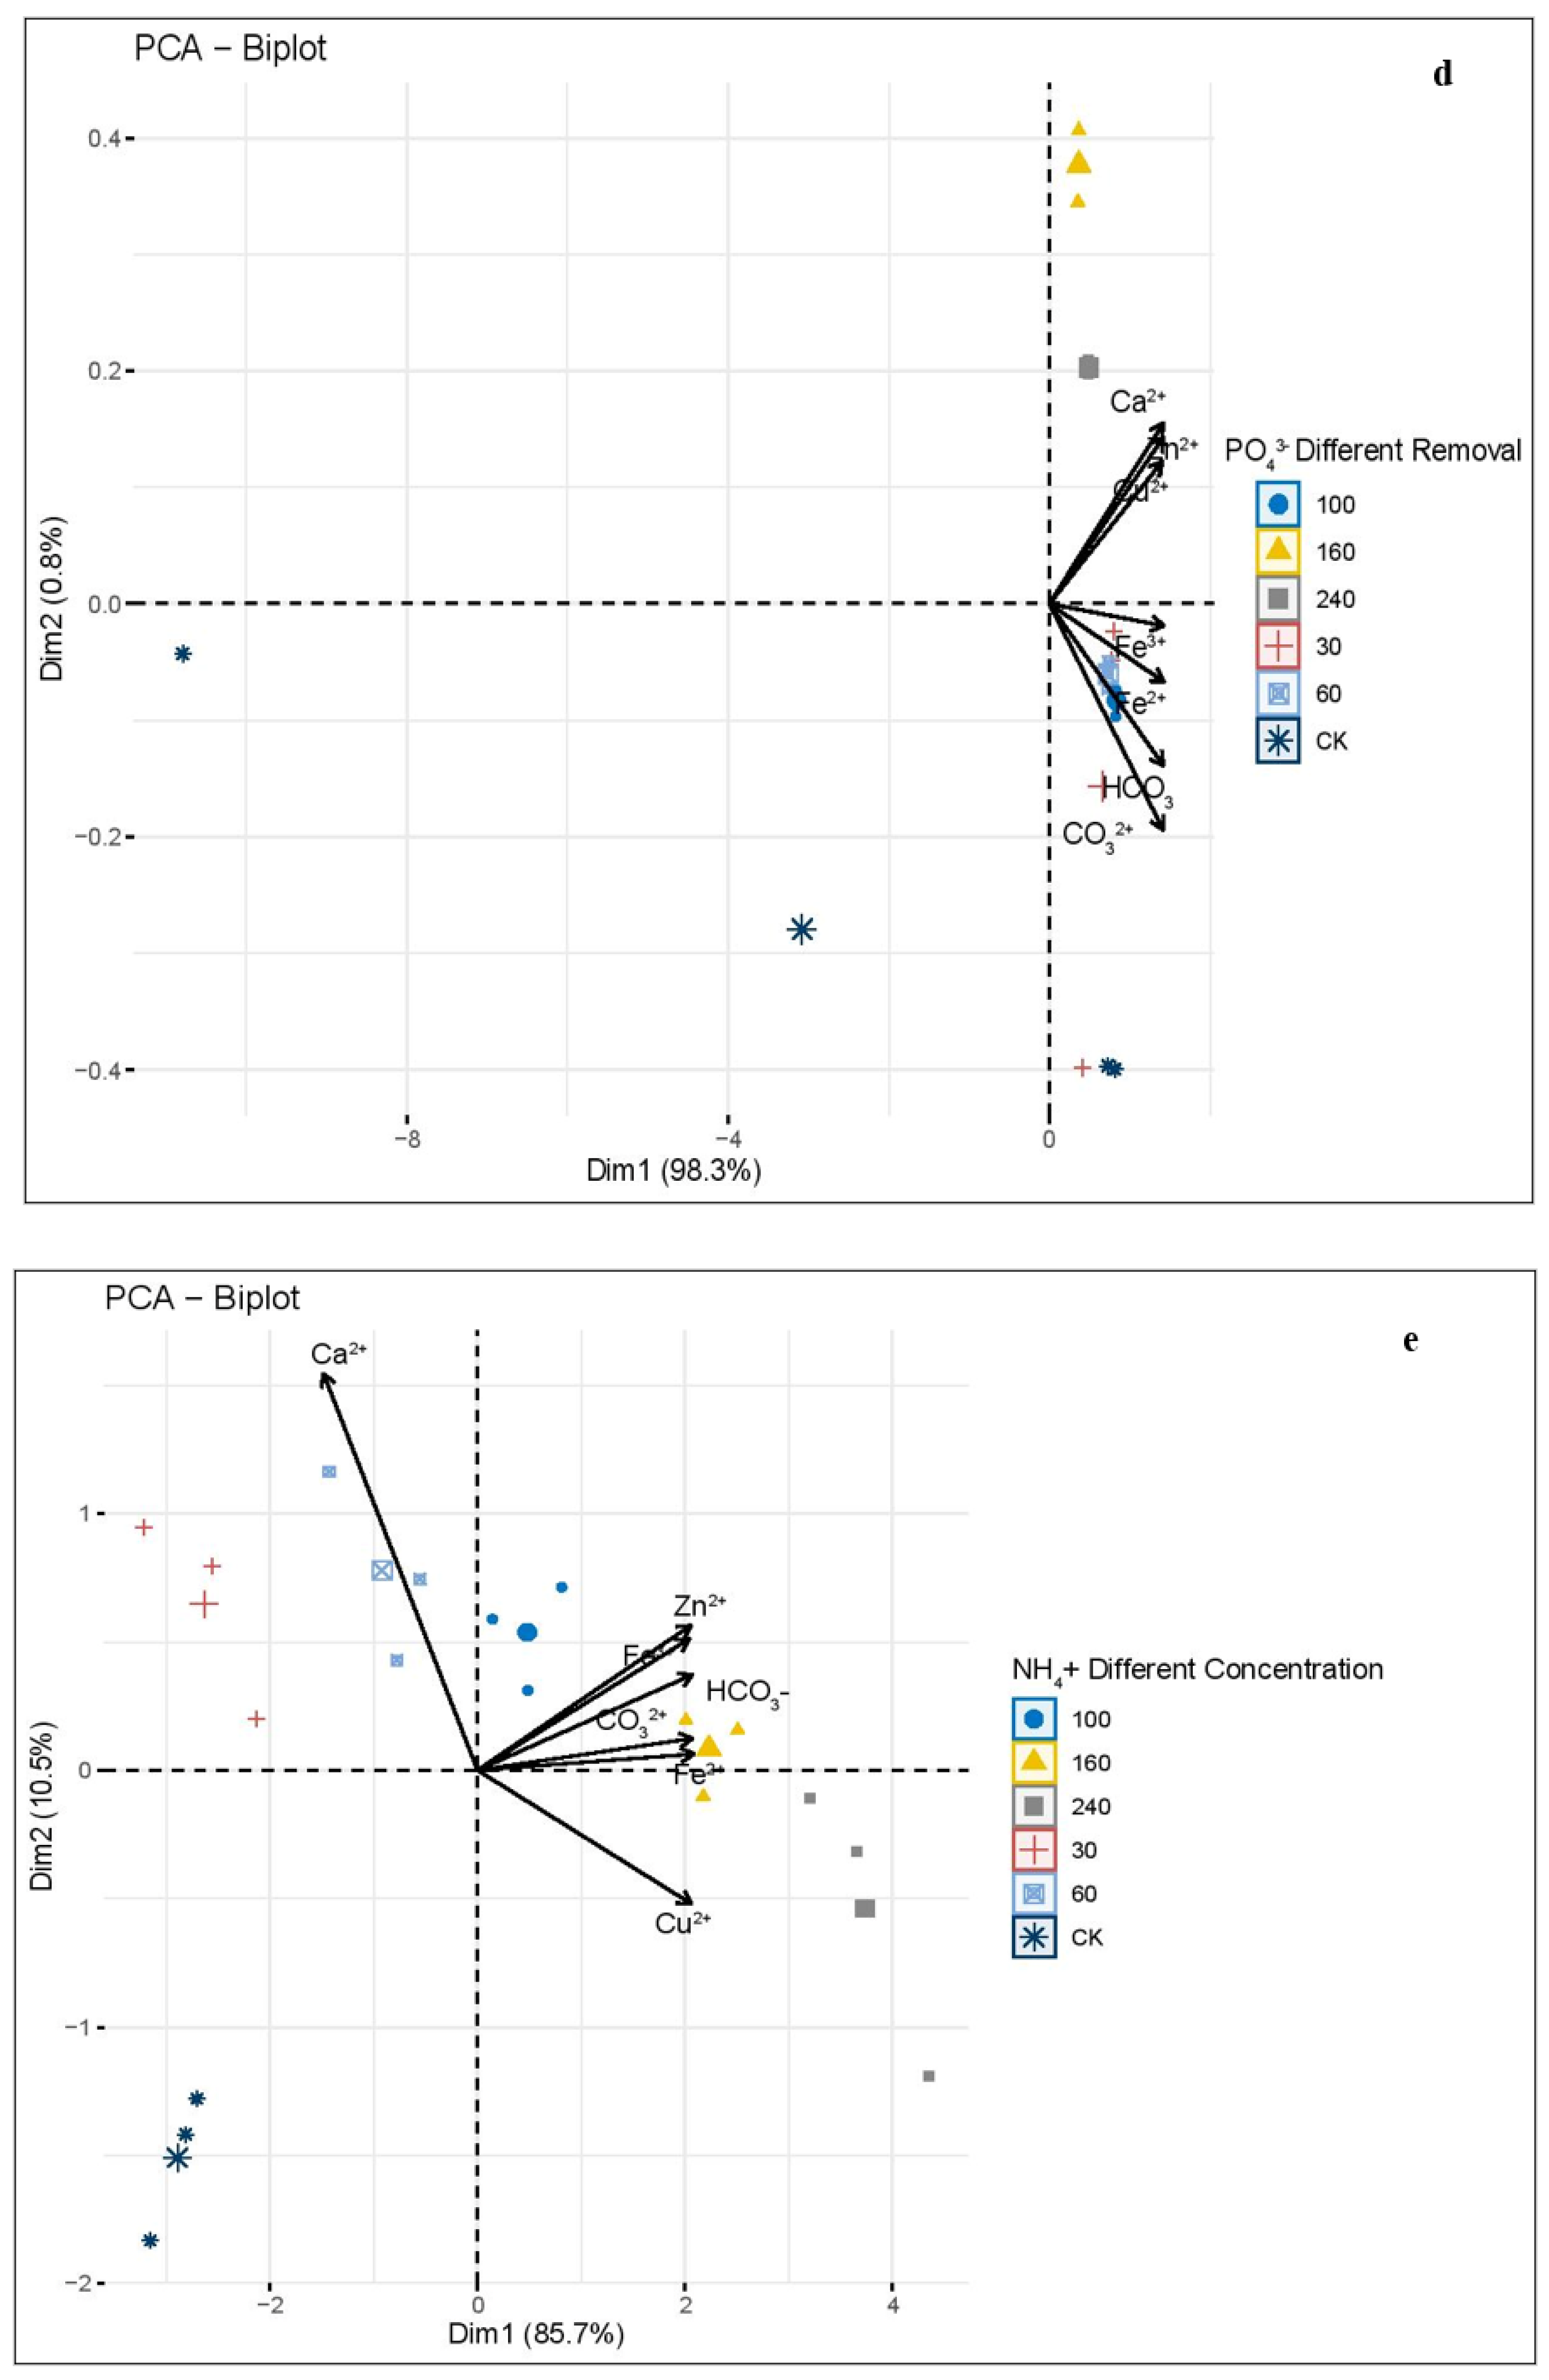
The biplot, which includes both the exploratory factor ratings and the loaded matrices in one biplot presentation, is a common approach to visualize PCA findings. The plot shows the observations as points in the plane formed by two principal components, e.g., the x-axis and the y-axis. In Figure 1a, phosphate and ammonium concentration, as well as the removal effect of different biochar, has been presented. The results show that phosphate and ammonium concentration in PCA 1 (Dim1) is 75.9%, and PCA 2 (Dim2) is 16.3%. The PO43− and NH4+ recovery efficiencies using 12 different bio-chars were tested. TA-1 had the highest NH4+ removal efficiency, whereas JM had the lowest. Meanwhile, SD (rice biochar) had the best NH4+ removal efficiency, whereas JM and MG biochar had the lowest. PCA-biplot analysis of the phosphate, ammonium concentration and removal effect of different pyrolysis temperature is presented in Figure 1b. Changes happening after the removal effect of different pyrolysis temperatures on phosphate and ammonium concentration could be well assumed after witnessing the scores of the first and second principal component score (Figure 1b), which elucidates 81.1% and 13.9% of the variability, respectively. Two components were carefully selected from PCA analysis, and each had eigen values higher than 1.0. The PC1 exposed around 81.1% of the variability, and PC2 showed 13.9% of the variability. The phosphate and ammonium concentration in the presence of different temperatures showed variations. In Figure 1c, the principal component analysis of phosphate in different element concentrations is presented in graphical form. Analysis shows that PCA-biplot has two components, e.g., PCA-1 (Dim1) 76.5%, and PCA-2 (Dim2) 22.4%. Furthermore, the removal efficiency of phosphate also decreased when the initial concentration of metal ions was increased. The removal efficiencies dropped from Cu2+, Fe2+, HCO3, CO32−, Zn2+, and Ca2+. The highest phosphate removal occurs during the highest removal of PO43− ion concentration. The first two principal components were selected according to the magnitudes of corresponding different phosphate removal, which should be equal to or higher than each other according to their biplots. In Figure 1d, principal component analysis of phosphate during different removals is presented in graphical form. Analysis shows that PCA-biplot has two components, e.g., PCA-1 (Dim1) 98.3%, and PCA-2 (Dim2) 0.8%. It agrees with another traditional common rule, that the different phosphate removal of variance could be explained by at least 98.3% of PCA1, which often includes the interpretation of PCA which is necessary to understand the data structure. The biplot is a very popular way of visualizing the results from PCA, as it combines both the principal component scores and the loading vectors in a single biplot display. The plot shows the observations as points in the plane formed by two principal components, e.g., x-axis and y-axis. Biplot PCA analysis of the ammonium different element concentration is presented in Figure 1e. Changes happening after ammonium different element (Zn2+, Fe3+, HCO3, CO32−, Fe2+, and Cu2+) concentrations could be well assumed after witnessing the score of the first and second principal component score (Figure 1e), which elucidates 85.5% and 10.5% of the variability, respectively. In principal component analysis of ammonium, different element concentrations are presented in graphical explanation. The plot shows the observations as points in the plane formed by two principal components, e.g., x-axis and y-axis. Biplot PCA analysis of the ammonium different element concentration is presented in Figure 1f. Changes happening after ammonium different element concentrations could be well assumed after witnessing the score of the first and second principal component score (Figure 1f), which elucidates 97.8% and 1.7% of the variability, respectively. Two components were carefully selected from PCA analysis, each with eigen values higher than 1.0. The PC1 exposed around 85.5% of the variability, and PC2 showed 10.5% of the variability.

3.2. Relationship of Ammonium and Phosphate Concentration with Ammonium and Phosphate Removal Efficiency, Pyrolysis Temperature, Removal Efficiency and Different Elemental Concentrations

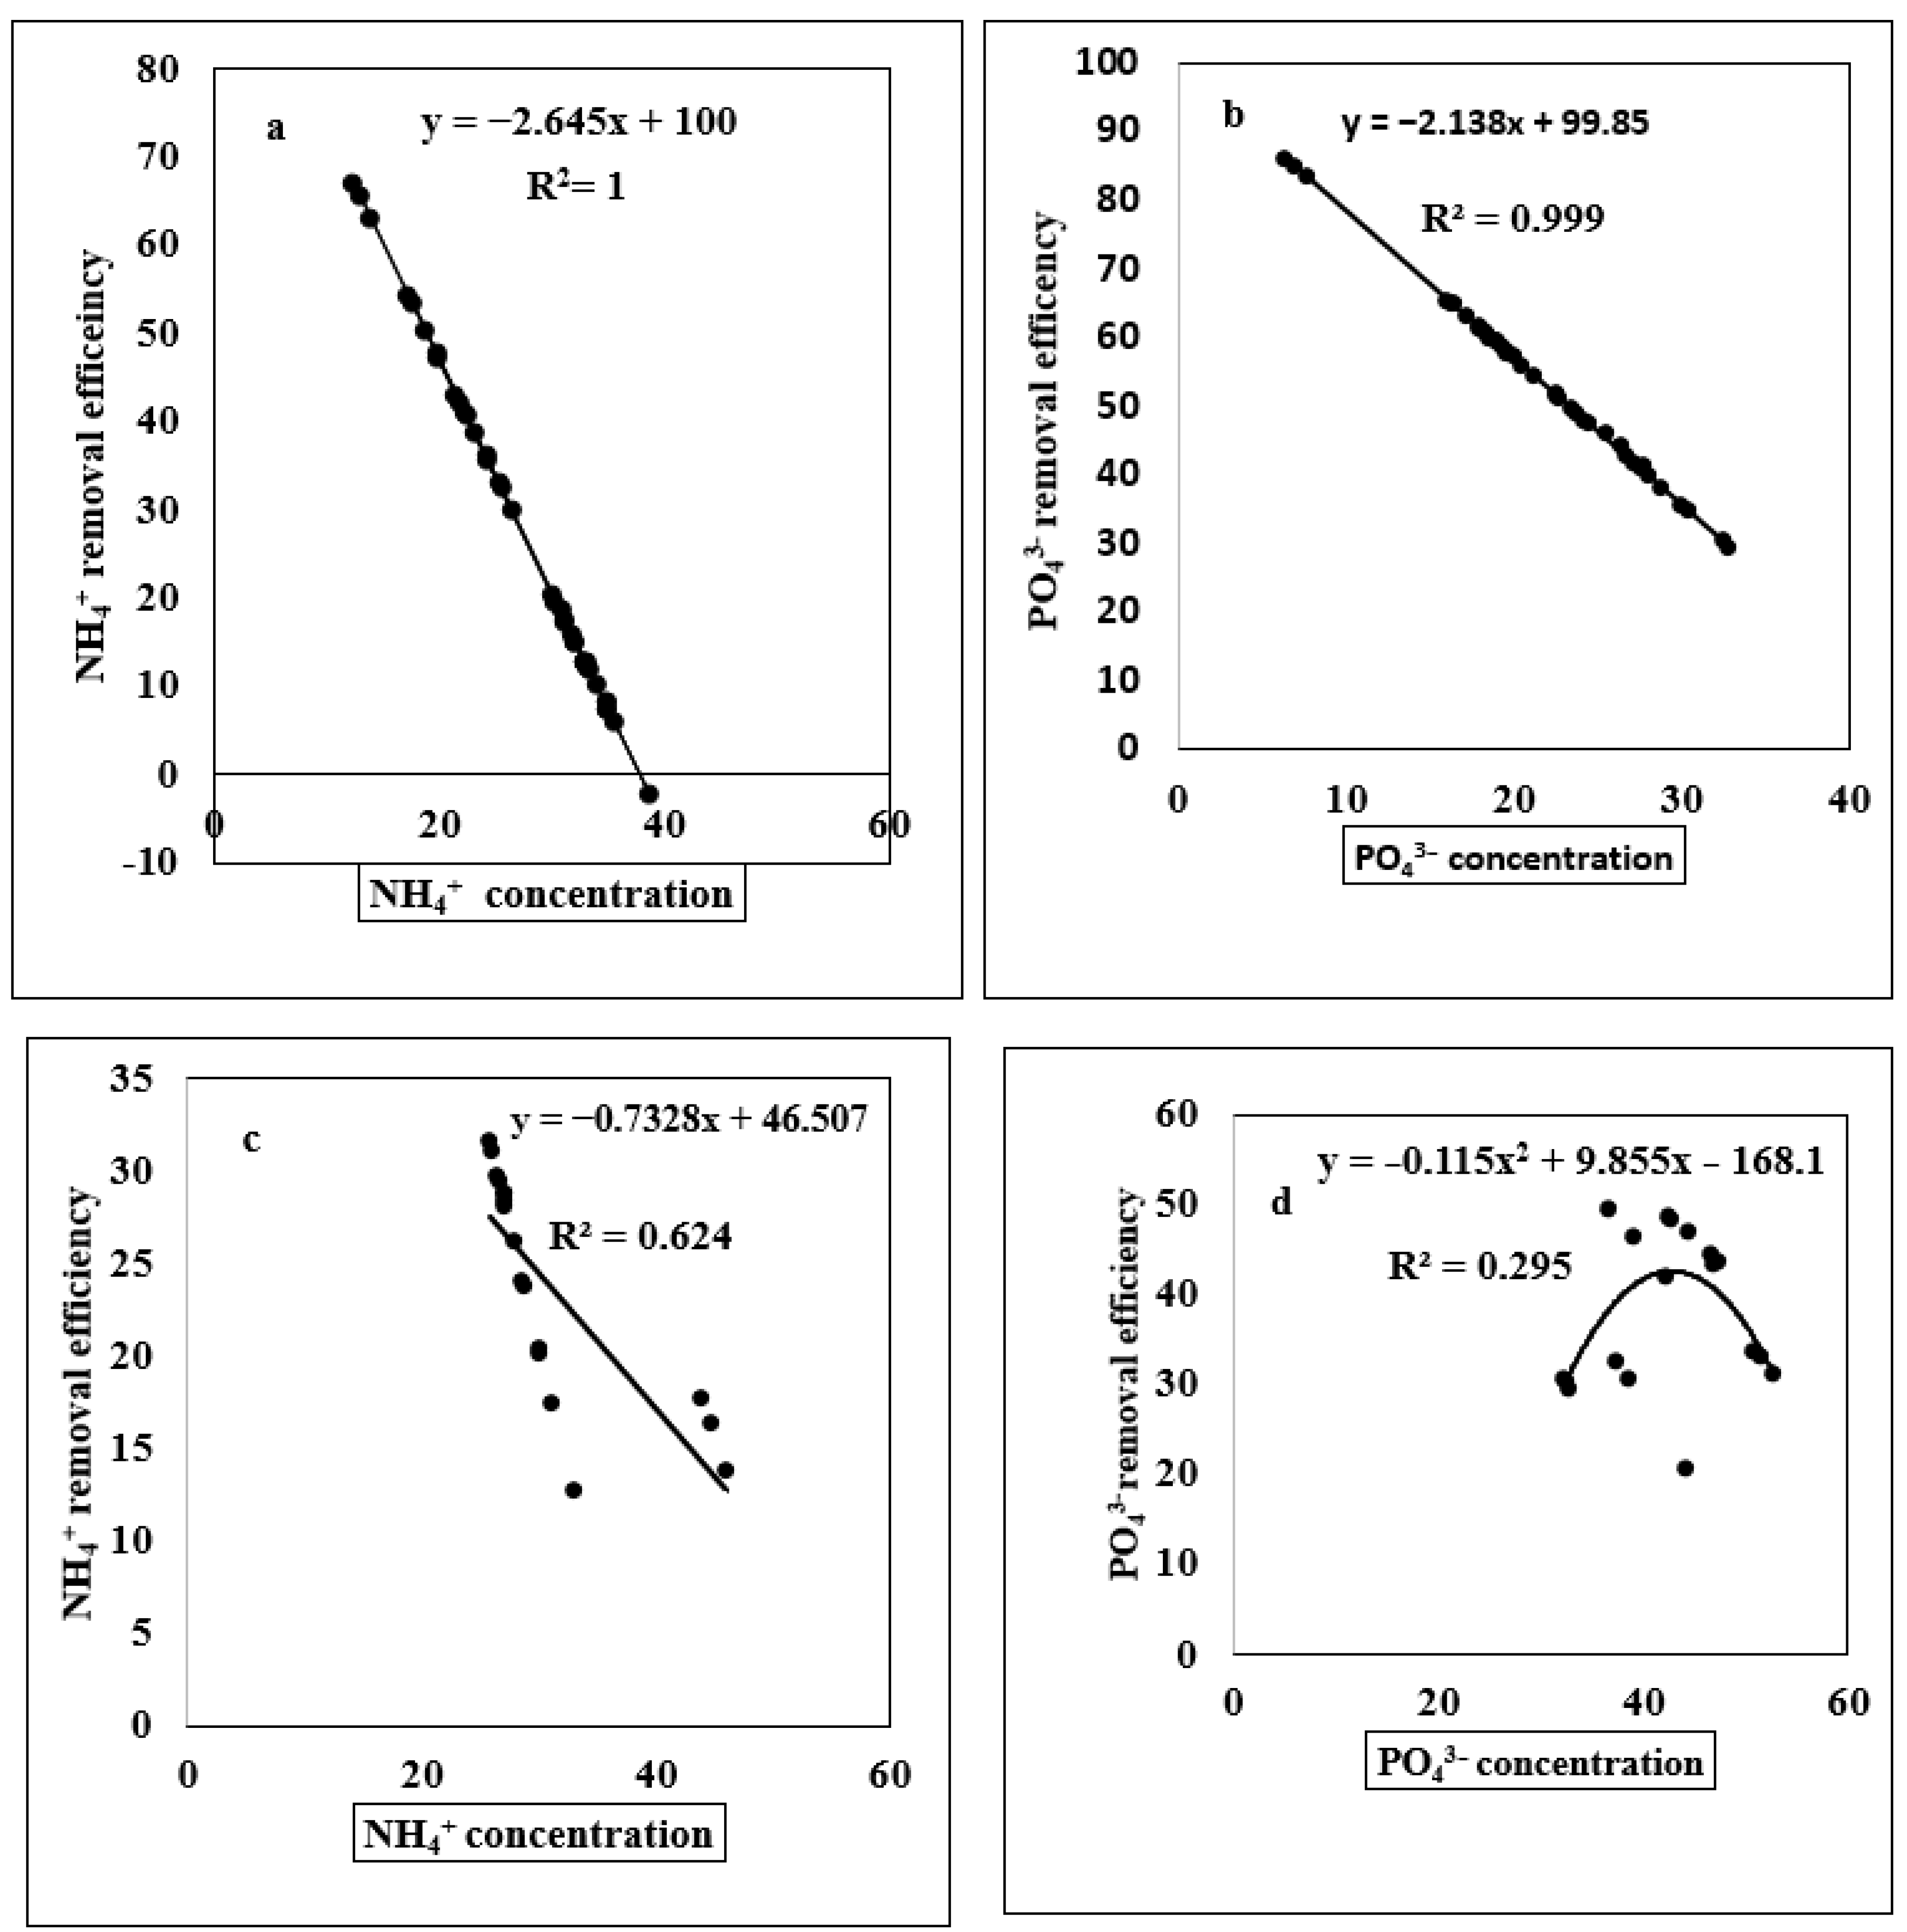
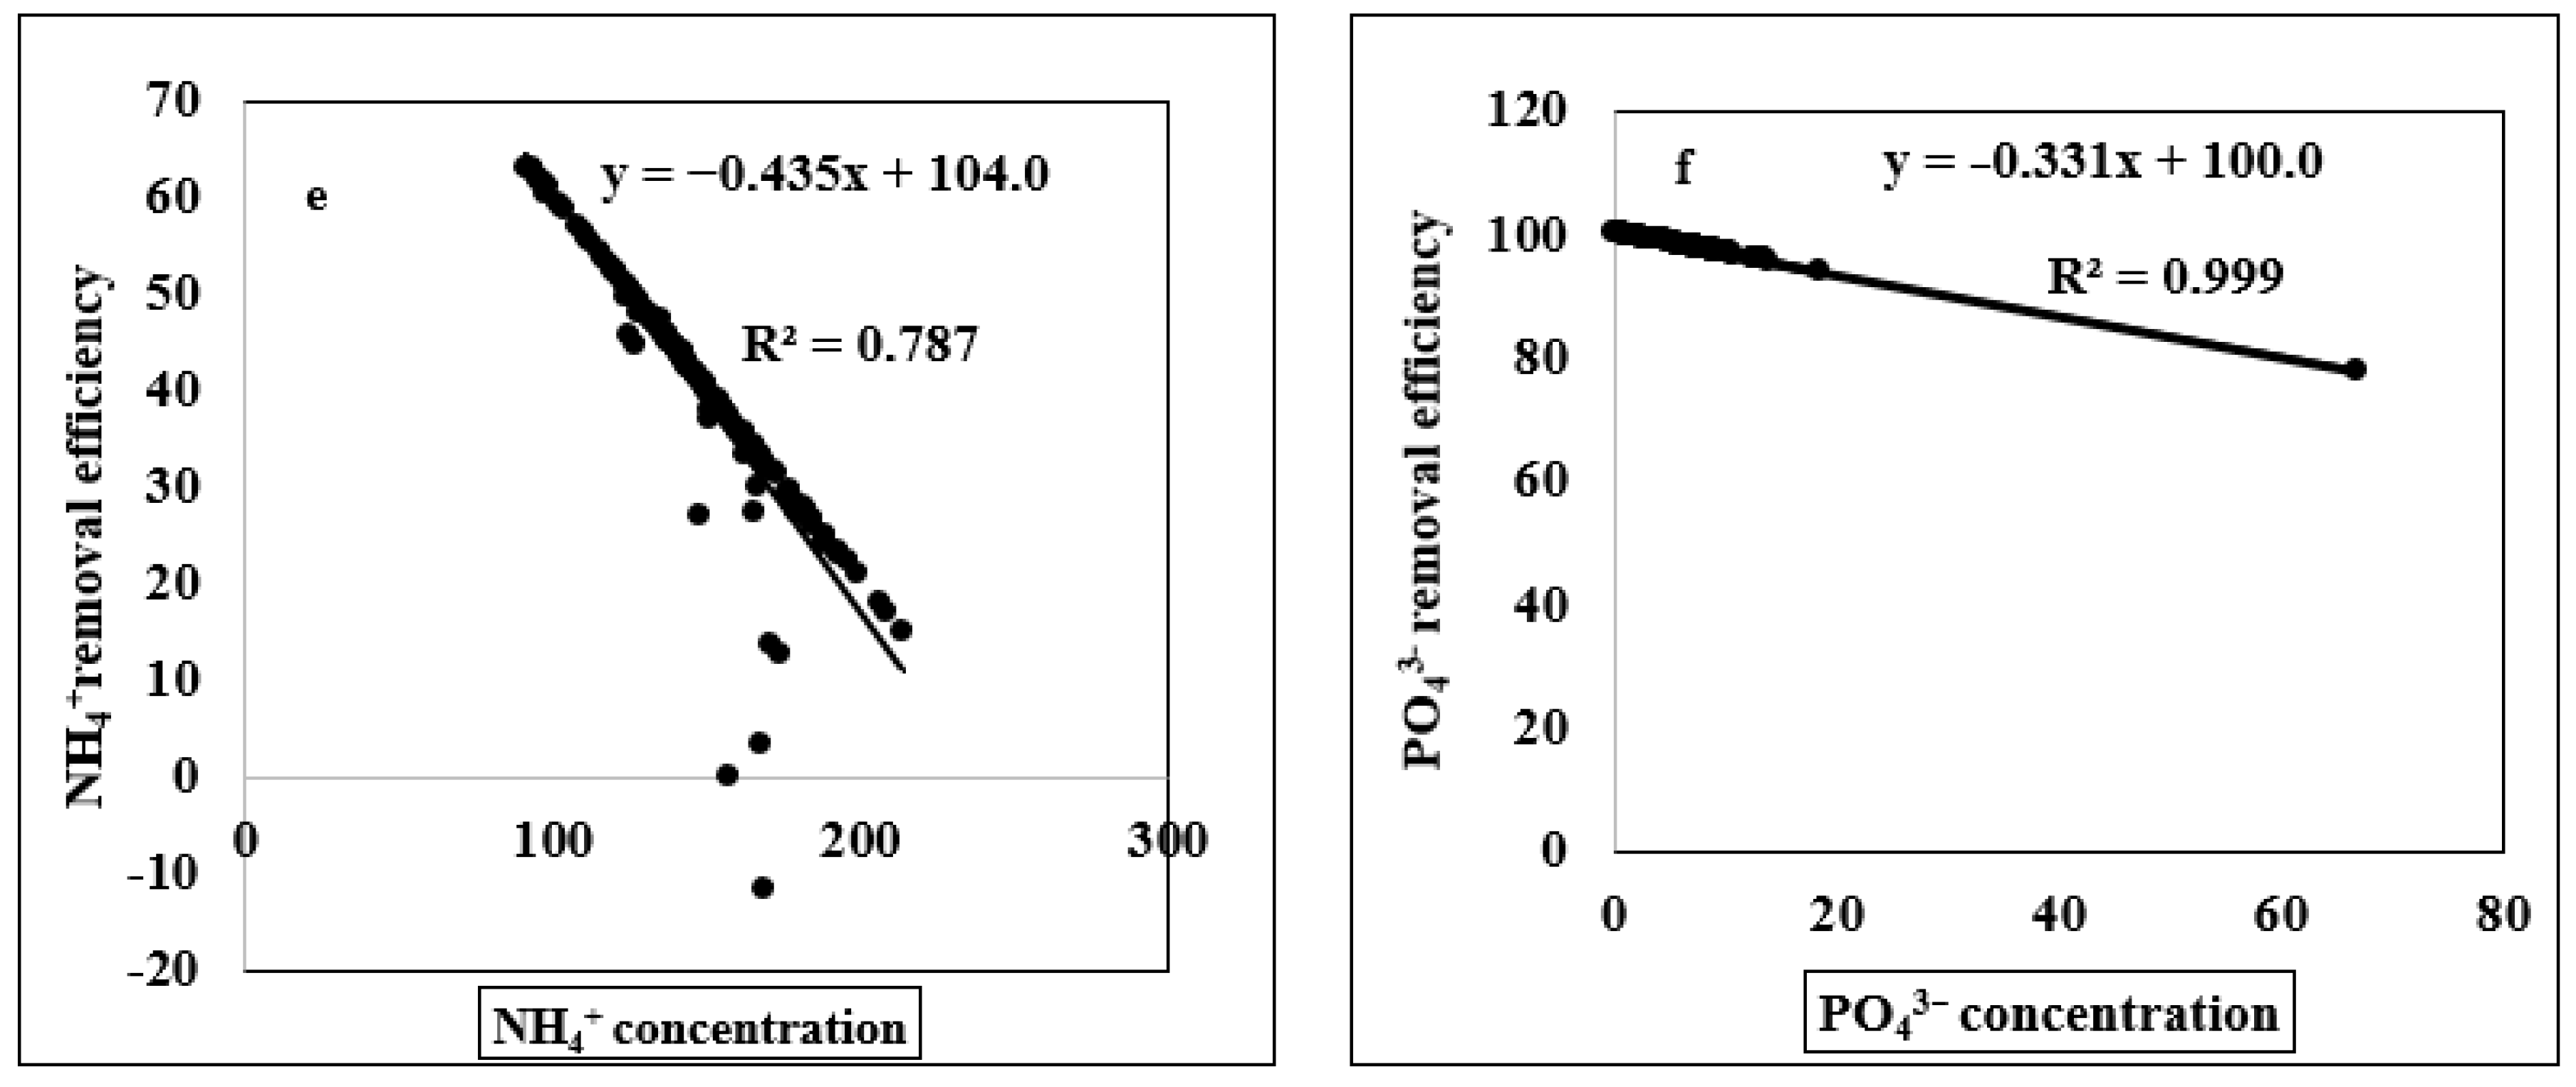
Regression analysis is a powerful statistical method that allows you to examine the relationship between two or more variables of interest. In Figure 2a, the relationship between two variables can be quantified as NH4+ concentration, and NH4+ removal efficiency is the variable. In the graphical explanation, the relationship between NH4+ concentration and NH4+ removal efficiency has been quantified, according to which, as NH4+ concentration increased, the NH4+ removal efficiency also increased under the biochar effect, and the graph was lagged. In Figure 2b, the relationship between two variables can be quantified as PO43− concentration, and PO43− removal efficiency are the variables. In the graphical explanation, the relationship between PO43− concentration and PO43− removal efficiency has been quantified. According to which, as PO43− concentration increased, the PO43− removal efficiency also increased under the biochar effect, and the graph was lagged after some time. In Figure 2c, the relationship between the two variables can be quantified as NH4+ concentration, and NH4+ removal efficiency under pyrolysis temperature is the variable. In the graphical explanation, the relationship between NH4+ concentration and NH4+ removal efficiency has been quantified under pyrolysis temperature with R2 = 0.624; according to which, in the presence of pyrolysis temperature, as NH4+ concentration increased, the NH4+ removal efficiency also increased, and the graph was lagged. In Figure 2d, the relationship between the two variables can be quantified as PO43− concentration, and PO43− removal efficiency under pyrolysis temperature is the variable. In the graphical explanation, the relationship between PO43− concentration and PO43− removal efficiency has been quantified under pyrolysis temperature with R2 = 0.295; according to which, in the presence of pyrolysis temperature, PO43− concentration and PO43− removal efficiency were shown as a curve with variations. In Figure 2e, the relationship between two variables is quantified as NH4+ concentration, and NH4+ removal efficiencies under different elements concentrations are the variables. In the graphical explanation, the relationship between NH4+ concentration and NH4+ removal efficiency has been quantified under different element concentrations, with R2 = 0.787. According to which, as NH4+ concentration and removal efficiency was directly promotional, the graph was inclined. In Figure 2f, the relationship between two variables can be quantified as PO43− concentration, and PO43− removal efficiency under different element concentrations are the variables. In the graphical explanation, the relationship between PO43− concentration and PO43− removal efficiency has been quantified under different element concentrations, with R2 = 0.999; according to which, the PO43− concentration and removal efficiency graph was inclined downward. A linear regression line has an equation of the form y = a + bx, where a x is the explanatory variable and y is the dependent variable. The slope of the line is b, and a is the intercept (the value of y when x = 0).

3.3. The Key Route Main Path of Removal: (A) Phosphate Removal, (B) Ammonium Removal

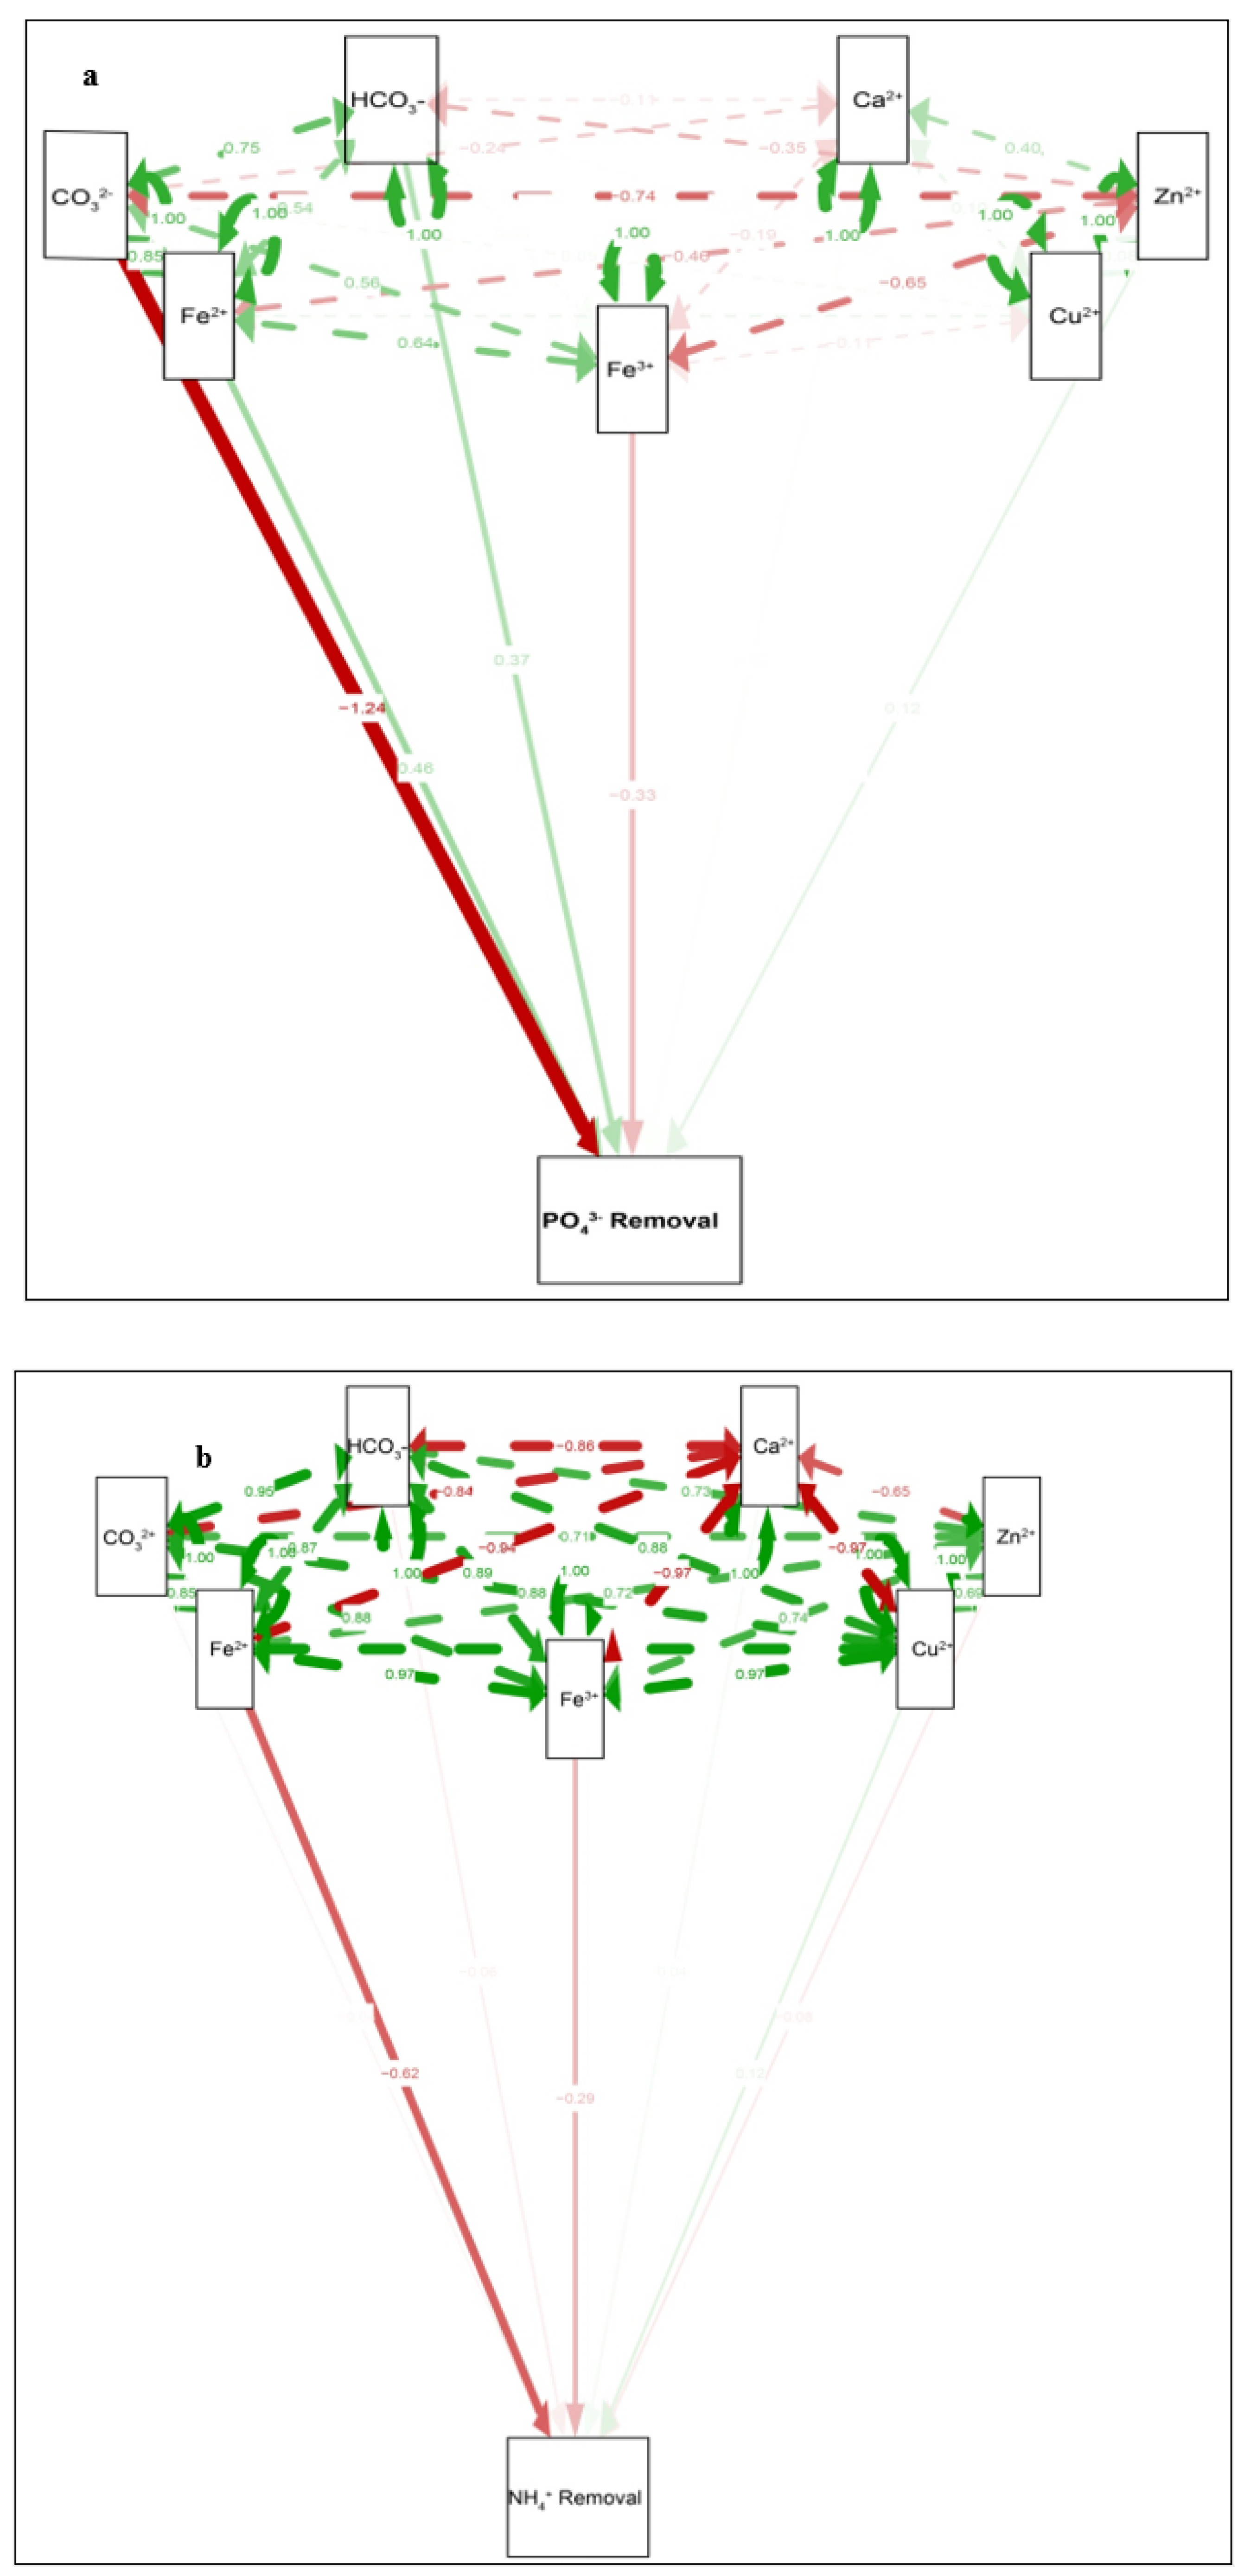
The researchers employed path analysis to examine the link between PO43− removal and the relative relevance of direct and indirect impacts on other ions such as CO32−, HCO3, Fe2+, Fe3+, Cu2+, Ca2+, and Zn2+. PO43− showed a low direct path coefficient and a high indirect path coefficient, suggesting that it mostly regulated ion activation via an indirect pathway (Figure 3a). The activation of HCO3 directly significantly affected the activation of total PO43−, which was maximal, followed by CO32−, Fe 2+, Fe3+, Cu2+, Ca2+, and Zn2+. As shown in Figure 3b, ammonium ions have a high concentration via a direct pathway.

3.4. Pearson Correlation under Ammonium Concentration and Removal Efficiency, and Phosphate Removal Concentration and Removal Efficiency

Using the Pearson correlation of ammonium concentration effect, the ammonium concentration showed a positive and significant correlation with Fe3+ (r = 0.983 **, Table 1). The Pearson correlation of ammonium concentration was analyzed, and the Pearson correlation was insignificant in many ionic concentrations, as all were more than the significant 0.05. The highest relationship of ammonium concentration was observed with Zn2+ (r = 0.982 **), and K+ (r = 0.983 **). Furthermore, the ammonium concentration indicated a non-significant correlation with Cu2+ (r = 0.13), CO32− (r = 0.113), Fe2+ (r = 0.116) and SO42− (r = 0.116). Ammonium concentration was positively correlated with Zn2+, Fe3+ and K+, and negatively correlated with Cu2+, CO32−, Fe2+, SO42−. The Pearson correlation coefficient—also known as Pearson’s r, the Pearson product–moment correlation coefficient, the bivariate correlation, or colloquially as the correlation coefficient—is a measure of linear correlation between two sets of data. The Pearson correlation measures the strength of the linear relationship between two variables. As shown in Table 2, the Pearson correlation under ammonium removal efficiency was analyzed, and the Pearson correlation co-efficient was insignificant in many ionic concentrations, as all were more than the significant 0.01 ammonium removal efficiency that was significantly positively correlated with all ions: Ca2+ (r = 0.989 **), Zn2+ (r = 0.962 **), Fe3+ (r = 0.999 **), Fe2+ (r = 0.994), correlated with SO42− (r = 0.998 **), and highly positively correlated Cu2+ (r = 1.000 **), CO32− (r = 1.000 **), HCO3 (r = 1.000 **) and K+ (r = 1.000 **), (Table 3). The Pearson correlation of phosphate removal concentration was analyzed, and the Pearson correlation co-efficient was insignificant in ionic concentration, as all were more than the significant 0.01. We found that the contribution of phosphate removal concentration was greatly correlated (p < 0.001) with Ca2+ (r = 1.000 **) and Zn2+ (r = 1.000 **); while, the highest negative correlation of phosphate removal concentration was documented with Cu2+ (r = −0.528 *) and K+ (r = −0.523 **). Overall, there was a significant relationship of phosphate removal concentration with all ions. Ca2+ and Zn2+ was strongly positive correlated with (r = −1.000–1.000 **); while, Fe3+ (r = −0.303), Fe2+ (r = −0.303), CO32− (r = −0.325), and HCO3 (r = −0.319) were highly negatively associated with and strongly positive correlated with K+ and SO42− (r = −0.999–0.999 **). As seen in Table 4, the Pearson correlation of phosphate removal efficiency was analyzed and the Pearson correlation co-efficient was insignificant in ionic concentration, as all were more than the significant 0.01. Phosphate removal efficiency correlation was significant at the 0.01 level for all ions. The phosphate removal efficiency indicated a significant correlation with Ca2+ (r = 0.999 **), Zn2+ (r = 0.999 **) and SO42 (r = 0.116 **). Phosphate removal efficiency was positively correlated with Cu2+ (r = 0.977 **), Fe3+ (r = 0.997 **), Fe2+ (r = 0.998 **), CO32 (r = 0.993 **), HCO3 (r = 0.992 **), K+ (r = 0.998 **) and SO42− (r = 0.998 **).

4. Discussion

4.1. Ammonium and Phosphate Recovery from Biogas Slurry by Struvite and Biochar Precipitation

Our study reports the recovery of NH4+ and P from biogas slurry by combination of the biochar with struvite precipitation. The P and NH4+ recovery efficacies reach 33% and 45%, respectively, and were stable at an optimized pH of 9.0 with twelve different types of biochar. NH4+ and P recovery were better through struvite precipitation and the biochar adsorption mechanism. Our study is associated with the observations reported by other Elsevier researchers; they reported that phosphate removal efficiency was gradually increased when the content of biochar increased [47,48,49,50]. These results indicate that biochar is a good carrier for struvite precipitation to recover P and NH4+ from the biogas slurry as a slow-release fertilizer. Likewise to our results, Zheng et al. [50] found that the recovery of P and N from urine increased by approximately 40–50% and 99%, respectively, under the combination of biochar and struvite at an optimized pH of 9.0. The time of communication among biochar and nutrients solution has had a considerable impact on the reactivity of biochar and element sorption [51]. However, Huang et al. [52] revealed that maximum removal was noted when pyrolysis was repeated five times at pH 8.0–8.5. Conversely, [53] observed that ammonium removal efficiency (mass) was decreased from 92% to 77% after five recycles. The removal efficiency of phosphate and NH4+ is not directly proportional of each of the biochar specimens to the biochar dose. This is an overall fact during the adsorption method, which is mostly due to the overlap of adsorption sites based on the solid increase [54,55,56].

4.2. Principal Component Analysis (PCA) Analysis of Different Indicators

In this study, PCA was conducted on different twelve biochars, different pyrolysis temperature, different ion concentrations of ammonium and phosphate removal efficiency. First, the applicability of PCA was tested by the SPSS 2020 software. The results are shown in Figure 1a, 75.9% PCA-1 (Dim1) and 16.3% PCA-2 (Dim2), indicating that the data is suitable for phosphate and ammonium concentrations and the removal effect of different biochar PCA. Figure 1b indicates the results of phosphate and ammonium concentrations and the removal effect of different pyrolysis temperatures: PCA-1 (Dim1) 81.1%, and PCA-2 (Dim2) 13.9%. Figure 1c reveals the results of phosphate different element concentrations: PCA-1 (Dim1) 76.5%, and PCA-2 (Dim2) 22.4%. In Figure 1d the results regarding phosphate different removal can be observed, PCA-1 (Dim1) 98.3%, and PCA-2 (Dim2) 0.8%. Figure 1e presents the results found regarding ammonium different element concentration, PCA-1 (Dim1) 85.5%, and PCA-2 (Dim2) 10.5%. Figure 1f indicates the results of ammonium different element concentration, PCA-1 (Dim1) 97.8%, and PCA-2 (Dim2) 1.7%. These results were used to verify the sufficiency of the example [57], and the reach of independence variable [58], respectively. The aims of the PCA were to extract the necessary information representative of the typical characteristics of the water environment from a large amount of data, and represent it as a new set of independent variables of the principal component [59]. Previous research has shown that COD (chemical oxygen demand) and NH4+ are the eigenvalues of each principal component. The scree plot helps us to determine that N in the Xin’anjiang River is mainly derived from human sewage and agricultural wastewater [60]. The TN (Total nitrogen) and TP (Total phosphorus) in Xin’anjiang River mainly originated from surface run loss of nitrogen and phosphorus from tea plantations [61]; there is no universal rule for the estimation of a number of PCs (Prin-cipal components) [62].

4.3. Regression Analysis of Different Indicators

The present study examines the impact of key factor relationships of ammonium concentration with ammonium removal efficiency under the biochar effect. We provided graphical explanation of the relationship of ammonium concentration with ammonium removal efficiency under the biochar effect, and the overall significance of the model can be seen from the value of the coefficient of multiple determinations; that is, the R-square. The value of the R-square (as seen in Figure 2a) is 1, which is high, showing that about 100% of the total change in removal efficiency of biochar at different concentrations of ammonium can be explained by the five explanatory variables chosen in this study. Regarding the relationship of phosphate concentration with phosphate removal efficiency under the biochar effect, the calculated value of the F statistic (as seen in Figure 2b) is R2 = 0.999, which is highly significant. For the relationship of ammonium concentration with ammonium removal efficiency under pyrolysis temperature (as seen in Figure 2c), R2 = 0.624. For the relationship of phosphate concentration with phosphate removal efficiency under pyrolysis temperature, R2 = 0.295 (Figure 2d). Regarding the relationship of ammonium concentration with ammonium removal efficiency under different elemental concentrations, R2 = 0.787 (Figure 2e). For the relationship of phosphate concentration with phosphate removal efficiency under different elemental concentrations, R2 = 0.999 (Figure 2f). Our results show that ammonium concentration and biochar positively and significantly influence removal efficiency. Additionally, biochar is a key factor, showing a positive effect on removal efficiency. These findings are consistent with the findings of other studies, including [63,64,65,66], which show that there is a positive and significant impact of ammonium and phosphate on the removal effect of biochar [67].

4.4. Route Main Path Analysis of Different Indicators

Results for the path analysis are shown in Figure 3a for phosphate removal, and Figure 3b for ammonium removal; our results are similar to those of other researchers who reported that non-significant relationships existed between phosphate and ammonium removal [68,69]. Additionally, the results of our study are consistent with the findings of others [69,70,71]. Furthermore, several researchers have found significant relationships between P and other metal ions [69,71,72]. Several researchers have suggested that acid ammonium extractions are not appropriate for calcareous soils where calcium dominates P sorption reactions [73,74,75]. Therefore, path analysis and regression were conducted after the removal of ions with pH 7.0 from the data set [68]. Therefore, ammonium removal relationships were developed to link path analysis, as well as to enhance the ammonium removal processes [76]; a series of linear regression and path analysis results determined the NH4+-N and P transformation rates of processes [77,78,79,80].

4.5. Pearson Correlation of Different Indicators

In order to analyze and confirm the relationships, Pearson’s correlation analyses were applied to the data. As shown in Table 1 (r = 0.983 **), Pearson’s correlation under ammonium concentration indicated significant differences in the mean squares from analysis of variance, at the p ≤ 0.01 level. In Table 2, Pearson’s correlation under ammonium removal efficiency was at the 0.01 level of significance. As shown in Table 3 (r = 0.1000 **), Pearson’s correlation under phosphate removal concentration was at the 0.01 level of significance and also for the Pearson’s correlation under phosphate removal efficiency, as seen in Table 4 (r = 0.999 **). There was a statistically important positive correlation between ammonium and phosphorus at 0.01 levels, while only Cu2+ and K+ had a strong negative correlation, with (r = −0.528–0.523 **), at the 0.01 level, signifying their similar source of origin and mobility [80]. It was hypothesized that metals with a high positive correlation are possibly from the same pollution source [81]. P uptake was correlated with P concentration in the media, with more rapid uptake at higher initial concentrations [82,83]. The results show that the correlation coefficient values between ammonium and phosphates were found to be 0.96 and 0.98, respectively, which indicated the impact of the positive correlation with phosphate and ammonium levels [84].

5. Conclusions

In this study, which used the technology of struvite and biochar co-precipitation to recover ammonium and phosphate from biogas slurry, the main findings are as follows: struvite is the best adsorbing agent and can remove the greater concentrations of ammonium and phosphate from mushroom soil biochar and rice biochar, and reduce the impact of Ca2+ on the struvite formation. Under the optimal conditions for struvite precipitation, 18.0% to 99.0% of phosphate and 15.0% to 71.0% of ammonium can be recovered, indicating a substantial nutrient recovery effect. The PCA and different statistical approaches were used to extract the most significant indicator parameters of the ammonium and phosphate recovery from biogas slurry. Changes happening after the removal effect of different pyrolysis temperature on phosphate and ammonium concentration could be well assumed after witnessing the score of the first and second principal component score, which elucidates 81.1% and 13.9% of the variability. Regression analysis indicated that as PO43− concentration increased, the PO43− removal efficiency was also increased under the biochar effect, and the graph was lagged. Path analysis examined the link between PO43− removal and the relative relevance of direct and indirect impacts on other ions, such as CO32−, HCO3, Fe2+, Fe3+, Cu2+, Ca2+, and Zn2+. PO43− showed a low direct path coefficient and a high indirect path coefficient. According to the Pearson correlation, the ammonium concentration showed a positive and significant correlation with Fe3+ (r = 0.983 *). The Pearson correlation of ammonium concentration was analyzed and the Pearson correlation was insignificant in many ionic concentration, as all were more than the significant 0.05. The highest relationship of ammonium concentration was observed with Zn2+ (r = 0.982 **), and K+ (r = 0.983 **). Although the multivariate statistical analysis approach is standard form and is a widely used and adaptive descriptive data analysis tool, it also has many adaptations of its own that make it useful to a wide variety of situations and data types in numerous disciplines. The main technical findings of this study indicated that mushroom soil biochar and rice biochar are likely to be valuable sorbents for N and P recovery from biogas slurry, and could be used as a slow-release fertilizer. This precipitation process might also aid in the disposal of biogas sludge in both urban and rural areas.

Author Contributions

Conceptualization, Q.H. and A.A.K.; Methodology, G.M.K. and M.S.; Software, M.I.K.; Validation, N.A.W.; Formal analysis, C.Y. and K.A.K.; Investigation, Q.H.; Resources, Q.H.; Data curation, Q.W. and G.G.; Writing—original draft preparation, A.A.K.; Writing—review and editing, M.A.K. and K.A.K.; Visualization, S.G.; Supervision, Q.H.; Projected ministration, Q.H.; Funding acquisition, Q.H. All authors have read and agreed to the published version of the manuscript.

Funding

This study was funded by the National Natural Science Foundation of China (41571288), the Hainan Provincial Natural Science Foundation of China (319MS008), the National Science and Technology Support Program of China (2014BAD14B04), and the Research Initiation fund of Hainan University (KYQD(ZR)20032). Financial support was also from Academician He Hong’s team from the Innovation Center of Hainan Province.

Institutional Review Board Statement

Not applicable.

Informed Consent Statement

Not applicable.

Data Availability Statement

Not applicable.

Conflicts of Interest

The authors declare that they have no known opposing financial or personal interest.

References

  1. Song, L.; Liu, J.; Wang, Z. Pig farm wastewater treatment, and comprehensive utilization technology. Chin. J. Anim. Sci. 2015, 10, 51–57. [Google Scholar]
  2. Wu, L.; Zhang, S.; Wang, J.; Ding, X. Phosphorus retention using iron (II/III) modified Biochar in saline-alkaline soils: Adsorption, column, and field tests. J. Environ. Pollut. 2020, 261, 114223. [Google Scholar] [CrossRef] [PubMed]
  3. Duan, N.; Zhang, D.; Lin, C.; Zhang, Y.; Zhao, L.; Liu, H.; Liu, Z. Effect of organic loading rate on anaerobic digestion of pig manure: Methane production, mass flow, reactor scale and heating scenarios. J. Environ. Manag. 2019, 231, 646–652. [Google Scholar] [CrossRef] [PubMed]
  4. He, X.; Zhang, T.; Ren, H.; Li, G.; Ding, L.; Pawlowski, L. Phosphorus recovery from biogas slurry by ultrasound/H2O2 digestion coupled with HFO/biochar adsorption process. Waste Manag. 2017, 1, 219–229. [Google Scholar] [CrossRef] [PubMed]
  5. Scarlat, N.; Fahl, F.; Dallemand, J.F.; Monforti, F.; Motola, V. A spatial analysis of biogas potential from manure in Europe. J. Ren. Sustain. Energy Rev. 2018, 1, 915–930. [Google Scholar] [CrossRef]
  6. Bergland, W.H.; Dinamarca, C.; Toradzadegan, M.; Nordgård, A.S.; Bakke, I.; Bakke, R. High rate manure supernatant digestion. J. Water Res. 2015, 76, 1–9. [Google Scholar] [CrossRef] [Green Version]
  7. Wang, F.; Zhang, D.; Shen, X.; Liu, W.; Yi, W.; Li, Z.; Liu, S. Synchronously electricity generation and degradation of biogas slurry using a microbial fuel cell. J. Renew. Energy 2019, 142, 158–166. [Google Scholar] [CrossRef]
  8. Pivato, A.; Vanin, S.; Raga, R.; Lavagnolo, M.C.; Barausse, A.; Rieple, A.; Laurent, A.; Cossu, R. Use of digestate from a decentralized on-farm biogas plant as fertilizer in soils: An ecotoxicological study for future indicators in risk and life cycle assessment. J. Waste Manag. 2016, 1, 378–389. [Google Scholar] [CrossRef] [Green Version]
  9. Zacharof, M.P.; Mandale, S.J.; Williams, P.M.; Lovitt, R.W. Nanofiltration of treated digested agricultural wastewater for recovery of carboxylic acids. J. Clean Prod. 2016, 20, 4749–4761. [Google Scholar] [CrossRef]
  10. Shang, D.; Geissler, B.; Mew, M.; Satalkina, L.; Zenk, L.; Tulsidas, H.; Barker, L.; El-Yahyaoui, A.; Hussein, A.; Taha, M. Unconventional uranium in China’s phosphate rock: Review and outlook. J. Renew. Sustain. Energy Rev. 2021, 140, 110740. [Google Scholar] [CrossRef]
  11. Cao, L.; Wang, J.; Xiang, S.; Huang, Z.; Ruan, R.; Liu, Y. Nutrient removal from digested swine wastewater by combining ammonia stripping with struvite precipitation. J. Environ. Sci. Pollut. Res. 2019, 26, 6725–6734. [Google Scholar] [CrossRef] [PubMed]
  12. Lupton, S. Markets for waste and waste-derived fertilizers. An empirical survey. J. Rural. Stud. 2017, 55, 83–99. [Google Scholar] [CrossRef]
  13. Aziz, M.; Yaseen, M.; Naveed, M.; Wang, X.; Fatima, K.; Saeed, Q.; Mustafa, A. Polymer-Paraburkholderia phytofirmans PsJN coated diammonium phosphate enhanced microbial survival, phosphorous use efficiency, and production of wheat. Agronomy 2020, 10, 1344. [Google Scholar] [CrossRef]
  14. Egle, L.; Rechberger, H.; Zessner, M. Overview and description of technologies for recovering phosphorus from municipal wastewater. J. Resour. Conserv. Recycl. 2015, 105, 325–346. [Google Scholar] [CrossRef]
  15. Yuan, Y.Y.; Huu, H.N.; Wenshan, G.; Yiwen, L.; Soon, W.C.; Dinh, D.N.; Heng, L.; Jie, W. A critical review on ammonium recovery from wastewater for sustainable wastewater management. J. Bioresour. Technol. 2018, 268, 749–758. [Google Scholar]
  16. Liu, B.; Giannis, A.; Zhang, J.; Chang, V.W.; Wang, J.Y. Characterization of induced struvite formation from source-separated urine using seawater and brine as magnesium sources. J. Chemosphere 2013, 11, 2738–2747. [Google Scholar] [CrossRef]
  17. Sun, G.; Zhang, C.; Wang, Y. Process conditions for removal of nitrogen and phosphorus from pig farm wastewater by MAP crystallization method. J. Ecol. Rural. Environ. 2010, 3, 268–272. [Google Scholar]
  18. Luján-Facundo, M.; Iborra-Clar, M.; Mendoza-Roca, J.; Also-Jesús, M. Alternatives for the management of pig slurry: Phosphorous recovery and biogas generation. J. Water Proc. Eng. 2019, 30, 100473. [Google Scholar] [CrossRef]
  19. Zhang, K.E.; Bowers, J.; Harrison, H. Releasing phosphorus from calcium for struvite fertilizer production from anaerobically digested dairy effluent. J. Water Environ. Res. 2010, 1, 32–42. [Google Scholar] [CrossRef] [Green Version]
  20. Tang, Q.; Shi, C.; Shi, W.; Huang, X.; Ye, Y.; Jiang, W.; Kang, J.; Liu, D.; Ren, Y.; Li, D. Preferable phosphate removal by nano-La (III) hydroxides modified mesoporous rice husk biochars: Role of the host pore structure and point of zero charges. J. Sci. Total Environ. 2019, 662, 511–520. [Google Scholar] [CrossRef]
  21. Xu, Z.; Huang, Q.; Zhang, J.; Wu, Y.; Zhang, L.; Wang, L. Study on the technology of chemical precipitation treatment of high concentration ammonia nitrogen wastewater. J. Indust. Water Treat. 2010, 6, 31–34. [Google Scholar]
  22. Dongmei, Z.; Lihua, C.; Xiaohui, G. Research on the influencing factors of struvite precipitation method used in pig farm wastewater pretreatment. J. South China Norm. Univ. 2012, 2, 99–102. [Google Scholar]
  23. Ackerman, J.N.; Zvomuya, F.; Cicek, N.; Flaten, D. Evaluation of manure-derived struvite as a phosphorus source for canola. J. Plant Sci. 2013, 3, 419–424. [Google Scholar] [CrossRef]
  24. Li, B.; Boiarkina, I.; Huang, H.M.; Munir, T.; Wang, G.Q.; Young, B.R. Phosphorus recovery through struvite crystallization: Challenges for future design. Sci. Total Environ. 2019, 648, 1244–1256. [Google Scholar] [CrossRef]
  25. Huang, H.; Liu, J.; Ding, L. Recovery of phosphate and ammonia nitrogen from the anaerobic digestion supernatant of activated sludge by chemical precipitation. J. Clear Prod. 2015, 102, 437–446. [Google Scholar] [CrossRef]
  26. Nelson, N.O.; Mikkelsen, R.L.; Hesterberg, D.L. Struvite precipitation in anaerobic swine lagoon liquid: Effect of pH and Mg:P ratio and determination of the rate constant. J. Biore Technol. 2003, 89, 229–236. [Google Scholar] [CrossRef]
  27. Adnan, A.; Dastur, M.; Donald, S.M.; Frederic, A.K. Preliminary investigation into factors affecting controlled struvite crystallization at the bench scale. J. Environ. Eng. Sci. 2004, 3, 195–202. [Google Scholar] [CrossRef]
  28. Wang, J.; Song, Y.; Yuan, P.; Peng, J.; Fan, M. Modeling the crystallization of magnesium ammonium phosphate for phosphorus recovery. J. Chemosphere 2006, 65, 1182–1187. [Google Scholar] [CrossRef]
  29. Safaa, M.R. Phosphate removal from aqueous solution using slag and fly ash. HBRC J. 2013, 3, 270–275. [Google Scholar]
  30. Chinos, J.M.; Fernández, A.I.; Villalba, G.; Segarra, M.; Urruticoechea, A.; Artaza, B.; Espiell, F. Removal of ammonium and phosphates from wastewater resulting from the process of cochineal extraction using MgO-containing by-product. J. Water Res. 2003, 37, 1601–1607. [Google Scholar] [CrossRef]
  31. Stratful, I.; Scrimshaw, M.; Lester, J. Conditions influencing the precipitation of magnesium ammonium phosphate. J. Water Res. 2001, 35, 4191–4199. [Google Scholar] [CrossRef]
  32. Wang, J.; Burken, J.G.; Zhang, X.J.; Surampalli, R. Engineered struvite precipitation: Impacts of component-ion molar ratios and pH. J. Environ. Eng. 2005, 131, 1433–1440. [Google Scholar] [CrossRef]
  33. Perera, P.W.A.; Han, Z.Y.; Chen, Y.X.; Wu, W.X. Recovery of nitrogen and phosphorous as struvite from swine waste biogas digester effluent. Biomed. Environ. Sci. 2007, 20, 343–350. [Google Scholar] [PubMed]
  34. Hjorth, M.; Christensen, K.V.; Christensen, M.L.; Sommer, S.G. Solid-liquid separation of animal slurry in theory and practice: A review. Agron. Sustain. Dev. 2010, 30, 153–180. [Google Scholar] [CrossRef] [Green Version]
  35. Prabhu, M.; Mutnuri, S. Cow urine as a potential source for struvite production. J. Recycl. Org. Waste Agric. 2014, 3, 49. [Google Scholar] [CrossRef] [Green Version]
  36. Jiang, D.; Yoshimasa, A.; Motoi, M. Removal and recovery of phosphate from water by calcium-silicate composites-novel adsorbents made from waste glass and shells. J. Environ. Sci. Pollut. Res. 2017, 24, 8210–8218. [Google Scholar] [CrossRef]
  37. Du, J.; Bao, J.; Hassan, M.A.; Irshad, S.; Talib, M.A.; Zhang, H. Efficient capture of phosphate and cadmium using Biochar with multifunctional amino and carboxylic moieties: Kinetics and mechanism. J. Water Air Soil. Pollut. 2020, 231, 25. [Google Scholar]
  38. Rafeah, W.; Zainab, N.; Veronica, U. Removal of mercury, lead, and copper from aqueous solution by activated carbon of palm oil empty fruit bunch. J. World Appl. Sci. 2009, 5, 84–91. [Google Scholar]
  39. Zheng, J. Influencing factors and application of nitrogen and phosphorus removal by struvite method. J. Urban Roads Bridge Flood Cont. 2009, 5, 254–257. [Google Scholar]
  40. Gadekar, S.; Pullammanappallil, P. Validation and applications of a chemical equilibrium model for struvite precipitation. Environ. Model. Assess 2010, 15, 201–209. [Google Scholar] [CrossRef]
  41. Booker, N.A.; Priestley, A.J.; Fraser, I.H. Struvite formation in wastewater treatment plants: Opportunities for nutrient recovery. J. Environ. Technol. 1999, 20, 777–782. [Google Scholar] [CrossRef]
  42. Doyle, J.D.; Parsons, S.A. Struvite formation, control, and recovery. J. Water Res. 2002, 36, 3925–3940. [Google Scholar] [CrossRef]
  43. Stumm, W.; Morgan, J.J. Aquatic Chemistry; Wiley-Inter Science: New York, NY, USA, 1970; p. 583. [Google Scholar]
  44. Arge, E.; Bruaset, A.; Langtangen, H.P. Modern Software Tools for Scientific Computing; Springer Science & Business Media: Berlin/Heidelberg, Germany, 1997. [Google Scholar]
  45. Kolaczyk, E.D.; Csárdi, G. Statistical Analysis of Network Data with R; Springer: New York, NY, USA, 2014; p. 65. [Google Scholar]
  46. Kubar, A.A.; Qing, H.; Sajjad, M.; Chen, Y.; Lian, F.; Wang, J.; Kubar, A.A. Recovery of phosphate and ammonium from the biogas slurry as value-added fertilizer by biochar and struvite co-precipitation. J. Sustain. 2021, 7, 3827. [Google Scholar] [CrossRef]
  47. Asada, T.; Ishihara, S.; Yamane, T.; Toba, A.; Yamada, A.; Oikawa, K. Science of bamboo charcoal: Study on carbonizing temperature of bamboo charcoal and removal capability of harmful gases. J. Health Sci. 2002, 48, 473–479. [Google Scholar] [CrossRef] [Green Version]
  48. Taghizadeh-Toosi, A.; Clough, T.J.; Sherlock, R.R.; Condron, L.M. A wood based low-temperature biochar captures NH3 –N generated from ruminant urine-N, retaining its bioavailability. Plant Soil. 2012, 353, 73–84. [Google Scholar] [CrossRef]
  49. Sajjad, M.; Sardar, K.; Shams, A.B.; Saduf, M.; Alia, N.; Sheikh, S.A.; Anwarzeb, K. Removal of potentially toxic elements from aqueous solutions and industrial wastewater using activated carbon. J. Water Sci. Technol. 2017, 75, 2571–2579. [Google Scholar] [CrossRef] [Green Version]
  50. Zheng, M.; Xie, T.; Li, J.; Xu, K.; Wang, C. Biochar as a Carrier of Struvite Precipitation for Nitrogen and Phosphorus Recovery from Urine. J. Environ. Eng. 2018, 144, 2018. [Google Scholar] [CrossRef]
  51. Spokas, K.A.; Novak, J.M.; Venterea, R.T. Biochar’s role as an alternative N-fertilizer: Ammonia capture. Plant Soil. 2012, 350, 35–42. [Google Scholar] [CrossRef]
  52. Huang, H.; Xiao, X.; Yang, L.; Pan, B. Removal of ammonium from rare-earth wastewater using natural brucite as a magnesium source of struvite precipitation. Water Sci. Technol. 2011, 63, 468–474. [Google Scholar] [CrossRef]
  53. Türker, M.; Çelen, I. Removal of ammonia as struvite from anaerobic digester effluents and recycling of magnesium and phosphate. Bioresour. Technol. 2007, 8, 1529–1534. [Google Scholar] [CrossRef]
  54. Bhargava, D.; Sheldarkar, S. Use of TNSAC in phosphate adsorption studies and relationships. Effects of adsorption operating variables and related relationships. Water Res. 1993, 27, 313–324. [Google Scholar] [CrossRef]
  55. Kobya, M.; Demirbas, E.; Bayramoglu, M. Modeling the effects of adsorbent dose and particle size on the adsorption of Cr (VI) ions from aqueous solutions. J. Adsorp. Sci. Technol. 2004, 22, 583–594. [Google Scholar] [CrossRef]
  56. Kara, S.; Aydiner, C.; Demirbas, E.; Kobya, M.; Dizge, N. Modeling the effects of adsorbent dose and particle size on the adsorption of reactive textile dyes by fly ash. J. Desalination 2007, 212, 282–293. [Google Scholar] [CrossRef]
  57. Taubner, S.; Klasenand, J.; Munder, T. Why do psychotherapists participate in psychotherapy research and why not? results of the attitudes to psychotherapy research questionnaire with a sample of experienced German psychotherapists. J. Psychol. Res. 2016, 26, 318–331. [Google Scholar] [CrossRef] [PubMed]
  58. Sun, L.; Geng, Y.; Sarkis, J.; Yang, M.; Xi, F.; Zhang, Y.; Xue, B.; Luo, Q.; Renand, W.; Bao, T. Measurement of polycyclic aromatic hydrocarbons (PAHs) in a Chinese brown field re development site: The case of Shenyang. J. Ecol. Eng. 2013, 53, 115–119. [Google Scholar] [CrossRef]
  59. Abdi, H.; Williams, L.J. Principal component analysis. Wiley Interdiscip. J. Rev. Comput. Statain. 2002, 2, 433–459. [Google Scholar] [CrossRef]
  60. Li, X.; Li, P.; Wangand, D.; Wang, Y. Assessment of temporal and spatial variations in water quality using multivariate statistical methods: A case study of the Xin’anjiang river, China. J. Front Environ. Sci. Eng. 2014, 8, 895–904. [Google Scholar] [CrossRef]
  61. Li, X.; Feng, J.; Wellenand, C.; Wang, Y. A Bayesian approach of high impaired river reaches identification and total nitrogen load estimation in a sparsely monitored basin. J. Environ. Sci. Pollut. Res. Int. 2017, 24, 987–996. [Google Scholar] [CrossRef]
  62. Petr, P. Principal component weighted index for wastewater quality monitoring. J. Water. 2019, 11, 2376. [Google Scholar]
  63. Sial, M.H.; Awan, M.S.; Waqas, M. Role of institutional credit on agricultural production: A time series analysis of Pakistan. J. Econ. Fin. 2011, 3, 126. [Google Scholar] [CrossRef] [Green Version]
  64. Hussain, A. Impact of credit disbursement, area under cultivation, fertilizer consumption and water availability on rice production in Pakistan (1988–2010). Sarhad J. Agric. 2012, 28, 95–101. [Google Scholar]
  65. Faridi, M.Z.; Chaudhry, M.O.; Tahir, N. Institutional credit and agricultural productivity an evidence from Pakistan. J. Life 2015, 13, 183–188. [Google Scholar]
  66. Chandio, A.A.; Jiang, Y.; Joyo, M.A.; Rehman, A. Impact of area under cultivation, water availability, credit disbursement, and fertilizer off-take on wheat production in Pakistan. J. Appl. Environ. Biol. Sci. 2016, 6, 10–18. [Google Scholar]
  67. Rehman, A.; Chandio, A.A.; Hussain, I.; Jingdong, L. Fertilizer consumption, water availability and credit distribution: Major factors affecting agricultural productivity in Pakistan. J. Saudi Soc. Agric. Sci. 2019, 18, 269–274. [Google Scholar] [CrossRef]
  68. Zhang, H.; Schroder, J.L.; Fuhrman, J.K.; Basta, N.T.; Storm, D.E.; Payton, M.E. Path and multiple regression analyses of phosphorus sorption capacity. J. Soil. Sci. Soci. Am. 2005, 69, 96. [Google Scholar] [CrossRef]
  69. Dodor, D.E.; Oya, K. Phosphate sorption characteristics of major soils in Okinawa, Japan. J. Commun. Soil Sci. Plant Anal. 2000, 31, 277–288. [Google Scholar] [CrossRef]
  70. Singh, B.B.; Tabatabai, M.A. Effects of soil properties on phosphate sorption. J. Commun. Soil. Sci. Plant Anal. 1977, 8, 97–107. [Google Scholar] [CrossRef]
  71. Sanyal, S.K.; Datta, D.S.K.; Chan, P.Y. Phosphate sorption desorption behavior of some acidic soils of south and southeast Asia. J. Soil Sci. Soc. Am. 1993, 57, 937–945. [Google Scholar] [CrossRef]
  72. Borling, K.; Ottabong, E.; Barberis, E. Phosphorus sorption in relation to soil properties in some cultivated Swedish soils. J. Nutr. Cycl. Agro Ecosyst. 2001, 59, 39–46. [Google Scholar] [CrossRef]
  73. Loeppert, R.L.; Inskeep, W.P. Iron methods of soil analysis. In Part 3. SSSA Book Ser. 5.; Sparks, D.L., Ed.; ASA and SSSA: Madison, WI, USA, 1996; pp. 639–664. [Google Scholar]
  74. Schoumans, O.F. Determination of the degree of phosphateorus in non-calcareous soil. In Methods of Phosphorus Analysis for Soils, Sediments, Residuals, and Waters. Bull. No. 369. Southern Extension Research Activity-Information Exchange Group (SERA-IEG-17); Pierzynski, G.M., Ed.; Kansas State University: Manhattan, KS, USA, 2000; pp. 31–34. [Google Scholar]
  75. Kleinman, P.J.A.; Sharpley, A.N. Estimating phosphorus sorption saturation from Mehlich-3 data. J. Commun. Soil. Sci. Plant Anal. 2002, 33, 1825–1839. [Google Scholar] [CrossRef]
  76. Wang, B.; Lehmann, J.; Hanley, K.; Hestrin, R.; Enders, A. Adsorption and desorption of ammonium by maple wood biochar as a function of oxidation and pH. J. Chemosphere 2015, 138, 120–126. [Google Scholar] [CrossRef] [PubMed] [Green Version]
  77. Li, S.; Zhou, Y.; Zhao, Y.; Li, W.; Song, W.; Miao, Z. Avian influenza H9N2 sero prevalence among pig population and pig farm staff in Shandong, China. J. Virol. 2015, 121, 34–40. [Google Scholar] [CrossRef] [PubMed] [Green Version]
  78. Petersen, D.; Blazewicz, S.; Firestone, M.; Herman, D.; Turetsky, M.; Waldrop, M. Abundance of microbial genes associated with nitrogen cycling as indices of biogeochemical process rates across a vegetation gradient in Alaska. J. Environ. Microb. 2012, 14, 993–1008. [Google Scholar] [CrossRef]
  79. Zhi, W.; Ji, G. Quantitative response relationships between nitrogen transformation rates and nitrogen functional genes in a tidal flow constructed wetland under C/N ratio constraints. J. Water Res. 2014, 64, 32–41. [Google Scholar] [CrossRef] [PubMed]
  80. Haloi, N.; Sarma, H.P. Heavy metal contaminations in the groundwater of Brahmaputra flood plain: An assessment of water quality in Barpeta district, Assam (India). J. Environ. Moni Assess 2012, 184, 6229–6237. [Google Scholar] [CrossRef]
  81. Mansouri, B.; Salehi, J.; Etebari, B.; Moghaddam, H.K. Metal concentrations in the groundwater in Birjand flood plain, Iran. J. Bull. Environ. Toxi 2012, 89, 138–142. [Google Scholar] [CrossRef] [PubMed]
  82. Ayadi, A.; David, P.; Arrighi, J.F.; Chiarenza, S.; Thibaud, M.C.; Nussaume, L.; Marin, E. Reducing the genetic redundancy of Arabidopsis phosphate transporter1 transporters to study phosphate uptake and signaling. J. Plant Phys. 2015, 167, 1511–1526. [Google Scholar] [CrossRef] [Green Version]
  83. Jaimie, B.P.; Miller, A.C.V.; Alison, B. Uncoupling growth from phosphorus uptake in Lemna: Implications for use of duckweed in wastewater remediation and P recovery in temperate climates. J. Food Eng. Secur. 2020, 9, 244. [Google Scholar]
  84. Adoonsook, D.; Chia, Y.C.; Wongrueng, A.; Pumas, C. A simple way to improve a conventional A/O-MBR for high simultaneous carbon and nutrient removal from synthetic municipal wastewater. PLoS ONE 2019, 14, e0214976. [Google Scholar] [CrossRef]
Figure 1. (a) Principal component analysis (PCA) of phosphate and ammonium concentration, and the removal effect of different biochars; (b) phosphate and ammonium concentration, and the removal effect of different pyrolysis temperatures; (c) phosphate different element concentration; (d) phosphate different removal; (e) ammonium different element concentration; (f) ammonium different element removal.
Sustainability 14 05617 g001aSustainability 14 05617 g001bSustainability 14 05617 g001cSustainability 14 05617 g001d
Figure 2. (a) Relationship of ammonium concentration with ammonium removal efficiency under different elemental concentrations, (b) phosphate concentration with phosphate removal efficiency under the biochar effect; (c) ammonium concentration with ammonium removal efficiency under pyrolysis temperature; (d) phosphate concentration with phosphate removal efficiency under pyrolysis temperature; (e) ammonium concentration with ammonium removal efficiency under different elemental concentrations; (f) phosphate concentration with phosphate removal efficiency under different elemental concentrations. The number of replications is (n = 3).
Sustainability 14 05617 g002aSustainability 14 05617 g002b
Figure 3. The key route main path of removal: (a) phosphate removal, (b) ammonium removal.
Sustainability 14 05617 g003
Table 1. Pearson correlation under ammonium concentration.
Ca2+Zn2+Cu2+Fe3+Fe2+CO32−HCO3K+SO42−
Ca2+1−0.476 *−0.822 **−0.484 *−0.643 **−0.618 **−0.546 *−0.377−0.593 **
Zn2+−0.476 *10.849 **0.966 **0.915 **0.936 **0.968 **0.982 **0.362
Cu2+−0.822 **0.849 **10.855 **0.924 **0.905 **0.864 **0.798 **0.13
Fe3+−0.484 *0.966 **0.855 **10.959 **0.881 **0.920 **0.983 **0.347
Fe2+−0.643 **0.915 **0.924 **0.959 **10.892 **0.912 **0.913 **−0.116
CO320.618 **0.936 **0.905 **0.881 **0.892 **10.964 **0.879 **−0.113
HCO3−0.546 *0.968 **0.864 *0.920 *0.912 **0.964 **10.926 **−0.217
K+−0.3770.982 **0.798 **0.983 **0.913 **0.879 **0.926 *1−0.466
SO42−0.593 **−0.3620.13−0.347−0.116−0.113−0.217−0.4661
* Correlation is significant at the 0.05 level (two-tailed). ** Correlation is significant at the 0.01 level (two-tailed).
Table 2. Pearson correlation under ammonium removal efficiency.
Ca2+Zn2+Cu2+Fe3+Fe2+CO32−HCO3K+SO42−
Ca2+10.900 **0.980 **0.973 **0.947 **0.989 **0.987 **0.980 **0.987 **
Zn2+0.900 **10.948 **0.955 **0.962 **0.939 **0.943 **0.950 **0.938 **
Cu2+0.980 **0.948 **10.999 **0.990 **0.998 **0.998 **1.000 **0.998 **
Fe3+0.973 **0.955 **0.999 **10.994 **0.995 **0.996 **0.999 **0.997 **
Fe2+0.947 **0.962 **0.990 **0.994 **10.981 **0.984 **0.990 **0.985 **
CO32−0.989 **0.939 **0.998 **0.995 **0.981 **11.000 **0.998 **0.998 **
HCO30.987 **0.943 **0.998 **0.996 **0.984 **1.000 **10.999 **0.998 **
K+0.980 **0.950 **1.000 **0.999 **0.990 **0.998 **0.999 **10.998 **
SO42−0.987 **0.938 **0.998 **0.997 **0.985 **0.998 **0.998 **0.998 **1
** Correlation is significant at the 0.01 level (two-tailed).
Table 3. Pearson correlation under phosphate removal concentration.
Ca2+Zn2+Cu2+Fe3+Fe2+CO32−HCO3K+SO42−
Ca2+11.000 **0.528 *−0.3850.981 **0.964 **0.972 **0.998 **0.994 **
Zn2+1.000 **10.528 *−0.3850.981 **0.964 **0.972 **0.998 **0.994 **
Cu2+0.528 *0.528 *10.581 *0.586 *0.551 *0.564 *0.523 *0.543 *
Fe3+−0.385−0.3850.581 *1−0.303−0.3250.319−0.3870.362
Fe2+0.981 **0.981 **0.586 *−0.30310.993 **0.990 **0.989 **0.994 **
CO32−0.964 **0.964 **0.551 *−0.3250.993 **10.992 **0.977 **0.983 **
HCO30.972 **0.972 **0.564 *−0.3190.990 **0.992 **10.980 **0.986 **
K+0.998 *0.998 **0.523 *−0.3870.989 **0.977 **0.980 **10.999 **
SO42−0.994 **0.994 **0.543 *−0.3620.994 **0.983 **0.986 **0.999 **1
** Correlation is significant at the 0.01 level. * Correlation is significant at the 0.05 level.
Table 4. Pearson correlation under phosphate removal efficiency.
Ca2+Zn2+Cu2+Fe3+Fe2+CO32−HCO3K+SO42−
Ca2+10.99 *0.97 *0.98 *0.98 *0.96 *0.97 *0.99 *0.99 *
Zn2+0.99 *10.97 *0.980.98 *0.96 *0.97 *0.99 *0.99 *
Cu2+0.97 *0.97 *10.97 *0.97 *0.96 *0.96 *0.97 *0.97 *
Fe3+0.98 *0.98 *0.97 *10.99 *0.98 *0.98 *0.99 *0.99 *
Fe2+0.98 *0.98 *0.97 *0.99 *10.99 *0.99 *0.98 *0.99 *
CO32−0.96 *0.96 *0.96 *0.98 *0.9910.99 *0.97 *0.98 *
HCO30.97 *0.97 *0.96 *0.98 *0.99 *0.99 *10.98 *0.98 *
K+0.99 *0.99 *0.97 *0.99 *0.98 *0.97 *0.98 *10.99 *
SO42−0.99 *0.99 *0.97 *0.99 *0.99 *0.98 *0.98 *0.99 *1
* Correlation is significant at the 0.05 level.
Publisher’s Note: MDPI stays neutral with regard to jurisdictional claims in published maps and institutional affiliations.