Abstract
Responding to the events surrounding the COVID-19 pandemic, this study explores how to improve health and wellbeing and reduce infections in outdoor open spaces on university campuses to maximize their potential as a response to future crises. The study identifies the relationship between human behavior (social) and the various physical and environmental elements of these spaces. A case study and mixed-methods approach were undertaken, comprising four modes of inspection: user analysis layer using questionnaires and observations to survey students’ needs and behavior; context analysis layer using space syntax and CFD to examine the space’s physical and environmental conditions; design solutions reflecting an understanding of virus transmission; and a performance analysis layer to test the performance of ‘anti-virus’ courtyards. The findings demonstrated that students are willing to use the open spaces that they used before the pandemic, at the same frequency. This indicates a need to redesign the current spaces to prevent the spread of viruses. The study highlights the social, physical, and environmental implications to be considered in designs for outdoor anti-virus spaces. It provides a comprehensive process for transforming outdoor spaces on university campuses into anti-virus spaces that meet users’ needs. These findings have implications for the designing and retrofitting of open spaces to reduce infection.
1. Introduction
Today’s universities must be resilient places in which the learning environment includes more than the latest technological and academic buildings. Rather, the entire campus, including its outdoor spaces, should be perceived as a learning environment offering a holistic learning experience for students [1]. Universities are increasingly interested in becoming greener and better managing their campuses [2,3]. Well-designed green urban spaces that incorporate eco-friendly infrastructure may be useful for addressing urban climate change concerns. However, many of the discussions about climate change were put on hold in 2020 [4], when the emergence of COVID-19 put the world on high alert. The pandemic has affected human and public health and redefined sustainability priorities and decision-making [5,6]. There is a large body of literature on factors that affect the spread of viruses in indoor environments [7] and in the urban context in general [8,9,10]. However, whilst universities are considered hot spots for virus spreading—due to the large numbers of people passing through these spaces, and the critical age group of this community and their attachment to social gatherings [11]—few studies have explored the adjustments that can be implemented on universities campuses.
1.1. Outdoor Open Spaces on Universities Campuses
Outdoor open spaces are important for sustainable universities because they accommodate outdoor activities and enhance the campus’s livability and vitality. The character of the outdoor space determines the quality of the campus [11,12]. Students’ success is aided by access to outdoor environments just as much as it is by on-campus amenities, such as the libraries, cafeterias, or university squares [13]. As such, designers and planners should consider outdoor spaces on university campuses to improve first impressions and create a holistic learning environment.
Various studies have proposed ways of improving outdoor spaces in universities to enhance comfort [14,15] and encourage students’ use of them for study, relaxation, contemplation, socialization, and entertainment [16]. These design strategies have placed emphasis on outdoor space layout [17]; location [18]; circulation and walking distance [19]; slope [20]; site furniture and seating [21]; shading [22]; and greenery and vegetation [23,24,25,26]. Studies have demonstrated the social value of public gathering spaces [15,27] and suggested ways of accommodating community belonging in courtyard spaces in universities by providing for users’ needs and preferences [13,28]. Researchers have developed frameworks for enhancing informal learning in these spaces [29,30]. Previous studies have largely discussed the principles of planning and elements of courtyard spaces on campuses, focusing on comfort, with little research [17,31] to address the elements of healthy open spaces and no guidelines for creating healthy, anti-virus open spaces.
The restrictions imposed to meet the threat of COVID-19 have highlighted the importance of outdoor communication and activities. Courtyard spaces are one of the most common outdoor open spaces on university campuses [28]. These spaces serve the needs of their users by providing scenery, as well as pleasing views for the buildings by which they are surrounded [17]. They also enable accessibility and freedom to engage in activities, contribute to strengthening interpersonal relationships, and improve the quality of university life [16]. This study discusses how to improve health and wellbeing and reduce infections in courtyard outdoor spaces in universities, with the goal of maximizing their potential as an anti-virus built environment to respond to future crises. This study also aims to explore students’ preferences and needs with regard to health and wellbeing and contribute to efforts to limit the spread of diseases by promoting healthy, open courtyard spaces.
1.2. Factors Affecting the Spread of Viruses in Open Spaces
Infectious disease transmission occurs in four major ways: direct contact, indirect contact, droplet transmission, and airborne transmission [32]. COVID-19 virus is being transferred between people via respiratory droplets and contact pathways, according to current evidence [33]. Airborne transmission of coronavirus may be possible in specific circumstances and settings [34]. The following sections explain the factors that contribute to the spread of viruses in the campus setting (Table 1).

Table 1.
Summary of key factors (social, physical, and environmental) that affect the spread of viruses in public open spaces.
1.2.1. Social Factors: Student Behavior and Attitudes
In general, urbanized areas in which societal interactions are concentrated generate favorable conditions for crowd diseases to spread. The novel coronavirus, for example, is a respiratory illness mainly transmitted via close person-to-person contact and through the respiratory droplets produced by the infected person when they cough, sneeze, or speak [34]. Controls to minimize infection rates have included ensuring distance is kept between people at all times (social distancing), mandating the wearing of personal protective equipment (PPE) [35,36,37,38]. The World Health Organization (WHO) has recommended the maintenance of an interpersonal distance of 1.5 m to 2 m to minimize the risk of infection. However, research supports the hypothesis of virus transmission over 2 m distance from an infected person [39,40]. The demand for social distancing could have implications for the design and planning of our spaces, not least due to increasing acceptance of distance learning, online shopping, and online connection [41]. User density can be significantly influenced by an open space layout, but social distancing should not be implemented without further research into capacity control, as well as user behavior observations and behavior modelling.
1.2.2. Physical Factors: The Built Environment
The link between COVID-19 frequency and urban design features remains a matter of debate, and the present data do not provide much clarity on how different design parameters influence infection rates [42]. One study in Poland found that an increase in population concentration was associated with a rise in COVID-19 transmission and mortality rates [43]. The availability of open green spaces in areas of high population density appears to be particularly important [44]. Another recent study found that the smaller the area of green space in a city, the higher the confirmed number of infections [33]. It can thus be assumed that urban green spaces divide urban areas and reduce population density, thereby reducing the population’s infection rate. Moreover, a study conducted in the United States concluded that a higher ratio of green spaces was linked with lower racial disparities in COVID-19 infection rates [8]. Furthermore, evidence suggests that a decentralized network of smaller green spaces—as opposed to a centralized space—makes it easier for users to interact with nature, improving physical and psychological wellbeing [45]. A decentralization strategy may foster horizontal expansion, necessitating a re-examination of planning theories to facilitate sustainable development and sufficient urban design [46]. However, the early findings suggest that planners should continue to advocate for compact patterns of urban expansion over sprawling alternatives, as several additional benefits of compact urban development are supported in studies [47,48,49]. The report on cities and pandemics states that public space assessments and programs are needed to support the creation of more equitably distributed public spaces. Moreover, flexibility and adaptability in the use of public spaces are crucial, particularly during a pandemic when public spaces must rapidly accommodate new needs [50]. The urban design elements can also contribute to the decrease of the virus spread—for example, flat surfaces may collect less dust, whilst white or light-colored surfaces may show dust clearly [41]. Even before COVID-19, there was growing attention and had been major advances in the use of smart solutions, to enhance the efficiency of urban operations and improve quality of life. This pandemic is now expected to boost smart city concepts [51]. Smart cities—and indeed smart university campuses—can use software applications to identify risk and gather information about the potential transmission of infectious diseases. These ICT solutions also have benefits for sustainability, as they reduce the need for reliance on other resources [52].
1.2.3. Environmental Factors
Virus survival is affected by several environmental conditions, include temperature, relative humidity (RHs), virus type (lipid or non-lipid), the presence of organic matter (e.g., saliva and mucus), and sunlight (ultraviolet light) [53]. Pollution also contributes to virus transmission [54,55]. Some experts believe that temperature and humidity are the most important drivers of airborne respiratory virus survival [56,57]. Virus survival decreases as temperatures rise [53]. The survival rate (half-life) of SARS-CoV-2 at 20 °C is higher than that at 40 °C [58]. Survival rates for viruses are higher in both low (10–40%) and high (60–100%) RHs compared to moderate RHs (40–60%) [59,60]. In general, viruses with lipid envelops types such as influenza and coronaviruses, will tend to survive longer at lower RHs (20–30%) [61]. The high air temperatures combined with high relative humidity levels have a synergistic impact on the inactivation of SARS-CoV-2 viability, while low temperature and low humidity promote the virus’s extended life on contaminated surfaces [62]. Based on examining the COVID-19 data and metrological data from official sources, it was found that each 1 °C increase in temperature was associated with a 4.8% decrease in confirmed daily cases [63]. However, several other studies argue that either there is no correlation between temperatures and COVID-19 cases, or temperature rise is associated with an increase in rates of transmission. For example, the spread rate of COVID-19 is not sensitive to ambient temperature variations in Iranian cities [64]. Other studies identified a positive relationship between COVID-19 spread and high temperatures in Milan, Oslo, and Jakarta, respectively [65,66,67]. In addition, it was also found that drier air favors the transmission of the virus [67]. Studies from Africa and the United States, as well as a global study of 100 countries, all found no significant relationship between humidity and COVID-19 transmission [68,69]. Sunlight is known to play a role in virus survival. Recent research findings have shown that dim light conditions help the virus to survive [70]. The UVB levels representative of natural sunlight quickly deactivate SARS-CoV-2 on surfaces, particularly on stainless steel surfaces [71]. Turning to other thermal parameters, further research is needed in relation to the impact of air movement, as the spread of viruses known to be associated with air pollution concentration and distribution. The literature shows that the distribution of air pollution through air movement can have both positive and negative effects on the rate of infection, depending on the studied area. A significant positive correlation with increased air movement was found, where a 1% increase in average air speed causes an 11.21% increase in COVID-19 cases in African countries [68]. However, a significant negative correlation with air movement and COVID-19 was found, where an increase in air speed was associated with decreased incidence of COVID-19 [72,73]. As has been established, air pollution strongly exacerbates the impact of illness on humans, and air stagnation is directly associated with elevated concentration of air pollution, specifically particle matter 2.5 μm (PM2.5) [74,75,76]. Whilst an increase in PM2.5 of 41.9% during episodes of stagnant air compared with non-stagnant air days, was reported [77], a low wind speeds were strongly correlated with elevated pollution concentration, in the southern part of the United States [75]. This establishes air stagnation as a threat, when dealing with the spread of viruses. In some contexts, COVID-19 cases and deaths are strongly linked with high levels of air pollution. Studies show that long-term exposure to air pollution can affect the respiratory system and increase human vulnerability [54,55]. For example, studies from different Italian regions show greater virus transmission in northern regions characterized by higher levels of air pollution [55,78]. Results from a large-scale study conducted in the Netherlands indicate that a 1 μ/m3 increase in PM2.5 concentrations is associated with 9.4 times more COVID-19 cases, 3.0 more hospital admissions, and 2.3 more deaths [79]. Hence, improvement in air quality could be a weapon in the fight against COVID-19 (and other pandemics). ‘Particular matter’ (PM) is a common term of air pollution. It has the greatest impact on individuals of any contaminant. Nitrates, sulfate, ammonia, sodium chloride, black carbon, mineral dust, and water are the primary constituents of PM. It is made up of a complex combination of organic and inorganic solid and liquid particles floating in air. While particles with a diameter of 10 microns or less can penetrate deep into the lungs, particles with a diameter of 2.5 microns or less are considerably more harmful to one’s health. PM2.5 has the ability to cross the lung barrier and enter the bloodstream [80].
1.3. Transforming University Courtyard Spaces into Healthy, Disease-Free, and Anti-Virus Environments
Can university courtyard spaces be formed or reshaped to become disease-free, anti-virus environments that enhance the wellbeing of students? As noted above, the impact of urban environments on human health can be serious. One’s physical surroundings interact with environmental and social factors—promoting sustainability and health or exacerbating illness and disease. The characteristics of built environments vary within urban context, and new design guidelines for the open spaces in universities could be developed to increase health, health equity, and environmental sustainability. This research looks at the impact of the urban settings of university campus courtyards, focusing on the health and wellbeing of the students who use them. For this purpose, a case study campus is used. The investigation is intended to support the development of a model for public health spaces and strengthen support for planning that promotes urban health across university campuses. Table 2 illustrates the factors that affect the design of healthy, anti-virus open spaces in universities, and categorizes these according to their impact on virus transmission based on previous literature.

Table 2.
Factors affect outdoor courtyard components and their impact on the spread of viruses.
This study will focus on the relationship between outdoor courtyard design and the spread of viruses. The factors under study include air pollution (stagnant air locations), green cover, decentralization, and social distancing. The study also considers the impact of students’ needs and behavior. It tests these factors on a case study campus to generate a framework for the responsible design of anti-virus outdoor open space in universities.
2. Materials and Methods
This section details the design and methods of this study. To cross-reference the theories examined in the literature review, a case study approach was adopted. Multi-layered and triangulated quantitative and qualitative methods were used. The main outdoor courtyard space at Al-Ahliyya Amman University (AAU), Jordan, was used as a case study (Figure 1). A user analysis layer was developed to survey the students’ needs, behaviors, and attitudes, with a questionnaire and observations to investigate the relevant social factors. A context analysis layer was applied, incorporating space syntax (spatial analysis) to explore the physical conditions (urban layout and physical conditions), and a computational fluid dynamic (CFD) was used to examine the environmental conditions (outdoor thermal and air quality conditions), with a focus on stagnant air locations. Design solutions were developed by triangulating the anti-virus social, physical, and environmental factors. A performance analysis layer using CFD and space syntax was applied to test the performance of design alternatives and identify the optimal alternatives for anti-virus courtyards. Finally, a preference analysis layer using graphical modeled images as stimulus material was employed to capture the students’ preferences and perceptions.
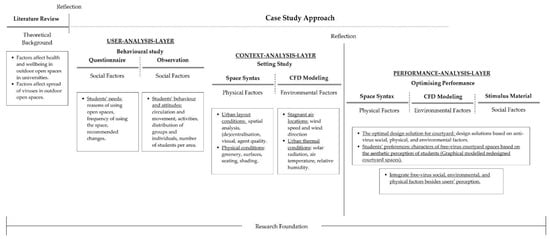
Figure 1.
The study methods and research flow.
2.1. Study Area
A previous study of AAU students’ preferences for open spaces identified the ‘Architecture-Engineering’ courtyard as the most favored open space in the university, cited by 67% of the study participants [11]. As such, this major open courtyard space was selected as the representative study site for the current study (Figure 2). This courtyard is the most densely populated on the AAU campus. It is located in a Mediterranean climate region, north-west of the campus, and covers a total area of 2048 m2. Of the coverage, 2% is palm trees, 8.5% shading structure, and 3.7% benches along the edges. The courtyard can accommodate up to 2682 students per day from 8:30 to 17:30, Sunday to Friday. It covers an open space, enclosed on three sides (two buildings of five floors, and kiosks of one floor on one side). The courtyard has four main axial entries (accesses): one access point on the axis of the campus zone (space ‘CA’), the architecture faculty access (space ‘AA’), the engineering faculty access (space ‘EA’), and the west parking (space ‘PA’).
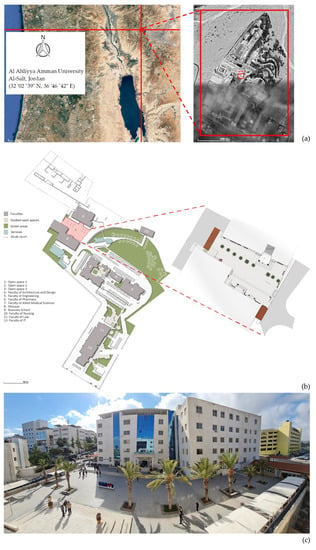
Figure 2.
Site location and study area: (a) site location, (b) university campus and study courtyard, and (c) panoramic view of the courtyard.
2.2. Methods
2.2.1. Questionnaire
The questionnaire was disseminated during the online teaching period (March to April 2021). At that time, the students had spent approximately one year away from the university campus. The objective of the questionnaire was to obtain the students’ insights on their campus and investigate the effect of their being away from the campus, whether this had affected their point of view regarding the meaning of and need for open spaces, and whether their preferences and behavior were likely to remain affected even after the pandemic. In addition, the students were encouraged to criticize the courtyard features as ‘clients’ with the right to demand improvements in response to their environmental and sustainability concerns. The target group’s feedback of 224 respondents was taken on board to ensure that their requirements are considered in the improvement plans. A preliminary set of 11 questions was prepared and categorized into three groups: (1) student profile, (2) the use of university outdoor open spaces before COVID-19, and (3) the use of university open spaces post-COVID-19. The students were asked to respond to a series of multiple-choice questions. A reflection section was added at the end of the survey to gather insights from the students about their courtyard experiences and desires for post-COVID-19 changes (Table 3).

Table 3.
Dimensions and items of the questionnaire.
2.2.2. Observation
Observation is an important research method used in social sciences for diverse purposes. There are several types, techniques, and approaches. As such, the choice must be adapted to the research problem and scientific context [81]. In this paper, an indirect observation approach was adopted. This allows a researcher to obtain information about the situation without participating in the event—using a hidden camera or a voice recorder, for example. It involves unobtrusive or non-invasive methods, and the researcher only has a limited impact on the situation, as the participants are largely unaware that the observations are taking place. The authors of [82] note several types of measures used in the observation of humans in public spaces: counting, tracing, looking for traces, mapping, photographing, test walks, and keeping a diary. Mapping and photographing measures were best suited to the objectives of this study. ‘Mapping’ involves the observation of the subjects’ locations in a space. This provides essential information about where people choose to be (on the edges, in the middle, or distributed in the space). This type of investigation is usually conducted over an extended period of time, allowing the researcher to compare seasons or different times of the day or week. Sample pictures are thus registered in fixed, repeated moments of time. The students in this study were mapped and photographed over a period of 2 weeks during the first semester of 2021/2022, on both sunny and rainy days. This was the first in-person teaching semester since the COVID-19 lockdown. The observations were conducted by human subjects, three times per day, on all weekdays (9:00–11:00, 11:00–14:00, and 14:00–17:00). Two types of activities were distinguished: ‘dynamic’ activities, such as walking and running or exercising, and ‘static’ activities, such as sitting and standing. The results are presented in the form of graph-based descriptors.
2.2.3. Space Syntax: Agent Analysis
To predict congestion, pedestrian traffic, and crowd control—and assess the social and economic aspects of buildings and urban layouts—it is crucial to understand how pedestrians move in their environments [83]. Space syntax is a network analysis model used to investigate global and local urban grids, and it includes techniques for observing movement within a network [84]. An agent-based model is a simulation of personal movement behavior in the area of spatial syntax in which ‘agents’ pick their direction of travel based on a defined visual field and have access to pre-computed data about what is visible from any given location on the map [83]. Space syntax theory is used to split spaces into components by measuring individual straight-sight lines, thus helping to analyze and quantify pedestrian flow [85]. The agent analysis tool used in this investigation was Depthmap 10.14. The software was used to acquire a better understanding of the cognitive basis of natural movement and explain pedestrian navigation, way-finding, and concentration. A CAD plan of the existing courtyard was imported into Depthmap. The software can divide any given plan into a grid, of which the size can be determined by the user. The user then generates and examines the connections between different point locations at the center of each grid. An agent analysis graph was generated for the courtyard. Based on an analysis of the existing case, recommendations were made and new design alternatives for the courtyard were examined using the agent analysis tool in Depthmap. In all graphs, red is used to indicate the highest value of agent concentration, and blue represents the lowest.
2.2.4. Computational Fluid Dynamics (CFD)
The site was modeled throughout the year (with an emphasis on 15 March, 15 June, 15 September, and 15 December) to investigate the stagnant air locations in the courtyard. Air temperatures, relative humidity, and shadow patterns were also simulated. ENVI-met, a CFD modeling software, was used to calculate and analyze thermal conditions and air movement (and other parameters) in urban spaces. ENVI-met uses the non-hydrostatic incompressible Navier–Stokes equations to measure the wind flow behavior [86]. ENVI-met has been shown to accurately calculate wind interactions in built environments [87,88,89]. The analysis used data assuming a human height of 1.6 m, with emphasis on the critical areas where wind speed was below 0.2 m/s. Table 4 shows the outer-boundary conditions extracted from Meteonorm for each month. The wind direction is given in degrees, denoting north as 0 degrees and south as 180 degrees clockwise.

Table 4.
Wind speed and wind direction at the outer boundaries during the four seasons.
2.2.5. Stimulus Material
In the final stage of the research, to ensure that the social, environmental, and physical factors were considered alongside the users’ preferences, stimulus material was used to investigate the students’ views of the proposed designs. This layer was key to ensuring community participation in the improvement process of the courtyard design. A focus group of 100 students participated in the study. The respondents were randomly selected from the group who had participated in the questionnaire phase (the first stage of the research) and were willing to participate again in this stage. The experiment included a set of three-dimensional, graphically modelled images of the real courtyard and the proposed courtyard design reflecting the anti-virus strategies. Data were collected via an online survey comprising four sections: general personal questions; overall rankings of the proposed design cases; the reasons for this selection, including functional and practical-use explanations (students’ needs for social gathering, networking, accessibility, and circulation), comfort explanations (thermal conditions), aesthetic explanations (greenery, seating arrangements), and health care explanations (social distancing, less crowding). Data were also collected on the impact of these options on students’ behavior regarding the health requirements.
3. Results
This section presents the findings of the descriptive analysis: namely, the user layer (on students’ needs, behaviors, and attitudes in the courtyard) and the context layer (concerning the urban layout, physical conditions, and outdoor environment). It then discusses the development and testing of design alternatives incorporating the anti-virus social, physical, and environmental factors and users’ perceptions.
3.1. User Layer
This section presents the results of the questionnaire and observations related to social factors (users’ needs, behaviors, and attitudes). The questionnaire was distributed to 336 students, with 37 from each faculty. Of these, 224 reported that the architecture courtyard was their preferred outdoor open space on the university campus [11]. This study focuses on the responses of this group. The group was 50.4% male and 49.6% female, and all were aged 19–23 years old. The users were from different faculties, and the respondents’ preferences were analyzed according to their discipline. Moreover, descriptive statistics produced via SPSS for the students’ questionnaire responses was provided (Appendix A, Figure A1).
3.1.1. Students’ Use of the Courtyard Prior to COVID-19
This section explores the students’ perspectives on their use of the open spaces in the university before the pandemic. More than two-thirds of the students (70.1%) confirmed that they used the courtyard space on a daily basis, 22.8% visited once every 2–3 days, and the remaining 7.1% visited it once a week. Most (70.1%) said they preferred to use the courtyard between 11:00 and 14:00. As a result, the courtyard is crowded at this time of day. Almost half of the students (45.5%) said they spent between 30 min and 1 h every day in the courtyard, and a further 22.3% stayed for approximately 2 h. This increases the chances of spreading infection. Social networking was one the most commonly cited reasons for using the courtyard, cited by 85.3% of the students, followed by eating and drinking (77.2%) and relaxing (62.1%). Some 43.8% of the students said they engaged in activities in the space, and the smallest group (29%) said they used the courtyard to study. The courtyard was said to be ‘crowded’ (35.3%) or ‘partially crowded’ (59.8%) most of the time. This aligns with the finding that students primarily use the spaces for social activities and interaction, and it highlights the importance of finding solutions to eliminate the spread of viruses.
3.1.2. Students’ Use of the Courtyard after COVID-19
This section explores the students’ views of their use of open spaces in the university post-COVID-19. Most of the respondents recorded kept using the courtyard. Some 40.2% indicated that they planned to increase their use of open spaces in the future. A similar percentage (40.6%) would consider using the open spaces at the same frequency as before. Just 5.8% said that they intended to stop using the courtyard. More than two-thirds of the students (70.8%) said that they intended to continue using the same open space that they had preferred before the health crisis, despite this space being described as crowded most of the time. This indicates that many students are ignoring the risk of COVID-19. In addition, it confirms the significance of open spaces in universities as nodes for social networking. Thus, it is vital to ensure that health and safety measures are in place in these spaces where young people meet. Networking and communication were described as the primary functions of the open spaces in the university. More than three-quarters of the participants (80.4%) indicated that they would be using the courtyard for socializing, whilst 65.6% said eating and drinking, 55.4% relaxing, 39.3% engaging in activities, and 35.3% exercising and walking. Just 27.7% said they would be using the space to study. These percentages indicate that static (passive) activities are the most common. It is also understood that passive activities are associated with the greatest risk of virus transmission. The results indicate that students’ priorities for using the courtyard space are unchanged since the COVID-19 lockdown. However, the strengths of their preferences have changed (Figure 3). The number of students who would consider using the courtyard for social interaction was more than 5% higher pre-COVID-19 than it was post-crisis. In addition, the number of students who said they would consider using the courtyard for eating and drinking, relaxing, and engaging in activities also appears to have declined. However, the number of students who would consider using the courtyard for exercising and walking post-COVID-19 was more than 5% higher than the pre-pandemic figure. This may be due to the negative impact of online learning and stay-home orders on health and weight.
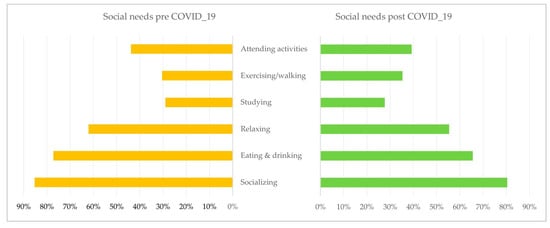
Figure 3.
Comparison of students’ social needs in relation to the courtyard, pre- and post-COVID-19.
3.1.3. Students’ Reflections
A section was added to the end of the questionnaire to invite the students to share their perspectives on their courtyard use experiences. The students’ reflections focused on the changes made to the physical features and design of the courtyard due to the new health requirements.
The students’ priorities were an increase in the greenery in the courts and the creation of more comfortable spaces in terms of thermal conditions (Figure 4). Two-thirds of the students (67%) wanted an increase in greenery, and half (51%) wanted to improve thermal comfort. Almost half (47%) noted the need to decrease the crowdedness of the spaces, and just 9.8% wanted to minimize the features that encouraged students to gather (e.g., seating areas for group discussion). The SPSS analysis underlines this finding, showing a negative correlation (0.332 > 0.05) between crowding and the students’ desire to be in less crowded spaces. These findings indicate the importance of open spaces for socializing and communication. Further analysis of the results revealed that females were 5% more likely than males to consider using less crowded spaces.
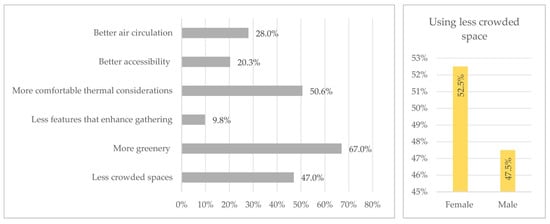
Figure 4.
Breakdown of students’ desires for courtyard-design changes post-COVID-19.
At the end of the survey, students shared their remarks on how experiences of using the courtyard space could be improved after the return to normal teaching in the university. The replies were similar to those given in response to the open-ended question. For example, two students said:
‘The seating should be replaced because it is not comfortable, and more seating should be provided … Add more appropriate greenery and trees around the seating … The palm trees are not good for creating shade … They should be replaced. Add more shading devices and rain shelters to make the courtyard usable during hot and rainy days.’
‘It would be good if we had a water feature in the courtyard.’
Other students expressed the desire for more services and activities in the courtyard:
‘Please consider adding more services and facilities in the courtyard—such as cafes and kiosks…’
‘Please increase activities after 15:00.’
A small number of students expressed worries about the pandemic:
‘Add private spaces for individuals to reduce gatherings and crowdedness … Expand and increase the area of the courtyard to allow social distancing.’
3.1.4. Students’ Behavior and Attitudes
Timed photographs of the courtyard were taken during the observation period, and graph-based descriptors (maps) of the space were generated (Appendix A, Figure A2), Figure 5 illustrated observation on Sunday and Monday, as students’ schedules usually are the same on Sunday and Tuesday, as well as Monday and Wednesday. This graphical presentation of the observations provided insights into user density and spatial use according to categories of activity (i.e., ‘dynamic in space’ or ‘static in space’). The majority of users taking part in stationary (static) activities such as standing and sitting. Of the three time slots, 11:00–14:00 was the most crowded period in the courtyard, followed by 14:00–17:00. The morning time slot (9:00–11:00) had the lowest user density. The analysis of user density revealed unequal distribution between the different spaces. The graph shows high student density around the stair area in front of the CA and the EA, which are used for seating purposes. The students tend to gather in the center of the courtyard, around the planted trees. This can be explained by the benches around the vegetation, as well as the shading provided by the trees. Higher density was observed around the seating area at the side of the AA in the CA area, compared to the seating area in the PA. The observed users were primarily engaged in static activities, most of which took place in the center of the courtyard. The axial line linking access to the PA and CA areas is the dynamic axis, as it is the most-often used for movement in the court.
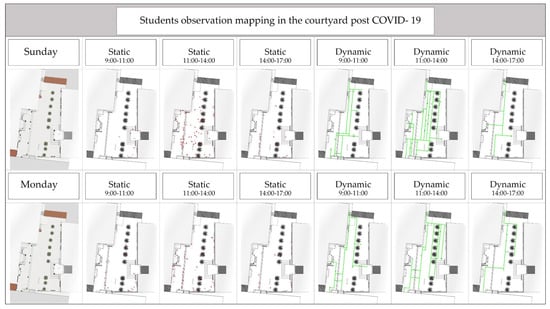
Figure 5.
Student observation mapping in the courtyard post-COVID-19: static activities and dynamic activities.
3.2. Context Layer: The Real (Base) Case
3.2.1. Assessing the Urban Layout and Physical Context of the Courtyard
Based on the agent analysis of the courtyard, a graph-based descriptor of the urban setting was created to investigate the relationship between pedestrian movement densities and spatial structure (Figure 6). The levels of movement (concentrations of people) differ in the heart of the larger defined space (the square), between the EA and the AA, where a high volume of people is concentrated (red, yellow). The volume of people decreases towards the edges, where the smallest number of people are found (blue). The student preference for gathering in the center can be explained by the few obstacles and the vision lines in this space, with the longest lines of sight located in the core, where there is the heaviest movement and greatest agent concentration. This finding corresponds to the observations discussed earlier.
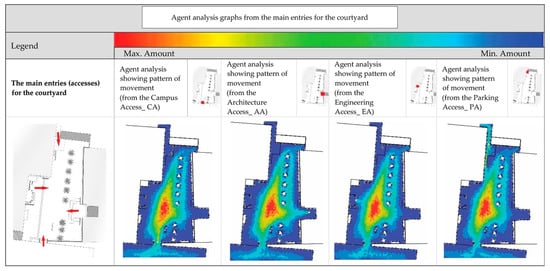
Figure 6.
Agent analysis graph for the main entries (accesses) to the courtyard.
3.2.2. Assessing the Environmental Context of the Courtyard
The measurements of thermal conditions (i.e., air temperature and relative humidity) and the shadow patterns in the courtyard in March, June, September, and December (four months representing the four seasons) are illustrated in Appendix A, Figure A3.
The wind flow in the courtyard differs throughout the year due to changes in wind directions and fluctuation in air temperature. The study analyzed the wind flow at four times of the year (15 March, 15 June, 15 September, and 15 December) and at three different times of the day (09:00, 12:00, and 15:00) to assess the current levels of air stagnation in the courtyard.
The direction of wind flow at the outer boundaries is generally southwest in March, June, and December. However, it shifts southeast in September. There are wind speeds of 2.5 m/s, 5.5 m/s, 2.5 m/s, and 3 m/s in March, June, September, and December, respectively. There are several areas of the courtyard with relatively stagnated air and wind speeds of less than 0.2 m/s. These are denoted in dark blue in Figure 7. Due to greater air temperature fluctuation, wind speeds are higher in June. The mean wind flow is approaching the corner of the buildings on the PA side in March, June, and December, resulting in a separation in the mean flow and the formation of a horseshoe vortex around the buildings and a cavity zone behind the buildings. This cavity zone is characterized by low wind speeds and small vortices that flow in the opposite direction of the mean wind flow. The flow reattaches inside the courtyard, with higher wind speed values. The reattachment distance is relatively small (approximately 6 m) because the small building on the far left (PA) is just one floor high (3 m). Moreover, the wind flow is not affected by the palm trees in its path due to their small foliage. The courtyard has two other cavity zones in the AA and EA areas, with low wind speed vortices due to lower surface pressure. The wind speed values are higher in the courtyard in June than in other months due to the higher outer-boundary condition values. In September, the approaching wind flow is directed from the CA side beside the street, where there is an open area that allows for better wind flow. Wind speed is higher when it enters the courtyard. However, it is slowed down by drag forces until it reaches the space between the two buildings, where it accelerates due to the wind tunnel effect. The flow separates when it approaches the building on the far left, leaving a small area in front of the building with low wind speed. The months share the two stagnate air areas in the AA and EA areas due to the lower surface pressure created by the geometry of the buildings.
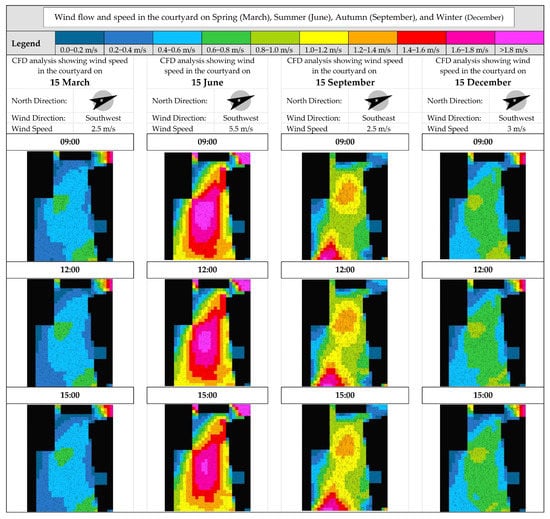
Figure 7.
Environmental analysis of the four seasons (summer, autumn, winter, and spring) in the courtyard: wind flow and wind speed.
3.3. Performance Layer: The Optimal Design of the Courtyard
This section presents the interpretations of the results used to develop the proposed design solutions. The results concern the performance of the proposed alternatives (in terms of the social, physical, and environmental factors affecting virus transmission, as well as the users’ stated preferences and perceptions), as tested via space syntax, CFD simulation, and stimulus materials.
3.3.1. Application of Research into Healthy, Disease-Free, Anti-Virus Courtyard Designs
High-quality courtyards and outdoor open spaces should be designed with anti-virus measures in mind to ensure students’ health and wellbeing. This requires environmental, physical, and social analyses, paying attention to students’ psychological expectations, needs, and behavioral attitudes.
As illustrated in Table 5, this analysis considered social factors (students’ needs and preferences, behaviors, and attitudes); physical factors (urban layout and physical conditions); and environmental factors (urban thermal and air quality conditions). It also considers social distancing, decentralization, green spaces, air pollution, and sunlight. On this basis, the priorities for redesign were identified as the gathering areas, seating arrangements, greenery (type and locations), and sunlit areas. The proposed design solutions are presented in the following paragraphs.

Table 5.
Analyses of social, physical, and environmental factors, and the corresponding design solutions for the courtyard open space.
The high-density areas should be redesigned to decrease the size of the gatherings for static activities, particularly during the most crowded times. Scattered spaces for limited numbers of students could be designed to decrease crowdedness and enable social distancing for static activities. High-volume areas should be redesigned to decrease concentration. The densest areas are located in the center of the courtyard—in addition to the stairs, which are used for seating. The seating and the location of the trees and vegetation should be reorganized to decrease the concentration of students in any single location. In addition, more benches are needed to discourage the use of the stairs as seating. High stagnant air concentration near the front facades of the buildings is a problem. Decreasing these stagnant air locations would dilute the air pollutants in the courtyard and improve air quality. In addition, sunlit areas in winter and spring would attract more outdoor activities. Shaded areas can be created by planting numerous, large-crown deciduous trees, which would improve air quality, and provide thermal comfort for students in summer.
Design solutions for the courtyard space were developed on the basis of the comprehensive integrated related analyses detailed above. The solutions are illustrated in Figure 8.
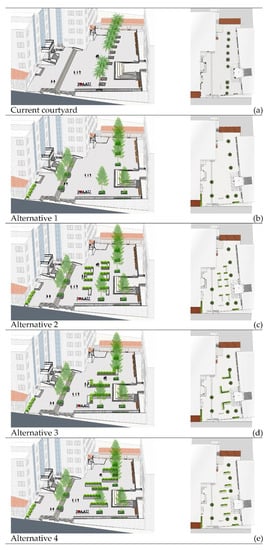
Figure 8.
Diagrammatic sketches (stimulus figures) of (a) the current courtyard case (plan and 3D modelled graph) and (b–e) the courtyard design solutions (plan and 3D modeled graph).
3.3.2. Performance of the Courtyard Design Solutions
In this section, the results of the space syntax, CFD simulation, and stimulus materials studies for the proposed courtyard designs are interpreted to assess their performance and identify the optimal design.
Social, Environmental, and Physical Performance
The visibility graph analysis (VGA) for the solutions, as illustrated in Figure 9, indicates strong connectivity in the courtyard as a whole and strong integration in the center (red, yellow) in design alternative 1 (D1). The changed location of the trees creates openness and removes obstacles, thereby producing stronger visual connections and integration.
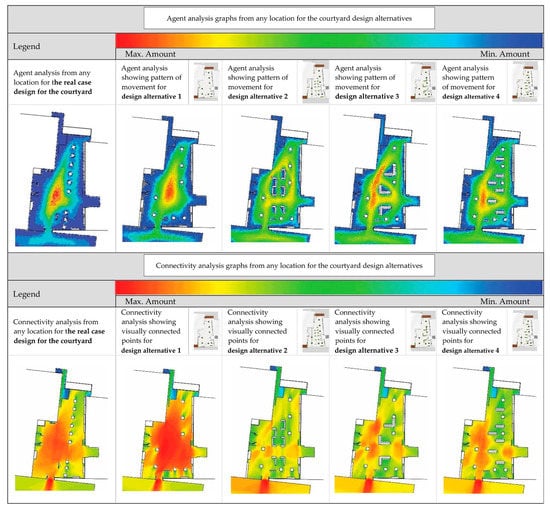
Figure 9.
Visibility graph analysis (VGA) of the design alternatives for the ‘anti-virus’ outdoor courtyard: agent analysis (patterns of movement) and connectivity analysis (patterns of visually connected points).
However, changing the arrangement of the seating affects the pattern of movement and visual connectivity, as noted in D2, D3, and D4. The agent analysis graph suggests that the axis of movement and frequent use is concentrated between the CA and the PA access in D3 and D4 (red, yellow), with a lower rate of concentration in D2 (yellow, green). The three alternatives all allow movement (and concentration) between the EA and AA, albeit less (yellow). However, in D4, movement and concentration is separated into two axes by the seating locations in EA and AA. In addition, the three alternatives all decrease the volume of people in the center of the courtyard. The connectivity analysis indicates an enveloped spatial-visual organization of strictly sequenced and contained spaces in D2, with less decisive guiding axial connectivity between CA and PA, and the main axis linking the outside and inside of the university and being used by a large number of students from all faculties. However, the connectivity line of the access between CA and PA inserts a stronger visual connection in D3 and D4.
In conclusion, D2 shows the lowest concentration of people (with no red color); therefore, better social distancing has been achieved. Less connectivity of space means a lower density of people and therefore more social distancing, which is a priority. However, D4 shows more connectivity in the courtyard as a whole: the strength of the visual connectivity line in the dynamic axis (CA and PA), together with the frequent use of spaces for static activities, indicates more free movement and better use of the area. Taken together, this suggests that D4 is optimal for social distancing, urban layout, and physical conditions, whilst D2 is ideal for its lower level of connectivity.
The proposed design includes a change in the location of the trees and the replacement of the palm trees with another type that has a higher density of leaves and more vegetation. A comparison of the current courtyard with that of the proposed design found that the wind speed and direction of wind flow at the outer boundaries were the same for the two designs. The stagnation was reduced by the proposed design, though not significantly (Figure 10). A breakdown of the wind flow observed at the four selected moments of the year (15 March, 15 June, 15 September, and 15 December) showed that the speed of wind flow generally increases (light to dark grey color) up to 0.04 m/s at the southwest and southeast edges of the courtyard. This indicates the potential to decrease stagnant air concentrations in these areas. However, in the proposed design, air speed is decreased at the center of the courtyard. This might be due to the reduction in trees in this area. The wind speed recorded the highest difference in transitional seasons in September, with approximately 0.1–0.3 m/s difference. The stagnant air areas (light grey) moved slightly southeast towards the AA and EA. On the other hand, the comparison of their thermal conditions found that the proposed design had no significant impact on air temperature (less than 0.5°C) or relative humidity (less than 0.5%) (Appendix A, Figure A4). Further study is needed to measure this impact.
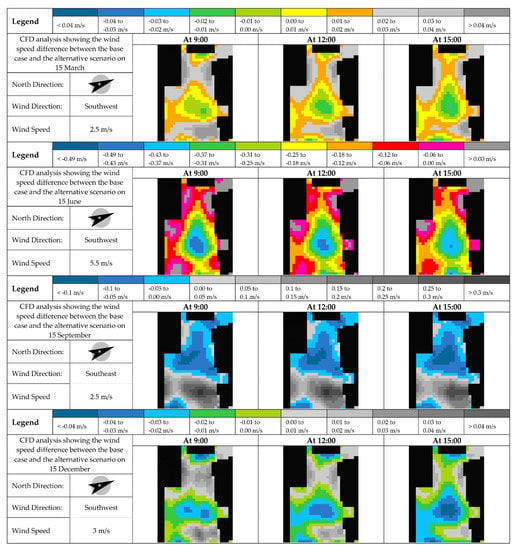
Figure 10.
Wind behavior in the current courtyard and in the alternative scenario in spring (March), summer (June), autumn (September), and winter (December). (The negative values mean that the current courtyard has a higher wind speed than the proposed design, whilst the positive values mean that it has a lower wind speed.)
These results indicate that the stagnant air areas are influenced by the location and type of trees, which affect the airflow in the courtyard. Airflow increases around the tress with high-density leaves and decreases the stagnant air concentration. Therefore, the proposed strategy could enhance health conditions, with a low-significant impact.
Users’ Preferences and Perceptions
The students’ impressions of the proposed design alternatives were measured using a five-step Likert scale, where 1 is the least positive response and 5 the most positive. The mean (M) and standard deviation (SD) were calculated. In addition, the impact on students’ intentions to change their behavior in line with health guidelines was assessed. The higher the respondent’s score, the more positive their perception of the courtyard design alternative. Descriptive statistics were produced to measure the students’ responses to the four alternatives, taking into account their needs and comfort levels, the aesthetics, and health requirements. Satisfaction was indicated by the use of ‘strongly’ and ‘strongly agree’ responses. As illustrated in Figure 11, the data gleaned from this questionnaire indicate low levels of satisfaction with the current design of the courtyard. Only 15.8% of the students described themselves as satisfied (M = 2.1) with D1, which is the most similar to the current design. The mean scores for the three other alternatives ranged from 3.1 to 3.5. D2 (M = 3.5, SD = 1.3) received the highest scores from more than half of the participants (57.9%). While 45.3% of the students preferred D3 (M = 3.2, SD = 1.3) and D4 (M = 3.1, SD = 1.4). The students’ perspective was positively influenced by the new seating arrangements and greenery. This was the case for D2, with its grid organization, and for D3 and D4, with their cluster organization. This was significantly different to D1, with its current seating arrangements at the edges of the courtyard.
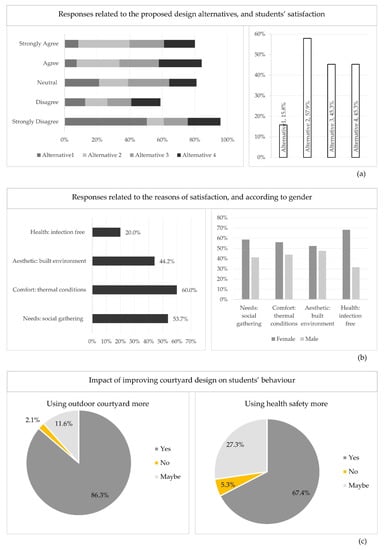
Figure 11.
Breakdown of the responses related to (a) proposed design alternatives and students’ satisfaction; (b) reasons for satisfaction, in line with gender; and (c) the impact of courtyard design improvements on students’ behavior.
Most students felt that the new seating arrangements and greenery provided more comfort than the original design and better met their needs (60% and 53.7%, respectively). Social distancing and a reduction in crowdedness for the purposes of health and safety were the least-common concerns amongst the students, with only 20% of respondents citing these as reasons for selecting one design over another. However, further analysis of the results revealed that female students were more than 35% more likely than male students to take these health requirements into consideration. A large proportion of the students (86.3%) indicated that they would consider using the courtyard more if its layout were improved. In addition, more than three-quarters of the participants (67.4%) said that they were happy to adhere to health guidelines.
4. Discussion: Performative Design Guidelines for Anti-Virus Courtyards on University Campuses
The spread of viruses in the outdoor courtyard is influenced by several factors. The organization of spaces for gathering and seating arrangements affects decentralization and social distancing [45,46]. Clustering decreases population density in gathering areas. The location and density of the greenery are also relevant, as they affect the air stagnancy. This supports the findings of [8,33,44]. Stagnant air concentration decreases significantly in areas surrounding trees. Community engagement in the design of open spaces is essential for meeting the needs of users and is thus more likely to result in behavioral change. This result aligns the findings of [11,90,91]. The next section presents the implications of these findings for the design and retrofitting of open spaces to create healthy campus environments.
Design Implications
These findings have implications for the design of outdoor open spaces in universities that take into account health and students’ perceptions and adaptive behaviors. Strategies on mitigation of context analysis in particular urban layout (decentralization, distancing), physical conditions (greenery, seating), and environmental conditions (air pollution, sunlight). are introduced. A user analysis can facilitate more effective improvement of the campus environment. These strategies could provide students with a healthier environment and greater behavioral benefits. University open spaces should be designed to provide healthy environments that are conducive to students’ engagement in their preferred activities. For example, students engaged in static activities are at greater risk of infection than those engaging in dynamic activities. Thus, dynamic activity areas (e.g., the axis of movement) require less virus protection, whilst static resting spaces (e.g., seating areas) should be located in areas of high virus-protection, such as scattered clustered areas with lower population density and appropriate distancing. University open spaces designed with consideration of students’ needs, comfort, aesthetics, and health requirements promote adaptive behaviors and can provide comfortable perceptions for the students. If students are to take account of health requirements—such as social distancing, the use of PPE, and occupancy rates—they need optimally arranged gathering areas and seating locations, an axis of movement, trees and vegetation, and shaded and sunlit areas.
This study identified various changes that could be made to the design of the university courtyard space to reduce the spread of COVID-19. These changes integrate environmental, physical, and social elements. Figure 12 illustrates the synergy between the various factors that should be considered and optimized for the design of anti-virus spaces.
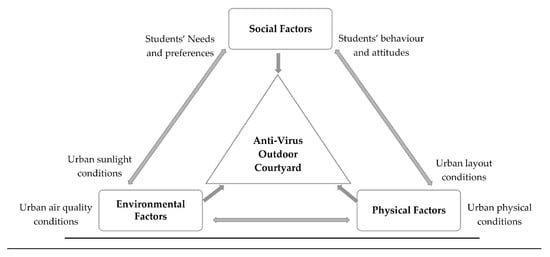
Figure 12.
Synergies between factors affecting the design of ‘anti-virus’ courtyards on the university campus.
The general recommendations for planning and designing anti-virus courtyards on university campuses are presented below.
Social factors: The courtyard design should respond to students’ needs, preferences, behaviors, and attitudes [34,35,36,37,38,39,40]. This can be achieved in various ways:
- providing places for socializing, networking, and gathering (each area accommodating a limited number of students to ensure they do not become crowded).
- increasing greenery and improving thermal comfort.
- providing less crowded spaces.
Physical factors: The urban layout and physical conditions should enhance decentralization and promote social distancing [42,43,44,45,46,47,48,49,50]. This can be achieved in various ways:
- organization of function: avoid conflict between areas for dynamic (walking) and static (sitting and relaxing) activities.
- organization of access for dynamic activities: the axis of circulation for the courtyard should be visually clear to enhance accessibility and circulation. Avoid placing obstacles (trees, seating) along the main access between the inside and outside of the courtyard or along the access between the buildings surrounding the courtyard.
- arrangement of seating for static activities: use clustered organization for the seating arrangements and for the location of trees in areas of heavy use. Limit the number of students using the stairs for seating, as this results in crowdedness. Add more benches in the clustered organization.
Environmental factors: The environmental solutions should enhance urban air quality and thermal conditions [74,75,76]. This can be achieved by the proper organization of greenery and facades:
- greenery should be placed at the corners and edges of the courtyard, where the stagnant air is concentrated. Trees with high-density leaves are recommended, as they can provide shading and improve air quality. Trees and shrubs are recommended near the seating and in areas of high population density. Placing canopy trees at the edge of dynamic accesses is recommended, as they do not obstruct movement. Deciduous trees are recommended to provide shading in summer and enhance sunlit areas in winter.
- height of surrounding facades should be optimized to control air orientation and stagnant air locations.
5. Conclusions
This study provides a foundation for research intended to enhance university life for students and for decision-making on the design of healthy open spaces on campus. The significance of this research is its integration of concerns newly arising in response to COVID-19, in addition to the novel research design to include social, physical, and environmental factors in when considering the design. This study employed a comprehensive methodology, triangulating quantitative and qualitative methods for data collection and several analysis techniques including questionnaire, observation, space syntax, and CFD.
It investigated a courtyard on a university campus and its transformation into an anti-virus space. The study proposes a ‘research for design’ method, based on a comprehensive analysis integrating (a) social factors (emphasizing the needs, preferences, behaviors, and attitudes of users); (b) physical factors (urban layout and the physical conditions of the site); and (c) environmental factors (urban air quality and the thermal conditions of the space). These elements are the design priorities that affect the design of anti-virus outdoor open spaces in universities. The study produced reference data and developed optimization strategies for redesigning an existing built environment—with the data gathered over time, across seasons, and based on incomplete benchmarks. The study findings also highlight the strength of the visual connectivity line in the dynamic axis, showing that a lower level of connectivity between the spaces used for static activities is a priority for a courtyard layout. Stagnant air concentration is influenced by the heights of surrounding buildings and the location and type of greenery. Air flow increases around trees with high-density foliage and decreases stagnant air concentration. Although it has only a low significant impact, this strategy is sufficient to enhance health conditions. Further research based on field measurement will be adopted to explore more this result. Student engagement in the design and retrofit of open spaces is essential if the spaces are to meet the students’ needs and ensure their awareness of and positive attitude towards health guidelines. This structured investigation contributes to the discipline of outdoor spaces studies and documents the novelty of the university courtyard experience, thereby promoting sustainable and healthy university campuses.
Author Contributions
Conceptualization, S.A.; Data curation, S.A.; Formal analysis, S.A., Z.A.-S. and Y.A.; Funding acquisition, S.A. and Z.A.-S.; Investigation, S.A., Z.A.-S., Y.A. and A.A.; Methodology, S.A.; Project administration, S.A.; Resources, S.A., Z.A.-S., Y.A., A.A. and N.A.; Software, S.A., Z.A.-S. and Y.A.; Supervision, S.A.; Validation, S.A., Z.A.-S. and Y.A.; Visualization, S.A. and A.A.; Writing—original draft, S.A.; Writing—review & editing, Z.A.-S. and N.A. All authors have read and agreed to the published version of the manuscript.
Funding
This research received no external funding.
Institutional Review Board Statement
The study was conducted according to the guidelines of the Declaration of Helsinki, and approved by the Institutional Review Board of Al-Ahliyya Amman University (protocol code Deans’ Council Session (15/2019-2020) Decision No: (14), Rev. a, 7 April 2021).
Informed Consent Statement
Informed consent was obtained from all subjects involved in the study.
Acknowledgments
Authors would like to express sincere thanks to everyone who contributed to this work, and in particular Al-Ahliyya Amman University. This study is part of an ongoing funded project by Al-Ahliyya Amman University (AAU), Jordan to develop a roadmap for a sustainable university campus.
Conflicts of Interest
The authors declare no conflict of interest.
Appendix A

Figure A1.
Breakdown of survey responses: (a) students’ preferences for use of the courtyard, related to faculty, and (b) students’ questionnaire responses.

Figure A2.
Detailed observation mapping during the weekdays in the courtyard post-COVID-19.

Figure A3.
Environmental analysis of the four seasons (summer, autumn, winter, and spring) in the courtyard: (a) thermal conditions and (b) shadow patterns.

Figure A4.
Thermal conditions in the current courtyard (base) and the alternative scenario during the four seasons (summer, autumn, winter, and spring).
References
- Scholl, K.; Gulwadi, G.B. Recognizing Campus Landscapes as Learning Spaces. J. Learn. Spaces 2015, 4, 53–60. [Google Scholar]
- Alnusairat, S.; Al-Shatnawi, Z.; Kakani, A. Towards an Integrated Sustainable University Campus: The Social Pillar–Case of Al-Ahliyya Amman University Jordan. In Proceedings of the 35th PLEA International Conference: Planning Post Carbon Cities, Online, Coruna, Spain, 1–3 September 2020; Volume 3, pp. 1513–1518. [Google Scholar]
- Zainordin, N.; Wahi, W.; Petrus, M.; Tiong Koh, C. Sustainable development attitude: A study on perception among private & public higher learning institutions student in Malaysia. Int. J. Sci. Technol. 2017, 3, 514–524. [Google Scholar]
- Spadaro, I.; Pirlone, F. Sustainable Urban Mobility Plan and Health Security. Sustainability 2021, 13, 4403. [Google Scholar] [CrossRef]
- Hakovirta, M.; Denuwara, N. How COVID-19 redefines the concept of sustainability. Sustainability 2020, 12, 3727. [Google Scholar] [CrossRef]
- Goniewicz, K.; Khorram-Manesh, A.; Hertelendy, A.J.; Goniewicz, M.; Naylor, K.; Burkle, F.M. Current response and management decisions of the European Union to the COVID-19 outbreak: A review. Sustainability 2020, 12, 3838. [Google Scholar] [CrossRef]
- Sun, C.; Zhai, Z. The efficacy of social distance and ventilation effectiveness in preventing COVID-19 transmission. Sustain. Cities Soc. 2020, 62, 102390. [Google Scholar] [CrossRef]
- De Luca, C.; Libetta, A.; Conticelli, E.; Tondelli, S. Accessibility to and Availability of Urban Green Spaces (UGS) to Support Health and Wellbeing during the COVID-19 Pandemic—The Case of Bologna. Sustainability 2021, 2021, 11054. [Google Scholar] [CrossRef]
- Frank, L.D.; Wali, B. Treating two pandemics for the price of one: Chronic and infectious disease impacts of the built and natural environment. Sustain. Cities Soc. 2021, 73, 103089. [Google Scholar] [CrossRef]
- Kim, D. Exploratory study on the spatial relationship between emerging infectious diseases and urban characteristics: Cases from Korea. Sustain. Cities Soc. 2021, 66, 102672. [Google Scholar] [CrossRef]
- Alnusairat, S.; Ayyad, Y.; Al-shatnawi, Z. Towards Meaningful University Space: Perceptions of the Quality of Open Spaces for Students. Buildings 2021, 11, 556. [Google Scholar] [CrossRef]
- Mt Akhir, N.; Md Sakip, S.R.; Abbas, M.Y.; Othman, N. A Taste of Spatial Character: Quality outdoor space in campus landscape leisure setting. Environ.-Behav. Proc. J. 2017, 2, 65. [Google Scholar] [CrossRef][Green Version]
- Wilson, T. Design Guidelines for Activating Outdoor Spaces of University Campuses; California Polytechnic State University: San Luis Obispo, CA, USA, 2018. [Google Scholar]
- Huang, J.; Chen, Y.; Jones, P.; Hao, T. Heat stress and outdoor activities in open spaces of public housing estates in Hong Kong: A perspective of the elderly community. Indoor Built Environ. 2020, 1420326X20950448. [Google Scholar] [CrossRef]
- Faragallah, R.N. The impact of productive open spaces on urban sustainability: The case of El Mansheya Square—Alexandria. Alex. Eng. J. 2018, 57, 3969–3976. [Google Scholar] [CrossRef]
- Hanan, H. Open Space as Meaningful Place for Students in ITB Campus. Procedia—Soc. Behav. Sci. 2013, 85, 308–317. [Google Scholar] [CrossRef]
- Lau, S.S.Y.; Gou, Z.; Liu, Y. Healthy campus by open space design: Approaches and guidelines. Front. Archit. Res. 2014, 3, 452–467. [Google Scholar] [CrossRef]
- Ashihara, Y. Exterior Design in Architecture; Van Nostrand Reinhold: New York, NY, USA, 1981. [Google Scholar]
- Olszewski, P.; Wibowo, S.S. Using equivalent walking distance to assess pedestrian accessibility to transit stations in Singapore. Transp. Res. Rec. 2005, 1927, 38–45. [Google Scholar] [CrossRef]
- Borst, H.C.; Miedema, H.M.E.; de Vries, S.I.; Graham, J.M.A.; van Dongen, J.E.F. Relationships between street characteristics and perceived attractiveness for walking reported by elderly people. J. Environ. Psychol. 2008, 28, 353–361. [Google Scholar] [CrossRef]
- Zacharias, J.; Stathopoulos, T.; Wu, H. Spatial behavior in San Francisco’s plazas: The effects of microclimate, other people, and environmental design. Environ. Behav. 2004, 36, 638–658. [Google Scholar] [CrossRef]
- Stino, L. Case Studies of Effective Planting Design Criteria in Egypt and the Middle East. In Proceedings of the First International Conference: Towards a Better Quality of Life, Technische Universität Berlin Campus, El Gouna, Egypt, 24–26 November 2017. [Google Scholar] [CrossRef]
- Jaber, S.M. Landsat-based vegetation abundance and surface temperature for surface urban heat island studies: The tale of Greater Amman Municipality. Ann. GIS 2018, 24, 195–208. [Google Scholar] [CrossRef]
- Montacchini, E.; Tedesco, S.; Rondinone, T. Greenery for a university campus: Does it affect indoor environmental quality and user well-being? Energy Procedia 2017, 122, 289–294. [Google Scholar] [CrossRef]
- Doomi, M.B.; Aldayaflah, O.; Hazaymeh, K. The effects of land cover changes on land surface temperature in Amman, an urban climate change study. Dirasat: Hum. Soc. Sci. 2016, 43, 967–977. [Google Scholar] [CrossRef]
- Abd-Razak, M.Z.; Mustafa, N.K.F.; Che-Ani, A.I.; Abdullah, N.A.G.; Mohd-Nor, M.F.I. Campus sustainability: Student’s perception on campus physical development planning in Malaysia. Procedia Eng. 2011, 20, 230–237. [Google Scholar] [CrossRef]
- Worpole, K.; Knox, K. The Social Value of Public Spaces; Joseph Rowntree Foundation: York, UK, 2007; Available online: https://www.jrf.org.uk/report/social-value-public-spaces (accessed on 24 April 2007).
- Rached, I.; Elsharkawy, H. The Role of Open Spaces in the University Campus in the Egyptian context. In Proceedings of the Designing Place—International Urban Design Conference, Nottingham, UK, 2–3 April 2012; pp. 1–15. [Google Scholar]
- Bracco, S.; Delfino, F.; Laiolo, P.; Morini, A. Planning & open-air demonstrating smart city sustainable districts. Sustainability 2018, 10, 4636. [Google Scholar] [CrossRef]
- Feder, M.A.; Shouse, A.W.; Lewenstein, B.; Bell, P. Learning Science in Informal Environments: People, Places, and Pursuits; National Academies Press: Washington, DC, USA, 2009. [Google Scholar]
- Megahed, N.A.; Ghoneim, E.M. Antivirus-built environment: Lessons learned from Covid-19 pandemic. Sustain. Cities Soc. 2020, 61, 102350. [Google Scholar] [CrossRef]
- Cannell, J.J.; Zasloff, M.; Garland, C.F.; Scragg, R.; Giovannucci, E. On the epidemiology of influenza. Virol. J. 2008, 5, 1–2. [Google Scholar] [CrossRef]
- Liu, J.; Liao, X.; Qian, S. Community transmission of severe acute respiratory syndrome coronavirus 2, Shenzhen, China, 2020. Emerg. Infect. Dis. 2020, 26, 1320. [Google Scholar] [CrossRef]
- WHO (World Health Organization). Report of the WHO-China Joint Mission on Coronavirus Disease 2019 (COVID-19) 16–24 February 2020; World Health Organization: Geneva, Switzerland, 2020; Available online: https://www.who.int/docs/default-source/coronaviruse/who-china-joint-mission-on-covid-19-final-report.pdf (accessed on 19 December 2021).
- Giuliani, D.; Dickson, M.M.; Espa, G.; And Santi, F. Modelling and predicting the spatio-temporal spread of Coronavirus disease 2019 (COVID-19) in Italy. arXiv 2020, arXiv:2003.06664. [Google Scholar] [CrossRef]
- Jones, N.R.; Qureshi, Z.U.; Temple, R.J.; Larwood, J.P.J.; Grennhalgh, T.; Bourouiba, L. Two metres or one: What is the evidence for physical distancing in covid-19. BMJ 2020, 370, m3223. [Google Scholar] [CrossRef]
- Kim, Y.; Ryu, H.; Lee, S. Agent-based modeling for super-spreading events: A case study of mers-cov transmission dynamics in the republic of korea. Int. J. Environ. Res. Public Health 2018, 15, 2369. [Google Scholar] [CrossRef]
- Larsson, N.; Mangone, G.; Berchtold, M.; Foliente, G.; Delcourt, H.; Leighton, L.; Cinq-Mars, J.; Chaloner-Larsson, G.; Kujawski, W.; Issa, M.H.; et al. Pandemics and the Built Environment, Technical Report. International Initiative for a Sustainable Built Environment, (June). Available online: http://iisbe.org/system/files/private/Covid-19%20and%20the%20Built%20Environment%2017Sep20.pdf (accessed on 28 September 2021).
- Bourouiba, L. Turbulent gas clouds and respiratory pathogen emissions: Potential implications for reducing transmission of COVID-19. JAMA 2020, 323, 1837–1838. [Google Scholar] [CrossRef]
- Setti, L.; Passarini, F.; De Gennaro, G.; Barbieri, P.; Perrone, M.; Borelli, M.; Miani, A. Air borne transmission route of COVID-19: Why 2 meters /6 feet of interpersonal distance could not be enough. Int. J. Environ. Res. Public Health 2020, 17, 2932. [Google Scholar] [CrossRef] [PubMed]
- Budds, D. Design in the Age of Pandemics. Available online: https://www.curbed.com/2020/3/17/21178962/design-pandemics-coronavirus-quarantine (accessed on 27 March 2021).
- Sharifi, A.; Khavarian-Garmsir, A. The COVID-19 pandemic: Impacts on cities and major lessons for urban planning, design, and management. Sci. Total Environ. 2020, 749, 142391. [Google Scholar] [CrossRef] [PubMed]
- Ciupa, T.; Suligowski, R. Green-Blue Spaces and Population Density versus COVID-19 Cases and Deaths in Poland. Int. J. Environ. Res. Public Health 2021, 18, 6636. [Google Scholar] [CrossRef]
- Saunders, M.J.; Evans, C.A. COVID-19, tuberculosis, and poverty: Preventing a perfect storm. Eur. Respir. J. 2020, 56, 2001348. [Google Scholar] [CrossRef] [PubMed]
- Velarde, M.D.; Fry, G.; Tveit, M. Health effects of viewing landscapes—Landscape types in environmental psychology. Urban For. Urban Green. 2007, 6, 199–212. [Google Scholar] [CrossRef]
- Barton, H. Sustainable Communities the Potential for Eco-Neighbourhoods. J. Environ. Assess. Policy Manag. 2000, 2, 169–171. [Google Scholar] [CrossRef]
- Connolly, C.; Keil, R.; Ali, S.H. Extended urbanisation and the spatialities of infectious disease: Demographic change, infrastructure and governance. Urban Stud. 2020, 58, 245–263. [Google Scholar] [CrossRef]
- Hamidi, S.; Sabouri, S.; Ewing, R. Does density aggravate the COVID-19 pandemic: Early findings and lessons for planners. J. Am. Plann. Assoc. 2020, 86, 495–509. [Google Scholar] [CrossRef]
- Sharifi, A. Resilient urban forms: A macro-scale analysis. Cities 2019, 85, 1–14. [Google Scholar] [CrossRef]
- UN Habitat. Cities and Pandemics: Towards and More Just, Green, and Healthy Future; United Nations Human Settlements Programme (UN-Habitat): Nairobi, Kenya, 2021; ISBN 978-92-1-132877-6. [Google Scholar]
- Chen, B.; Marvin, S.; While, A. Containing COVID-19 in China: AI and the robotic restructuring of future cities. Dial. Hum. Geogr. 2020, 10, 238–241. [Google Scholar] [CrossRef]
- Pinheiro, M.; Luís, N. COVID-19 Could Leverage a Sustainable Built Environment. Sustainability 2020, 12, 5863. [Google Scholar] [CrossRef]
- Tang, J.W. The effect of environmental parameters on the survival of airborne infectious agents. J. R. Soc. Interface 2009, 6, S737–S746. [Google Scholar] [CrossRef] [PubMed]
- Berman, J.D.; Ebisu, K. Changes in U.S. air pollution during the COVID-19 pandemic. Sci. Total Environ. 2020, 739, 139864. [Google Scholar] [CrossRef] [PubMed]
- Conticini, E.; Fdiani, B.; Caro, D. Can atmospheric pollution be considered a co-factor in extremely high level of SARS-CoV-2 lethality in Northern Italy? Environ. Pollut. 2020, 261, 114465. [Google Scholar] [CrossRef]
- Park, J.E.; Son, W.S.; Ryu, Y.; Choi, S.B.; Kwon, O.; Ahn, I. Effects of temperature, humidity, and diurnal temperature range on influenza incidence in a temperate region. Influenza Other Respir. Viruses 2020, 14, 11–18. [Google Scholar] [CrossRef]
- Paynter, S. Humidity and respiratory virus transmission in tropical and temperate settings. Epidemiol. Infect. 2015, 143, 1110–1118. [Google Scholar] [CrossRef]
- Riddell, S.; Goldie, S.; Hill, A. The effect of temperature on persistence of SARSCoV-2 on common surfaces. Virol. J. 2020, 17, 145. [Google Scholar] [CrossRef]
- Dietz, L.; Horve, P.F.; Coil, D.A.; Fretz, M.; Eisen, J.A.; Van Den Wymelenberg, K. 2019 Novel Coronavirus (COVID-19) Pandemic: Built Environment Considerations To Reduce Transmission. MSystems 2020, 5, e00245-20. [Google Scholar] [CrossRef]
- Moriyama, M.; Hugentobler, W.J.; Iwasaki, A. Seasonality of Respiratory Viral Infections. Annu. Rev. Virol. 2020, 7, 83–101. [Google Scholar] [CrossRef]
- Harper, G. Airborne Micro-organisms—Survival test with 4 viruses. J. Hyg. 1962, 59, 479–486. [Google Scholar]
- Chan, K.H.; Peiris, J.S.; Lam, S.Y.; Poon, L.L.; Yuen, K.Y.; Seto, W.H. The Effects of Temperature and Relative Humidity on the Viability of the SARS Coronavirus. Adv. Virol. 2011, 2011, 734690. [Google Scholar] [CrossRef] [PubMed]
- Prata, D.; Rodrigues, W.; Bermejo, P. Temperature significantly changes COVID-19 transmission in (sub)tropical cities of Brazil. Sci. Total Environ. 2020, 729, 138862. [Google Scholar] [CrossRef] [PubMed]
- Jahangiri, M.; Jahangiri, M.; Najafgholipour, M. The sensitivity and specificity analyses of ambient temperature and population size on the transmission rate of the novel coronavirus (COVID-19) in different provinces of Iran. Sci. Total Environ. 2020, 728, 138872. [Google Scholar] [CrossRef] [PubMed]
- Menebo, M. Temperature and precipitation associate with Covid-19 new daily cases: A correlation study between weather and Covid-19 pandemic in Oslo, Norway. Sci. Total Environ. 2020, 737, 139659. [Google Scholar] [CrossRef]
- Tosepu, R.; Gunawan, J.; Effendy, D.; Ahmad, L.; Lestari, H.; Bahar, H.; Asfian, P. Correlation between weather and Covid-19 pandemic in Jakarta, Indonesia. Sci. Total Environ. 2020, 725, 138436. [Google Scholar] [CrossRef]
- Zoran, M.; Savastru, R.; Savastru, D.; Tautan, M. Assessing the relationship between ground levels of ozone (O3) and nitrogen dioxide (NO2) with coronavirus (COVID-19) in Milan, Italy. Sci. Total Environ. 2020, 740, 140005. [Google Scholar] [CrossRef]
- Adekunle, I.A.; Tella, S.A.; Oyesiku, K.O.; Oseni, I.O. Spatio-temporal analysis of meteorological factors in abating the spread of COVID-19 in Africa. Heliyon 2020, 6, e04749. [Google Scholar] [CrossRef]
- Meyer, A.; Sadler, R.; Faverjon, C.; Cameron, A.R.; Bannister-Tyrrell, M. Evidence That Higher Temperatures Are Associated with a Marginally Lower Incidence of COVID-19 Cases. Front. Public Health 2020, 8, 367. [Google Scholar] [CrossRef]
- Schuit, M.; Gardner, S.; Wood, S.; Bower, K.; Williams, G.; Freeburger, D.; Dabisch, P. The Influence of Simulated Sunlight on the Inactivation of Influenza Virus in Aerosols. J. Infect. Dis. 2020, 221, 372–378. [Google Scholar] [CrossRef]
- Ratnesar-Shumate, S.; Williams, G.; Green, B.; Krause, M.; Holland, B.; Wood, S.; Bohannon, J.; Boydston, J.; Freeburger, D.; Hooper, I.; et al. Simulated Sunlight Rapidly Inactivates SARS-CoV-2 on Surfaces. J. Infect. Dis. 2020, 222, 214–222. [Google Scholar] [CrossRef]
- Alkhowailed, M.; Shariq, A.; Alqossayir, F.; Alzahrani, O.A.; Rasheed, Z.; Al Abdulmonem, W. Impact of meteorological parameters on COVID-19 pandemic: A comprehensive study from Saudi Arabia. Inform. Med. Unlocked 2020, 20, 100418. [Google Scholar] [CrossRef] [PubMed]
- Pani, S.K.; Lin, N.H.; RavindraBabu, S. Association of COVID-19 pandemic with meteorological parameters over Singapore. Sci. Total Environ. 2020, 740, 140112. [Google Scholar] [CrossRef] [PubMed]
- Le, T.; Wang, Y.; Liu, L.; Yang, J.; Yung, Y.L.; Li, G.; Seinfeld, J.H. Unexpected air pollution with marked emission reductions during the COVID-19 outbreak in China. Science 2020, 369, 702–706. [Google Scholar] [CrossRef] [PubMed]
- Kerr, G.H.; Waugh, D.W. Connections between summer air pollution and stagnation. Environ. Res. Lett. 2018, 13, 084001. [Google Scholar] [CrossRef]
- Fiore, A.M.; Naik, V.; Leibensperger, E.M. Air Quality and Climate Connections. J. Air Waste Manag. Assoc. 2015, 65, 645–685. [Google Scholar] [CrossRef]
- Liao, T.; Gui, K.; Jiang, W.; Wang, S.; Wang, B.; Zeng, Z.; Che, H.; Wang, Y.; Sun, Y. Air stagnation and its impact on air quality during winter in Sichuan and Chongqing, southwestern China. Sci. Total Environ. 2018, 635, 576–585. [Google Scholar] [CrossRef]
- Cartenì, A.; Di Francesco, L.; Martino, M. How mobility habits influenced the spread of the COVID-19 pandemic: Results from the Italian case study. Sci. Total Environ. 2020, 741, 140489. [Google Scholar] [CrossRef]
- Cole, M.; Ozgen, C.; Strobl, E. Air Pollution Exposure and COVID-19. IZA Institute of Labor Economics. Environ. Resour. Econ. 2020, 76, 581–610. [Google Scholar] [CrossRef]
- WHO (World Health Organization). Ambient (Outdoor) Air Pollution. Available online: https://www.who.int/news-room/fact-sheets/detail/ambient-(outdoor)-air-quality-and-health (accessed on 14 April 2021).
- Ciesielska, M.; Wolanik, B.; Katarzyna, M. Observation Methods. In Qualitative Methodologies in Organization Studies; Ciesielska, M., Jemielniak, D., Eds.; Palgrave Macmillan: Cham, Switzerland, 2018. [Google Scholar] [CrossRef]
- Gehl, J.; Svarre, B. How to Study Public Life; IslandPress: Washington, DC, USA; Covelo, CA, USA; London, UK, 2001. [Google Scholar]
- Penn, A.; Turner, A. Space Syntax Based Agent Simulation. In Pedestrian and Evacuation Dynamics; Schreckenberg, M., Sharma, S.D., Eds.; Springer: Berlin, Germany, 2001; pp. 99–114. ISBN 3540426906. [Google Scholar]
- Hillier, B.; Penn, A.; Hanson, J.; Grajewski, T.; Xu, J. Natural movement: Or, configuration and attraction in urban pedestrian movement. Environ. Plan. B Plann. Des. 1993, 20, 29–66. [Google Scholar] [CrossRef]
- Batty, M. A New Theory of Space Syntax; CASA Working Paper Series 75; Centre for Advanced Spatial Analysis (UCL): London, UK, 2004. [Google Scholar]
- Bruse, M. Bleeding Edge: Envi-MET Overview. Available online: http://www.envi-met.net/documents/papers/overview30.pdf (accessed on 19 December 2021).
- Ayyad, Y.; Sharples, S. Envi-MET validation and sensitivity analysis using field measurements in a hot arid climate. Cardiff IOP Conf. Ser. Earth Environ. Sci. 2019, 329, 012040. [Google Scholar] [CrossRef]
- Elnabawi, M.H.; Hamza, N.; Dudek, S. Numerical modelling evaluation for the microclimate of an outdoor urban form in Cairo, Egypt. Housing and Building National Research Center. HBRC J. 2014, 11, 246–251. [Google Scholar] [CrossRef]
- Song, B.; Park, K.-H.; Jung, S.-G. Validation of ENVI-met Model within Situ Measurements Considering Spatial Characteristics of Land Use Types. J. Korean Assoc. Geogr. Inf. Stud. 2014, 17, 156–172. [Google Scholar]
- Luo, J.; Chan, E.H.W.; Du, J.; Feng, L.; Jiang, P.; Xu, Y. Developing a Health-Spatial Indicator System for a Healthy City in Small and Midsized Cities. Int. J. Environ. Res. Public Health 2022, 19, 3294. [Google Scholar] [CrossRef]
- Jian, I.-Y.; Luo, J.; Chan, E.-H.W. Spatial justice in public open space planning: Accessibility and inclusivity. Habitat Int. 2020, 97, 102122. [Google Scholar] [CrossRef]
Publisher’s Note: MDPI stays neutral with regard to jurisdictional claims in published maps and institutional affiliations. |
© 2022 by the authors. Licensee MDPI, Basel, Switzerland. This article is an open access article distributed under the terms and conditions of the Creative Commons Attribution (CC BY) license (https://creativecommons.org/licenses/by/4.0/).