Article

Assessments of Underground Carbon Stocks in Merang-Kepahyang Peatlands, South Sumatra, Indonesia

1
Department Civil and Environmental Engineering, IPB University, Kampus IPB Darmaga, Gedung Fakultas Teknologi Pertanian, Bogor 16680, Indonesia
2
Center for Transdisciplinary and Sustainability Studies, IPB University, Kampus IPB Baranangsiang, Jl. Raya Pajajaran No. 27, Kecamatan Bogor Tengah, Bogor 16127, Indonesia
3
Indonesian Center for Agricultural Land Resources Research and Development (ICALRD), Ministry of Agriculture, Jl. Tentara Pelajar No. 12 Cimanggu, Bogor 16111, Indonesia
*
Authors to whom correspondence should be addressed.
Sustainability 2022, 14(9), 5473; https://doi.org/10.3390/su14095473
Submission received: 22 March 2022 / Revised: 18 April 2022 / Accepted: 27 April 2022 / Published: 2 May 2022

Abstract

:
Indonesia has 673 peat hydrological units (PHUs) covering more than 26.5 million hectares, of which approximately 70% are located on the Kalimantan and Sumatra Islands. Merang-Kepahyang PHUs in South Sumatra cover a total area of approximately 1.094 km2, comprising three watersheds, namely Merang (360.3 km2), Buring (458.5 km2), and Kepahyang (275.3 km2). This area is globally known as a carbon (C)-rich ecosystem. However, there is still a lack of understanding of the C cycle in this area, primarily associated with land use and cover changes. This study spatially estimates belowground carbon stocks and relates them to land elevation, land use, and soil unit. To reduce inaccurate estimates, the volume of the peat is discretized by a 200 m × 200 m grid as a grid based analysis. This assessment aimed to obtain the baseline data with particular attention to provide information on the peat carbon and its spatial distribution in each watershed. We conducted field surveys and image analysis based on SPOT 6 (1.5 m/pixel with raster format 200 m/pixel) to produce interpolated data and maps of land use, soil unit, land elevation, peat thickness, and peat carbon. We found that the land elevation ranged from 1.5 to 13.0 m-MSL in Merang, from 1.1 to 13.5 m-MSL in Buring, and from 0.2 to 11.6 m-MSL in Kepahyang. Peat thickness in ranged from 1.3 m to 12.9 m in Merang, from 0.8 m to 13.2 m in Buring, and from 0.4 m to 11.4 m in Kepahyang. Peat carbon was 220 M t in Merang, 225.8 M t in Buring, and 116.8 M t in Kepahyang. On average, peat carbon density was 6.11 kt ha−1 in Merang, 4.92 kt ha−1 in Buring, and 4.24 kt ha−1 in Kepahyang. The cumulative area covering the peat with a thickness greater than 3 m was 334.9 km2 (93%) in in Merang, 379.4 km2 (83%) in Buring, and 193.9 km2 (70%) in Kepahyang. There is a relationship between carbon content and elevation, where most of the high carbon content is in the higher elevation. Furthermore, the trees in the secondary forest are primarily found at higher elevations, while the shrubs are located at lower elevations. This is due to water table conditions below the land surface at higher elevations, and close to land surface at lower elevations. In conclusion, these watersheds are carbon-rich areas which are worthy of conservation while a small portion (<30%) may be used for cultivation.

1. Introduction

Indonesia has 673 peat hydrological units (PHUs) that cover approximately 26.5 million hectares, of which approximately 70% are located on the Kalimantan and Sumatra Islands. This area is globally known as a carbon (C)-rich ecosystems. Saragi-Sasmito et al. [1] estimated that 93% of the carbon in this area is stored in belowground organic peat soils. However, there is still a lack of understanding of the C cycle in this area, primarily associated with land use and cover changes.
Unfortunately, most tropical wetlands are found in developing nations which have limited funding for laboratory analyses and suitable facilities to estimate belowground carbon stocks [2]. One of the standard methods of assessing the carbon stock is derived from the peat distribution map and peat depth map. However, there are uncertainties and potential losses from conversion [3]. Beilman et al. [4] shows that the geostatistical approach has as much as 10% more peat C than mean depth calculations.
This study spatially estimates belowground carbon stocks and relates them to land elevation, land use, and soil units. To reduce inaccurate estimates, the volume of the peat is discretized by a 200 m × 200 m grid. The same discretization is also applied to land elevation, land use, and the soil map to relate them with carbon stock. Using the same 200 m × 200 m grid, the morphological characteristics of this area are analyzed in grid bases.
The morphological characteristics of the study area were unknown since various land use activities have been underway since the early 1970s. A restoration project has been launched, and field investigations have begun since 2018 mainly to collect data on the morphological characteristics of the areas. Land elevation in the study area has come from the 90 m × 90 m DEM map from ZSL Indonesia, which is derived from the LIDAR survey and SRTM data. The land use map was developed from a combination of Landsat 8 interpretation (resolution 1.5 m/pixel) with RBI maps scale 1:50,000. The soil map and peat depth map are derived from the maps of various sources and geological maps. Field surveys were conducted to verify the land use map, soil map, and peat depth map and collect soil samples for laboratory analyses. The chemical and physical properties of the peat in the study area were analyzed in the laboratory. The study area is located in Merang-Kepahyang PHU, in South Sumatra, with a total area of approximately 1095 km2 consisting of three watersheds, namely Merang (360.3 km2), Buring (458.5 km2), and Kepahyang (275.3 km2), as shown in Figure 1.

2. Materials and Methods
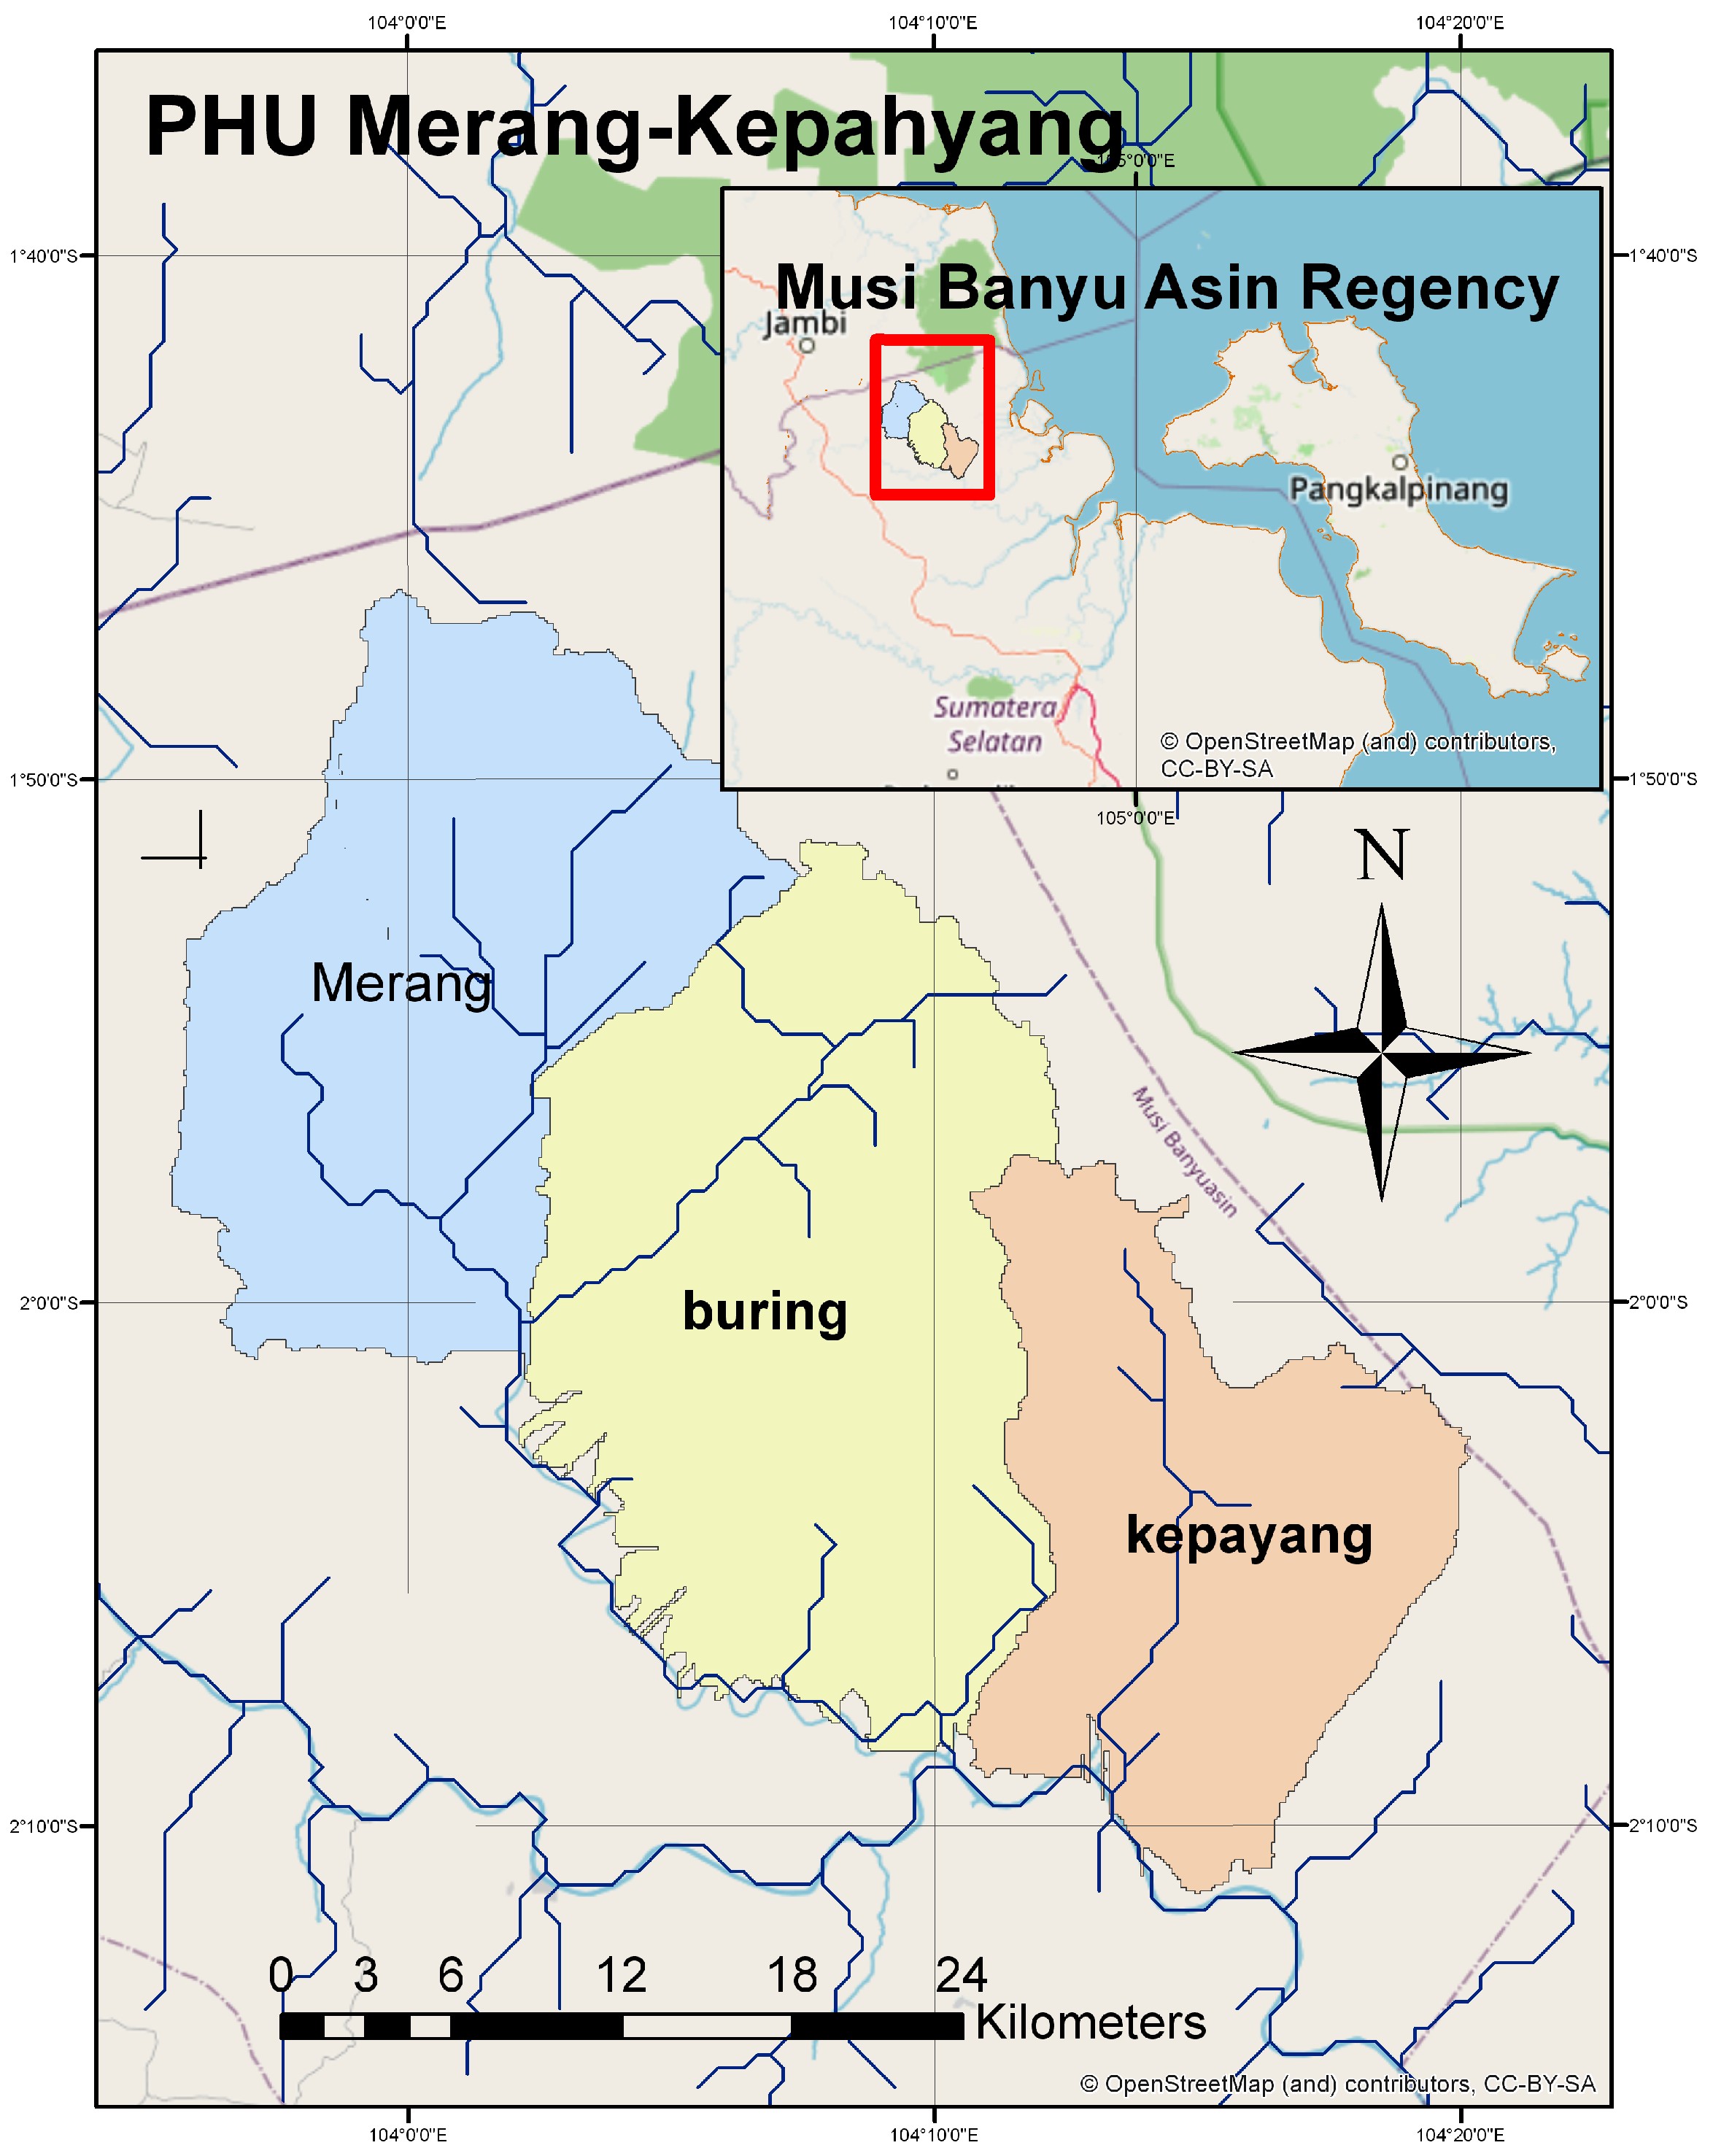
2.1. Study Site

The study site is administratively located within the Musi Banyuasin (MUBA) Regency of South-Sumatra Province (Figure 1).
The study area borders with the Muaro Jambi Regency of Jambi Province in the north, while on the southern side, it borders with the Banyuasin Regency of South Sumatra Province. The study site can be reached by car from Palembang City, the capital of South Sumatra, within approximately 6 h, and from Muaro Jambi within approximately 3 h. The study site comprises three watersheds (WS) which are, from north to south:
1.
Merang has an area of approximately 360.3 km2, and the river’s length is approximately 35 km;
2.
Buring has an area of 458.5 km2 and the length of the main river is approximately 22 km;
3.
Kepahyang has an area of approximately 275.3 km2, and the length of the main river is approximately 24 km.
There have been 15 forest fires in the area from 2001 to 2015 (private conversation with Kelola Sendang). Kelola Sendang was a ZSL-run project working with the Indonesian Government, communities, and the private sector across 1.6 million hectares in South Sumatra (including the study site).

2.2. Data Acquisition

2.2.1. Climate Data Acquisition

Climatic data were obtained from Kenten Station, the closest weather station managed by the National Agency of Meteorology, Climatology, and Geophysics (BMKG) in Palembang City. The station was registered by the World Meteorological Organization (WMO) with the WMO 96223. The daily data collected since 1976 are:
1.
Minimum temperature (Tmn);
2.
Maximum temperature (Tmx);
3.
Averaged temperature (Tav);
4.
Averaged air relative humidity (RH);
5.
Rainfall (R);
6.
Sunshine duration (SD);
7.
Average wind velocity;
8.
Main wind direction;
9.
Maximum wind velocity.

2.2.2. Peat Data Acquisition

Data acquisition related to peat is mainly comprised of from secondary data and primary data. We have 337 soil boring points from secondary data. To refine the assessments, we surveyed an additional 69 soil boring points. Field surveys were conducted from 10 May to 25 May 2019, and from 21 June to 28 June 2019, to investigate the biophysical environments. Peat samples were taken from 31 points in Merang, 13 points in Buring, and 25 points in Kepahyang. Peat depth was measured using a sample ring mounted on metal rods, extending to the largest depth of 13 m from the land surfaces. The sample size was 500 m L (diameter of 7.63 cm and height of 4 cm). From 69 soil bores, we selected 47 samples to analyze the complete physical properties. We ensured that these samples were representative of the area. Table 1 shows the eight parameters to be measured in the laboratory.
From the field, the samples were transported to and measured with the standard methods in the Soil Research Station belonging to the Ministry of Agriculture in Bogor City, West Java.

2.3. Peat Carbon Calculation

Peat carbon herein was calculated as follows [5,6]:
P C T = i = 1 n P C i = i n C C i × B D i × P V i
where P C T is the total peat carbon ( t ) ; P C is the peat carbon ( t ) ; C C is the peat carbon content ( t / t ) ; B D is the peat bulk density (t m−3); P V is the peat volume and i is grid number.
P V i = 1 R F i G V i
R F is the root fraction, and G V is the grid volume ( m 3 )
R F i = R D i × P T i × G A i
where R D is the root density (mm−1), P T is the peat thickness (m), and G A is the grid area (m2).

2.4. Land Use Map, Soil Map, and Elevation Map

To create the land use map, we initially used the images from the SPOT 6 satellite year acquisition 2016 following Sencaki et al. [7]. SPOT 6 images have a resolution of 1.5 m per pixel. The data were interpreted and checked through field observations conducted from 10 May to 25 May 2019, and 21 June to 28 June 2019. Each instance of land use was delineated in the form of a polygon. Data in the polygon were converted into a raster format with a resolution of 200 m/pixel to be consistent with other data for analysis. ArcGIS Desktop 10.5 software analyzed the data and produced the maps. The results were displayed in the form of maps and tables. In this research, we used combined ground truth and visual inspection.
For the soil map, the data source was based on a combination of Landsat 8 interpretation (resolution 1.5 m/pixel) with the RBI maps scale 1:50,000, SRTM/DEM 30 m/pixel, maps of various sources, and the geological map [5]. Polygons were formed to delineate the soil units based on field observation for more detail and were refined with the available data. Data in the polygon were then converted to a raster format with 200 m resolution to be consistent with other data for the analysis. ArcGIS Desktop 10.5 software was used to analyze the data and produce the maps. The procedure to create the soil units map is with the ground truth through transects to find peat depth and peat maturity and then combine the results with the contour map and Landsat image to delineate the peatland area and its spread.
Elevation data were derived from LiDAR mapping [8] conducted by Kelola Sendang Project (KSP). Digital elevation model (DEM) was used to extract the data with a resolution of 100 m/pixel. Following Carless et al. [9], the data were then converted into a raster format with a resolution of 200 m/pixels to be consistent with the other data to be further analyzed. The grids were generated as follows:
1.
Merang covers (40,425–40,432) m2 per grid with 8914 grids;
2.
Buring covers (40,485–40,493) m2 per grid with 11,325 grids;
3.
Kepahyang covers (40,619–40,626) m2 per grid with 6778 grids.
Software ArcGIS Desktop 10.5 was used to analyze and map the spatial data. The frequency and cumulative distribution of land elevations were obtained using the FREQUENCY Function available in WS Excel.

2.5. Peat Carbon Mapping

The spatial data of the peat depth were obtained from secondary data and field measurements. We had 337 soil boring points from secondary data. To refine the assessments, we surveyed an additional 69 soil boring points. The field measurement data consisted of 31 points in Merang, 13 points in Buring, and 25 in Kepayang. Field measurements were conducted from 10 Mai to 25 Mai 2019, and from 21 June to 28 June 2019. Peat depth was measured using a sample ring mounted in metal rods extending to the deepest of 13 m from the land surfaces. The data were interpolated using the inverse distance weighted (IDW) method available in the ArcGIS Desktop 10.5 software. The data were then converted into a raster format with a 200 m resolution as in the DEM.
The carbon stock was the total summation of peat carbon calculated in every grid over the whole area. The size of one grid was 200 m × 200 m. Carbon content and particle density were obtained from the measurement of peat samples relevant to the soil units. The grid area was similar to those which used land elevation and peat thickness maps. ArcGIS Desktop 10.5 Software analyzed the data and produced the expected maps. The frequency and cumulative distribution of peat maps were obtained using the FREQUENCY Function available in WS Excel.

3. Results and Discussions

3.1. Temperature

The temperature data are processed for daily minimum ( T n ); average ( T a ); and maximum ( T x ) temperatures from 1976 to 2017 with the ranges of (23.6 ± 0.8) °C, (30.8 ± 1.7) °C, and (26.4 ± 0.9) °C, respectively. These three temperatures changed positively with time, with slopes of 0.03 C /year, and 0.04 C /year. Based on the Mann–Kendall test [10], these changes are positively significant, meaning that this area is becoming hotter with time.

3.2. Relative Humidity
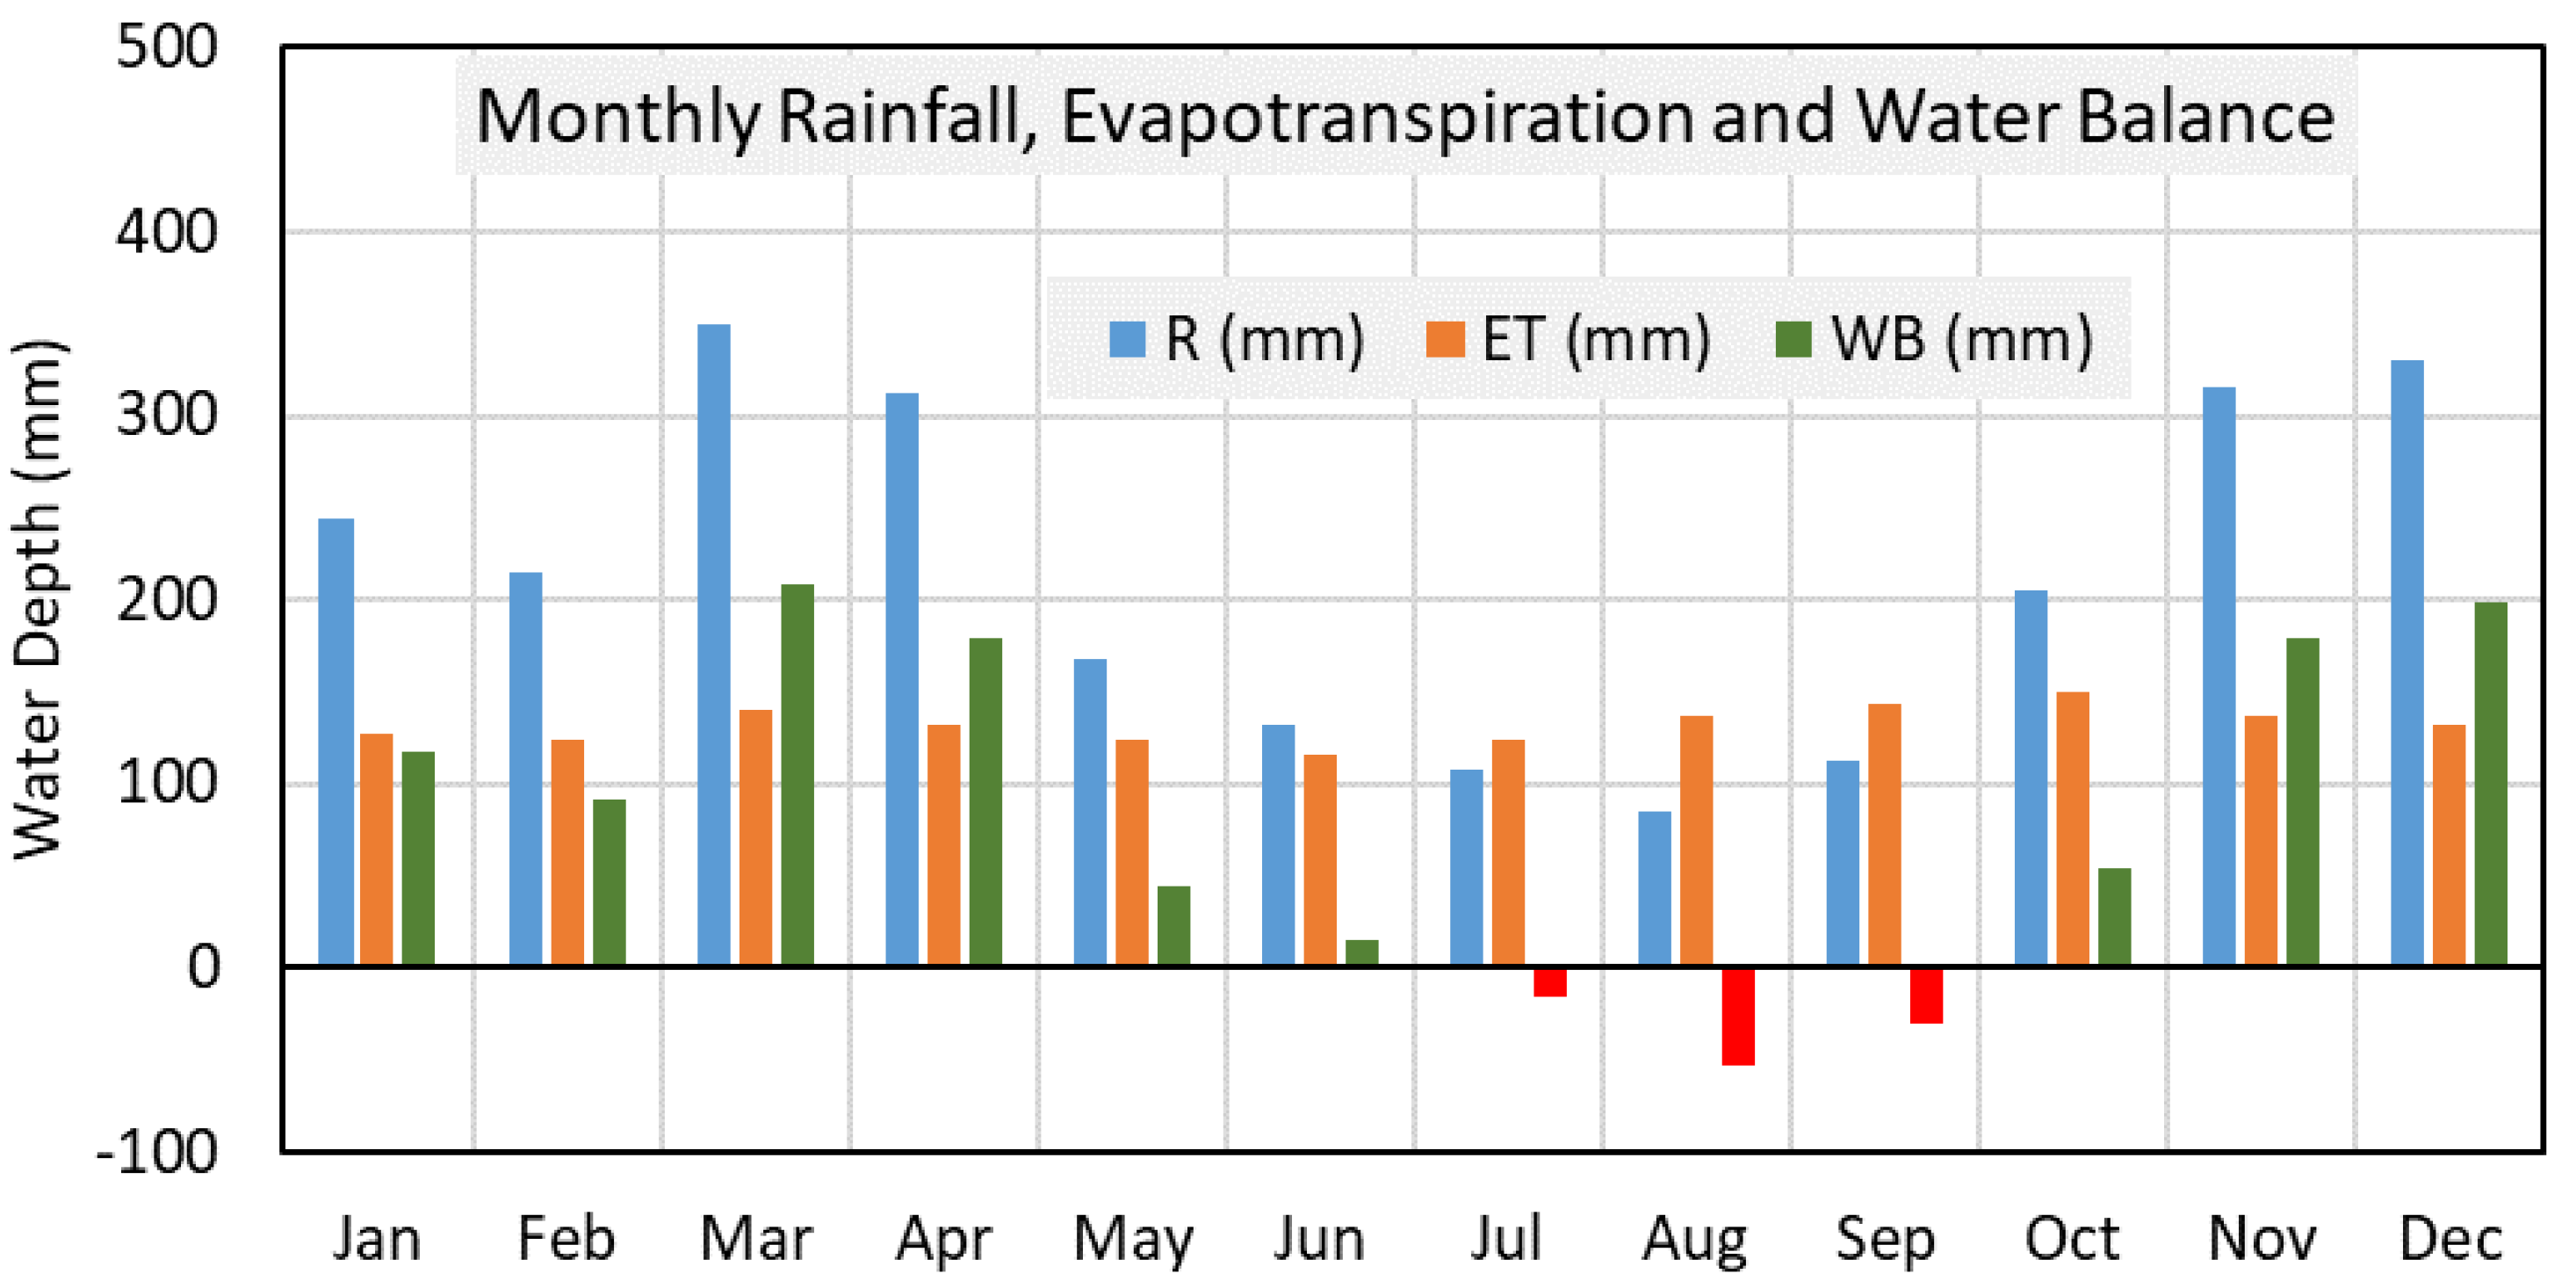
The same as temperature data, the daily average relative humidity (RH) from 1976 to 2017, has a range of (86.5 ± 5.0)%. This RH changed negatively with time, having a slope of −0.11%/year. This RH change is negatively significant based on the Mann–Kendall analysis [10], meaning that this area is becoming drier.

3.3. Rainfall

For the rainfall, the annual rainfall (R) from 1976 to 2017 was in the range of (2575 ± 496) mm. This R changed positively with time, with a slope of 6 mm/year. However, this R change is not significant according to the Mann–Kendall analysis [10]. The lowest rainfall was 1606 mm in 1978 when the first El-Nino occurred, while the highest rainfall was 3714 mm in 2010.

3.4. Evapotrasnpiration

Finally, for evapotranspiration, the annual evapotranspiration (ET) from 1976 to 2017, which was in the range of (1587 ± 44) mm, changed positively with time, with a slope of 1 mm/year. Based on Mann–Kendall analysis [10], however, this change is not significant.

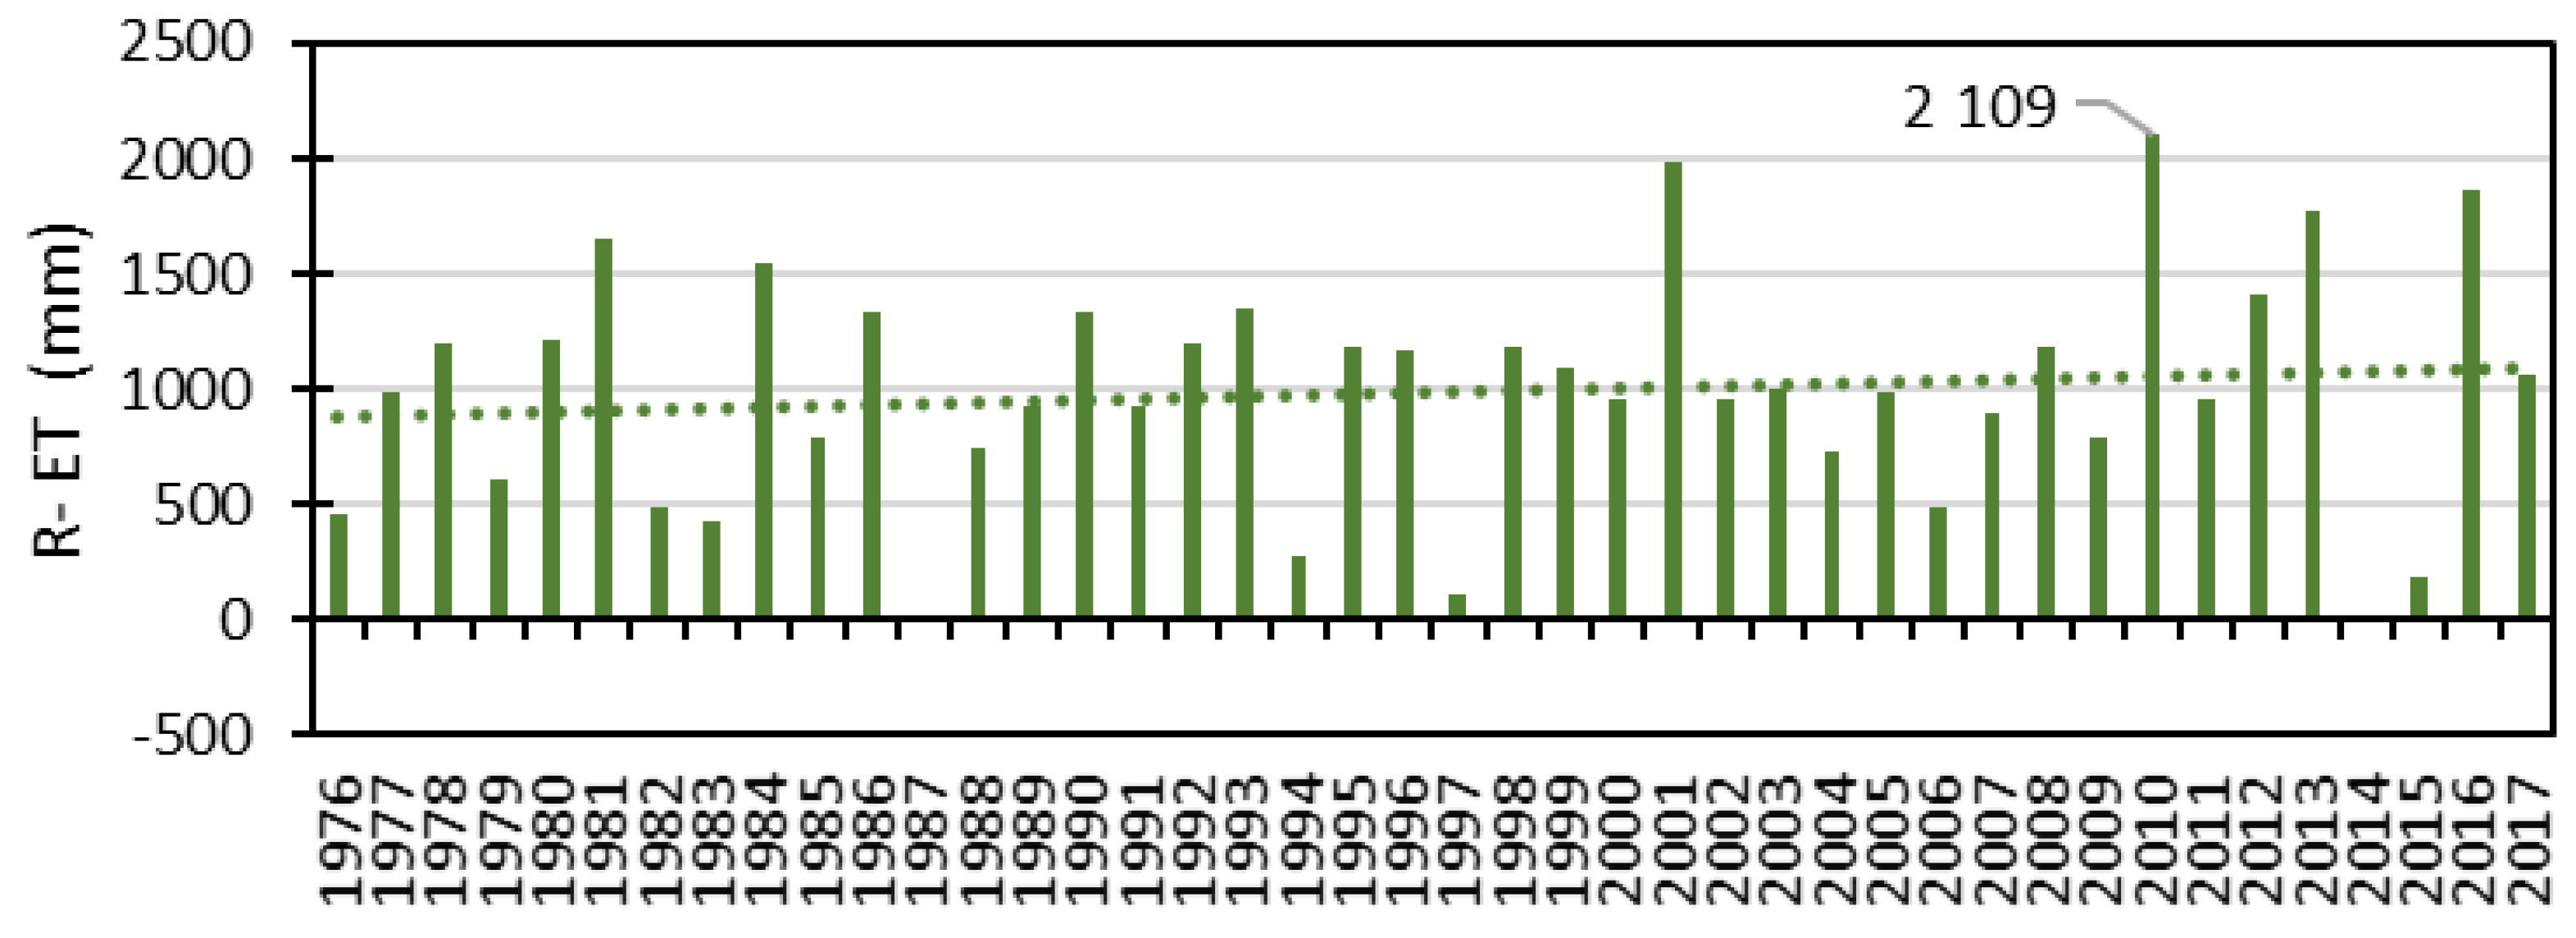
3.5. Climatic Water Balance

The climatic water balance represents the available rainwater (ARW) which is the rainfall minus the evapotranspiration (R-ET). Here, the ARW is called surplus when its value is positive or deficit when it is negative. Figure 2 shows the annual rainfall minus evapotranspiration (R-ET) from 1976 to 2017 in the range of (5084 ± 988) mm and changed positively with time, with a slope of 5 mm/year. However, this change was not significant based on the Mann–Kendall analysis [10]. The highest surplus value was 2109 mm in 2010, while the lowest deficit value was −12 mm in 2014. There were no data recorded in 1987 due to instrumental failure.

3.6. Monthly Water Balance

Figure 3 shows the average values of the monthly rainfall, evapotranspiration, and water balance for 42 years. Rainfall fluctuated widely from 85 mm in August to 349 mm in March, while evapotranspiration varied from 116 mm in June to 150 mm in October. Furthermore, the water balance fluctuated widely from −53 mm in August to 209 mm in March. Looking at the negative values of the water balance, the dry season generally starts from July to September, while the wet season starts from October to June. Water depth in the y axis of Figure 3 represents the water volume per unit area.

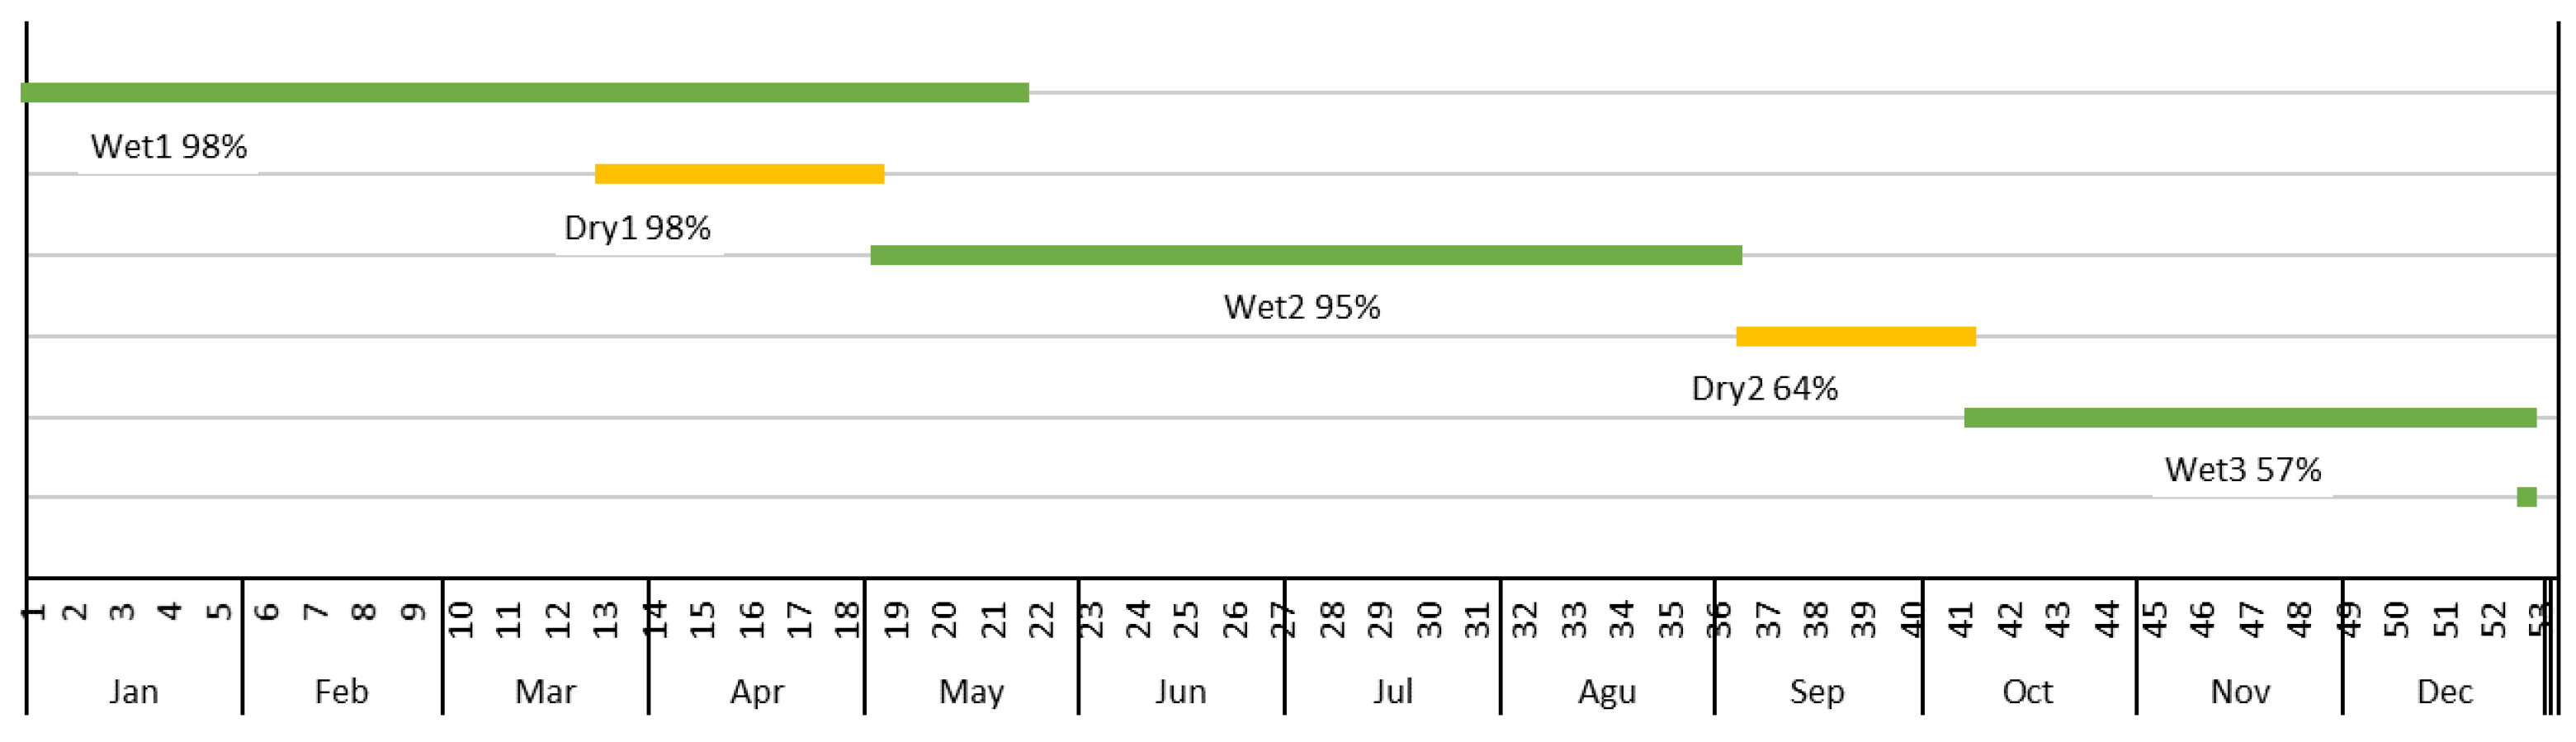
3.7. Wet and Dry Seasons

Wet and dry periods were determined by the values of climatic water balance computed daily [11]. The wet period ( W P ) was determined when the values were positive for a period of days while the dry period ( D P ) was determined when the values were negative for a period of days. Figure 4 shows patterns of W P and D P which are the averaged values over 42 years.
The graphs in Figure 4 can be interpreted here as follows:
1.
Wet1 starts from the first week of January to the third week of May with a percentage of occurrence of 98% over 42 years;
2.
Dry1 starts from the second week of March to the first week of May with a percentage of occurrence of 98% over 42 years;
3.
Wet2 starts from the first week of May to the fourth week of August with a percentage of occurrence of 95% over 42 years;
4.
Dry2 starts from the first week of September to the second week of October, with a percentage of occurrence of 64% over 42 years;
5.
Wet3 starts from the second week of October to the fourth week of December with a percentage of occurrence of 57% over 42 years;
6.
Wet season starts from the second week of October to the fourth week of August, but it may occasionally be interrupted by the dry period between the third week of May to the fourth week of April;
7.
Dry season starts from the first week of September to the second week of October.

3.8. Available Rainwater in the Wet and Dry Periods

Table 2 shows the available rainwater during the wet and dry periods. The positive value means a surplus of the rainwater, while the negative value means a deficit of the rainwater. The rainwater was in surplus during the wet period and in deficit during the dry period. On average, the rainwater surplus during the wet period was 1646 mm, while the deficit during the dry period was −347 mm. Thus, there would be a rainwater surplus totaling 1299 mm in one year. This indicates that the studied area is abundant in water and forms a wetland or a floodplain. The rainwater surplus ought to be conserved in many forms of water reservoir in anticipation of the rainwater deficit during the dry periods.
Table 2 above also shows the rainwater gain and loss rates at the peaks of the wet and dry periods (peak rate). The highest rate of rainwater gain was 17.8 mm d−1 in Wet3, while that of the rainwater loss was −8.7 mm d−1 in Dry1. These values should be used for a structural or technical design/planning on water management to prevent flooding during the wet period and drought during the dry period.

3.9. Land Elevation Analysis

Figure 5 shows land elevation maps in the three watersheds with a full scale from 0 m to 15 m with a color-graded interval of 3 m. The higher cumulative area with higher elevation is found in the Buring watershed. The lower cumulative area with higher elevation is located in the Kepahyang watershed. Areas with higher elevation are commonly situated in the northern part of all watersheds. As a result, all streams are flowing in southward direction. Considering the elevation distribution of all watersheds and flow patterns, it is expected that the northern part of all watersheds consists of a peat dome with higher peat depth, and consequently, a higher carbon stock. The darker the color is, the higher the elevation. The lowest to highest elevations ranged from 1.5 to 12.4 m in Merang; from 1.1 to 12.4 m in Buring; and from 0.2 to 11.0 m in Kepahyang. Areas with low elevation are situated along the riverine. They are widening downstream, which might be associated with faster peat decomposition in this area due to the lower water level. The lower elevation also signifies a more insufficient carbon stock.

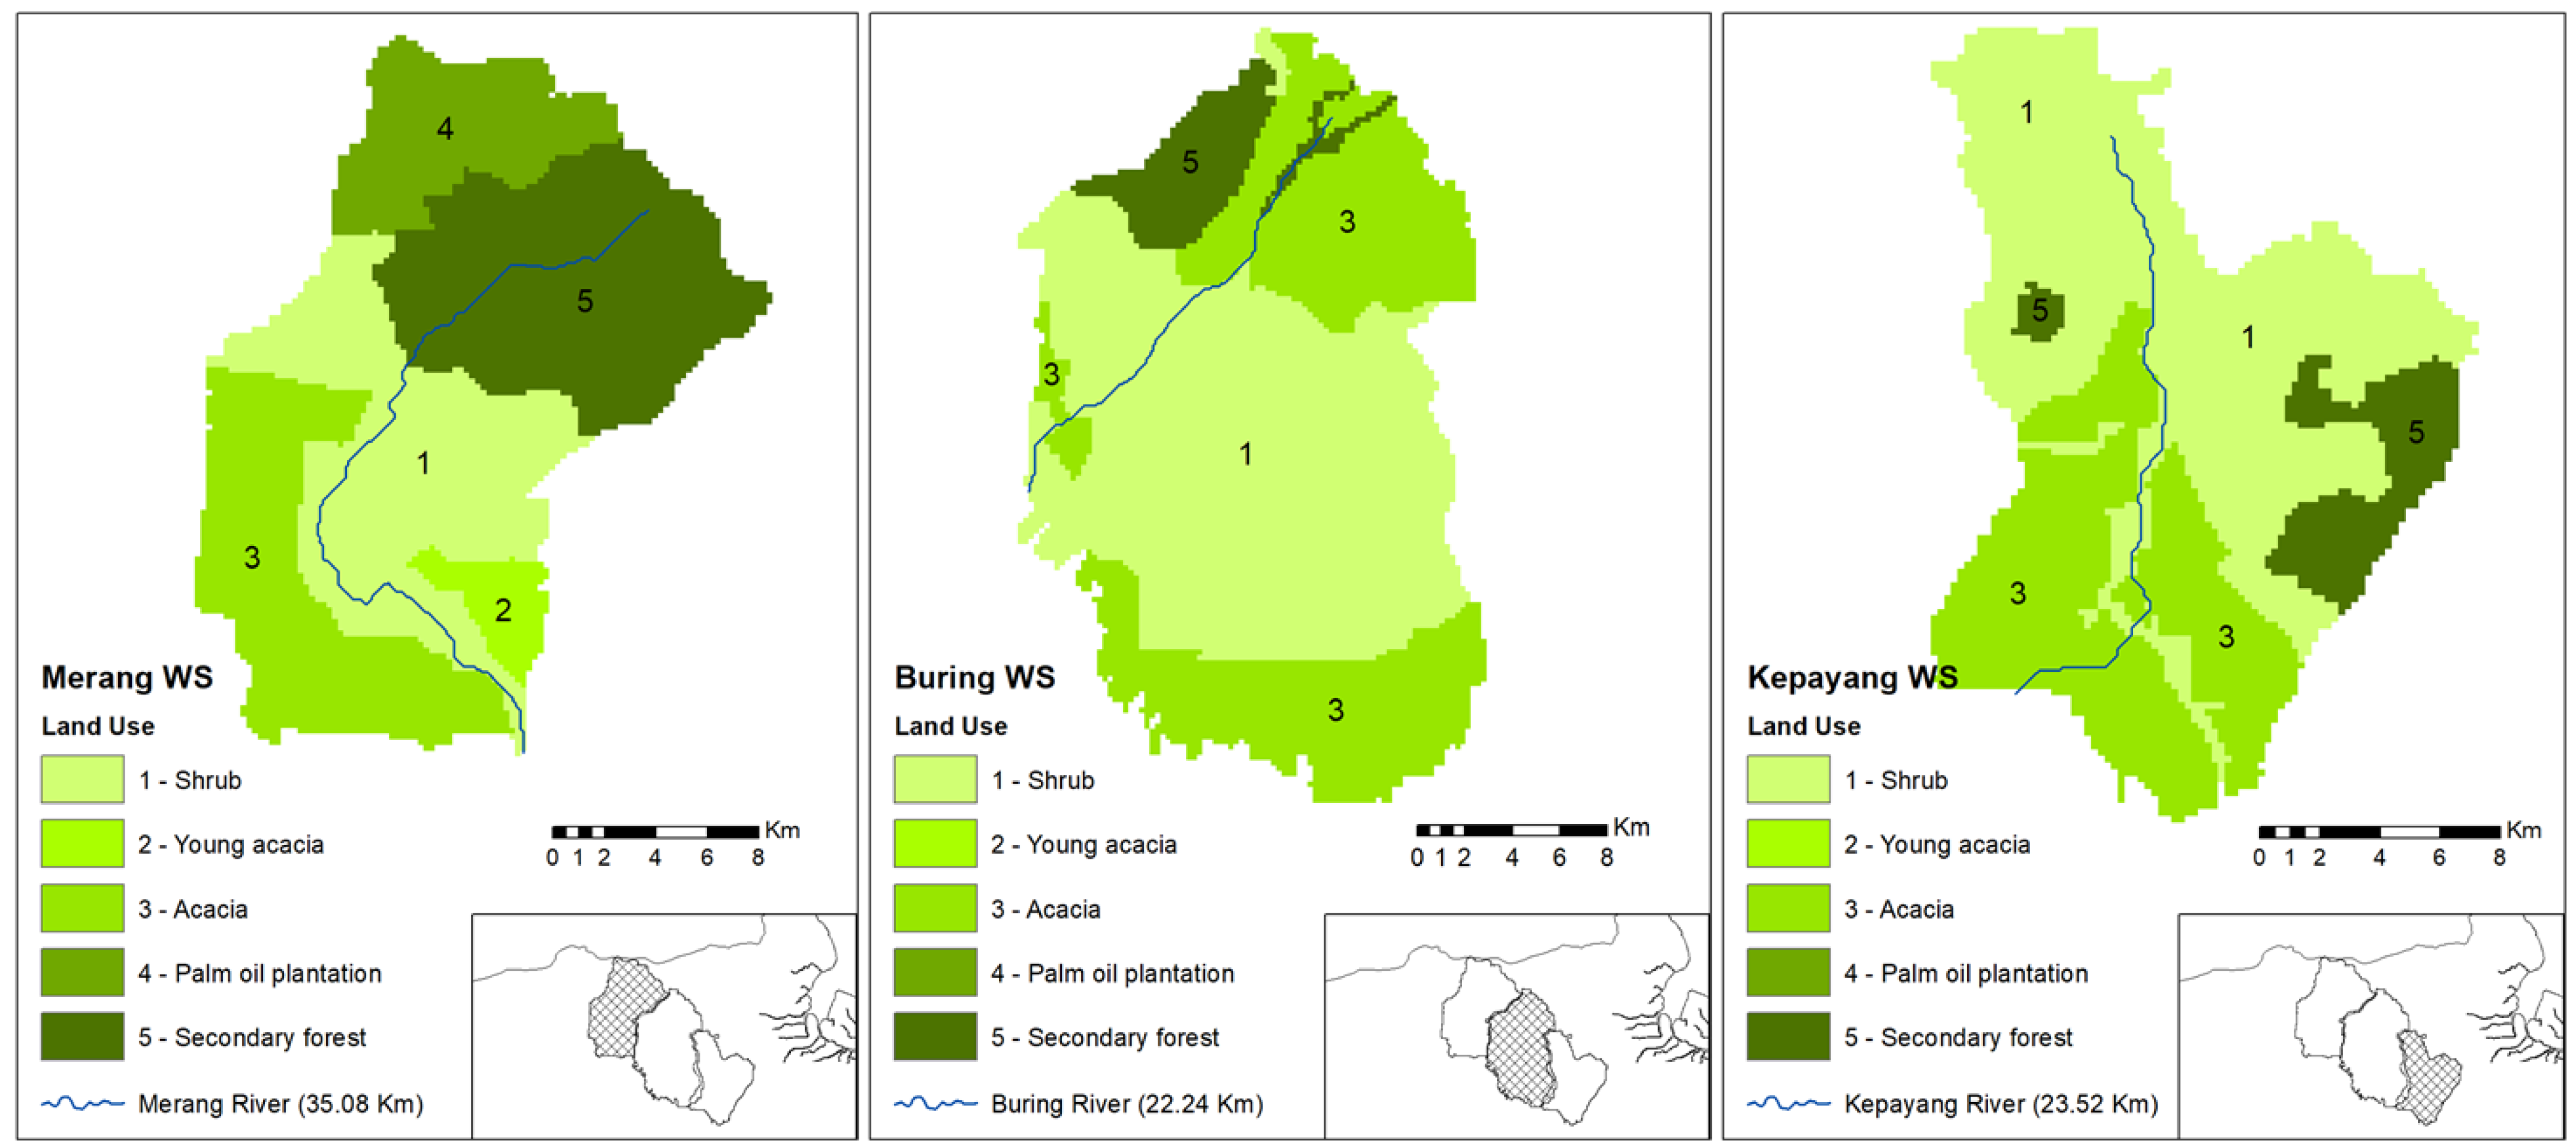
3.10. Land Uses Mapping

The types and coverage areas of land uses found in Merang, Buring, and Kepahyang are shown as in Figure 6. In general, there were five land uses in the forms of: 1. shrubs; 2. young acacia; 3. grown acacia; 4. oil palm; and 5. secondary forests.
Shrubs were the primary vegetation in the three watersheds, followed by acacias. However, the forests in Buring and Kepahyang occupied a small portion of the areas. Primary forests were cleared by logging concessions years ago and then naturally replaced by wild trees that formed the secondary forests. These areas are concentrated in the higher elevations where the water levels below land surfaces fluctuate with time. These aerobic-anaerobic conditions of the soils allow the trees to grow correctly.
Shrubs predominantly cover the lower elevations where the water levels were usually closer to the surfaces, faced waterlogging problems, and formed floodplains. Due to these conditions, trees are challenging to grow.
Acacia and oil palm were mainly planted in areas previously occupied by secondary forests where the water level fluctuations were more manageable. Acacia is more water tolerant than oil palm concentrating in the lower regions. Grown acacia was found in Merang in approximately 13.8 km2 (4%) but will spread as the young acacia is planted in all watersheds. Oil palm only existed in Merang for approximately 49.2 km2 (14%) and seemingly will be unchanged.
There are problems in the Merang area, such as many people having planted oil palm and extracted wood from the Merang forest. In the southern part of Merang, there is a burned area with intense stagnant water conditions that are difficult to drain. Current land use is bushes and shrubs. Forest, shrubs, and young acacia land uses dominate the study area. Forest occupies peat dome in the northern part. Shrub might have dominated the area after a fire incident in 2015 as pioneer vegetation.

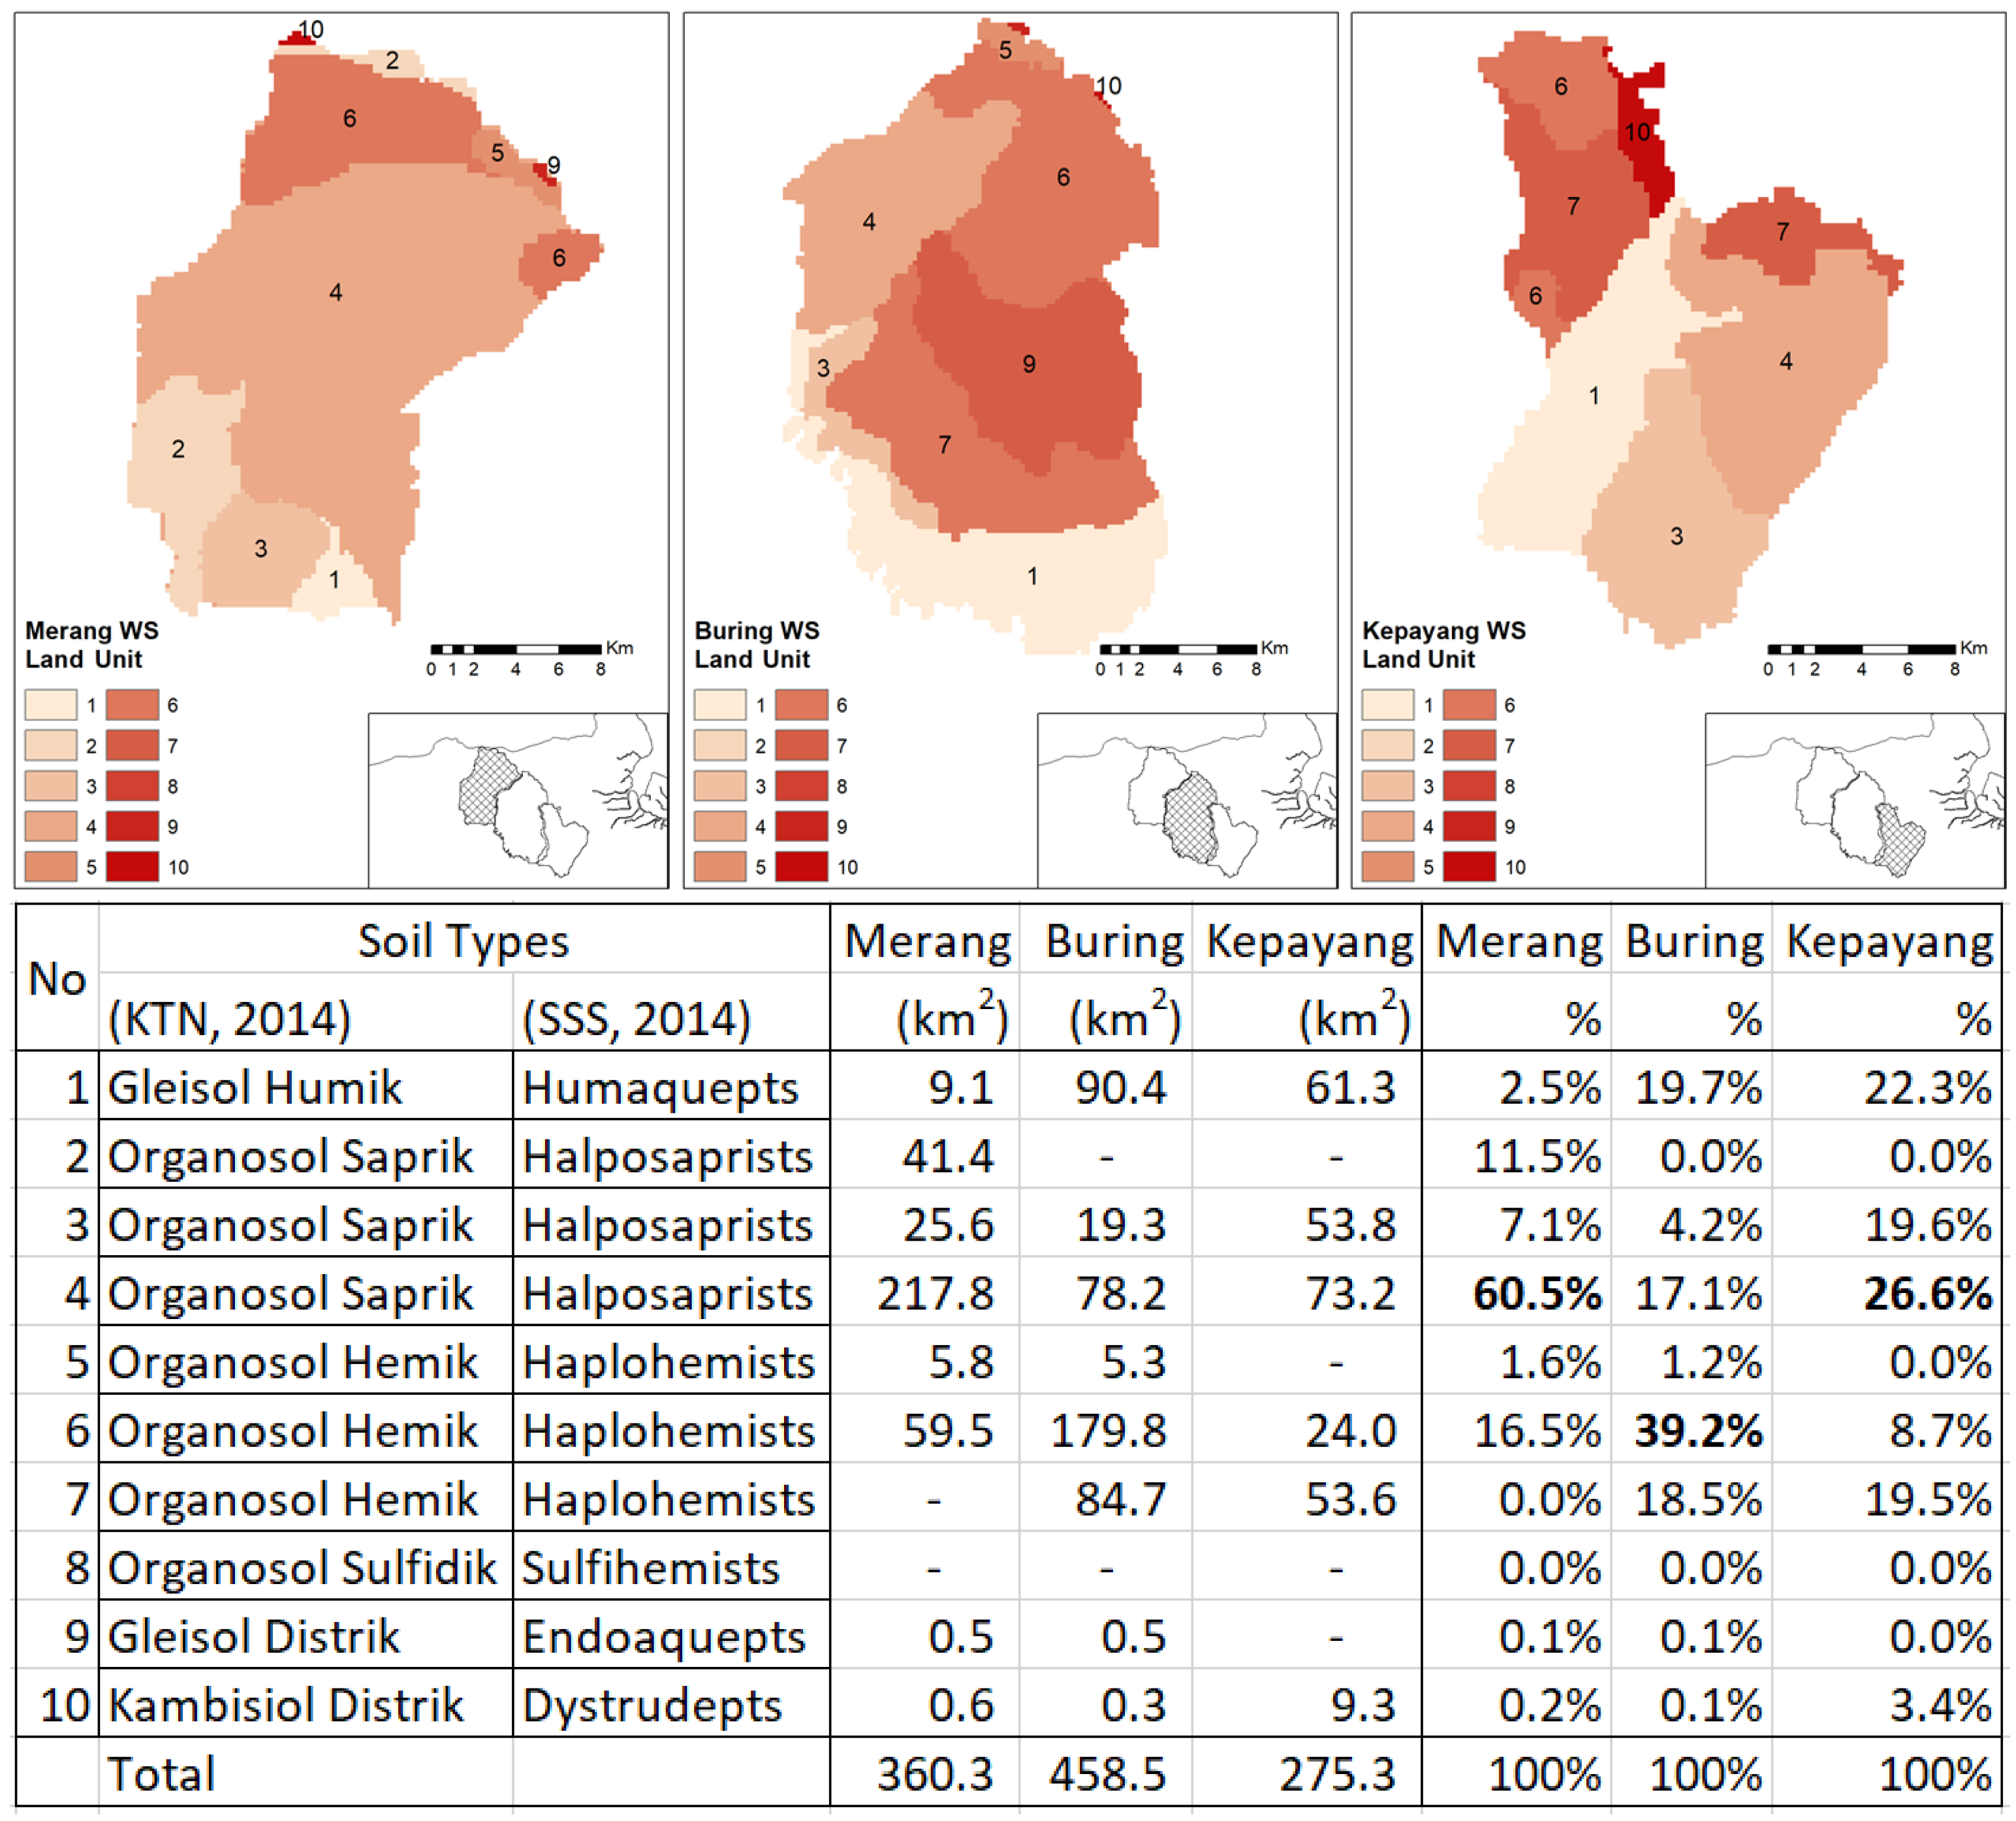
3.11. Soil Units Mapping

Types and their coverage areas of soil units in the three watersheds are shown as in Figure 7. There were ten soil types in which Organosol was the major soil unit in the three watersheds. Organosol sapric was the largest area in Merang (60.5%) and Kepahyang (26.6%), whereas Organosol Hemic was the largest area in Buring (39.2%). Kambisol covered a small part of the areas in the northern part.
Kambisol is categorized as recently formed mineral soil with less developed horizons. Gleisol humic dominated the lower regions in the southern part of all watersheds. Gleisol humic is classified as mineral soil covered by thin peat layers with frequent inundations; mineral soil’s color is usually gray due to periodic inundation. Meanwhile, peat soils dominated up to 96% to 99% of all watersheds. All peat soils in the area are categorized as Organosol hemic-saprist ranging from medium to high maturities. Problems that are dominated in this location include:
1.
Physical properties, such as low bulk density ( B D ) (<0.1 g cm−2), water saturation with high conductivity, subsidence, irreversible and flammable, so that plants will collapse easily.
2.
Chemical properties, the soil is very acidic, the content of macro-phosphorus nutrients, potassium, and exchange-based and micronutrients, especially Z n and C u , are very low.
The northern part of all watersheds, forming peat domes, possess the highest belowground carbon stocks. Most of the peat soils in these regions are mature peats (hemist-saprist).

3.12. Peat Properties Analysis

Table 3 shows eight parameters of the peat properties measured in the 47 points in Merang, Buring, and Kepahyang. Table 3 shows the minimum, maximum, average, and deviation of each parameter. In the detailed data, the parameter changed with the location (soil unit) and depth, but O M and C O were relatively more stable (each with 2% Std.), so their averaged values might be acceptable to represent the whole area.
On the other hand, B D will also be used to calculate the peat carbon fluctuation (up to 35%), and accordingly, it might not be suitable to use its average value. The relationship between B D and P O R is relatively linear, with R 2 = 0.64 , in P O R = 2.67 B D + 0.7872 . This equation may be practically helpful for calculating P D , which is very difficult and time-consuming to measure.

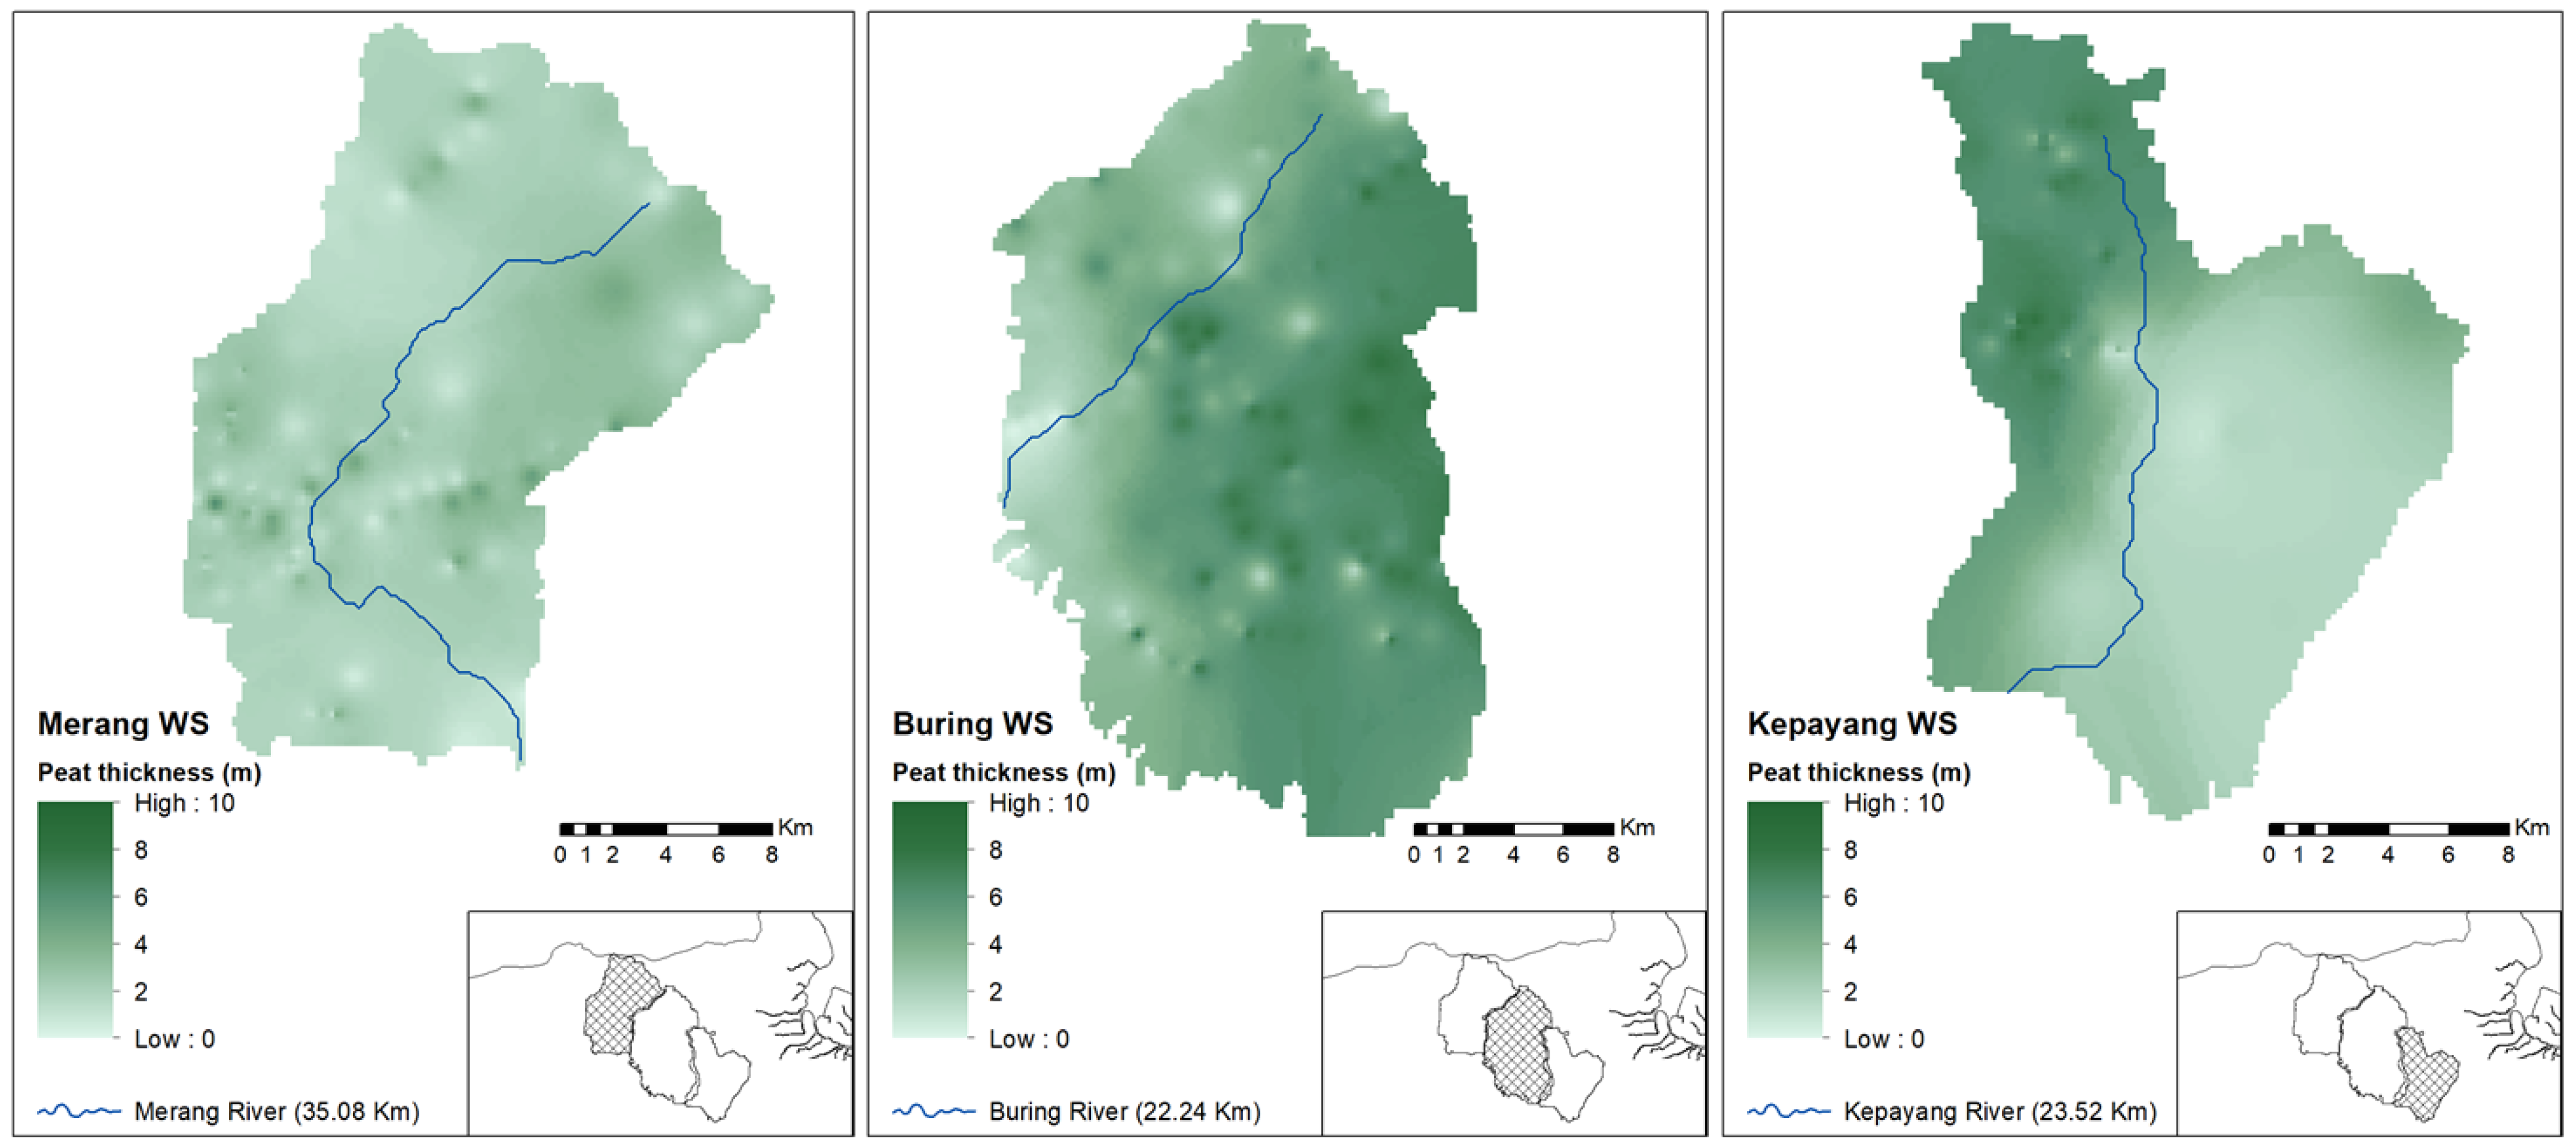
3.13. Peat Thickness Analysis

Figure 8 shows spatial distributions of peat thickness in Merang, Buring, and Kepahyang. Peat thickness ranged from 1.3 to 12.9 m in Merang, from 1.3 to 12.9 m in Buring, and from 1.3 to 12.9 m in Kepahyang. Compared to Buring and Kepahyang, the peat thickness in Merang was more homogeneously distributed over the western and the eastern sides of the river. In Buring, the peats on the eastern sides of the river were thicker than that on the western sides. In Kepahyang, the peats on the western side were thicker than on they were on the eastern sides, which were also more homogeneously shallow.
In all cases, the peats were shallower toward the rivers, which also meant toward the lower land elevations. The distribution of the peat thickness correlated with land uses. The areas which covered shrubs had a lower peat thickness. Furthermore, the areas along the river also had less peat thickness, which was consistent with elevation data, as discussed previously.

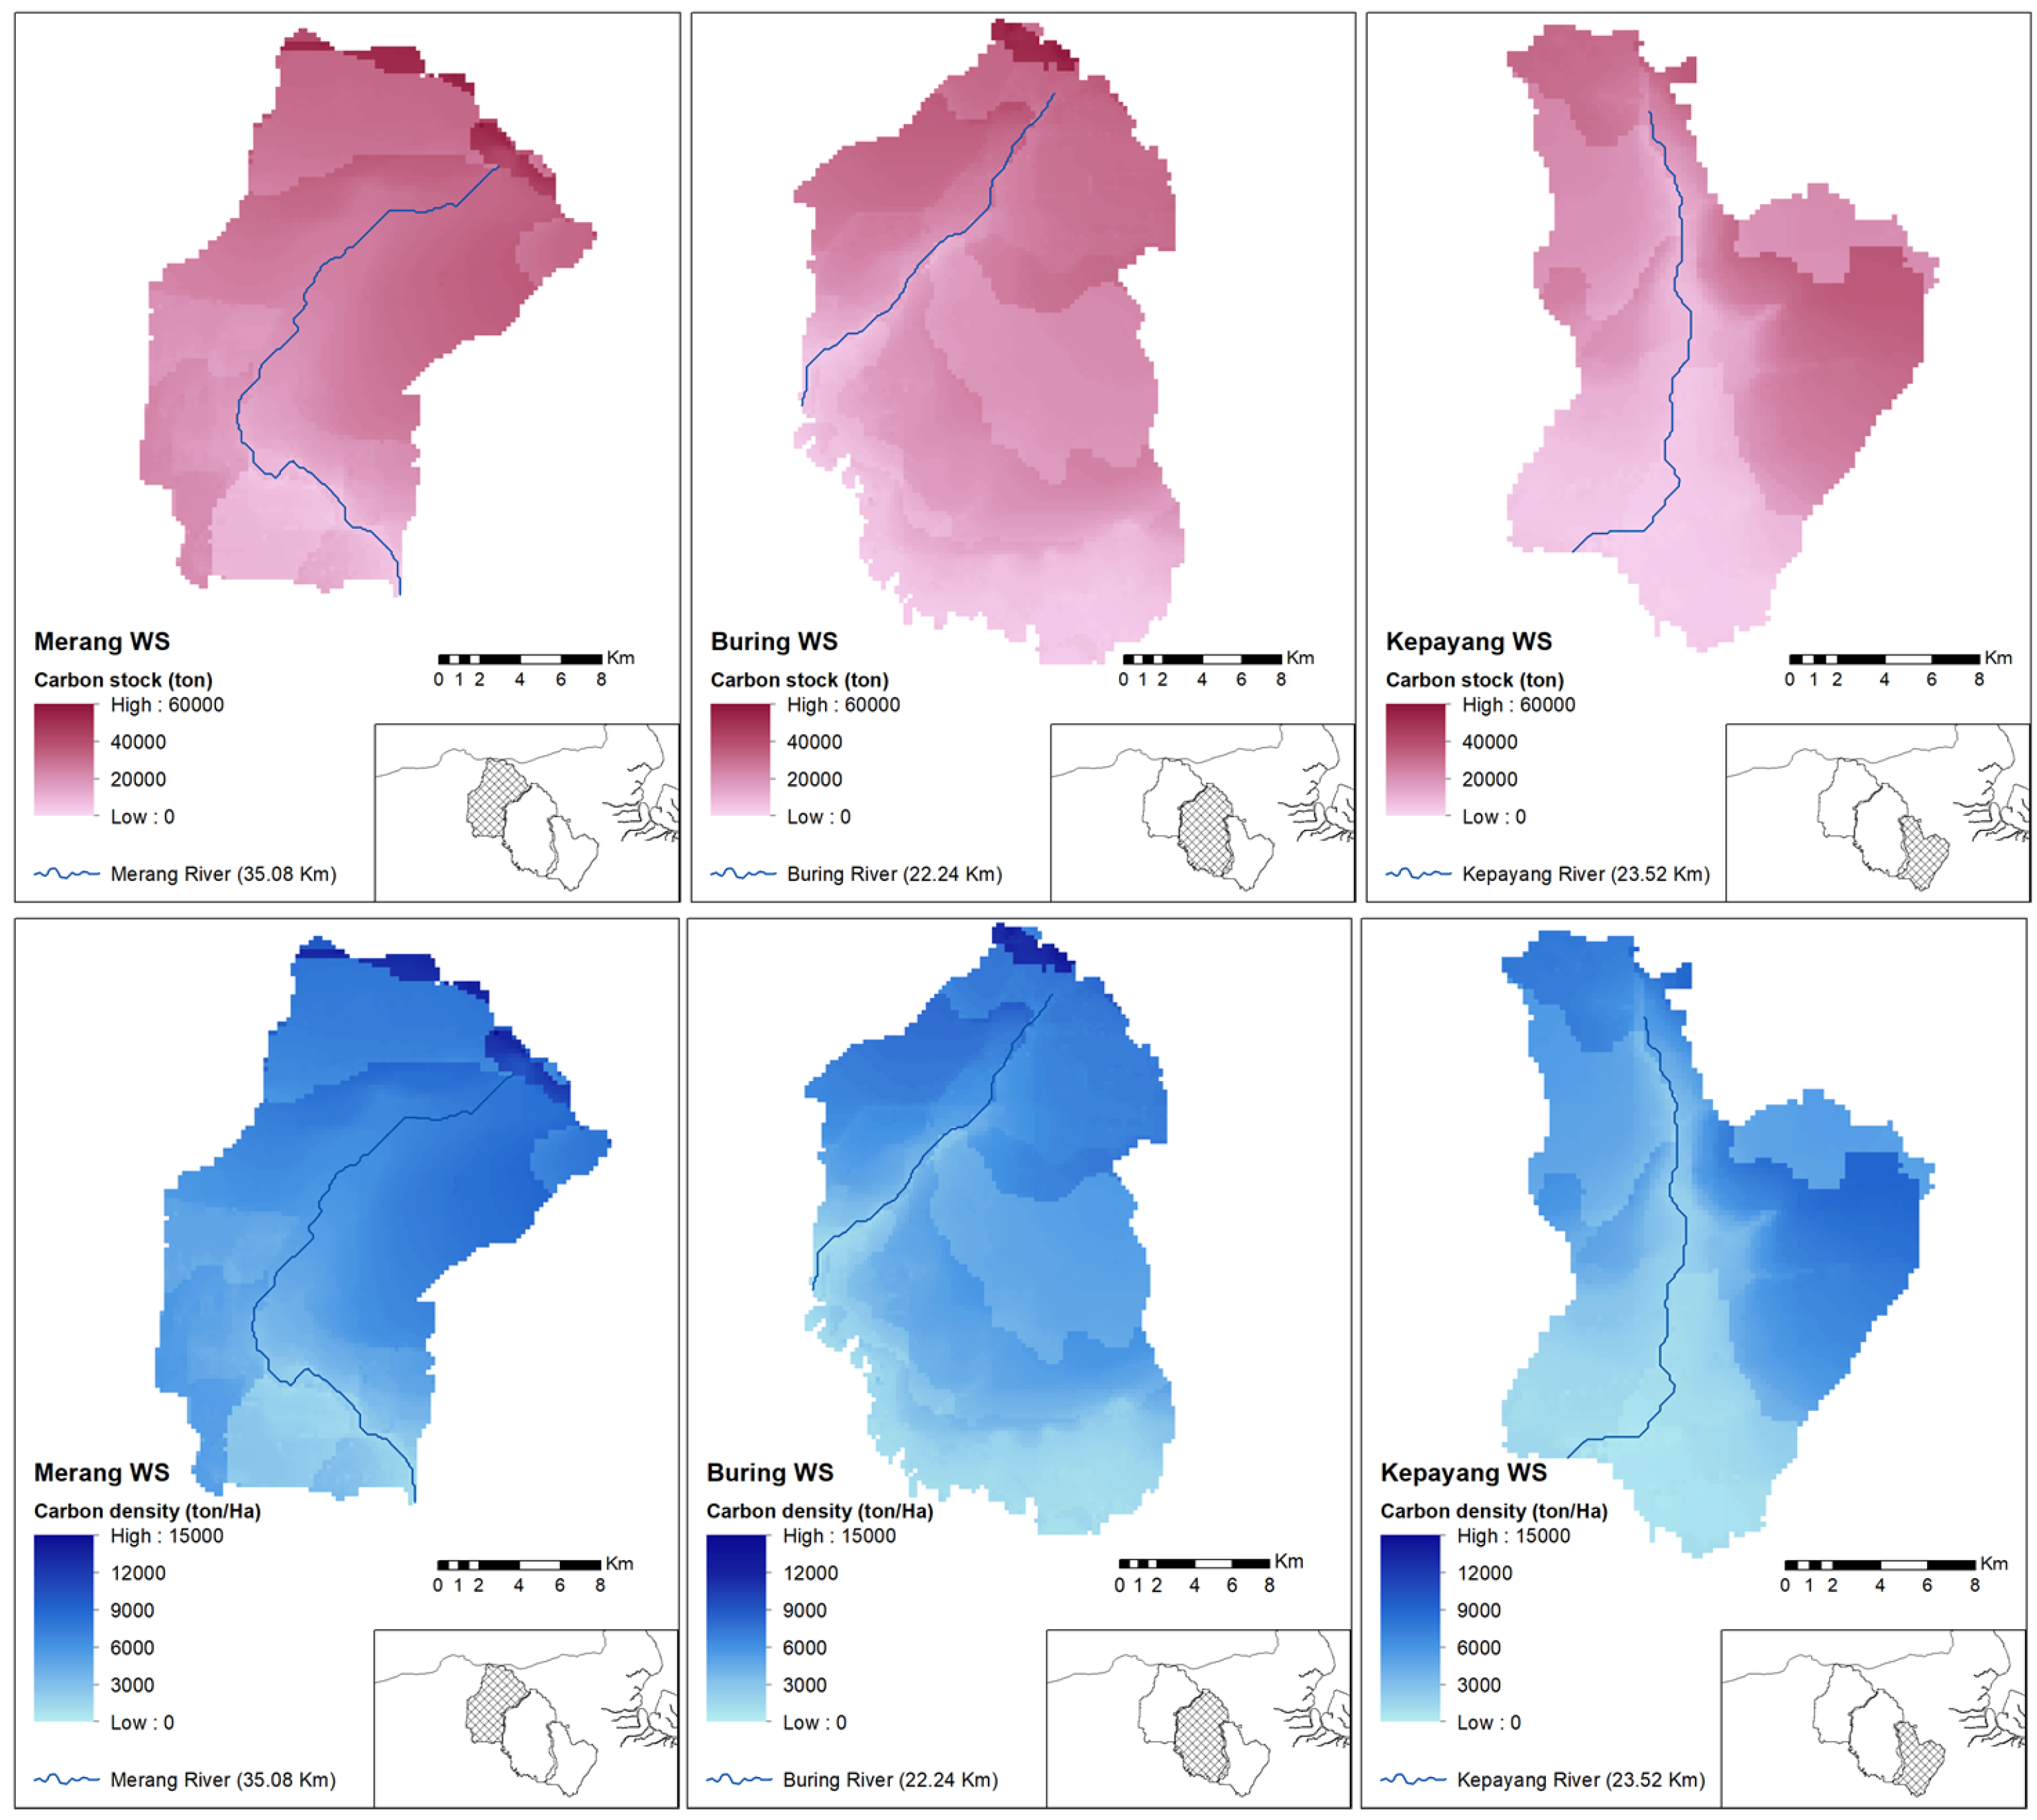
3.14. Carbon Stock Analysis

Figure 9 shows the spatial distributions of peat carbon and its density in the three watersheds. In the whole area, peat carbon was 220 Mt in Merang, 225.8 Mt in Buring, and 116.8 Mt in Kepahyang. Peat carbon density ranged from 0.0 to 9.11 kt ha−1 in Merang, from 0.0 to 9.11 kt ha−1 in Buring, and from 0.0 to 9.11 kt ha−1 in Kepahyang. The average peat carbon density was 6.11 kt ha−1 in Merang, 4.92 kt ha−1 in Buring, and 4.24 kt ha−1 in Kepahyang. In general, peat thickness weightily determined the peat carbon as greater peat thickness indicates more extensive carbon stock and density. Furthermore, since land elevation was strongly correlated with peat thickness, the higher land elevation was strongly correlated with the higher peat carbon.
The important findings of this assessment are resumed as follows:
1.
Based on water balance analysis, the highest rate of rainwater gain was 17.8 mm d−1 in Wet3, while that of the rainwater loss was −8.7 mm d−1 in Dry1. This is an indicator that the area has potential as peatland.
2.
The peat depth map in this study was derived from 337 soil boring points from secondary data and an additional 69 soil boring points from field surveys. The boring points are scattered in ten soil units. This means that each soil unit has an average of 40.6 points.
3.
This study estimated that the underground peat carbon was 220.2 Mt in Merang, 225.8 Mt in Buring, and 116.8 Mt in Kepahyang. Peat carbon density ranged from 0.98 to 14.65 kt ha−1 in Merang, from 0.68 to 14.3 kt ha−1 in Buring, and from 0.0 to 9.11 kt ha−1 in Kepahyang. The average peat carbon density was 6.11 kt ha−1 in Merang, 4.92 kt ha−1 in Buring, and 4.24 kt ha−1 in Kepahyang. This value is higher than that reported by Saragi-Sasmito et al. [1], 1752(401) M g C/ h a , of which 93% was stored in belowground organic peat soils. Draper et al. [12] reported that peatland pole forest is found to be the most carbon-dense ecosystem identified in Amazonia ((1391 ± 710) M g C/ h a ) (note: 1 k t C = 1000 M g C).
4.
The peat content estimation is higher than in the previous study. This could be caused by the approach to calculating the volume of the peat by the grid method. This is in line with the results from [4] which indicated that the geostatistical approach has as much as 10% more peat C than mean depth calculations.
5.
Since land elevation is strongly correlated with peat thickness, the higher land elevation is also strongly correlated with higher peat carbon. Mostly in the higher land elevation, the peat is hemist-saprist. These are the mature peats that possess the highest belowground carbon stocks.
6.
Secondary forest is concentrated at higher elevations, while shrub predominantly covers lower elevations. This happens because the water levels are dynamically below the land surface in the area with higher elevation. Therefore, the primary forests that were cleared by logging concessions years ago are naturally replaced by wild trees that formed the secondary forests. These aerobic-anaerobic conditions of the soils allowed the trees to grow correctly.
7.
Shrubs predominantly cover the areas in the lower elevations where the water levels were usually closer to the surfaces, faced waterlogged problems, and formed floodplains. Due to these conditions, trees are challenging to grow.
8.
The relationship between B D and P O R is relatively linear, with R 2 = 0.64 , P O R = 2.67 B D + 0.7872 . This equation may be practically helpful for calculating P D , which is very difficult and time-consuming to measure.

4. Conclusions and Recommendations

In conclusion, these 3 watersheds are carbon-rich areas worthy of conservation while a small portion (<30%) may be used for cultivation. Carbon stocks from this assessment are higher than those of a similar previous study. This could be caused by the approach to calculating the volume of the peat by the grid method. There is a relationship between carbon stock and elevation, where most of the high carbon stock is at higher elevations. Furthermore, the trees in the secondary forest are primarily found at higher elevations, while the shrubs are located at lower elevations. This is due to water table conditions: it is below the land surface in higher elevations and it is close to the land surface in lower elevation.
The peat’s physical and chemical properties in this study are from 47 samples. These samples have represented all ten soil units. However, there are some limitations to having more samples because some areas in the field are under inundated conditions almost all year. For future works or recommendations, it would be better to develop a standard method for collecting and analyzing peat samples from the inundated area. During the field survey in the dry season, accessibility to the peatland is limited due to the lack of water access. However, during the wet season, although access is not the problem anymore, the samples could not be collected with the current standard method.

Author Contributions

Conceptualization, Y.S. and B.I.S.; methodology, Y.S. and B.I.S.; software, Y.S. and A.P.; validation, B.I.S. and L.M.; formal analysis, B.I.S., L.M., and A.P.; investigation, Y.S., L.M., and A.P.; resources, D.B.; data curation, Y.S., L.M., and A.P.; writing—original draft preparation, B.I.S.; writing—review and editing, Y.S. and B.I.S.; visualization, A.P.; supervision, B.I.S. and D.B.; project administration, D.B.; funding acquisition, D.B. All authors have read and agreed to the published version of the manuscript.

Funding

This research was funded by the Zoological Society of London (ZSL) Indonesia to LPPM IPB University under research contract from 19 March 2018.

Institutional Review Board Statement

Not applicable.

Informed Consent Statement

Not applicable.

Data Availability Statement

Not applicable.

Acknowledgments

We would like to thank to David Ardhian, Edwin Wira Pradana, Edwin Hermawan, and all the staff of ZSL Indonesia in Bogor and in Palembang for providing assistance and help in supporting the research. In terms of government officers, we would like to thank Bapak Hadenli Ugihan (PSU Kelola Sendang), Ibu Regina Aryani (Bappeda South Sumatera Province), and Bapak Syafrul Yunardi (TRG South Sumatera) and all the staff whose names we cannot exhaustively list here. Our sincere acknowledgments also go to some the staff of some private companies: Bapak Bowo Suratmanto and the staff from PT Rimba Hutani Mas (RHM) and Riza Suarga and the staff from PT Global Alam Lestari (GAL) and Bapak Soegeng Irianto and Bapak Zulfikar (former PT GAL head and staff), for constantly facilitating our efforts during fieldwork.

Conflicts of Interest

The authors declare no conflict of interest. The funders had no role in the design of the study; in the collection, analyses, or interpretation of data; in the writing of the manuscript, or in the decision to publish the results.

References

  1. Saragi-Sasmito, M.F.; Murdiyarso, D.; June, T.; Sasmito, S.D. Carbon stocks, emissions, and aboveground productivity in restored secondary tropical peat swamp forests. Mitig. Adapt. Strateg. Glob. Chang. 2019, 24, 521–533. [Google Scholar] [CrossRef] [Green Version]
  2. Warren, M.W.; Kauffman, J.B.; Murdiyarso, D.; Anshari, G.; Hergoualc’h, K.; Kurnianto, S.; Purbopuspito, J.; Gusmayanti, E.; Afifudin, M.; Rahajoe, J.; et al. A cost-efficient method to assess carbon stocks in tropical peat soil. Biogeosciences 2012, 9, 4477–4485. [Google Scholar] [CrossRef] [Green Version]
  3. Warren, M.; Hergoualc’h, K.; Kauffman, J.B.; Murdiyarso, D.; Kolka, R. An appraisal of Indonesia’s immense peat carbon stock using national peatland maps: Uncertainties and potential losses from conversion. Carbon Balance Manag. 2017, 12, 12. [Google Scholar] [CrossRef] [PubMed]
  4. Beilman, D.W.; Vitt, D.H.; Bhatti, J.S.; Forest, S. Peat carbon stocks in the southern Mackenzie River Basin: Uncertainties revealed in a high-resolution case study. Glob. Chang. Biol. 2008, 14, 1221–1232. [Google Scholar] [CrossRef]
  5. Subardja, D.S.; Ritung, M.A.; Sukarman, E.S.; Subandiono, R.E. Petunjuk Teknis Klasifikasi Tanah Nasional. Edisi Ke-2. Balai Besar Penelitian dan Pengembangan Sumberdaya Lahan Pertanian; Badan Penelitian dan Pengembangan Pertanian: Bogor, Indonesia, 2016; p. 60. [Google Scholar]
  6. Agus, F.; Hairiah, K.; Mulyani, A.; World Agroforestry Centre (ICRAF). Pengukuran cadangan karbon tanah gambut; World Agroforestry Centre (ICRAF): Bogor, Indonesia, 2011. [Google Scholar]
  7. Sencaki, D.B.; Muhammad, D.J.; Sumargana, L.; Gandharum, L. Peatland Delineation Using Remote Sensing Data in Sumatera Island. In Proceedings of the 2018 IEEE Asia-Pacific Conference on Geoscience, Electronics and Remote Sensing Technology (AGERS), Jakarta, Indonesia, 18–19 September 2018; pp. 1–6, ZSCC: 0000004. [Google Scholar] [CrossRef]
  8. Carless, D.; Luscombe, D.J.; Gatis, N.; Anderson, K.; Brazier, R.E. Mapping landscape-scale peatland degradation using airborne lidar and multispectral data. Landsc. Ecol. 2019, 34, 1329–1345. [Google Scholar] [CrossRef] [Green Version]
  9. Carless, D.; Kulessa, B.; Booth, A.D.; Drocourt, Y.; Sinnadurai, P.; Street-Perrott, F.A.; Jansson, P. An integrated geophysical and GIS based approach improves estimation of peatland carbon stocks. Geoderma 2021, 402, 115176. [Google Scholar] [CrossRef]
  10. Zhang, Z.; Moore, J.C. Chapter 5—Basic Probability and Statistics. In Mathematical and Physical Fundamentals of Climate Change; Zhang, Z., Moore, J.C., Eds.; Elsevier: Boston, MA, USA, 2015; pp. 125–160. [Google Scholar] [CrossRef]
  11. Irsyad, F.; Saptomo, S.K.; Setiawan, B.I. Penentuan Awal Dan Durasi Musim Kemarau Menggunakan Fungsi Polynomial Dengan Aplikasi Visual Basic for Applications (VBA). Agromet 2018, 28, 40–46. [Google Scholar] [CrossRef]
  12. Draper, F.C.; Roucoux, K.H.; Lawson, I.T.; Mitchard, E.T.A.; Coronado, E.N.H.; Lähteenoja, O.; Montenegro, L.T.; Sandoval, E.V.; Zaráte, R.; Baker, T.R. The distribution and amount of carbon in the largest peatland complex in Amazonia. Environ. Res. Lett. 2014, 9, 124017, ZSCC: 0000160. [Google Scholar] [CrossRef]
Figure 1. Study-site in South Sumatra Province.
Sustainability 14 05473 g001
Figure 2. Annual rainfall minus evapotranspiration.
Sustainability 14 05473 g002
Figure 3. The monthly rainfall, evapotranspiration, and water balance for 42 years.
Sustainability 14 05473 g003
Figure 4. Available rainwater in the wet and dry periods.
Sustainability 14 05473 g004
Figure 5. Land elevations in Merang, Buring, and Kepahyang.
Sustainability 14 05473 g005
Figure 6. Land uses in Merang, Buring, and Kepahyang.
Sustainability 14 05473 g006
Figure 7. Soil units in Merang, Buring, and Kepahyang. Numbers 1–10 is the major soil unit.
Sustainability 14 05473 g007
Figure 8. Spatial distributions of the Peat Thickness in Merang, Buring, and Kepahyang.
Sustainability 14 05473 g008
Figure 9. Spatial distributions of the peat carbon and its density in Merang, Buring, and Kepayang.
Sustainability 14 05473 g009
Table 1. Peat parameters to be measured from the peat samples.
NoParameterAbbreviation
1PorosityPOR
2Bulk DensityBD
3Particle DensityPD
4Ash ContentAC
5Organic MatterOM
6C-OrganicsCO
7pHpH
8Fiber ContentFC
Table 2. Available rainwater during the wet and dry periods.
PeriodsProb.Water Depth (mm)Peak Rate (mm)
MinAveMaxMinAveMax
Wet198%250.1556.3862.54.810.115.4
Dry198%−219.1−103.612.0−8.7−4.6−0.5
Wet295%311.0619.8928.54.28.512.8
Dry264%−397.1−209.7−22.4−5.1−3.0−0.9
Wet357%203.3470.5738.83.510.717.8
Dry312%−67.6−34.2−0.8−7.1−4.4−1.7
Table 3. Statistical peat properties of 47 samples in Merang, Buring, and Kepayang.
ParameterMinMaxAverageStdStd (%)
POR (%)657401334
BD (g/cc)0.080.260.140.0535
PD (g/cc)0.180.280.230.0912
AC (%)193257
OM (%)91999722
CO (%)47525012
FC (%)1158321237
pH4.56.25.40.510
Publisher’s Note: MDPI stays neutral with regard to jurisdictional claims in published maps and institutional affiliations.

