Abstract
The Keetch–Byram Drought Index (KBDI) is a numerical value reflecting the dryness of the top layer of soils, deep forest litter, logs, and living vegetation. The KBDI is expressed as a scale from 0 to 200, where the number represents the amounts of rainfall (in millimeters) to return the soil to saturation. We proposed a method to integrate peatland groundwater as a key variable for the peatland forest fire hazard, and we called it mKBDI. The groundwater table was obtained from the SWAT-MODFLOW model simulation. The MODFLOW model uses a 200 m × 200 m grid. The SWAT-MODFLOW model was calibrated and validated using daily water level measurements in the river. The model failed to represent peak flow, but the model produced the average water level. Output from the simulation was read using the FloPy module, and then mKBDI was calculated. The daily calculations of the mKBDI for each grid for the catchment were saved in the NetCDF format using the x-array module. We applied this model in the Peatland Hydrological Unit (PHU) Merang-Kepahyang, South Sumatera, Indonesia, in 2015 (El-Niño year) and 2016 (La-Nina Year). The daily mKBDI index from all the grids in the catchment was classified into three classes: low (mKBDI < 100), moderate (mKBDI = 101–150), or high (mKBDI > 150). Then, the whole catchment was classified according to these classes. Therefore, every day the percentage of the area with low, moderate, or high class in the catchment dynamically changed. When these classes were verified with hotspot data, all hotspots only coincided with the high hazard classes, where more than 60% was area of the catchment. No hotspot data were reported on low/moderate levels throughout 2015/2016. In the larger area with high mKBDI classes, the frequency of hotspots substantially rose. Sixty-three hotspots occurred during August–October of 2015 when the area of high hazard classes was above 70%. Through this finding, we proposed to use a 60% area of the catchment with high mKBDI classes as a threshold value indicating that the area is prone to peatland fire. Therefore, the peatland restoration project in preventing the fire could be evaluated using this indicator. If the restoration projects could reduce the area with high mKBDI classes to less than 60% for the whole year, we could accept it as a successful project.
1. Introduction
The ability to predict peatland fire danger is important because peatland fire has caused losses in both economics and ecosystem biodiversity [1]. Total carbon losses from the 1997 peatland fires in Central Kalimantan are estimated to have been in the range of 0.218 Gt C to 0.491 Gt C, with the greatest contribution of atmospheric derived from peat rather than forest combustion [2]. Hayasaka et al. [3] estimated that maximum peak concentrations of , , , and were also observed during 2002, and their values reached 1905 × 10 gm, 85.8 × 10 gm, 38.3 × 10 gm, and 1003 × 10 gm, respectively.
There has been rising awareness in peatland studies, but fire-drought research that integrates groundwater as a key variable for fire hazards in Indonesian peatlands is limited. Previous studies mostly applied climate variables to predict soil moisture deficiency as a proxy of fire hazards, such as the Keetch–Byram Drought Index (KBDI) [4] and the Fire Weather Index (FWI) [5]. In peatlands, groundwater tables strongly control soil moisture dynamics, which causes a fire hazard [6,7,8,9].
Based on field measurements in several peatland locations in Indonesia, Taufik et al. [8] established a peatland fire danger index model. We named it modified-KBDI (mKBDI), and it integrates groundwater tables in the calculations. The mKBDI model could predict fire danger in some spots based on daily climate data and groundwater tables. However, the application of the model is limited because continuous daily groundwater table data in peatland are scarce in Indonesia. Carlson et al. [10] compiled water table depth on peat at 59 sites across 12 published research studies. Unfortunately, not all of the data are continuous and daily.
To overcome this, we propose the SWAT-MODFLOW model as a basis to provide a daily spatial water table so that spatial peatland fire danger can be calculated. The SWAT model is a surface hydrological model used worldwide [11,12]. SWAT is flexible because it can use grid precipitation data from GPM NASA and grid air temperature data from MERRA2 NASA. The other climate input in SWAT is easily available as SWAT is equipped with a weather generator (Senent-Aparicio et al. [13], Yang et al. [14]. Though SWAT is also equipped with its groundwater module, it is not suitable for peatland fire danger because the unit area is the Hydrological Response Unit (HRU), of which the size is mainly varied. Therefore, in this study, we proposed to use the MODFLOW groundwater model to replace the SWAT groundwater module following the approaches of several authors (Aliyari et al. [15], Bailey et al. [16], Kim et al. [17], Molina-Navarro et al. [18]). Here, we used the peatland layer as one layer in the MODFLOW model with a grid size of 200 m × 200 m, which is adequate enough to describe the groundwater fluctuation. The output of SWAT-MODFLOW in the MODFLOW format is processed using Python FloPy module. By coupling SWAT-MODFLOW, the daily groundwater table provided by the FloPy module is used to calculate mKBDI in each grid, which is then exported in the NetCDF format using the Python x-array module.
The SWAT-MODFLOW model was calibrated and validated using daily water level measurements in the river. Then, the fire hazard index derived from the SWAT-MODFLOW water table was cross checked with fire hotspots from NASA. This approach is used by Liew et al. [19], where hotspots are used as the reference data set to perform a validation study of the MODIS active fire detection algorithm. The relation between the number of hotspots and the mKBDI index is derived by aggregating the mKBDI index for the hydrology catchment. Here, the unit of analysis of mKBDI is the hydrology catchment. The mKBDI index from all the grids in the catchment are classified into three levels: low (), moderate (mKBDI = 101–150), or high (). The hazard class followed previous research in Southeast Asia where the (standard) classification was tested in previous research based on fire characteristics [8,20]. For comparison, a previous study [21] used the Standardized Precipitation Index (SPI), a different standard to apply for peat fire risk assessment in Central Kalimantan, Indonesia. Next, on a daily basis, we calculated the percentage of the area with low, moderate, or high class in the catchment. After this, the daily percentage of the three classes was correlated with the daily number of hotspots in the catchment to validate the model. The time of validation was 2015 and 2016. The year 2015 was chosen to represent the dry year during the El Niño period, while the year 2016 was chosen to represent the wet year during La Nina period [21,22,23,24,25].
2. Materials and Methods
2.1. Study Sites
The location of the study is in Peat Hydrology Unit (PHU) Merang-Kepahyang. This study site is administratively located within Musi Banyuasin (MUBA) Regency of the South Sumatra Province, as shown in Figure 1.
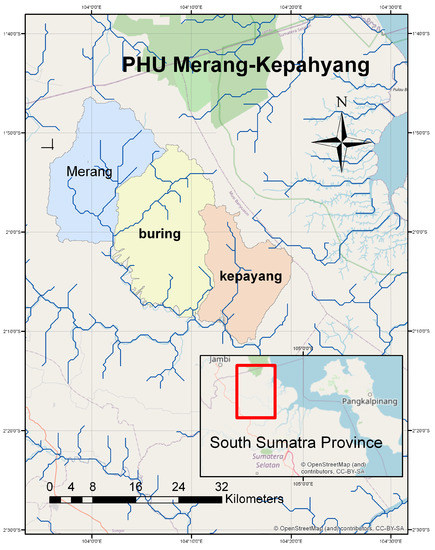
Figure 1.
Study site in South Sumatra Province (basemap from ©OpenStreetMap contributors).
On the northern side of the study area, the site borders the Muaro Jambi Regency of Jambi Province, while on the southern side it borders the Banyuasin Regency of South Sumatra Province. The studied site can be reached by road from Palembang City, the capital of South Sumatra, in about 6 h by car, and from Muaro Jambi in about 3 h by car. The studied site is composed of 3 sub-watersheds. These are, from north to south:
- Merang, with the area measuring about 360 km and the length of the river about 35 km.
- Buring, with the area measuring 459 km and the length of the main river about 22 km.
- Kepahyang, with the area measuring about 275 km and the length of the main river about 24 km.
There have been 15 forest fires in the area from 2001 to 2015 (private conversation with Kelola Sendang). Kelola Sendang was a ZSL-run project, working with the Indonesian Government, communities, and the private sector across 1.6 million hectares in South Sumatra (including the study site).
The spatial distributions of peat thickness in Merang, Buring, and Kepahyang are shown as in Figure 2.
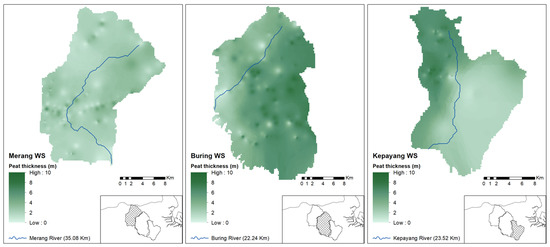
Figure 2.
Spatial distributions of peat thickness in Merang, Buring, and Kepahyang (source: Kelola Sendang Project).
2.2. SWAT Input Data
The SWAT model was constructed using ArcSWAT version 2012.10_4.21 released on 9 October 2018 with ArcGIS version 10.6. The canals and natural streams were collected from secondary data and verified in the field surveys. The catchments area was constructed using pre-defined watershed data with the given canals and natural streams network. The SWAT input data consisted of two types of maps, raster and vector. The following table (Table 1) summarizes the maps and their metadata.

Table 1.
Spatial data used in the SWAT model.
The study combined several data sets of climate and hydrology (Table 2) as the input to the SWAT model and drought-fire index. The region has two distinct seasons with ca. 2500 mm of annual rainfall. The peak dry season occurs from August to September, when the monthly rainfall is below 100 mm. The typical wet season appears from November to March.
Table 2.
List of data for drought-fire index calculation. Unit time calculation is daily.
The required data have different spatial resolutions. We argue that the resolutions of the climate data used in this study were appropriate, as the location is relatively flat topographically. Therefore, the spatial variability in the temperature data in this location was relatively small. The years of 2015 and 2016 were chosen as study cases to explore the possible condition of extreme hazard, which could occur in the basin. A strong El Niño was represented by 2015, whereas La Nina climate occurred in 2016 [26,27]. However, the run of the SWAT model started in 2013, using 2-year warming periods.
2.3. MODFLOW Input Data
The MODFLOW model used in this study is a one-layer aquifer derived from a peat depth map (Figure 2). The spatial data of peat depth were obtained from secondary data (337 points) and primary data/field measurements (69 points). The primary data consisted of 31 points in Merang, 13 points in Buring, and 25 points in Kepahyang. Field measurements were conducted from 10 May to 25 May 2019 and from 21 June to 28 June 2019. Peat depth was measured using a sample ring mounted in metal rods extending to the deepest extent of 13 m from the land surfaces. The data were interpolated using the inverse distance weighted (IDW) method, which was available in the ArcGIS Desktop 10.5 software used. The data were then converted into a raster format with a 200 m resolution to be consistent with other data for the next analysis steps.
The MODFLOW model was built using the ModelMuse 3.0 software from the USGS. The MODFLOW package used in the model was the River package, with the input data from the maps of canals and natural streams in SWAT model. The MODFLOW model used a 200 m × 200 m grid cell. This study uses three SWAT-MODFLOW models, i.e., Merang, Buring, and Kepahyang. Grids with dimensions of 200 m × 200 m were generated in: Merang, covering 40,425 m to 40,432 m per grid with a total of 8914 grids; Buring, covering 40,485 m to 40,493 m per grid with a total of 11,325 grids; and Kepahyang, covering 40,619 m to 40,626 m per grid with a total of 6778 grids.
As an illustration, the layout of the Buring MODFLOW model is shown in Figure 3.
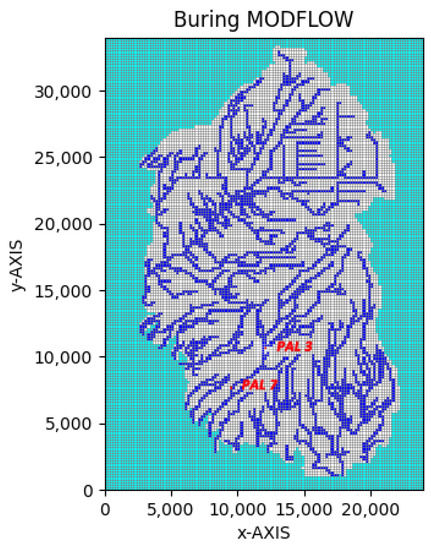
Figure 3.
MODFLOW model for Buring watershed.
For the numerical modeling, the following Table 3 showed the MODFLOW parameters used in the model:
Table 3.
Property parameters in the MODFLOW Model.
2.4. Modified Keetch–Byram Drought Index (mKBDI)
The modified Keetch–Byram Drought Index (mKBDI) is a modification of the KBDI to apply to peatland. The KBDI estimates the amount of soil moisture by tracking daily maximum temperatures and rainfall [28,29].
In this study, we apply the index of the mKBDI to assess daily fire hazard and the associated fire hazard class (i.e., low, moderate, and high). The hazard class follows previous research in Southeast Asia [7,8,30]. The daily time-step calculation of the mKBDI is as follows [7]:
Here, is the drought factor, is the rainfall factor, and is the water table factor on day t. The is scaled from zero to 203. is reached during prolonged heavy wet spells. On the other hand, long-lasting hot and dry spells create favorable conditions for the index to reach the maximum value of 203. The groundwater level affects the fire hazard, in which shallow groundwater tables reduce fire hazard through capillary rise. The drought factor reflects water loss through evapotranspiration, which is calculated using the following equation:
is the daily maximum temperature, and represents the annual rainfall in the location, which is ca. 2500 mm. Rainfall is considered to reduce the drought index, if it is more than 5.1 mm.
The rainfall factor was calculated using the following equation [31]:
Then, the water table factor () takes the following form:
The soil water content, , (mm) is calculated by applying the van Genuchten approach:
where, , are the residual and saturated soil moisture contents (mm), respectively, and and are the shape parameters (Van Genuchten 1980). h denotes the groundwater table depth (m).
Eventually, the probability of daily fire hazard was assessed using weather data for 2015 and 2016. Then, one of the three fire hazard classes was assigned to each day, namely, low (), moderate ( = 101–150), or high fire () hazard.
2.5. Area of Fire Hazard (AFH)
Area of fire hazard (AFH) was derived from the time series of the fire hazard class. We used several thresholds of to examine the severity of the fire hazard. For instance, we applied 30%, 40%, 50%, and 60% area, which belonged to the high-fire class. The was calculated using the following equation:
where: describes whether a grid cell g for day d and year i is in the fire hazard class (0–100: low; 101–150: moderate; 151–203: high), and is the number of grid cells in the sub-basin.
3. Results
3.1. Calibration and Validation of SWAT-MODFLOW Model
The SWAT model was calibrated using field measurements at two locations, at Pal 3 (104.119° E, 2.056° S) and Pal 7 (104.096° E, 2.084° S) in the Buring watershed, as shown in Figure 3. The canal segment length between Pal 3 to Pal 7 is 5.8 km. The canal is a man-made canal for timber logging with an average width of 2.4 m. The average canal depth in Pal 3 is 0.5 m, while the average depth in Pal 7 is 1.5 m. During high flow, the larger part of the water flows to the flood plain on the left and right of the canal.
Pal 3 is the furthest upstream of the canal. In Pal 3 and 7, water levels were measured using the Global Water WL16 logger at 1 h intervals. The measurements were conducted from 28 July 2018 to 1 October 2018. Due to a broken instrument in Pal 3, only at Pal 7 was the measurement continued to 14 February 2019. The water level measurements from 28 July 2018 to 1 October 2018 were used for calibration, while the measurements from 2 October to 14 February 2019 were used for validation. Here, the water level was aggregated to a daily level and then converted for the discharge to be comparable with the daily output discharge from the SWAT model.
The daily discharge measurement and discharge simulation at Pal 3 and Pal 7 are shown in Figure 4 and Figure 5.
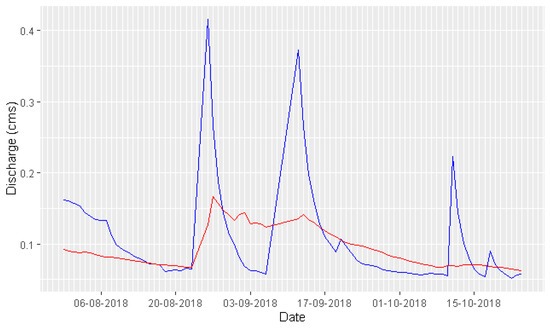
Figure 4.
Model calibration at Pal 3, using observation discharge (red line) and simulation discharge (blue line).
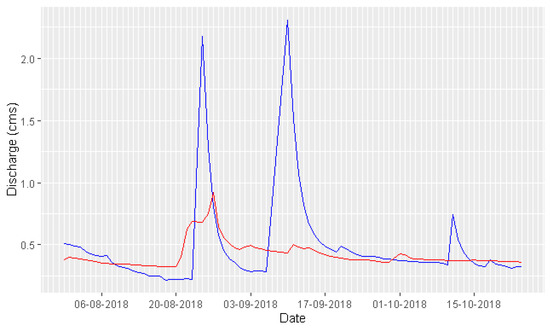
Figure 5.
Model calibration at Pal 7, using observation discharge (red line) and simulation discharge (blue line).
The calibration at Pal 3 had an NSE value of 0.244 and a Pearson correlation coefficient of 0.528, with a p-value of 2.46 × 10, while at Pal 7, the NSE value was 0.183 with the Pearson correlation coefficient was 0.493, with a p-value of 1.24 × 10. These NSE values were lower due to high flows during the measurement periods. During high flow, the larger part of the water flows on the flood plain. There is no rating curve for these events because there were no discharge measurements to relate to the flow depths.
For the validation of the model, the discharge measurement and discharge simulation at Pal 7 are shown in Figure 6.
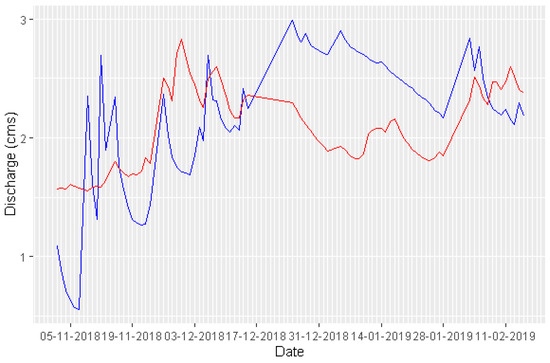
Figure 6.
Model validation at Pal 7, using observation discharge (red line) and simulation discharge (blue line).
The validation at Pal 7 had an NSE value of 0.038 and a Pearson correlation coefficient of 0.338, with a p-value of 0.00148. The NSE value for validation was lower than the one in the calibration because the measurement period for the validation was during the rainy season when the high flow occurred more frequently.
For the MODFLOW model, water level measurements at Pal 3 and Pal 7 could not be used for calibration and validation due to technical reasons. There is a trade-off between accuracy and computation. The accuracy requires the grid size of the MODFLOW model at the resolution of 2 m × 2 m to accommodate the width of the canals in the field. However, the computation capability is practically limited to the MODFLOW model with a 200 m × 200 m grid. This renders the calibration and validation unsatisfactory because the water level measurements at the canal with a width of 2.4 m are not compatible with the 200 m MODFLOW grid. Therefore, we tried to validate the SWAT-MODFLOW model with fire hotspots data by converting it to the Peatland Fire Danger Index. This is one of the main findings of our study.
3.2. Peatland Fire Danger Index
The study area consists of three sub-basins, namely: (i) Buring, (ii) Kepahyang, and (iii) Merang. Further analysis showed that the results were similar in the three sub-basins. Since sub-basin Buring is the largest among the three and its position is in the middle, the results and analyses of Peatland Fire Danger Index will be focused on sub-basin Buring. The spatial-temporal evolution of fire hazard in Buring is presented in Figure 7. Figure 7 (January–June 2015) explains the distribution of fire hazard before the El Niño event. The figure shows that locations close to the canal network showed a lower hazard than distant ones. This evidence revealed that horizontal drainage flux occurred toward the canal, leading to groundwater drawdown. More water was expected close to canal networks. For instance, on 7 June 2015, where a high hazard occurred in 41% area, there was 35% area surrounding the canals with low hazards (green color). A similar phenomenon also was found in the period of July–December 2015, when El Niño struck (Figure 7).
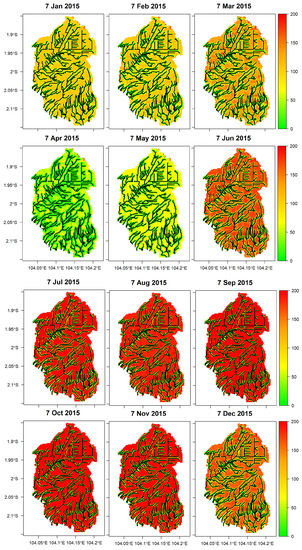
Figure 7.
Spatial-temporal evolution of fire hazard in 2015. The hazard is scaled from 0 (green) to 203 (red).
Highly dense drainage accelerated groundwater drawdown throughout the year. When the period of low precipitation struck, the impact of drainage was detrimental, as shown in the dry season of 2015. More than 60% of the sub-basin was reported at high hazard levels (Figure 7) during July–November 2015.
Hardly any large areas of high fire hazard were reported for the La Nina year. In January 2016, more than 80 of the area was at low- and medium-level fire hazards. The remaining belong to high hazards. The same pattern was monitored in February 2016, with an exception during the first week of February, when the high hazard area was slightly larger (~2%) compared to the low one (see Figure 8 for 7 February 2016).
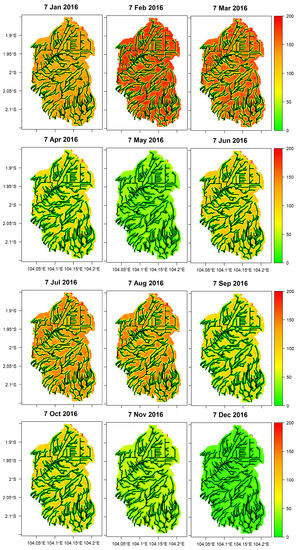
Figure 8.
Spatial-temporal evolution of fire hazard in 2016. The hazard is scaled from 0 (green) to 203 (red).
In March 2016, a low hazard dominated by more than 55% area, then it continued to attain ~90% in April–May 2016. The more medium level was developed in June 2016 by 16% higher than that of May (10%). However, hardly any high levels were monitored, as many of the 73% area in June belonged to a low hazard.
Normally, in July, less rainfall was observed. Here, the medium hazard developed until it attained 30% area. A location far away from the canal was monitored at a high level, but it was only covered by less than 10%. A similar pattern was found in August 2016. By contrast, more than 60% area in 2015 was identified as high hazards in the same months. The long rainy season triggered by La Nina, which provided more rainfall, could keep the groundwater table high. More rain in July and August could save the high hazard level below 14%. In 2015, the high hazard in July/August was four times higher. In the remaining months, a high hazard was monitored in few areas (<1%), and a low hazard predominantly in the area until 99% in December 2016 (Figure 8).
4. Discussion
Modeling SWAT-MODFLOW in peatland is challenging work. The inundation conditions shaping the peatland made the calibration and validation of the discharge in the rivers and canals harder. For the high flow, we failed in calibrating and validating the SWAT-MODFLOW model. Because during high flow a more significant part of the water flows in the flood plain, the existing canal capacity was exceeded, and the relation between flow depth and discharge changed drastically. Unfortunately, there are no data for the transformation of water level to discharge for high flow due to a lack of information on the discharge. Had we placed the observation instruments in a large canal, we could not guarantee that the flow was natural. Most of the large canals in the study area are downstream of the catchments, and are affected by timber logging operations and water management operations of the plantations by installing gates in the canals to the downstream outlets. This is a dilemma in the fields. With this limitation, we tried to evaluate the model during the prolonged drought period and validate it based on the fire hazard using the fire hotspots.
In modified KBDI (mKBDI) equations, there is no parameter relating the fire risk to El Niño events directly. However, empirically there is a relation between El Niño events and the drought in Indonesia, which helps to explain the fire risk. Setiawan et al. [22] stated that some parts of Indonesia have a meteorological drought during moderate and strong El Niño events. The study by Pan et al. [23] showed that drought and fires in Indonesia that occurred during the El Niño events from 1979 to 2016 were more intense and prolonged. This fact is also supported by Field et al. [24]. According to Field et al. [24], Indonesia’s fire season and smoke in 2015 were more severe than in 2006. The NASA Earth Observing System satellite data from 2000 recorded these events.
Here, we analyzed fire hazards in the Merang-Ngirawan basin for two contrasting climate extremes: (i) El Niño in 2015, and (ii) La Nina in 2016. Fire hazard was calculated based on the mKBDI, in which the hazard was categorized into three classes, namely: low (0–100), moderate (101–150), and high (>150). Every day, each cell in the basin was identified with this category, then the proportion area for each category was calculated. All sub-basins showed a similar pattern of fire hazards. Persistent high mKBDI was monitored during the dry season. In 2015, the impact of El Niño was prominent, as indicated by a huge area of high hazard (more than 60%, Figure 7). Proportion areas with high hazards can show fire vulnerability, with Merang and Kepahyang likely more fire-prone than Buring (Figure 9). The causes of the break points in Figure 9 on August 5 or October 25 were due to the precipitations as shown in Figure 10. In addition, a large area with a high hazard in both sub-basins developed earlier than in Buring.
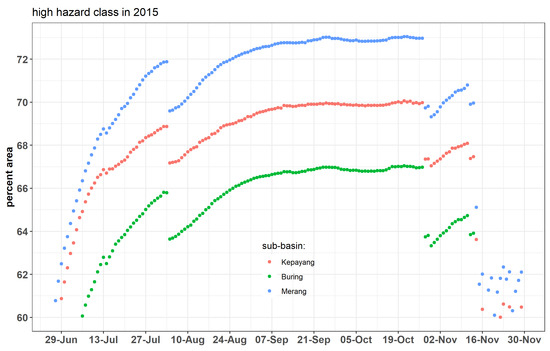
Figure 9.
Series of proportion areas (percent) for each basin that had a high mKBDI during El Niño 2015.
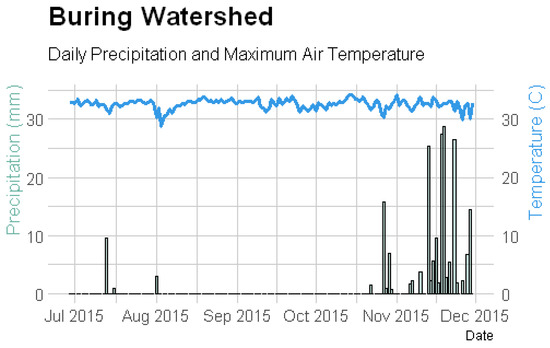
Figure 10.
Daily precipitation and maximum temperature in high mKBDI.
Then, the fire hazard was verified with hotspot data. All hotspots only coincided with the high hazard when it attained more than 60% area of the basin (Figure 11). No hotspot data were reported on low/moderate levels throughout 2015/2016. The larger the area with high mKBDI, the more the frequency of hotspots rose substantially. Sixty-three hotspots occurred during August–October 2015 when the high hazard area was above 70%.
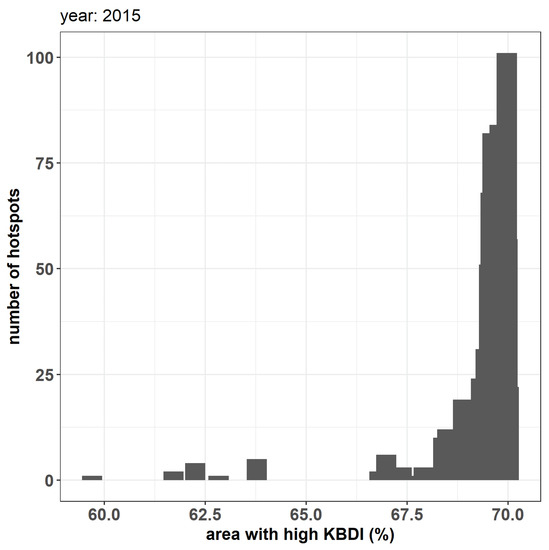
Figure 11.
Distribution of hotspots over areas with high mKBDI in 2015. Hotspots were only monitored when the area had high mKBDI ≥ 60%.
The relation between the drought and peat fire risk has also been studied by Hafni et al. [21]. Hafni et al. [21] used the Standardized Precipitation Index (SPI), a different standard for application to peat fire risk assessment in Central Kalimantan, Indonesia. The study showed a strong correlation (r = −0.61) between SPI-1 (short term) and the number of fires.
Based on these facts, we can be sure that the threshold value of 60% area is a new finding. Future research directions could be aimed at helping to determine the effectiveness of peatland rehabilitation by blocking canals. Currently, there are no quantitative methods to measure the effectiveness of peatland rehabilitation in Indonesia. With this model, using the threshold value 60% area of the basin with high hazard as an indicator, we could easily simulate the difference between the one with and the one without a blocking canal.
The Peatland Fire Danger Index in this study greatly depended on the groundwater table data, in which it was modeled. The correctness of groundwater table data determines the accuracy of the model in predicting the hazard. Further improvement of the model could be achieved by using field groundwater data as calibration factors.
5. Conclusions
Our SWAT-MODFLOW model could not be calibrated and validated properly. This is probably because our observation flow spots were in small canals, so that the high flow could not be recorded properly. However, for the long drought period, the SWAT-MODFLOW model transferred to the fire danger index model could show that the high fire danger index coincides with the number of hotspots. This research found that a 60% area of the basin with high hazards is the threshold value for classifying the area as prone to a peat fire. Through this finding, we proposed using 60% of a catchment area with high mKBDI classes as a threshold value that the area is prone to peatland fire. Therefore, the peatland restoration project in preventing fires could be evaluated using this indicator. If the restoration projects could reduce the area with high mKBDI classes to less than 60% for the whole year, then we could accept it as a successful project.
Author Contributions
Conceptualization, Y.S. and M.T.; methodology, Y.S., M.T. and B.I.S.; software, Y.S. and M.T.; validation, Y.S. and M.T.; formal analysis, Y.S., M.T. and B.I.S.; investigation, Y.S., M.T. and B.I.S.; resources, D.B. and B.D.; data curation, Y.S. and M.T.; writing—original draft preparation, Y.S. and M.T.; writing—review and editing, Y.S., M.T. and B.I.S.; visualization, M.T.; supervision, B.I.S. and D.B.; project administration, D.B. and B.D.; funding acquisition, D.B. and B.D. All authors have read and agreed to the published version of the manuscript.
Funding
This research was funded by the Zoological Society of London (ZSL) Indonesia to LPPM IPB University under a research contract on 19 March 2018.
Institutional Review Board Statement
Not applicable.
Informed Consent Statement
Not applicable.
Data Availability Statement
Not applicable.
Acknowledgments
We would like to thank to David Ardhian, Kresno Dwi Santosa, Edwin Wira Pradana, Edwin Hermawan, and all staff of ZSL Indonesia in Bogor and in Palembang for providing assistance and help in supporting the research. For government officers, we would like to thank Bapak Hadenli Ugihan (PSU Kelola Sendang), Ibu Regina Aryani (Bappeda South Sumatera Province), Bapak Syafrul Yunardi (TRG South Sumatera), and all the staff whose names are too numerous to mention. We also offer our sincere acknowledgments to some private companies’ staff: Bapak Bowo Suratmanto and the staff from PT Rimba Hutani Mas (RHM) and Riza Suarga, and the staff from PT Global Alam Lestari (GAL), Bapak Soegeng Irianto, and Bapak Zulfikhar (former PT GAL head and staff), for constantly assisting us during field work.
Conflicts of Interest
The authors declare no conflict of interest. The funders had no role in the design of the study; in the collection, analyses, or interpretation of the data; in the writing of the manuscript; or in the decision to publish the results.
References
- Glauber, A.J.; Moyer, S.; Adriani, M.; Gunawan, I. The Cost of Fire: An Economic Analysis of Indonesia’s 2015 Fire Crisis; Indonesia Sustainable Landscapes Knowledge Note No. 1. World Bank, Jakarta. ©World Bank. 2016. Available online: https://openknowledge.worldbank.org/handle/10986/23840 (accessed on 23 February 2022).
- Siegert, F.; Boehm, H.; Rieley, J.; Page, S.; Jauhiainen, J.; Vasander, H.; Jaya, A. Peat fires in Central Kalimantan, Indonesia: Fire impacts and carbon release. In Proceedings of the International Symposium on Tropical Peatlands, Jakarta, Indonesia, 22–23 August 2002; BPPT: Jakarta, Indonesia, 2002. [Google Scholar]
- Hayasaka, H.; Noguchi, I.; Putra, E.I.; Yulianti, N.; Vadrevu, K. Peat-fire-related air pollution in Central Kalimantan, Indonesia. Environ. Pollut. 2014, 195, 257–266. [Google Scholar] [CrossRef] [PubMed]
- Ganatsas, P.; Antonis, M.; Marianthi, T. Development of an adapted empirical drought index to the Mediterranean conditions for use in forestry. Agric. For. Meteorol. 2011, 151, 241–250. [Google Scholar] [CrossRef]
- Amiro, B.D.; Logan, K.A.; Wotton, B.M.; Flannigan, M.D.; Todd, J.B.; Stocks, B.; Martell, D. Fire weather index system components for large fires in the Canadian boreal forest. Int. J. Wildland Fire 2004, 13, 391–400. [Google Scholar] [CrossRef]
- Wösten, J.; Clymans, E.; Page, S.; Rieley, J.; Limin, S. Peat–water interrelationships in a tropical peatland ecosystem in Southeast Asia. Catena 2008, 73, 212–224. [Google Scholar] [CrossRef]
- Taufik, M.; Setiawan, B.I.; van Lanen, H.A. Modification of a fire drought index for tropical wetland ecosystems by including water table depth. Agric. For. Meteorol. 2015, 203, 1–10. [Google Scholar] [CrossRef]
- Taufik, M.; Setiawan, B.I.; Van Lanen, H.A. Increased fire hazard in human-modified wetlands in Southeast Asia. Ambio 2019, 48, 363–373. [Google Scholar] [CrossRef]
- Takeuchi, W.; Hirano, T.; Roswintiarti, O. Estimation Model of Ground Water Table at Peatland in Central Kalimantan, Indonesia. In Tropical Peatland Ecosystems; Springer: Tokyo, Japan, 2016; pp. 445–453. [Google Scholar] [CrossRef]
- Carlson, K.M.; Goodman, L.K.; May-Tobin, C.C. Modeling Relationships between Water Table Depth and Peat Soil Carbon Loss in Southeast Asian Plantations. Environ. Res. Lett. 2015, 10, 074006. [Google Scholar] [CrossRef]
- Ang, R.; Oeurng, C. Simulating streamflow in an ungauged catchment of Tonlesap Lake Basin in Cambodia using Soil and Water Assessment Tool (SWAT) model. Water Sci. 2018, 32, 89–101. [Google Scholar] [CrossRef]
- Rafiei Emam, A.; Kappas, M.; Linh, N.H.K.; Renchin, T. Hydrological Modeling and Runoff Mitigation in an Ungauged Basin of Central Vietnam Using SWAT Model. Hydrology 2017, 4, 16. [Google Scholar] [CrossRef]
- Senent-Aparicio, J.; Jimeno-Sáez, P.; López-Ballesteros, A.; Giménez, J.G.; Pérez-Sánchez, J.; Cecilia, J.M.; Srinivasan, R. Impacts of swat weather generator statistics from high-resolution datasets on monthly streamflow simulation over Peninsular Spain. J. Hydrol. Reg. Stud. 2021, 35, 100826. [Google Scholar] [CrossRef]
- Yang, X.; He, R.; Ye, J.; Tan, M.L.; Ji, X.; Tan, L.; Wang, G. Integrating an hourly weather generator with an hourly rainfall SWAT model for climate change impact assessment in the Ru River Basin, China. Atmos. Res. 2020, 244, 105062. [Google Scholar] [CrossRef]
- Aliyari, F.; Bailey, R.T.; Tasdighi, A.; Dozier, A.; Arabi, M.; Zeiler, K. Coupled SWAT-MODFLOW model for large-scale mixed agro-urban river basins. Environ. Model. Softw. 2019, 115, 200–210. [Google Scholar] [CrossRef]
- Bailey, R.T.; Wible, T.C.; Arabi, M.; Records, R.M.; Ditty, J. Assessing regional-scale spatio-temporal patterns of groundwater–surface water interactions using a coupled SWAT-MODFLOW model. Hydrol. Process. 2016, 30, 4420–4433. [Google Scholar] [CrossRef]
- Kim, N.W.; Chung, I.M.; Won, Y.S.; Arnold, J.G. Development and application of the integrated SWAT–MODFLOW model. J. Hydrol. 2008, 356, 1–16. [Google Scholar] [CrossRef]
- Molina-Navarro, E.; Bailey, R.T.; Andersen, H.E.; Thodsen, H.; Nielsen, A.; Park, S.; Jensen, J.S.; Jensen, J.B.; Trolle, D. Comparison of abstraction scenarios simulated by SWAT and SWAT-MODFLOW. Hydrol. Sci. J. 2019, 64, 434–454. [Google Scholar] [CrossRef]
- Liew, S.C.; Shen, C.; Low, J.; Lim, A.; Kwoh, L.K. Validation of MODIS fire product over Sumatra and Borneo using high resolution SPOT imagery. Proceedings of the KSRS 451 Conference. The Korean Society of Remote Sensing. 2003, pp. 1149–1151. Available online: https://www.koreascience.or.kr/article/CFKO200322941410653.pdf (accessed on 23 February 2022).
- Taufik, M.; Veldhuizen, A.; Wösten, J.; Van Lanen, H. Exploration of the importance of physical properties of Indonesian peatlands to assess critical groundwater table depths, associated drought and fire hazard. Geoderma 2019, 347, 160–169. [Google Scholar] [CrossRef]
- Hafni, D.; Putra, E.; Harahap, A.; Saharjo, B.; Graham, L.; Nurhayati, A.; Cochrane, M. Peat Fire Risk Assessment in Central Kalimantan, Indonesia Using the Standardized Precipitation Index (SPI); IOP Conference Series: Earth and Environmental Science; IOP Publishing: Bristol, UK, 2022; Volume 959, p. 012058. [Google Scholar]
- Setiawan, A.M.; Lee, W.S.; Rhee, J. Spatio-temporal characteristics of Indonesian drought related to El Niño events and its predictability using the multi-model ensemble. Int. J. Climatol. 2017, 37, 4700–4719. [Google Scholar] [CrossRef]
- Pan, X.; Chin, M.; Ichoku, C.M.; Field, R.D. Connecting Indonesian Fires and Drought With the Type of El Niño and Phase of the Indian Ocean Dipole During 1979–2016. J. Geophys. Res. Atmos. 2018, 123, 7974–7988. [Google Scholar] [CrossRef]
- Field, R.D.; van der Werf, G.R.; Fanin, T.; Fetzer, E.J.; Fuller, R.; Jethva, H.; Levy, R.; Livesey, N.J.; Luo, M.; Torres, O.; et al. Indonesian fire activity and smoke pollution in 2015 show persistent nonlinear sensitivity to El Niño-induced drought. Proc. Natl. Acad. Sci. USA 2016, 113, 9204–9209. [Google Scholar] [CrossRef]
- Alfahmi, F.; Khaerima, A.; Byantoro, A. Utilization of ECMWF Seasonal Rainfall Forecast 470 System (SEAS5) for Forest Fire Prediction over Sumatera Island, Indonesia; IOP Conference 471 Series: Earth and Environmental Science; IOP Publishing: Bristol, UK, 2021; Volume 893, p. 012042. [Google Scholar]
- Taufik, M.; Torfs, P.J.J.F.; Uijlenhoet, R.; Jones, P.D.; Murdiyarso, D.; Lanen, H.A.J.V. Amplification of wildfire area burnt by hydrological drought in the humid tropics. Nat. Clim. Chang. 2017, 7, 428–431. [Google Scholar] [CrossRef]
- Huijnen, V.; Wooster, M.J.; Kaiser, J.W.; Gaveau, D.L.A.; Flemming, J.; Parrington, M.; Inness, A.; Murdiyarso, D.; Main, B.; van Weele, M. Fire carbon emissions over maritime southeast Asia in 2015 largest since 1997. Sci. Rep. 2016, 6, 26886. [Google Scholar] [CrossRef] [PubMed]
- Dolling, K.; Chu, P.S.; Fujioka, F. A climatological study of the Keetch/Byram drought index and fire activity in the Hawaiian Islands. Agric. For. Meteorol. 2005, 133, 17–27. [Google Scholar] [CrossRef]
- Garcia-Prats, A.; Antonio, D.C.; Tarcísio, F.J.; Antonio, M.J. Development of a Keetch and Byram—Based drought index sensitive to forest management in Mediterranean conditions. Agric. For. Meteorol. 2015, 205, 40–50. [Google Scholar] [CrossRef]
- Ainuddin, N.; Ampun, J. Temporal analysis of the keetch-byram drought index in Malaysia: Implications for forest fire management. J. Appl. Sci. 2008, 8, 3991–3994. [Google Scholar] [CrossRef][Green Version]
- Taufik, M.; Widyastuti, M.T.; Sulaiman, A.; Murdiyarso, D.; Santikayasa, I.P.; Minasny, B. An improved drought-fire assessment for managing fire risks in tropical peatlands. Agric. For. Meteorol. 2022, 312, 108738. [Google Scholar] [CrossRef]


Publisher’s Note: MDPI stays neutral with regard to jurisdictional claims in published maps and institutional affiliations. |
© 2022 by the authors. Licensee MDPI, Basel, Switzerland. This article is an open access article distributed under the terms and conditions of the Creative Commons Attribution (CC BY) license (https://creativecommons.org/licenses/by/4.0/).