Article

Improving the Performance of the Reverse Osmosis Process with Fiber Filter and Ultrafiltration: Promoting Municipal Sewage Reclamation and Reuse for Industrial Processes

1
Department of Resources Engineering, National Cheng Kung University, Tainan 701, Taiwan
2
Water Resources Bureau of Tainan City Government, Tainan 701, Taiwan
*
Author to whom correspondence should be addressed.
Sustainability 2022, 14(9), 5443; https://doi.org/10.3390/su14095443
Submission received: 5 April 2022 / Revised: 28 April 2022 / Accepted: 29 April 2022 / Published: 30 April 2022
(This article belongs to the Special Issue Technology for Sustainable Wastewater Treatment)

Abstract

:
Wastewater reuse presents a promising solution to the growing need for the sustainable use of available water resources. The reclamation of municipal sewage through reverse osmosis can be applied for diverse uses to alleviate chronic water scarcity. In this study, a pilot plant was fabricated to measure the efficiency and the costs that are associated with pretreatment by the fiber filtration and ultrafiltration of secondary effluent from a water resource recovery facility in Taiwan. The results of this dual-membrane process meet the quantity and quality standards for industrial reuse. The pretreatment produced feedwater with a silt density index (SDI15) lower than 4.1, and with average turbidity removal rates of 42.7% (fiber filtration) and 99.2% (ultrafiltration). Following reverse osmosis, a 97.9% rejection of the electrolyte conductivity was achieved in the reclaimed water. The fouling of the membranes was controlled through the application of intensive backwash, chemically enhanced backflushing, and cleaning in place. The proposed system improves the feasibility, reliability, and economy of the dual-membrane process as a tertiary treatment for safe water reuse, and it thereby demonstrates that this technology has reached maturity for the full-scale implementation of sustainable water reuse.

1. Introduction

Climate change, as well as more frequent and prolonged droughts in particular, have led to chronic water scarcity [1,2]. This trend is set to continue, and the growing need for the sustainable use of available water resources has prompted regional and national governments worldwide to seek alternative water sources [3]. Wastewater reuse presents a promising route to the achievement of water sustainability. It can be applied for diverse uses to share the burden on freshwater sources, where the use of reclaimed water has proven to be an excellent approach to dealing with water scarcity [4,5]. In Taiwan, the uneven spatial and temporal distribution of water resources, difficulties regarding water storage due to the terrain, high levels of urbanization, and rapid industrialization have led to low water-use efficiency as well as to water shortages. In 2021, Taiwan’s 70 water resource recovery facilities (WRRFs) discharged 3.3 million tons of treated water [6]. While this water cannot be used as drinking water or by the food and pharmaceutical industries, it offers a realistic alternative for manufacturing industries in water-stressed regions, and namely, in southern Taiwan.
The reuse of municipal sewage has been the focus of international attention, and the direct utilization of treated municipal sewage in Europe is expected to increase in the future [7]. Worldwide, several case studies have been conducted to investigate the implementation of the advanced reclamation of municipal wastewater for industrial reuse [8,9,10,11,12,13,14].
Municipal sewage, therefore, represents a promising alternative water resource that supports the development of a circular economy. The main factors that hamper the development of municipal sewage for reuse are the cost of reclamation (including the costs of the plant construction, operation, and maintenance), the distribution and monitoring of the reuse system [15], and the meeting of the requirements of water reuse. A key issue is the operating costs that are associated with reverse osmosis (RO), and particularly those related to filtration and membrane maintenance.
The biofouling of the membranes is one of the most common operational problems for RO [16]. Researchers have attempted to predict the level of fouling by using mathematical models [17], either through a characterization of the fouling potential of the feed, or by the detection of the fouling conditions of the membranes [18]. An ascorbic/oxalic acid cleaning in place (CIP) has also been applied to hydraulic irreversible fouling [19], and nonconventional pretreatment systems have been examined for their efficiency in terms of improving the water quality and minimizing the overall treatment cost [20]. Because RO membranes are susceptible to physical, chemical, and biological fouling, the effective pretreatment of feedwater is a significant component of membrane systems [21].
The aim of this study was to integrate a sustainable pilot plant into a conventional WRRF. We measured the efficiency and operating costs of the proposed system. The design focused on the removal of dissolved organic matter and inorganic fouling by using a combined fiber filter (FF) and ultrafiltration (UF) membrane system. We identified the optimal operating conditions for the treatment of municipal sewage by using an RO membrane process. Not only was the resulting water compatible with industrial requirements, but it also met the standards for local water reuse. The proposed system improves the feasibility, reliability, and economy of the dual-membrane process as a tertiary treatment for safe water reuse.

2. Materials and Methods

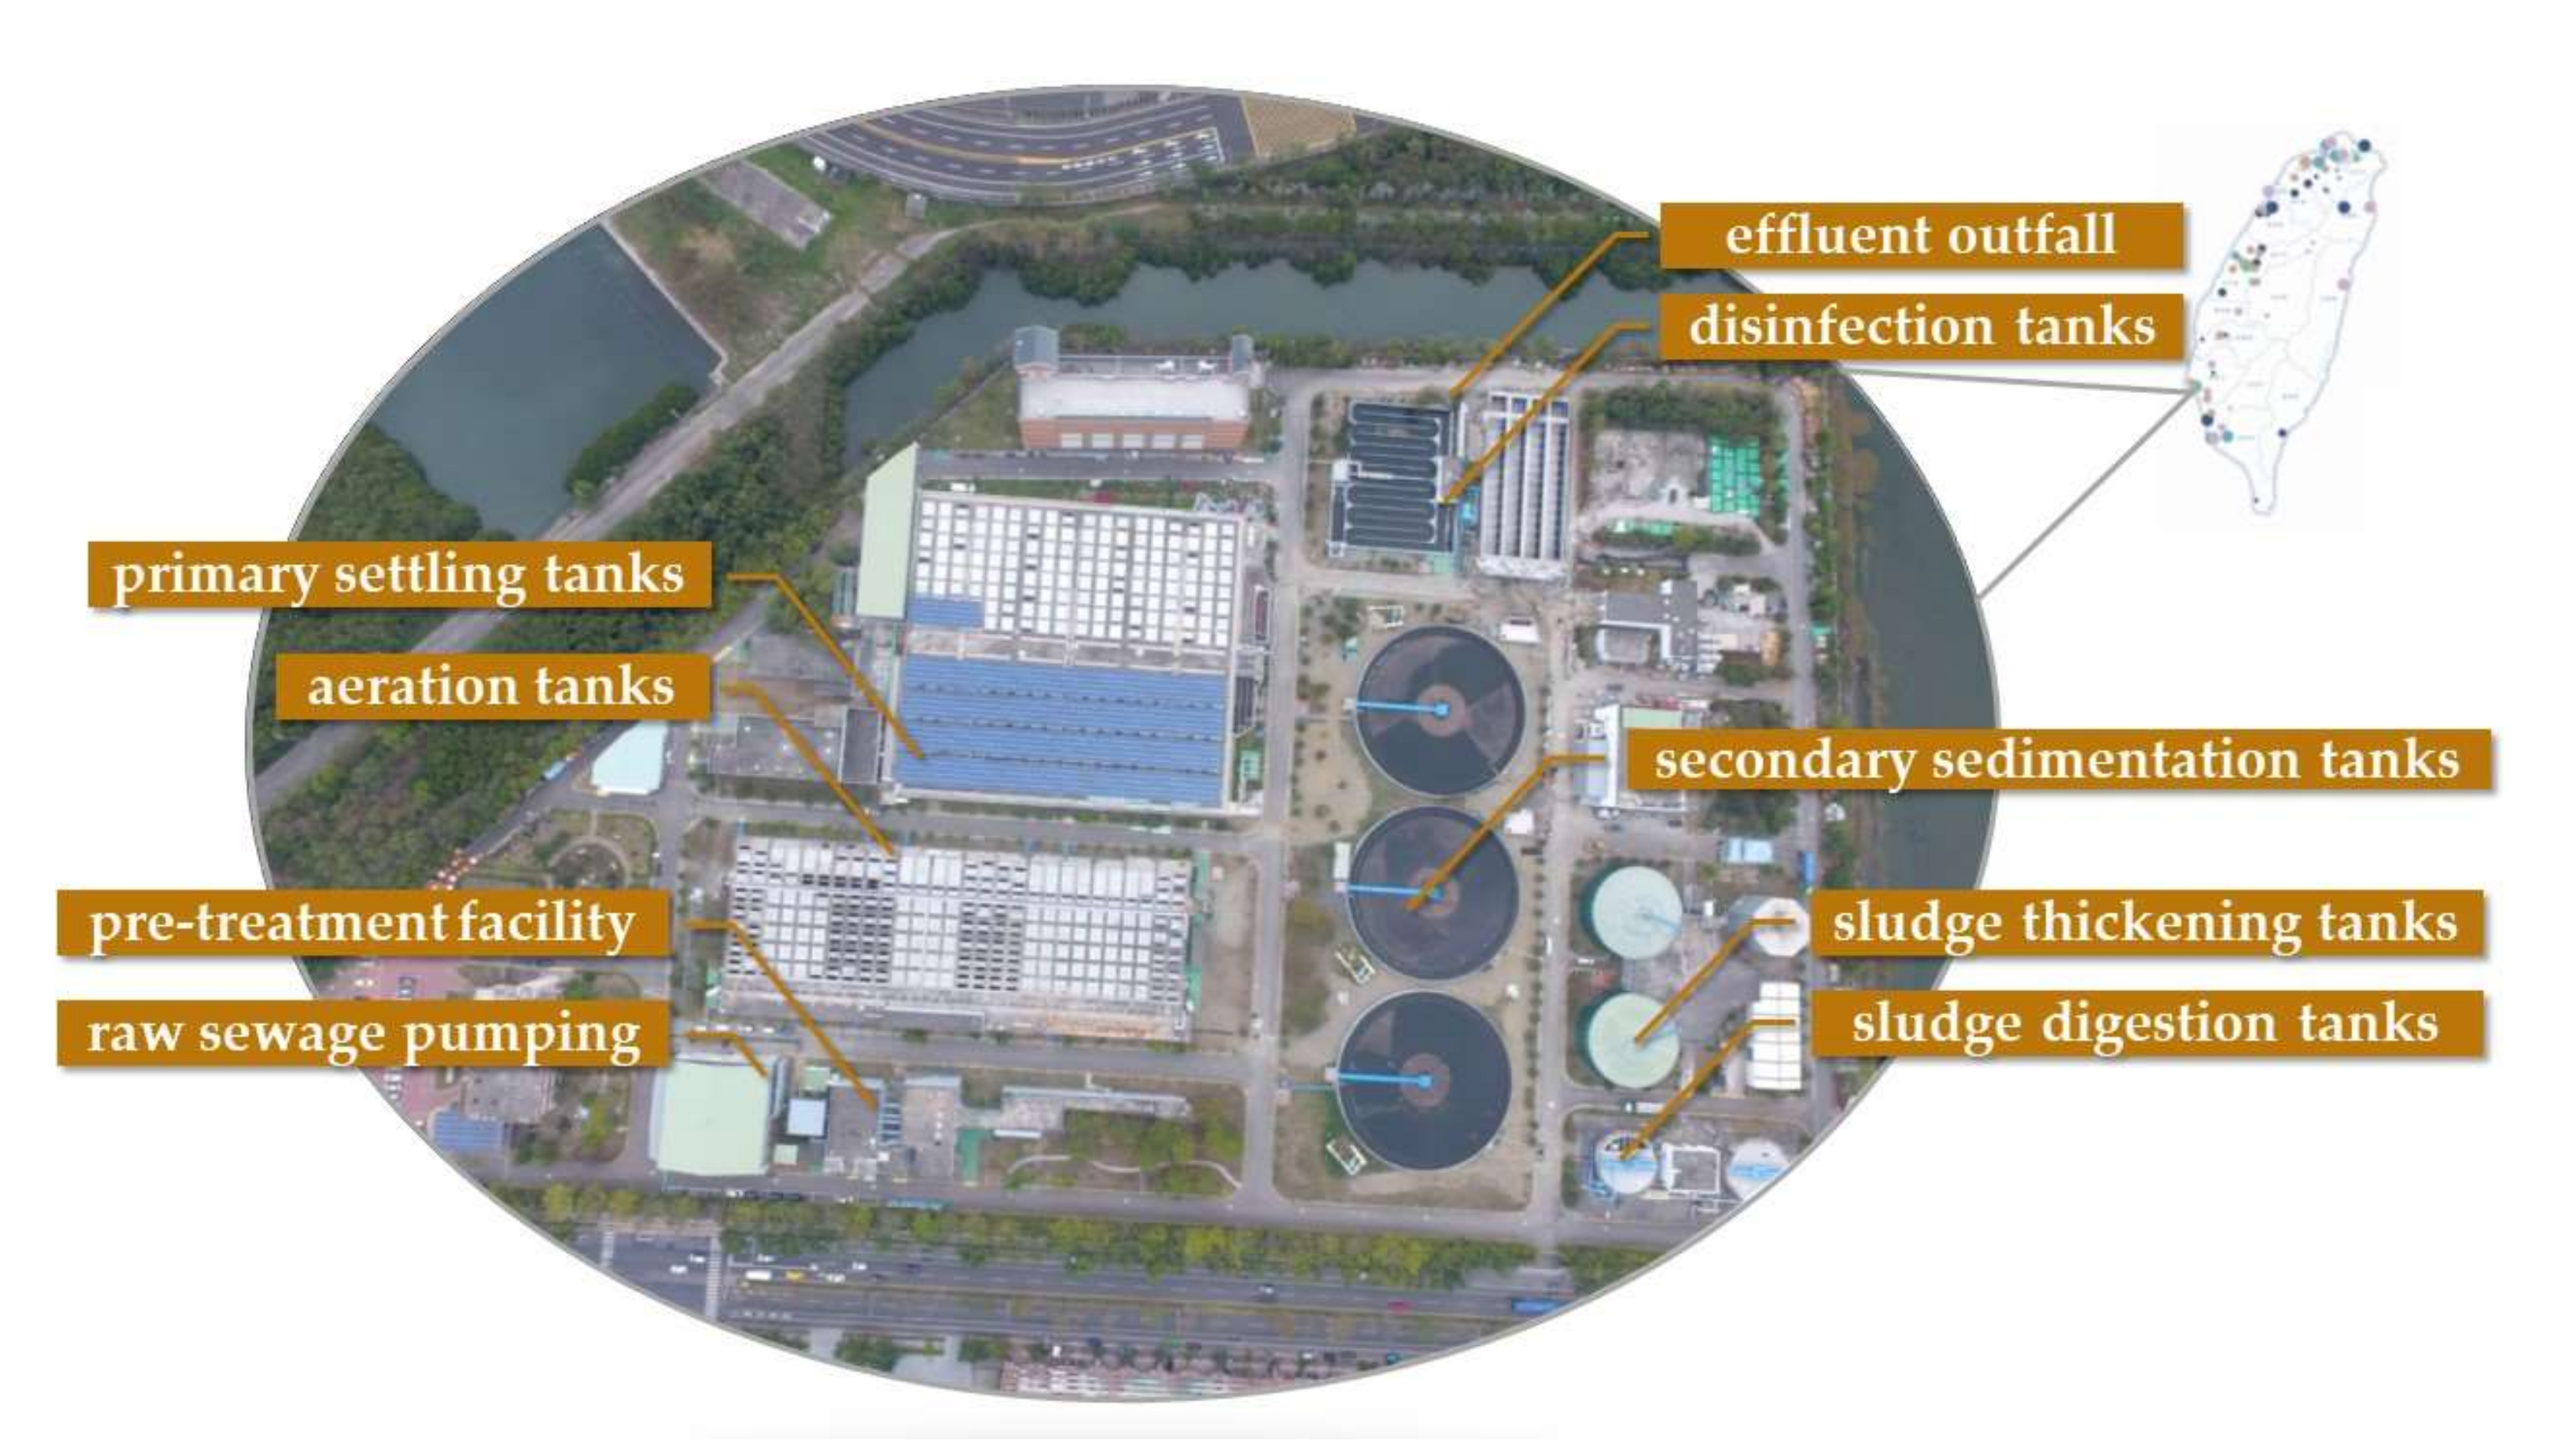
2.1. Description of WRRF and Reclaimed Water Source

The water source that was used in the pilot plant was secondary effluent from the Anping WRRF, which is located offshore in Tainan (latitude 22°58′57.4″ N, longitude 120°10′39.8″ E), on the right bank of a canal. This WRRF covers an area of approximately 10.31 hectares, with a maximum treatment capacity of 16,000 m3 per day of wastewater.
The facility performs secondary treatment on the basis of the conventional activated sludge system, with a coarse grid, pumping stations, fine screening, grit-and-grease removal, primary settling tanks, aeration tanks, secondary sedimentation tanks, interception stations, and approximately 79.9 km of trunk and lateral sewer lines. The origin of the wastewater is 33% interception and 67% domestic, and the treated wastewater is discharged into the harbor [6]. The general layout of the Anping WRRF is shown in Figure 1.
We designed and constructed a pilot plant to reclaim municipal sewage for industrial purposes. We implemented the proposed system to monitor the effluent contamination parameters and reclaimed water quality to understand its efficiency in practice. The proposed system was installed at the outlet of the secondary sedimentation tank inside the Anping WRRF and was directly connected to the effluent from the secondary treatment (i.e., its feedwater was the effluent output by the activated sludge system). The construction of the pilot plant was completed in April 2020.

2.2. Analytical Methods

The performance of the pilot plant was assessed by using the influent and effluent parameters. The WRRF secondary-sedimentation-tank effluent, feed, and permeate (i.e., treated wastewater) samples were collected daily and weekly over 12 months, from 24 October 2020 to 23 October 2021. Samples were collected from the effluent outfall of the secondary sedimentation tank, and from the FF filtrate outlet, the UF permeate outlet, and the RO permeate outlet of the pilot plant. All samples were collected in contaminant-free (i.e., trace-clean) polyethylene or amber glass bottles. The samples were maintained at a constant temperature of 4 °C until testing in order to ensure that they did not deteriorate or become contaminated or compromised.
In order to understand the characteristics of the effluent, we analyzed the following: pH, temperature (Temp), electrolyte conductivity (EC), total dissolved solids (TDS), suspended solids (SS), turbidity, biochemical oxygen demand (BOD5), chemical oxygen demand (COD), total organic carbon (TOC), ammonia-N (NH3-N), calcium (Ca2+), chloride (Cl), magnesium (Mg2+), silica (SiO2), boron (B), sulfate (SO42−), and the coliform group.
Test procedures were performed according to the standard methods: method NIEA PA101–PA108, and the EAL Data Quality System [22,23]. For example, we adopted the filter-paper weighting method to measure the SS; the dilution inoculation method to measure the BOD5; the potassium dichromate process to measure the COD; ICP/MS (Pekin-Elmer NexION 300×) to measure the Ca2+ and Mg2+; plate count to determine the coliform group; and water at a constant given pressure and applied through a 0.45 µm-pore-size microfiltration membrane (using standard methods (ASTM D4189-07)) to measure the silt density index (SDI15). Laboratory analyses of samples were conducted by an accredited laboratory (SGS Taiwan Ltd., in Kaohsiung, Taiwan). Field measurements of the Temp, EC, and pH were made by water-quality sonde (WTW Pro-fiLine pH/Cond 3320, Weilheim, Germany).

2.3. Description of Pilot Plant Test System and Membrane Selection

FF units have long been used in commercial applications for the removal of suspended particles from water streams. In South Korea in particular, FF units are applied for the tertiary treatment of wastewater [24,25]. Systematic studies into the solid-removal efficiency and online factor of FF [26,27] have confirmed that polymeric RO membranes can tolerate organics in wastewater and can achieve >96% salt rejection [28]. The combination of UF followed by RO has become a viable technology for effluent reclamation because of its high rejections of EC, viruses, and turbidity [29,30].
The EC (2839 μS/cm) of the effluent in the selected WRRF is relatively high because of its coastal location. This, combined with the strict water-quality requirements of industrial applications, necessitates pretreatment combined with advanced reclamation schemes that are based on FF followed by a dual-membrane (UF and RO) process.
In this study, experiments were carried out with a commercial fiber ball and membranes. We used the Dingxinda, Pentair Aquaflex 64, and Hydranautics Nitto Denko LFC3-LD for the FF, UF, and RO membranes, respectively. The relevant characteristics and parameters were designed according to the commercial guidelines that are shown in Table 1 [31,32,33]. The general layout of the pilot plant is shown in Figure 2. A schematic block diagram of the dual-membrane pilot plant is presented in Figure 3.
The feed, permeate, and concentrate water-flow rates were measured by using online flow meters. The feed and permeate turbidity were continuously measured by using the TurbSense® online turbidity meter, and the SDI15 of the filtrate from the FF and the UF was measured by using the offline automatic SDI meter from STERLITECH Simple SDI: Auto according to ASTM D 4189-07. The pH level was adjusted by using a blending line and reject-concentrate-water recycling. Each unit had sampling points to validate the water qualities obtained. A real-time monitoring system was mounted on the equipment to continuously measure the power consumption. The pilot plant was fully automated, and the operating data (i.e., pressure and flow) were acquired from the control panel system and were recorded to monitor the performance.
The optimization of the dual-membrane system was based on maximizing the quality and quantity of the reclaimed water while reducing the energy consumption. The performance evaluation was conducted on four operating modes to identify the benefits of UF pretreatment at different levels on the basis of user requirements. The parameters of the four operating modes are shown in Table 2. The system was operated in each mode for 90 days, and the pilot plant was operated for a total of 12 months.
The UF, the RO flux rate, and the water permeability were established on the basis of membrane design recommendations to define whether the applied operating conditions were sustainable in terms of fouling. After each process, an intensive backwash (BW), chemically enhanced backflushing (CEB), and cleaning in place (CIP) were applied to recover the permeability to baseline conditions. The cleaning conditions are summarized in Table 3. The maximum capability of the pilot plant is 50 m3/day. Treatment includes three steps:
1.
FF unit
FF eliminates all particles larger than the degree of filtration, and a high percentage of smaller ones. The filtrate of the FF unit was pumped to the UF unit by a feed pump. The FF and UF units were applied as pretreatment prior to the RO unit to remove fine SS, coagulated colloidal materials, and bacteria, and to prevent any interference due to suspended particles that might reduce the UF performance. This is also an effective way of protecting the rear UF unit.
A fiber ball 30 mm in diameter and made of polyester fiber was used. The filling height of the filter material was three times the packed column diameter inside a vertical housing. We adopted a filtration velocity of 80 m/h, and an 8 mm porous plate-type filter-medium filtration membrane was installed in the filtration tank.
The FF unit included an automatic BW system that combined water and compressed air. Filter bundles were unwound, and then air scouring was performed by an air compressor. Air scouring included 3 min of air and a low-velocity wash, followed by 5 min of air only. Finally, the unit was rinsed with water for 2 min to remove all particles from the FF. The BW process was 10 min for each stage.
2.
UF unit
The UF unit consisted of a single module of polymeric hollow fiber membranes, with a total membrane area of 64 m2, and operated in dead-end mode. The feed was pumped through the UF membrane in an inside-out filtration, and UF water production was performed at flux between 40 and 45 LMH. Controlled BW was performed several times per day. Hydraulic cleanings consisted of a combination of a BW (15 m3/h for 30 s) and the circulation of raw water in the feed side (4 m3/h for 30 s) during filtration cycles. We applied a fixed filtration time of 30 min, which included the collection of the produced permeate water, which was recovered for water production and BW water.
The daily CEB was applied periodically in alkaline conditions (100 mg/L of NaOCl) to recover the permeability, and the operating pressure differential (ΔP) exceeded 1.5 kg/cm2 for the CIP. Cleaning was performed automatically to ensure the maximum elimination of fouling and scaling.
3.
RO unit
Following UF, ions, such as Na+ and Cl, and other compounds had to be removed by the RO unit. Permeate production was performed at flux between 16 and 18 LMH, and at a recovery rate between 65 and 70%. The high-pressure pump was adjusted by using a speed driver, in which the flow was fixed. The CIP was set to operate automatically, when ΔP exceeded 3.0 kg/cm2 in acid (0.01 N of HCl) and alkaline (0.01 N of NaOH) conditions, to recover the permeability and to avoid the fouling and scaling of the RO membrane.

3. Results

In this section, we first characterize the WRRF effluent by considering both the physicochemical parameters and the activated sludge processes. We then evaluate the performance of the FF, UF, and RO units. Finally, we assess the energy and chemical-dosage costs from a techno-economic perspective; we used these results to estimate the operating costs.

3.1. Characterization of WRRF Effluent

The Anping WRRF is located in a coastal area where the wastewater is collected by gravity in a sewage pipeline that is about 10 m below ground. Because of seawater intrusion and sewage interception, the measured values of the EC and the TDS are higher compared to the sewage indicators of other WRRFs.
The effluent of the Anping WRRF served as the feedwater of the pilot plant. The physicochemical parameters were recorded at the outlet of the secondary sedimentation tanks of the WRRF throughout the study period (between October 2020 and October 2021). The data are presented in Table 4 and they include the average, maximum, and minimum values of the different physicochemical parameters. In general, low standard deviations were obtained for the turbidity, the BOD5, the COD, the SS, and the TOC, which indicate the effluent stability. The greatest variations were found in the Cl-, the TDS, and the EC. These significant fluctuations were likely caused by contact with seawater. Finally, following disinfection (chlorination), the microbiological indicators were compliant with the regulatory values.
Because of the seawater intrusion and interception by the initial rainfall of the flood season in the pipe network, in the collected samples, the EC measurements varied from 735 to 7860 μS/cm, with an average of 2839 μS/cm. Seawater and rainfall also affected the pH values.

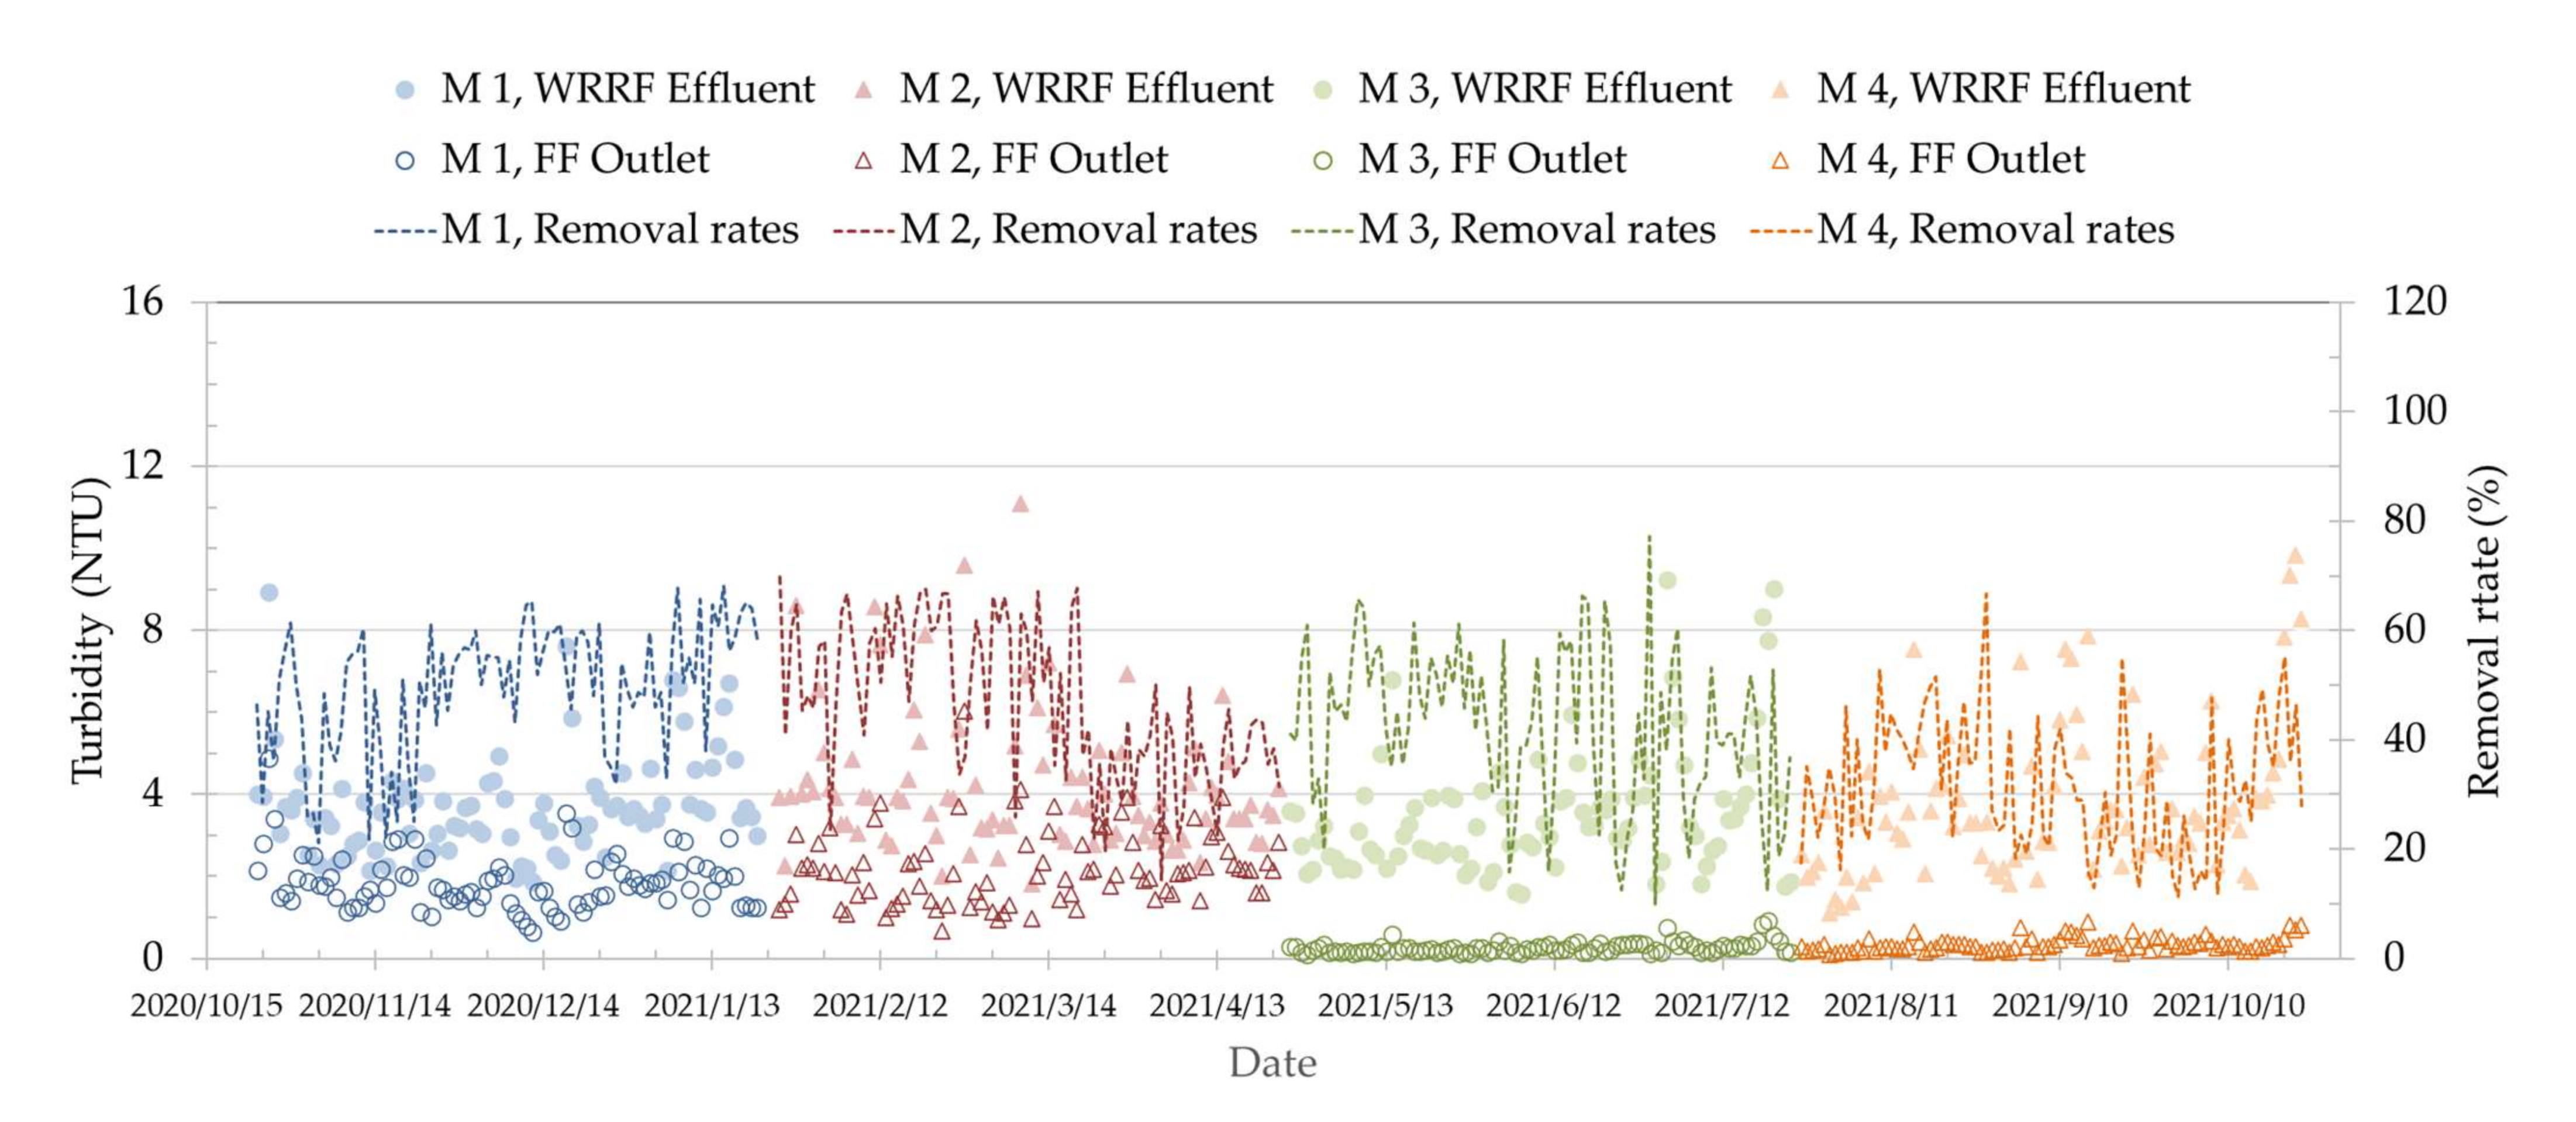
3.2. Filter Efficiency of Selected FF Unit

The evaluation of the field data related to the FF unit indicated that the turbidity removal efficiency met the design specifications. Specifically, the filtrate turbidity never exceeded 6.82 NTU, and the average turbidity of the feed was 3.83 NTU, the average turbidity of the permeate was 2.16 NTU, and the average turbidity removal rate was 42.7%. The relevant data are presented in Figure 4. The net driving pressure (NDP) of the FF unit was stable (mostly below 1.50 kg/cm2), and the average NDP was 0.8 kg/cm2. These results are shown in Figure 5. In Operating Mode 3, fiber-ball defilamentation and clogging occurred (as shown in Figure 6), which was cleared immediately.

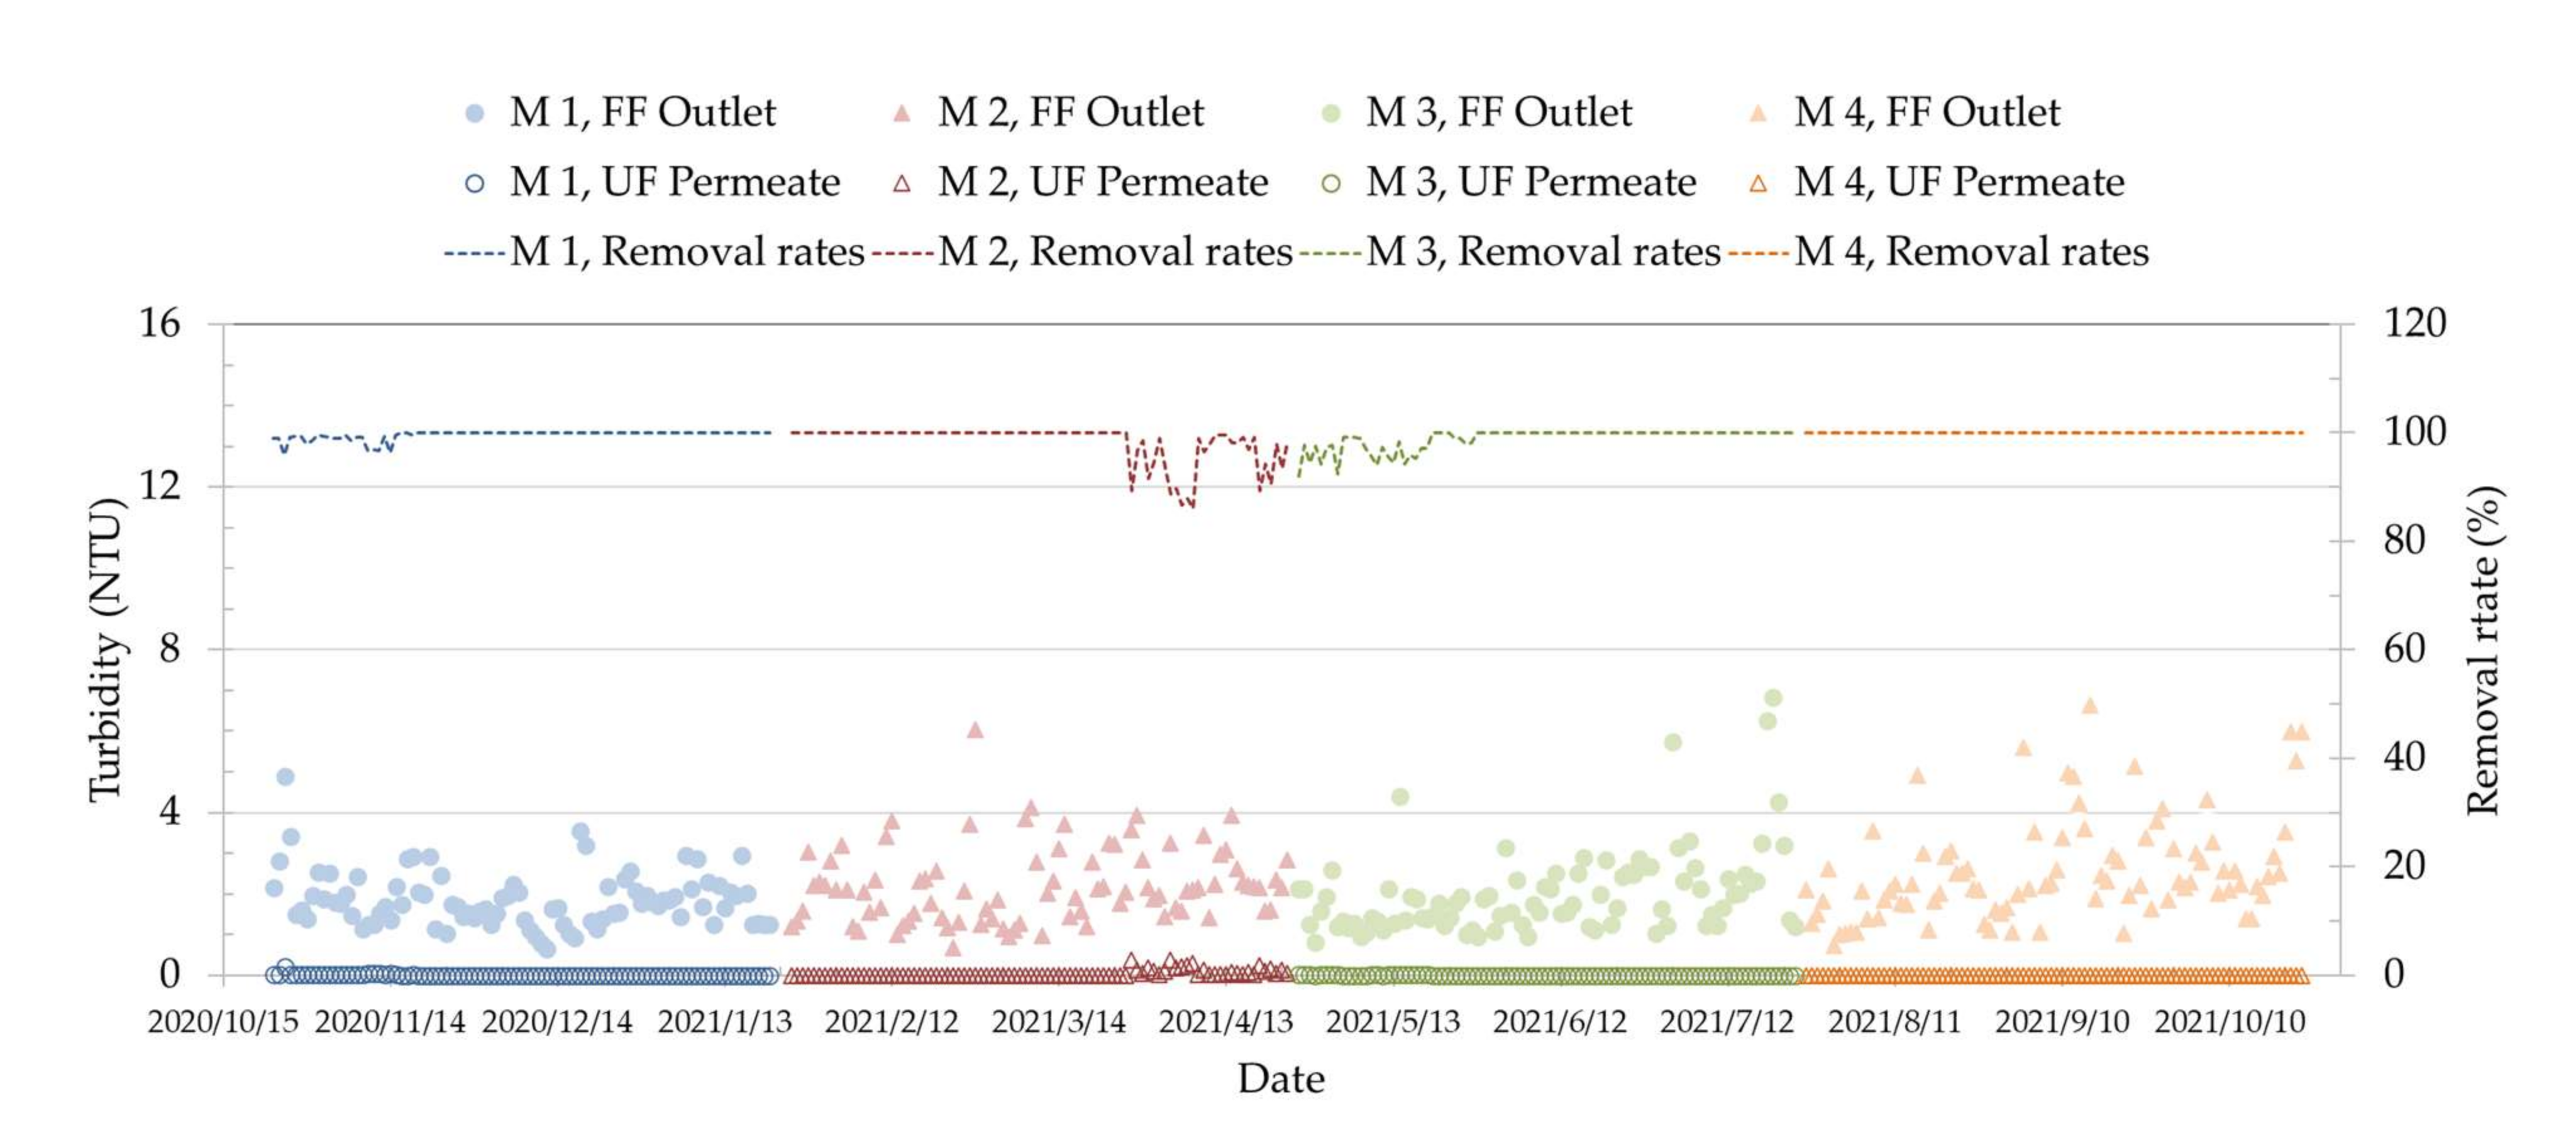
3.3. Filter Efficiency of UF Unit

Pretreatment by the UF unit was necessary to ensure that the removal of the particulate inorganic and organic matter met the SDI15 feedwater goals. For the operating period, the permeate of the UF unit had an average turbidity of 0.015 NTU, and an average removal rate of 99.2%.
For the four operating modes, the average SDI15 were 2.6, 2.9, 2.3, and 2.6. The permeate of the UF unit had an SDI15 lower than 4.1, regardless of the feed and permeate turbidity. This is within the process limits for industrial reuse. As shown in Figure 7, our results indicate that FF followed by UF produced stable RO feedwater of an SDI15 that was lower than 4.1 in practice. To evaluate the operating efficiency of the UF unit, daily CEB was applied periodically. The NDP of the UF was stable (mostly below 1.50 kg/cm2), and the average NDP was 0.4 kg/cm2.

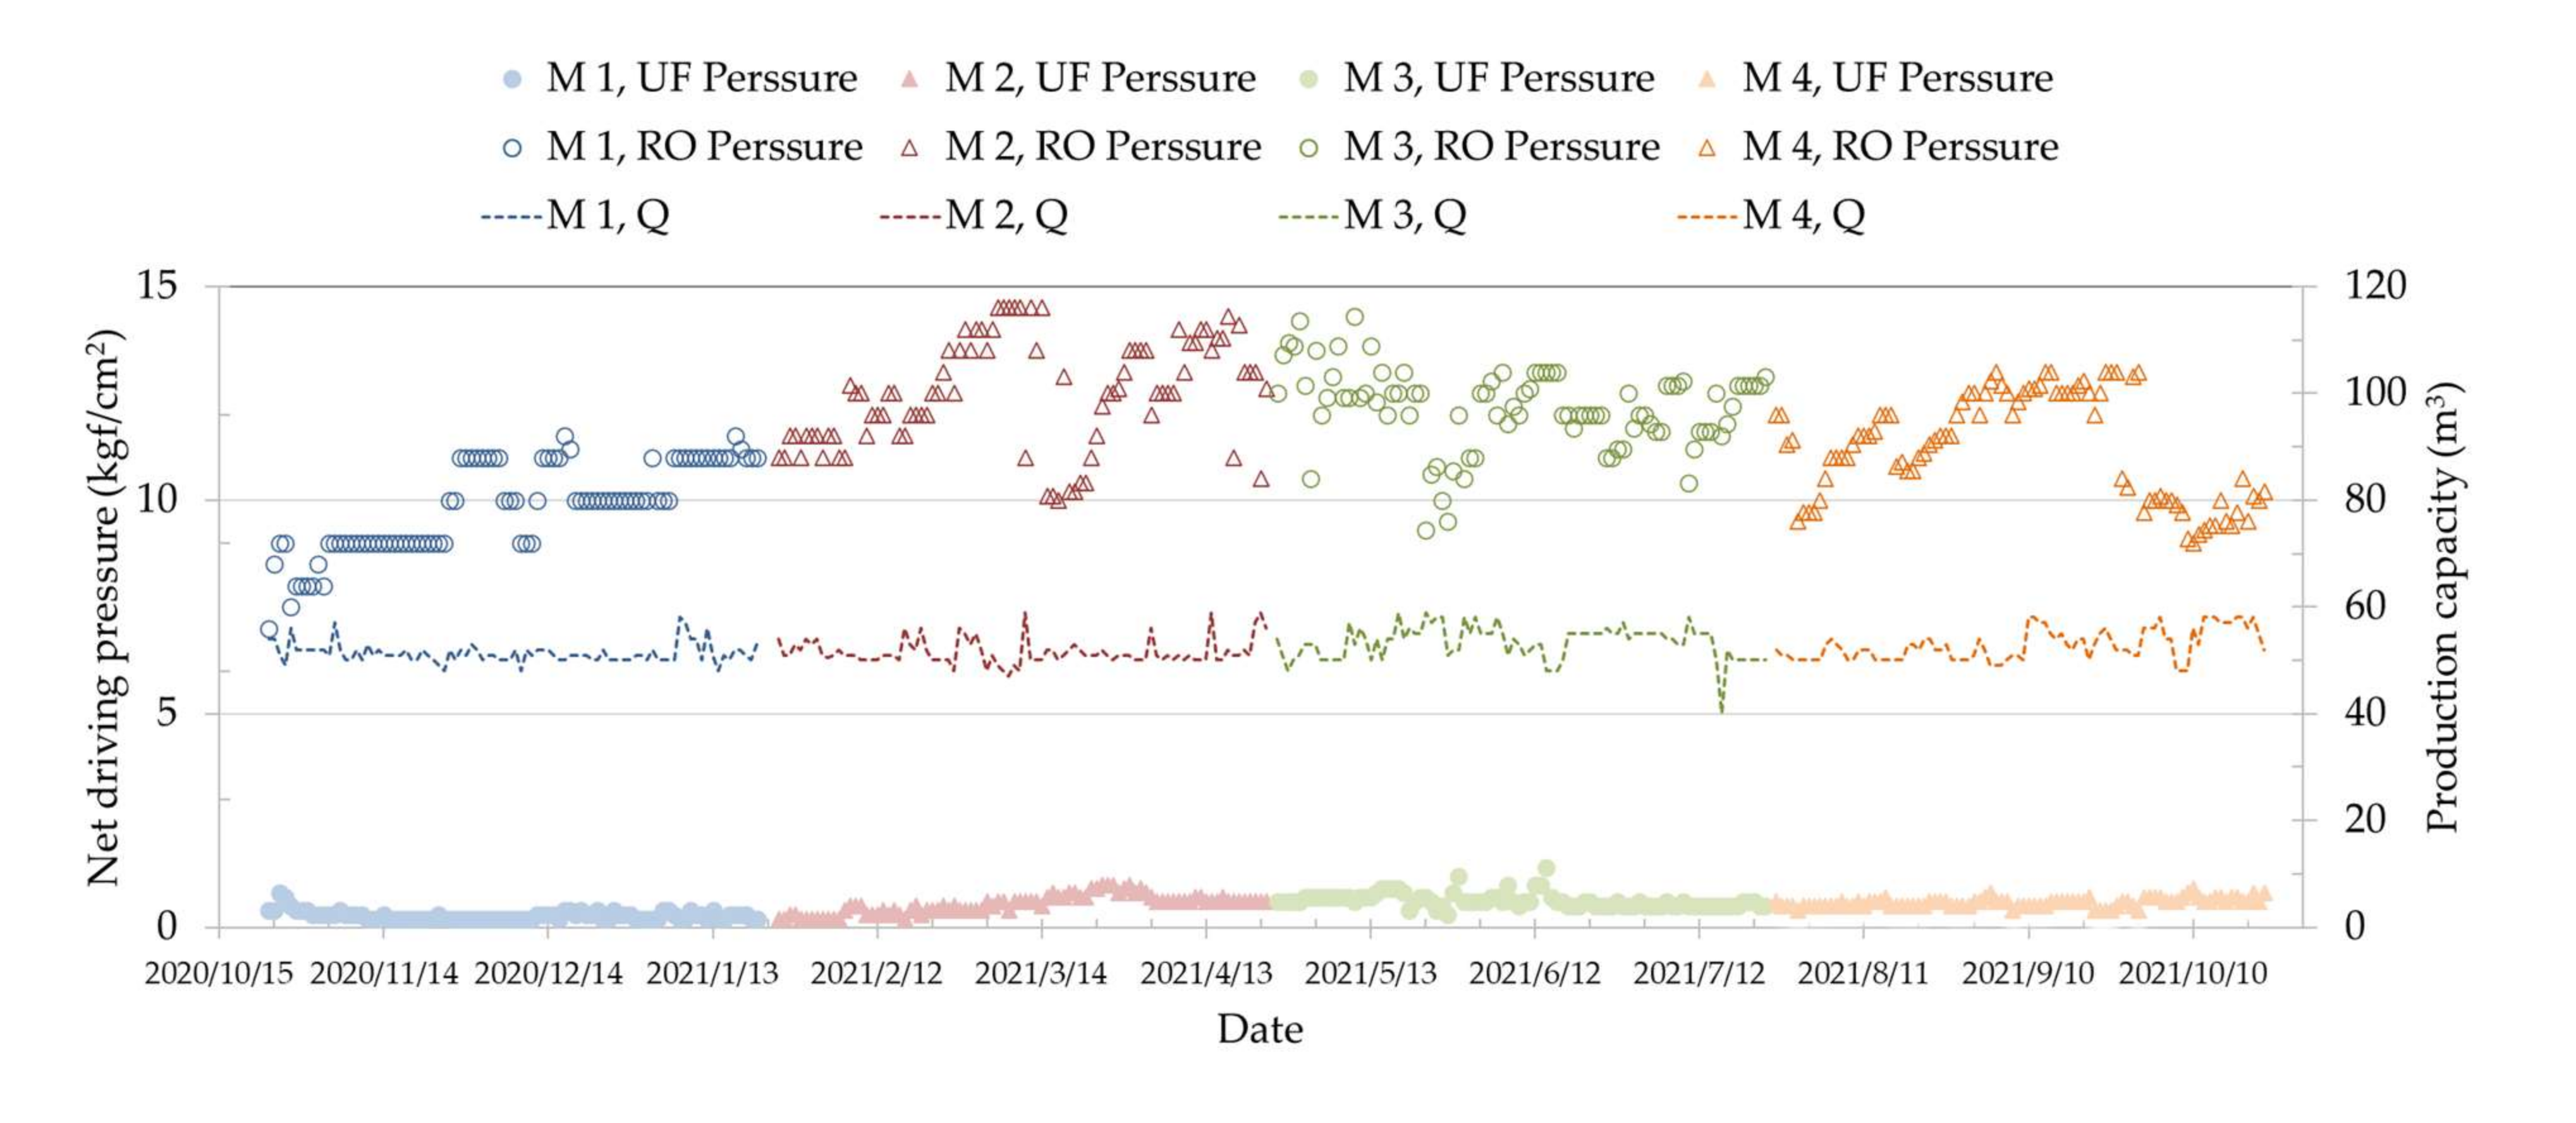
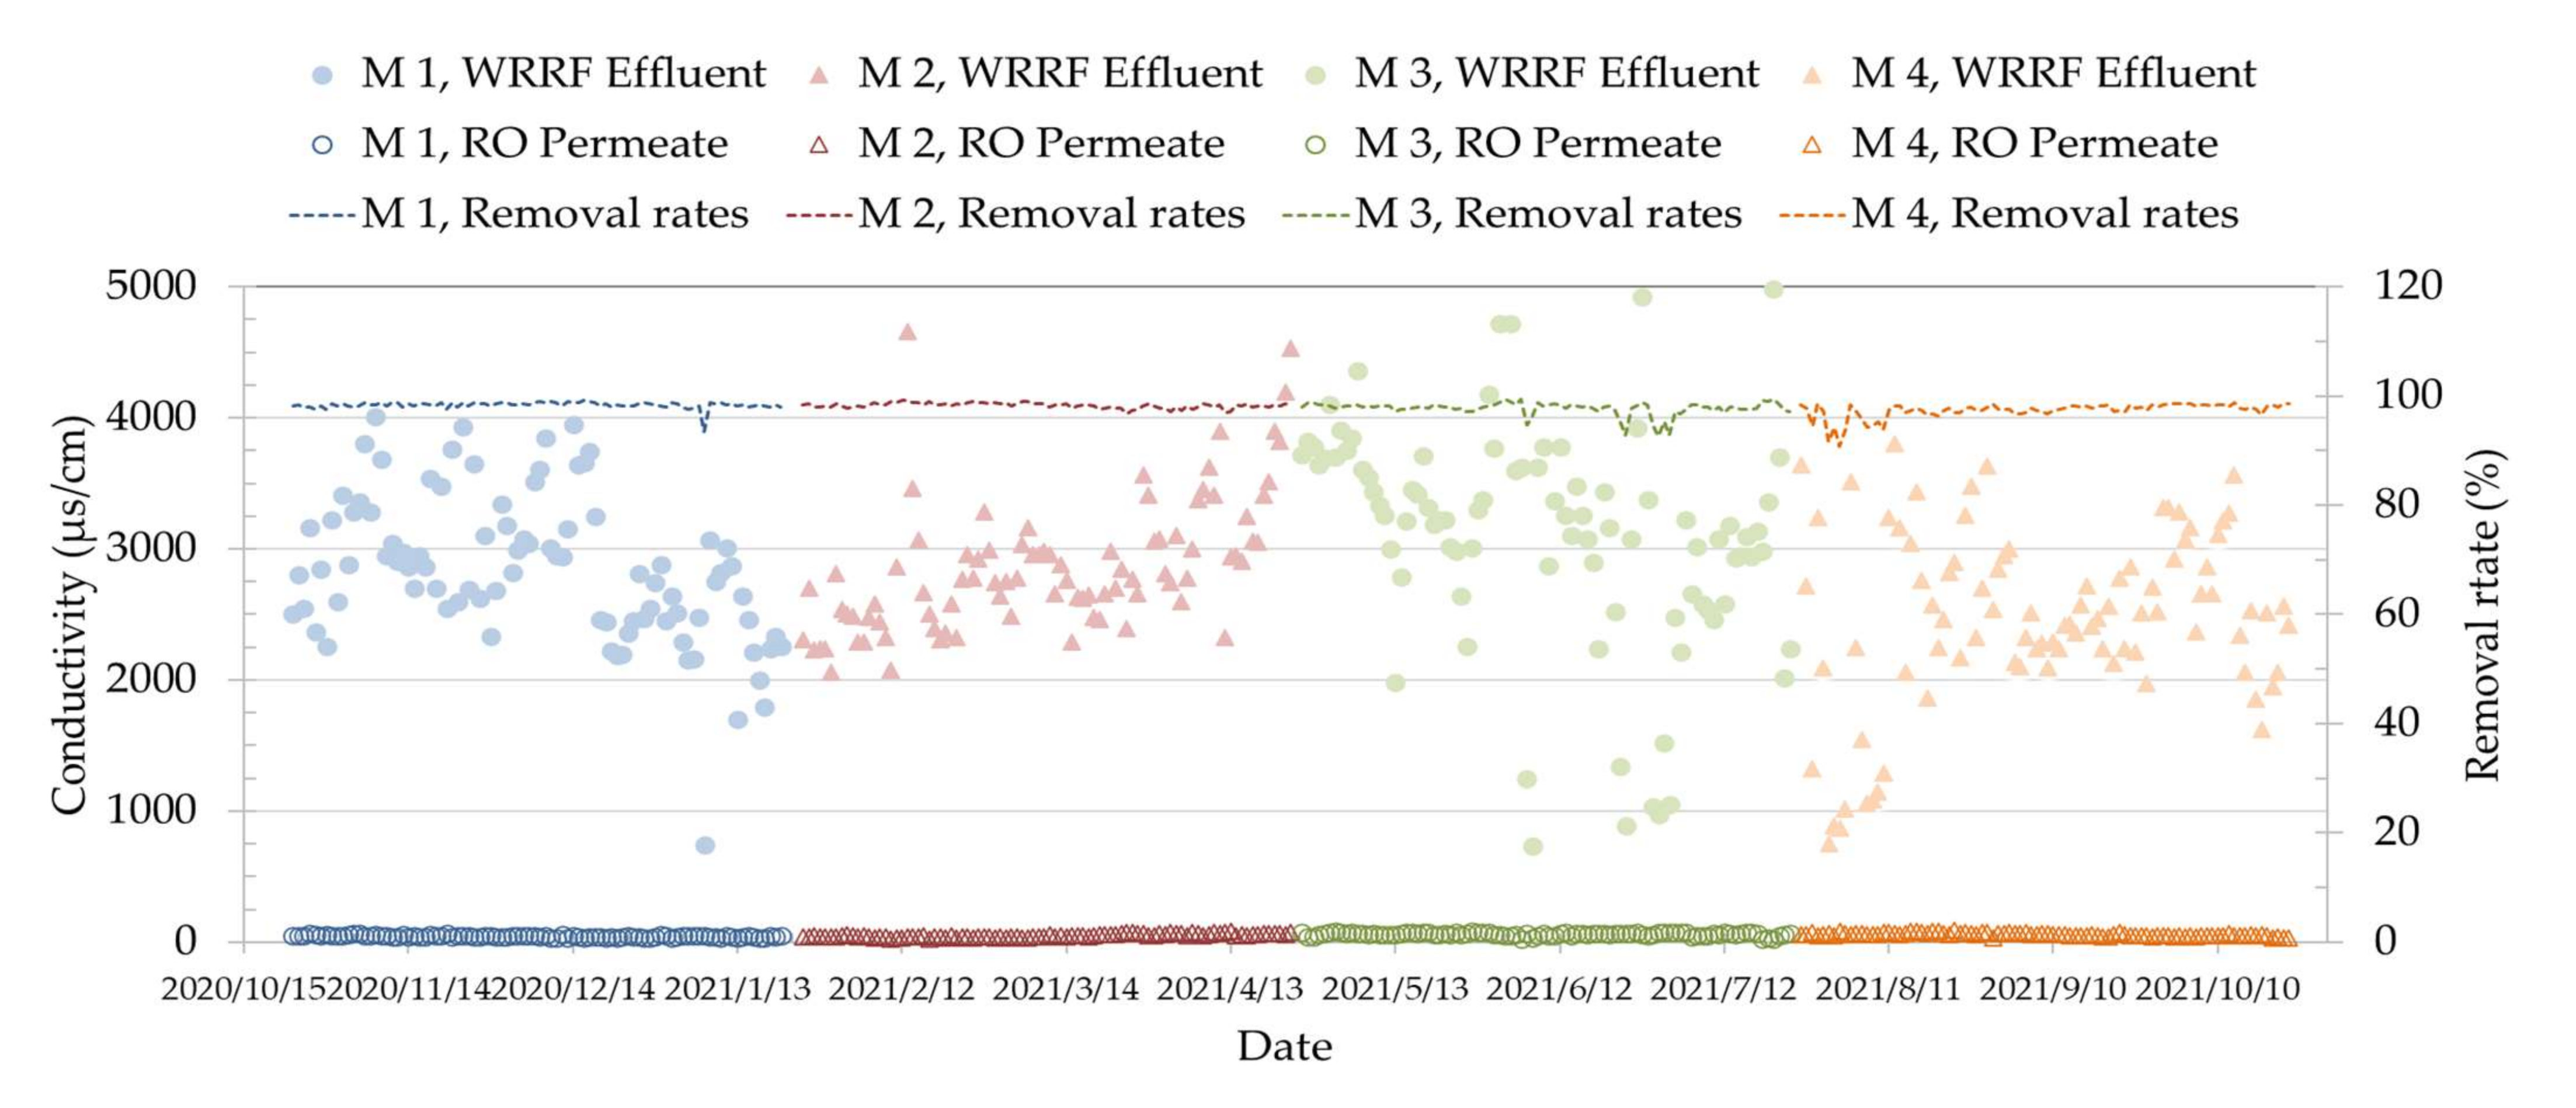
3.4. Water-Quality Performance of RO System

NDP is the effective pressure that is exerted on the membrane during operation. If the NDP on the RO unit doubles, the permeate flow is doubled. The NDP of the RO was stable (mostly below 14.5 kg/cm2), and the average NDP was 11.4 kg/cm2 (as shown in Figure 8). The operating performance of the RO unit proved stable, with respective reductions in the average ECs of the four operating modes: from 2843 to 45 μS/cm; from 2891 to 49 μS/cm; from 3148 to 62 μS/cm; and from 2474 to 57 μS/cm. The RO membrane rejected 97.9% of the EC (details provided in Figure 9), which was the main objective of this step.
The relevant literature confirms that the RO process is effective at removing inorganics and nutrients, and that it can remove approximately 95% of the organic compounds and TDS [34,35,36]. The laboratory analysis results of the sample are presented alongside the Taiwanese quality standards for the use of reclaimed water [37] in Table 5. Over the operating period, all of the values that were related to the permeate in terms of the organic content, the pH, the turbidity, the NH3-N, the TOC, and the coliform group met the requirements for reclaimed water and were within the process limits for industrial reuse. Therefore, the filtrate water that was produced by FF followed by UF was suitable for RO feedwater.

4. Discussion

To increase water-resource sustainability while preventing pollution, this study analyzed the physicochemical characteristics of the municipal sewage output by the Anping WRRF. The conventional activated sludge system demonstrated excellent results: the treated effluent quality was characterized by an average SS of 6.3 ± 2.1 mg/L, a BOD5 of 7.5 ± 2.4 mg/L, a COD of 24.1 ± 3.6 mg/L, an NH3-N of 1.83 ± 2.01 mg/L, a coliform group of (3.3 ± 2.8) × 104 CFU/100 mL, and a Temp of 26.1 ± 2.6 °C. The pH was in the range of 6.8 ± 0.2.
In an activated sludge system, oxygen is necessary for the survival of microbes. Nevertheless, dissolved oxygen (DO) can cause microbial reduction, such as nitrate to nitrite and sulfate to sulfide [38]. That is, limiting the DO value can achieve nitrification [39]. In addition, while there is no direct physical–chemical connection between DO and pH, pH is sometimes indirectly affected by DO. For example, it can introduce additional nutrients, such as nitrogen. In practice, ammonium concentrations are not constant in wastewater treatment plants [40]. Furthermore, if the pH or DO is too high or too low, the growth of microbes could be inhibited.
The pH level can be a factor that limits the growth of coliform, and activated sludge processes with (de)nitrification favor the biological elimination of coliform [41]. These variations explain the concentration changes in pH, DO, coliform, and ammonia, and they demonstrate domestic-quality wastewater characteristics.
Two of the most important indicators that are related to the reclamation of municipal sewage by membrane processes are organic loads and biodegradability, which are reflected in the COD and the BOD5/COD indicators [42,43]. A high BOD5/COD ratio indicates good biodegradability [38], and slow biodegradability is caused by diverse unknown constituents in the wastewater that lead to fouling and scaling [44,45]. In this study, the inflow and effluent BOD5/COD ratios were, respectively, 0.36 and 0.31, which express good biodegradability. Further observations with an optical microscope (Zoomkop EZ-20I, Leader Scientific, Taiwan, China) showed that the dominant organisms present in effluent are rotifers and ciliates (shown in Figure 10) [46,47,48]. These indicate low particulate-organic-matter content and low organic strength, which means that membrane fouling and scaling are unlikely. These results demonstrate that the effluent output by secondary treatment is suitable for advanced processing (such as membrane processing) and for the subsequent application in dual distribution systems, as well as for industrial secondary use, and for environmental and landscape uses.
The technical feasibility of the proposed system (i.e., FF + UF and RO) was demonstrated through operation and optimization over 12 months at the Anping WRRF. The FF efficiency was confirmed, as the WRRF effluent had low turbidity (maximum value between 8.93 and 11.1 NTU) in all four operating modes (average turbidities of 3.74, 4.24, 3.54, and 3.80 NTU), and the average removal rates were 49.7, 47.0, 42.4, and 31.7%. The filtration-treatment efficiency stabilized under filtration linear velocity at 80 m3/m2/h. FF could produce filtrate with an average turbidity of 2.16 NTU. High water and air flows can be applied to this FF, which permits a fast and efficient BW. We confirmed that the optimal operating conditions of BW are an air-flow rate of 250 m/h and a water-flow rate of 50 m3/m2/h.
For commercial applications, physical durability is an important concern. The removal rates showed a downward trend in the late stages of Operating Mode 2, which was due to the partial fiber-ball defilamentation. Following the maintenance of the FF unit, the initial treatment efficiency was restored, and the average removal rate reached 45%. This indicates that FF is effective at turbidity removal. We recommend that FF should be supplemented by 10% each year to reduce defilamentation and clogging. In this study, the treatment efficiency of Mode 4 was lower, which was caused by low effluent turbidity close to the limit of the fiber filtration treatment after stabilization (5–10 NTU).
The technical performance of the UF process was assessed on the basis of the turbidity. The removal efficiencies are shown in Figure 7. For the four operating modes, the permeate of the UF had the following average turbidity values: 0.008, 0.037, 0.016, and <0.001 NTU. The average removal rates were 99.6, 98.2, 99.0, and 100.0%, respectively.
In general, system fouling (scaling) is related to the frequency of cleaning. In the late stages of UF in Operating Mode 2, the turbidity removal rate of the FF decreased, which meant that the particles and solutes could be deposited on the UF membrane, which causes surface fouling (scaling). This increased the SDI15 value. However, it is possible for the system to recover, as shown in Figure 11. This was achieved by increasing the frequency of the CEB, as well as the duration of medicated washing. The performance of the UF unit demonstrated that, if daily CEB and CIP are applied well, the UF unit can run successfully in a treatment scheme for the reclamation of effluents from WRRFs.
In all four operating-mode periods, the UF did not remove ions, as UF has no effect on the EC. This was confirmed by the EC measurements, the mean of which, for the UF feed, ranged from 2500 to 3100 μS/cm.
Figure 8 and Figure 9 show the NDP, the reclaimed water-production capacity, and the average EC of the RO unit during the study period. The operating pressure increased gradually with increases in the processing capacity; however, the EC of the RO permeate was very low, at 23 to 89 μS/cm (well below the threshold). The four operating modes introduced only small changes in the RO permeate flow rate: 51.32, 51.54, 53.30, and 52.81 CMD. The RO membranes rejected 99.2% of the turbidity, and 97.9% of the EC.
The most significant substance that was deposited onto the RO membrane was dissolved organic matter. Therefore, an improved cleaning efficiency and BW with a NaCl draw solution, should be applied to prevent organic fouling. Over time, membrane fouling is unavoidable. This is a key problem in the development of membrane technology. The measurement of the parameters to determine the extent of fouling is a time-consuming process, and it is difficult to predict the type and the extent of fouling on the basis of an index [49]. Over a 90-day test period, the salt-rejection rates were improved, without a significant decline in the water flux, and without serious inorganic fouling (scaling). This means that the UF unit can be used as a pretreatment for RO in the reclamation of effluents from WRRFs. The fouling of the UF and RO membranes can be controlled with CEB and CIP to meet the target of RO recovery.
Both pretreatments, (i.e., FF and UF) removed the SS, the turbidity, and the dissolved organic matter. No significant differences were found in the RO performance in terms of organic fouling or scaling, regardless of the type of pretreatment (FF or UF) that was applied.
In general, RO can effectively remove ionic substances but not gases. When HCO3 and CO32− are removed, the additional CO2 reduces the pH level [50]. The average values for the pH of the WRRF effluent, the RO feed, and the RO permeate are shown in Figure 12. As expected, the pH of the WRRF effluent was 6.8–7.4, the pH of the RO feed was 5.7–6.4, and the pH of the RO permeate was 5.4–5.9, which was 0.3–0.5 units lower than the pH of the feedwater. This is slightly below the required standard for industrial reuse. Therefore, appropriate adjustments must be made in order to ensure compliance with the process requirements and to reduce the possibility of equipment corrosion.
Finally, we conducted a performance evaluation in the four operating modes to determine the related costs of the proposed scheme (i.e., FF + UF and RO). In Taiwan, up to 92% of the funds that are needed to construct plants for water reclamation are covered by the central government, while local authorities handle the continued operation and maintenance. The operation and maintenance costs were more difficult to assess than the construction costs; nonetheless, the overall costs were high. The price of tap water from the Taiwan Water Company (TWC) is USD 0.33/m3, and the price of the reclaimed water was not competitive compared to this. This indicates that water reuse might be unfeasible from an economic perspective. To serve the public interest, a combination of reducing the maintenance costs as well as the revenue received from water and sewerage bills might be the best approach. Although several factors have to be taken into account, the main economic concern in water-reuse projects is related to filtration, which means that energy consumption is a key factor that influences the production of freshwater by RO.
A real-time monitoring system was mounted in the WRRF to measure the power consumption. The energy-saving data related to the four operating schemes, based on the water quality and the insights that were obtained from the pilot-plant performance, are shown in Figure 13. In order to evaluate the economic benefits of reclaimed water, the usage and cost of the energy and the chemical consumption are provided in Table 6.
The chemical costs of treatment are considerable. On the basis of reducing maintenance costs, generally, a reduction in the chemical usage and comparably low maintenance requirements are needed. The chemicals cost calculations are based on the cleaning conditions and on the chemicals that are used for the recovery permeability and to avoid fouling (scaling).
The results reveal that, in Operating Mode 3, the pilot plant, over 90 days, reached a gross power of up to 13,595 kWh, with an energy-consumption rate of 2.84 kWh/m3, and without production-capacity decay. The chemical-dosage cost and the energy cost were USD 0.465/m3, which represents an energy savings of USD 0.038/m3, when compared to Operating Mode 4.
The optimal results were achieved at a workflow of the UF of: 45 LMH, RO: 75%, and 18 LMH. In terms of the operating costs, Operating Mode 3 was the cheapest, with an improved recovery rate, which means that the investment cost can be reduced. The optimization of the operating conditions is crucial for fouling (scaling) reduction. FF+UF improved the reliability and the operating cost of the RO system. The reuse of secondary effluent represents both a drought-proof and freshwater-preserving supply. Therefore, this approach is recommended for water-stressed regions, such as southern Taiwan. It must be noted that these results were achieved on a demonstration plant, and the effects of a large-scale operation need to be confirmed. In practice, limits such as the recovery rate, the permeate flow, and the rejection flow can be modified to obtain a desired safety margin and more flexibility [51]. It is likely that the savings for a large-scale operation might be considerably higher, as pilot-scale plants consume between two and ten times more energy than full-scale plants [52].

5. Conclusions

This study presents a pilot study of a dual-membrane process (UF + RO) for municipal sewage reuse in the industrial sector. The findings of this site-specific study are as follows:
  • The pretreatment unit consists of FF and UF. The filtrate of FF never exceeded 6.82 NTU, and the permeate of UF never exceeded 0.38 NTU. The average turbidity removal rates were 42.7 and 99.2%, respectively. Therefore, the proposed pretreatment process is suitable for RO;
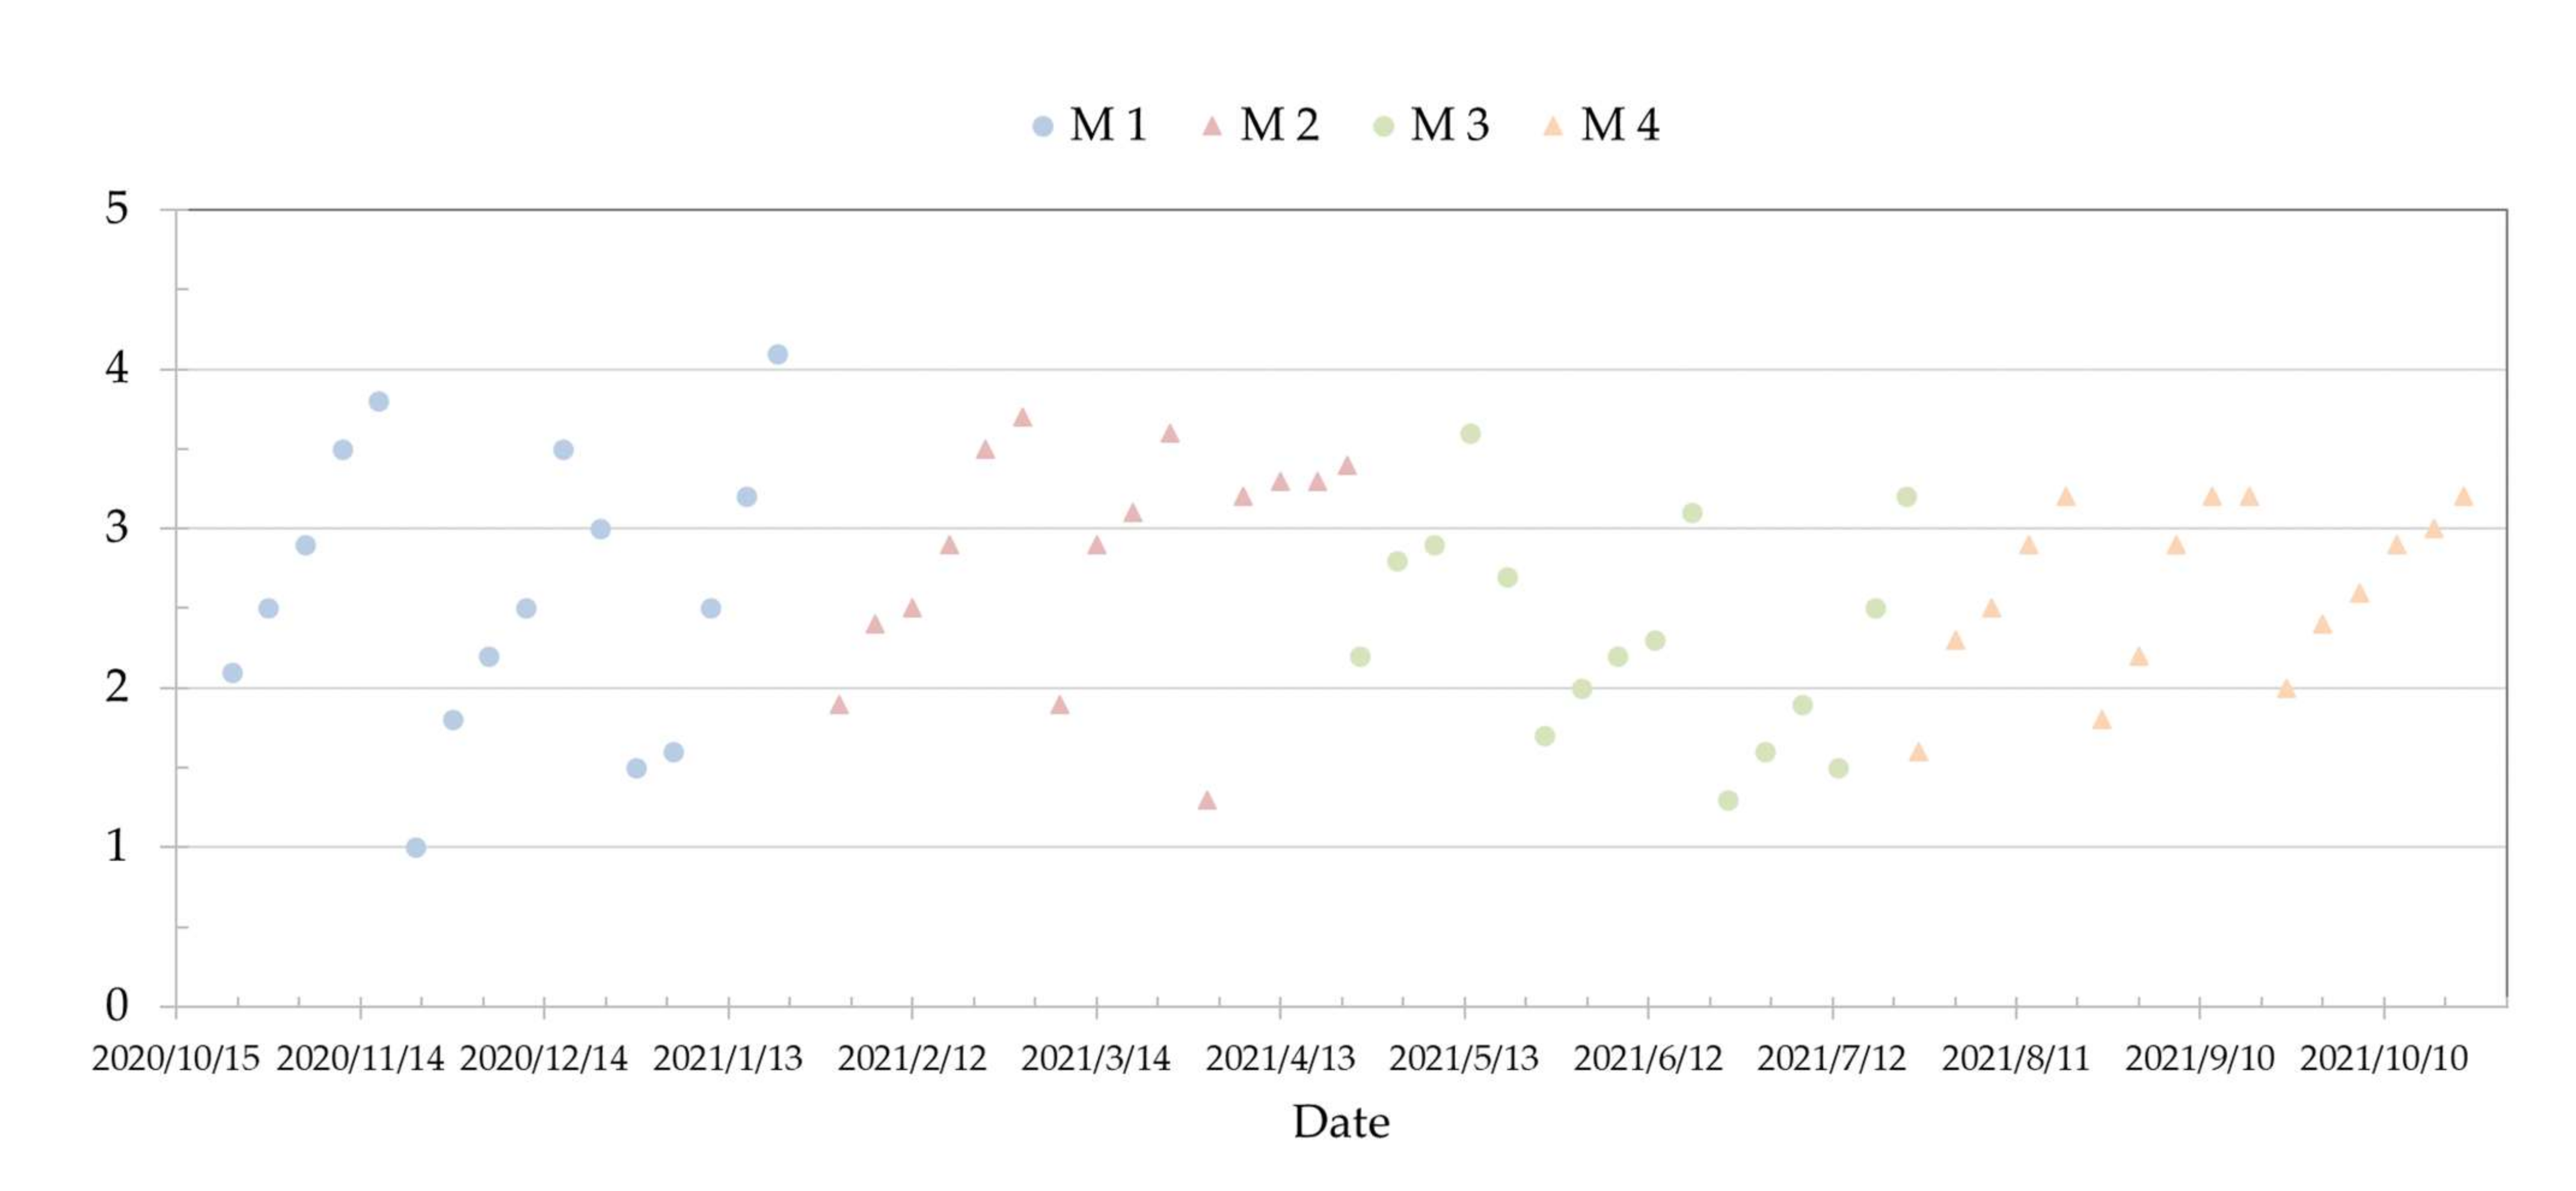
  • In practice, FF followed by UF produced stable RO feedwater of an SDI15 lower than 4.1, which indicates a robust protective effect on the subsequent RO process;
  • When UF provided a stable filtration performance, the RO unit exhibited a stable performance and production capacity. Indeed, the RO membranes rejected 97.9% of the EC, which meets the requirements for industrial reuse and government regulations;
  • The quality of the UF permeate was close to general water standards, while the RO permeate could be categorized as extremely pure water;
  • The fouling of the UF and RO membranes can be controlled and reduced through the application of BW, CEB, and CIP.
In terms of the operating cost, the optimal operating conditions (UF: 45 LMH, RO: 75%, and 18 LMH) reduced the operation and maintenance costs while maintaining the efficiency. Dual-membrane filtration (UF + RO) proved to be an efficient approach to water sustainability that will enable the reclamation of municipal sewage for industrial purposes. Industries that are located in water-stressed regions must ensure a stable and solid water supply. After more than twenty years of international study into the reuse of municipal sewage through membrane processes, this study confirms that the process has reached maturity and that it is ready for the full-scale implementation of sustainable water reuse. In future studies, we plan to explore the real productivity, the total costs during long-term operations, and the optimization of the energy consumption under field conditions.

Author Contributions

Conceptualization, methodology, investigation, data curation, writing—original draft preparation, visualization, S.-S.C.; software, writing—review and editing, super-vision, J.-H.W.; validation, formal analysis, resources, S.-S.C. and J.-H.W. All authors have read and agreed to the published version of the manuscript.

Funding

This research received no external funding.

Institutional Review Board Statement

Not applicable.

Informed Consent Statement

Not applicable.

Data Availability Statement

Data are contained within the article.

Acknowledgments

This research was supported by the Water Resources Bureau of the Tainan City Government through the job numbers: no. wat103168, and wat108129. We are sincerely grateful to the anonymous reviewers for their suggestions for improving the quality of the manuscript.

Conflicts of Interest

The authors declare no conflict of interest.

References

  1. Balfaqih, H.; Al-Nory, M.T.; Nopiah, Z.M.; Saibani, N. Environmental and economic performance assessment of desalination supply chain. Desalination 2017, 406, 2–9. [Google Scholar] [CrossRef]
  2. Mancosu, N.; Snyder, R.L.; Kyriakakis, G.; Spano, D. Water Scarcity and Future Challenges for Food Production. Water 2015, 7, 975–992. [Google Scholar] [CrossRef]
  3. Giannoccaro, G.; Arborea, S.; de Gennaro, B.C.; Iacobellis, V.; Piccinni, A.F. Assessing Reclaimed Urban Wastewater for Reuse in Agriculture: Technical and Economic Concerns for Mediterranean Regions. Water 2019, 11, 1511. Available online: https://www.mdpi.com/2073-4441/11/7/1511 (accessed on 5 December 2020). [CrossRef] [Green Version]
  4. Ponce-Robles, L.; Masdemont-Hernández, B.; Munuera-Pérez, T.; Pagán-Muñoz, A.; Lara-Guillén, A.J.; García-García, A.J.; Alarcón-Cabañero, J.J. WWTP Effluent Quality Improvement for Agricultural Reuse Using an Autonomous Prototype. Water 2020, 12, 2240. Available online: https://www.mdpi.com/2073-4441/12/8/2240 (accessed on 5 December 2020). [CrossRef]
  5. Chang, D.; Ma, Z. Wastewater reclamation and reuse in Beijing: Influence factors and policy implications. Desalination 2012, 297, 72–78. [Google Scholar] [CrossRef]
  6. Sewage System Office Construction and Planning Agency Ministry of the Interior. Public Sewage Treatment Plant. 2022. Available online: https://www.cpami.gov.tw/home.html (accessed on 12 March 2022).
  7. Maryam, B.; Büyükgüngör, H. Wastewater reclamation and reuse trends in Turkey: Opportunities and challenges. J. Water Process Eng. 2019, 30, 100501. [Google Scholar] [CrossRef]
  8. Alsarayreh, A.A.; Al-Obaidi, M.A.; Farag, S.K.; Patel, R.; Mujtaba, I.M. Performance evaluation of a medium-scale industrial reverse osmosis brackish water desalination plant with different brands of membranes. A simulation study. Desalination 2021, 503, 114927. [Google Scholar] [CrossRef]
  9. Al-Obaidi, M.A.; Alsarayreh, A.A.; Al-Hroub, A.M.; Alsadaie, S.; Mujtaba, I.M. Performance analysis of a medium-sized industrial reverse osmosis brackish water desalination plant. Desalination 2018, 443, 272–284. [Google Scholar] [CrossRef] [Green Version]
  10. Lee, K.; Jepson, W. Drivers and barriers to urban water reuse: A systematic review. Water Secur. 2020, 11, 100073. [Google Scholar] [CrossRef]
  11. Lefebvre, O. Beyond NEWater: An insight into Singapore’s water reuse prospects. Curr. Opin. Environ. Sci. Health 2018, 2, 26–31. [Google Scholar] [CrossRef]
  12. Pintilie, L.; Torres, C.M.; Teodosiu, C.; Castells, F. Urban wastewater reclamation for industrial reuse: An LCA case study. J. Clean. Prod. 2016, 139, 1–14. [Google Scholar] [CrossRef]
  13. Touati, K.; Gzara, L.; Mahfoudhi, S.; Bourezgui, S.; Hafiane, A.; Elfil, H. Treatment of coastal well water using ultrafiltration-nanofiltration-reverse osmosis to produce isotonic solutions and drinking water: Fouling behavior and energy efficiency. J. Clean. Prod. 2018, 200, 1053–1064. [Google Scholar] [CrossRef]
  14. Tang, F.; Hu, H.-Y.; Sun, L.-J.; Sun, Y.-X.; Shi, N.; Crittenden, J.C. Fouling characteristics of reverse osmosis membranes at different positions of a full-scale plant for municipal wastewater reclamation. Water Res. 2016, 90, 329–336. [Google Scholar] [CrossRef]
  15. Barbagallo, S.; Cirelli, G.L.; Consoli, S.; Licciardello, F.; Marzo, A.; Toscano, A. Analysis of treated wastewater reuse potential for irrigation in Sicily. Water Sci. Technol. 2012, 65, 2024–2033. [Google Scholar] [CrossRef] [Green Version]
  16. Nejati, S.; Mirbagheri, S.A.; Warsinger, D.M.; Fazeli, M. Biofouling in seawater reverse osmosis (SWRO): Impact of module geometry and mitigation with ultrafiltration. J. Water Process Eng. 2019, 29, 100782. [Google Scholar] [CrossRef]
  17. Corbatón-Báguena, M.J.; Álvarez-Blanco, S.; Vincent-Vela, M.C. Evaluation of fouling resistances during the ultrafiltration of whey model solutions. J. Clean. Prod. 2018, 172, 358–367. [Google Scholar] [CrossRef]
  18. Sim, L.N.; Chong, T.H.; Taheri, A.H.; Sim, S.T.V.; Lai, L.; Krantz, W.B.; Fane, A.G. A review of fouling indices and monitoring techniques for reverse osmosis. Desalination 2018, 434, 169–188. [Google Scholar] [CrossRef]
  19. Brover, S.; Lester, Y.; Brenner, A.; Sahar-Hadar, E. Optimization of ultrafiltration as pre-treatment for seawater RO desalination. Desalination 2022, 524, 115478. [Google Scholar] [CrossRef]
  20. Jamaly, S.; Darwish, N.N.; Ahmed, I.; Hasan, S.W. A short review on reverse osmosis pretreatment technologies. Desalination 2014, 354, 30–38. [Google Scholar] [CrossRef]
  21. Voutchkov, N. Considerations for selection of seawater filtration pretreatment system. Desalination 2010, 261, 354–364. [Google Scholar] [CrossRef]
  22. American Public Health Association. Standard Methods for the Examination of Water and Wastewater, 23rd ed.; American Water Works Association & Water Environment Federation: Washington, DC, USA, 2017. [Google Scholar]
  23. Environmental Protection Administration. Environmental Analysis Laboratory. 2020. Available online: https://www.epa.gov.tw/niea/A048BA729D1F7D58 (accessed on 8 March 2022).
  24. Kim, J.J.; Yoon, H.; Hong, J.; Lee, T.; Wilf, M. Evaluation of new compact pretreatment system for high turbidity seawater: Fiber filter and ultrafiltration. Desalination 2013, 313, 28–35. [Google Scholar] [CrossRef]
  25. Lee, J.J.; Cha, J.H.; Ben Aim, R.; Han, K.B.; Kim, C.W. Fiber filter as an alternative to the process of flocculation–sedimentation for water treatment. Desalination 2008, 231, 323–331. [Google Scholar] [CrossRef]
  26. Lee, J.J.; Johir, M.A.H.; Chinu, K.H.; Shon, H.K.; Vigneswaran, S.; Kandasamy, J.; Shaw, K. Hybrid filtration method for pre-treatment of seawater reverse osmosis (SWRO). Desalination 2009, 247, 15–24. [Google Scholar] [CrossRef] [Green Version]
  27. Jeanmaire, J.-P.; Suty, H.; Marteil, P.; Breant, P.; Pedenaud, P. Application of the flexible fiber filter module (3FM) filter to sea water filtration. Water Sci. Technol. 2007, 56, 157–165. [Google Scholar] [CrossRef]
  28. Qin, J.-J.; Wai, M.N.; Oo, M.H.; Kekre, K.A.; Seah, H. Feasibility study for reclamation of a secondary treated sewage effluent mainly from industrial sources using a dual membrane process. Sep. Purif. Technol. 2006, 50, 380–387. [Google Scholar] [CrossRef]
  29. Qin, J.-J.; Kekre, K.A.; Tao, G.; Oo, M.H.; Wai, M.N.; Lee, T.C.; Seah, H. New option of MBR-RO process for production of NEWater from domestic sewage. J. Membr. Sci. 2006, 272, 70–77. [Google Scholar] [CrossRef]
  30. Zhao, Y.; Song, L.; Ong, S.L. Fouling behavior and foulant characteristics of reverse osmosis membranes for treated secondary effluent reclamation. J. Membr. Sci. 2010, 349, 65–74. [Google Scholar] [CrossRef]
  31. PENTAIR. Product Selection Tools. 2020. Available online: https://xflow.pentair.com/en (accessed on 28 December 2020).
  32. Hydranautics—A Nitto Group Company. Product Selection Tools. 2020. Available online: https://membranes.com/product-selection-tools/ (accessed on 9 February 2022).
  33. Henan Dingxinda Import & Export Co., Ltd. Product Selection Tools. 2022. Available online: https://www.dxdcarbon.com/ (accessed on 9 February 2022).
  34. Urgun-Demirtas, M.; Benda, P.L.; Gillenwater, P.S.; Negri, M.C.; Xiong, H.; Snyder, S.W. Achieving very low mercury levels in refinery wastewater by membrane filtration. J. Hazard. Mater. 2012, 215–216, 98–107. [Google Scholar] [CrossRef]
  35. Singapore’s National Water Agency. NEWater Technology. 2021. Available online: https://www.pub.gov.sg/ (accessed on 12 August 2021).
  36. Doederer, K.; Farré, M.J.; Pidou, M.; Weinberg, H.S.; Gernjak, W. Rejection of disinfection by-products by RO and NF membranes: Influence of solute properties and operational parameters. J. Membr. Sci. 2014, 467, 195–205. [Google Scholar] [CrossRef] [Green Version]
  37. Water Resources Agency, MOEA. Laws. 2021. Available online: https://eng.wra.gov.tw/Default.aspx (accessed on 5 March 2022).
  38. Panhwar, M.Y.; Panhwar, S.; Keerio, H.A.; Khokhar, N.H.; Shah, S.A.; Pathan, N. Water quality analysis of old and new Phuleli Canal for irrigation purpose in the vicinity of Hyderabad, Pakistan. Water Pract. Technol. 2022, 17, 529–536. [Google Scholar] [CrossRef]
  39. Stenstrom, M.K.; Song, S.S. Effects of oxygen transport limitation on nitrification in the activated sludge process. Res. J. Water Pollut. Control. Fed. 1991, 63, 208–219. Available online: https://www.jstor.org/stable/25043984 (accessed on 23 December 2020).
  40. Keerio, H.A.; Bae, W. Experimental investigation of substrate shock and environmental ammonium concentration on the stability of ammonia-oxidizing bacteria (AOB). Water 2020, 12, 223. [Google Scholar] [CrossRef] [Green Version]
  41. Neger, M.K. Literature Review on the Survival of Fecal Coliform in Fresh and Saline Waters, and Sediments; Agreement No. GA-97020501-0; Lummi Indian Business Council: Bellingham, WA, USA, 2002. [Google Scholar]
  42. Căilean, D.; Barjoveanu, G.; Teodosiu, C.; Pintilie, L.; Dăscălescu, I.G.; Păduraru, C. Technical performances of ultrafiltration applied to municipal wastewater treatment plant effluents. Desalination Water Treat. 2015, 56, 1476–1488. [Google Scholar] [CrossRef]
  43. Samudro, G.; Mangkoedihardjo, S. Review on BOD, COD and BOD/COD Ratio: A triangle zone for toxic, biodegradable and stable levels. Int. J. Acad. Res. 2010, 2, 235–239. [Google Scholar]
  44. Mutamim, N.S.A.; Noor, Z.Z.; Hassan, M.A.A.; Olsson, G. Application of membrane bioreactor technology in treating high strength industrial wastewater: A performance review. Desalination 2012, 305, 1–11. [Google Scholar] [CrossRef]
  45. Viero, A.F.; Sant’Anna, G.L. Is hydraulic retention time an essential parameter for MBR performance? J. Hazard. Mater. 2008, 150, 185–186. [Google Scholar] [CrossRef]
  46. Fried, J.; Lemmer, H. On the dynamics and function of ciliates in sequencing batch biofilm reactors. Water Sci. Technol. 2003, 47, 189–196. [Google Scholar] [CrossRef]
  47. Chan, H. High performance achieved by microbes to separate laundry effluents resulting in producing high water quality in a compact area. Sep. Purif. Technol. 2012, 90, 101–108. [Google Scholar] [CrossRef]
  48. Pérez-Uz, B.; Arregui, L.; Calvo, P.; Salvadó, H.; Fernández, N.; Rodríguez, E.; Serrano, S. Assessment of plausible bioindicators for plant performance in advanced wastewater treatment systems. Water Res. 2010, 44, 5059–5069. [Google Scholar] [CrossRef]
  49. Hernández Navarro, M.; Melián-Martel, N.; Ruiz-García, A.; Río-Gamero, B.D. Fouling characterization during initial stage of cross-flow ultrafiltration. J. Water Process Eng. 2020, 38, 101611. [Google Scholar] [CrossRef]
  50. Walker, J.T.; Phillips, D.V.; Melin, J.; Spradlin, D. Effects of intermittent acidic irrigations on soybean yields and frogeye leaf spot. Environ. Exp. Bot. 1994, 34, 311–318. [Google Scholar] [CrossRef]
  51. Ruiz-García, A.; de la Nuez-Pestana, I. A computational tool for designing BWRO systems with spiral wound modules. Desalination 2018, 426, 69–77. [Google Scholar] [CrossRef] [Green Version]
  52. Lesjean, B.; Leiknes, T.O. Salient outcomes of the European R&D projects on MBR technology. In Final MBR-Network Workshop; Kompetenzzentrum Wasser Berlin GmbH: Berlin, Germany, 2009. [Google Scholar]
Figure 1. Aerial view of Anping WRRF: raw-sewage pumping, pretreatment facility, primary settling tanks, aeration tanks, secondary sedimentation tanks, disinfection tanks, sludge-thickening tanks, sludge-digestion tanks, and effluent outfall.
Sustainability 14 05443 g001
Figure 2. Images of pilot plant: raw feedwater storage tank, FF units, filtrate storage tank, vacuum filtration pump, UF units, permeate storage tank, RO units, chemical dosing system, control panel, and steel frame.
Sustainability 14 05443 g002
Figure 3. Schematic diagram of dual-membrane (UF and RO) pilot plant.
Sustainability 14 05443 g003
Figure 4. Turbidity removal efficiencies of four operating modes of FF unit outlet.
Sustainability 14 05443 g004
Figure 5. Net driving pressures (NDPs) and production capacities (m3) of four operating modes of FF unit.
Sustainability 14 05443 g005
Figure 6. Fiber-ball defilamentation, clogging, and cleaning for FF unit: (a) defilamentation; (b) defilamentation; (c) clogging; (d) cleaning.
Sustainability 14 05443 g006
Figure 7. Turbidity concentrations (NTU) and removal efficiencies (%) of FF-unit outlet and UF-unit permeate.
Sustainability 14 05443 g007
Figure 8. Net driving pressures (NDPs) and production capacities (m3) of four operating modes of RO unit.
Sustainability 14 05443 g008
Figure 9. EC concentrations (μs/cm) and removal efficiencies (%) of RO-unit permeate.
Sustainability 14 05443 g009
Figure 10. Biological phases observed in activated sludge system: (a) Philodina sp.; (b) rotifer; (c) Epistylis plicatilis; (d) Vorticella aquadulcis complex.
Sustainability 14 05443 g010aSustainability 14 05443 g010b
Figure 11. Trend of SDI15 changes during operating period.
Sustainability 14 05443 g011
Figure 12. Values for pH of effluent, RO feed, and permeate.
Sustainability 14 05443 g012
Figure 13. Energy-consumption data collected through real-time monitoring.
Sustainability 14 05443 g013
Table 1. Specifications of FF, UF, and RO units and design parameters based on product data sheets (PDSs).
ParameterDingxinda (Fiber Filter) ParameterPentair, X-Flow Aquaflex 64
(UF Membrane)
ParameterHydranautics, Nitto Denko LFC3-LD
(RO Membrane)
Density1.38 kg/m3Maximum System Pressure43 psiMaximum Applied Pressure600 psig
Filtration Linear VelocityFrom 30 to 80 m3/m2/hMaximum Backflush Pressure43 psiMaximum Chlorine Concentration<0.1 ppm
Backwash TimeFrom 10 to 20 minTemperature Range0 to 40 °CMaximum Feedwater Turbidity1.0 NTU
Backwash CycleFrom 8 to 24 hEffective Membrane Area64.0 m2Maximum Feedwater SDI155.0
Filtration Pressure2.0 kg/cm2 or lessModule Length1537.5 mmPermeate Flow41.6 m3/d
Filter MaterialPolyester fiberModule Weight Water-Filled66 kgMaximum Feed Flow17.0 m3/h
Specific Surface Area3000 m2/m3Membrane Diameter0.77 mmMembrane Active Area37.1 m2
Replacement Filter MediaNone (10% supplement once a year)Crossflow Flow Rate30.8 m3/hSalt Rejection99.7%
Table 2. Parameters of four different operating modes.
ItemMode 1Mode 2Mode 3Mode 4
Production Capacity (m3)50.050.050.050.0
FF Filtration Linear Velocity (m/h)80808080
UF Filtrate Flux Rate (LMH)40404545
RO Recovery (%)75757565
RO Filtrate Flux Rate (LMH)16181818
Running Period (days)90909090
Table 3. List of cleaning conditions for each unit.
UnitFFUFRO
CEB Cleaning ConditionsMonthlyDailyN/A
CEB Cleaning ProcessChemicals: 100 mg/L NaOCl;
Times: 4 h
Chemicals: 100 mg/L NaOCl;
Times: 1 h
N/A
CIP Cleaning ConditionsPressure differential (ΔP) exceeds 1.5 kg/cm2 or removal rate below 20%Pressure differential (ΔP) exceeds 1.5 kg/cm2Pressure differential (ΔP) exceeds 3.0 kg/cm2
CIP Cleaning ProcessChemicals: 0.05% NaOH, 100 mg/L NaOCl; Times: 8 hChemicals: 0.27% NaOH, 200 mg/L NaOCl; Times: 4 hChemicals: 0.01 N NaOH, 0.01 N HCl; Times: 4 h
Table 4. Quality and characteristics of effluent water from Anping WRRF.
ParametersWRRF Effluent
MaximumMean Value ± SDMinimum
Coliform group 1 (CFU/100 mL) 21.5 × 10⁵(3.3 ± 2.8) × 104120
BOD5 (mg/L)14.37.5 ± 2.42.4
COD (mg/L)39.624.1 ± 3.613.5
NH3-N (mg/L)9.201.83 ± 2.010.03
TOC (mg/L)8.85.1 ± 1.42.8
Cl (mg/L)1340603 ± 214330
SS (mg/L)16.86.3 ± 2.12.5
TDS (mg/L)25031587 ± 388498
Turbidity (NTU) 311.13.8 ± 1.61.1
pH7.36.8 ± 0.26.3
EC (μs/cm)78602839 ± 757735
1 At the outlet of the disinfection tanks of the WRRF. 2 CFU: colony-forming unit. 3 NTU: nephelometric turbidity unit.
Table 5. Treated water quality and quality standards of reclaimed water.
ItemTreated WaterQuality Standards of Reclaimed Water 1
Temp (°C)21.1–33.4-
pH5.3–5.96.0–8.5
Turbidity (NTU)0.1–1.25
EC (μs/cm)30–105-
Boron (mg/L)0.05–0.25-
Ca2+ (mg/L)1.10–2.16-
Cl (mg/L)1.5–16.1-
COD (mg/L)ND (<3.2)–4.2-
Mg2+ (mg/L)<0.1-
NH3-N (mg/L)0.04–1.4210
SiO2 (mg/L)0.11–1.34-
SS (mg/L)<0.1-
TDS (mg/L)19.6–62.5-
SO42− (mg/L)0.10–2.73-
TOC (mg/L)0.3–0.610
Minimum residual chlorine of combined residual chlorine (mg/L)-0.4
Minimum residual chlorine of free residual chlorine (mg/L)-0.1
Maximum allowable limit for coliform group (membrane filtration method) (CFU/100 mL)<10200
1 The hydrogen ion concentration is a tolerance range, and the remaining water-quality requirements are the maximum allowable limit.
Table 6. Cost estimates of different treatment modes.
Item 1Mode 1Mode 2Mode 3Mode 4
Production capacity (m3)51.351.553.352.8
UF filtrate flux rate (LMH)40404545
RO recovery (%)75757565
RO filtrate flux rate (LMH)16181818
Chemical dosage cost (USD/m3)0.2170.2170.2130.244
Gross power (kWh)14,35714,86413,59513,808
Energy consumption rate (kWh/m3)3.113.212.842.91
Energy cost per m3 (USD/m3)0.2760.2850.2520.259
Chemical dosage cost + energy cost 2 (USD/m3)0.4930.5020.4650.503
1 Only the variable costs (chemical dosage and energy) are compared; the rest of the benchmark condition costs are not included in the comparison. 2 Chemical consumption based on NaOCl, NaOH, and HCl for CEB and CIP.
Publisher’s Note: MDPI stays neutral with regard to jurisdictional claims in published maps and institutional affiliations.

