Abstract
The energy consumption and carbon footprint of cryptocurrencies have always been a popular topic. However, most of the existing studies only focus on one cryptocurrency, Bitcoin, and there is a lack of long-term monitoring studies that summarize all cryptocurrencies. By constructing a time series hash rate/power model, this research obtained the 10-year time series data on energy consumption dataset of global top-25 cryptocurrencies for the first time. Both the temporal coverage and the spatiotemporal resolution of the data exceed previous studies. The results show that Bitcoin’s power consumption only accounts for 58% of the top-25 cryptocurrencies. After China bans cryptocurrencies, the conservative change in global CO2 emissions from 2020 will be between −0.4% and 4.4%, and Central Asian countries such as Kazakhstan are likely to become areas of rapid growth in carbon emissions from cryptocurrencies.
1. Introduction
As a financial and investment tool of blockchain, cryptocurrency has developed rapidly in recent years. From 2016 to 2021, the price of Bitcoin increased 112 times, Ethereum increased 498 times, and Dogecoin increased 1055 times. Therefore, cryptocurrency is regarded by many people as an effective way to quickly earn wealth, which has triggered a global mining boom. Mining, which uses an encryption algorithm to obtain virtual currency rewards, requires a huge amount of electricity. There is much research concerned that the widespread use of cryptocurrencies will cause additional carbon emissions. World Meteorological Organization data show that in the context of the global economic recession of the COVID epidemic, the global CO2 concentration in 2020 was abnormally higher than that in 2019 by 0.61% [1,2]. Carbon dioxide emissions from commercial aviation worldwide decreased by 410 million metric tons (Mt CO2) in 2020 compared to 2019 (905–495 Mt CO2). Therefore, researchers are especially concerned that the total global carbon dioxide emissions are still increasing despite the traffic restrictions caused by COVID-19. Some researchers believe that the cryptocurrency mining boom is one of the reasons.
The increasing energy consumption of Bitcoin mining has triggered a passionate debate within academic literature and among the general public regarding the sustainability of the digital currencies [3,4,5]. Old data shows that the electricity consumption caused by Bitcoin calculation alone (138 TWh) exceeds the sum of lighting and television in the United States (60 & 60 TWh), and also exceeds the national electricity consumption of Ukraine and Norway [6]. In 2018, Masanet simulated the increase in electricity growth caused by Bitcoin mining and believed that the popularity of Bitcoin would lead to uncontrollable global temperature changes [7]. Krause and Tolaymat provided an estimated range from 3 to 15 Mt CO2 for the first half of 2018 [8]. McCook estimated 63 Mt CO2 up to August 2018 [9]. Foteinis estimated the combined footprint of Bitcoin and Ethereum to be 43.9 Mt CO2 [10]. Mora et al. claimed that Bitcoin mining will cause the global climate to rise by 2° [11]. Stoll et al. found annual emissions of Bitcoin ranging from 22.0 to 22.9 Mt CO2 of carbon dioxide [12]. Although these studies have some preliminary estimates, they are often debated by a large number of researchers due to different statistical calibers and poor temporal or spatial resolution of the methods.
From April to October 2020, the Chinese government issued a series of policies on “energy saving and emission reduction” and prohibited cryptocurrency mining. The latest data show that Bitcoin hash rate in China has been cleared, while the proportion of Bitcoin hash rate in the United States and Kazakhstan has increased rapidly since July [6]. From a global perspective, the transfer of cryptocurrency mining equipment between countries is bound to bring about a redistribution of global carbon emissions. Therefore, it is difficult to assess the carbon footprint impact of this important historical event by using the country as the statistical unit and the year as the statistical scale. New methods, especially statistical methods based on a geospatial perspective, need to be proposed to estimate the global transfer path of mining equipment and reveal the global carbon footprint of cryptocurrencies after China bans cryptocurrency mining.
Compared with previous schemes, this paper constructs a dataset with higher spatial and temporal resolution scales, including upgrading China’s power and energy structure data scale to the provincial level, which helps reduce national-scale estimation errors [13]. Second, this article systematically collected the time series data of 25 kinds of cryptocurrency hash rate and constructed the hash rate/power time series model of the cryptocurrency mining machine, which greatly improved the accuracy and time resolution of the cryptocurrency power consumption analysis data. Latly, the improvement of data and methods makes this research one of the best time coverage and highest data resolution studies on the power consumption and carbon emission analysis of cryptocurrency mining.
2. Materials and Methods
2.1. Hash Rate of Global Cryptocurrency
The global hash rate of a cryptocurrency is an important indicator of the number of computing devices in the world for a cryptocurrency. Using hash rate can ensure that the data cover all computing devices that are mining and can avoid double counting between different currencies because even if the same device can mine multiple cryptocurrencies, the total hardware hash rate is always limited. Hash rate is a measurement unit of Bitcoin network processing capacity, that is, the speed at which the terminal device calculates the result of the hash function. For example, when the hash rate reaches 10 Th/s, it means that it can perform 10 trillion hash calculations per second. The global hash rate reflects the computing scale of global mining equipment at the same time. The hash rate is directly related to the mining difficulty and mining output. There is a large gap between the mining algorithms of different cryptocurrencies, such as SHA256 and Scrypt. This also results in different hash rates/powers of the same device in different cryptocurrencies, which must be counted separately. Therefore, this study collected the global hash rate changes of the 25 most widely used cryptocurrencies from 9 January 2009 to 14 July 2021 [Table 1]. In this way, this study can reduce the errors of previous estimates of global hash rate and carbon emissions using only Bitcoin data. This study counts the mining machine model and release year of each cryptocurrency algorithm and constructs a time-series hash rate/power dataset. In this way, the power consumption at a certain time can be inversely calculated according to the hash rate of the encrypted currency. The historical data of the cryptocurrency hash rate come from Coinwarz, the world’s largest data service online platform for cryptocurrencies [14]. These data can visually show the total scale of calculations of cryptocurrency mining equipment since 2009.

Table 1.
Data availability of 25 cryptocurrencies.
2.2. Energy Consumption Estimation Methodof Cryptocurrency
In the current cryptocurrency field, there are mainly two ways of “obtaining” coins, namely, POS (proof of stake) and POW (proof of work), which is also called “mining” in this research. Among them, the POS method issues coins based on the number of virtual coins held, and the POW method issues coins based on the calculation of the algorithm. Generally, the cryptocurrency field has also noticed that the POW method consumes huge amounts of electricity, and POS is considered to be the main method of mining cryptocurrencies in the future. However, for now, POW is still the most mainstream cryptocurrency mining method [3]. The 25 cryptocurrencies counted in this study are all POW methods.
The upgrading of the computer chip manufacturing process and core design has led to an upward trend in the hash rate/power of integrated chips. Therefore, the construction of “hash rate/power” timing models of different cryptocurrency algorithms is very important for estimating the timing energy consumption of cryptocurrencies. The algorithms of different cryptocurrencies are very different, but they can be divided into two categories: “anti-ASIC” and “ASIC” according to whether they can be mined by special ASIC equipment. The cryptocurrencies that can be mined by ASIC equipment include most cryptocurrencies, such as Bitcoin and Litecoin. Encrypted coins for ASIC-resistant devices include Monero, Ethereum, etc. They usually use dynamic, changing, or memory-intensive encryption algorithms to circumvent the application of ASIC mining machines [15]. However, this research only focuses on the power consumption of the equipment used in the cryptocurrency algorithm. Generally, ASIC miners have a higher hash rate and lower power consumption. With the same hash rate, ASIC miners have lower carbon emissions.
This research obtains as comprehensively as possible the hash rate, power consumption, and release year of all corresponding mining equipment for 25 cryptocurrencies since 2009, including but not limited to ASIC mining machines, GPUs, and CPUs for various algorithms. The hashrate/power scatter diagram of different algorithms is shown in Figure 1. In this way, a model of the power consumption of various cryptocurrencies and hash rate on a time scale has been constructed [Figure 2].
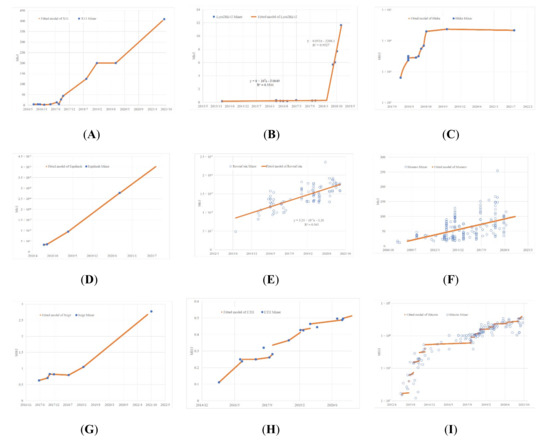
Figure 1.
Hash rate-power model based on time series data of 486 mining equipment samples. (A) Hashrate/power-time model of Blake algorithm (Decred). (B). Hashrate/power-time model of Equihash algorithm (Horizen, Zcash, Beam). (C) Hashrate/power-time model of X11 algorithm (Dash). (D) Hashrate/power-time model of Lyra2REv2 algorithm (Vertcoin, Monacoin). The model is divided into two-time phases: GPU mining and ASIC mining. (E) Hashrate/power-time model of Scrypt algorithm (Feathercoin, Einsteinium, Dogecoin, Syscoin, Verge, LitecoinCash, Litecoin, Florincoin, Viacoin). (F) Hashrate/power-time model of SHA256 algorithm (Bitcoin, DigiByte, BitconCash, Peercoin). (G) Hashrate/power-time model of RandomX/CryptoNight algorithm (Monero). (H) Hashrate/power-time model of X16R algorithm (Ravencoin). (I) Hashrate/power-time model of Ethash algorithm (Ethereum Classical, Ethereum).
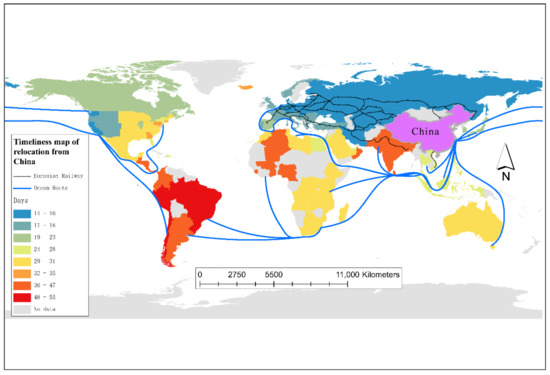
Figure 2.
Timeliness map of relocation from China.
2.3. Carbon Emission Estimation Method
There have been quite a few studies on carbon emission estimation methods based on power generation methods. Based on the consideration of the complex power structure and large total amount of each province in China, this research uses provincial resolution in China and the United States. The proportion of Bitcoin hash rate in China ranks first in the world, and the proportion of coal-fired power generation is also high. Therefore, China has always been considered by researchers to be the country with the largest energy consumption and carbon emissions of cryptocurrencies. However, there are great differences in the power energy structure of provinces in China. Coal-fired power generation accounts for 12.9% of China’s Sichuan Province and 84.1% of Inner Mongolia [5]. Therefore, the power generation data scale of this study is delineated by province in China and the United States, and other regions are delineated by national scales to ensure uniform resolution and granularity. Similarly, energy consumption data for power generation are also delineated on a provincial/state scale in China and the United States and on a national scale in other regions.
Carbon emission data are calculated by the conversion parameters between the power generation method and the carbon emission amount, which is a relatively simple and universal calculation method in the field of carbon emissions. Each kilowatt-hour of coal-fired power generation is equivalent to 950 g of carbon dioxide emissions, 350 g for natural gas, 105 g for solar power, 12 g for wind power, 4 g for hydropower, and 6 g for nuclear power. The power generation data come from British Petroleum’s Statistical Review of World Energy 2021 and the 2020 China Statistical Yearbook [5,16]. The carbon emission data corresponding to different power generation methods come from the International Energy Agency (IEA) and the United Nations Environment Programme (UNEP) [17,18].
2.4. Miner Relocation Driving Force Indicator
This research assumes that the miners of cryptocurrency mining are rational people who seek to maximize their interests. Then, the mining behavior of miners under the premise of owning equipment can be modeled as a model for seeking the optimal solution for the greatest benefit:
Assuming that the cost of mining at a new location is lower (usually the cost of electricity), the RDF (relocation driving force) that determines whether a miner will relocate to a new location is:
When the driving cost is greater than 0, the mining revenue of the miner in the new location is greater than the local revenue, which will drive the miner to migrate between different locations. The relocation cost can be approximated as a linear function proportional to the distance when the cryptocurrency price fluctuates little. Miners will reconsider the mining location after a certain place issues a mining prohibition policy. When other parameters remain unchanged, electricity tariffs can be regarded as the only difference factor that affects profits between different locations.
By incorporating Equations (1) and (3) into Equation (2), the following formula can be obtained.
In Equation (4), RDF is converted into a ternary linear function related to regional electricity prices, relocation costs, and duration. Taking Russia as an example, the electricity price in Russia is $0.094/KWh. For simple calculation, this research assumes that all the mining machines to be relocated are Ant s11, its single device hash rate is 20.5 T, the daily income of a single device (15 September) is $6.50, the power consumption is 1435 W, and the packaging size is 486 × 388 × 265. Assuming optimal loading, 1485 units can be installed in a 40 hq standard container (1180 × 213 × 218 cm). We calculate that each 40 hq container takes a day during the journey to Russia, and the lost bitcoin gains are $5903, which greatly exceeds the freight difference between sea and rail transportation. Therefore, this study assumes that when relocating mining machines, miners will preferentially travel to the destination country via rail transportation on the Eurasian continent, and other countries without rail links to China will travel by sea. This study is based on this principle, combined with freight and timeliness data obtained from JC Logistics Global Service Center, which is one of China’s largest international logistics service trading centers, and roughly divides the world into 10 geographic locations.
Then, the relocation distances of countries around the world were calculated through ocean routes and railway systems, and 23 freight areas were finally divided [Figure 2, Appendix A].
The geoprocessing tool used in this study is ArcGIS, and the base map is GADM (Global Administrative Division Data) [19]. Based on this, the global electricity price distribution map is drawn [Figure 3]. In this way, the price of electricity in various locations around the world, as well as freight, will be brought into the model as the driving force calculation parameters.
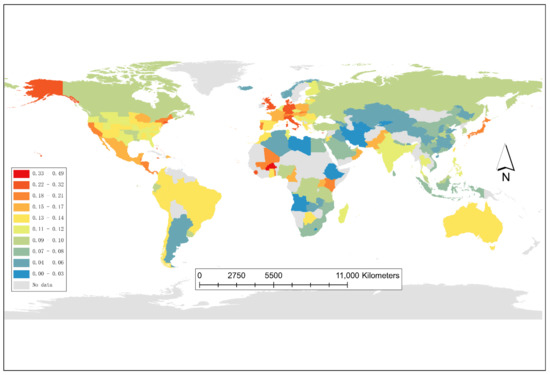
Figure 3.
Global electricity price distribution.
2.5. Cryptocurrency Miner Migration Trend Simulation Based on a Normal Distribution
When the calculation of the RDF indicators for 70 countries is completed, which destination the miners choose becomes a probability question based on the ranking of driving forces. This research introduces the reflection normal distribution function:
In this study, σ is std(0:69), so the curve indicates the probability of each country being selected as the migration destination of cryptocurrency mines. As of 1 September 2021, the power consumption of the mining machines that disappeared in China has reached 34.525 TWh compared to 2020. Then, the total power consumption Q(x) that is about to transfer is:
In this paper, γ = 34,525, q is the transfer volume of country i, and hi is the transfer ratio of country i. According to the miners’ IP attribution data, China, the United States, Russia, Malaysia, Iran, Kazakhstan, Canada, Germany, and Ireland account for approximately 94% of the global Bitcoin hash rate share. Therefore, this study will evaluate the hash migration trend and carbon footprint of the above eight major countries with the exception of China, and the sum of the eight countries will approximate the global results.
3. Results
3.1. Total Hash Rate and Total Power Consumption of Cryptocurrencies in the World
This study found that the total hash rate of global cryptocurrencies has grown almost exponentially since 2013 [Figure 4]. Some cryptocurrency hash rate fluctuates in value during the “hard fork” or output halving, but overall, the hash rate of various cryptocurrencies is increasing. The total power consumption of the cryptocurrency also shows an increasing characteristic based on the calculation of the power consumption time series data of the device. It is worth noting that from the perspective of the hash ratio, Bitcoin’s hash ratio accounts for approximately 84% of all cryptocurrencies. However, due to the large number of high hash rate/power ASIC mining machines, the power consumption of Bitcoin accounts for only 58% of all cryptocurrencies (as of September 2021).
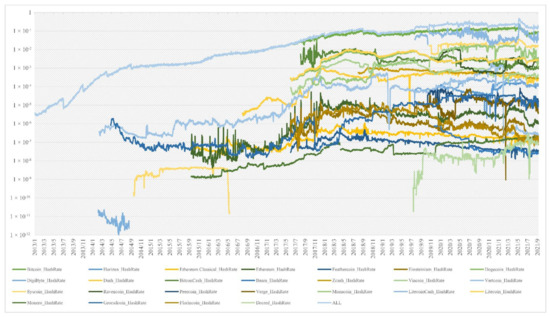
Figure 4.
Total hash rate of cryptocurrencies in the world.
This study puts the previous estimates of the power consumption of cryptocurrencies (all Bitcoin) and the results of this article into Figure 5 [6,7,8,10,11,12,13,20,21,22,23,24]. As shown in the figure, before 2019, the growth trend of Bitcoin was generally in line with the expectations of researchers. However, after 2019, due to the popularity of a large number of anti-ASIC and high energy consumption cryptocurrencies, the proportion of Bitcoin in the power consumption of cryptocurrencies continued to decline. The power consumption of Bitcoin estimated by Digiconomist and CBECI is higher than the estimation of Bitcoin in this study but lower than the power consumption of all cryptocurrencies estimated in this study.
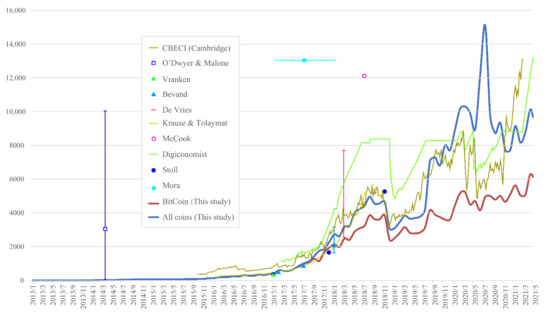
Figure 5.
Total power consumption of cryptocurrencies in the world.
For cryptocurrencies other than Bitcoin, when using the parameters of their respective mining equipment to calculate power consumption, there is a huge error compared to the power consumption estimated directly using the parameters of the Bitcoin mining machine. This study summarizes the errors as shown in Table 2. This also proves that the power consumption of Bitcoin cannot be directly used to predict other cryptocurrencies. There is a large system error here, and the order of magnitude is approximately 10~108.
Table 2.
When using Bitcoin computing power parameters, the calculation error statistics of the power consumption of different cryptocurrency algorithms.
3.2. Distribution of CO2 Emissions per Watt of Electricity on a Global Provincial Scale
Based on the CO2 emissions of power generation methods, this study estimated the carbon footprint of electricity in 222 countries [Figure 6], that is, the quality of carbon dioxide produced per kilowatt-hour of electricity generated. Based on this result, we can clearly see that the electricity carbon footprint of provinces such as Sichuan and Yunnan in China is the same as that of Western Europe and Canada. Central Asia, including China’s Xinjiang Autonomous Region and Kazakhstan, has a relatively high electricity carbon footprint [Figure 7].
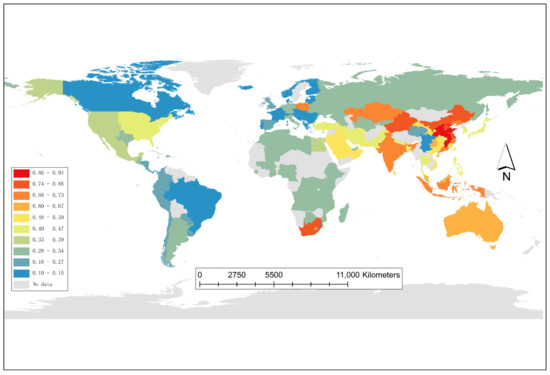
Figure 6.
Distribution of CO2 emissions per watt of electricity on a global provincial scale.
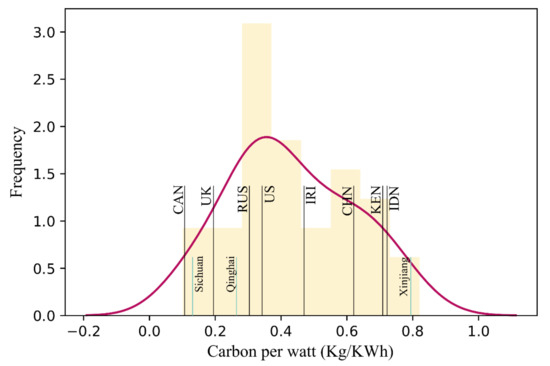
Figure 7.
Comparison of carbon footprints per watt-hour of Canada, the United Kingdom, Russia, the United States, Iran, China, Kazakhstan, Indonesia, and China’s Sichuan Province, Qinghai Province, and Xinjiang Uyghur Autonomous Region.
Judging from the historical data of electricity CO2 emissions from China’s provinces [Figure 8], the CO2 generated by electricity generation in China’s provinces showed a downward trend until 2019. The sudden increase in China’s electricity carbon footprint in 2020 is likely to be due to the large amount of clean energy consumed by cryptocurrency mining, which has led to an increase in coal-fired power generation in the eastern provinces of China. According to the calculation results of this study, the CO2 generated by cryptocurrency mining in China in 2020 mainly comes from Xinjiang and Inner Mongolia. These two regions account for 71.76% of China’s mining carbon emissions, and the hash rate contributes 43.22%. In contrast, China’s Sichuan and Yunnan provinces accounted for 12.27% of carbon emissions, and the hash rate contributed 44.9%.
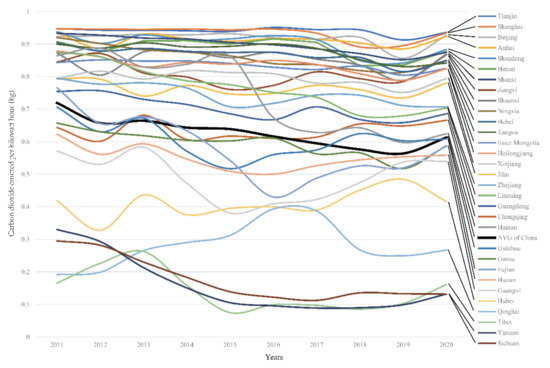
Figure 8.
Changes in the carbon footprint of electricity generation in China’s provinces in the past ten years.
3.3. Scenario Simulations of the Driving Forces and Main Migration Countries
We have counted industrial electricity prices around the world to evaluate the migration of mining farms after China banned cryptocurrency mining. As shown in Figure 3, electricity prices in Central Asia, North Africa and southern South America are relatively low. The Eurasian Railway coverage area has obvious advantages in terms of transportation time. Ocean transportation is limited by the geographical location of specific routes and transit ports, and its transportation timeliness ranges from 20 days to two months. After calculating the driving force based on electricity price, freight, and transit time, we obtained the driving force ranking of 70 countries around the world [Figure 9].
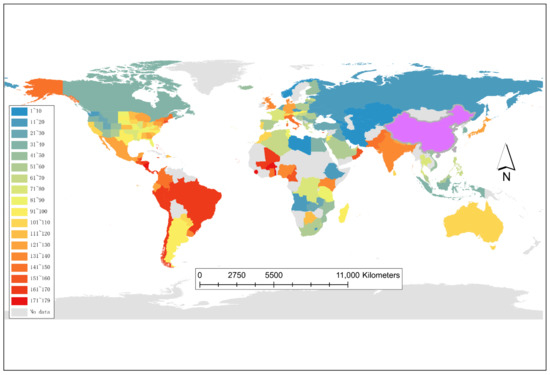
Figure 9.
RDF rankings in the world.
Among them, Turkmenistan, Kazakhstan, Iran, and other countries in Central Asia rank high on the driving force list due to their convenient transportation with China and cheap domestic electricity prices, which indicates a higher attractiveness to miners.
From the simulation results of the eight countries with the highest hash rate share in the world, the United States and Russia benefit from a higher base of miners, while Iran mainly benefits from its low electricity prices (global ranking 4/126). These countries will become more popular destinations during the migration of miners. It is worth noting that Kazakhstan is not only close to Xinjiang in China, but domestic electricity prices rank 7/126 in the world. Therefore, Kazakhstan is expected to achieve the highest growth rate among the seven countries [Figure 10], and the United States is expected to achieve the highest absolute growth rate.
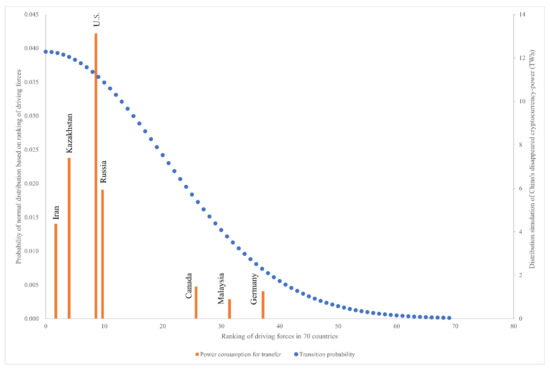
Figure 10.
Prediction of relocation volume based on driving force and normal distribution.
3.4. Carbon Footprint Prediction
We estimated global power consumption from January 2013 to August 2021 and carbon emissions from September 2019 to August 2021 [Figure 11]. Since China banned cryptocurrency mining activities in May 2021, the global cryptocurrency power consumption and carbon emissions have dropped significantly, even reaching the level of 2019. This is measured on the premise that China has disappeared 34.5 TW of mining machine power consumption. This disappearing mining equipment are more likely to be in the process of handling and trading. In view of the lag of cross-border relocation, these devices are likely to be restarted in other countries within 2022. If these countries have a worse electricity carbon footprint than China, then more CO2 emissions are inevitable. Moreover, Figure 11 shows that from July to August 2021, the global cryptocurrency mining power consumption was reduced by 2.4%, but the carbon emissions increased by 1.7%. This is an interesting sign.
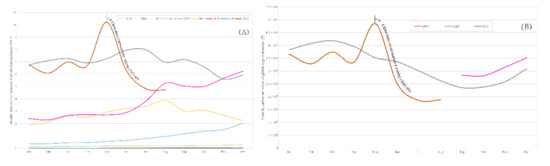
Figure 11.
Estimated cryptocurrency’s pressure on global energy and environment. Including monthly mining power consumption (A) and carbon emissions (B) in the world.
To further predict global carbon emissions after China’s ban on cryptocurrencies, this study constructed two prediction models. It also compares the global mining power consumption- CO2 emissions in 2020 and the linear fit (black dotted line) of Q2 and Q3 data in 2021 [Figure 12].
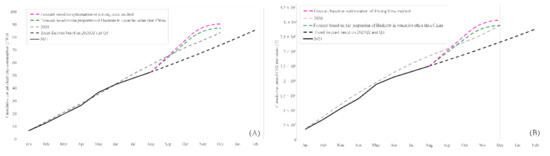
Figure 12.
The global power consumption (A) and carbon emissions (B) trends under the two scenarios.
Model 1: Green dotted line. Based on the current proportion of countries other than China in the third quarter of 2021, the mining machines that disappeared from China will be distributed to 7 other countries without distinction. This allocation method ignores the willingness of the miners. In this case, the global CO2 emissions are estimated to be approximately 389.1 Mt when the equipment is allocated. Compared with the full year of 2020 (389.8), this is a decrease of 0.2%.
Model 2: Purple dotted line. Using the driving force method of this research to estimate the migration of cryptocurrency mining machines between countries, with mining work as a natural person and the pursuit of the best cost, the normalized normal distribution weight is used as the growth rate to predict the volume of the migration equipment. Under this scenario, global CO2 emissions will reach 406.9 Mt. This is an increase of 4.4% compared to 2020.
4. Discussion
China’s prohibition of the energy-intensive industry of cryptocurrency mining is undoubtedly an important contribution to the world environment. However, profit-seeking miners may move to areas with a “dirtier” power structure, thereby offsetting the Chinese government’s efforts to the world environment. This research suggests that after rational mining unions banned cryptocurrencies in China, they are more inclined to choose Central Asian countries to continue mining. Among the two models proposed in this study, the migration of mining farms after China’s ban on cryptocurrencies will result in a change in carbon emissions in the global cryptocurrency sector by −0.2% to 4.4% based on 2020. This is something that researchers have never paid attention to.
This research obtained global cryptocurrency power consumption data for the first time from 2009 to September 2021 and calculated the global total hash rate of cryptocurrencies, including Bitcoin. Compared with previous conclusions estimated by Bitcoin alone, this study found that Bitcoin accounted for only 58% of the power consumption of all cryptocurrencies, which was much lower than its hash rate (84%, 2020). These data show that Bitcoin ASIC mining machines are more efficient than other cryptocurrency mining machines. It also shows that using traditional method that only Bitcoin is used to estimate the power consumption of global cryptocurrencies, which will cause an error that is nearly doubled.
The accuracy of judging the location of miners based on the IP attribution is much more accurate than judging based on the registration location of the mining pool [6,13,25]. However, due to the decentralization and concealment of cryptocurrency mining, the attribution data used in this article are still only a sample of 32% to 37% of the global Bitcoin computing power. Using these data to estimate the distribution of all cryptocurrencies in the world will inevitably lead to errors [13,26]. However, this is by far the most accurate method for estimating the location of miners. If the proportion of attribution sampling can be increased, the reliability of the data can be further improved.
From the perspective of the main transfer destinations, the main power generation methods of Central Asian countries are coal-fired and natural gas thermal power generation, which leads to high electricity carbon footprints in most Central Asian countries. For example, Kazakhstan’s CO2 emissions per KWh are estimated to reach 0.7 kg, which is five times that of China’s Sichuan Province [27,28]. In addition, Central Asian countries and China have convenient railway systems, and relocation and transportation are very convenient. As a result, under the driving force-based simulation scenario of this research, even if the United States, Russia, Canada, and other countries undertake to transfer hash rates, global CO2 emissions may still increase even after China bans cryptocurrency mining. Even if the global cryptocurrency hash rate in 2022 remains the same as in 2021, it is very likely to increase carbon dioxide emissions by 17.1 Mt, an increase of 4.4%.
The development of this research is based on the following two premises and one hypothesis. Premise 1, the electricity consumed by mining at a certain time in history is directly related to the hash rate/power of the mining equipment. Limited by the development of integrated circuit technology, the hash rate/power of the cryptocurrency mining equipment in a short period of time can be approximately regarded as continuous. Premise 2, the amount of CO2 produced by mining is strictly related to the fuel used for local power generation. Hypothesis 1, miners tend to use equipment with the highest hash rate/power for mining in lower-cost locations and eliminate old equipment as soon as new equipment appears. Therefore, limited by the above content, this study has the following shortcomings.
Firstly, the power consumption and carbon emissions calculated in this paper are the lowest estimates. For example, for the convenience of calculation in this article, it is assumed that the miners will immediately eliminate their old equipment after the release of the new high-efficiency equipment. In fact, it is impossible for miners to eliminate old equipment immediately, and a large number of ordinary users are more inclined to use their own high-energy-consuming GPUs while participating in mining during the spare time of their PC. If miners do not update their older equipment with higher power consumption in time, the power consumption estimate in this paper is underestimated, because the energy consumption ratio of old equipment is often worse. The later miners update their equipment and the older equipment exists in the crypto mining farm, the more serious the underestimation of power consumption will be.
Secondly, more efficient methods need to be proposed. In this research, in addition to cost factors such as electricity prices and freight, social stability indicators have not been considered as the influencing factors of miners’ relocation destinations, such as local wars, terrorist attacks, theft, robbery, etc. With more influencing factors, more effective methods are needed to improve the accuracy and robustness of forecasting carbon emissions [29].
Thirdly, the freight and aging data used in this study are from the first half of 2021. At the end of this study, many reports showed that the global ocean shipping industry’s freight rates skyrocketed in the second half of the year, and transit aging had almost doubled. This has had a partial impact on the prediction of this article, but based on the algorithm of this research, the skyrocketing cost of shipping will further increase the priority for using the Eurasian railway system, and the CIS and Eastern European countries may be more attractive to cryptocurrency miners. In the context of higher shipping costs and delays, the actual carbon emissions generated by global cryptocurrency mining are likely to be higher.
Finally, the COVID-19 factor was not considered. The impact of the COVID-19 pandemic on the environment is sweeping and profound, and many researchers expect widespread travel restrictions and shutdowns triggered by COVID-19 to lead to boost global air quality in 2020 [30]. However, according to the latest statistics [1], the global carbon emissions in 2020 did not drop sharply, and even continued to rise abnormally. This may be caused using more low-intensive power-consuming equipment, and some researchers believe that under the heavy impact of COVID-19 on the economy, the popularity of cryptocurrency mining is one of the important factors driving up carbon emissions.
Even though COVID-19 has many social and economic possibilities that affect the price of cryptocurrencies, this paper calculates the electricity consumption and carbon emissions of cryptocurrencies based on basic information such as the computing power of the entire cryptocurrency network, the energy consumption ratio of chips, and the regional power structure, the impact of COVID-19 on estimates can be avoided. But COVID-19 does affect this study’s assessment of miner migration in terms of customs bans, destination medical and epidemic levels, industrial shutdown policies, and more. The socioeconomic impact of COVID-19 is complex and cannot be ignored, but unfortunately, it is difficult to quantify factors such as COVID-19’s traffic/post restrictions, miners’ subjective concerns, and business-related epidemic policies/taxes into this research in a short period of time. Therefore, we believe that the acquisition and sampling of mining equipment information, the comprehensive socio-economic judgment of the attractiveness of migration destinations, and the socio-economic impact of COVID-19 will be important directions for future research on cryptocurrency energy consumption and migration [30]. This not only requires the joint efforts of researchers in more fields, but also requires more basic statistical data to be opened up for access [22].
Even so, based on the results of this research, after China banned cryptocurrencies, Central Asia and other countries with a low proportion of clean electricity increased cryptocurrencies mining CO2 emission. These countries should formulate policies to reduce the entry of miners, thereby reducing more unclean electricity consumption caused by mining and reducing the negative impact of global carbon emissions.
5. Conclusions
This research, based on the time-spatial power-based cryptocurrency big data miner driving force model, establishes a global CO2 emission prediction framework after China had banned cryptocurrency and obtains the following three points of understanding:
Bitcoin’s hash rate occupies 84% of all cryptocurrencies, but the power consumption of the device only accounts for 58%. Therefore, using only the one cryptocurrency, Bitcoin, on behalf of all cryptocurrencies to calculate energy consumption or CO2 emissions will cause large errors.
This research is based on the hash rate/power time series data of different cryptocurrency devices and has obtained the world’s consecutive cryptocurrency power consumption dataset for the first time since 2009. Based on provincial-level resolution electricity data, we have obtained continuous cryptocurrency carbon emission data from September 2019 until now.
After China bans cryptocurrency mining, global cryptocurrency mining activities are likely to cause more carbon emissions, with a growth rate between −0.2% and 4.4%.
Author Contributions
Data curation, X.S. and X.R.; Funding acquisition, X.S.; Methodology, X.L.; Project administration, X.S. and L.X.; Software, X.L.; Supervision, X.L.; Writing—original draft, X.S.; Writing—review & editing, X.R. All authors have read and agreed to the published version of the manuscript.
Funding
This research was funded by [the Basic Research Project of Department of Science and Technology of Sichuan Province] grant number [2021YJ0335], [the Project of the Department of Science and Technology of Sichuan Province] grant number [2021YFG0258] and [National Natural Science Foundation of China] grant number [42001100]. And The APC was funded by [2021YJ0335].
Institutional Review Board Statement
Not applicable.
Informed Consent Statement
Informed consent was obtained from all subjects involved in the study.
Data Availability Statement
The authors confirm that the data supporting the findings of this study are available within the article or its supplementary materials.
Conflicts of Interest
The authors declare no conflict of interest.
Appendix A
| Country | Freight | Time | Area | Country | Freight | Time | Area | Country | Freight | Time | Area | Country | Freight | Time | Area | Country | Freight | Time | Area |
|---|---|---|---|---|---|---|---|---|---|---|---|---|---|---|---|---|---|---|---|
| Aruba | 3200 | 27 | Caribbean Sea | Angola | 2480 | 30 | Mid-South Africa | Bangladesh | 5320 | 42 | South Asia | Guatemala | 4000 | 45 | West Africa | Kyrgyzstan | 5000 | 15 | Eurasian Railway System |
| Bahamas | 3200 | 27 | Botswana | 2480 | 30 | Belize | 4000 | 45 | Mali | 4000 | 45 | Latvia | 5300 | 16 | |||||
| Barbados | 3200 | 27 | Congo | 4000 | 30 | Bhutan | 5320 | 42 | Nicaragua | 4000 | 45 | Liechtenstein | 5700 | 18 | |||||
| Bermuda | 3600 | 30 | Ethiopia | 4000 | 30 | Honduras | 4000 | 45 | Nigeria | 4000 | 45 | Lithuania | 5300 | 16 | |||||
| Cayman Islands | 3200 | 27 | Kenya | 4000 | 30 | India | 5320 | 42 | Panama | 4000 | 45 | Luxembourg | 5700 | 18 | |||||
| Dominican | 3200 | 27 | Lesotho | 2480 | 30 | Nepal | 5320 | 42 | Sierra Leone | 4000 | 45 | Moldova | 5700 | 18 | |||||
| Jamaica | 3200 | 27 | Madagascar | 2480 | 30 | Oman | 5320 | 42 | Togo | 4000 | 45 | Netherlands | 5300 | 14 | |||||
| Trinidad & Tobago | 3200 | 27 | Malawi | 2480 | 30 | Pakistan | 5320 | 42 | Albania | 5700 | 18 | Eurasian Railway System | Norway | 5700 | 18 | ||||
| Iceland | 6400 | 33 | Europe | Mauritius | 2480 | 30 | Sri Lanka | 5320 | 42 | Armenia | 5700 | 18 | Poland | 5000 | 14 | ||||
| Algeria | 2480 | 40 | Mediterranean | Mozambique | 2480 | 30 | Indonesia | 2800 | 25 | Near China | Austria | 5700 | 18 | Portugal | 5700 | 18 | |||
| Cyprus | 2480 | 30 | Rwanda | 4000 | 30 | Malaysia | 2800 | 25 | Azerbaijan | 5700 | 18 | Romania | 5700 | 18 | |||||
| Lebanon | 2480 | 30 | South Africa | 2480 | 30 | Philippines | 2800 | 25 | Belarus | 5300 | 14 | Russia | 7500 | 14 | |||||
| Malta | 2480 | 30 | Swaziland | 2480 | 30 | Singapore | 2800 | 25 | Belgium | 5300 | 14 | Serbia | 5700 | 18 | |||||
| Morocco | 2480 | 30 | Tanzania | 4000 | 30 | Thailand | 2800 | 25 | Bosnia and Herzegovina | 5700 | 18 | Slovakia | 5300 | 14 | |||||
| Tunisia | 2480 | 30 | Uganda | 4000 | 30 | Vietnam | 2800 | 25 | Bulgaria | 5700 | 18 | Slovenia | 5700 | 18 | |||||
| Bahrain | 2480 | 30 | Middle East | Zambia | 2480 | 30 | Australia | 1880 | 30 | Croatia | 5700 | 18 | South Korea | 1680 | 22 | ||||
| Egypt | 2480 | 25 | Canada | 3000 | 21 | America | Japan | 600 | 22 | Czech Republic | 5300 | 14 | Spain | 6400 | 20 | ||||
| Iraq | 2480 | 30 | Mexico | 5520 | 30 | Burkina Faso | 4000 | 45 | West Africa | Democratic Republic of the Congo | 4000 | 30 | Switzerland | 5700 | 18 | ||||
| Israel | 1320 | 23 | United States | 2600 | 14 | Cameroon | 4000 | 45 | Denmark | 5300 | 14 | Trinidad and Tobago | 3200 | 27 | |||||
| Jordan | 2480 | 28 | Argentina | 1600 | 47 | Cape Verde | 4000 | 45 | Dominican Republic | 3200 | 27 | Turkey | 5700 | 18 | |||||
| Kuwait | 2480 | 30 | Brazil | 2160 | 55 | Colombia | 4000 | 45 | Estonia | 5300 | 16 | Turkmenistan | 5000 | 15 | |||||
| Libya | 2480 | 30 | Chile | 2160 | 55 | Costa Rica | 4000 | 45 | Georgia | 5300 | 14 | Ukraine | 5000 | 14 | |||||
| Qatar | 2480 | 30 | Paraguay | 1600 | 47 | Ecuador | 4000 | 45 | Greece | 5700 | 18 | United Kingdom | 5700 | 18 | |||||
| Saudi Arabia | 2480 | 30 | Peru | 2160 | 55 | El Salvador | 4000 | 45 | Iran | 5200 | 15 | Uzbekistan | 5000 | 15 | |||||
| United Arab Emirates | 1760 | 25 | Uruguay | 1600 | 47 | Ghana | 4000 | 45 | Kazakhstan | 5000 | 15 |
References
- Greenhouse Gas Bulletin: Another Year Another Record. Available online: https://public.wmo.int/en/media/press-release/greenhouse-gas-bulletin-another-year-another-record (accessed on 5 October 2021).
- Shan, Y.; Ou, J.; Wang, D.; Zeng, Z.; Zhang, S.; Guan, D.; Hubacek, K. Impacts of COVID-19 and fiscal stimuli on global emissions and the Paris Agreement. Nat. Clim. Change 2021, 11, 200–206. [Google Scholar] [CrossRef]
- De Vries, A. Bitcoin boom: What rising prices mean for the network’s energy consumption. Joule 2021, 5, 509–513. [Google Scholar] [CrossRef]
- De Vries, A.; Stoll, C. Bitcoin’s growing e-waste problem. Resour. Conserv. Recycl. 2021, 175, 105901. [Google Scholar] [CrossRef]
- Wimbush, S. Cryptocurrency mining is neither wasteful nor uneconomic. Nature 2018, 555. [Google Scholar] [CrossRef] [PubMed]
- Bitcoin Electricity Consumption Index. Available online: https://cbeci.org/ (accessed on 5 October 2021).
- Masanet, E.; Shehabi, A.; Lei, N.; Vranken, H.; Koomey, J.; Malmodin, J. Implausible projections overestimate near-term Bitcoin CO2 emissions. Nat. Clim. Change 2019, 9, 653–654. [Google Scholar] [CrossRef]
- Electricity consumption of Bitcoin: A Market-Based and Technical Analysis. Available online: http://blog.zorinaq.com/bitcoin-electricity (accessed on 5 October 2021).
- The Cost & Sustainability of Bitcoin. Available online: https://www.academia.edu/37178295/The_Cost_and_Sustainability_of_Bitcoin_August_2018_ (accessed on 5 October 2021).
- Krause, M.J.; Tolaymat, T. Quantification of energy and carbon costs for mining cryptocurrencies. Nat. Sustain. 2018, 1, 711–718. [Google Scholar] [CrossRef]
- Mora, C.; Rollins, R.L.; Taladay, K.; Kantar, M.B.; Chock, M.K.; Shimada, M.; Franklin, E.C. Bitcoin emissions alone could push global warming above 2 C. Nat. Clim. Change 2018, 8, 931–933. [Google Scholar] [CrossRef]
- Stoll, C.; Klaaßen, L.; Gallersdörfer, U. The carbon footprint of bitcoin. Joule 2019, 3, 1647–1661. [Google Scholar] [CrossRef]
- Foteinis, S. Bitcoin’s alarming carbon footprint. Nature 2018, 554, 169–170. [Google Scholar] [CrossRef] [PubMed] [Green Version]
- Coinwarz. Available online: https://www.coinwarz.com/ (accessed on 5 October 2021).
- CPU Benchmark of RandomX Hashrate. Available online: https://xmrig.com/benchmark (accessed on 5 October 2021).
- British Petroleum’s Statistical Review of World Energy 2021. Available online: https://www.bp.com/en/global/corporate/energy-economics/statistical-review-of-world-energy.html (accessed on 5 October 2021).
- The 2020 China Statistical Yearbook. Available online: http://www.stats.gov.cn/tjsj/ndsj/2020/indexeh.htm (accessed on 5 October 2021).
- The International Energy Agency (IEA). Available online: https://www.iea.org/ (accessed on 5 October 2021).
- Global Administrative Division Data. Available online: https://gadm.org/ (accessed on 5 October 2021).
- Bitcoin Energy Consumption Index. Available online: https://digiconomist.net/bitcoin-energy-consumption/ (accessed on 5 October 2021).
- Vranken, H. Sustainability of bitcoin and blockchains. Curr. Opin. Environ. Sustain. 2017, 28, 1–9. [Google Scholar] [CrossRef] [Green Version]
- O’Dwyer, K.J.; Malone, D. Bitcoin mining and its energy footprint. In Proceedings of the 25th IET Irish Signals & Systems Conference 2014 and 2014 China-Ireland International Conference on Information and Communications Technologies (ISSC 2014/CIICT 2014), Limerick, Ireland, 26–27 June 2014; Volume 699, pp. 280–285. [Google Scholar]
- JC Logistics Global Service Center. Available online: http://www.jc56.cn/ (accessed on 5 October 2021).
- Badea, L.; Mungiu-Pupăzan, M.C. The economic and environmental impact of bitcoin. IEEE Access 2021, 9, 48091–48104. [Google Scholar] [CrossRef]
- Kononova, K.; Dek, A. Bitcoin Carbon Footprint: Mining Pools Based Estimate Methodology. In Proceedings of the HAICTA, 2020, Thessaloniki, Greece, 24–27 September 2020; pp. 265–273. [Google Scholar]
- Jiang, S.; Li, Y.; Lu, Q.; Hong, Y.; Guan, D.; Xiong, Y.; Wang, S. Policy assessments for the carbon emission flows and sustainability of Bitcoin blockchain operation in China. Nat. Commun. 2021, 12, 1938. [Google Scholar] [CrossRef] [PubMed]
- Wang, X.; Zheng, H.; Wang, Z.; Shan, Y.; Meng, J.; Liang, X.; Feng, K.; Guan, D. Kazakhstan’s CO2 emissions in the post-Kyoto Protocol era: Production-and consumption-based analysis. J. Environ. Manag. 2019, 249, 109393. [Google Scholar] [CrossRef] [PubMed] [Green Version]
- Shan, Y.; Huang, Q.; Guan, D.; Hubacek, K. China CO2 emission accounts 2016–2017. Sci. Data 2020, 7, 54. [Google Scholar] [CrossRef] [PubMed] [Green Version]
- Gao, M.; Yang, H.; Xiao, Q.; Goh, M. A novel method for carbon emission forecasting based on Gompertz’s law and fractional grey model: Evidence from American industrial sector. Renew. Energy 2022, 181, 803–819. [Google Scholar] [CrossRef]
- Gao, M.; Yang, H.; Xiao, Q.; Goh, M. COVID-19 lockdowns and air quality: Evidence from grey spatiotemporal forecasts. Socio-Econ. Plan. Sci. 2022, 11, 101228. [Google Scholar] [CrossRef] [PubMed]
Publisher’s Note: MDPI stays neutral with regard to jurisdictional claims in published maps and institutional affiliations. |
© 2022 by the authors. Licensee MDPI, Basel, Switzerland. This article is an open access article distributed under the terms and conditions of the Creative Commons Attribution (CC BY) license (https://creativecommons.org/licenses/by/4.0/).