Article

Situation Analysis and the Potential for Circularity of the Wastewater Sector in Lithuania

by
Jolita Kruopienė
* and
Miglė Žiukaitė
Institute of Environmental Engineering, Kaunas University of Technology, LT-44249 Kaunas, Lithuania
*
Author to whom correspondence should be addressed.
Sustainability 2022, 14(9), 5327; https://doi.org/10.3390/su14095327
Submission received: 31 March 2022 / Revised: 21 April 2022 / Accepted: 24 April 2022 / Published: 28 April 2022
(This article belongs to the Special Issue Strategies toward a Green Deal and Circular Economy)

Abstract

:
The concept of circular economy is one of the priority areas for economic development on which the current environmental policy of the European Union is based. Most existing European wastewater treatment plants were built and operated according to the concept of linear economy where wastewater and sewage sludge were considered as waste only. In fact, there is a wide range of possibilities to use them as a resource to recover materials and energy. Implementation of the concept of circular economy in a relatively small country requires a great deal of additional research and monitoring to assess the available potential. In this paper, data on municipal wastewater in agglomerations larger than population equivalent of 2000 were analyzed, and the situation is presented through indicators covering prevention, removal, reuse, recycling, and recovery. The novelty of this article is that it evaluates the circularity of Lithuanian wastewater treatment plants and their potential for the future. Thus far, the wastewater sector in the country has been found to largely comply with legal obligations, but very few solutions of circularity were found to be implemented.

1. Introduction

The Urban Waste Water Treatment Directive (UWWTD) [1] has made a significant contribution to reducing the pollution of natural waters with wastewater and, at the same time, to improving the quality of water bodies. Member states’ profiles on urban wastewater treatment, published in November 2021, have shown progress in all countries, including the European Union (EU) as a whole: around 76% of European urban wastewater is collected and treated according to EU standards. Four countries, namely Austria, Germany, Luxembourg, and the Netherlands, have fully implemented the UWWTD. Ten countries have more than 90% compliance. However, differences between countries remain, and there are still five countries with less than 50% compliance. Lithuania is among the ten countries that are close to fully implementing the requirements of the directive: 99% of Lithuanian wastewater is treated in accordance with the UWWTD requirements [2].
Although the requirements of the UWWTD are strict, and have made a significant contribution to improving water quality, modern understanding of environmental protection, natural resources, and economic development shows that they are not enough. There is both a need and an opportunity to move further away from “end-of-pipe” solutions to prevention and circularity. Various authors note that wastewater treatment plants (WWTPs) should be, and are increasingly being, designed not only to perform their traditional function of treating wastewater to a quality that can be safely discharged into the natural environment but also to become bioenergy plants (biogas production) or even biorefineries [3,4,5,6,7].
The “Evaluation of the Urban Waste Water Treatment Directive”, published in 2019, shows that pollution loads have decreased significantly compared to 1990: biological oxygen demand (BOD) loads have halved in many countries, and nitrogen (N) and phosphorus (P) loads have also decreased significantly. However, a number of shortcomings are also evident, such as stormwater overflows, the use of potentially mal-functioning individual or other appropriate systems, and small agglomerations not covered by the directive [8].
As noted in the Evaluation, there are hardly any provisions in the UWWTD that directly encourage the potential of wastewater treatment plants to become part of the circular economy (CE). The use of sludge in agriculture is regulated by the Sewage Sludge Directive [9]. However, the direct use of sludge in agriculture is controversial due to possible contamination by undesirable substances [10,11]. Some EU countries have imposed stricter requirements on the amount of pollutants in sewage sludge, and some generally abandon such use due to the risk of pollution to human health and the environment [8]. The legal requirement to recover substances such as phosphorus from sewage sludge or the sewage itself exists only in a few countries [12]. The new Water Reuse Regulation [13] has taken over the re-use of water itself.
The proposal for a CE model in the European water and wastewater sector is available in the scientific literature [14]. Based on the assumptions of the CE, the waste hierarchy [15], and a detailed literature analysis, the authors proposed to apply the following hierarchy to water management and to address the following aspects:
-
Prevention or reduction: avoid wastewater generation and pollution;
-
Reclamation or removal: to remove pollutants from water and wastewater using efficient technologies;
-
Reuse: use wastewater as an alternative source of water supply (not for drinking purposes);
-
Recycling: to treat wastewater so that it can be used as drinking water;
-
Recovery: recovery of resources, such as nutrients and energy, from wastewater;
-
Rethink: how to use resources to build a sustainable economy.
Prevention is the most desirable solution. “Rethink” should be applied to all other elements of the model.
As already mentioned, Lithuania is doing quite well in implementing the requirements of the UWWTD. The country has been a member of the EU since 2004, and it is this membership that has given a major boost to Lithuania’s wastewater management. As far back as 2002, only 21% of wastewater was properly treated [16]. In line with the requirements of the UWWTD and the Accession Treaty, the territory of Lithuania was classified as a sensitive area due to the eutrophication of the Baltic Sea, which is sensitive to emissions of nitrogen and phosphorus. Therefore, Lithuania was required to ensure that no later than 2008, in agglomerations larger than a 10,000 population equivalent (p.e.), all urban wastewater entering sewage collection systems was treated before being discharged into the natural environment under stricter requirements—tertiary treatment (i.e., biological with additional nitrogen and phosphorus removal) [17]. In agglomerations of between 2000 and 10,000 p.e., urban wastewater entering collecting systems had to be biologically treated before being discharged into the natural environment by 2010 at the latest. In 2010, the amount of wastewater treated in the country by the required norms reached 90.1% [16]. Currently, the required treatment method is implemented in all but one wastewater treatment plant in Lithuania [2]. It must be acknowledged that some problems are constantly arising; they are caused, for example, by the changing load on the treatment plants [17]. It is difficult to complete the process of connecting the population to the centralized collecting systems and treatment. Upon joining the EU, Lithuania committed to achieving 98% connection by 2023. At the national level for agglomerations > 2000 p.e., this has been achieved [2], but the situation of individual agglomerations and smaller agglomerations is not yet sufficient, as the total connection to the centralized collecting systems achieved at the national level in 2019 was 76.45% [18].
Thus, in summary, Lithuania, although facing some difficulties, is doing fairly well at meeting the requirements of the UWWTD. However, as already mentioned, the directive does not reflect the aspects of circularity. In the context of a rising overall understanding of the new role of WWTPs in CE and in the light of EU documents such as the Green Deal [19] and A New Circular Economy Action Plan [20], the water and wastewater sector of the country should take a step further and become involved in the circular systems. This manuscript presents the results of a study aimed at assessing the circularity of the wastewater sector in Lithuania as well as analyzing its potential for further development.

2. Materials and Methods

The set of indicators we used to measure the transition of the wastewater sector to CE was largely based on [21], where the authors collected and summarized the indicators identified through a comprehensive literature review. These indicators are appropriate to reflect the situation in terms of the reclamation/removal, reuse, and recovery options of the CE model for wastewater [14]. To assess the prevention/reduction situation, we introduced additional indicators that show water consumption and wastewater generation, while to assess recycling, we introduced an indicator of water recycling for potable usage. An indicator showing wastewater service coverage is included under prevention, because it points to the potential to prevent pollutants from entering water bodies, or to recover resources and energy. In most cases, there is a better possibility of controlling pollutant discharge and better recovery options in larger centralized WWTPs. No indicator was set for the option “Rethink”; this is addressed by a general analysis and discussion. The set of used indicators is presented in Table 1.
The analysis was performed by assessing the current situation according to the data from 2018–2020. Those indicators for which long-term trends are important, such as prevention indicators, were analyzed over the period 2002–2020. There are some 630 municipal wastewater treatment plants in Lithuania. Our assessment concentrated on municipal WWTPs in agglomerations where more than 2000 p.e. of wastewater is generated. In 2020, there were 67 such agglomerations, while in 2019 and 2018, there were 65. In 2020, the population of the country was 2,794,885 [22]. Over the past three decades, the population has been declining and redistributing as more people, as well as economic activities, are concentrated in major cities. For comparison: in 2006, as many as 95 agglomerations were identified [23]. Thus, the number of agglomerations producing at least 2000 p.e. of wastewater is declining, but where the population is concentrated, new agglomerations with >2000 p.e. are recorded (see Figure 1). There are five WWTPs in the country that receive loads exceeding 100,000 p.e.
Data for the calculation and analysis of the indicators were collected from the websites of the Environmental Protection Agency (EPA) and the WWTPs and their operating companies and were additionally obtained from the EPA and the WWTPs upon direct request. The analysis and evaluations were also based on statistics, EC reports, feasibility studies, and river basin management plans, which were identified as a result of the literature review.

3. Results

3.1. Prevention

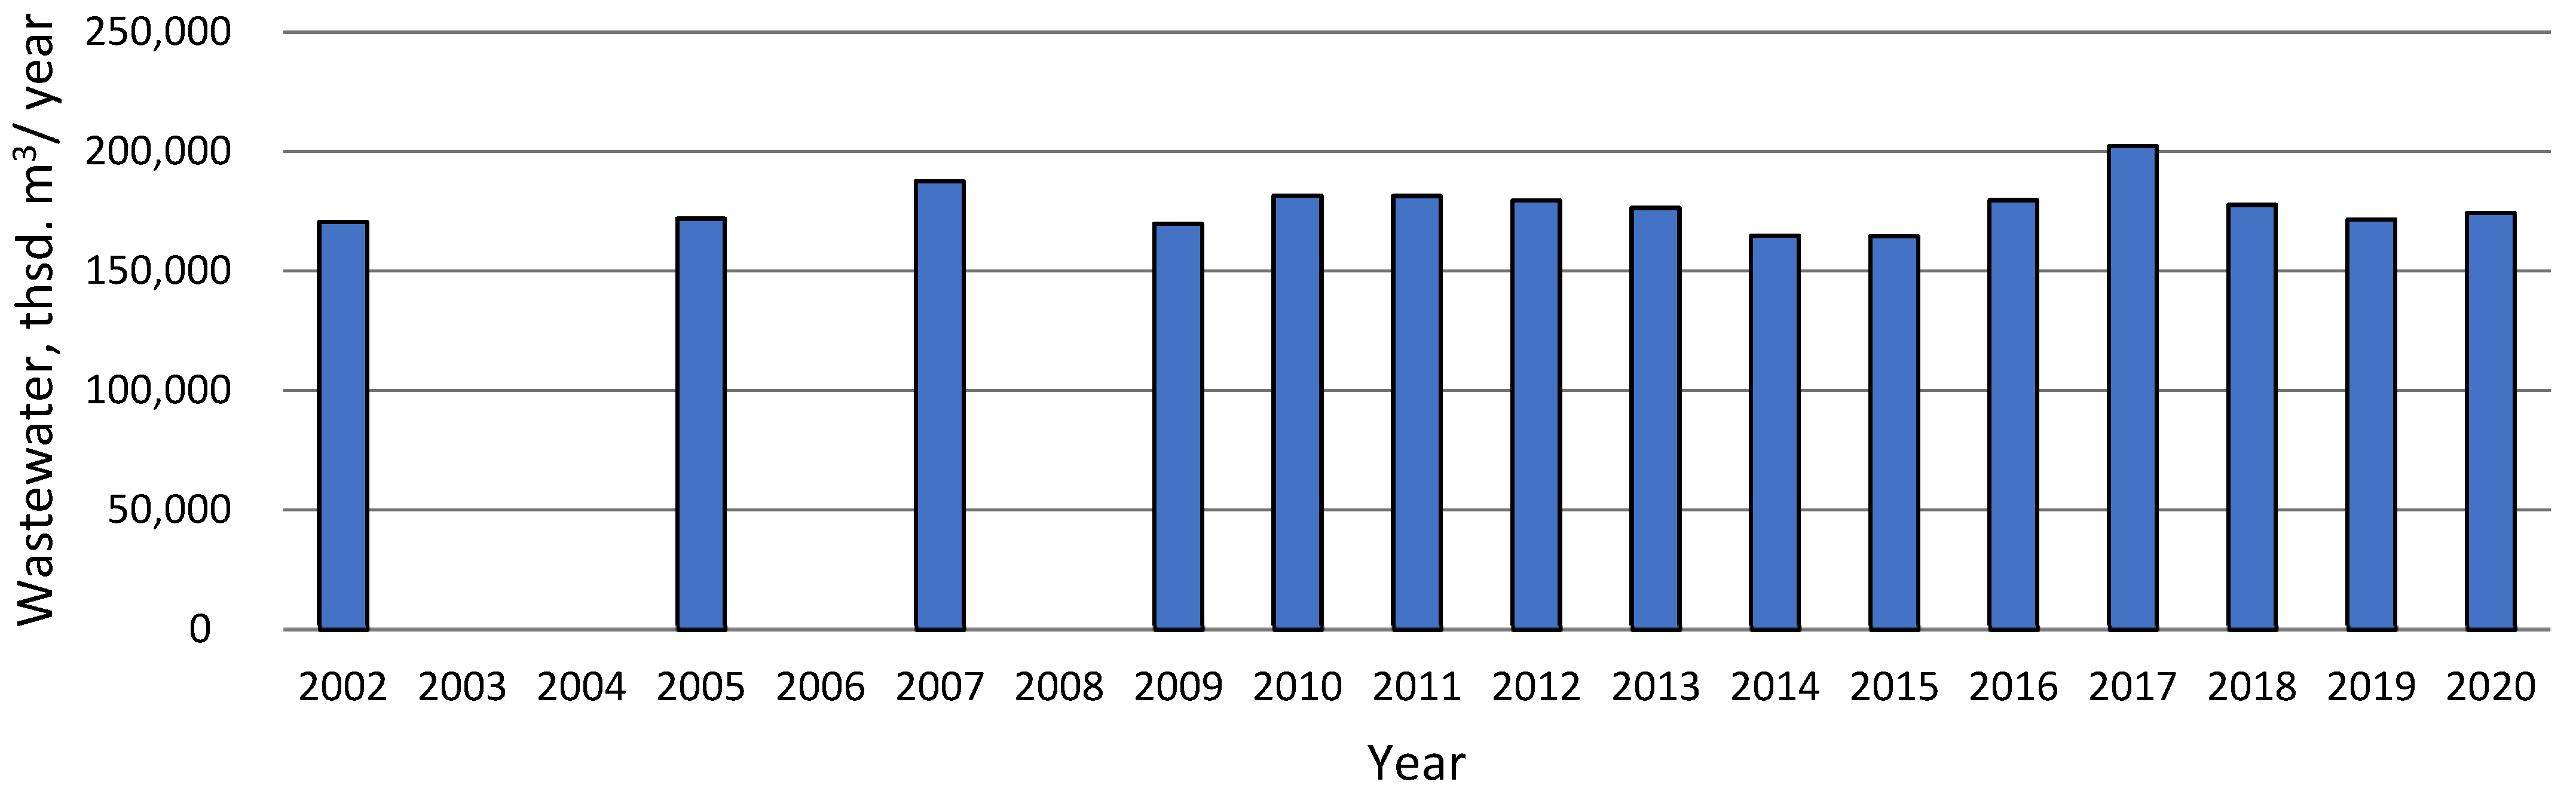
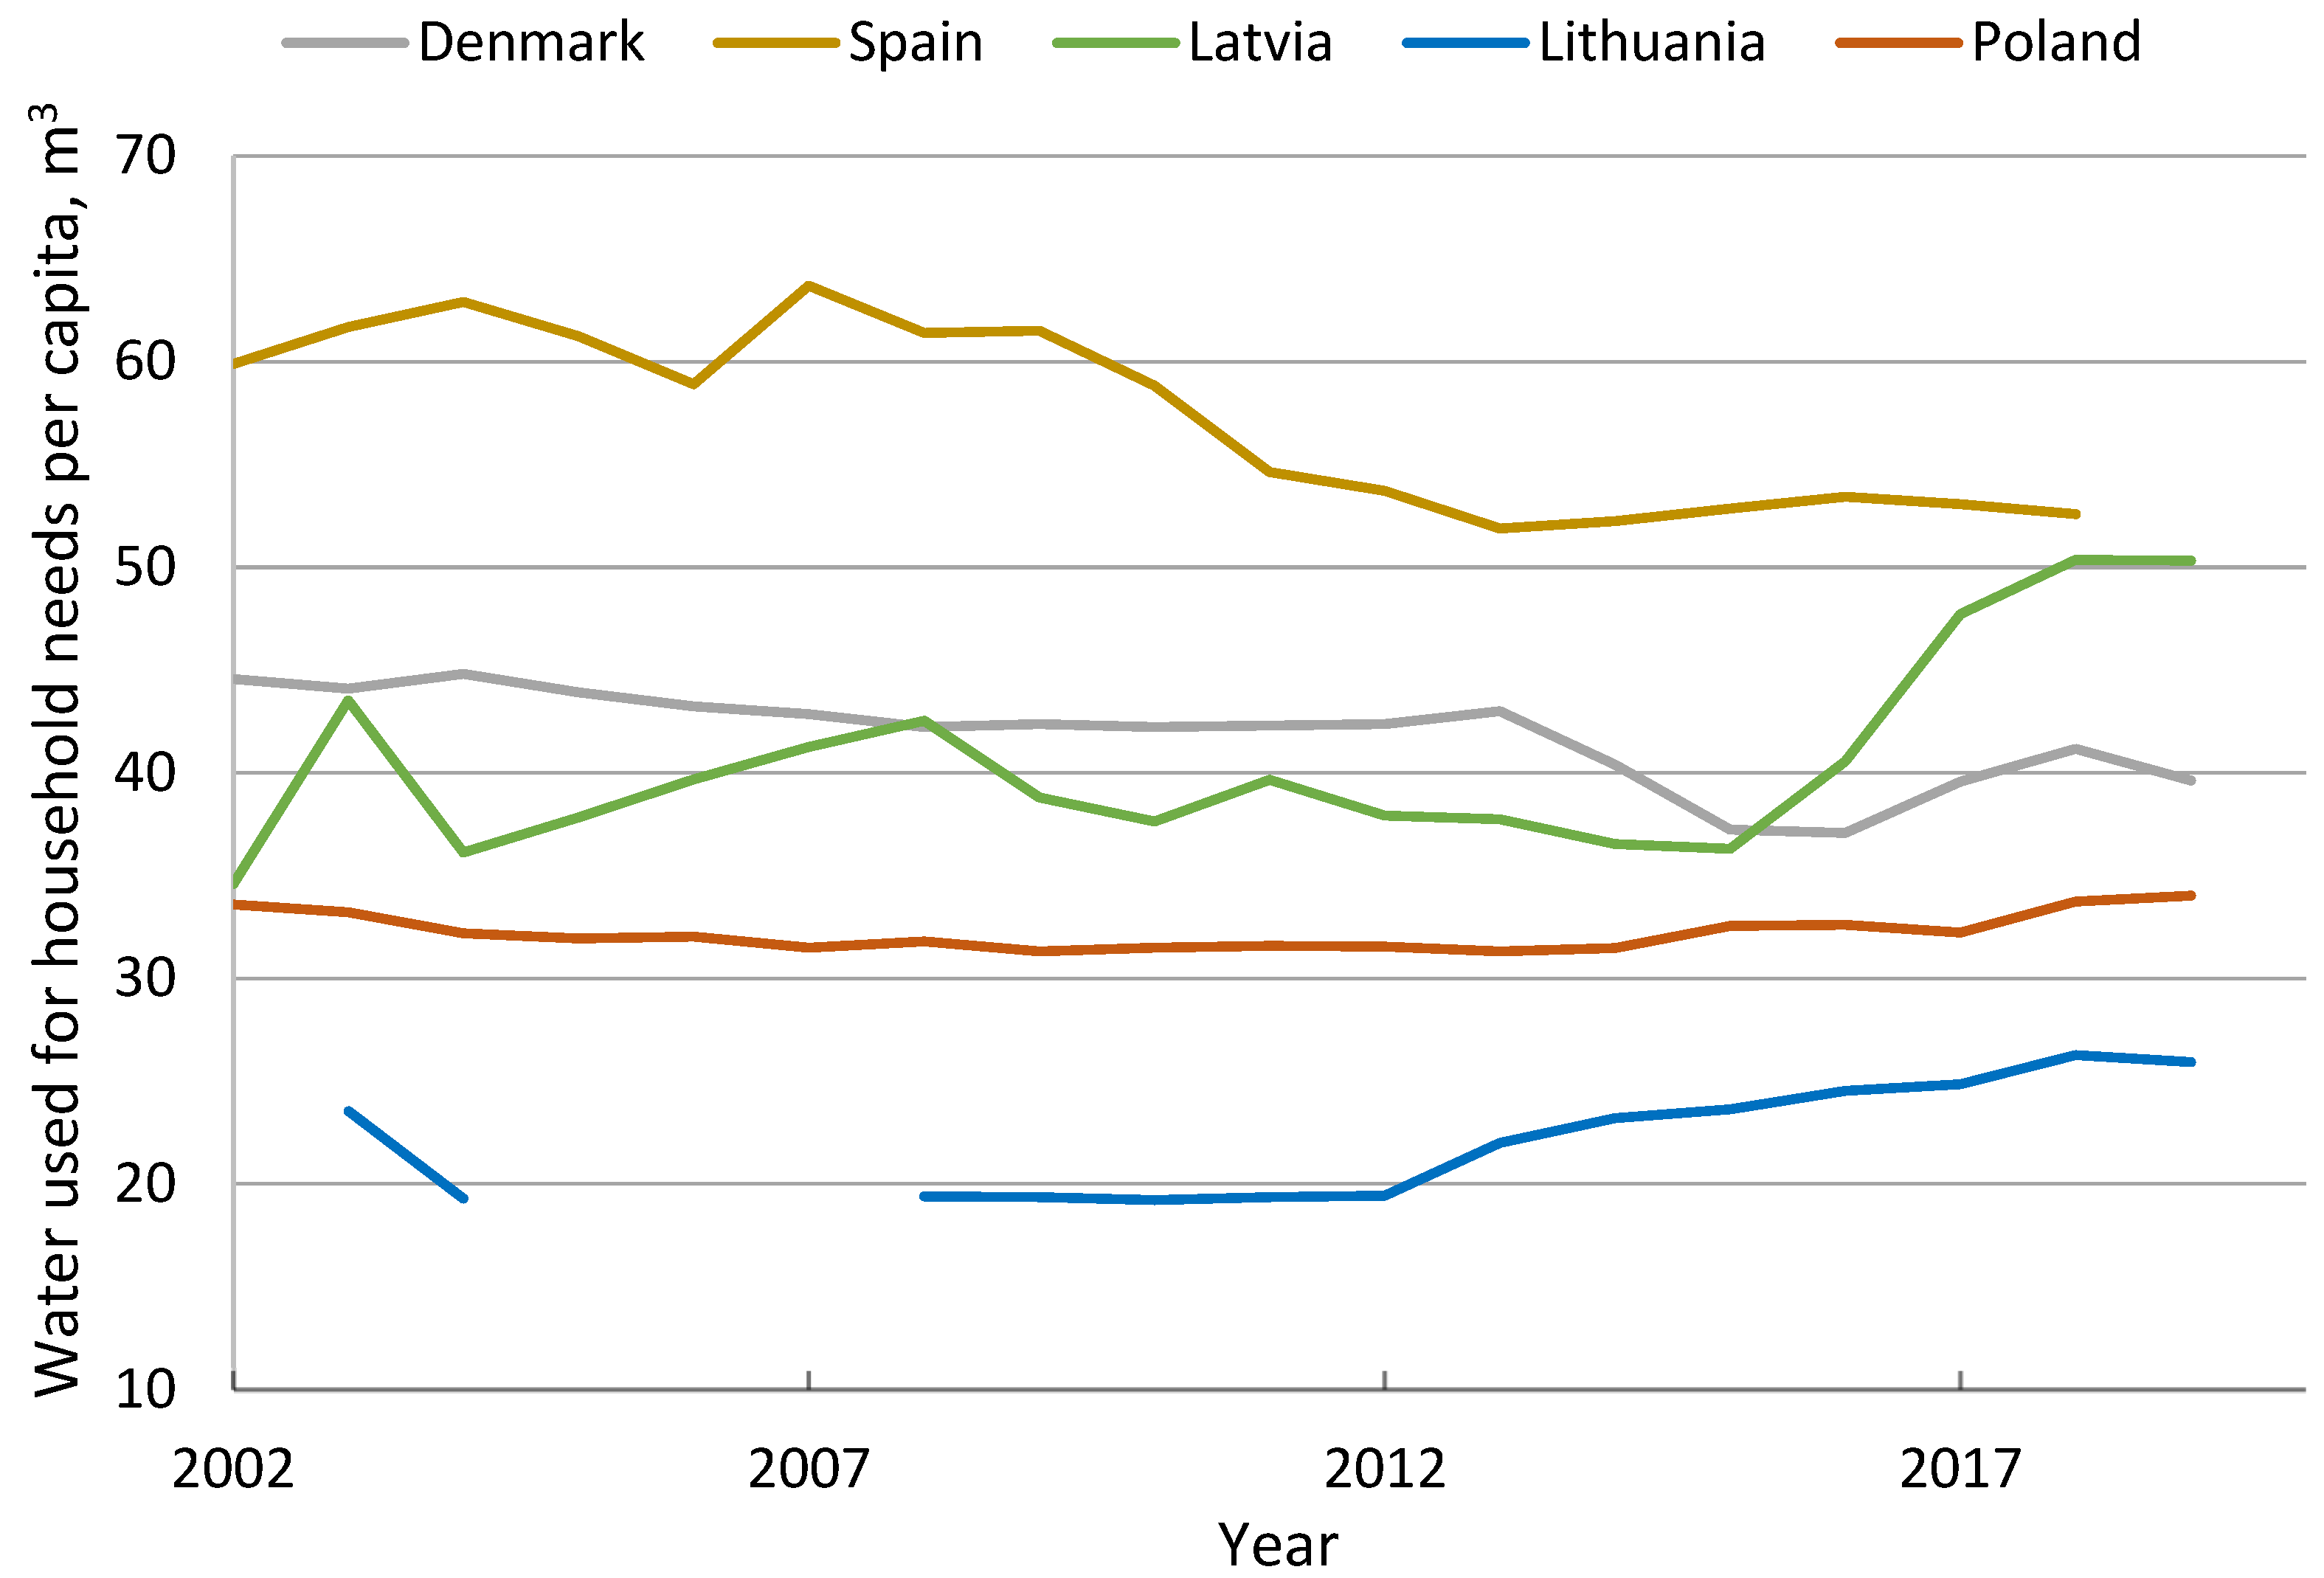
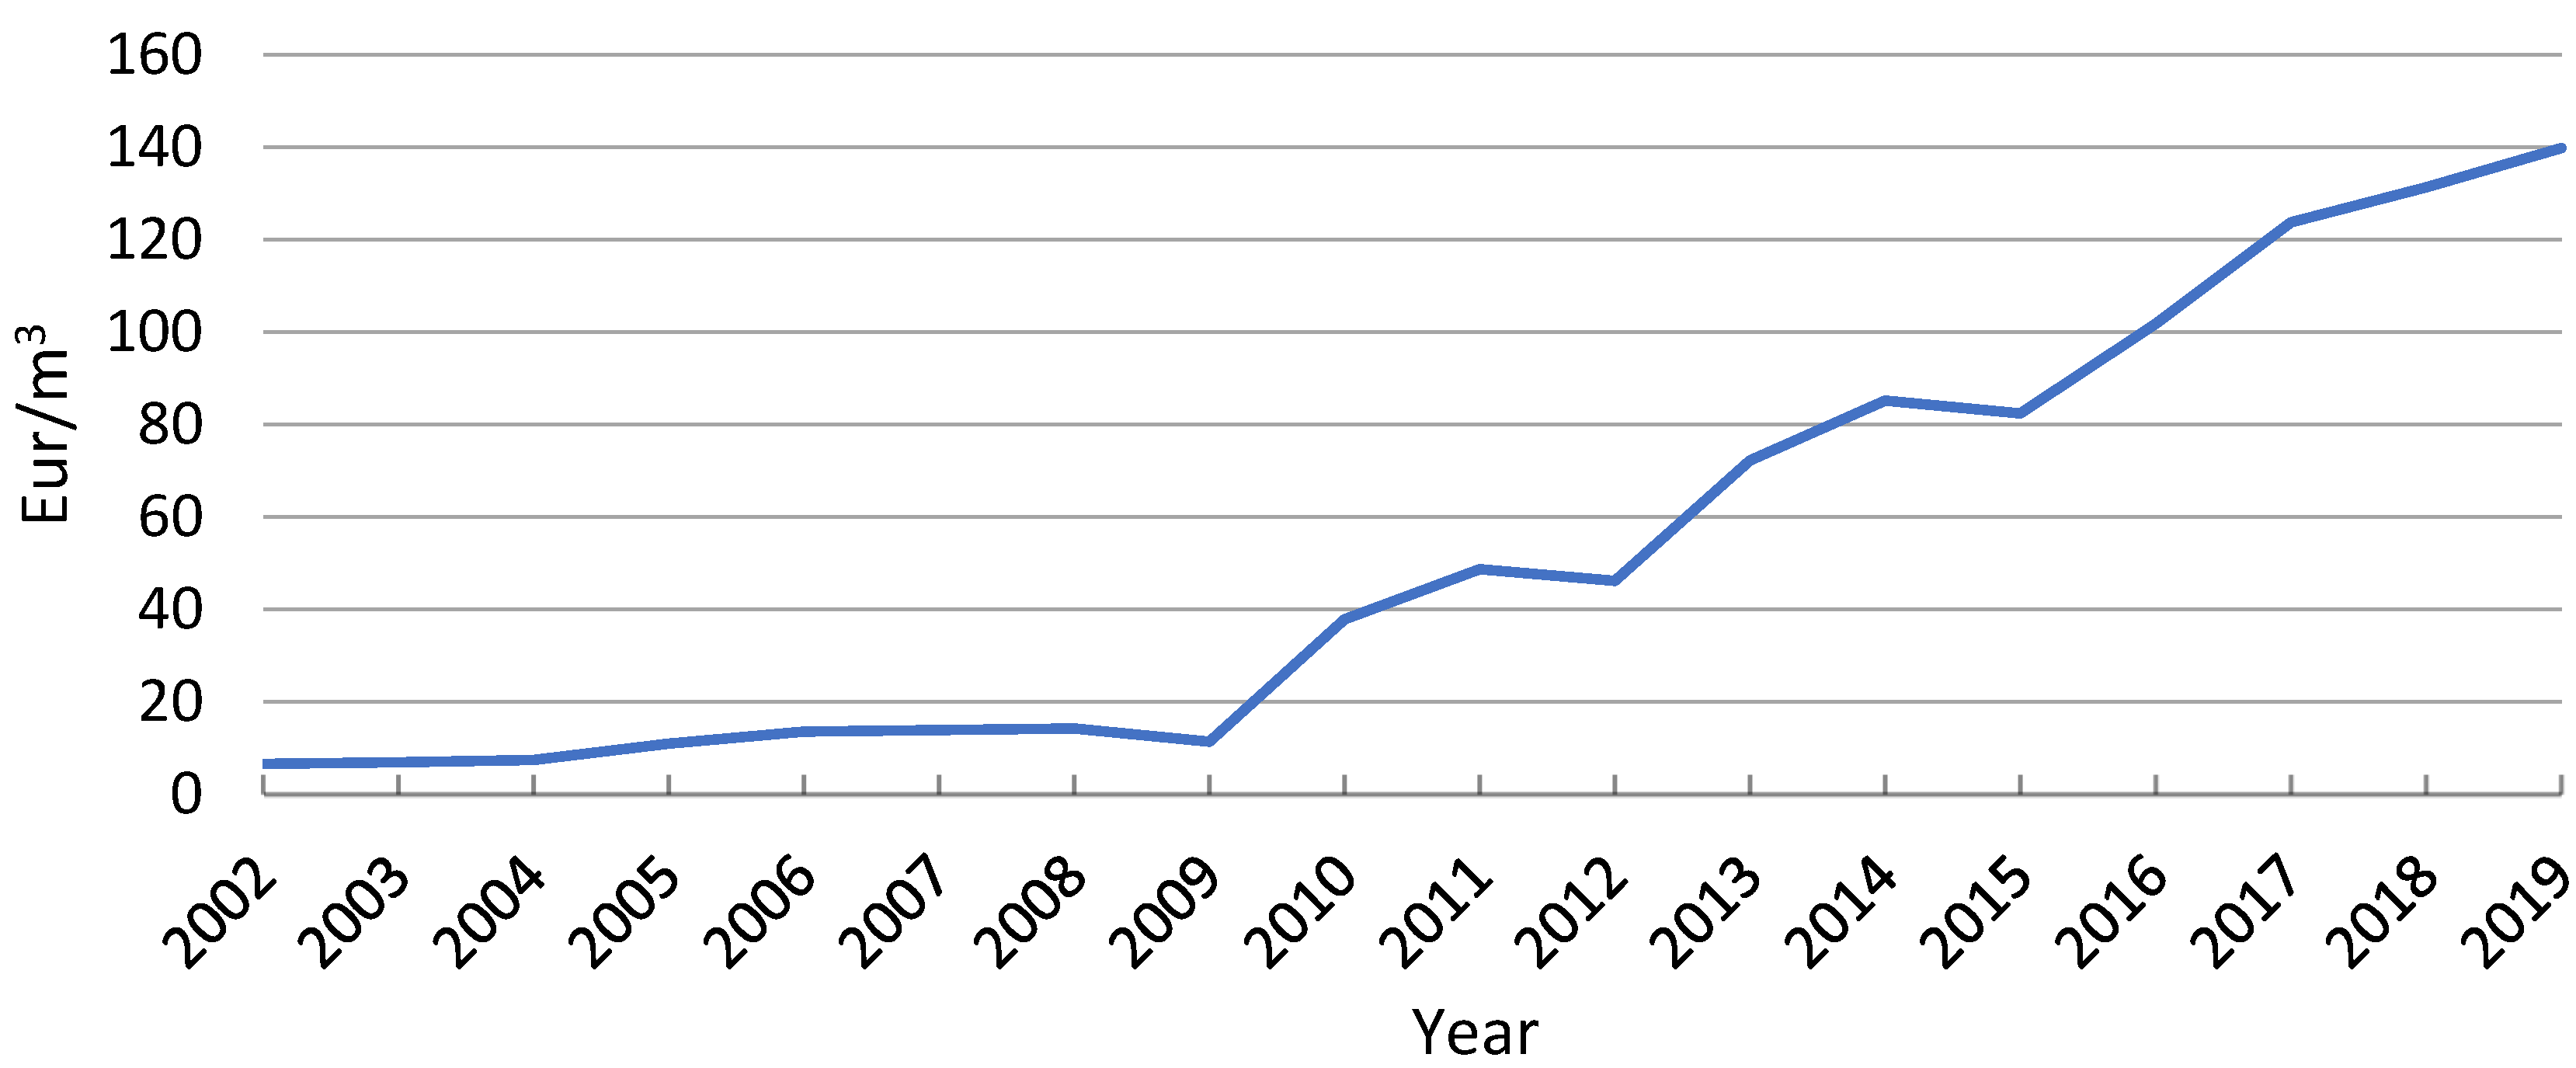
3.1.1. Water Consumption and Wastewater Discharge

The total annual amount of wastewater to be treated in Lithuania fluctuates, but in the long term it remains relatively stable (see Figure 2). Wastewater treatment plants in agglomerations of more than 2000 p.e. account for ~86–87% of this volume [24]. Thus, the overall quality of wastewater in Lithuania depends mainly on wastewater treatment in these agglomerations. The rest of the domestic and industrial wastewater to be treated is discharged from industrial enterprises, small settlements, and other facilities.
As much as 90% of the overall water consumption is in the energy sector, which mainly uses surface water. Excluding the energy sector, the main use (58%) is for domestic purposes [25]. It is household needs that have seen an increase in water consumption in recent years, both in absolute terms and per capita. Nevertheless, per capita consumption in Lithuania is still low compared to that of other European countries (see Figure 3). The 1990s and the first decade of the 21st century saw low consumption, mainly due to rising water prices, which encouraged people to save water. The recent increase in per capita consumption is due to the improving standard of living, with a significant number of people moving to private houses, where they grow lawns and vegetables. Climate change is exacerbating extreme weather events, with drought and heat increasing the need for irrigation. Water suppliers are recording a particularly significant increase in water consumption during the heat, especially in the mornings and evenings, when people water their lawns. However, the water used for irrigation does not enter the sewage, which needs to be treated. The increase in consumption per capita can also be linked to the number of emigrants returning temporarily during their holidays.
Other water users are industry (20.5%), fisheries (19.5%), and agriculture (1.5%). The water productivity index (Figure 4) indicates the increasing efficiency of water use in the country; it shows that economic output produced per cubic meter of fresh water abstracted has almost tripled over the past two decades [27]. Compared to other European countries, water productivity in Lithuania is average or even higher. In 2019, water productivity, expressed in EUR/m3, was 139.9 in Lithuania, 134.3 in Latvia, 51.2 in Poland, 310.8 in Denmark and 18.8 in Greece. However, the possibility of comparing countries is limited, as the productivity index is strongly influenced by the economic and industrial structure of the country, i.e., whether or not water-intensive economic activities predominate. The increase in water productivity in Lithuania could be attributed both to the increasing efficiency and to the changing profile of economic activities as the IT sector, which does not require much water, grows.

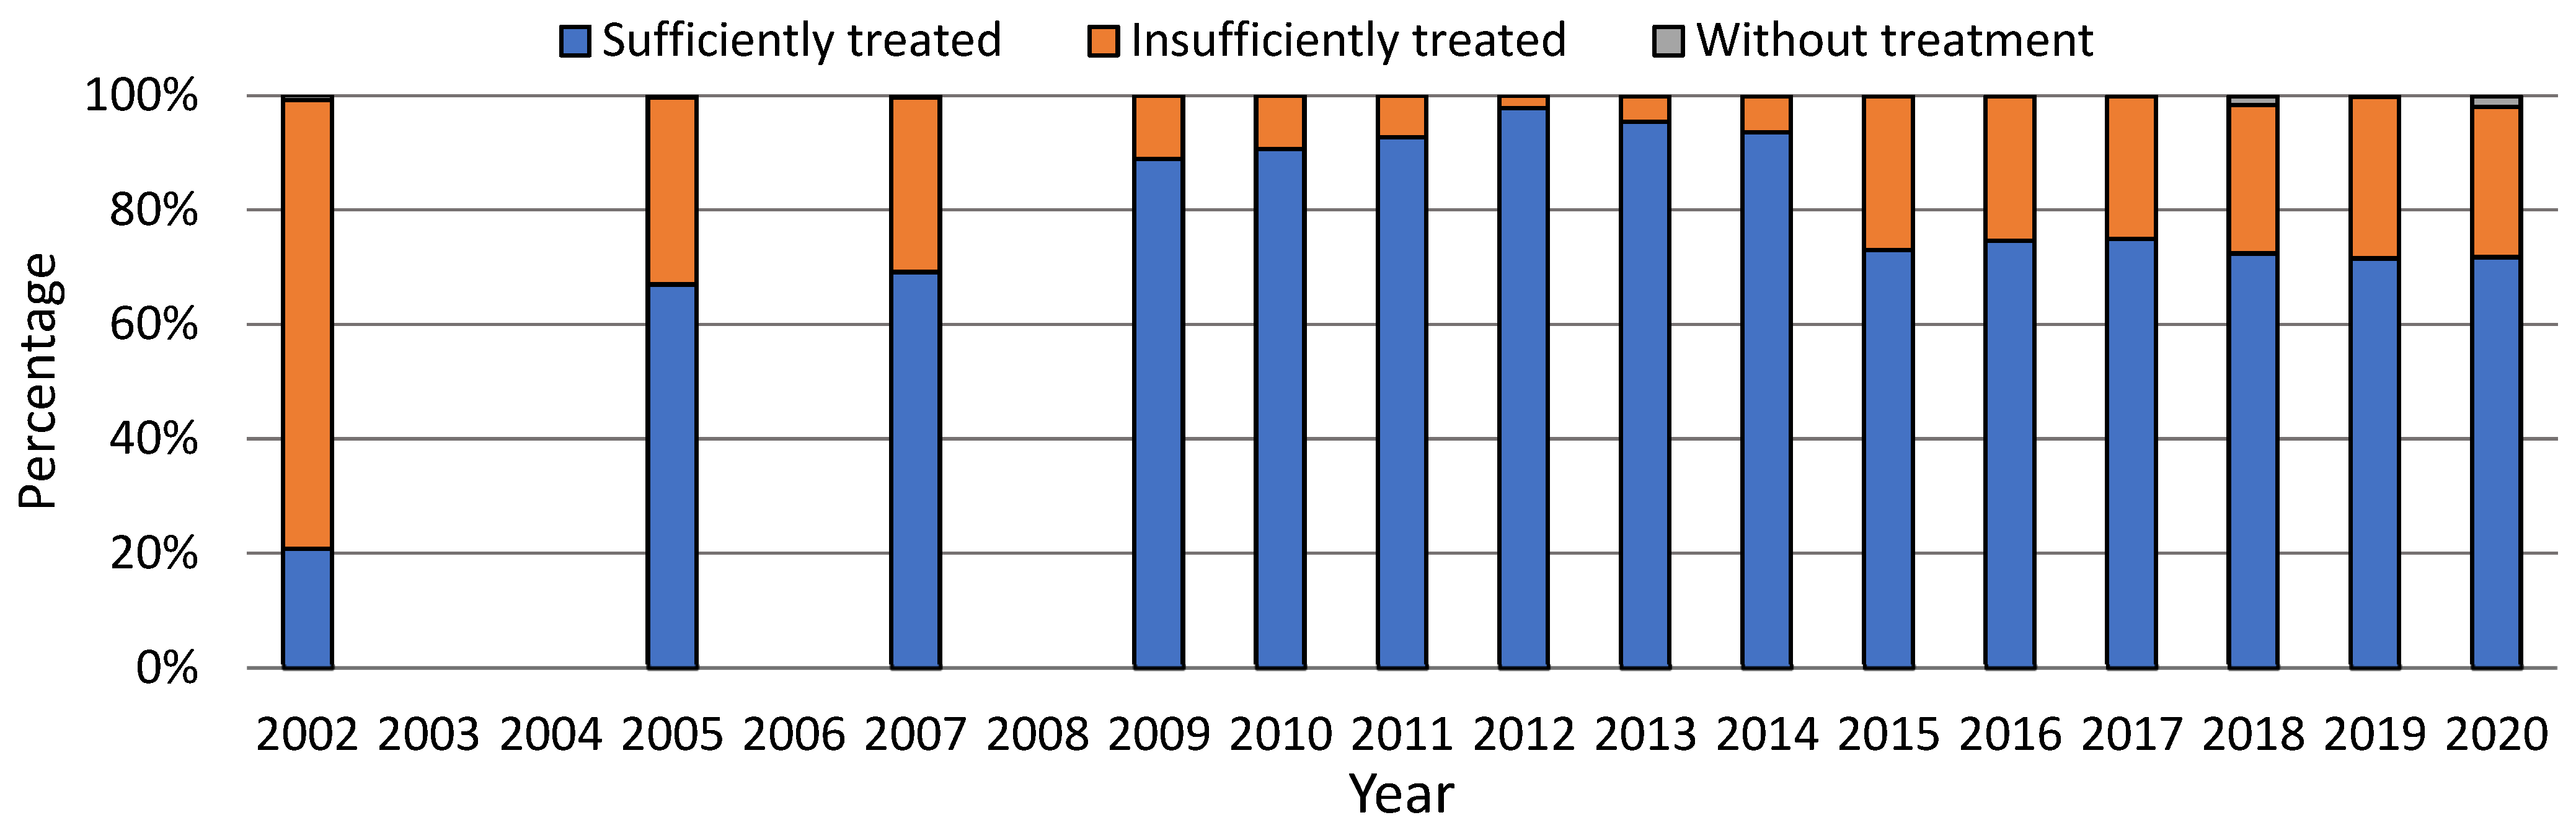
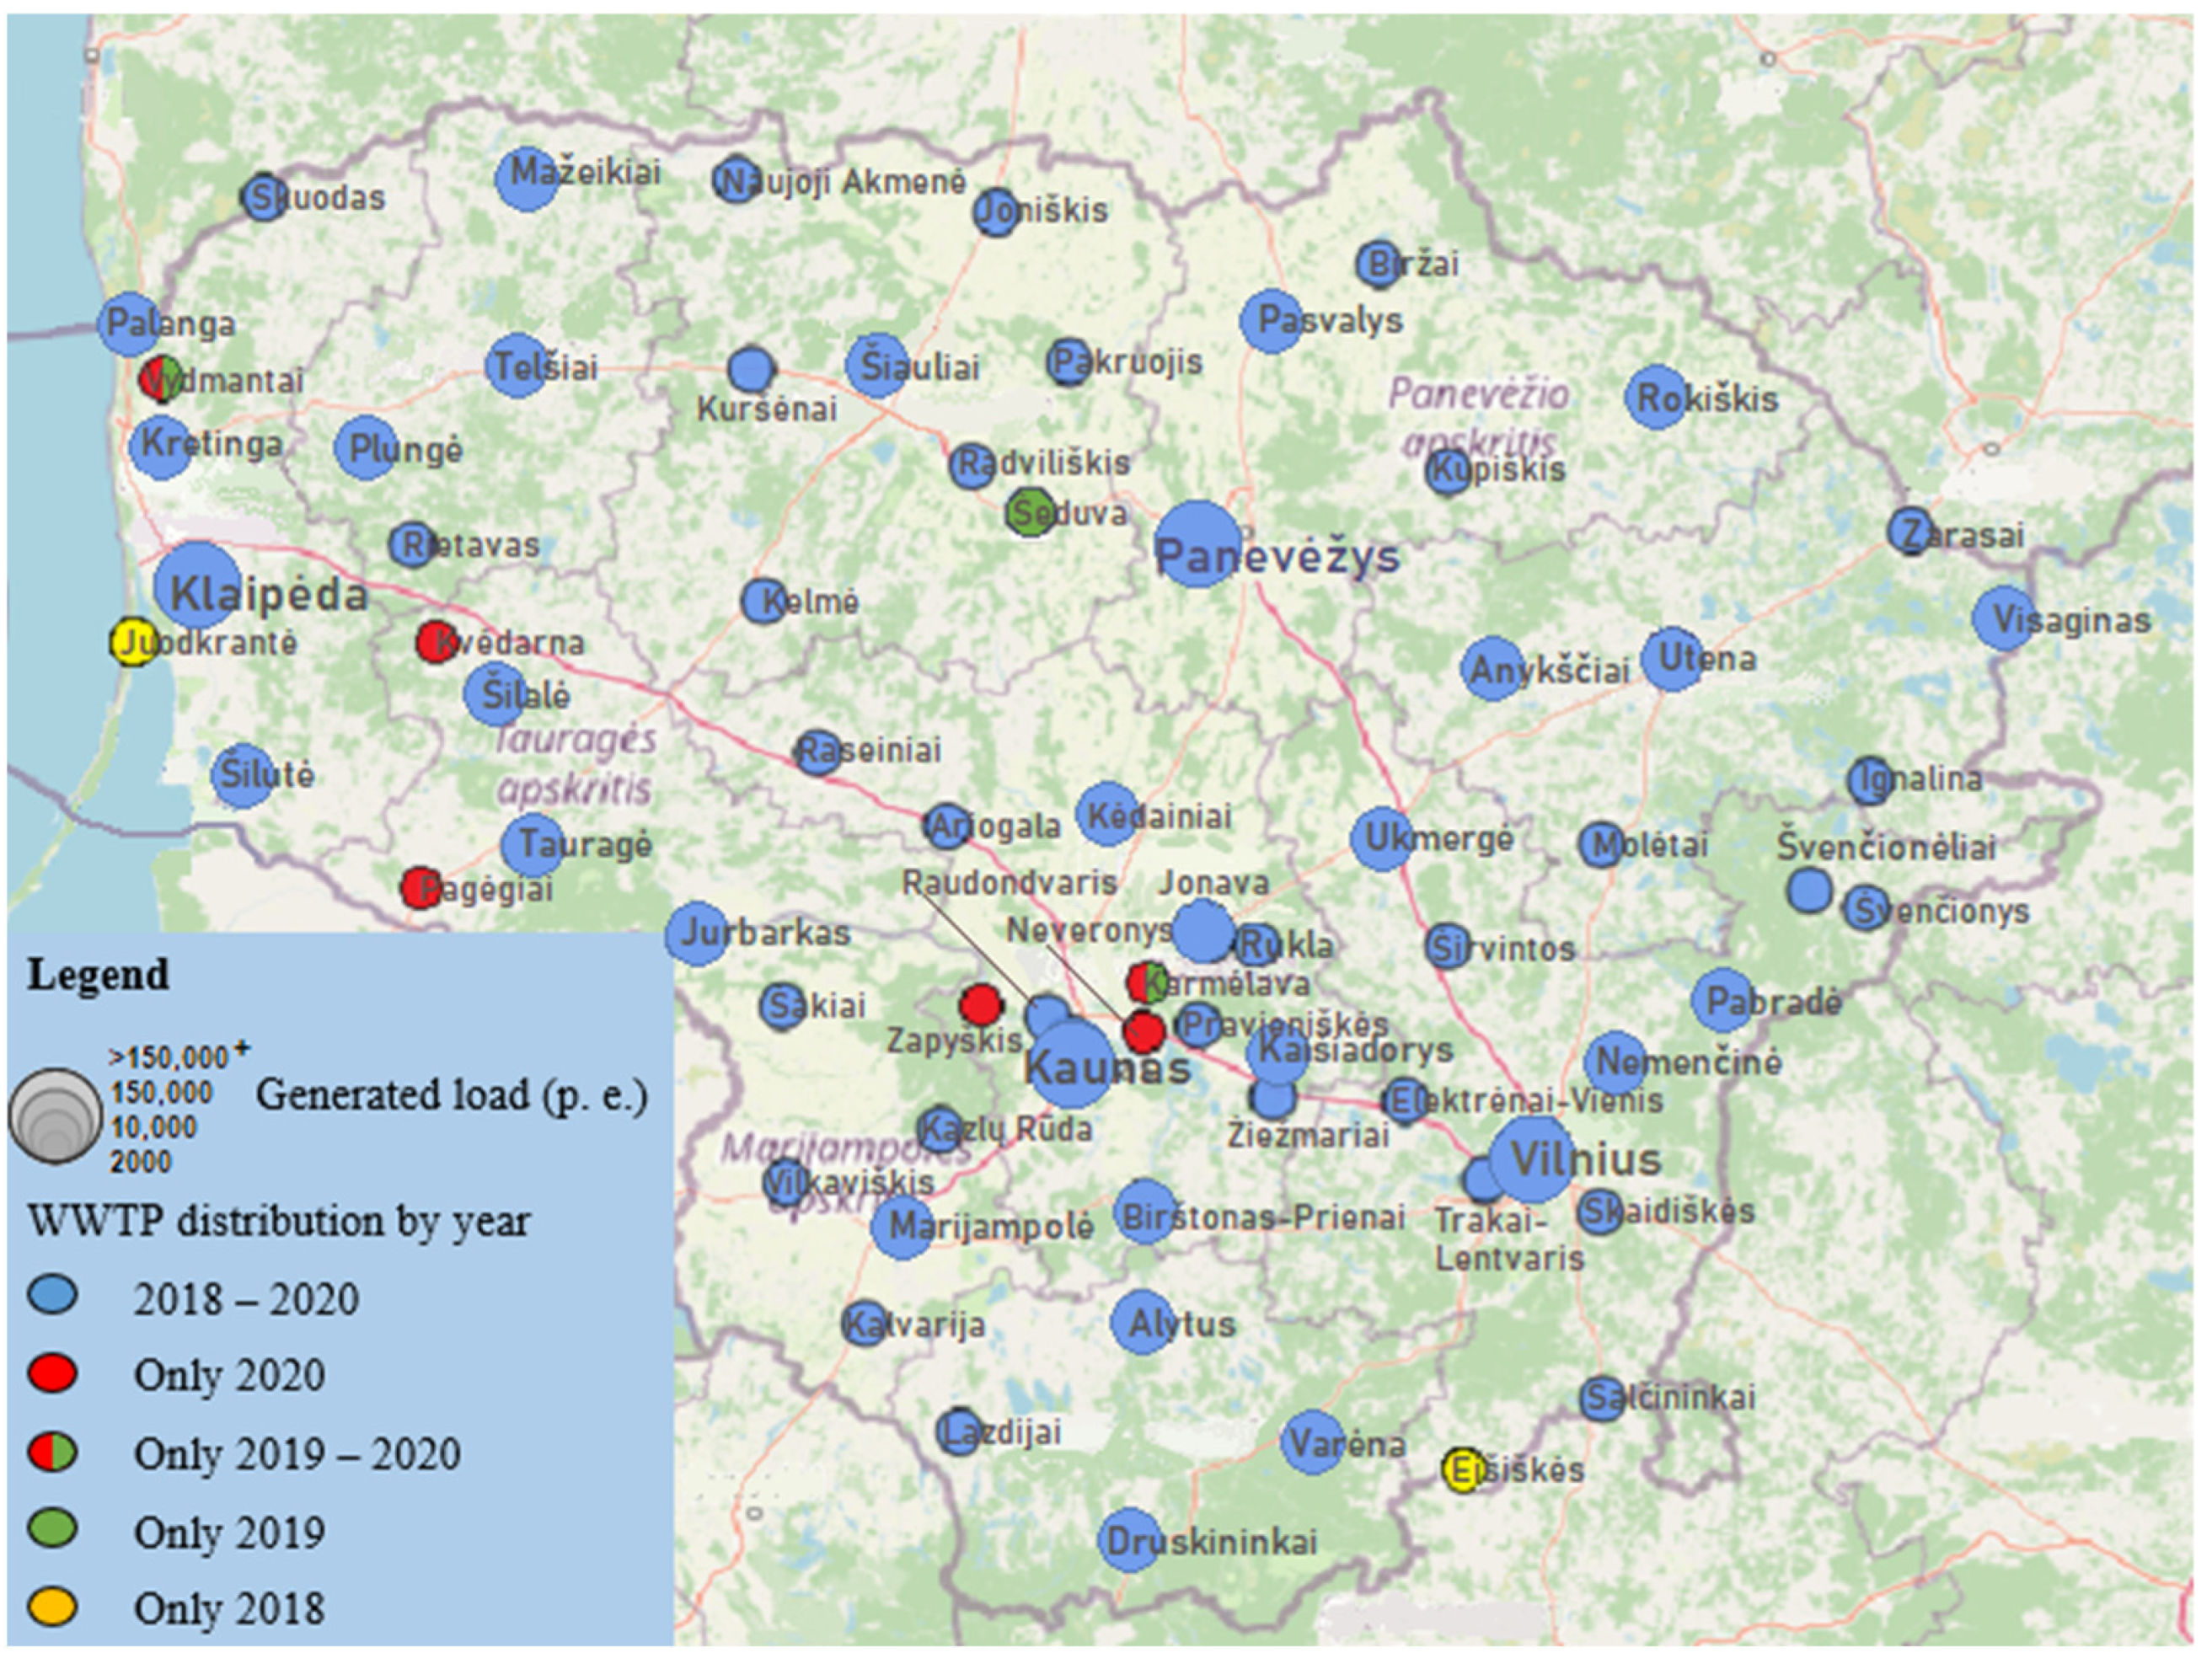
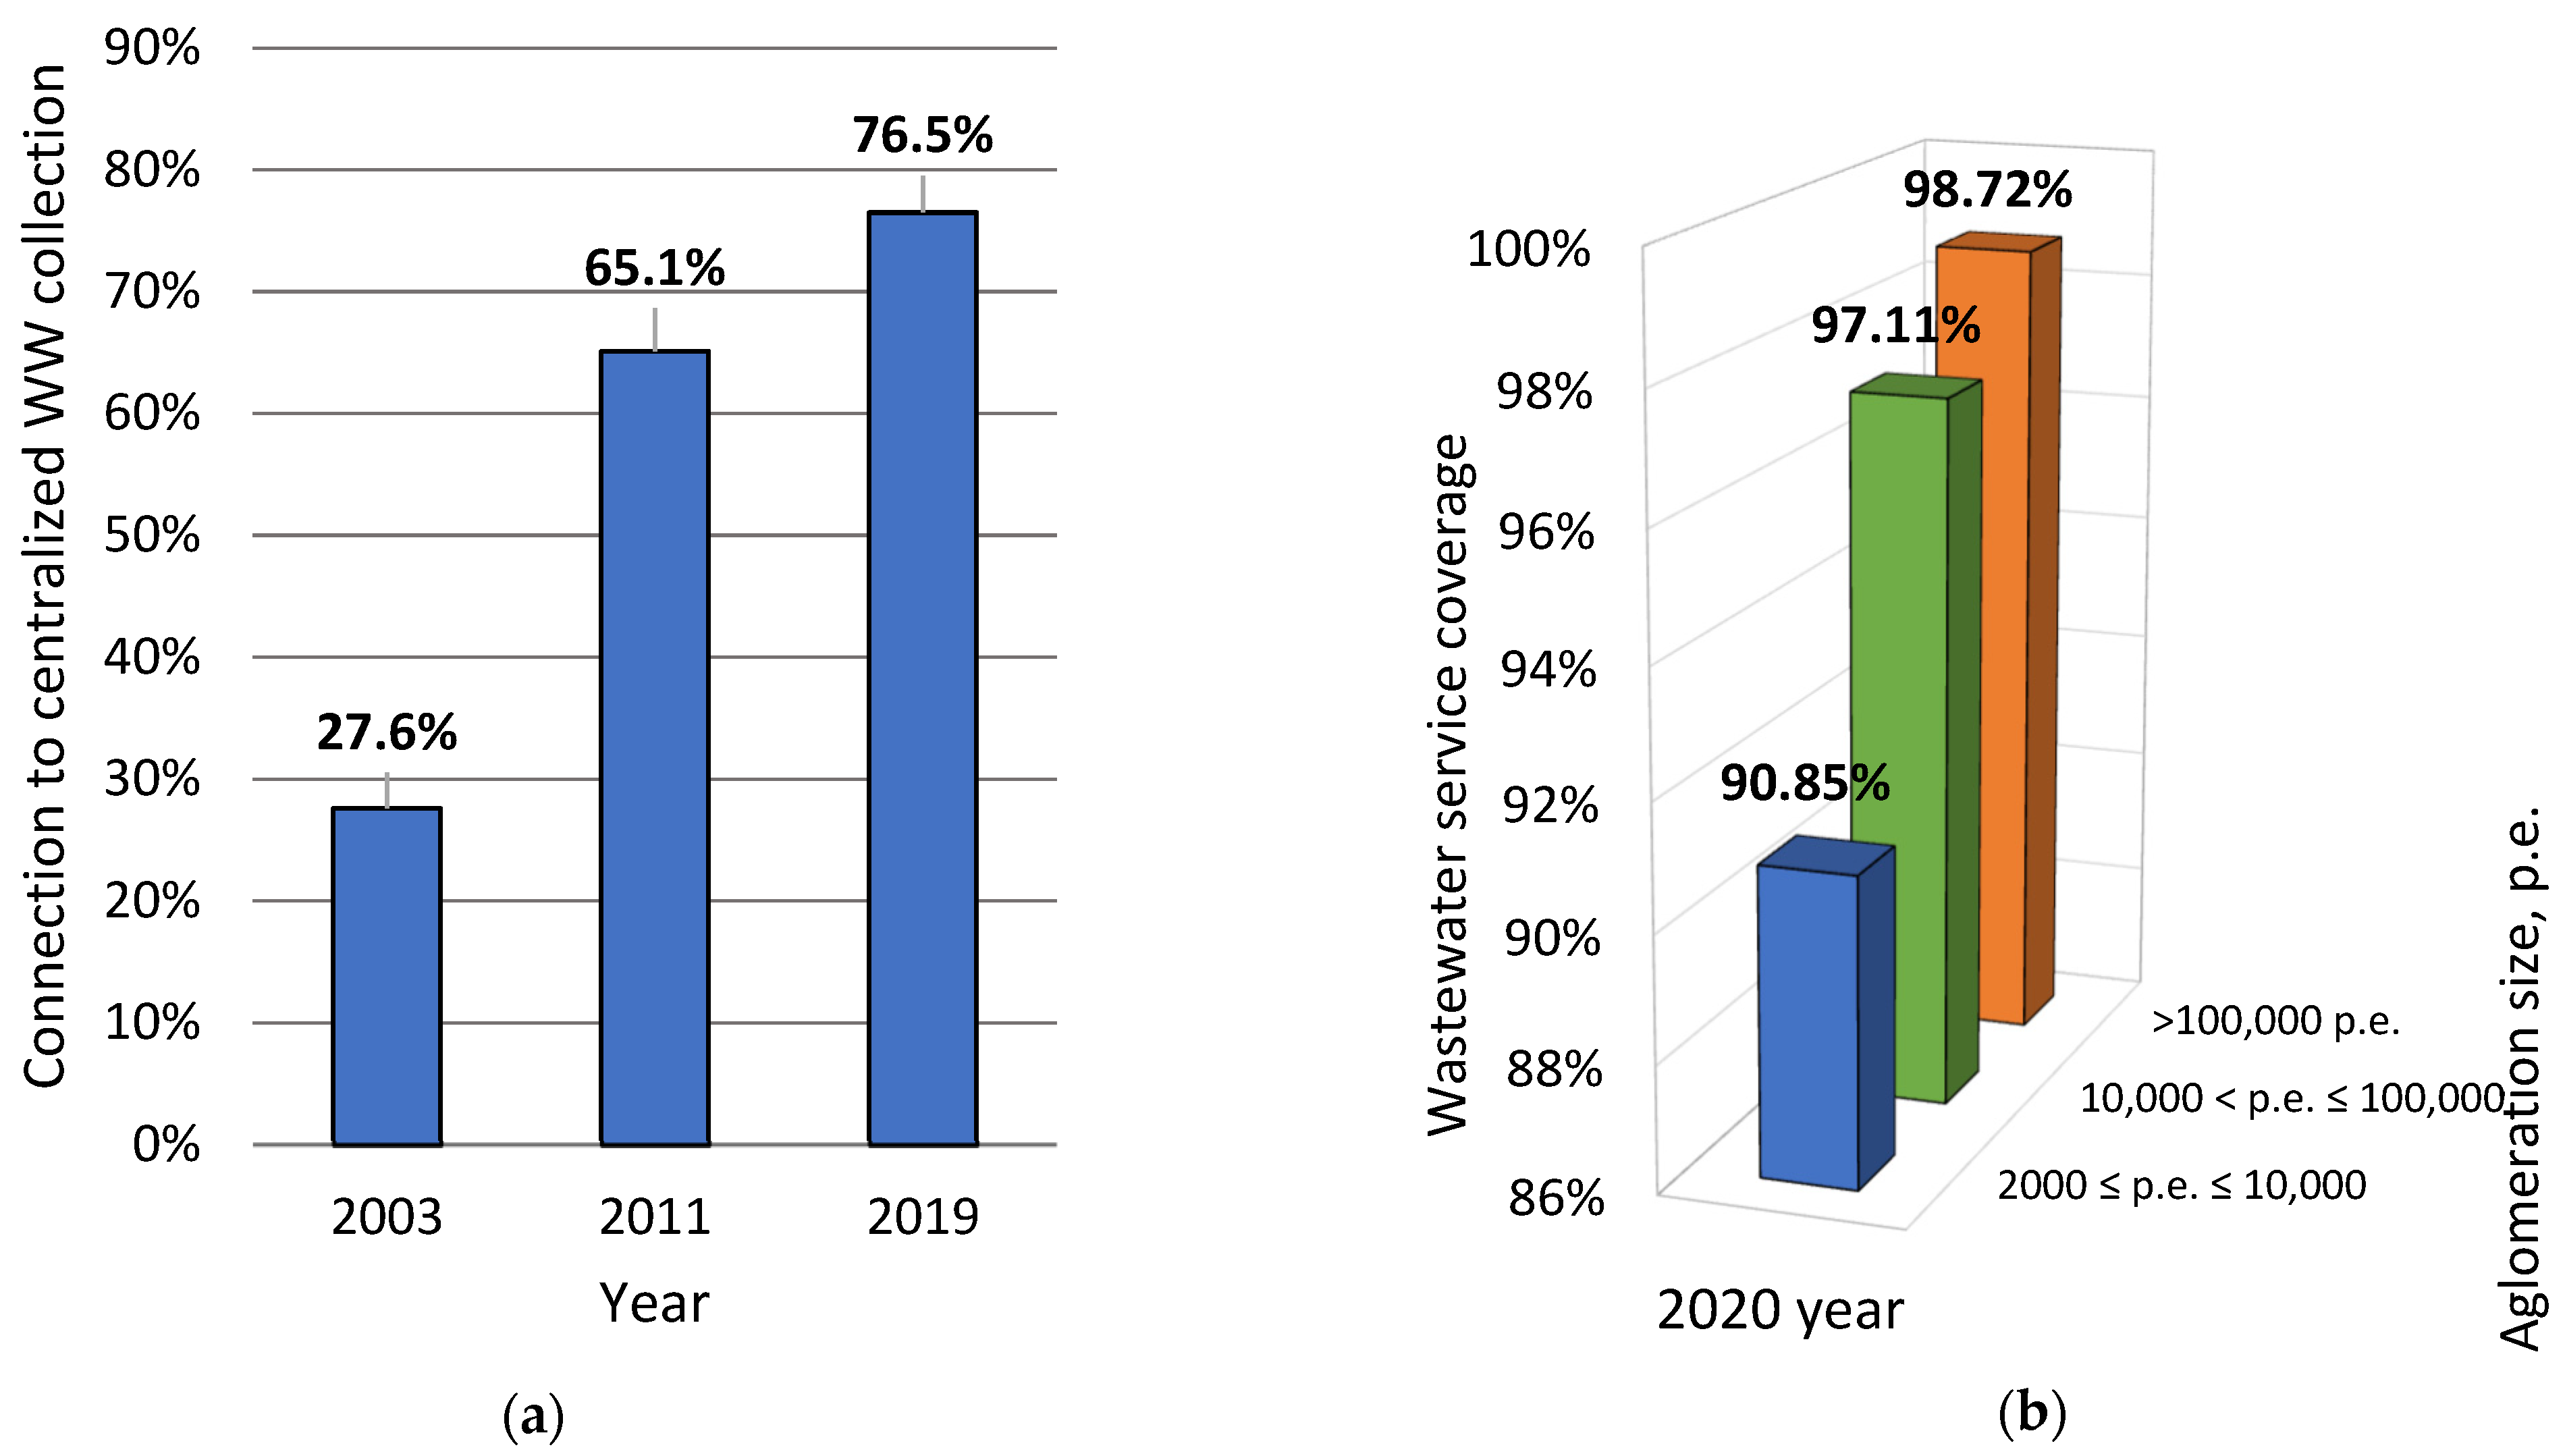
3.1.2. Wastewater Service Coverage

The development of the wastewater collection service has been rapid over the past 20 years as a result of the implementation of UWWTD requirements, as well as significant EU funds allocated to this development (Figure 5a). In total, at the national level, only some 40,000 people in agglomerations of more than 2000 p.e. remain offline, still using individual collection systems [17,18,28]; most of them live in rural areas, which are small agglomerations (Figure 5b). The rapid process of connecting the population to the sewage network has slowed down considerably: it is not always easy to build networks to the rest of the population due to the distances and costs involved, and where networks are available, residents are reluctant to connect for various reasons. Approximately one in five inspections of individual wastewater treatment by environmental inspectors reveals cases of incompliance [29]. Thus, achieving the widest possible connection to centralized collection is important both to ensure the quality of wastewater treatment and to provide more choices for resource recovery possibilities from wastewater.

3.2. Reclamation

Reclamation involves the removal of pollutants from wastewater so that it can be discharged without risk to humans and the natural environment, reach a quality that is suitable for a variety of economic uses, or even be made suitable for potable usage [14].
Nutrients in wastewater receive special attention because they are responsible for the problem of eutrophication. It is important to assess the effectiveness of the processes used in wastewater treatment plants, as well as the efficiency of treatment. As for the further use of sludge, it may be limited by the accumulation of heavy metals and hazardous organic pollutants. Therefore, the pollutant content in sewage sludge is also one of the indicators considered.

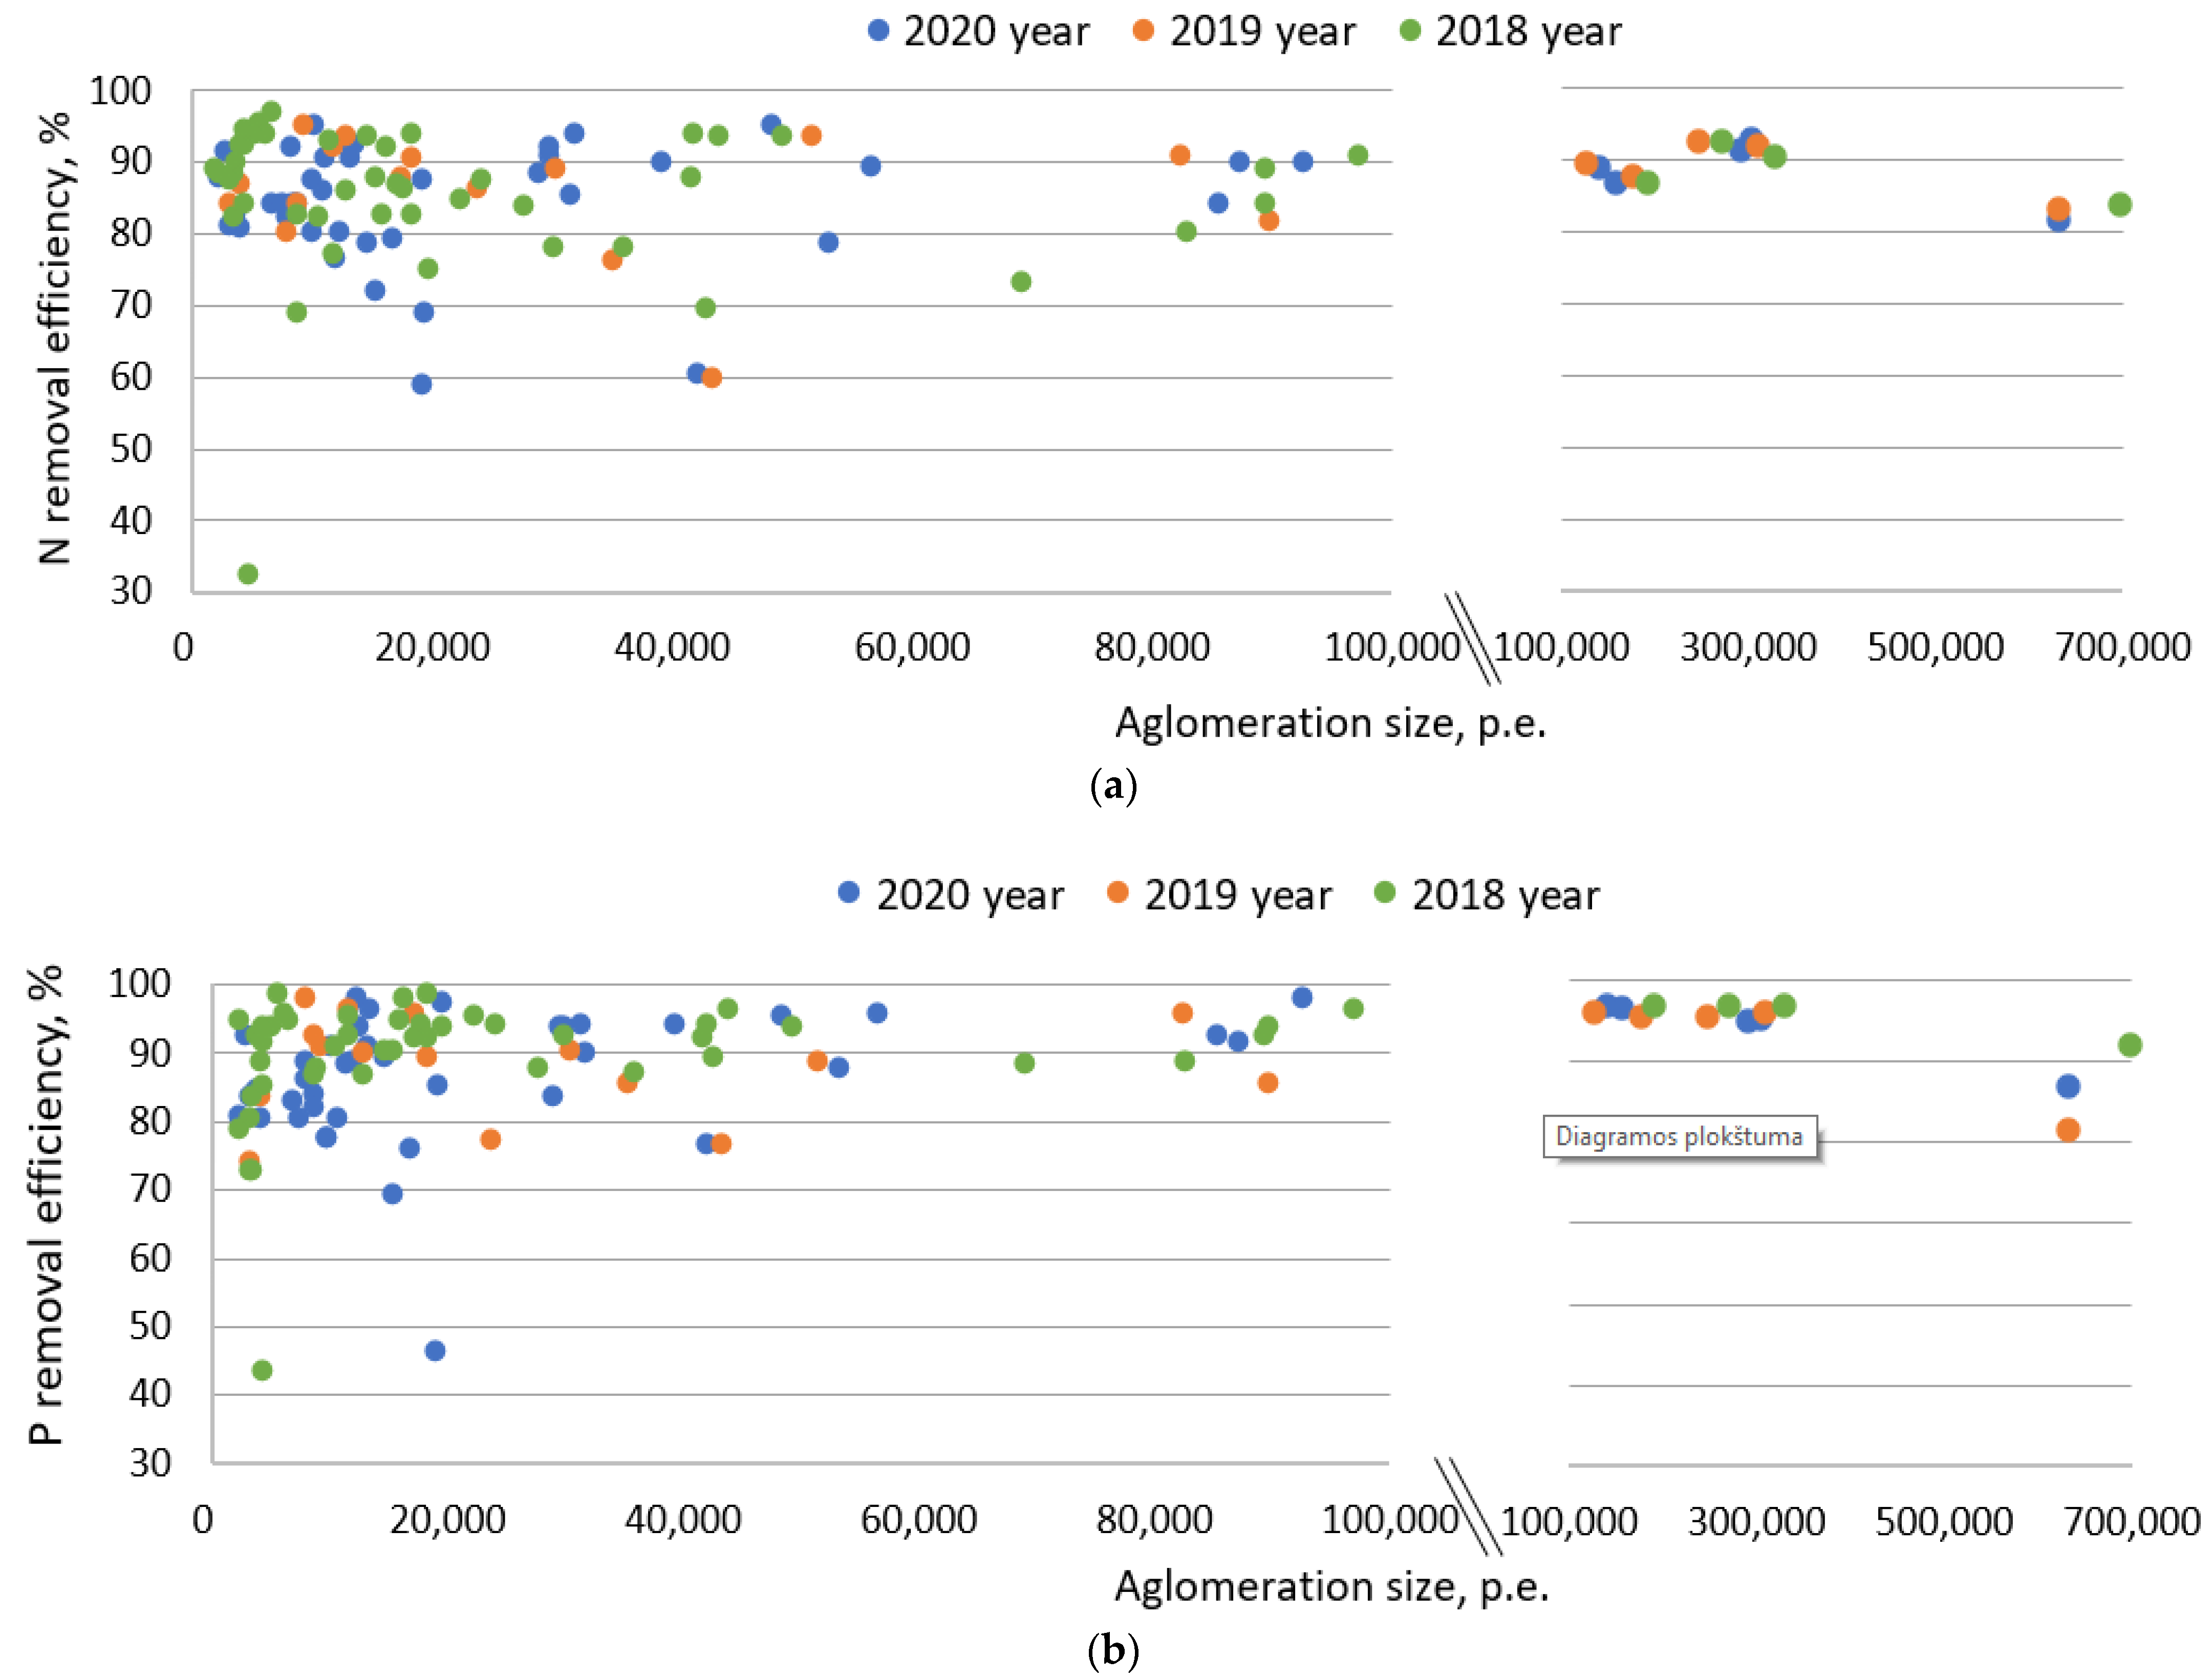
3.2.1. Nutrient Removal Efficiency

The maximum and minimum efficiency of nitrogen and phosphorus removal varies over a relatively wide range, especially in smaller treatment plants (Figure 6). Efficiency was calculated as the percentage reduction in the total load of nitrogen (N) and phosphorus [21].
In conventional activated sludge treatment plants, the efficiency of nitrogen removal is generally expected to be 86–90% [30]. For the assessed WWTPs, this was achieved in 80% of cases. The highest removal efficiency was in large treatment plants. The median calculated for nitrogen removal is as follows:
  • In WWTPs > 100,000 p.e.: 89.6%;
  • In WWTPs 10,000–100,000 p.e.: 86.7%;
  • In WWTPs 2000–10,000 p.e.: 84.3%.
For phosphorus, an even higher degree of purification was achieved. The median is as follows:
  • In WWTPs > 100,000 p.e.: 96.0%;
  • In WWTPs 10,000–100,000 p.e.: 91.4%;
  • In WWTPs 2000–10,000 p.e.: 83.3%.
The vast majority of the analyzed WWTPs use conventional biological treatment with activated sludge. WWTPs above 10,000 p.e. are obliged to apply tertiary treatment for better nutrient removal [1,17]. Still, interviews with treatment plants have shown that if the required degree of treatment is achieved and maintained, some treatment plants tend to apply biological treatment only. At the same time, the achieved removal efficiency in some WWTPs is insufficient to ensure the required quality of the effluent. Depending on the condition of the receiving water bodies, Lithuania may set stricter requirements for wastewater discharge than required by the UWWTD [31]. Some WWTPs, even if they comply with the requirements of the directive, do not meet the specific requirements for their discharge. This is especially relevant for the largest wastewater treatment plant in the capital, which, due to the increased pollution load, is unable to cope with it and achieve the permissible N concentration in the discharge. It contributes strongly to the fact that since 2015, the share of insufficiently treated wastewater in the country has increased again. In 2020, sufficiently treated wastewater accounted for only 71.7%, while in 2012, it was as high as 97.8% (see Figure 7). In 2018–2020, the permitted N and/or P concentrations were exceeded in the water discharged by WWTPs in another ten agglomerations [17,24].

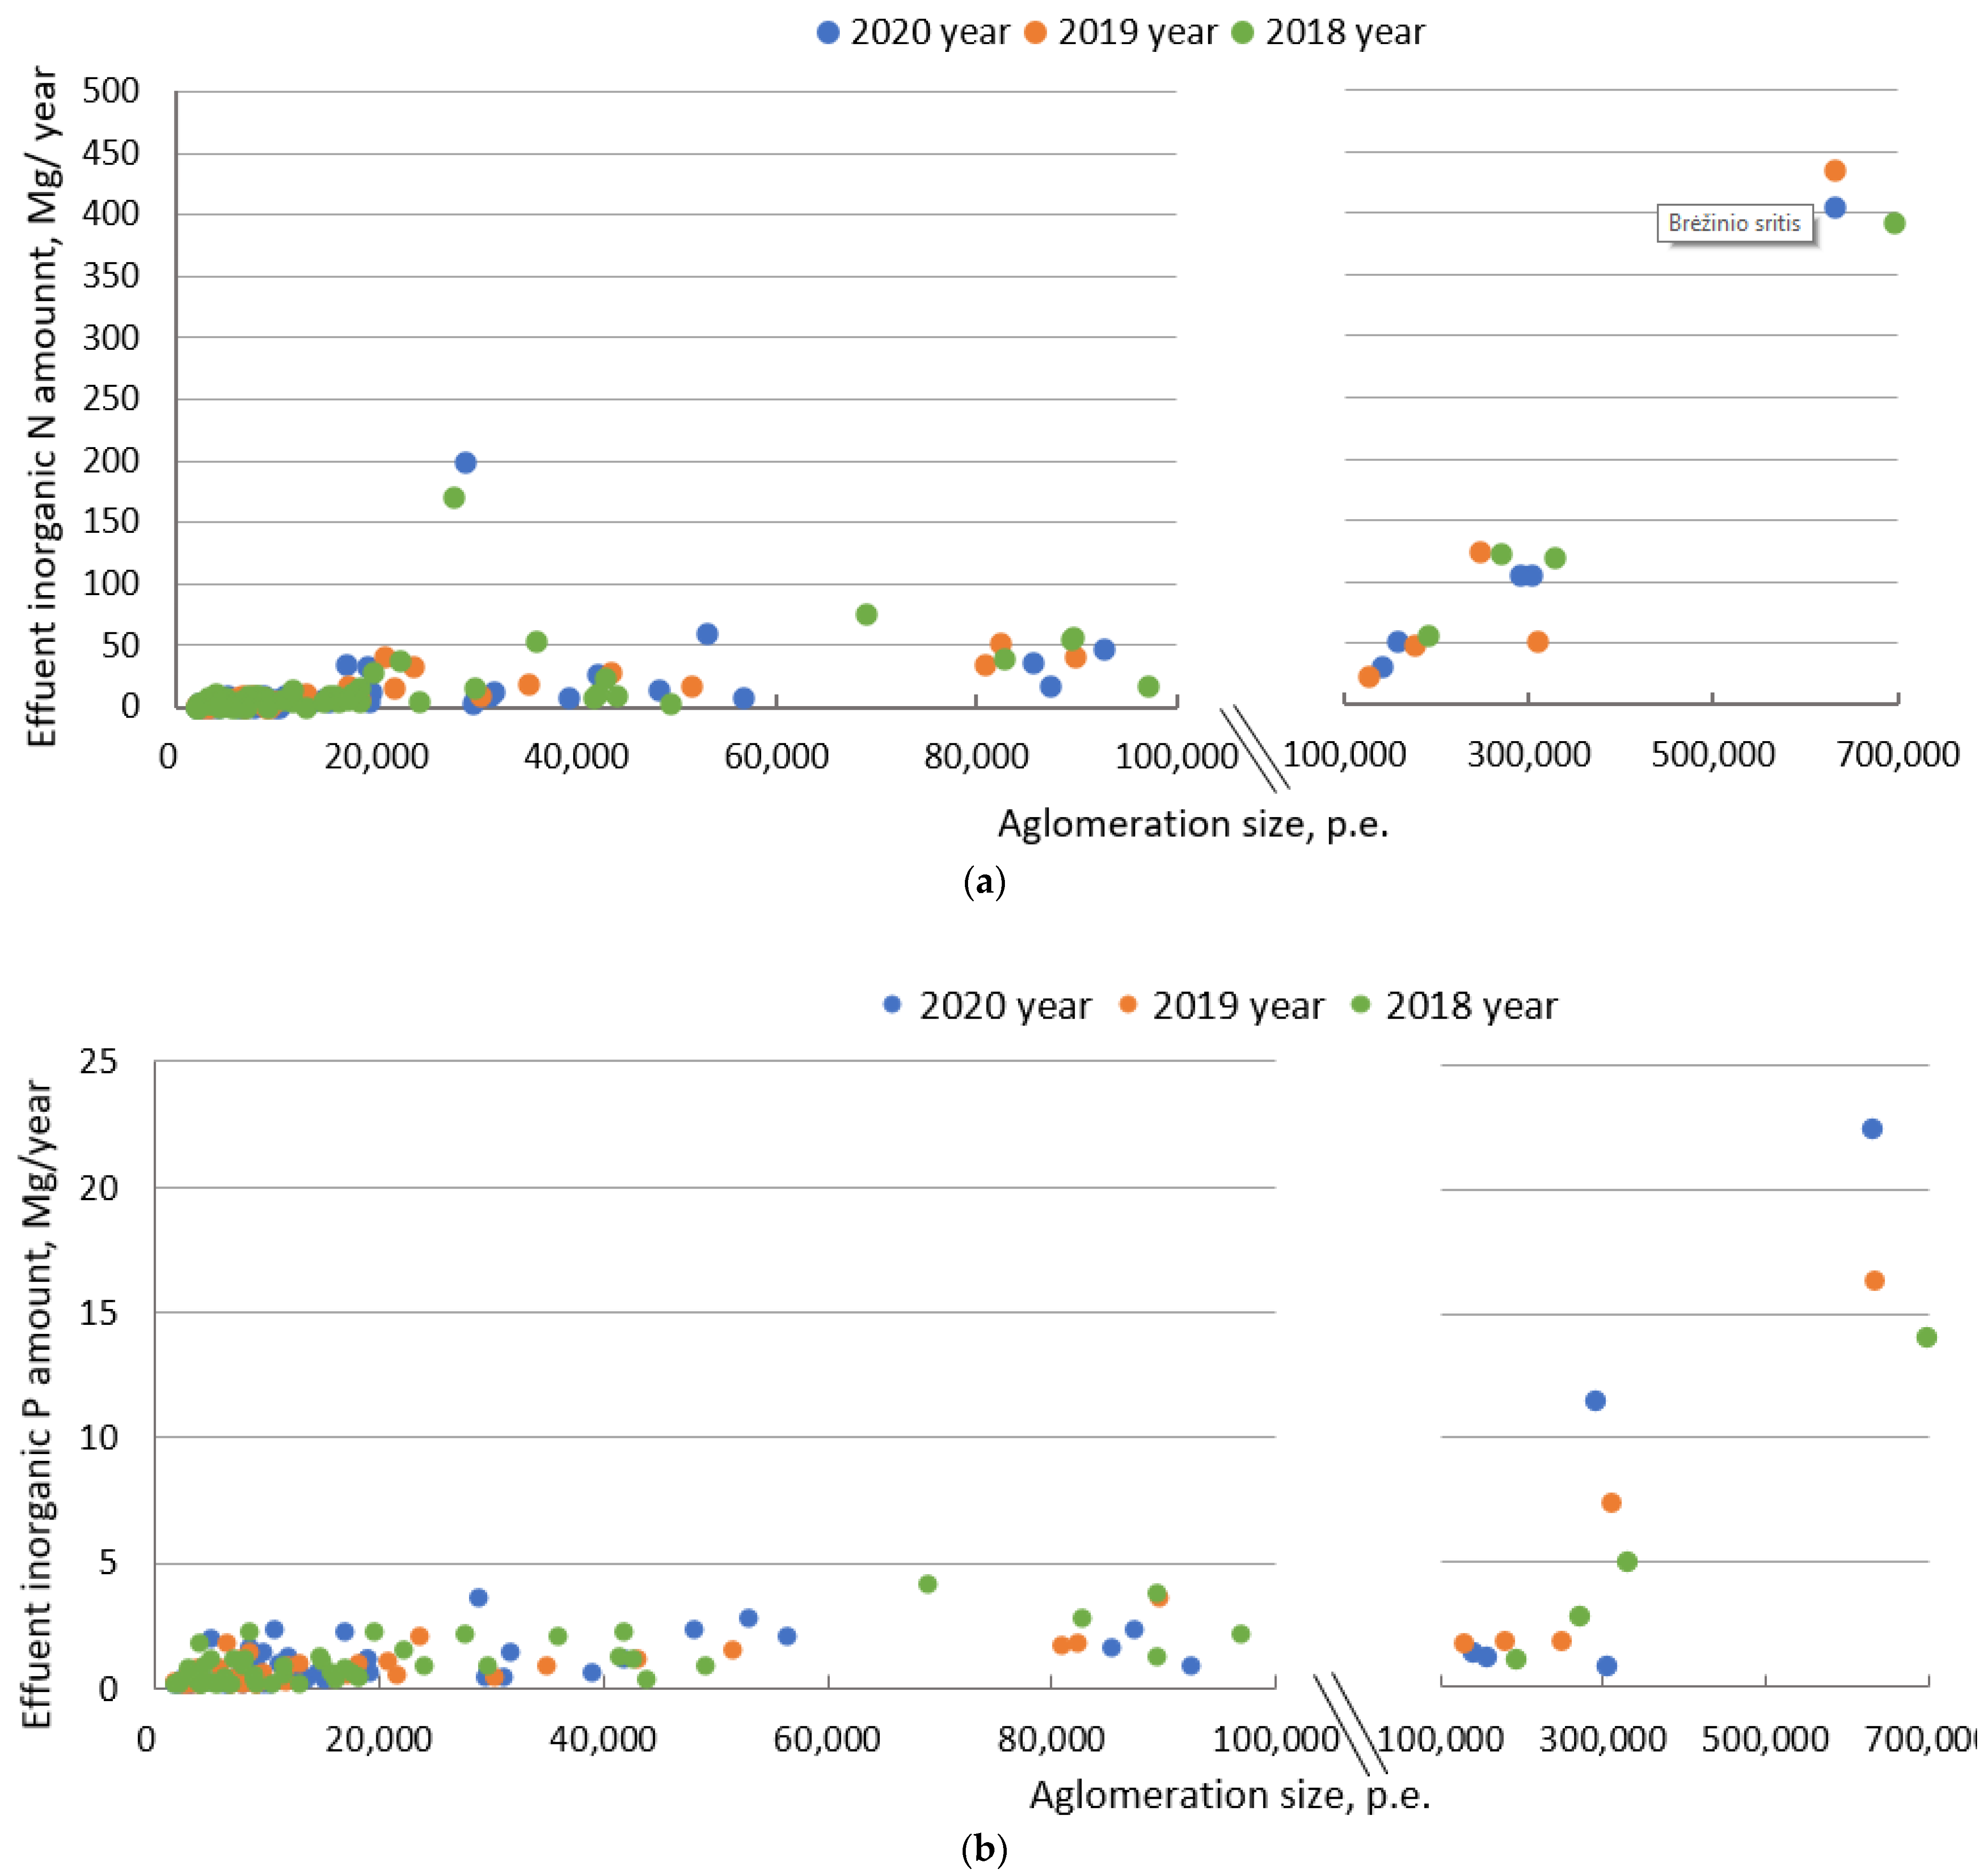
3.2.2. Effluent Inorganic Content

The effluent inorganic content indicator was calculated as the share of inorganic nitrogen (NH4-N, NO3-N, and NO2-N) and inorganic phosphorus (PO4-P) in total nitrogen and phosphorus emissions. Although there are studies reporting the bioavailability of organic forms, such as [32], which demonstrated the bioavailability of approximately 28–57% of dissolved organic N in effluents, it is the inorganic forms of nutrients that are crucial for eutrophication [33]. Therefore, we also calculated the inorganic N and P loads on the receiving water bodies. All wastewater point discharges were included in the calculations in order to provide an overall picture of the contribution of the country’s point sources to the eutrophication of the Baltic Sea.
Most of the nutrient load is caused by a discharge from large agglomerations (see Figure 8). It is therefore very important that they achieve a high degree of purification. Unfortunately, it is the largest WWTP that is having difficulty achieving the required nitrogen purification. Almost half (46.4–49.6%) of the inorganic nitrogen load comes from treatment plants larger than 100,000 p.e.; their contribution to inorganic phosphorus load is slightly lower, 31.0–43.4%. The share of inorganic nitrogen and inorganic phosphorus is quite high: 76–76% for N and 52–55% for P (Table 2). This can be compared with neighboring Poland, where in recent years the average share of inorganic nitrogen in the riverine nutrients loads was 64%, while that of inorganic phosphorus was 35% [33]. Again, the large percentage of the inorganic part of discharges in Lithuania is largely determined by the largest WWTP; without it, the share of inorganic nitrogen would be 54–56%, and the share of inorganic phosphorus would be 40–42%.

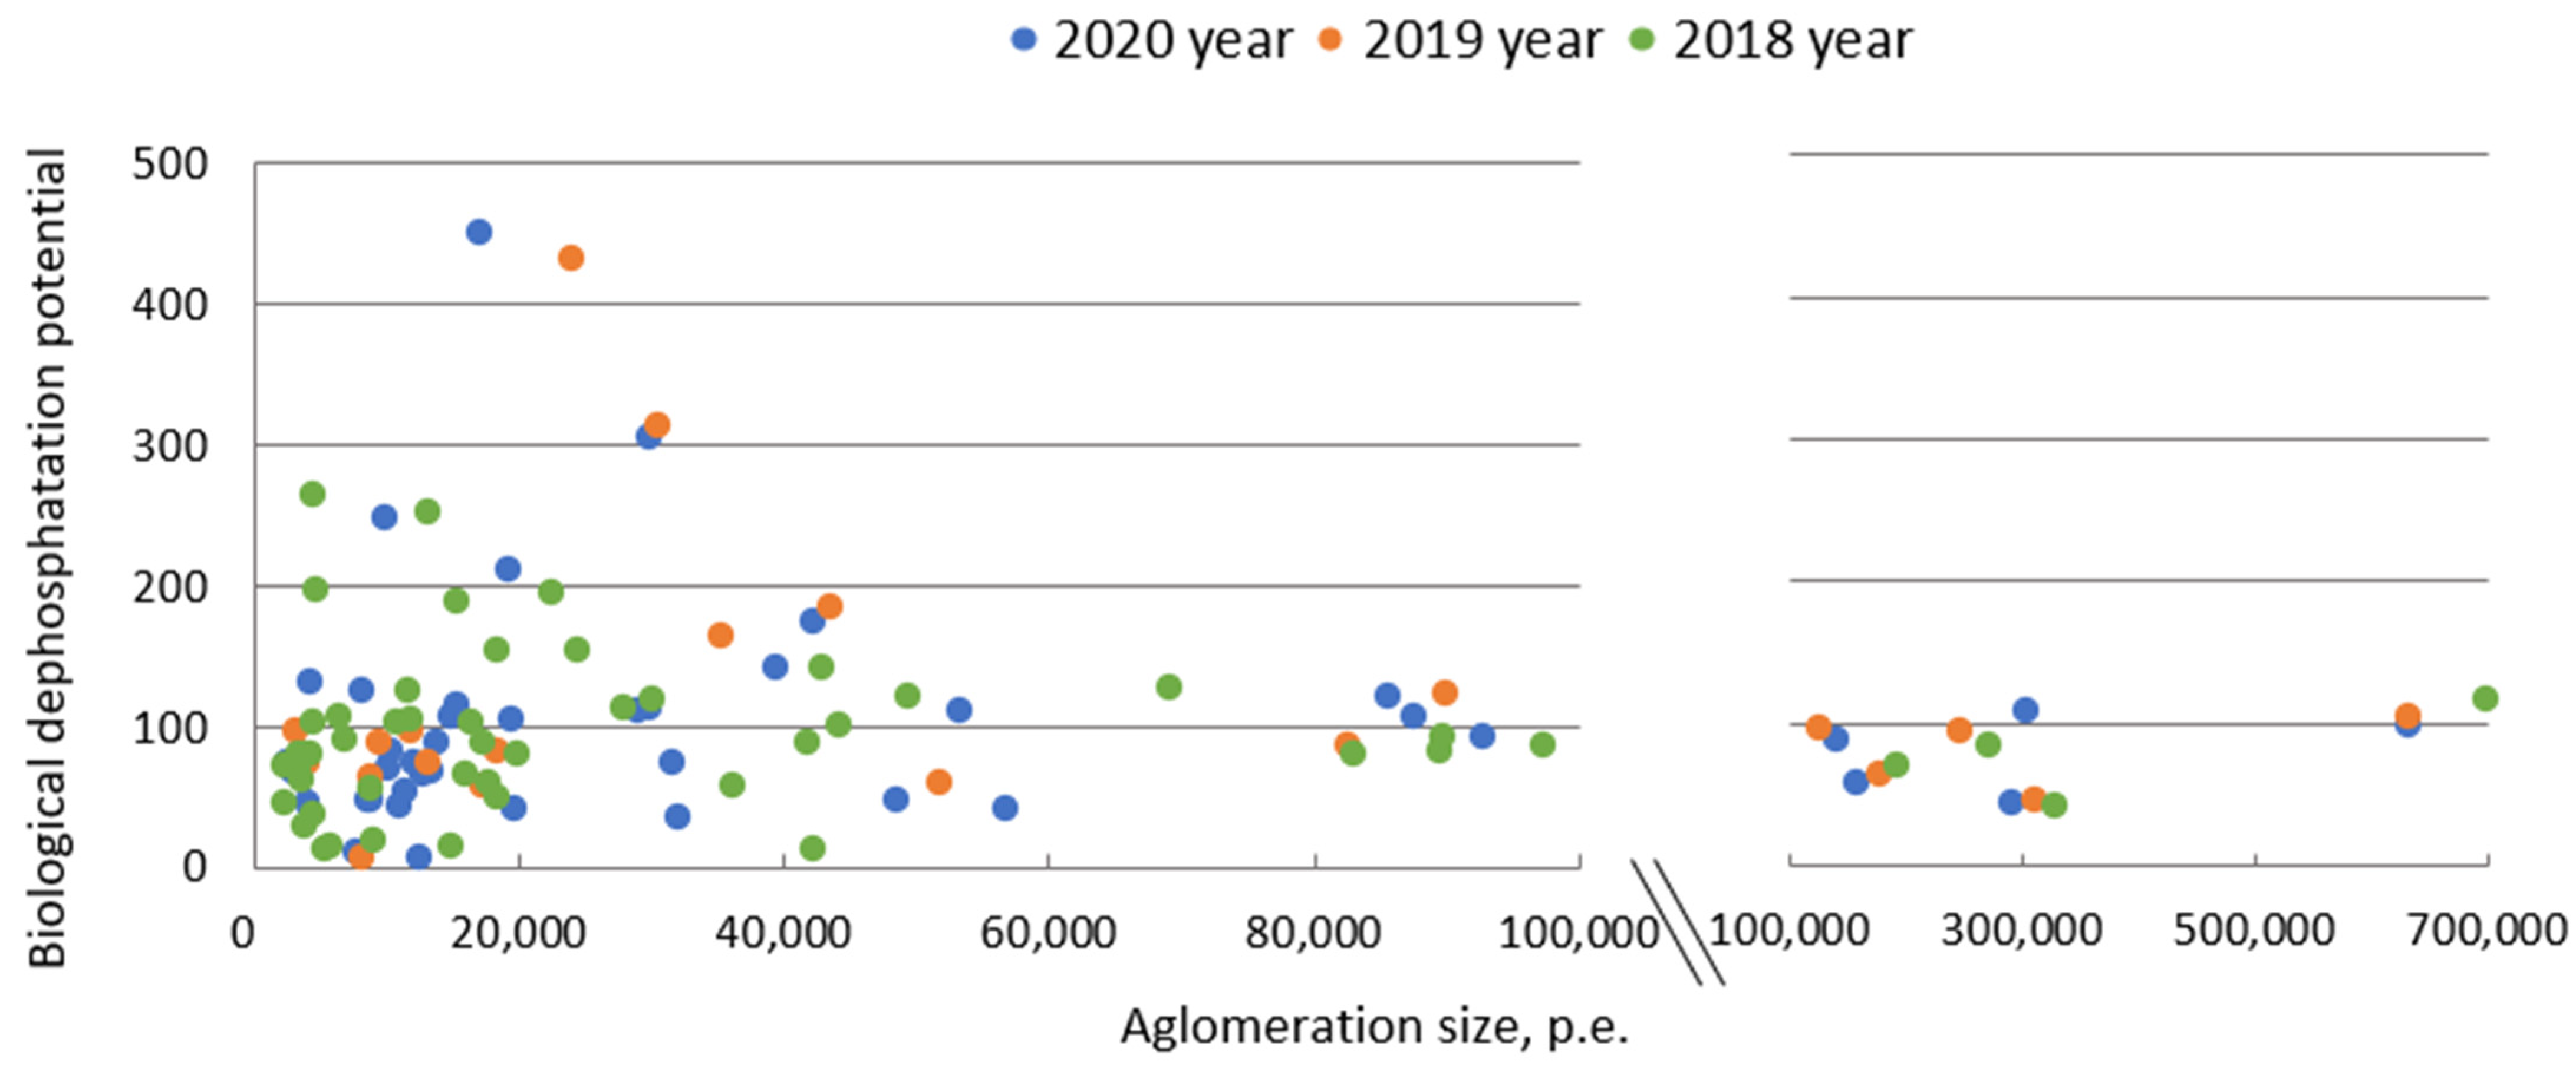
3.2.3. Biological Dephosphatation Potential and the Use of Chemicals for Wastewater Treatment

The biological dephosphatation potential indicator was calculated as a ratio of chemical oxygen demand and total phosphorus concentration (COD/TP) in the influents [21]. This indicator shows how P tends to be removed from wastewater during biological treatment. Values below 50 indicate that sufficient dephosphatation is unlikely to be achieved without additional chemical purification, such as the use of metal salts [34,35,36]. However, any introduction of additional chemicals may interfere with and adversely affect further processes, such as phosphorus recovery or other uses of sludge. Figure 9 shows that the characteristics of wastewater from the examined Lithuanian WWTPs are very different. Low COD/TP ratios, which complicate the biological treatment of phosphorus, are more common in smaller wastewater treatment plants.
Iron salts are most often used to enhance phosphorus removal in Lithuanian WWTPs. Non-chemical alternatives are only applicable at the experimental level. Probiotics have been tested in several treatment plants, and very good results have been obtained [37].

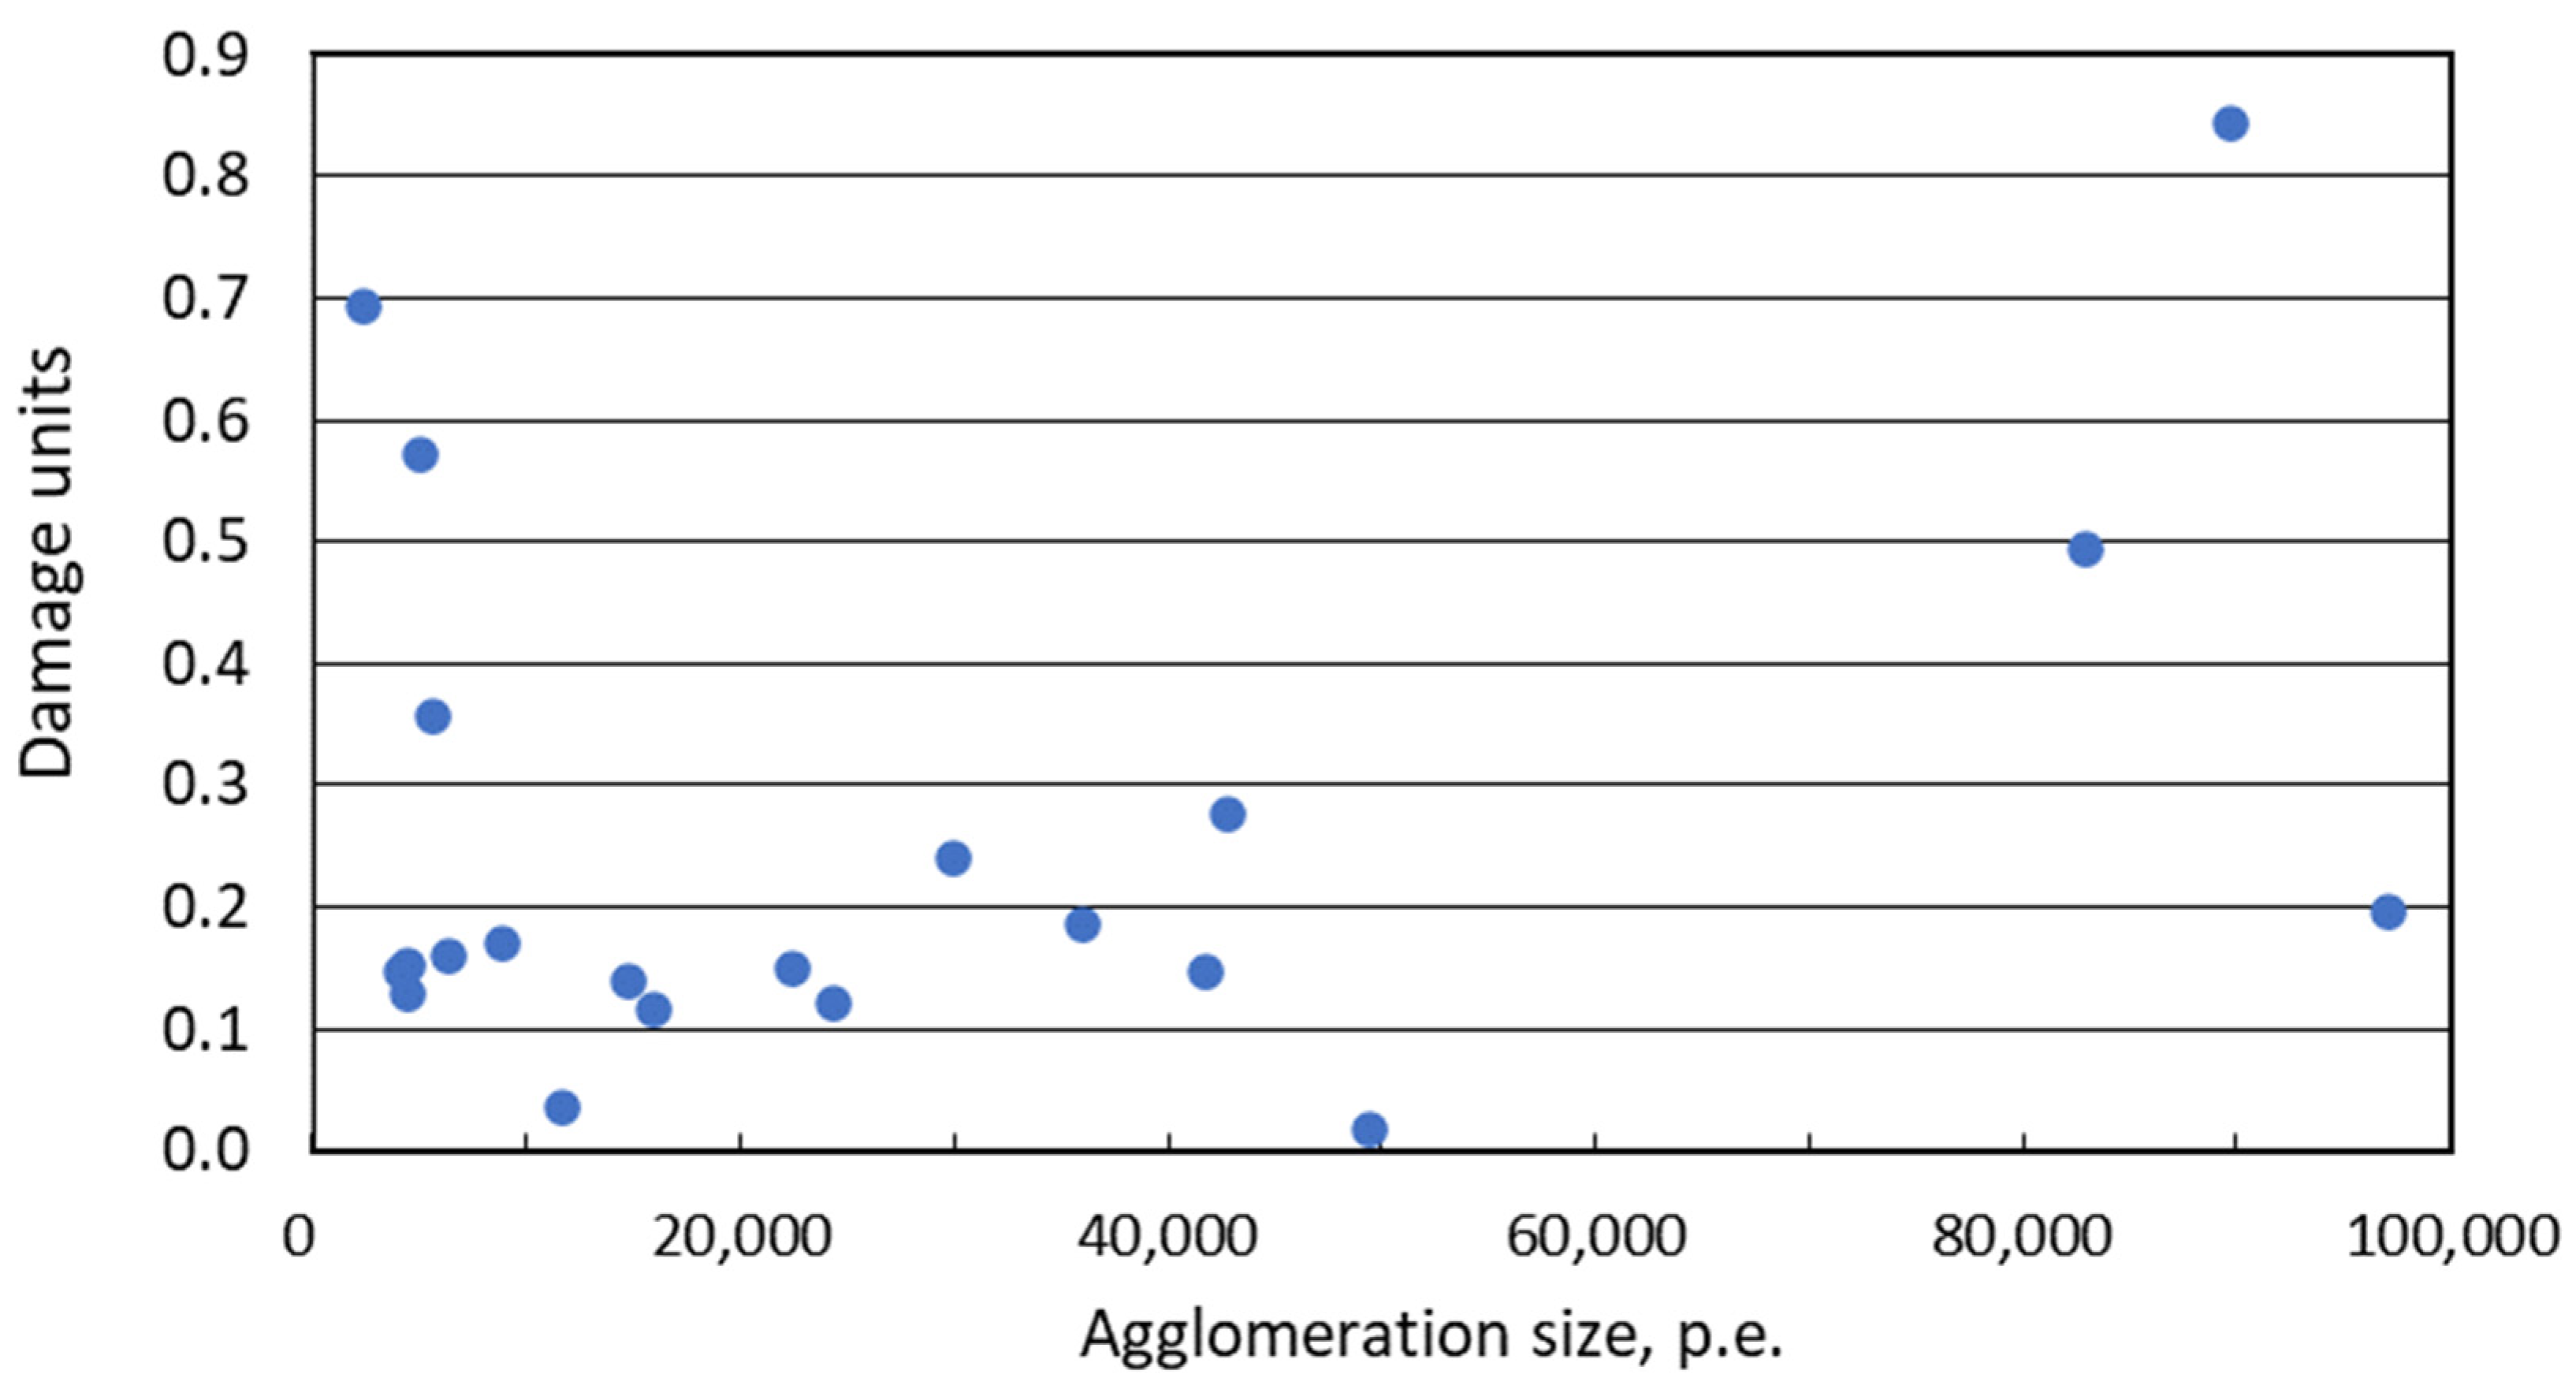
3.2.4. Pollutant Content Indicator for the Recovered Sewage Sludge

Pollutant content for the recovered sewage sludge was calculated according to the damage units approach [21,38], the essence of which is to express pollution as a harmfulness coefficient. The amount (mg/kg) of each metal in the analyzed product is divided by the limit value set for that metal in the product (e.g., in compost or digestate). The resulting quotients are then summed and divided by the amount of P (g/kg) in the product to give a dimensionless value for the indicator.
As limit values, we used the values applicable to sludge category I (Table 3) in accordance with the “Sewage Sludge Management and Utilization Requirements” in force in Lithuania [39]. These values are close to the criteria set for organic fertilizers under the Fertilizer Regulation [40].
Damage units were calculated for sludge transferred by WTTPs for agricultural usage in 2018. This was practiced by one-third of WWTPs, which are greater than 2000 p.e. Sludge holders, i.e., WWTPs, are required to measure the concentrations of heavy metals in the sludge. Our calculations are based on these measurements.
According to the literature, the average damage units per 1 g of P in untreated sewage sludge are approx. 0.5 [21,38]. In the case of Lithuanian WWTPs, the median value was 0.16, which is considerably lower (Figure 10). It is even lower than the average value of 0.23 for the commercial fertilizer single superphosphate [21,38]. Nevertheless, the harmfulness of sludge differed greatly between different treatment plants, with the values of damage units ranging from 0.0175 to 0.84. The result seems to be largely determined by the metal contamination of the wastewater entering the treatment plant. High concentrations of Zn, Cd, and sometimes Hg are most common; in some cases, they even exceed the limit values applicable to sludge category II.
Additionally, the data on median amounts of metals and P in sludge compost and digestates from Lithuanian WWTPs were obtained from a report developed during a country-level study [41]. The calculated damage unit values show that sewage sludge compost (made from digested or undigested sludge from municipal WWTPs by composting with structural materials (green waste, peat, etc.)) and anaerobic digestates from the production of biogas in anaerobic digestion facilities of sewage sludge have indicator values of 0.08, 0.12, and 0.23, respectively (Table 4). However, despite the fact that the values of damage units are low, as it was also in the case with sewage sludge itself, there are cases of high Cd, Cu, and Zn concentrations, especially in digestates [41].
Measurements of metal concentrations in sewage sludge are common, while measurements of organic pollutants are relatively scarse. Micropollutants have been found during various studies: pharmaceuticals, phthalates, especially DEHP, as well as other hazardous organic substances [41,42,43]. However, the picture of Lithuanian sewage sludge contamination or non-contamination with various micropollutants remains fragmented.

3.3. Reuse and Recycling

One of the most obvious ways to reuse treated wastewater from urban wastewater treatment plants is to irrigate agricultural areas [12,44]. In some southern European countries, such as Cyprus, Malta, Greece, Italy, and Portugal, this is already a common practice. The leader is Cyprus, where they reuse 95.4% of treated urban wastewater for irrigation in agriculture or for other uses [2]. There is no such practice in Lithuania thus far. According to [45], only nine farms used water for irrigation in 2019. The total amount of water used was 570 thsd. m3 and accounted for only 0.014% of total water used in agriculture. In total, 45% of irrigation water was taken from surface water bodies and the rest from wells.
The situation is the same with the recycling of treated wastewater, in that it is currently zero; i.e., the use of purified wastewater for drinking purposes is not practiced.

3.4. Recovery

Sewage, including the water itself and the sludge generated during its treatment, has a considerable potential for the recovery of the materials and energy it contains [14,46]. In terms of recovery of materials, perhaps the best known is the return of nutrients to their cycles through spreading on the soil as well as the extraction of phosphorus itself [12,38,47]. Energy can also be recovered from wastewater. In this case, the production and use of biogas for energy generation is the most widely used choice [48]. Recovery of these resources from Lithuanian WWTPs is examined further in more detail. However, in fact, a much wider variety of materials, such as biopolymers, cellulose, and metals, can be recovered from wastewater [4,7,49,50]. Energy can also be recovered not only through biogas, but also, for example, the heat from the effluent can be used [7,51]. Unfortunately, we did not find any examples of such recoveries in Lithuanian wastewater treatment plants.

3.4.1. Nutrient Recovery

Nutrients are returned to the economic cycle in Lithuania through the use of sewage sludge for fertilization in agriculture (29.9% of sludge in 2020), as well as through its use in compost production (20.8% in 2020) (see Table 5 in Section 3.4.2).
Nitrogen concentrations in sludge from wastewater treatment plants that transferred sludge for agricultural use in 2018 ranged from 1.6% to 8.2%; the average was 5%. In this way, approximately 794 Mg of nitrogen per year was recovered via the agricultural use of sludge. Analogous phosphorus concentrations in 2018 ranged from 0.74% to 3.9%, and the average was 1.8%. Approximately 286 Mg of phosphorus per year was recovered via the agricultural use of sludge.
Thus far, there is not a single wastewater treatment plant in the country that has introduced nitrogen and phosphorus recovery technology. There are also no legal requirements that would encourage the introduction of such technologies in Lithuania.

3.4.2. Sewage Sludge Processing

Approximately 40,000–44,000 Mg of sewage sludge is generated in Lithuania per year, which is ~14.7 kg per year per capita. This is very similar to Poland (14–15 kg/capita) but less compared to Germany or Austria (~25 kg/capita). However, taking into account the percentage of the population connected to the centralized wastewater collection and treatment, the amount of sludge generated per capita in both Lithuania and Poland is approaching that in the above-mentioned countries: 19.3 kg/capita in Lithuania and 20.7 kg/capita in Poland [52]. Sludge management solutions have changed dramatically over the past two decades. Initially, when the network of municipal sewage treatment plants in the country began to expand, most of the sludge simply ended up in sludge polygons and was stored there. Sludge management solutions were sought [53,54]; according to the adopted decisions, sludge digestion and drying facilities were installed. A significant part of the sludge was expected to be incinerated. Sludge drying and granulation started. However, for a long time, there were no suitable facilities for sludge incineration, and only in 2017 was a small proportion (0.3%) of the sludge incinerated for the first time [23,54]. This percentage is increasing rapidly (Table 5). The sludge is incinerated in a cement kiln, together with other waste and fuel, but there are no mono-incinerators in the country as of yet. A significant proportion of the sludge is used in agriculture and in compost production together with green waste.
Table 5. Sludge generation and processing. Compiled based on [55,56].
Year Agricultural UseCompostIncinerationLandfillOther
Mg/YearMg/Year%Mg/Year%Mg/Year%Mg/Year%Mg/Year%
201844,191.64215,891.65936.017,510.039.61884.1604.33401.7987.75504.02512.5
201939,944.58715,052.42237.716,790.042.01844.9664.63618.7129.12638.4876.6
202041,048.06112,288.54929.98553.13020.814,431.16535.21650.1174.04125.110.0

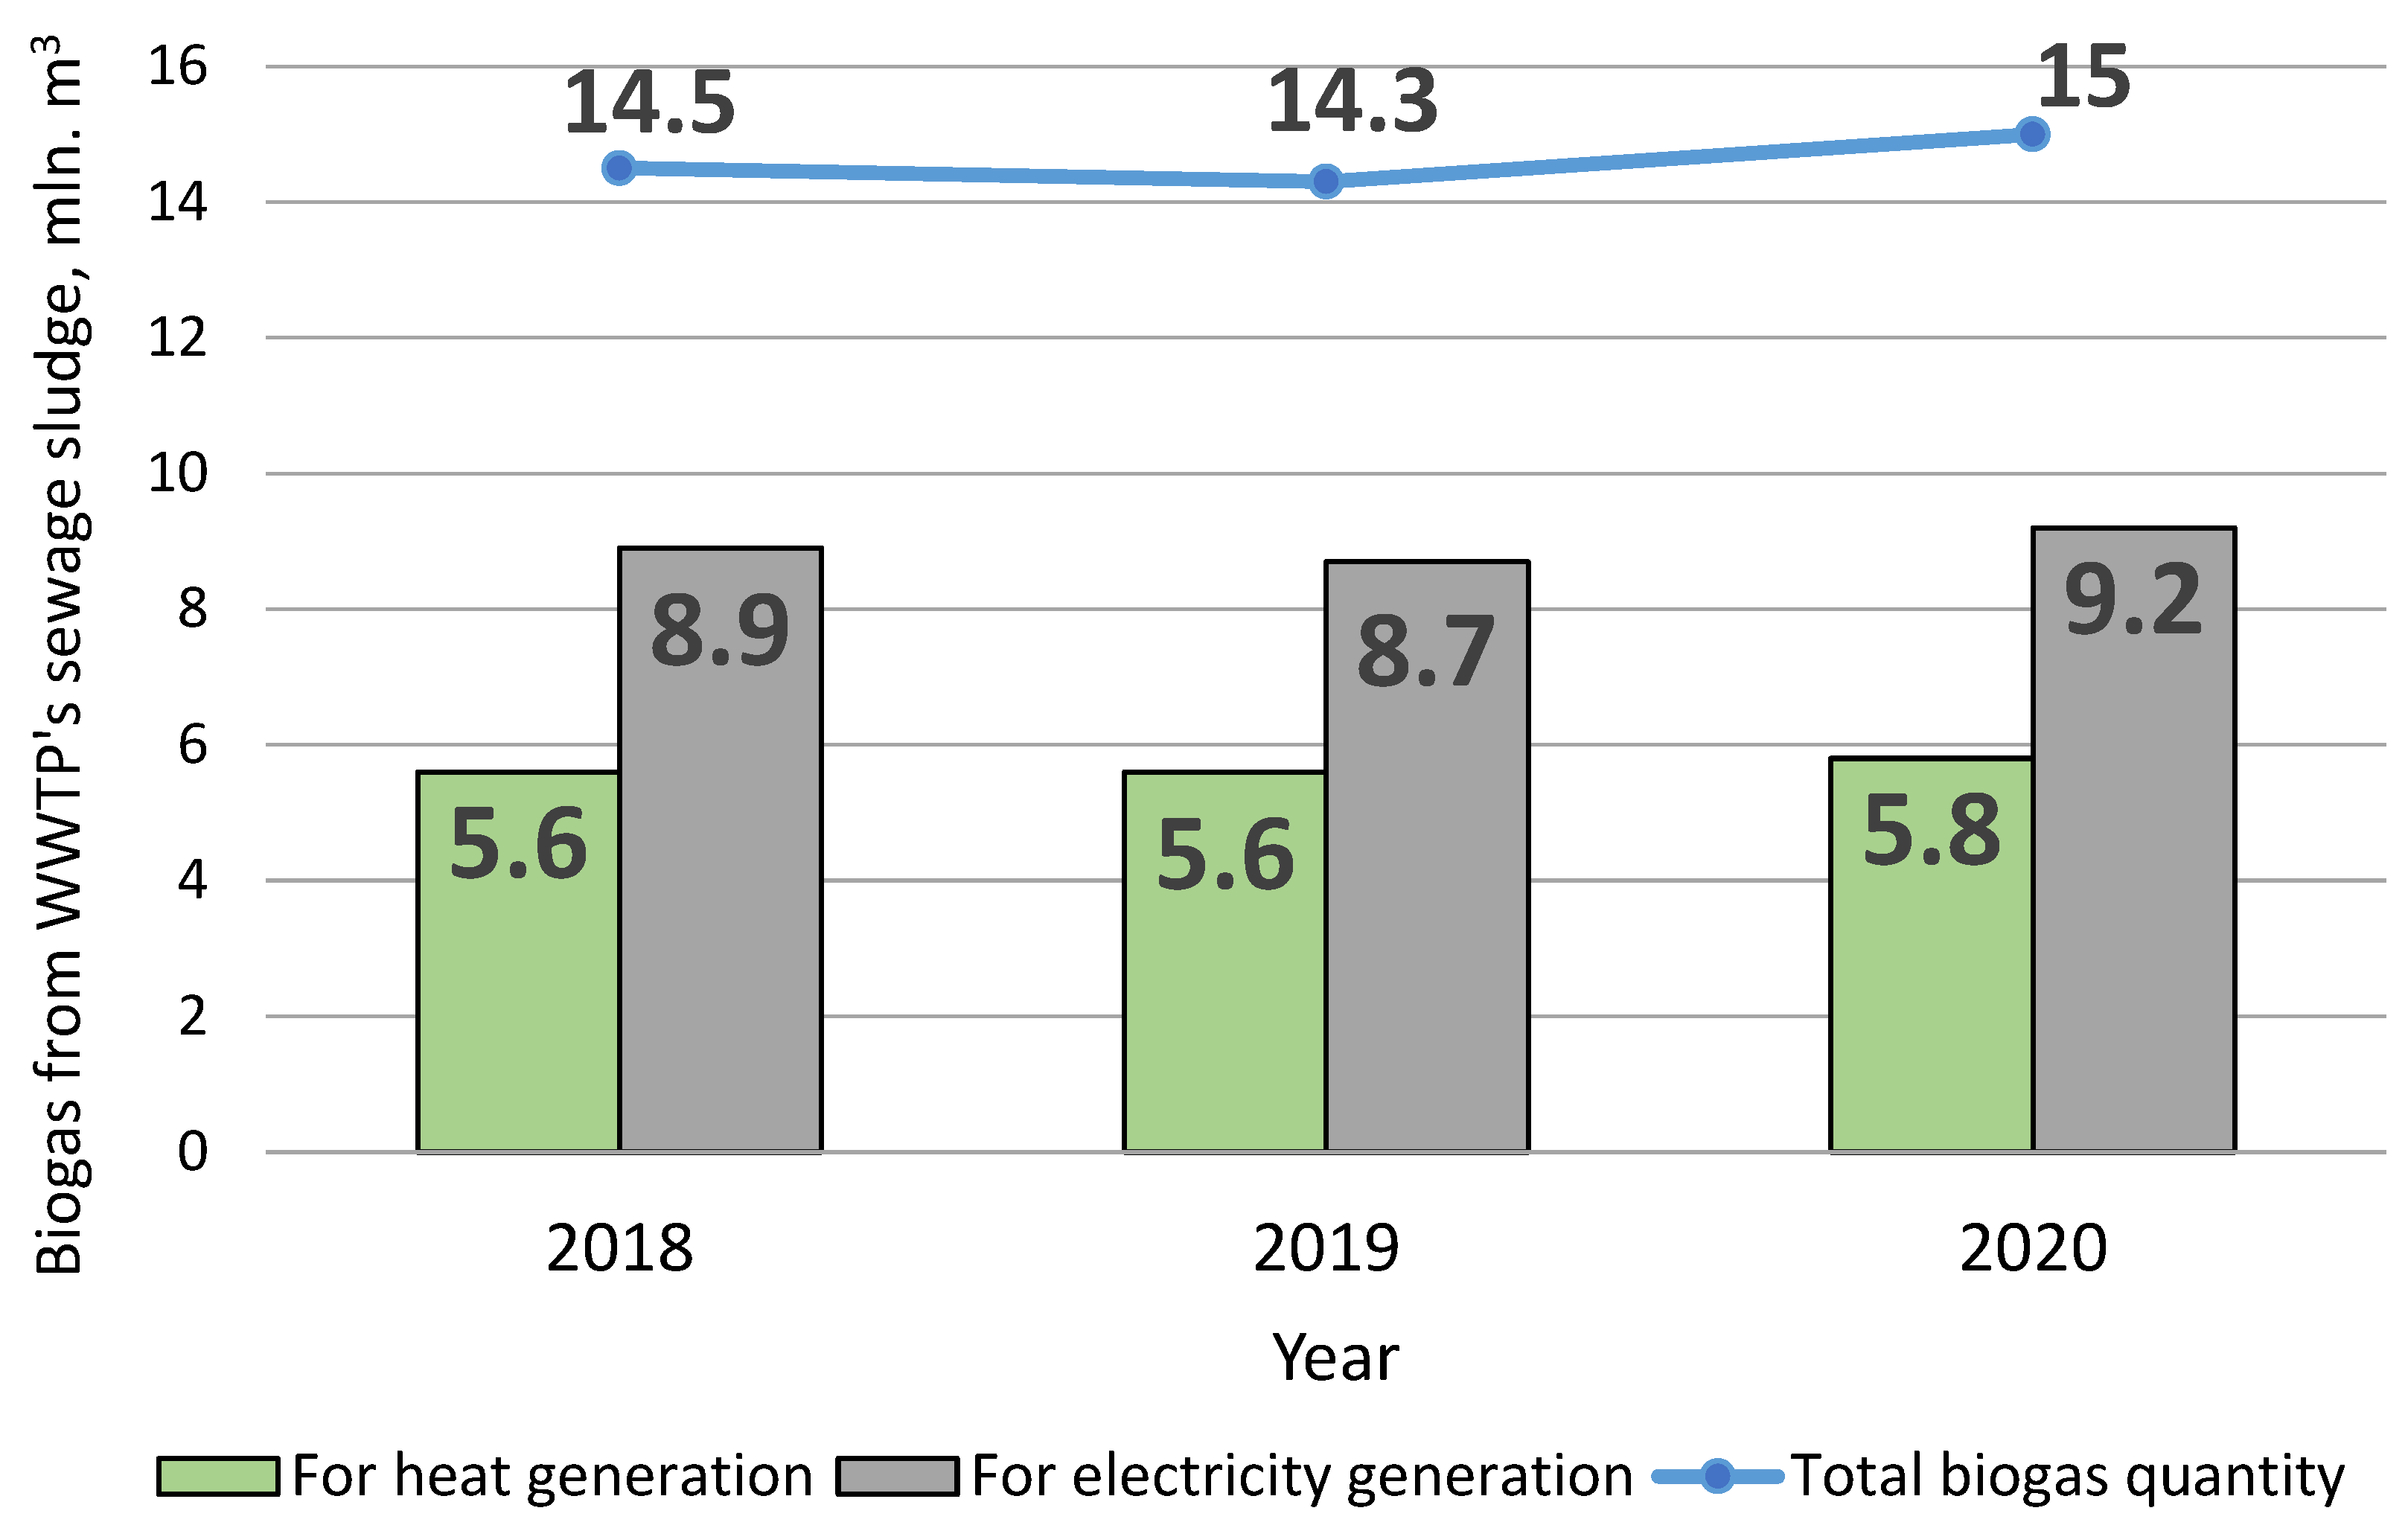
3.4.3. Biogas Production

Sewage sludge is also utilized in biogas production. Biogas can be produced via anaerobic digestion from sewage sludge, municipal waste, and animal waste rich in organic matter [48]. Biogas contains 60–67% methane and 30–33% carbon dioxide [57], and is considered to be a renewable energy source that can be used in the production of electricity and heat [48].
There are 13 biogas power plants operating in Lithuania, which produce 15 million m3 of biogas per year from sewage sludge [16,58]. The biogas is then converted into electricity (60%) and heat (40%) (Figure 11) [58]. All of this renewable energy accounts for only up to 1% of Lithuania’s total renewable energy [59].

4. Discussion

The assessment of circularity according to the CE options for the water and wastewater sector showed a rather diverse situation in Lithuania concerning different options and according to different indicators. A very general assessment is that the country’s wastewater sector is more or less implementing well the provisions of the European legal requirements, which have also been transposed into the Lithuanian legal framework. At the same time, there are almost no additional solutions that could constitute bolder steps in implementing a circular economy. As for prevention, the situation with water demand and wastewater generation is stable and good. However, increasing water consumption in households needs to be addressed. It is gratifying that per capita water consumption in Lithuania is lower than for many other European countries, but the upward trend is unfavorable. This is where the link with the use of water for irrigation comes into play, as it is the need for irrigation that largely determines the increased demand for water. Climate change is likely to exacerbate this need not only on private estates but also in agriculture. Thus far, irrigation in agriculture is rarely practiced, but it is only a matter of time before that situation changes. The private sector should seize the opportunities to store and use rainwater as well as unpolluted domestic water for irrigation. Here, we are faced with the need to “Rethink”; water prevention options exist, they simply need to be promoted and implemented. Meanwhile, for agriculture, to “Rethink” could mean even greater changes in the long run by using treated wastewater for irrigation. Unsurprisingly, most examples of good practice in water reuse or recycling come from countries facing water scarcity [7]. Lithuania has sufficient fresh water resources and, therefore, has no natural incentive to reuse and recycle water. Given the sufficient availability of good-quality water, it is unlikely that recycled water will be used for drinking purposes in Lithuania in the short term. It is difficult to expect the recycling of wastewater into drinking water to be accepted by the country’s society, and the application of expensive sophisticated technologies will be unlikely to pay off [7]. However, individual solutions, such as supplying car washes with treated water from WWTPs, are entirely possible.
Relatively little attention has been paid in Lithuania to the prevention of pollution by hazardous chemicals although action in this area is gradually increasing [42,60,61]. Legislation on the requirements for the reduction and elimination of pollution by priority and priority hazardous substances, the development of River Basin District Management Plans (RBMPs) under the Water Framework Directive, and the implementation of the REACH Regulation are encouraging the action [62,63]. Assessment of the situation during the preparation of the RBMPs shows that discharges of priority and priority hazardous substances continue; there are sections of rivers that do not meet the requirements of good quality [17]. Therefore, there is still a great deal of room for preventive solutions to reduce the use of hazardous chemicals in manufacturing processes and in the products from which they enter wastewater.
The importance of the prevention of hazardous substances is also confirmed by the quality of sewage sludge. Although the calculated indicator values expressed in damage units are small even compared to those of commercial fertilizers, there are still cases whre the pollution of sludge with metals, mostly cadmium and zinc, reaches such values that the use of sludge in agriculture becomes problematic. This use in Lithuania is subject to strict requirements to ensure that there is no risk to the environment and human health [39]. Nevertheless, namely the use of sludge in agriculture and composting constitutes the most popular sludge management solutions in the country. Sludge management practices vary widely across the EU; in other words, there is no uniform prevailing model. For example, in 2018, Spain used as much as 87% of its sludge for agricultural purposes, Hungary composted 71.5%, Germany incinerated 73.5%, and Romania landfilled 52.2%. Still, most countries combine different solutions and do not have a single dominant one. Looking at Lithuania’s neighboring countries, their sludge was managed in 2018 as follows [64]:
  • Latvia: 17.4% for agriculture, 35.9% for compost, 44.4% for other processing;
  • Poland: 20.3% for agriculture, 4.3% for compost, 19.1% incinerated, 54% other;
  • Sweden: 38.3% for agriculture, 25.5% for compost, 1.3% incinerated, 27.1% other.
Thus, in neighboring countries as well as in Lithuania, the use of sludge for agriculture and compost is significant, and incineration is equally important in Poland. Interestingly, all neighboring countries identify a significant proportion of sludge management decisions as “other”. At least in the case of Poland, this has been identified as a failure in the municipal sewage sludge system [51]. The choice of sewage sludge management solutions is not an easy issue, which is why the strategic documents being prepared do not always answer all the relevant questions. The Strategy for Municipal Sewage Sludge Treatment was adopted in Poland in 2018, but according to [51], it is not a coherent and comprehensive document; although recommendations have been made to increase the amount of processed sludge before it enters the environment and also to increase incineration, no recommendations have been made as to how to implement this. In Lithuania, the sludge management program was prepared back in 2006 [53], according to which sludge management solutions were developed, and sludge drying and granulation were introduced. The disadvantage of the Lithuanian program and its solutions was that the sludge prepared for incineration simply had nowhere to be incinerated, i.e., only part of the technical solution chain was implemented rather than the entire required chain. Another important point is that the amount of energy obtained by incinerating the sludge is approximately equal to the amount of energy used to prepare (dry) and incinerate the sludge; thus, the energy balance is approximately zero. As a result, many WWTPs have suffered financial losses. The main goal achieved using these sludge treatment technologies was to reduce the amount of sludge. It was noted when developing the Lithuanian Circular Economy Roadmap that such incineration of sewage sludge is a lost opportunity to recover valuable materials [65]. At the same time, the National Waste Prevention and Management Plan for 2021–2027 notes that the ash from the sludge, which is burned in a cement plant, is used immediately to produce cement, which is the case for waste-free production. The Plan also emphasizes the goal of maximizing the energy potential of the sludge and the nutrients it contains. When choosing the method and processes of sewage sludge treatment, it is suggested to give priority to those that enable sludge composting as well as biogas production [66].
Nutrient recovery is increasingly being discussed and applied in different countries, but there is still a lack of legal and economic drivers for its truly widespread application [4,12,38]. Germany and Switzerland, where legal drivers are already in place, can be mentioned as exceptions [12]. Even in neighboring Poland, which has large-capacity sewage treatment plants and has carried out a number of research projects on nutrient recovery, P recovery technologies are only just beginning to be introduced. In small Lithuania as well as Latvia and Estonia, this would be an expensive solution at this stage, and it is more realistic to develop composting and nutrient recovery through the use of compost, as envisaged in the National Waste Prevention and Management Plan for 2021–2027. An interesting example of the application of the circular economy was implemented at the Vilnius WWTP, from which the dried sludge as well as the ash from the biofuel power plant was directed to the fertilization of energy plant plantations. In turn, those plants were later sent back to a biofuel power plant as a fuel. In their estimation, this allowed for the recycling of ~135 Mg of P per year. However, again, even such a solution is hardly profitable [67].
While currently, the resource recovery from WWTPs in Lithuania is largely limited to nutrients via sludge application in agriculture and composting and energy recovery due to biogas production, the potential to recover materials and energy under the ideal conditions is presented in Table 6. That is, the maximum potential was calculated; in reality, even trying to exploit it in full, it would be reduced depending on the recovery technologies used. These maximum potentials were matched to the country’s current demand/consumption. The calculations were based on data from 2019 and include all municipal WWTPs and not only those larger than 2000 p.e.
The wastewater treated at WWTPs, if fully recovered, would cover about 61% of the country’s water demand. By comparison, in the Netherlands, the potential is only up to 20%, because of water being used in agriculture and not reaching the WWTPs, while in Singapore, a 40% recovery has actually been achieved [7].
WWTPs themselves use the energy to carry out the treatment processes, and it is possible to recover the energy that is used for the purposes of the treatment plant itself, while the rest is transferred to the grid. The following assumptions, identical to [7], which allows to make the comparisons, were made in the calculations: all COD enters an anaerobic digester whith a recovery of 80%; the electricity conversion efficiency is 38%, and the heat conversion efficiency is 40% at the combined heat and power plant (CHP); the change in temperature is 4 °C, and the heat pump operates continuously when recovering heat from the effluents. The results of the calculations show that energy from WWTPs can potentially cover a small but still significant part of the country’s energy demand: 2.2% of gas demand, 7% of electricity, and 3.4% of heat, due to biogas production and the use at CHPs. Heat recovery potential from the effluent itself reaches as much as 55% of the derived heat demand in the country. These estimates are similar or even higher compared to those for the Netherlands [7], apparently reflecting the lower energy consumption per capita in Lithuania.
The total influent N is 9.2% of the nitrogen applied in agriculture with mineral fertilizers. The total influent P is 10.9% of the phosphorus applied in agriculture with mineral fertilizers. In reality, depending on the technology used, the recovery potential for nitrogen and phosphorus is lower. However, compared to the current amounts of N and P recovered now through the direct use of sludge in agriculture, the potential is approximately three times greater.
“Analysis of circularity of the Lithuanian industry” has noted the importance of preventing discharges; in fact, materials are lost via dispersion to the environment when they are discharged to water bodies [64]. Lithuania has done much to improve wastewater management, but currently, there are, again, issues related to overloads of certain WWTPs and the increasing share of insufficiently treated effluents containing excess amounts of N and P [17,73]. Point-sources represent 4% of the N load and 13% of the P load in the total load from Lithuania to the Baltic Sea [74]. Even if this may not look like much, analysis also has points to possibilities to decrease that load.

5. Conclusions

Our analysis, which aimed to assess the circularity and potential of the wastewater sector in Lithuania, revealed the achievements and shortcomings that should be focused on in the further development of this sector:
-
In terms of prevention, water consumption and the resulting amounts of sewage and sludge are not currently a concern. Water productivity is rising, and household water consumption is among the lowest in the EU. However, there is a tendency for household consumption to start increasing, so there is a need for intervention and the promotion of prevention measures given that one of the reasons for this increase is the use of water for irrigation.
-
There is no reuse and recycling of wastewater in Lithuania, and given that the country has sufficient water resources, including high-quality groundwater, it is difficult to expect large-scale reuse and recycling in the near future. Still, it is worthwhile and possible to plan reuse cases, such as water for car washing. In the long term, if the need for irrigation increases due to climate change, the possibilities for reusing water in agriculture will need to be assessed.
-
The implementation of EU directives and financial support has led to a significant qualitative change in the wastewater sector in Lithuania over the past two decades. Connections to centralized wastewater collection networks have tripled. However, the process of connecting to centralized collection and treatment is not yet complete, especially in smaller agglomerations, and needs to be continued.
-
For the time being, there is a limited focus, albeit an increasing one, on the pollution of wastewater with hazardous chemicals, both by preventing such pollution through the avoidance of these substances in production processes and products and by applying advanced technologies for the treatment of these substances in WWTPs. Undoubtedly, this issue should receive further attention.
-
The removal of nutrients from wastewater is crucial for the prevention of eutrophication in the Baltic Sea. Much progress has also been made here over the last two decades. In 2002, only 21% of wastewater was sufficiently treated, and in 2012, it was already 97.8%. Unfortunately, by 2020, the share of sufficiently cleaned wastewater fell to 71.7%. This was largely due to a lack of timely response to the redistribution and concentration of the population and industry in larger centers, meaning that some sewage treatment plants were subjected to higher pollution loads than they could handle. Therefore, proper forecasting, planning, and timely response to change is very important. It is true that the reconstruction of problematic WWTPs is currently underway, but timely planning should allow us to avoid temporary discrepancies in the required quality of treatment.
-
The main solutions for the use of sludge are in agriculture and composting. Approximately one-third of the N and P potential is recovered through agricultural use, which is considerable. The National Waste Prevention and Management Plan provides for the promotion of sludge composting and biogas production, which are to be considered as appropriate solutions. Applying recovery technologies would be a costly solution for the time being given that the majority of WWTPs in Lithuania are smaller than 100,000 p.e. As technology evolves and becomes cheaper, the application of P recovery technologies should primarily be considered in those five treatment plants that are larger than 100,000 p.e.
-
The amount of sludge incinerated is increasing rapidly. Some of the sludge is incinerated in a cement plant, where the ash is immediately used to make cement. Still, all other sludge is incinerated using only energy recovery, but considering that the technology used in the country’s wastewater treatment plants consumes a great deal of energy for sludge drying and granulation, the overall energy balance is more or less zero. Hence, the only benefit is a reduction in the amount of sludge. At this point, essential solutions are needed to avoid losing both energy and material potential as well as to assess the feasibility of mono-incineration plants with P recovery.
-
It is estimated that under ideal conditions, WWTPs can potentially cover 2.2% of the national gas demand, as much as 7% of electricity, and 3.4% of heat, due to biogas production and subsequent use at CHPs. Heat recovery potential from the effluent itself could reach as much as 55% of the derived heat demand in the country. N and P in the inflowing water make up 9.2% and 10.9% of the nitrogen and phosphorus content that is applied to agricultural fields with mineral fertilizers, respectively.
-
Examples of wastewater treatment plants being used as “biorefineries” and “interesting” materials being produced have not been identified. This is still the case for future decisions.
-
The performed analysis provided an overall picture, but it is not detailed enough to justify specific decisions. Decisions on the implementation of specific circularity solutions will need to be based on a thorough analysis of material and energy flows covering not only the wastewater sector but also other sectors with which WWTPs could share materials and energy in the country’s regions.

Author Contributions

Both authors contributed equally to the research presented in this paper. More specifically, J.K. created the research design, while M.Ž. collected the data. Both authors participated equally in performing calculations and data analysis. J.K. was the main text writer, with comments and contributions from M.Ž. All authors have read and agreed to the published version of the manuscript.

Funding

The study was developed under the project: “Monitoring of water and sewage management in the context of the implementation of the circular economy assumptions” (MonGOS), no. PPI/APM/2019/1/00015/U/00001/ZU/00002 (2020–2022), financed by the Polish National Agency for Academic Exchange (NAWA) under the International Academic Partnerships Program.

Institutional Review Board Statement

Not applicable.

Informed Consent Statement

Not applicable.

Data Availability Statement

Not applicable.

Conflicts of Interest

The authors declare no conflict of interest.

References

  1. European Commission. Council Directive 91/271/EEC of 21 May 1991 Concerning Urban Waste-Water Treatment; Commission of European Communities: Brussels, Belgium, 1991. [Google Scholar]
  2. Country Profiles on Urban Waste Water Treatment. Available online: https://water.europa.eu/freshwater/countries/uwwt (accessed on 20 March 2022).
  3. Kacprzak, M.J.; Kupich, I. The specificities of the circular economy (CE) in the municipal wastewater and sewage sludge sector—local circumstances in Poland. Clean. Technol. Environ. Policy 2021, 1–17. [Google Scholar] [CrossRef]
  4. Van der Hoeka, J.P.; de Fooija, H.; Strukera, A. Wastewater as a resource: Strategies to recover resources from Amsterdam’s wastewater. Resour. Conserv. Recycl. 2016, 113, 53–64. [Google Scholar] [CrossRef] [Green Version]
  5. Bairq, Z.A.S.; Li, R.; Li, Y.; Gao, H.; Sema, T.; Teng, W.; Kumar, S.; Liang, Z. New advancement perspectives of chloride additives on enhanced heavy metals removal and phosphorus fixation during thermal processing of sewage sludge. J. Clean. Prod. 2018, 188, 185–194. [Google Scholar] [CrossRef]
  6. Afridi, Z.U.R.; Jing, W.; Younas, H. Biogas Production and Fundamental Mass Transfer Mechanism in Anaerobic Granular Sludge. Sustainability 2019, 11, 4443. [Google Scholar] [CrossRef] [Green Version]
  7. Kehrein, P.; van Loosdrecht, M.; Osseweijer, P.; Garfí, M.; Dewulf, J.; Posada, J. A critical review of resource recovery from municipal wastewater treatment plants—Market supply potentials, technologies and bottlenecks. Environ. Sci. Water Res. Technol. 2020, 6, 877–910. [Google Scholar] [CrossRef] [Green Version]
  8. European Commission. Evaluation of the Urban Waste Water Treatment Directive; European Commission: Brussels, Belgium, 13 December 2019; 179p. [Google Scholar]
  9. European Commission. Council Directive 86/278/EEC of 12 June 1986 on the Protection of the Environment, and in Particular of the Soil, When Sewage Sludge Is Used in Agriculture; European Commission: Brussels, Belgium, 1986. [Google Scholar]
  10. Pedersen, K.E.; Brandt, K.K.; Hansen, M.; Cedergreen, N.; Magid, J. Assessment of Risks Related to Agricultural Use of Sewage Sludge, Pig and Cattle Slurry; University of Copenhagen: Copenhagen, Denmark, 2019; p. 142. [Google Scholar]
  11. Ivanová, L.; Mackuľak, T.; Grabic, R.; Golovko, O.; Koba, O.; Vojs Staňová, A.; Szabová, P.; Grenčíková, A.; Bodík, I. Pharmaceuticals and illicit drugs—A new threat to the application of sewage sludge in agriculture. Sci. Total Environ. 2018, 634, 606–615. [Google Scholar] [CrossRef]
  12. Smol, M.; Preisner, M.; Bianchini, A.; Rossi, J.; Hermann, L.; Schaaf, T.; Kruopienė, J.; Pamakštys, K.; Klavins, M.; Ozola-Davidane, R.; et al. Strategies for sustainable and circular management of phosphorus in the Baltic sea region: The holistic approach of the InPhos project. Sustainability 2020, 12, 2567. [Google Scholar] [CrossRef] [Green Version]
  13. European Parliament. Regulation (EU) 2020/741 of the European Parliament and of the Council of 25 May 2020 on Minimum Requirements for Water Reuse; European Parliament: Brussels, Belgium, 2020. [Google Scholar]
  14. Smol, M.; Adam, C.; Preisner, M. Circular economy model framework in the European water and wastewater sector. J. Mater. Cycles Waste Manag. 2020, 22, 682–697. [Google Scholar] [CrossRef] [Green Version]
  15. European Parliament. Directive 2008/98/EC of the European Parliament and of the Council of 19 November 2008 on Waste and Repealing Certain Directives; European Parliament: Brussels, Belgium, 2008. [Google Scholar]
  16. Environmental Protection Agency. Implementation of Urban Waste Water Treatment Directive. Available online: https://aaa.lrv.lt/lt/veiklos-sritys/vanduo/nuoteku-tvarkymas/miesto-nuoteku-valymo-direktyvos-igyvendinimas (accessed on 20 March 2022). (In Lithuanian).
  17. Environmental Protection Agency. 2022–2027 River Basin District Management Plans and Programmes. Reference Material for RBD Management Plans. Baseline Scenario of the Nemunas RBD. Available online: https://aaa.lrv.lt/lt/veiklos-sritys/vanduo/upes-ezerai-ir-tvenkiniai/vandens-valdymas-upiu-baseinu-rajonu-principu/2022-2027-m-upiu-baseinu-rajonu-valdymo-planai-ir-priemoniu-programos (accessed on 20 March 2022). (In Lithuanian).
  18. Eurostat. Population Connected to at Least Secondary Waste Water Treatment. Available online: https://ec.europa.eu/eurostat/databrowser/view/sdg_06_20/default/table?lang=en (accessed on 20 March 2022).
  19. European Commission. The European Green Deal; European Commission: Brussels, Belgium, 2020. [Google Scholar]
  20. European Commission. A New Circular Economy Action Plan for a Cleaner and More Competitive Europe; European Commission: Brussels, Belgium, 2019. [Google Scholar]
  21. Preisner, M.; Smol, M.; Horttanainen, M.; Deviatkin, I.; Havukainen, J.; Klavins, M.; Ozola-Davidane, R.; Kruopienė, J.; Szatkowska, B.; Appels, L.; et al. Indicators for resource recovery monitoring within the circular economy model implementation in the wastewater sector. J. Environ. Manag. 2022, 304, 114261. [Google Scholar] [CrossRef]
  22. Official Statistics Portal. Average Annual Population. Available online: https://osp.stat.gov.lt/statistiniu-rodikliu-analize?indicator=S3R633#/ (accessed on 20 March 2022).
  23. Environmental Protection Agency. Informing the Public about Sewage and Sludge Processing in Accordance with Article 16 of Council Directives Directive 91/271/EEC Concerning Urban Waste Water Treatment. Report. Available online: https://failai.gamta.lt/files/Visuomen%C4%97s%20informavimo%20ataskaita_2019.pdf (accessed on 20 March 2022). (In Lithuanian).
  24. Environmental Protection Agency. Wastewater Treatment Data. Available online: https://aaa.lrv.lt/lt/veiklos-sritys/vanduo/nuoteku-tvarkymas/nuoteku-tvarkymo-apskaitos-duomenys (accessed on 20 March 2022). (In Lithuanian).
  25. Environmental Protection Agency. Water Use data. Available online: https://aaa.lrv.lt/lt/veiklos-sritys/vanduo/vandens-paemimas-ir-naudojimas/vandens-naudojimo-apskaitos-duomenys (accessed on 20 March 2022). (In Lithuanian).
  26. Eurostat. Water Use by Supply Category and Economical Sector. Available online: https://ec.europa.eu/eurostat/databrowser/view/ENV_WAT_CAT__custom_2369043/default/table?lang=en (accessed on 20 March 2022).
  27. Eurostat. Water Productivity. Available online: https://ec.europa.eu/eurostat/databrowser/view/t2020_rd210/default/table?lang=en (accessed on 20 March 2022).
  28. Lithuanian Ministry of Environment. Investment Project (Feasibility Study) “Development and Implementation of a Wastewater Management Information System”, UAB “IO projects”, 2020; p. 169. Available online: https://am.lrv.lt/uploads/am/documents/files/NTIS%20IP%20final.pdf (accessed on 20 March 2022). (In Lithuanian).
  29. State Audit Report. Water Supply and Sewage Treatment. 2020, p. 60. Available online: https://www.valstybeskontrole.lt/LT/Product/23961/vandens-tiekimas-ir-nuoteku-tvarkymas (accessed on 20 March 2022). (In Lithuanian).
  30. Magdum, A.; Kalyanraman, V. Existing biological nitrogen removal processes and current scope of advancement. Res. J. Chem. Env. World Res. J. 2017, 21, 43–53. [Google Scholar]
  31. Ministry of Environment. On the Approval of the Wastewater Treatment Regulation; Order No. D1-236 of 17 May 2006; Ministry of Environment: Vilnius, Lithuania, 2006. [Google Scholar]
  32. Sattayatewa, C.; Pagilla, K.; Pitt, P.; Selock, K.; Bruton, T. Organic nitrogen transformations in a 4-stage Bardenpho nitrogen removal plant and bioavailability/biodegradability of effluent DON. Water Res. 2009, 43, 4507–4516. [Google Scholar] [CrossRef]
  33. Preisner, M.; Smol, M.; Szołdrowska, D. Trends, insights and effects of the Urban Wastewater Treatment Directive (91/271/EEC) implementation in the light of the Polish coastal zone eutrophication. Environ. Manag. 2021, 67, 342–354. [Google Scholar] [CrossRef] [PubMed]
  34. Ahn, C.H.; Park, J.K. Critical Factors Affecting Biological Phosphorus Removal in Dairy Wastewater Treatment Plants. KSCE J. Civ. Eng. 2008, 12, 99–107. [Google Scholar] [CrossRef]
  35. Pitman, A.R. Design considerations for nutrient removal activated sludge plants. Wat. Sci. Technol. 1991, 23, 781–790. [Google Scholar] [CrossRef]
  36. Randall, C.W.; Barnard, J.L.; Stensel, H.D. Design and Retrofit of Wastewater Treatment Plants for Biological Nutrient Removal; Technomic Publishing Company: Lancaster, PA, USA, 1992; p. 420. [Google Scholar]
  37. Budrys, R.P.; (Kaunas University of Technology, Kaunas, Lithuania). Personal Communication, 2022.
  38. Egle, L.; Rechberger, H.; Krampe, J.; Zessner, M. Phosphorus recovery from municipal wastewater: An integrated comparative technological, environmental and economic assessment of P recovery technologies. Sci. Total Environ. 2016, 571, 522–542. [Google Scholar] [CrossRef] [Green Version]
  39. Minister of Environment of the Republic of Lithuania. Order of the Minister of Environment of the Republic of Lithuania No. 349 “On Approval of Requirements for the Treatment and Use of Sewage Sludge”, of 29 June 2001, with Amendments. Minister of Environment of the Republic of Lithuania: Vilnius, Lithuania, 2001. Available online: https://www.e-tar.lt/portal/legalAct.html?documentId=e1a5c100bcf411eab9d9cd0c85e0b745 (accessed on 20 March 2022). (In Lithuanian).
  40. European Parliament. Regulation (EU) 2019/1009 of the European Parliament and of the Council of 5 June 2019 Laying down Rules on the Making Available on the Market of EU Fertilising Products; European Parliament: Brussels, Belgium, 2019. [Google Scholar]
  41. Lithuanian Ministry of Environment. Development of Requirements (Criteria) for Products Manufactured from Biodegradable Waste; Agrochemical Research Laboratory, UAB EcoIri Solution: Vilnius, Lithuania, 2015; p. 131. (In Lithuanian) [Google Scholar]
  42. Anne, O.; Paulauskiene, T. The Assessment of the Sewage and Sludge Contamination by Phthalate Acid Esters (PAEs) in Eastern Europe Countries. Sustainability 2021, 13, 529. [Google Scholar] [CrossRef]
  43. Lithuanian EPA, SYKE, Lithuanian MoE. Report on Hazardous Substances in the Aquatic Environment of Lithuania; Lithuanian EPA, SYKE, Lithuanian MoE: Vilnius, Lithuania, 2007; p. 55. (In Lithuanian) [Google Scholar]
  44. European Commission. The Potential of Water Reuse for Agricultural Irrigation in the EU; JRC Science for Policy Report; European Commission: Brussels, Belgium, 2017; p. 84. [Google Scholar]
  45. Environmental Protection Agency. Economic Analysis of Water Use. Available online: https://aaa.lrv.lt/uploads/aaa/documents/files/vandens naudojimo ekonomin-Чanaliz-Ч.docx (accessed on 20 March 2022). (In Lithuanian).
  46. Verstraete, W.; Van de Caveye, P.; Diamantis, V. Maximum use of resources present in domestic ‘‘used water”. Bioresour. Technol. 2009, 100, 5537–5545. [Google Scholar] [CrossRef]
  47. Cieslik, B.; Konieczka, P. A review of phosphorus recovery methods at various steps of wastewater treatment and sewage sludge management. The concept of “no solid waste generation” and analytical methods. J. Clean. Prod. 2017, 142, 1728–1740. [Google Scholar] [CrossRef]
  48. Demirbas, A.; Taylan, O.; Kaya, D. Biogas production from municipal sewage sludge (MSS). Energy Sources A Recovery Util. Environ. Eff. 2016, 38, 3027–3033. [Google Scholar] [CrossRef]
  49. Guerra-Rodríguez, S.; Oulego, P.; Rodríguez, E.; Singh, D.N.; Rodríguez-Chueca, J. Towards the Implementation of Circular Economy in the Wastewater Sector: Challenges and Opportunities. Water 2020, 12, 1431. [Google Scholar] [CrossRef]
  50. Meena, R.A.A.; Yukesh Kannah, R.; Sindhu, J.; Ragavi, J.; Kumar, G.; Gunasekaran, M.; Rajesh Banu, J. Trends and resource recovery in biological wastewater treatment system. Bioresour. Technol. Rep. 2019, 7, 100235. [Google Scholar] [CrossRef]
  51. McCarty, P.L.; Bae, J.; Kim, J. Domestic Wastewater Treatment as a Net Energy Producer. Can This be Achieved? Environ. Sci. Technol. 2011, 45, 7100–7106. [Google Scholar] [CrossRef] [PubMed]
  52. Rosiek, K. Directions and Challenges in the Management of Municipal Sewage Sludge in Poland in the Context of the Circular Economy. Sustainability 2020, 12, 3686. [Google Scholar] [CrossRef]
  53. Sweco BKG. Investment Program for Sludge Management in Lithuania; Feasibility Study; Sweco BKG: Stockholm, Sweden, 2006; p. 159. (In Lithuanian) [Google Scholar]
  54. Praspaliauskas, M.; Pedišius, N. A review of sludge characteristics in Lithuania’s wastewater treatment plants and perspectives of its usage in thermal processes. Renew. Sust. Energ. Rev. 2017, 67, 899–907. [Google Scholar] [CrossRef]
  55. Environmental Protection Agency. Summary Based on Waste Codes. Available online: https://aaa.lrv.lt/lt/veiklos-sritys/atliekos/atlieku-apskaita/atlieku-apskaitos-duomenys/suvestine-pagal-atlieku-kodus (accessed on 20 March 2022).
  56. Eurostat. Sewage Sludge Production and Disposal. Available online: http://appsso.eurostat.ec.europa.eu/nui/show.do?lang=en&dataset=env_ww_spd (accessed on 20 March 2022).
  57. Cao, Y.; Pawłowski, A. Sewage sludge-to-energy approaches based on anaerobic digestion and pyrolysis: Brief overview and energy efficiency assessment. Renew. Sustain. Energy Rev. 2012, 16, 1657–1665. [Google Scholar] [CrossRef]
  58. Official Statistics Portal. Environment, Agriculture and Energy in Lithuania (Edition 2020). Available online: https://osp.stat.gov.lt/lietuvos-aplinka-zemes-ukis-ir-energetika-2020/energetika/atsinaujinantys-energijos-istekliai/ (accessed on 20 March 2022).
  59. Official Statistics Portal. Renewable Fuel Commodities Balances. Available online: https://osp.stat.gov.lt/statistiniu-rodikliu-analize?hash=e69dc4ad-15d0-4d55-a261-96b455a7a20b#/ (accessed on 20 March 2022).
  60. Kruopienė, J.; Dvarionienė, J.; Dudutytė, Z.; Stančė, L.; Buzelytė, J. The use of hazardous chemical substances in Lithuanian industry: How sound is it? J. Clean. Prod. 2014, 72, 89–95. [Google Scholar] [CrossRef]
  61. Baranauskaitė-Fedorova, I.; Dvarionienė, J.; Nikiforov, A. Management of pharmaceutical substances in the environment: Lithuanian case study. Water Sci. Technol. 2016, 74, 1255–1265. [Google Scholar] [CrossRef]
  62. European Parliament. Directive 2000/60/EC of the European Parliament and of the Council of 23 October 2000 Establishing a Framework for Community Action in the Field of Water Policy; European Parliament: Brussels, Belgium, 2000. [Google Scholar]
  63. European Parliament. Regulation (EC) No 1907/2006 of the European Parliament and of the Council of 18 December 2006 Concerning the Registration, Evaluation, Authorization and Restriction of Chemicals (REACH), Establishing a European Chemicals Agency, Amending Directive 1999/4; European Parliament: Brussels, Belgium, 2006. [Google Scholar]
  64. Eurostat. Sewage Sludge Production and Disposal from Urban Wastewater. Available online: https://ec.europa.eu/eurostat/databrowser/view/ten00030/default/table?lang=en (accessed on 20 March 2022).
  65. Ministry of the Economy and Innovation. Analysis of Circularity of the Lithuanian Industry; Ministry of the Economy and Innovation: Vilnius, Lithuania, 2021; 209p. [Google Scholar]
  66. The Government of the Republic of Lithuania. The National Waste Prevention and Management Plan for 2021–2027; The Government of the Republic of Lithuania: Vilnius, Lithuania, 2021. [Google Scholar]
  67. LIFE17 ENV/LT/000310. Nutrient Recycling Circular Economy Model for Large Cities Water Treatment Sludge and Ashes to Biomass to Bio-Energy. Available online: https://webgate.ec.europa.eu/life/publicWebsite/index.cfm?fuseaction=search.dspPage&n_proj_id=6742 (accessed on 20 March 2022).
  68. Eurostat. Annual Freshwater Abstraction by Source and Sector. Available online: http://appsso.eurostat.ec.europa.eu/nui/show.do?dataset=env_wat_abs&lang=en/ (accessed on 20 March 2022).
  69. Eurostat. Supply, Transformation and Consumption of gas. Available online: https://appsso.eurostat.ec.europa.eu/nui/show.do?dataset=nrg_cb_gas&lang=en/ (accessed on 20 March 2022).
  70. Eurostat. Gross and Net Production of Electricity and Derived Heat by Type of Plant and Operator. Available online: https://appsso.eurostat.ec.europa.eu/nui/show.do?dataset=nrg_ind_peh&lang=en (accessed on 20 March 2022).
  71. Eurostat. Production of Electricity and Derived Heat by Type of Fuel. Available online: https://ec.europa.eu/eurostat/databrowser/view/NRG_BAL_PEH__custom_2375854/default/table?lang=en/ (accessed on 20 March 2022).
  72. Eurostat. Consumption of Inorganic Fertilizers. Available online: https://ec.europa.eu/eurostat/databrowser/view/aei_fm_usefert/default/table?lang=en/ (accessed on 20 March 2022).
  73. Česonienė, L.; Dapkienė, M.; Šileikienė, D.; Rekašienė, V. Impact of wastewater treatment plant on water quality of the river Mažoji Sruoja, Plungė district. Environ. Res. Eng. Manag. 2017, 73, 32–44. [Google Scholar] [CrossRef]
  74. HELCOM. Sources and Pathways of Nutrients to the Baltic Sea (PLC-6); Baltic Sea Environmental Proceedings No. 153; HELCOM: Helsinki, Finland, 2018; 42p. [Google Scholar]
Figure 1. WWTPs in agglomerations where more than 2000 p.e. of wastewater is generated.
Sustainability 14 05327 g001
Figure 2. Household and industrial wastewater that needs to be treated. Based on [24].
Sustainability 14 05327 g002
Figure 3. Per capita consumption of water by households. Based on [26].
Sustainability 14 05327 g003
Figure 4. Water productivity in euro per cubic meter (Euro: chain-linked volumes, reference year 2010). Based on [27].
Sustainability 14 05327 g004
Figure 5. Wastewater service coverage: (a) development of wastewater service coverage [18]; (b) percentage of inhabitants connected to centralized wastewater collection depending on agglomeration size. Calculated based on [16].
Sustainability 14 05327 g005
Figure 6. Nutrient removal efficiency indicator: (a) for total nitrogen, (b) for total phosphorus. Calculated based on data from WWTPs.
Sustainability 14 05327 g006
Figure 7. Wastewater treatment degree (all municipal and industrial wastewater included). Based on [24].
Sustainability 14 05327 g007
Figure 8. Effluent inorganic content indicator: (a) nitrogen, (b) phosphorus. Calculated based on data from [24].
Sustainability 14 05327 g008
Figure 9. Biological dephosphatation potential. Calculated based on data from WWTPs.
Sustainability 14 05327 g009
Figure 10. Damage units for sewage sludge transferred to agricultural usage. Calculated based on data from WWTPs.
Sustainability 14 05327 g010
Figure 11. The total amount of biogas generated per year from WWTPs. Calculated based on [58].
Sustainability 14 05327 g011
Table 1. Indicators used to assess the circularity of the wastewater sector. Partly based on [14,21].
CE model Options for Wastewater SectorIndicatorsComments
Prevention/reductionWater consumption and discharge
Wastewater service coverageThis indicator does not directly show prevention/reduction. Still, it is important because centralized wastewater collection brings water to larger WWTPs that have a greater potential for better emission control and resource recovery
Reclamation/removalNutrient (N and P) removal efficiency
Effluent inorganic content
Biological dephosphatation potential
Indicator for chemicals used for wastewater treatment
Pollutant content indicator for the recovered sewage sludge
ReuseTreated wastewater recovery indicator for irrigation
RecyclingWastewater recycling for potable usage
RecoveryNutrient recovery
Sewage sludge processing
Biogas production
Rethink No particular indicator was set. “Rethink” is covered by discussion on the status and potential of wastewater sector circularity
Table 2. Loads of total and inorganic N and P from point-source discharges in Lithuania (calculated based on [24]).
YearNitrogenPhosphorus
Total N LoadShare of Inorganic FractionInorganic N LoadTotal P LoadShare of Inorganic FractionInorganic P Load
2018
of which from >100,000 p.e.
1965 Mg/year76%1492 Mg/year143 Mg/year52%74.5 Mg/year
45.5% 46.4%36.4% 31.0%
2019
of which from >100,000 p.e
1929 Mg/year73%1416 Mg/year149 Mg/year53%78.5 Mg/year
48.6% 48.0%41.6% 37.2
2020
of which from >100,000 p.e
1852 Mg/year76%1398 Mg/year157 Mg/year55%86 Mg/year
47.9% 49.6%43.9% 43.4
Table 3. Classification of treated sludge by concentration of heavy metals according to the “Sewage Sludge Management and Utilization Requirements” [40].
Concentration of Metals, mg/kg Dry Matter
CdCrHgNiPbCuZn
Sludge category I<1.5<140<1<50<140<300<800
Sludge category II1.5–5140–1701–1.550–70140–150300–1000800–2500
Table 4. Pollutant content indicator for the Lithuanian sewage sludge compost and digestates, expressed in damage units.
Sewage Sludge CompostSewage Sludge Digestate,
after Anaerobic Digestion
Sewage Sludge Digestate, Dried,
after Anaerobic Digestion
Indicator value: damage units0.080.120.23
Table 6. Potential of resource recovery from Lithuanian WWTPs. Calculated for ideal conditions.
Actual DemandActual
Quantities
Potential Resource RecoveryPotential
Quantities
Water demand Water recovery
Water abstraction [68]280.5 mln m3/yearEffluents [65]171.5 mln m3/year
Energy demand Energy recovery
Natural gas [69]86.7 PJ/yearCH4 from COD (anaerobic) 1.88 PJ/year
Electricity [70]14.3 PJ/yearElectricity CH4 (CHP) 1.04 PJ/year
Derived heat [71]31.7 PJ/yearHeat CH4 (CHP)1.09 PJ/year
Heat (effluent)17.52 PJ/year
N demand N recovery
N applied to crops [72]178,603 Mg/yearInfluent N16,436 Mg/year
N in activated sludge3287 Mg/year
Sludge N recoverable (biodrying)2301 Mg/year
P demand P recovery
P applied to crops [72]22,960 Mg/yearInfluent P2511 Mg/year
P recovery as struvite879 Mg/year
P in activated sludge2260 Mg/year
Sludge P recoverable (wet chemical technology)2034 Mg/year
Publisher’s Note: MDPI stays neutral with regard to jurisdictional claims in published maps and institutional affiliations.

