Article

Multi-Scenario Simulation and Prediction of Regional Habitat Quality Based on a System Dynamic and Patch-Generating Land-Use Simulation Coupling Model—A Case Study of Jilin Province

College of Earth Sciences, Jilin University, Changchun 130061, China
*
Author to whom correspondence should be addressed.
Sustainability 2022, 14(9), 5303; https://doi.org/10.3390/su14095303
Submission received: 1 April 2022 / Revised: 23 April 2022 / Accepted: 23 April 2022 / Published: 28 April 2022

Abstract

:
Effectively evaluating and predicting the change trend in regional habitat quality and its response to land-use change is of great significance for promoting regional high-quality and sustainable development. In this study, Jilin Province is taken as an example, and the SD–PLUS coupling model and the habitat quality module of the InVEST model are used to simulate the habitat quality of Jilin Province in 2030. In addition, the population and urbanization rates under the SSPs path are taken as the scenario framework, and the habitat quality changes from 1995 to 2030 are discussed. The results showed that the kappa coefficient of the simulation results was 0.93, and the FoM coefficient was 0.102. The simulation effect was good. The land-use simulation results under the four scenarios were quite different, and the change areas were mainly concentrated in the northwest, southeast, and central urban areas of Jilin Province. From 1995 to 2015, the habitat quality showed spatial distribution characteristics of “high in the southeast and low in the northwest”, and the habitat quality continued to deteriorate. By 2030, the ecological priority scenario (S3) is expected to have the maximum average value of habitat quality. Under this scenario, the scale of ecological land, such as forest, increases, and the scale of construction land is controlled. The minimum habitat quality appeared in the situation of rapid expansion (S2), and the increase in low-quality habitat areas was highly consistent with the expansion trend in urban construction land. In the coordinated development scenario, the growth rate of construction land reached 52.26%, but the average value of habitat quality decreased by only 0.0002, which basically found the balance point between economic development and ecological protection. S4 had a high reference value for the future development of Jilin Province.

1. Introduction

Habitat quality refers to the ability of an ecosystem to provide suitable living conditions for the sustainable development of individuals and populations, which can reflect regional biodiversity to a certain extent [1,2]. At present, with the accelerating process of global urbanization and the increasing number of urban populations, the demand for construction land is increasing. The rapid expansion of cities and the continuous change in land use and land cover make a large number of ecological lands, such as forest, grassland and water area, occupied by construction land [3,4], resulting in a series of ecological problems such as soil erosion, environmental pollution, biodiversity reduction, and ecosystem imbalance [5]. Therefore, how to protect habitat quality in the context of rapid urbanization has become the primary problem studied by many scholars and government departments [6]. For example, The 15th Conference of the Parties to the Convention on Biological Diversity pointed out that habitat quality is closely related to biodiversity and that stable habitat quality is an important foundation for maintaining ecosystem biodiversity [7]. In 2020, China launched the preparation of the 14th Five-Year Plan for the protection and utilization of natural resources, emphasizing the importance of the preparation of ecological protection red lines and basic farmland protection red lines [8]. According to the results of the Millennium Ecosystem Assessment published by the United Nations, habitat quality degradation will affect the circular flow of material flow and energy flow among various plates of the habitat, thus increasing the risk of land fragmentation [9]. Therefore, studying and analyzing the temporal and spatial changes in regional habitat quality is of great significance for protecting regional biodiversity and maintaining the service function of the ecosystem.
In recent years, with the continuous maturity of 3S technology and hardware conditions, artificial intelligence for ecosystem service (ARIES) [10], multiscale integrated models of ecosystem services (MIMES) [11] and integrated valuation of ecosystem services and trade-offs (InVEST) [12] have been widely used in the quantitative assessment of habitat quality. Because the InVEST model has the characteristics of simple operation, small data demand and strong spatial expression ability [13], it has been successfully applied to the study of habitat quality at different scales such as the national, provincial, municipal and watershed [14,15,16,17]. At present, in addition to the research on the historical and current evolutionary characteristics of habitat quality, the simulation and prediction of future habitat quality based on land-use simulation methods, such as CA–Markov, CLUS-S and FLUS, are also gradually increasing [18]. The changes in habitat quality in the Yellow River Delta under multiple circumstances was analyzed by Qing Longding et al., who used the FLUS–InVEST coupling model. They proved that land-use change also had a great impact on regional carbon reserves and water resources protection [19]. Li Yanan and others compared the prediction results of habitat quality in Nanchang with the CA–Markov model and FLUS model; a difference between these two models was found in that the CA–Markov model simulated the quantity of land use better, while the FLUS model simulated the spatial pattern of land use better [20]. Liang Y et al. use SD–CLUE-S and InVEST to assess the oasis carbon storage in northwestern China [21]. These studies have proved that habitat quality prediction based on land-use simulation has high feasibility and research value.
However, in the process of simulation and prediction of habitat quality, the impact on the change in land demand caused by socioeconomic development and policy changes on the simulation and prediction results of habitat quality is often ignored by most articles, and little attention has been paid to the patch level change of habitat quality simulation results [22]. In this study, system dynamics (SD) model is mainly used in our prediction of land-use demand. The SD model can better reflect the regional, nonlinear, dynamic and systematic characteristics in the process of land-use change, and it can incorporate the factors of social economy, population change and policy intensity into the process of land demand change prediction. It is a good tool for multi-scenario simulation of land-use systems [23]. Land-use change simulation mainly relies on the patch-generating land-use simulation (PLUS) model. Compared with previous models, the PLUS model proposes a new land expansion analysis strategy (LEAS) by improving the previous rule mining methods such as the transition analysis strategy (TAS) or pattern analysis strategy (PAS). Meanwhile, multitype random patch seeds (CARS) is applied to model multiple land-use types at a fine-scale resolution [24]. The plus model has been proved to have higher accuracy in land-use simulation [25].
Jilin Province is a frontier and coastal province in Northeast China. It is located in the world-renowned “golden corn belt” and “golden rice belt” [26]. Cultivated land and forest land account for about 85% of the total area. It is an important ecological barrier and grain production base in Northeast China. Since the reform and opening up, Jilin Province has experienced a rapid process of urbanization [27]. From 1995 to 2015, the scale of construction land in Jilin Province increased by 68.1%, the urbanization rate increased from 40.3% to 48.4%. The rapid expansion of urban construction land has occupied a large amount of ecological land. According to the document of “The 14th Five-Year Plan for the National Economic and Social Development of Jilin Province and the Vision for 2035” [28], Jilin Province is in the key stage of accelerating transformation and upgrading to achieve high-quality development. The problems that need to be solved urgently are rapid urban expansion, the great pressure of ecological and environmental protection and the serious phenomenon of extensive utilization of resources [29]. Therefore, evaluating and predicting the temporal and spatial change characteristics of habitat quality from the perspective of land-use change is of great significance for maintaining the ecological balance and achieve the goal of sustainable development in Jilin Province.

2. Study Area and Data Sources

2.1. Study Area

Jilin Province is located between 121°38′ E~131°19′ E and 40°50′ N~46°19′ N, in the geometric center of Northeast Asia composed of Japan, Russia, North Korea, South Korea, Mongolia and the northeastern part of China (Figure 1). It has a total area of 191,267.1 km2, with significant morphological differences. The terrain tilts from southeast to northwest, showing obvious characteristics of “three plates”. The mountainous areas account for 36% of the total area, hills and platforms account for 34% and plains account for 30%. In 2020, the average precipitation of Jilin Province was 689.1 mm, and the annual average temperature was 6.5 °C.
The western part of Jilin Province is one of the three areas with concentrated distribution of saline–alkali land in the world [30], and it is also a typical area with fragile ecological environment [31]. The habitat quality of this region is vulnerable to human activities and climate change. Land salinization has seriously damaged the local ecosystem and hindered the development of its ecological civilization. Exploring the impact of saline–alkali land on regional habitat quality is also one of the reasons why we chose Jilin Province as the study area. In addition, as a typical provincial administrative region in China, Jilin Province is a good case to analyze and predict the temporal and spatial changes in habitat quality in Jilin Province, which can provide reference for large-scale regional high-precision land-use simulation and habitat quality prediction.

2.2. Data Sources

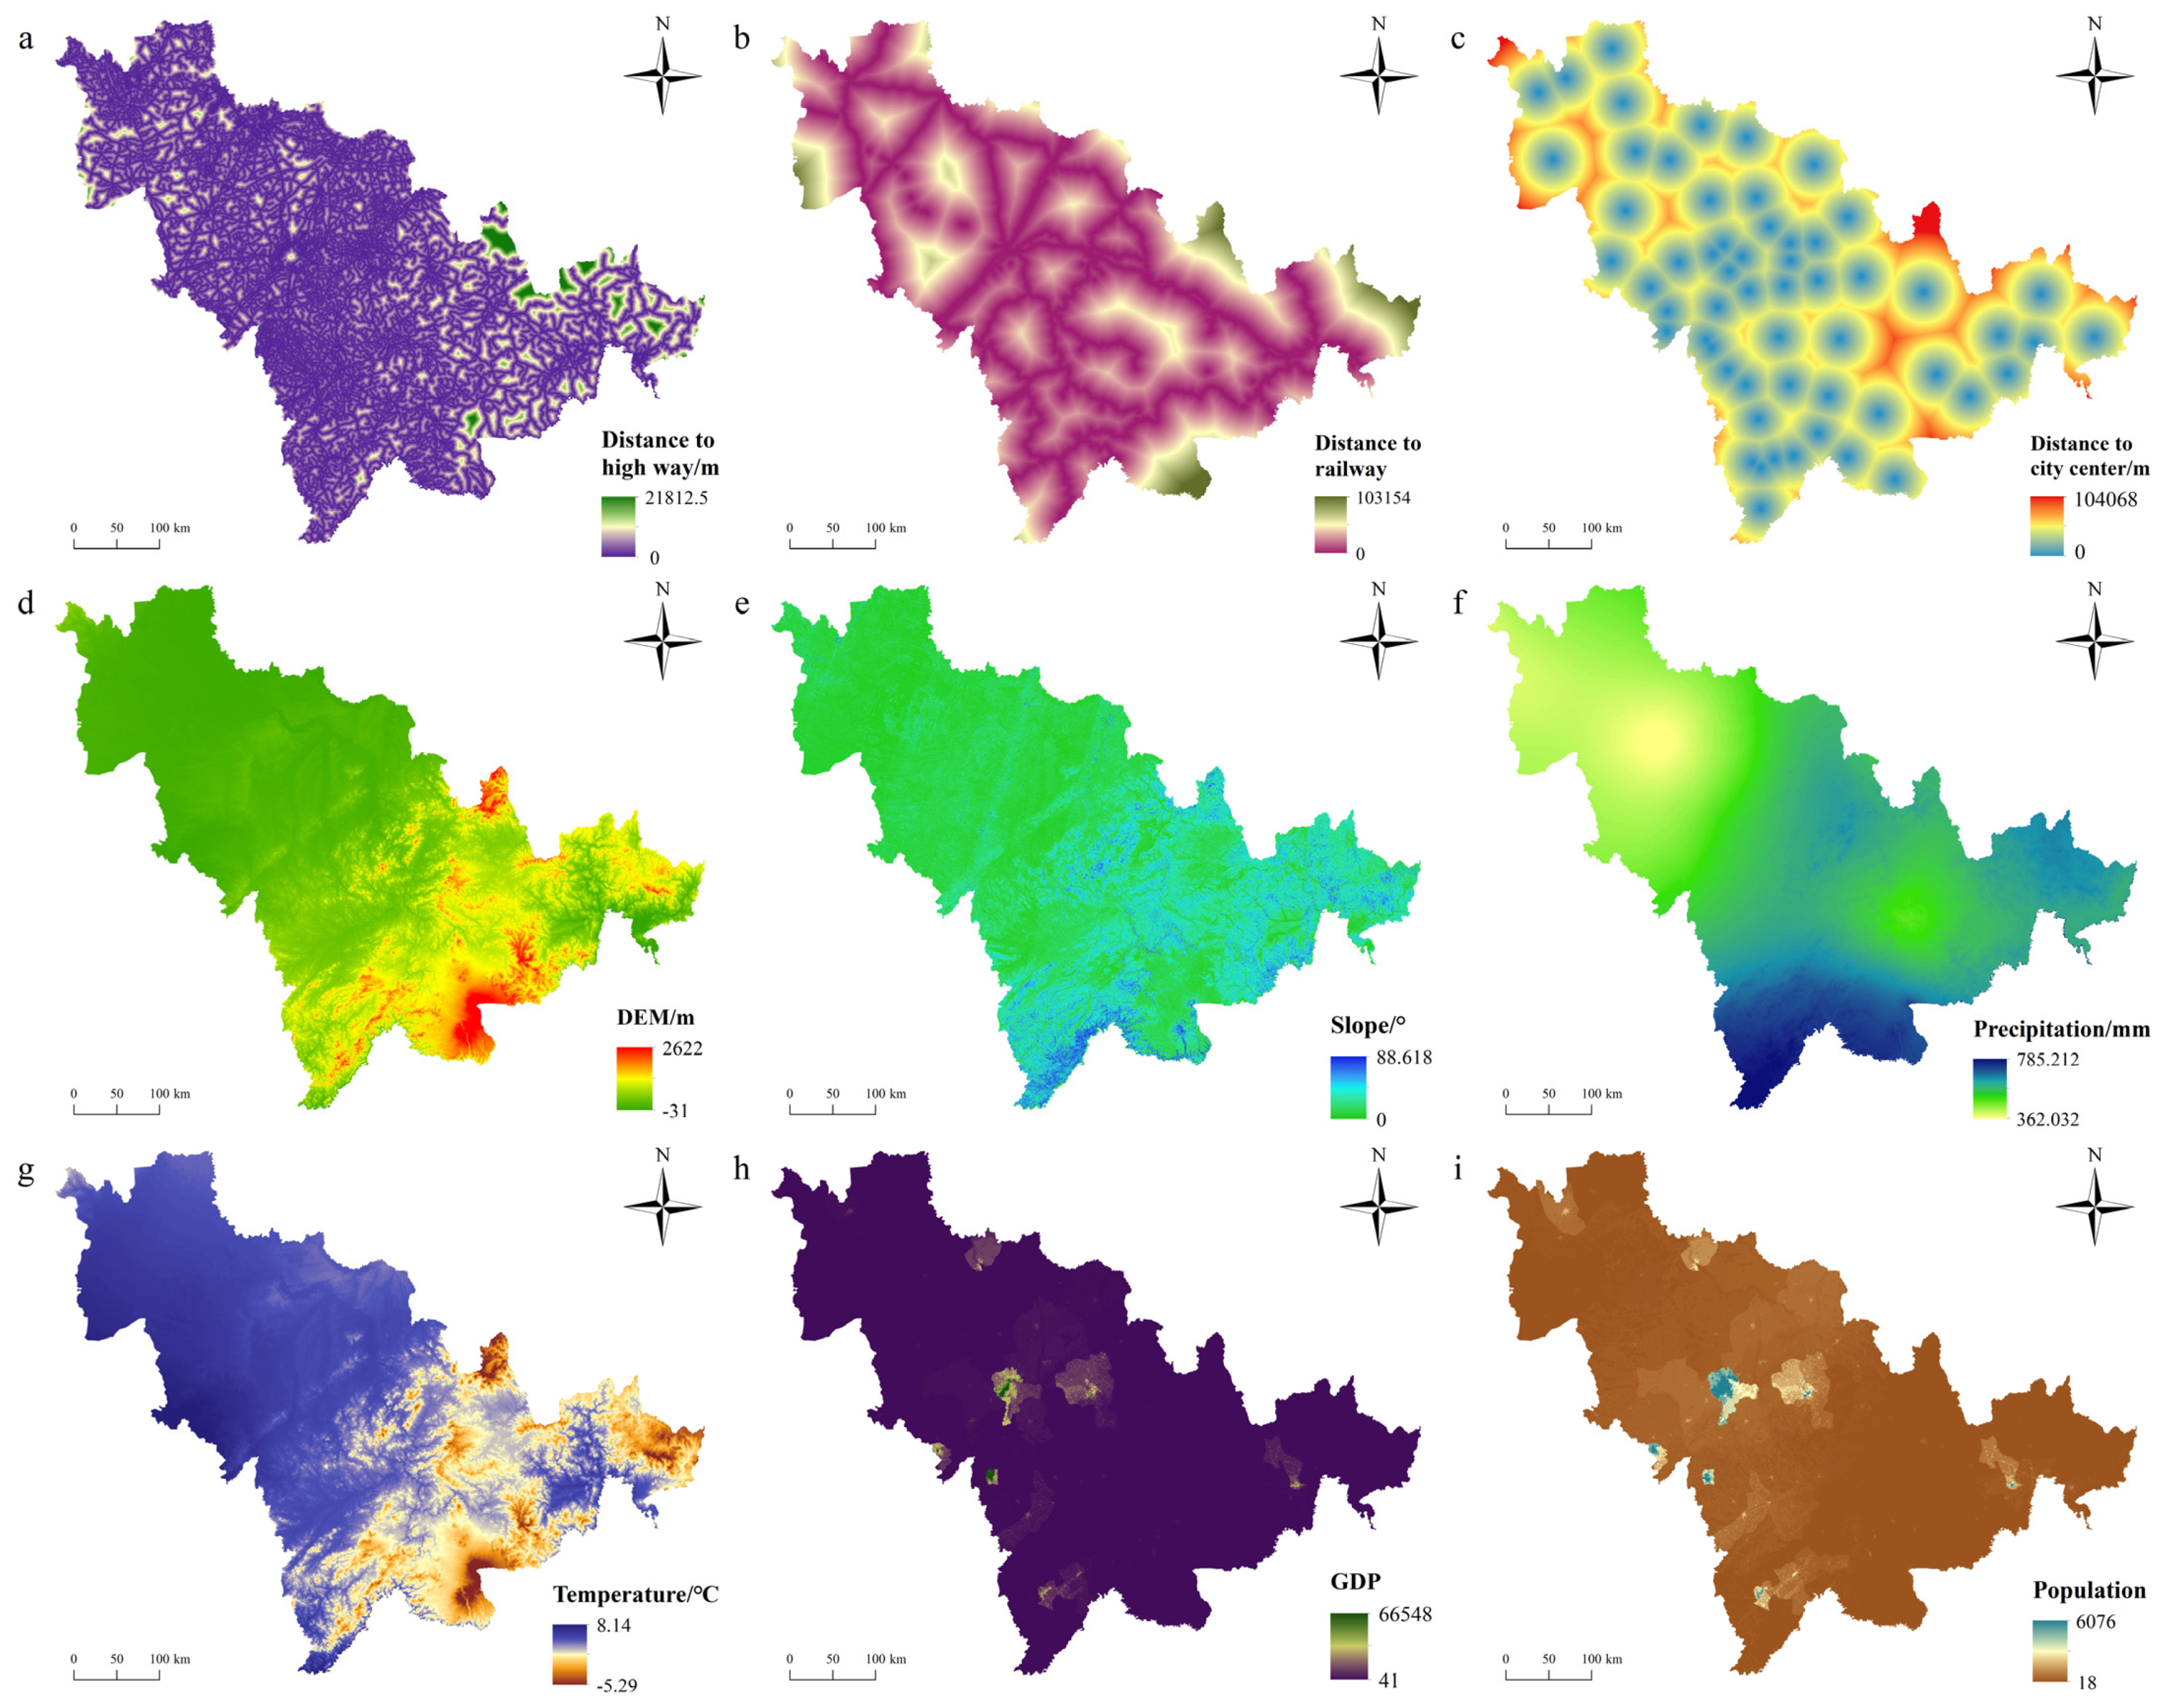
The land-use data of Jilin Province from 1995 to 2015 came from the Resource and Environment Science and Data Center of Chinese Academy of Sciences (http://www.resdc.cn (accessed on 25 March 2022)). These data were obtained through interpretation and digital processing based on Landsat TM images of the United States. The data’s accuracy is over 90% [32], and the spatial resolution is 30 × 30 m. The driving factors of this research mainly came from Geospatial Data Cloud (www.gscloud.cn (accessed on 18 March 2022)) and the Natural Resources Bureau of Jilin Province; the socioeconomic data mainly came from the Statistical Bureau of Jilin Province. The details of these data are shown in Table 1 and Figure 2.
The data on population and urbanization rates were mainly from the research published by Chen Y. D. of Tsinghua University in 2020 [33]. The economic data were mainly from the statistical yearbook of Jilin Province. All spatial data were resampled to a 30 m resolution and converted to the same projection (i.e., WGS_1984_UTM_zone_52N).

3. Methodology

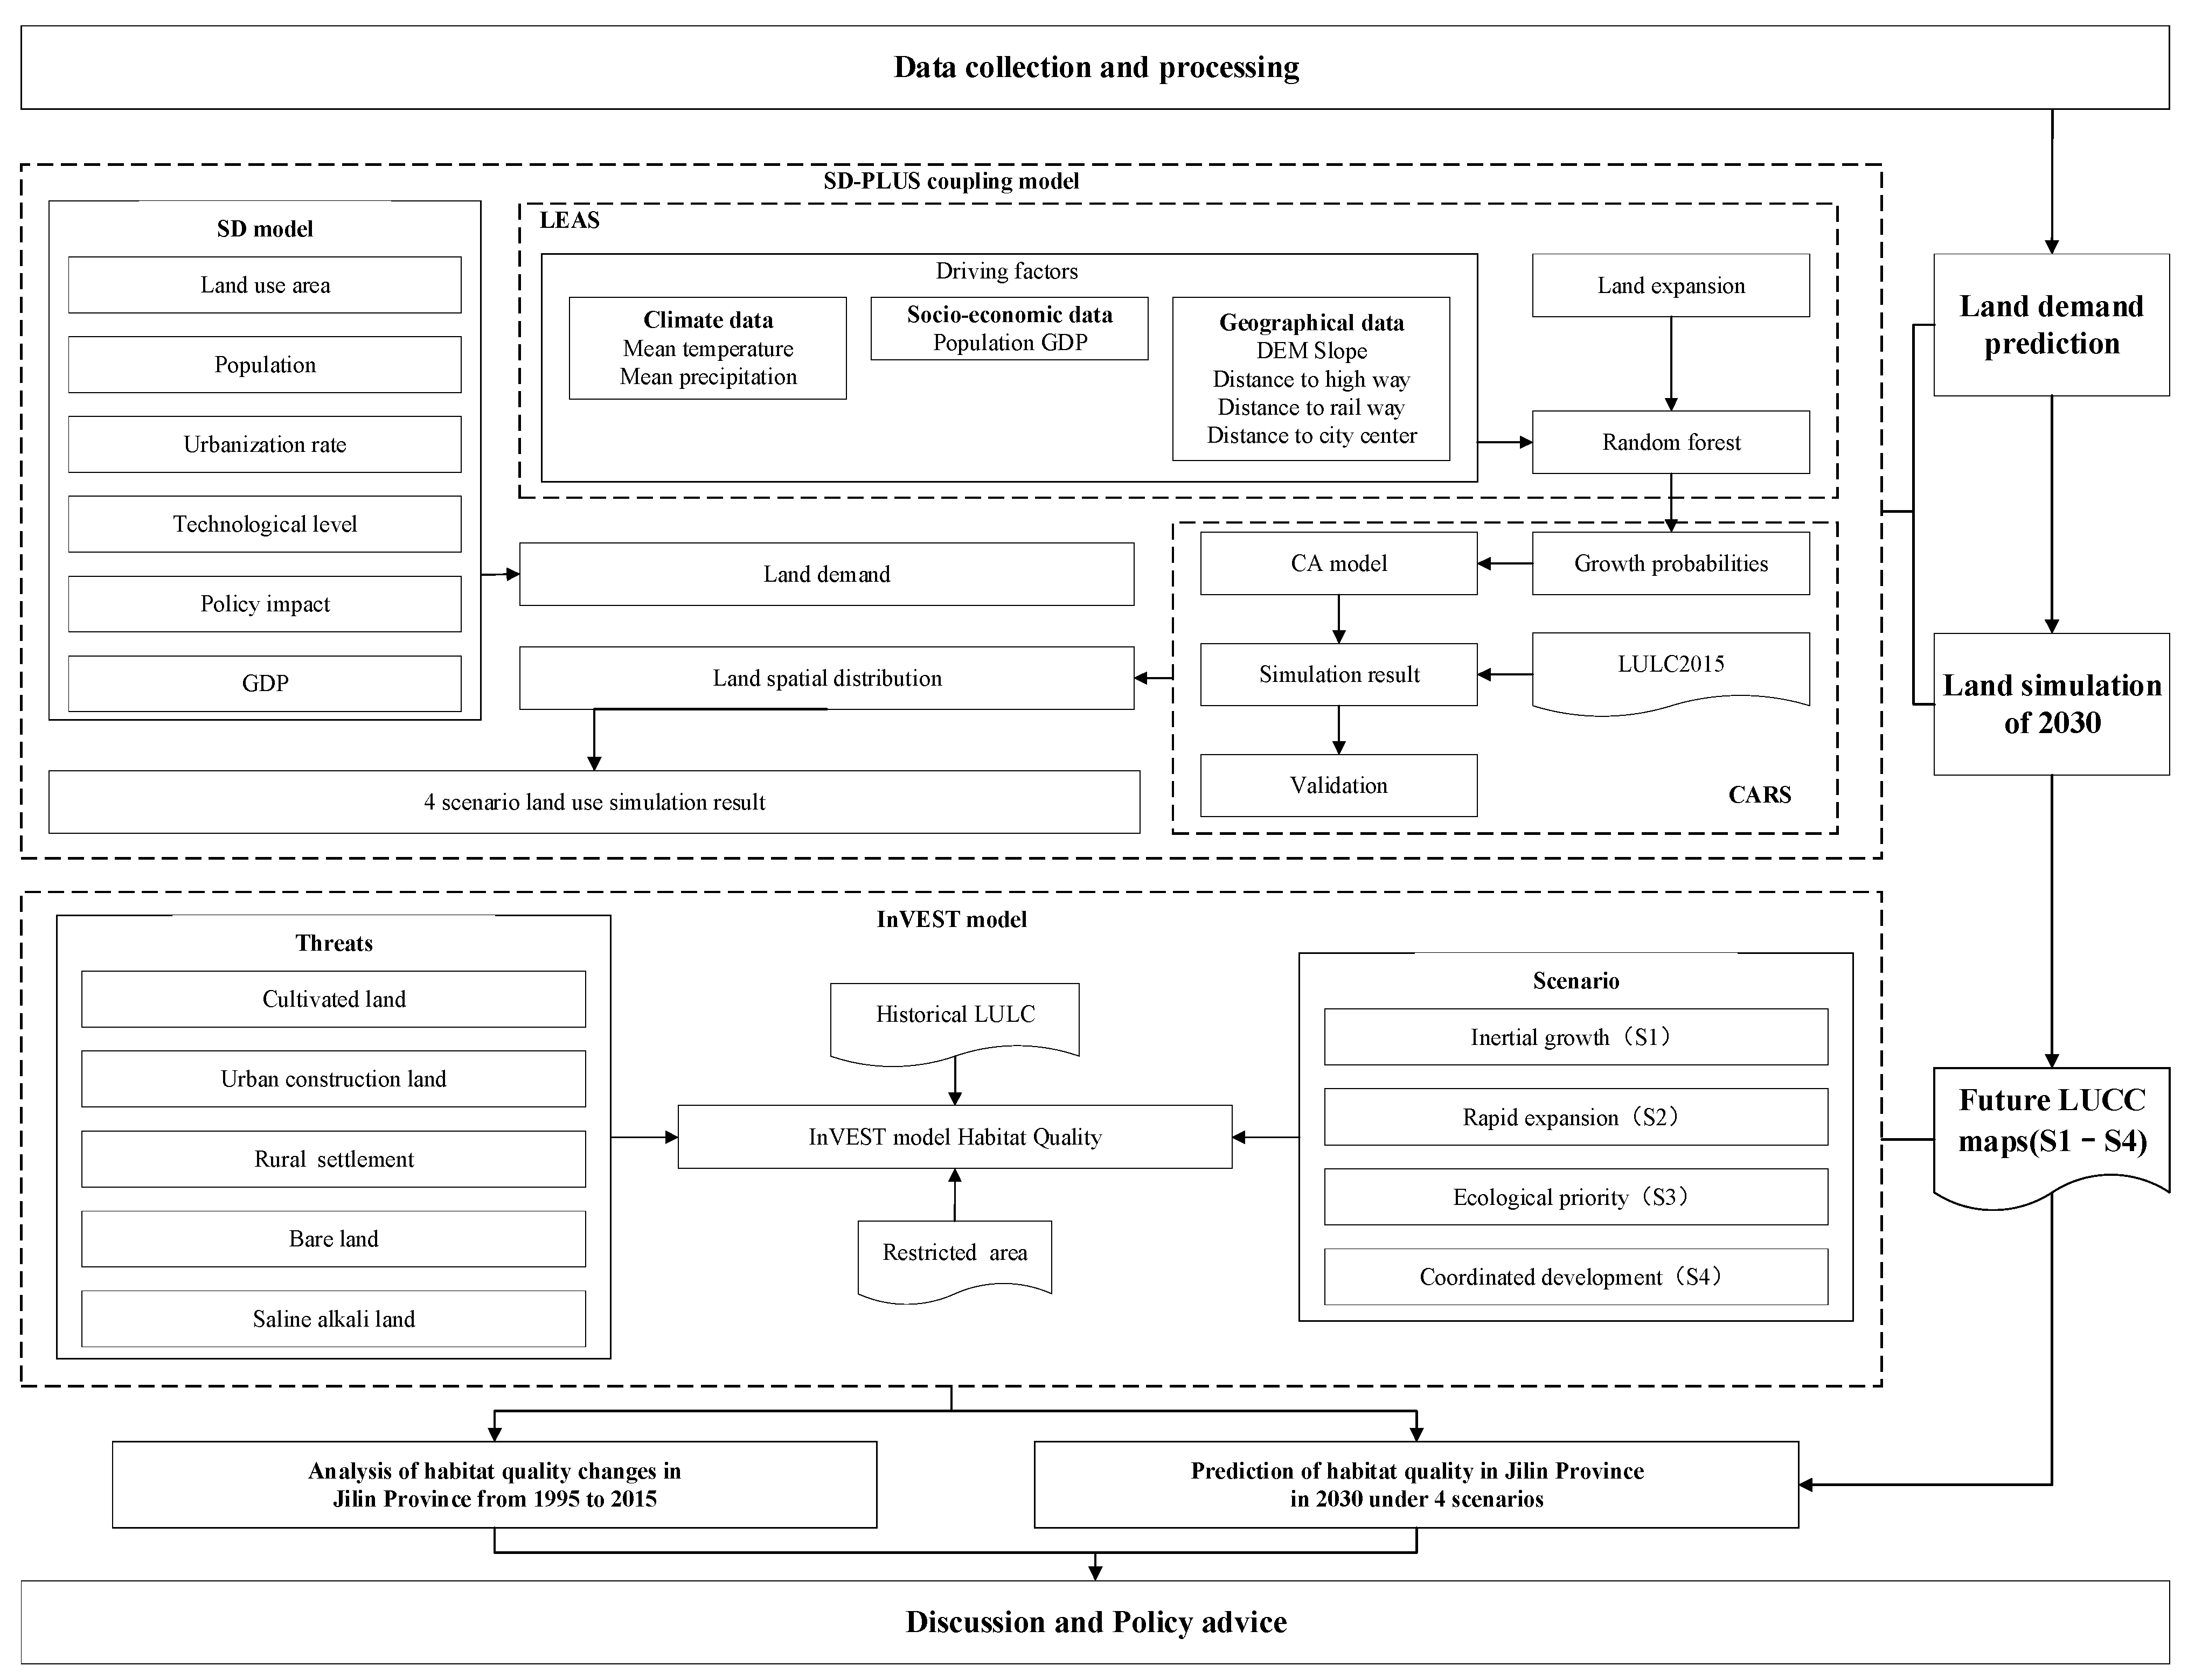
Habitat quality assessment can effectively reflect the changes in biodiversity and ecological environment, which is of great significance for regional ecological security and sustainable development [34]. As shown in the flow chart in Figure 3, this study was mainly divided into three parts: Firstly, the SD model was used to establish the regional macro land-use demand model according to social and economic development, natural environmental conditions and population change and to predict the demand area of various land types in Jilin Province in 2030 under 4 different conditions. Secondly, the PLUS model was used to simulate the land-use maps in 2030; obtain the suitable probability of different land types under the condition of considering the impact of human activities, natural environment and other threat sources; to obtain the most suitable spatial distribution of land use that meets the requirements through iterative operation. Finally, we used the habitat quality module of the InVEST model to evaluate the changes and response trends of habitat quality under different scenarios from 1995 to 2015 and 2030 and then give the corresponding countermeasures. The flow chart is shown in Figure 3.

3.1. Land Demand Simulation Based on SD Model and Scenario Setting

3.1.1. System Dynamics Model (SD Model)

The system dynamics model was first proposed by Forrester in the 1950s. Its outstanding feature is that it can reflect the interaction between the structure, function and dynamic behavior of complex systems [35] and conduct dynamic simulation experiments on complex systems so as to investigate the changing behavior and trend of complex systems under different situations [36].
Based on the comprehensive analysis of the influencing factors and historical changes of land use in Jilin Province, we took population change and economic growth as the leading variables affecting land demand, and in order to reflect a certain policy orientation, we considered the urban land intensive use intensity, cultivated land protection, wetland protection and saline–alkali land treatment as the policy trends to set the trend variable. We set the highest, high, medium and low level patterns, respectively, for the four scenarios and used the table function that could construct the nonlinear relationship between variables to express the quantitative relationship [22] as shown in Table 2. In order to keep the total area constant every year, bare land was regarded as regulation land, which could also judge the construction effect of the model to a certain extent [37].
The time boundary of the study was 1995–2030, and we chose Euler as the integration type and set the time step to 1 year. The model construction mainly included two stages: Stage 1—the initial year was 1995 and the final year was 2015. The historical data were used to set the parameters and adjust and test the model. Stage 2—The initial year was reset to 2015 and the final year was 2030. Then, we started to simulate the land demand of Jilin Province in 2030. The causality diagram is shown in Figure 4. The function of the adjustment factors in the diagram is a balanced dimension with a value of 1.

3.1.2. Scenario Setting

The scenario setting of this study was mainly based on the four SSPs paths in the research results of Chen Y. D. [33], and we finally set four scenario modes: inertial growth, rapid expansion, ecological priority and coordinated development. See Table 2 for parameter settings, and the scenario is described as follows:
Table 2. Scenario parameter settings.
Situational VariablesInertial Growth
(S1)
Rapid Expansion
(S2)
Ecological Priority
(S3)
Coordinated Development
(S4)
Leading variablesPopulationHighHighestLowMedium
GDPMedium economic growth
(Linear decrease from 4% to 1.5%)
Low economic growth
(Maintain 1.5%)
Highest economic growth
(Linear growth from 4% to 8.5%)
Highest economic growth
(Linear growth from 4% to 6.5%)
Urbanization rateMediumLowHighestHigh
Trend variablesTechnological progressMediumLowHighestHigh
Grain yield per areaAnnual growth of 1.5% (2%) to 2020 (2030)Annual growth of 1.3% (1.8%) to 2020 (2030)Annual growth of 1.9% (2.4%) to 2020 (2030)Annual growth of 1.7% (2.2%) to 2020 (2030)
Animal husbandry products yield per areaAnnual growth of 0.2%Annual growth of 0.3%Annual growth of 0.6%Annual growth of 0.4%
Per capita urban construction land areaHighHighestLowMedium
Per capita Rural settlement area MediumHighestLowHigh
Urban construction land intensive use intensityMedium (0.03)Low (0.01)Highest (0.1)High (0.05)
Cultivated land protect strengthMedium
(Increases linearly from 0.73 to 0.78 and then decreases to 0.75)
Low (Maintain 0.73)Highest
(Increases linearly from 0.73 to 0.89)
High
(Increases linearly from 0.73 to 0.81)
Wetland protection strengthMedium
(Decreases linearly from 1 to 0.89)
Low
(Decreases linearly from 1 to 0.67)
Highest
(Increases linearly from 1 to 1.15)
High
(Maintain 1)
Intensity of land salinization treatmentMedium
(Increases linearly from 0.7 to 0.75)
Low
(Maintain 0.7)
Highest
(Increases linearly from 0.7 to 0.9)
High
(Increases linearly from 0.7 to 0.86)
Water resources recyclingLowMediumHighHighest
  • Inertial growth scenario: The inertial growth scenario was mainly set with reference to the development trend of Jilin Province from 1995 to 2015. It was assumed that there were no new changes in economic or environmental policies under this scenario, applying the SSP2 path under the population growth and urbanization rates. Jilin Province will continue the previous development trend, experience a medium-level GDP growth and urbanization process, with low scientific and technological levels and poor ecological protection, and it will not set-up restricted transformation areas;
  • Rapid expansion scenario: The rapid expansion scenario was mainly set for the disorderly expansion at the urban scale in the future. In this scenario, Jilin Province has failed to achieve the development goal, the extensive economic growth mode that relies on land supply has not changed and the comprehensive opening-up two-child policy has further exacerbated the contradiction between people and land. In this scenario, the change in population growth and urbanization rates applied the SSP3 path, basically opening the mutual transformation between various land types. This scenario has the highest population growth rate; lowest urbanization rate, scientific and technological level and ecological protection, and it will not set-up restricted transformation areas neither;
  • Ecological priority scenario: The ecological priority scenario mainly assumed that Jilin Province entered a high-quality development stage. The speed of urban expansion decreased under policy restrictions, and the efficiency of intensive land use continuously improved, while the ecological protection policy was strictly implemented. In this scenario, the change in population growth and urbanization rate applied the SSP4 path. It had the highest technological level and economic growth rate, and then it set the national, provincial and municipal nature reserves in Jilin Province as prohibited transformation areas;
  • Coordinated development scenario: The coordinated development scenario assumed that Jilin Province paid attention to economic development and ecological protection simultaneously after comprehensively considering the above three simulation scenarios. In this scenario, the SSP5 path was applied to the population growth and urbanization rates, and the economic and technological development levels were slightly lower than that in the ecological priority scenario. At the same time, national and provincial protected areas were set as restricted transformation areas.

3.2. Multi-Scenario Simulation of Land Use Based on PLUS Model

3.2.1. PLUS Model

In this study we chose the PLUS model to simulate land-use change in Jilin Province. As a new land-use simulation model, the PLUS model mainly includes two parts: Land expansion analysis strategy (LESA): using a 5% random sampling method to sample from the expansion part of the two phases of land-use change, LESA uses the random forest algorithm to explore the factors of various land-use expansion and driving forces one by one, so as to obtain the development probability of various land uses [25].
A CA model based on multitype random seeds (CARS): This module combines random seed generation and a threshold decreasing mechanism. Then it dynamically simulates the automatic generation of patch in time and space under the constraint of the development probability generated by LESA. The neighborhood size was set to three, the patch generate and expansion coefficient was set to 0.9 and 0.1. As shown in Table 3, the neighborhood parameters of land types were calculated using the changes in land-use areas in Jilin Province from 1995 to 2015. As Jilin Province is still in the process of rapid urbanization, the difficulty and cost of construction land expansion are low. Therefore, in addition to restricting the transfer out of construction land, S1 and S2 basically liberalize the transformation between land types. S3 and S4 restrict the transformation of ecological land types to a certain extent [24]. See Table 4 for details.

3.2.2. Model Validation

In order to verify the accuracy of the land-use simulation by the PLUS model, the Kappa coefficient and FoM index (figure of merit) are introduced to test the accuracy. The Kappa coefficient is a consistency test method used to evaluate the classification results of remote sensing images. Its expression is shown in Formula (1). The larger the value of the Kappa coefficient, the more accurate the result of the land-use simulation [38].
K a p p a = P 0 P c P p P c
where P 0 is the ratio of the number of simulated correct grids to the total number, P c is the ratio of the number of simulated correct grids to the total number in the random state, and P p is the ratio of the number of correct grids simulated to the total number in the ideal state.
The FoM index is better than the Kappa coefficient at evaluating the accuracy of land-use simulation change [39]. Its expression is shown in Formula (2). Theoretically, the FoM value is between 1% and 59%, and a larger FoM value corresponds to a higher simulation accuracy [40].
F o M = B A + B + C + D
where A represents an area that changes but is predicted to remain unchanged, B represents the area predicted correctly, C represents the area predicted as the wrong land-use type, and D represents the area where there is no change in land use but is predicted to change.

3.3. Habitat Quality Assessment Based on the InVEST Model

3.3.1. InVEST Model Habitat Quality Module

The Habitat Quality module of the InVEST model, by combining the sensitivity of landscape types and the intensity of external threats, and considering the influence distance, spatial weight and the degree of legal protection of land of stress factors, the habitat quality is calculated as a continuous variable [41]. The model fully considers the impact of land cover mode and land cover pattern change on habitat quality [42]. The calculation formula is as follows:
D x j = r = 1 R y = 1 Y r ( w r / r = 1 R w r )   r y i r x y β x S j r
where D x j is the habitat degradation degree of x grid in habitat type j , R is the number of stress factor, W r is the weight, Y r is the total number of grid units of stress factors, r y is the number of stress factors on the grid unit, β x is the accessibility level of grid x (according to the degree of legal protection, the value of β x is between 0 and 1), S j r denotes the sensitivity of landscape j to stress factors, and i r x y denotes the influence distance of stress factors including linear and exponential decline [19].
To calculate the habitat quality, the following was used:
Q x j = H j [ 1 ( D x j z D x j z + k z ) ]
where Q x j denotes the habitat quality index of grid unit x of landscape type j ; H j denotes the habitat suitability score of the landscape j , ranging from 0 to 1; k is the semi-saturated constant, generally set to 0.5; z is the scale constant, and we took it as 2.5 [19].

3.3.2. Parameter Settings

Combined with the actual situation of Jilin Province, we extracted cultivated land, urban construction land, rural settlements, bare land and saline–alkali land as the threats. See Table 5 and Table 6 for the specific influence distance, weight and sensitivity of land use to habitat threats.

4. Results

4.1. Accuracy Verification of the SD-PLUS Coupling Model

The difference between the simulated value and the actual value of land demand in Jilin Province in 2015 is shown in Table 7. Except for the bare land as the regulation land, the absolute error between the simulated value and the actual value of the other eight land types was less than 5%, of which the simulation error of cultivated land, forest, grassland, and saline–alkali land was less than 1%; urban construction land was slightly higher than 1%, which proves that the quantitative simulation accuracy met the research requirements.
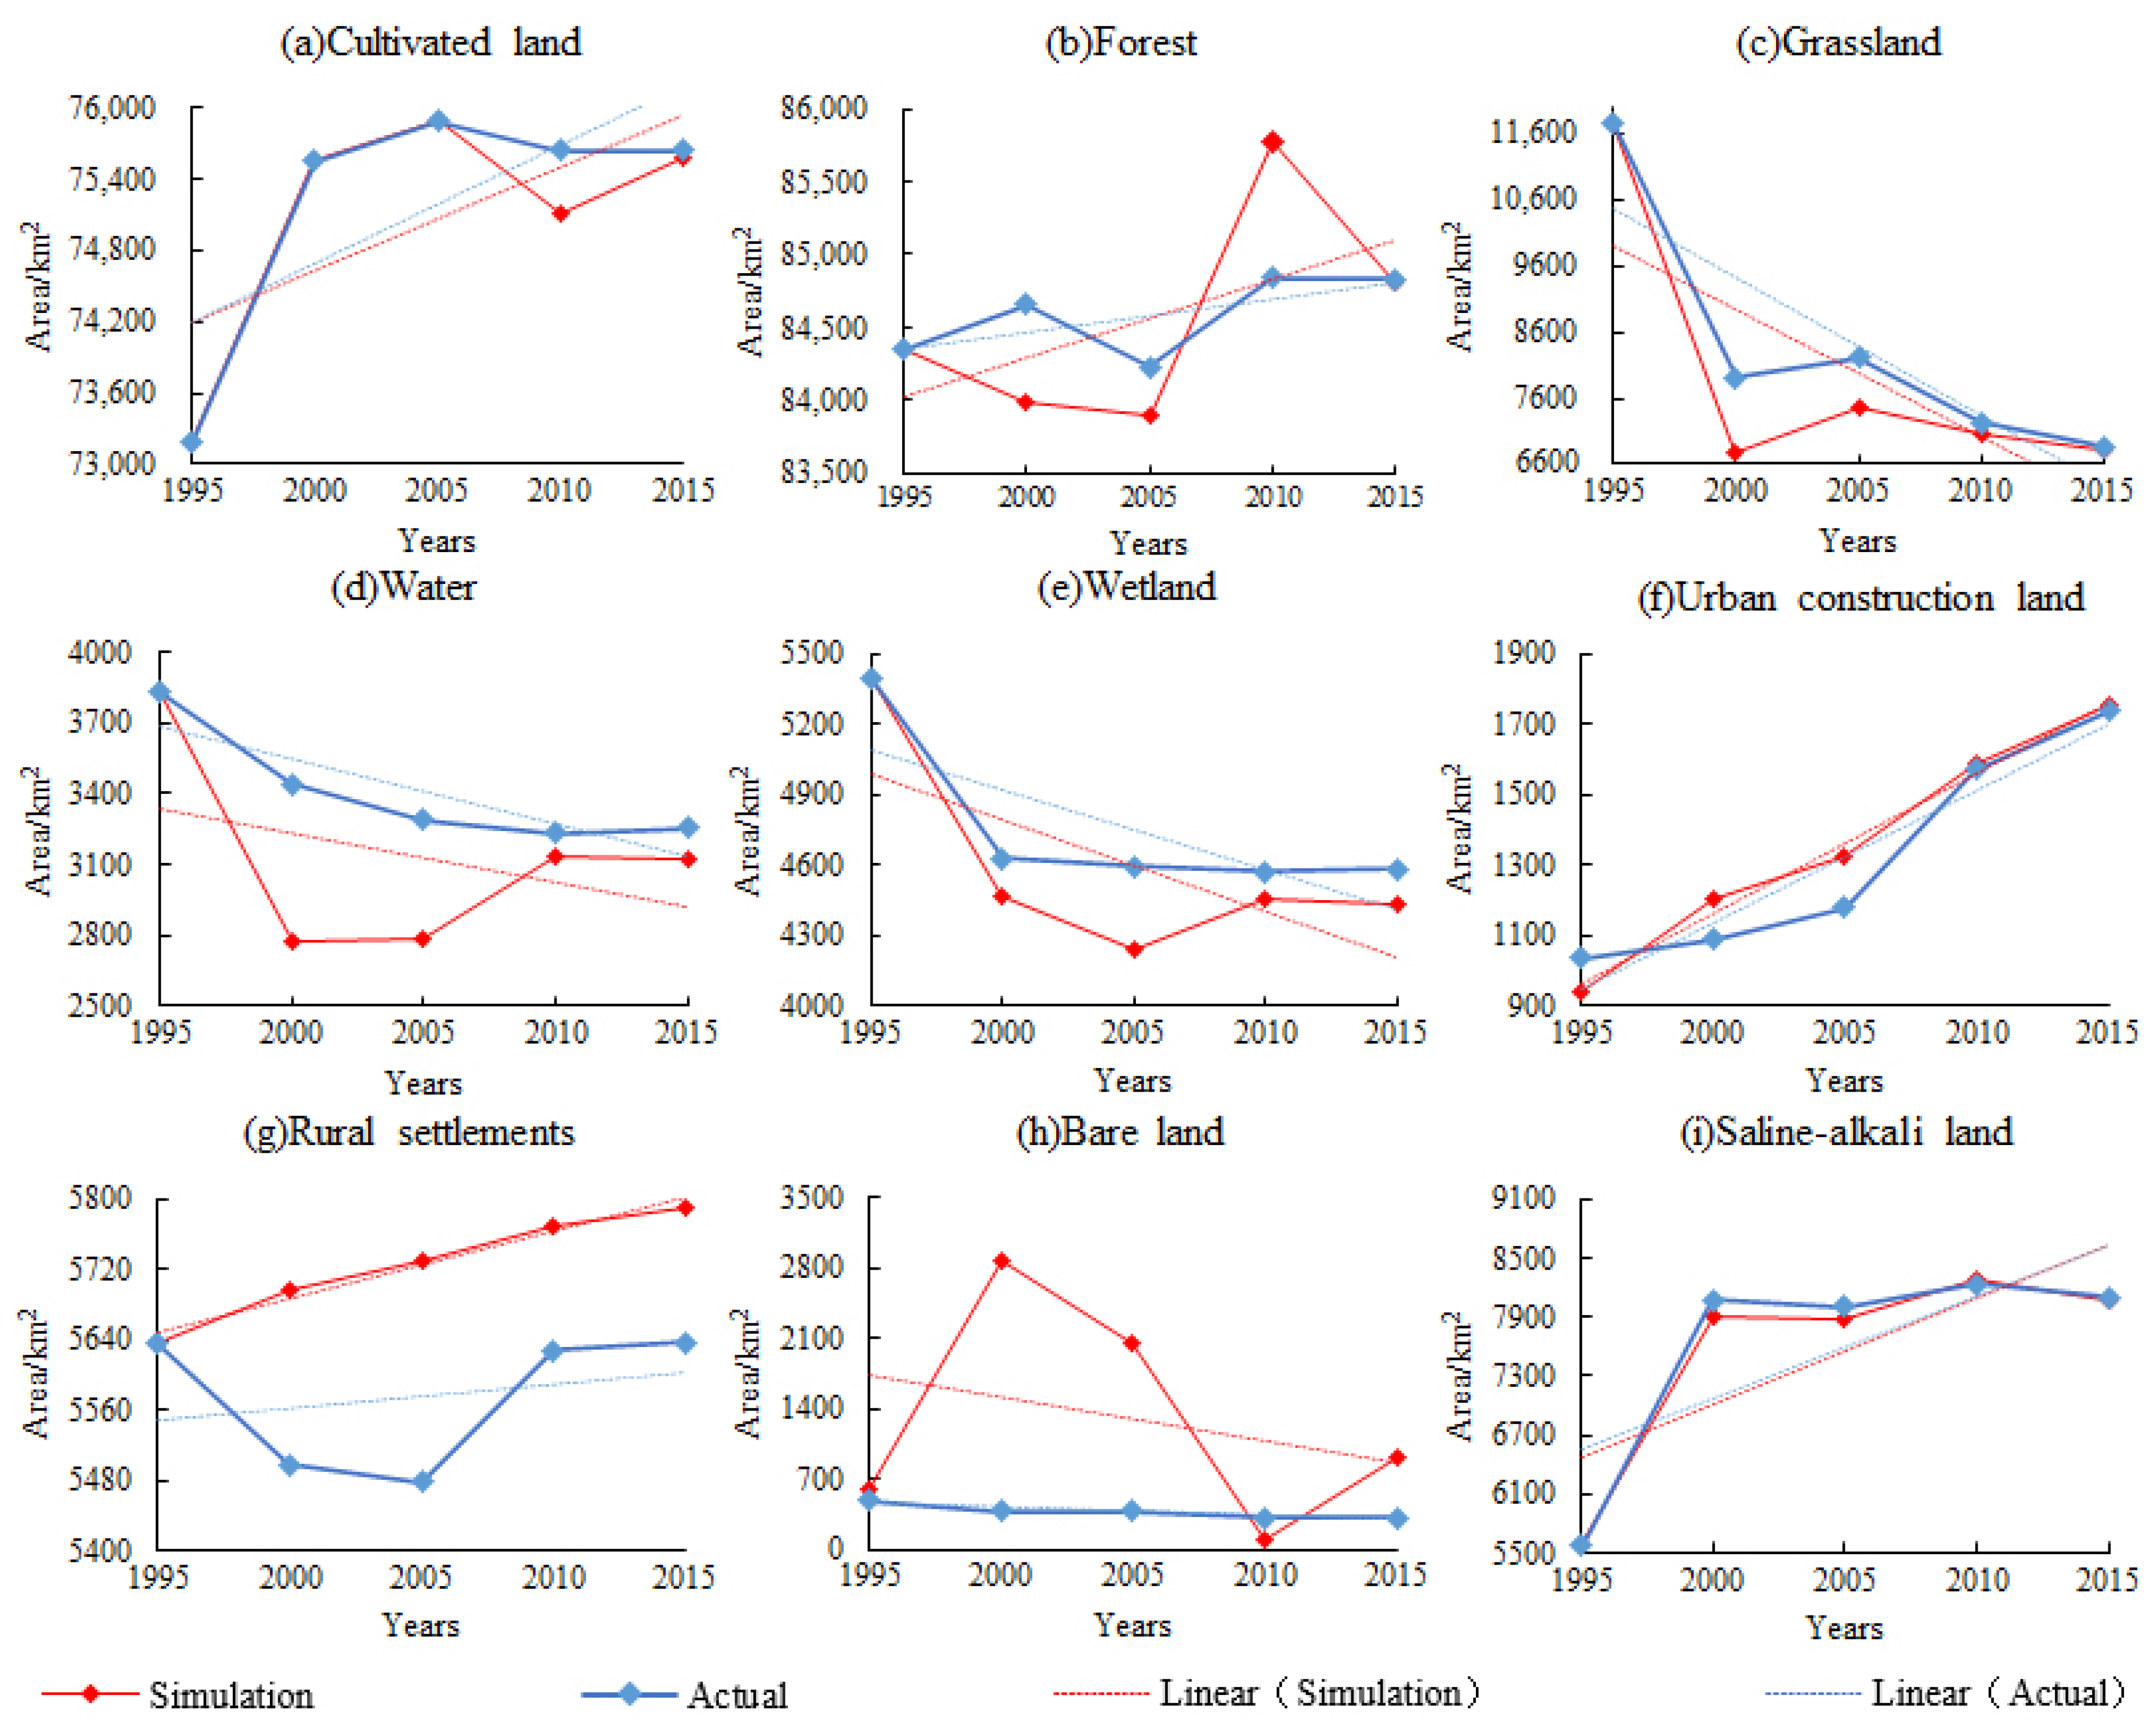
The simulated trend and actual trend of land-use change in Jilin Province are shown in Figure 5. Referring to the trend line, we found that the land-use change in the simulation was basically the same as the actual situation, which proves that the continuity of the model met the research requirements. Therefore, the land demand simulation results of the SD model can be input into the next step.
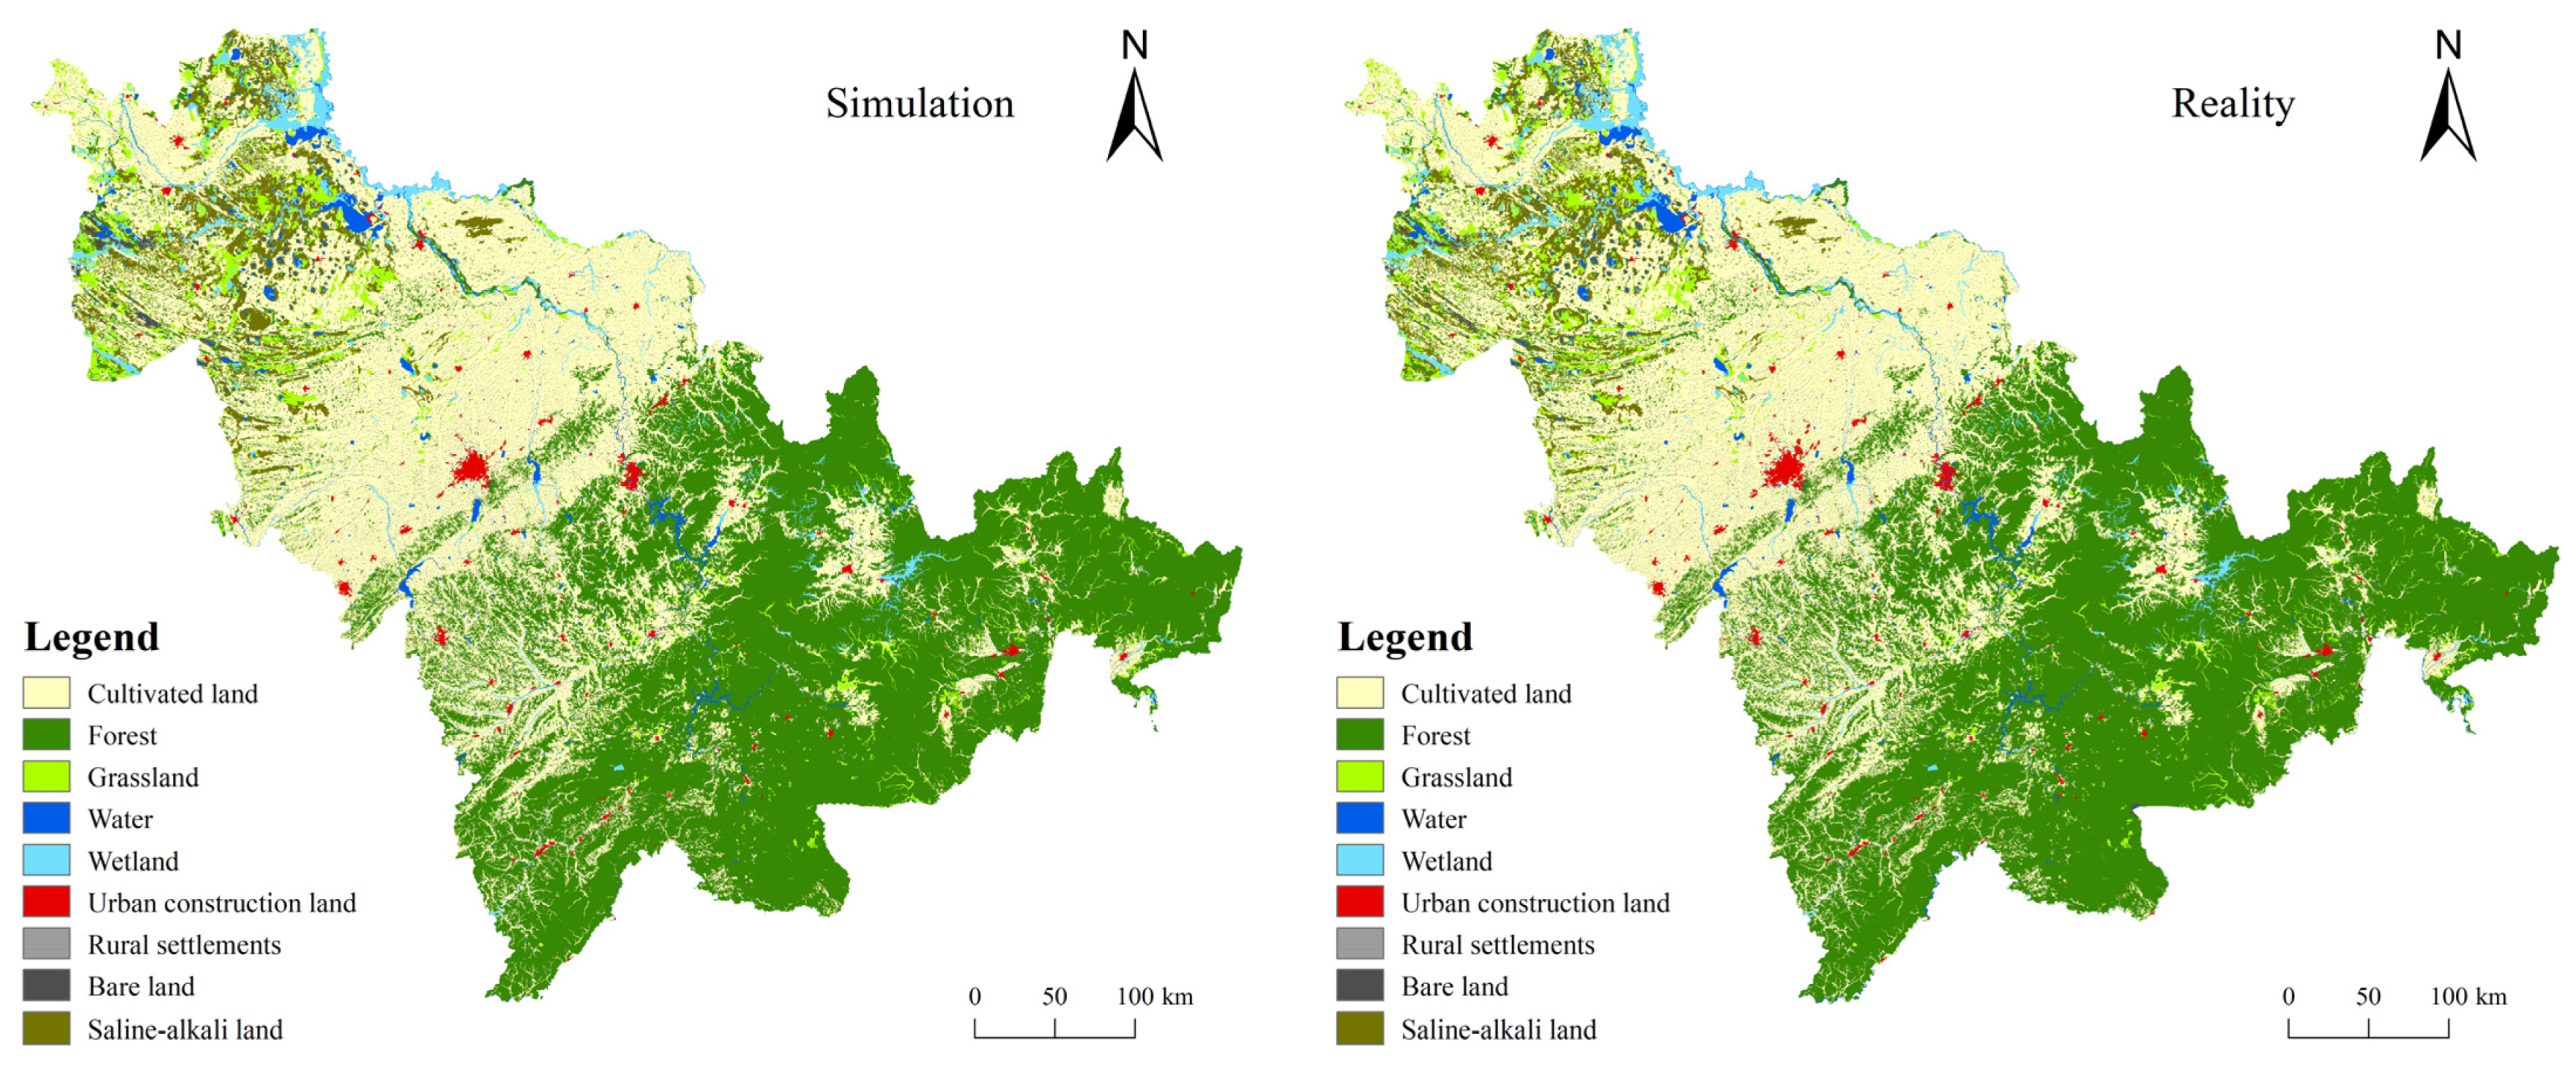
Using the above parameters, we obtained the spatial distribution results of land use in Jilin Province in 2015 as shown in Figure 6. The kappa coefficient of this simulation was 0.93, the overall accuracy was 95.64%, and the FoM index was 0.102. Combined with the overall observation and comparison, we found that the spatial distribution of the simulation of these two parts were in good agreement. It was proved that the land-use simulation of the SD–PLUS coupling model can be carried out in future studies.

4.2. Simulation of Land Use in Jilin Province in 2030

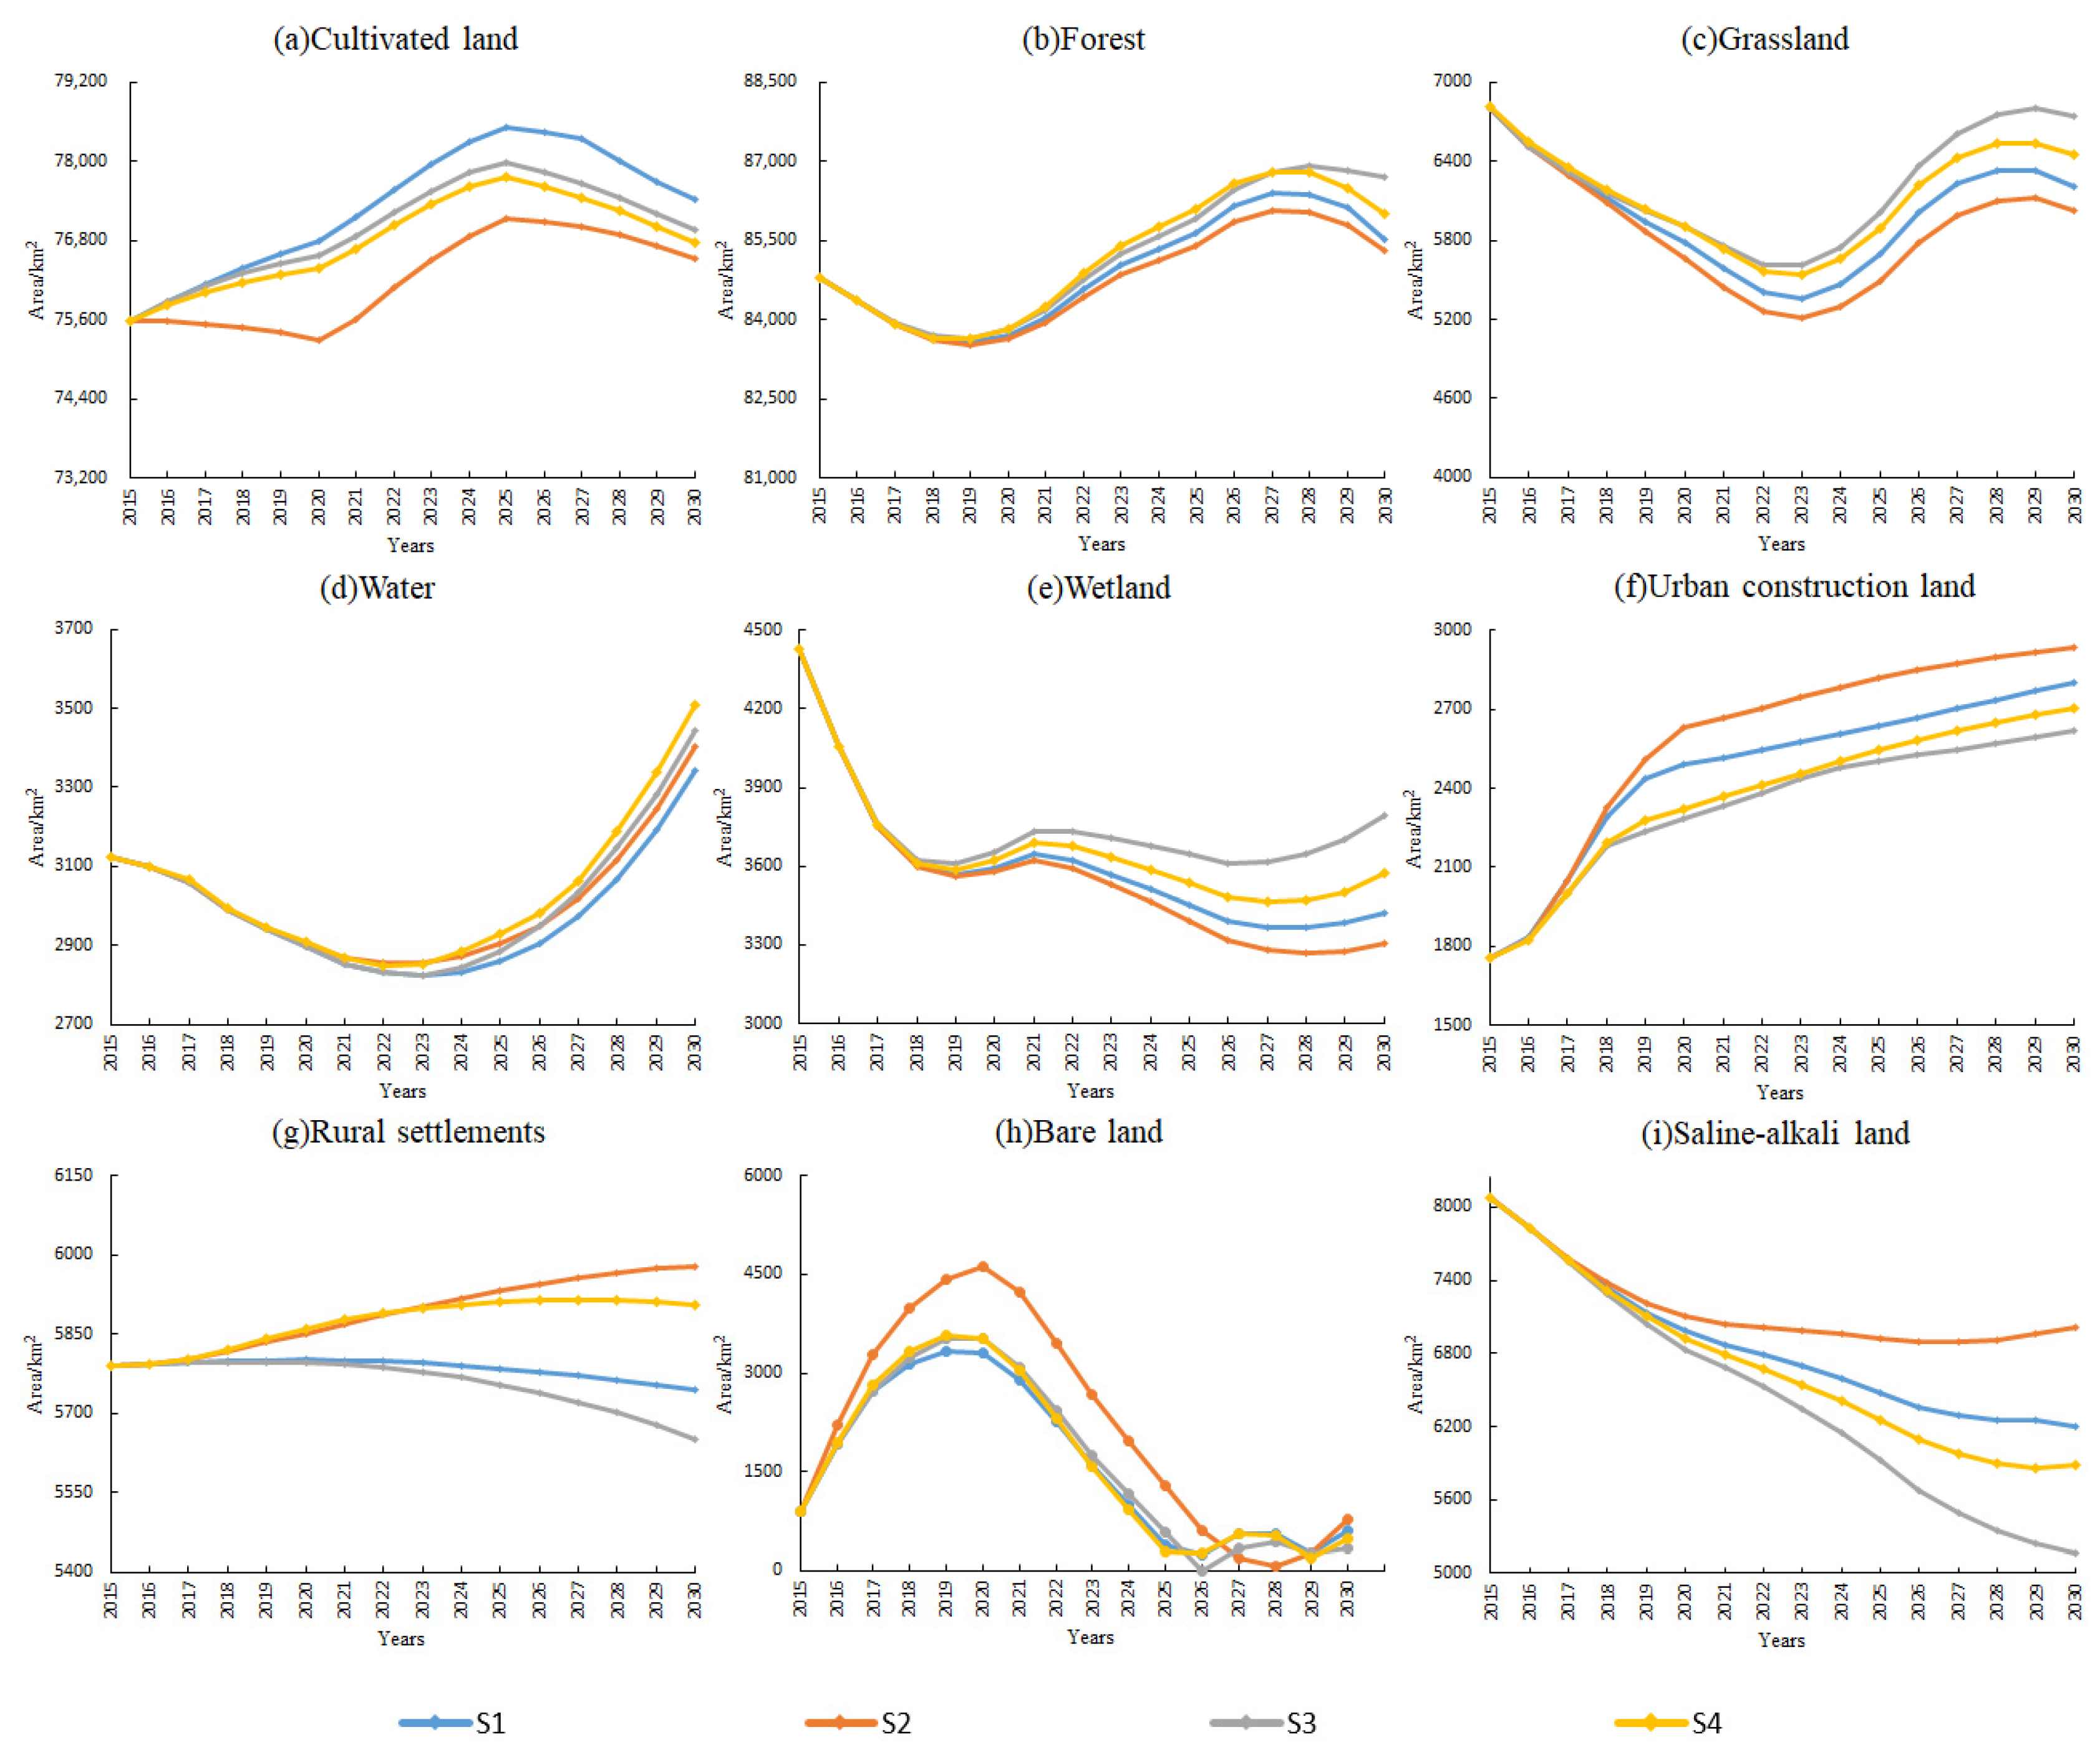
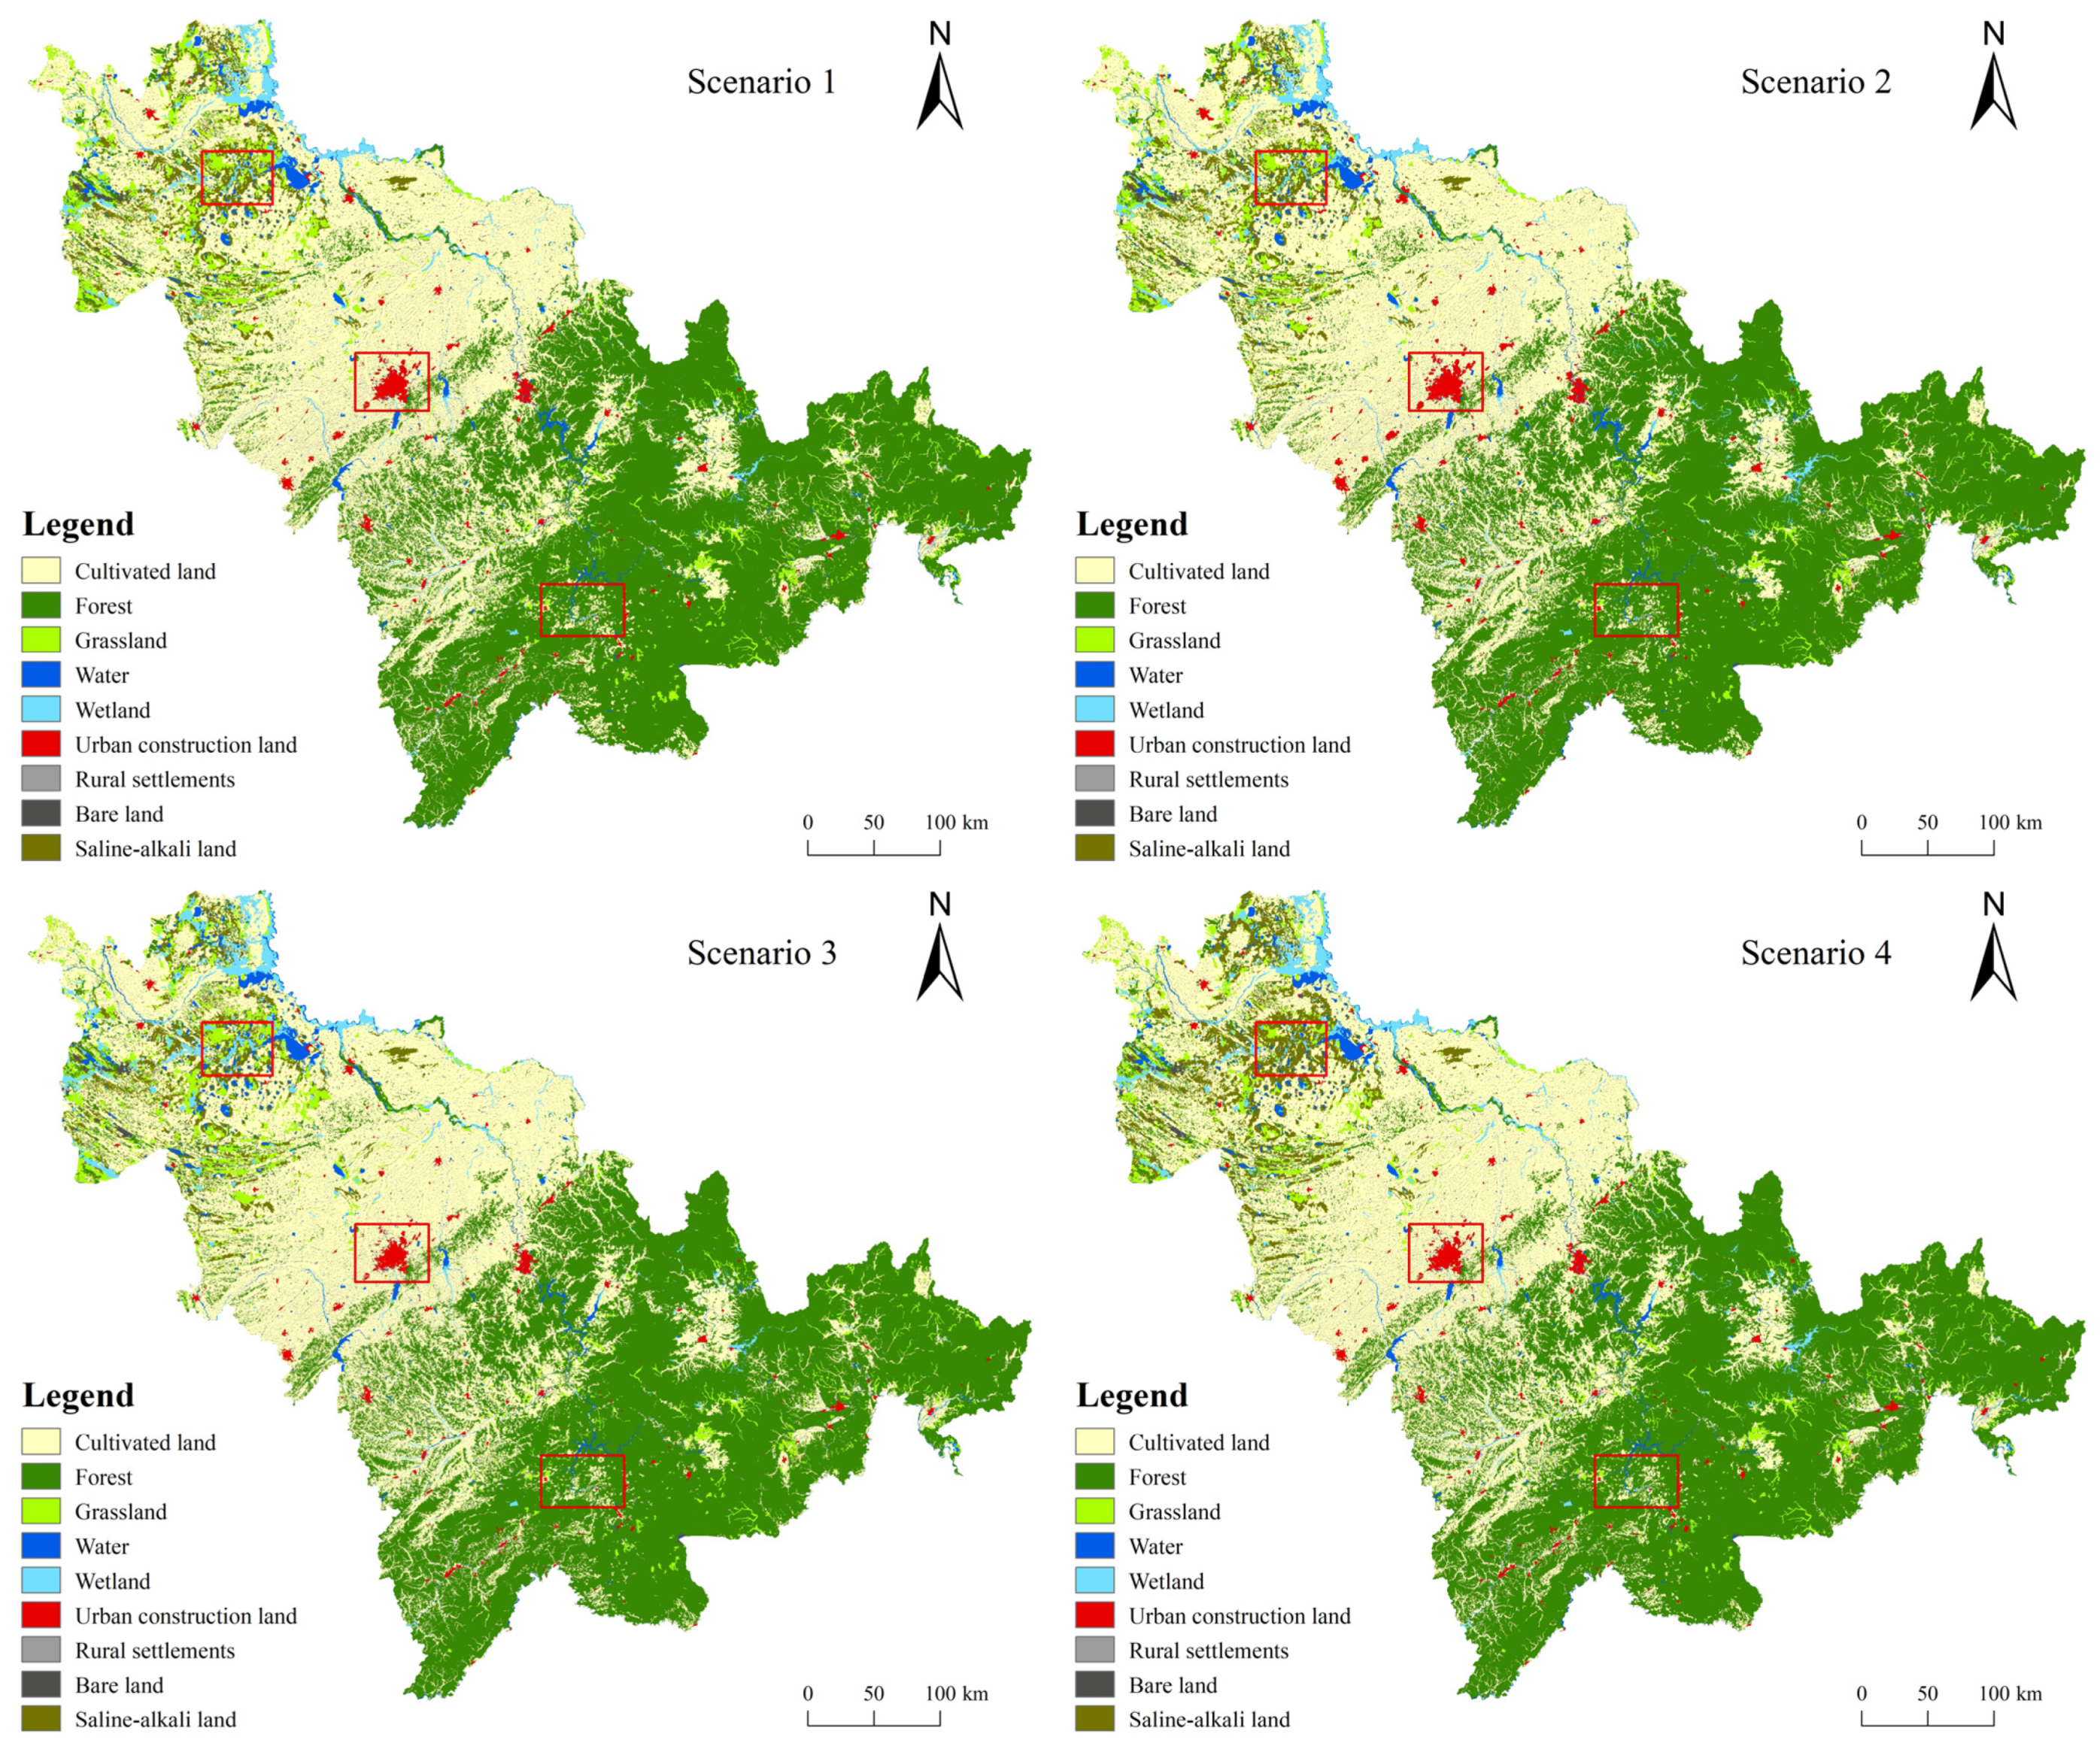
Using the verified SD–PLUS coupling model, a simulation of land use in Jilin Province in 2030 under four different scenarios was performed. The prediction results of land demand are shown in Figure 7, and the spatial simulation results are shown in Figure 8.
In general, the change in land-use demand in Jilin Province was greatly affected by different scenario settings. Under S1, due to the relatively few constraints, the area of various land types was obviously affected by population growth and economic development. Among them, the area of cultivated land, forest, water, and urban construction land increased compared with the beginning of the period, and the area of other land types decreased compared with 2015. With the continuous change in the urbanization rate and population, the area of urban construction land under this scenario expanded from 1775.61 to 2801.61 km2, increasing by 59.58%; at the same time, the demand for grain further increased, and the cultivated land area increased from 75,585.5 to 77,422.9 km2, ranking first in the cultivated land area of the four scenarios. Except for bare land, the area changes in the various areas basically continued the original trend. Under S2, the demand for urban construction land in Jilin Province further increased, the area of urban construction land in Jilin Province expanded from 1755.61 km2 at the beginning of the period to 2936.71 km2, with an increase of 67.27%, the maximum value under the four scenarios. Grassland and wetland areas had the largest declines in the whole scenario, 11.34% and 25.42%, respectively. The increase in cultivated land and forest land area were the smallest of the four scenarios, only 936.3 and 503 km2. The area of bare land and saline–alkali land reached 771.97 and 7018.10 km2, respectively. The rapid expansion of construction land seriously squeezed the change space of ecological land and brought great pressure to the regional ecosystem. Under S3, the disorderly expansion of construction land was effectively controlled. On the premise of meeting the needs of economic development, the area of urban construction land in Jilin Province will only increase to 2616.49 km2 in 2030, and the area of rural residential areas will decrease to 5651.28 km2 compared with S1 and S2. Thanks to the strict natural forest and wetland protection policies, the area of forest land and wetland under the ecological priority scenario was the largest of the four scenarios, 86,683.71 and 3794.29 km2, respectively. Under the background of increasing the investment in land salinization and alkalization control, the downward trend of grassland area in Jilin Province was effectively curbed, and the grassland area was reduced by only 62.15 km2. At the same time, saline–alkali land was also effectively controlled, with the smallest scale of 5163.19 km2 in four scenarios. Under S4, the area of each category was basically between the rapid expansion scenario and the ecological priority scenario in which the areas of urban construction land and rural residential areas were 2703.3 and 5906.74 km2, respectively; The area of saline–alkali land decreased by 2201.51 km2, a decrease of 27.25%, and the area of unused land was slightly higher than that in the ecological priority scenario, 479.43 km2.
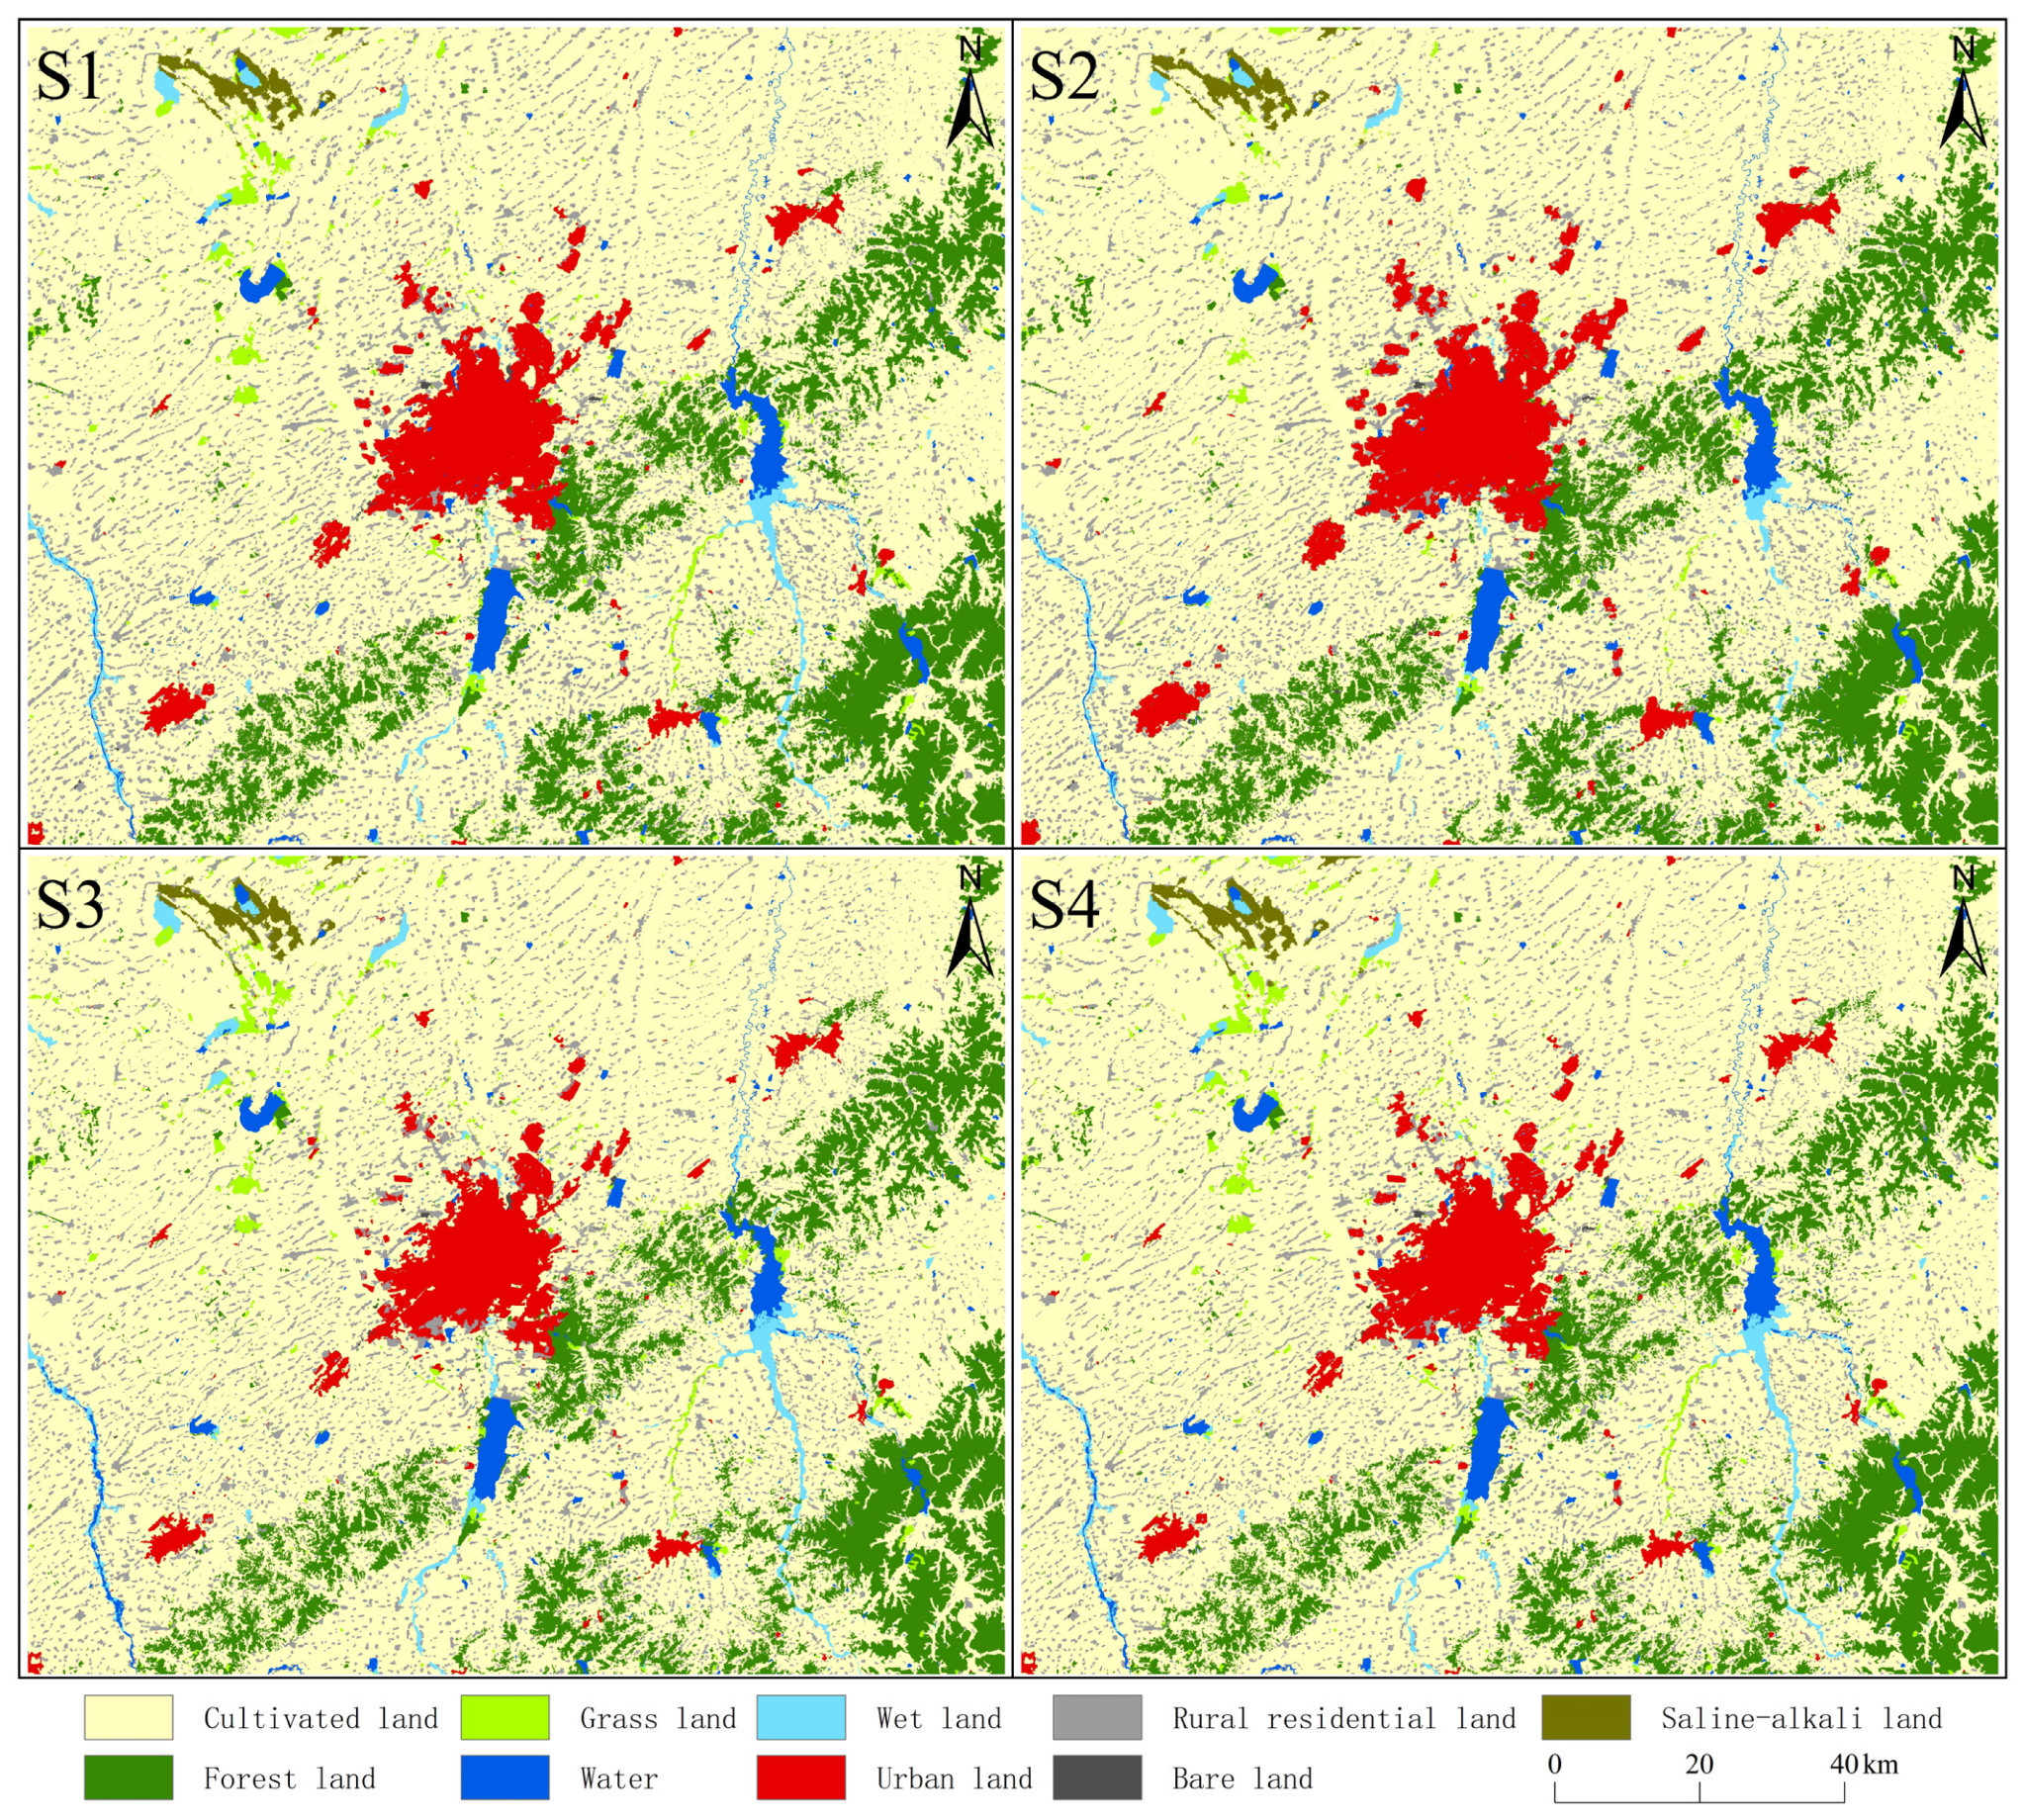
See Figure 8 for the simulation results of the spatial distribution of land use in Jilin Province in 2030. We found that the areas with obvious changes in land use were mainly concentrated in the northwest and southeast of Jilin Province and the central urban areas of various cities. Due to the large scope of Jilin Province, the representative central urban area of Changchun was selected for detailed analysis.
Changchun is the capital of Jilin Province. As shown in Figure 9, the scale of construction land in Changchun had different characteristics under different scenarios. Under S2, the scale of the central urban area of Changchun expanded rapidly, merging and absorbing the surrounding rural settlements and a large number of cultivated lands and bare lands. The original ecological land, such as forest and water in the central urban area was further occupied, most of which was transformed into urban construction land, and the forest land area in the southeast was also significant decreased. However, under this scenario, Gongzhuling city continues to expand eastward, basically realizing the merger of Changchun city and Gongzhuling city, embodies the typical characteristics of urban expansion. The change characteristics of the central urban area of Changchun under S1 are similar to those under S2, but the scale of the central urban area is much smaller than that under S2 scenario, and the change mainly occurs in the periphery of the central urban area, the land-use change within the urban area is relatively small, and the scale of forest, water and wetland basically remains unchanged. Under S3 and S4, due to the government’s attention to high-quality development and ecological protection, the expansion speed of the central urban area is slow, and under S3 scenario, the area of forest, water and wetland in Changchun has expanded to a certain extent on the original basis, the scale of construction land in the southeast has shrunk, and the area of cultivated land and unused land in Jingyuetan National Forest Park (south east part of Changchun) has gradually decreased, the area of forest land has further increased, the goal of ecological protection and land intensive and economical utilization has been basically realized.

4.3. Multi-Scenario Prediction of Habitat Quality in Jilin Province 2030

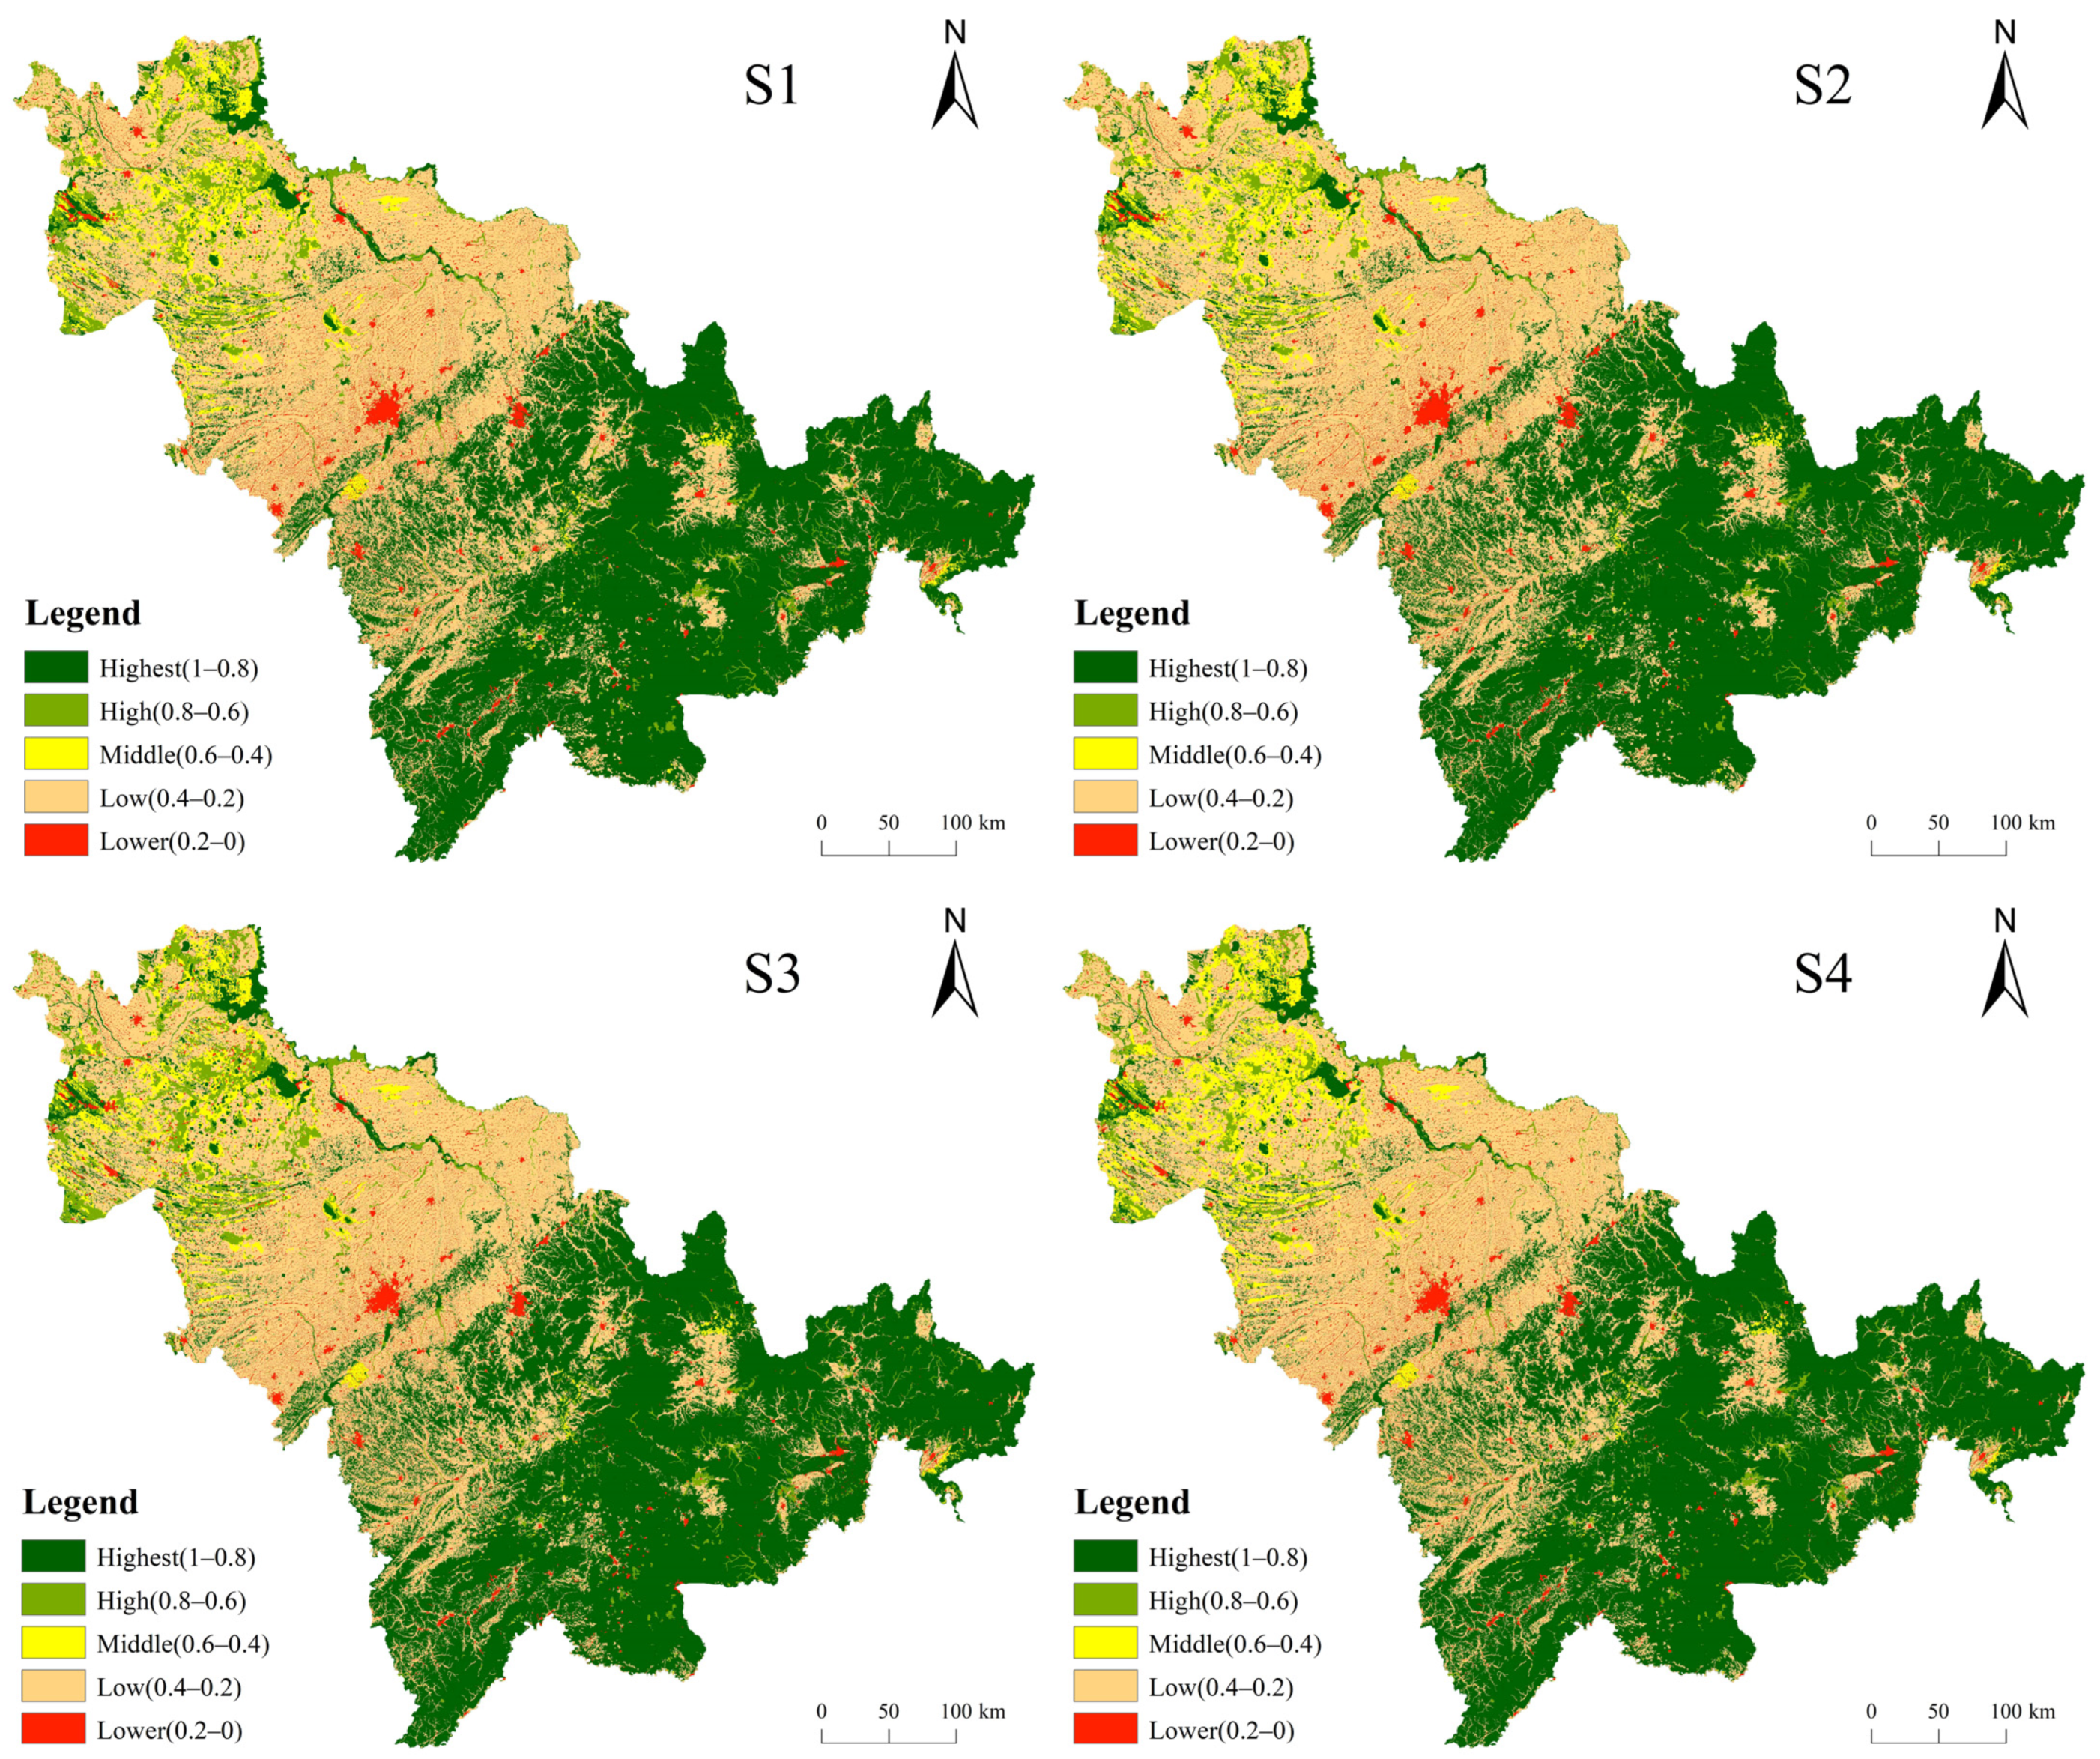
We put the simulation result of SD-PLUS coupling model into the InVEST model to obtain the spatial distribution of habitat quality in Jilin Province in 1995, 2015 and 4 scenarios of 2030. In order to facilitate the research, the habitat quality assessment results are divided into five categories according to the natural discontinuity classification method (49) in ArcGIS software: higher (1–0.8), high (0.8–0.6), middle (0.6–0.4), low (0.4–0.2), lowest (0.2–0). Six periods of spatial distribution of habitat quality in Jilin Province are shown in Figure 10 and Figure 11.

4.3.1. Temporal Variations in Habitat Quality in Jilin Province from 1995 to 2015

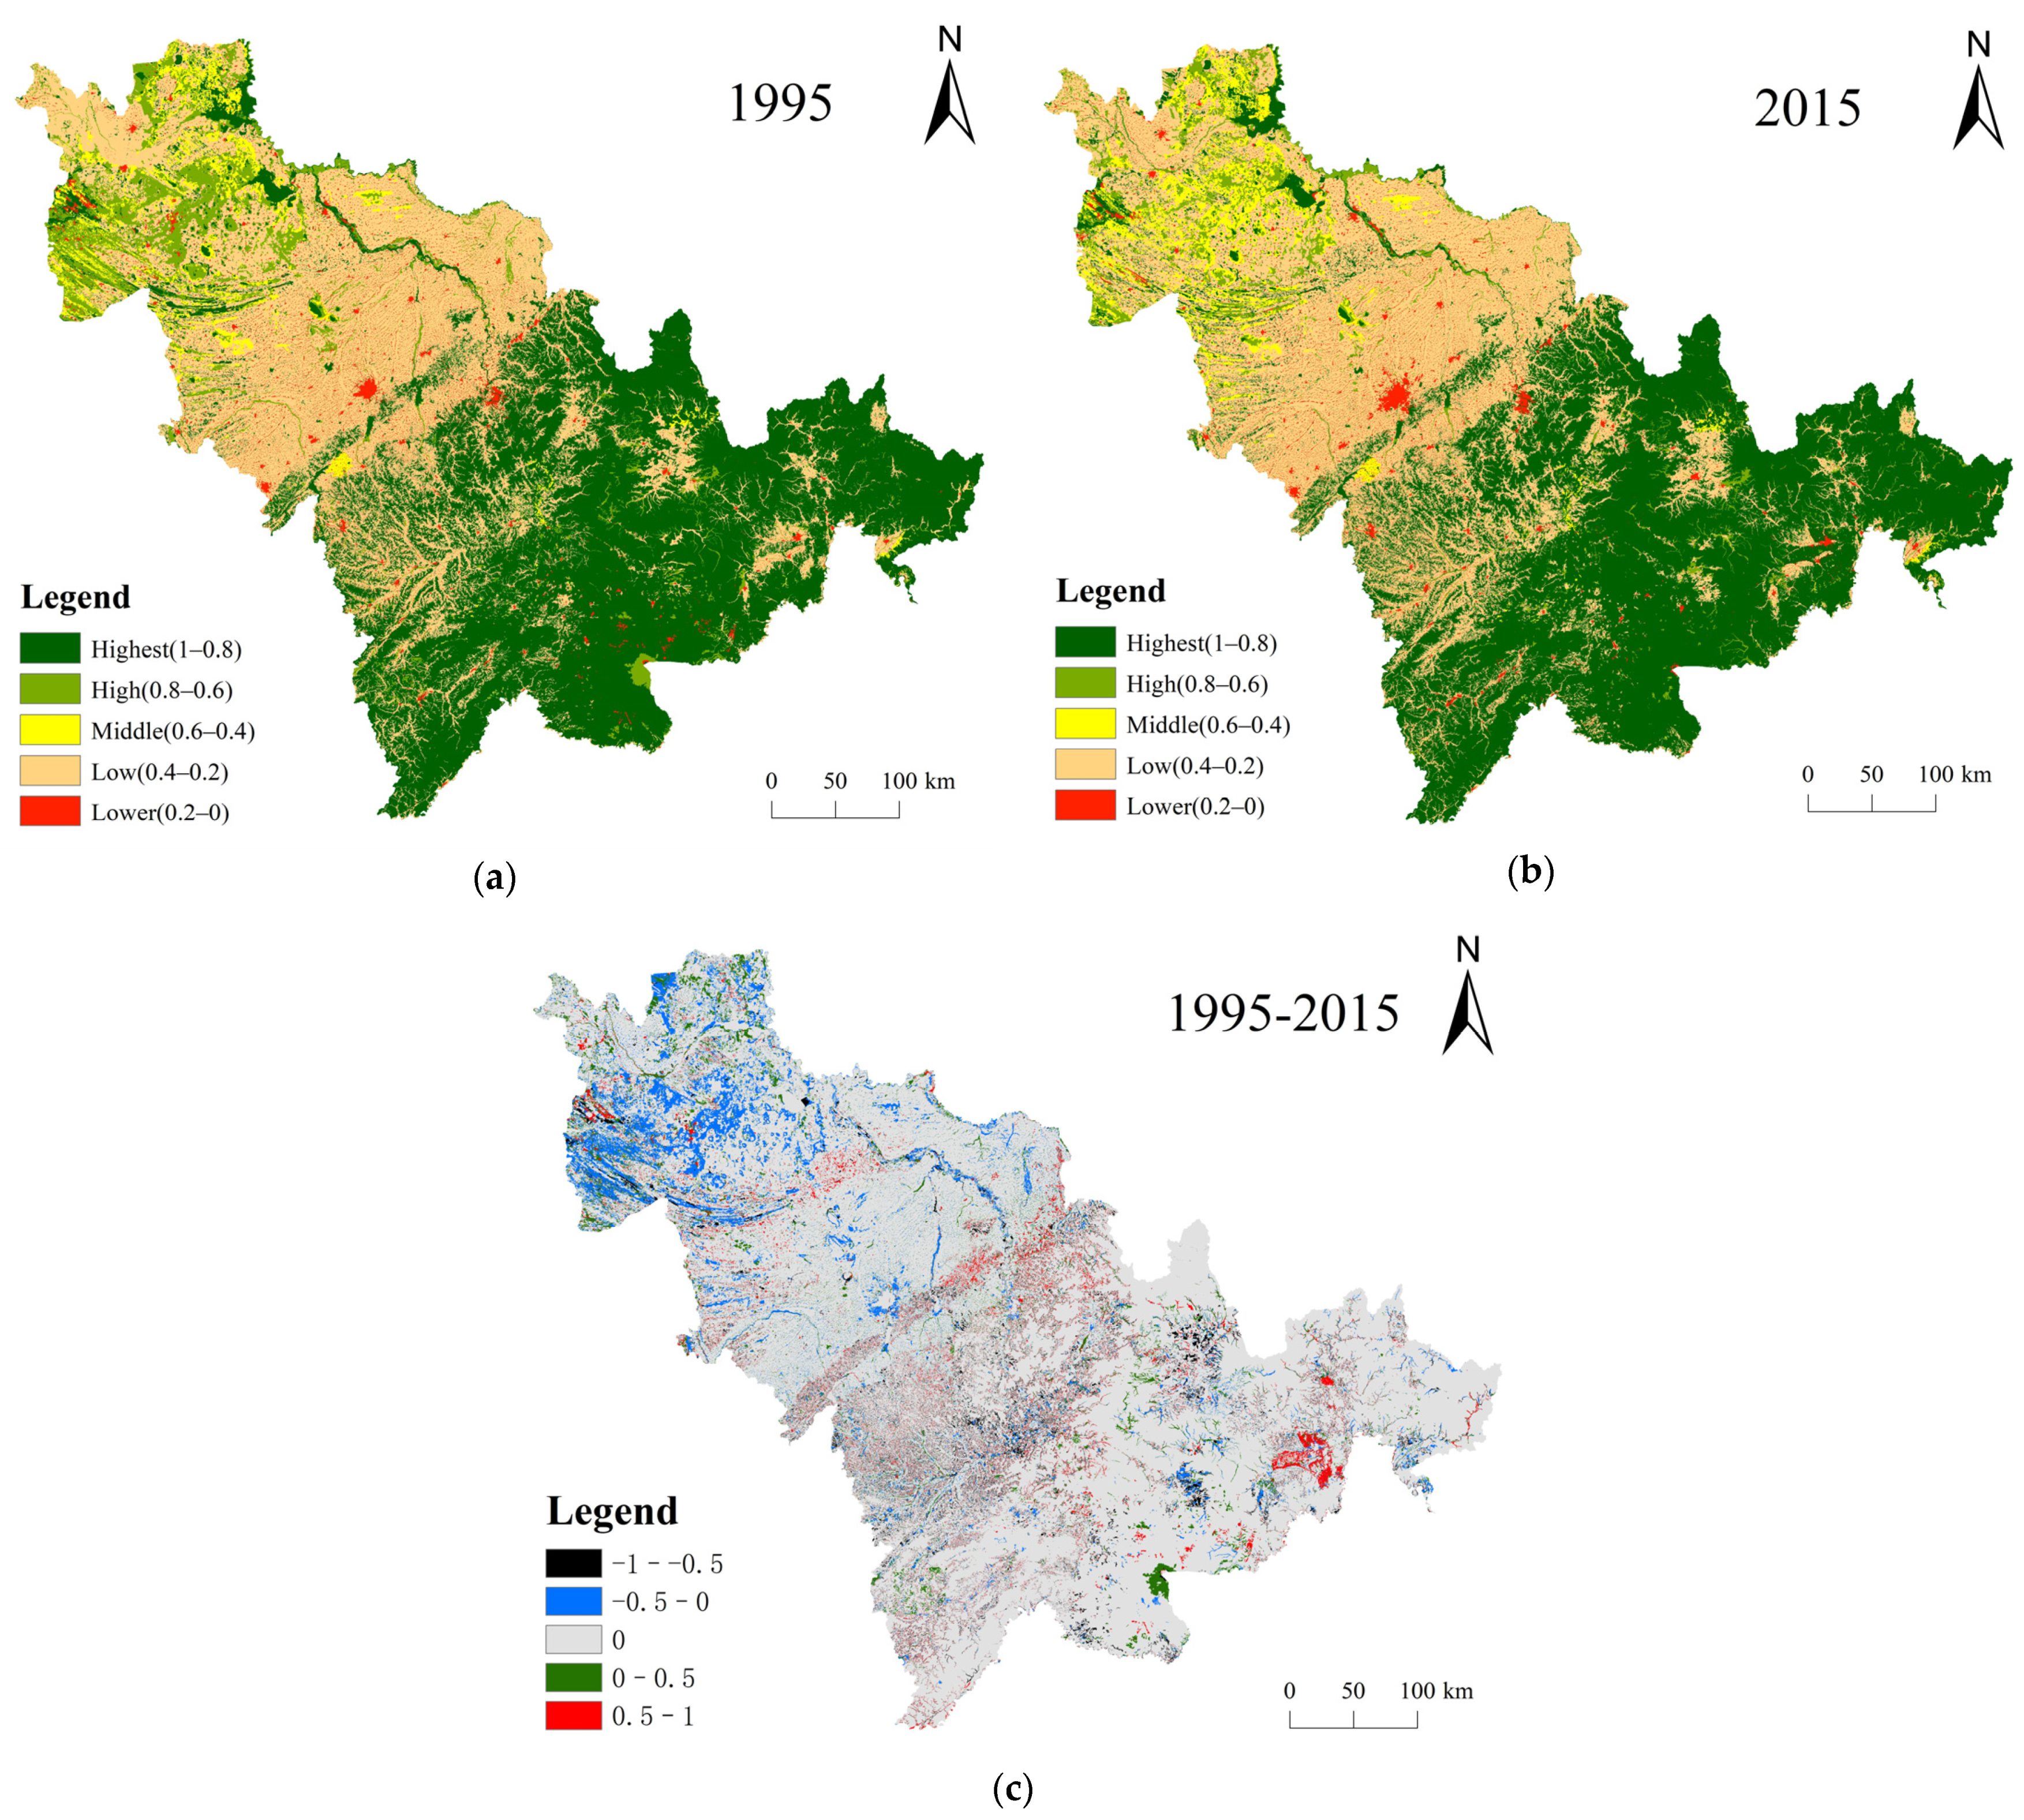
It can be seen from Figure 10A,B, that the habitat quality of Jilin Province mainly presented the spatial characteristics of “high in the southeast and low in the northwest”. Taking the Dahei mountains in the middle of Jilin Province as the dividing line, the habitat quality grade decreased from southeast to northwest. We used a raster calculator to process these two periods’ habitat quality data and then obtained the change in habitat quality (Figure 10C). The value of the change type was −1~1, and the closer the value was to −1, it proved that the habitat quality degradation in this area was more serious, otherwise it indicated that the habitat quality had improved, while 0 indicated that the habitat quality in this area did not greatly change. Overall, the average values of habitat quality in Jilin Province in 1995 and 2015 were 0.6898 and 0.6807, respectively, which were all in the “high” level, but showed a downward trend. Over the past 20 years, the area of “middle” grade has increased by 2658.46 km2, while the “high” level area has decreased from 15,981.07 to 10,711.65 km2, a decrease of 32.98%, the areas where habitat quality has degraded were mainly concentrated near Baicheng city in the northwest. Combined with land-use change, a large area of cultivated land and grassland in this area were degraded into saline–alkali land, and the scale of the original habitat quality grade of “highest” in the southeast of Jilin Province also shrunk to a certain extent.

4.3.2. Habitat Quality Prediction Results under Different Scenarios in Jilin Province in 2030

To 2030, the spatial distribution of habitat quality in Jilin Province under inertial growth (S1), rapid expansion (S2), ecological priority (S3), and coordinated development (S4) scenarios is shown in Figure 11. Under the four scenarios, the average values of habitat quality in Jilin Province in 2030 were 0.6733, 0.6702, 0.6882, and 0.6805, respectively. The predicted maximum value appeared in S3, and the minimum value appeared in S2. The order was S3 > S4 > S1 > S2, which is basically in line with the previous scenario setting. Although the average values of habitat quality under these four scenarios were all in the “high” level, compared with the average value of habitat quality in 2015, we found that only S3’s habitat quality improved by 0.0075, which proves that the role of strict ecological protection policy was significant. In S4, the area of urban construction land increased by 927.69 km2, but the average value of habitat quality decreased by only 0.0002. It can be seen that the scenario basically found the balance point between ecological protection and economic growth. In S2, the average value of habitat quality decreased by 0.0105 in 15 years, and the degradation rate of habitat quality was 0.0007/year, higher than 0.00045/year from 1995 to 2015; this proves that the deterioration of the ecological environment was accelerating. In S1, the degradation rate of habitat quality was 0.00037/year, basically continuing the previous trend. Generally speaking, the areas with a large spatial distribution gap of habitat quality grade in Jilin Province under the four scenarios were still concentrated in the northwest of Jilin Province (near Baicheng city), the southeast (near Baishan city and Yanbian Prefecture), and the central urban areas of various cities. In S3, the scale of the low-value area of habitat quality changed little compared with that at the beginning of the period, and the area of “high” level in the northwest has increased significantly. In S4, some “high” level areas near Baishan city in the northwest degenerated to “middle”, and the scale of the low-value area decreased a little. In S1 and S2, the ranges of the low value areas were significantly expanded with the increase in urban construction land.
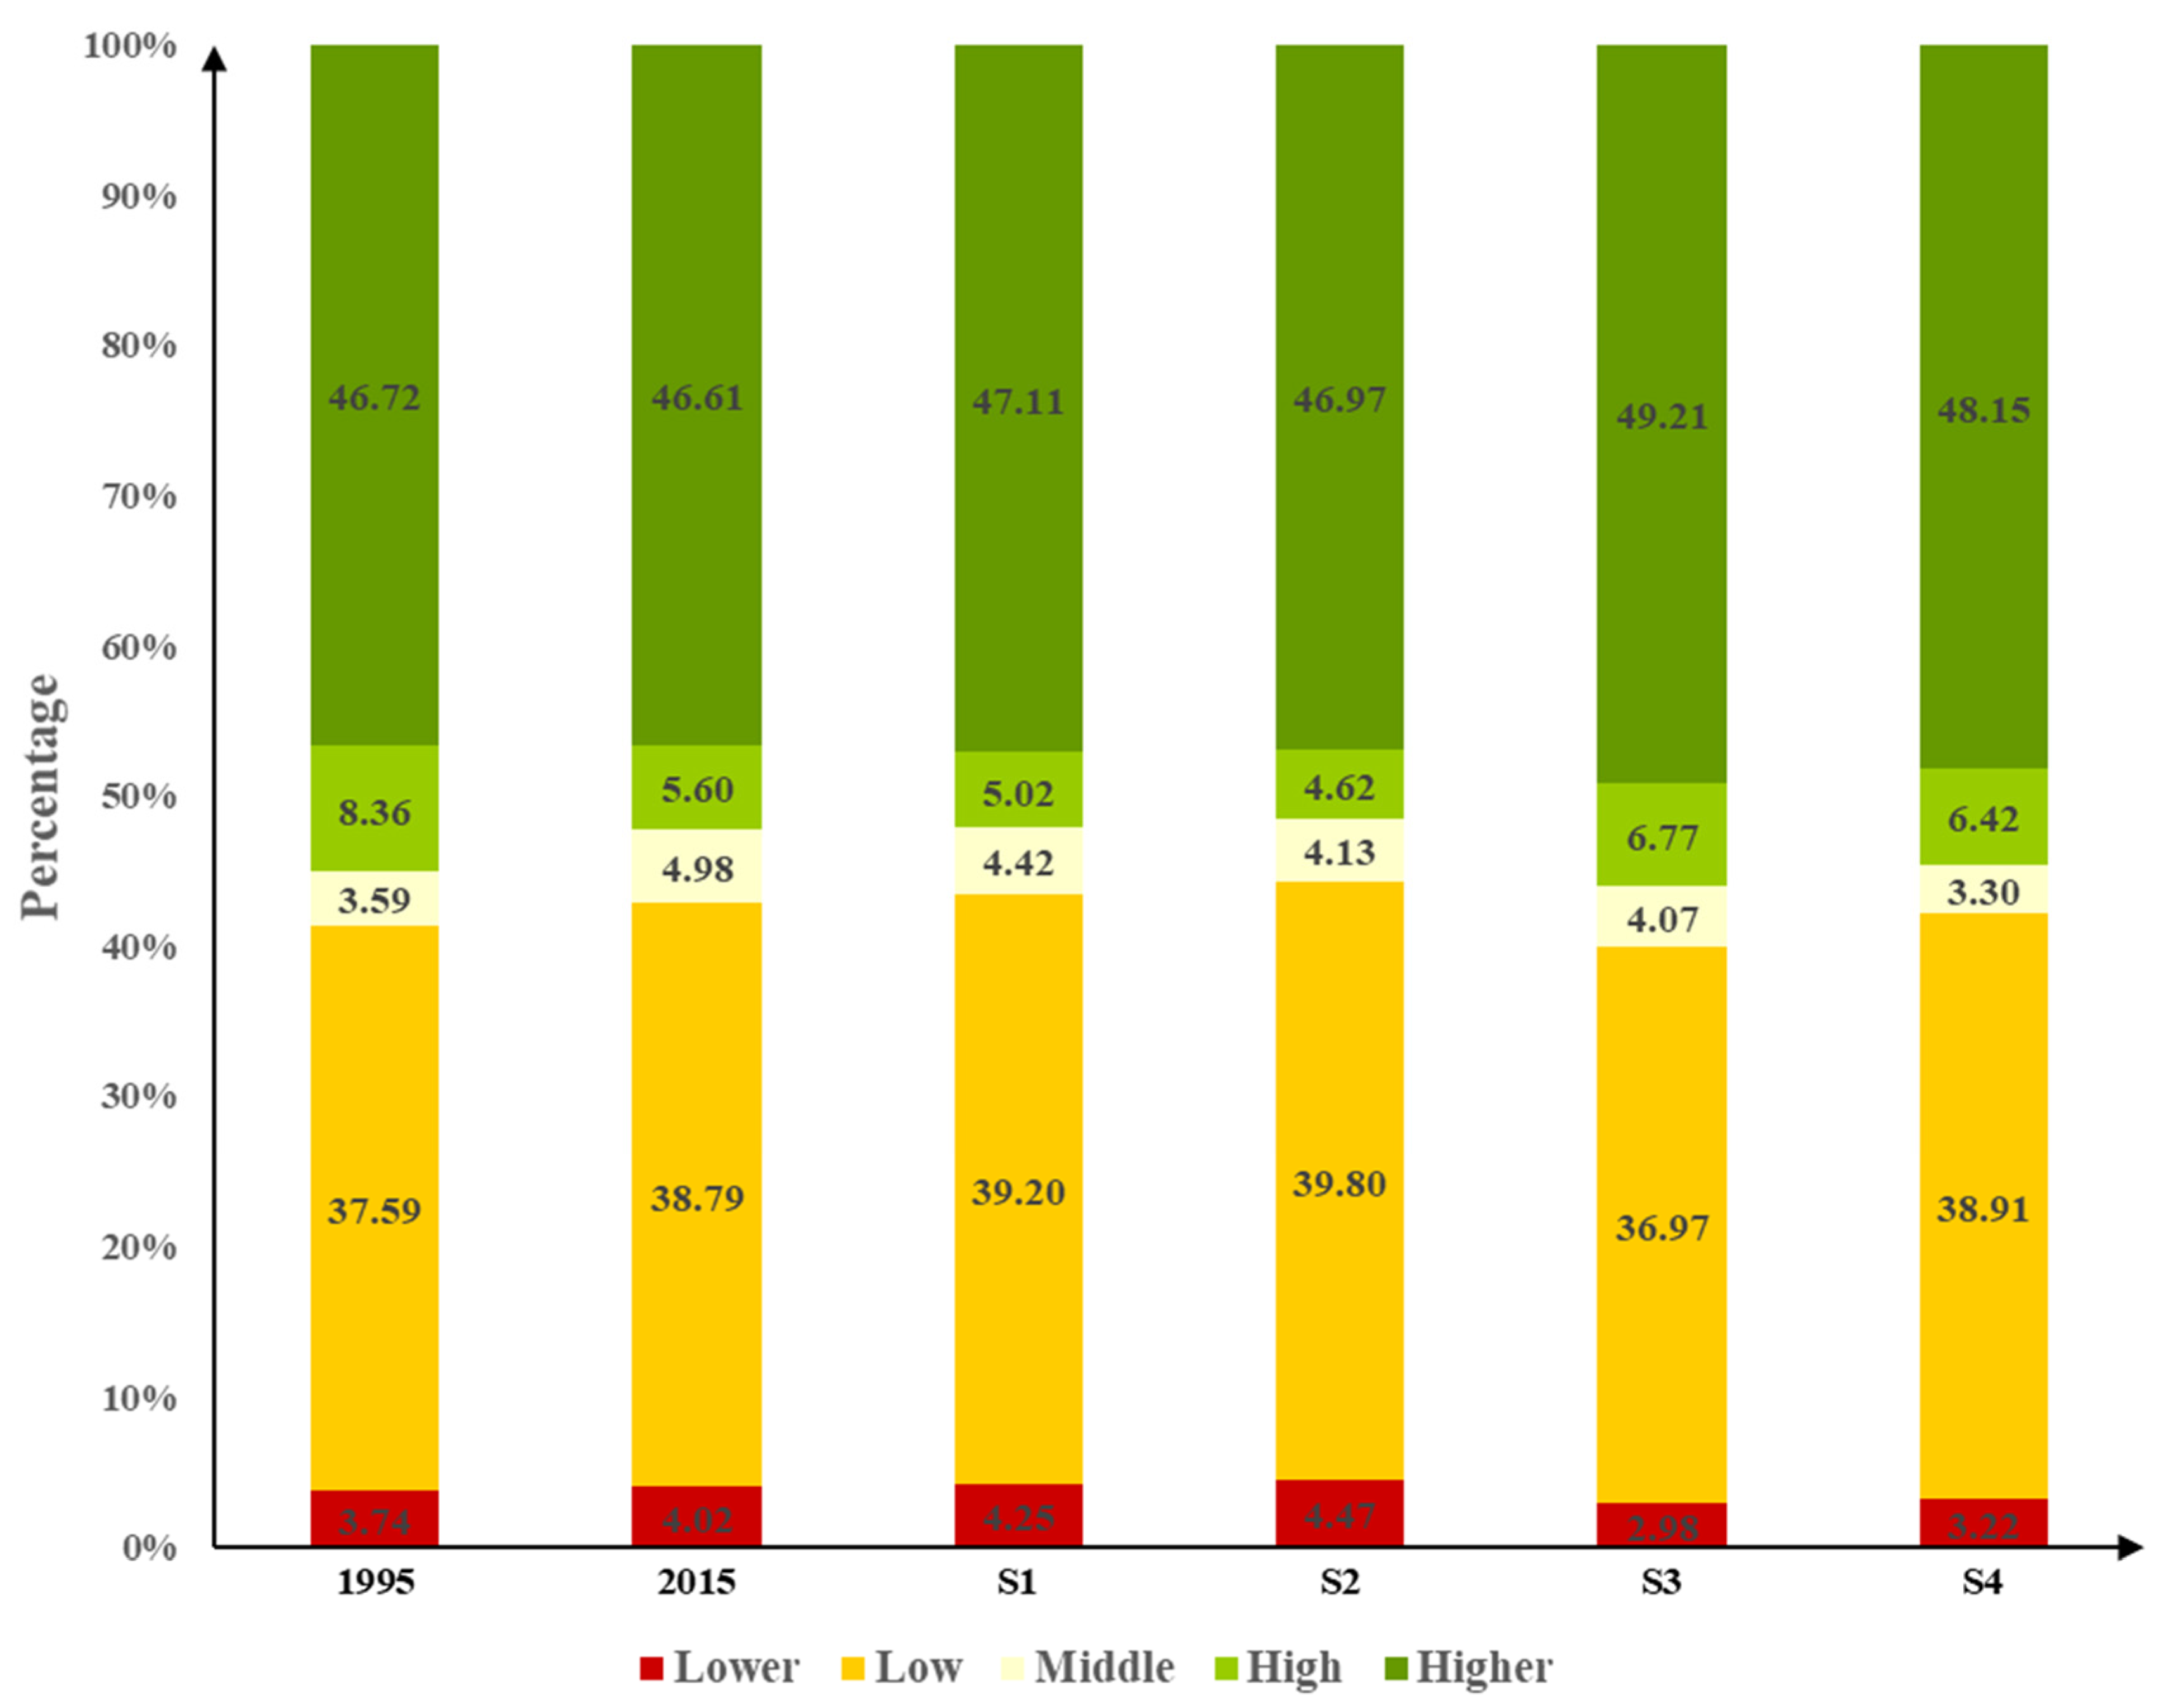
The area ratio of all levels in Jilin Province under the four scenarios in 1995, 2015, and 2030 are shown in Figure 12. We conclude that from 1995 to 2015, the proportion of “high” level areas decreased from 8.36% at the beginning to 5.6%; the proportion of “middle” and “low” grade areas increased by 1.39% and 1.2%, respectively; the proportion of “highest” and “lowest” grade areas changed little. Therefore, the degradation from “high” level to “middle” and “low” levels was an important reason for the continuous degradation of habitat quality in Jilin Province over the past 20 years. The situation of S1 and S2 were similar, the “high” level and “middle” level areas continued to transform to “low” and “lowest” level. A prominent feature of S2 is that the area of the “lowest” level accounted for 4.47%, which was the largest of the four scenarios. In S3 and S4, the areas with the “highest” and “high” levels increased significantly compared with 2015, the proportionate areas of these two levels increased by 2.6% and 1.17%, respectively, in S3 and by 1.54% and 0.82% in S4. At the same time, the proportion of “middle”, “low”, and “lowest” level areas were further reduced, and the overall level of habitat quality in Jilin Province was significantly improved.

5. Discussion

5.1. The Simulation Results of Land Use in Jilin Province

Firstly, in the simulation of land-use change, ANN–CA, CLUS-S, and the FLUS models, which are widely used at present, lack the mechanism to simulate the change in patch level in various places, especially for natural land types such as forest land and grassland. The PLUS model adopted a new analysis strategy (i.e., LESA) and multitype seed growth mechanism, making it more effectively simulate the automatic formation of patch under the constraint of development probability.
Secondly, human activities are one of the most important factors affecting regional land-use change, coupling the SD model with the PLUS model actually introduced human factors, such as socioeconomic development, policy intensity, and population growth, into the evolutionary analysis of the natural ecosystem by affecting land demand. That not only solves the problem of the poor spatial performance of the SD model, it can also reflect the impact of human activities on land-use change at the patch level, and the accuracy of the model will also be improved.
Thirdly, the grid pixel size of the land-use simulation research conducted for large-scale regions was mostly 1 km–90 m. For example, Liu Xiaoping and others used 1 × 1 km grid data in the process of land-use simulation in China [43]; 300 × 300 m land-use data were used by Zhang Xiaorong and others to simulate the multi-scenario of the China–Pakistan Economic Corridor [22]; Song Baiyuan and others used 100 × 100 m resolution grid data to simulate the multi-scene of China’s coastal zone. We use all types of grid data with 30 m precision as the data basis to simulate the provincial scope, which basically met the needs of large scale and high precision, and the results were also representative.

5.2. The Temporal and Spatial Changes in Habitat Quality in Jilin Province from 1995 to 2030

The habitat quality of Jilin Province showed the spatial characteristics of decreasing from southeast to northwest. This is because the “highest” levels were distributed in the east and south of Jilin Province, and the mountainous landforms and high forest coverage significantly improved the habitat quality of these regions. The “high” and “middle” levels were mainly distributed near Songyuan city and Baicheng city. There are many rivers, lakes, and wetlands in these areas; therefore, the habitat quality level was high. The “low” level was mainly distributed in the northwest of Jilin Province. The land-use type was dominated by cultivated land and the increasingly serious phenomenon of soil salinization, and these were the main reasons for the decline in the habitat quality in these areas. The “lowest” level was mainly distributed near the central urban area of each city. The large area of concentrated construction land and frequent human activities had a direct impact on the biodiversity and the function of ecosystem in these areas.
According to the prediction results of habitat quality in Jilin Province in 2030, in S2, Jilin Province continued the economic growth mode relying on large-scale land supply. The serious disorderly expansion and extensive land use further led to the rapid increase in urban construction land demand, and that indirectly intensified the competition between construction land and other land-use types and squeezed the original ecological space; Finally, this caused the continuous decline in the regional habitat quality. In S3, the high urbanization rate and technological level improved the quality of the population, generally; thus, Jilin Province can achieve its high-quality development aim. Getting rid of the extensive economic growth mode and deeply tapping the potential of land-use efficiency has fundamentally solved the problem of disorderly expansion of construction land. With the strictest ecological protection policy, the forest area in the southeast of Jilin Province was expanded on the original basis, the wetland area in the northwest was not reduced, and land salinization was effectively controlled; therefore, the habitat quality in this scenario was greatly improved. In the process of the S4 simulation, we found that although the area of urban construction land increased by 52.26%, the average value of habitat quality in this scenario decreased by only 0.0002. The main reason should be that an ecological balance point was formed due to the mutual transformation between different types, so that the decline of habitat quality caused by the expansion of construction land offset the rise of habitat quality caused by the increase in the ecological land area; this is of great reference value for the formulation of land-use policies and the setting of regional changes in Jilin Province in the future. Therefore, strict ecological protection policy is the premise of improving habitat quality. Reasonably controlling the scale of construction land, developing the existing potential of urban land, and limiting the disorderly expansion of cities are key to achieving sustainable development.
By analyzing the spatial distribution map of habitat quality in four different scenarios, we found that regional land-use change will have a great impact on habitat quality. The lowest level areas of habitat quality had high consistency with the spatial distribution of urban construction land. The scale of saline–alkali land in the northwest of Jilin Province in S2 was much larger than that in S3, which was reflected in the spatial distribution of habitat quality, that is, its “middle” level area was significantly more than that in S3. Basically, it formed a habitat quality pattern in which the “lowest” level was strongly related to urban construction land, the “low” level was strongly related to cultivated land, the “middle” level was strongly related to saline–alkali land, the “high” level was strongly related to grassland and wetland, and the “highest” level was strongly related to forest land. Thus, in the next development planning of Jilin Province, we should link the spatial division with the habitat quality (56) and incorporate the habitat quality into the feasibility evaluation system as a quantitative index.

5.3. Policy Recommendations

The habitat quality of Jilin Province is constantly changing with the economic development and the change in land use. In order to improve the future habitat quality of Jilin Province, improve the service function of ecosystem, and implement scientific land management policies, we put forward the following suggestions:
  • Formulating strict ecological protection policies plays a significant role in improving regional habitat quality. Therefore, we should establish the concept of ecological civilization of respecting nature, conforming to nature and protecting nature, strictly implement the demarcation of the red line of ecological protection, carry out the specific work on comprehensive land improvement, and conduct continuous supervision of the work results;
  • Land salinization is the main problem in the process of land use in the west of Jilin Province. The continuous increase in saline–alkali land areas will aggravate the risk of habitat quality degradation in the west of Jilin Province Strengthening the governance of land salinization, strictly controlling farmland circulation and stabilizing agricultural and animal husbandry space are key to improving the habitat quality in the west of Jilin Province;
  • For the low-value areas of habitat quality, Jilin Province needs to adhere to an ecological restoration policy that focuses on natural restoration and is supplemented by manual intervention so as to improve the regional vegetation coverage and NPP. In addition, the supervision and review of the development and construction activities in ecologically fragile areas should be strengthened, which can minimize the impact of human activities on the ecological balance;
  • The expansion of urban construction land directly affects the distribution of low-value habitat quality areas, thus affecting the overall habitat quality. Therefore, Jilin Province should reasonably control the total scale of urban construction land, deeply tap the potential of land-use efficiency, reduce the dependence on new construction land in the process of economic development by redeveloping the existing area and increasing the investment in high-tech industries. Jilin Province should gradually get rid of the extensive economic growth mode, reduce the proportion of land finance and, finally, achieve high-quality development.

5.4. Limitations and Implications

The first limitation of this research was that when the amount of data was large, we could not add more driving factors on the premise that the PLUS model does not report errors, which reduces the accuracy of the simulation results to a certain extent. It is also the main reason why the FoM index was not particularly high. The second limitation was that the setting of some parameters in the InVEST model was mainly based on previous research results and expert experience, and there is no unified standard, which makes the prediction results of habitat quality subjective. Moreover, the InVEST model estimates habitat quality mainly by accumulating the influence of various threat factors, but the simple accumulation of the influence of each threat factor is not completely equal to the comprehensive influence it makes on habitat quality; the comprehensive effect of multiple factors may be much greater than the simple sum of a single threat, which needs to be improved in the future research. Third, the SD–PLUS coupling model and InVEST model can predict the habitat quality at a specific time point, but it cannot completely describe the evolution process of habitat quality. In the next stage of research, we will try to introduce landscape pattern, so as to form a better ecological environment quality or ecological risk assessment framework.

6. Conclusions

This research first used the SD-PLUS coupling model to simulate the land-use situation of Jilin Province in 2030. Then, the InVEST model habitat quality module was used to analyze the temporal and spatial changes in habitat quality in Jilin Province from 1995 to 2015. Finally, the spatial patterns of habitat quality under different scenarios in Jilin Province in 2030 were predicted and analyzed. The results are summarized as follow:
(1)
There were significant differences in the land-use simulation results of four scenarios in Jilin Province in 2030. The areas with great changes were mainly in the saline–alkali land concentration areas in the northwest of Jilin Province and the forest in the south and the central urban areas of various cities. Under the rapid expansion scenario (S2), the total area of urban construction land increased to 2936.71 km2, an increase of 67.26%, and obvious signs of expansion appeared around and inside the central urban area. The change trend of the inertial growth scenario (S1) was similar to that in S2, but the expansion of urban construction land basically existed only around the central urban area, and there was no significant change within the urban area. Under the scenario of ecological priority (S3) and inertial growth (S4), the scale of urban construction land basically maintained the current situation, and it decreased slightly under S3;
(2)
The habitat quality of Jilin Province had the spatial characteristics of “high in the southeast and low in the northwest”. From 1995 to 2015, the average value of habitat quality in Jilin Province decreased from 0.6898 to 0.6807. This was mainly due to the large-area grassland and wetland degraded into unused land and saline–alkali land in the west of Jilin Province. The expansion of urban construction land also led to the increase in low-value areas of habitat quality;
(3)
The average value of the prediction of habitat quality in the four scenarios in Jilin Province in 2030 is as follows: S3 (0.6882) > S4 (0.6805) > S1 (0.6774) > S2 (0.6711). The areas with great differences in habitat quality were still the northwest and southeast of Jilin Province and the central urban areas of various cities, which are strongly related to land-type changes. Under S2, the degradation rate of habitat quality is further aggravated due to the extensive use of urban construction land and serious disorderly expansion of land; the S3 scenario benefited from the strictest ecological protection policy, which improved the quality of the regional habitat. Under S4, this scenario basically found the balance between economic development and ecological protection so that the habitat quality was not changed greatly, which has a high reference value for the future development of Jilin Province.

Author Contributions

Conceptualization, B.Z.; methodology, B.Z.; software, B.Z.; validation, B.Z.; formal analysis, B.Z.; investigation, B.Z.; resources, B.Z.; data curation, B.Z.; writing—original draft preparation, B.Z.; writing—review and editing, B.Z., S.L. and Z.L.; visualization, B.Z.; supervision, B.Z.; project administration, B.Z. and S.L.; funding acquisition, S.L. All authors have read and agreed to the published version of the manuscript.

Funding

This research was funded by the National Natural Science Foundation of China, the National Natural Science Foundation of Jilin Province, and the 14th Five-Year Plan for Natural Resources in Songyuan City (grant numbers: 71303006, 20210101395JC, and 20210305).

Institutional Review Board Statement

Not applicable.

Informed Consent Statement

Not applicable.

Data Availability Statement

Not applicable.

Conflicts of Interest

The authors declare no conflict of interest.

References

  1. Fellman, J.B.; Hood, E.; Dryer, W.; Pyare, S. Stream Physical Characteristics Impact Habitat Quality for Pacific Salmon in Two Temperate Coastal Watersheds. PLoS ONE 2015, 10, e0132652. [Google Scholar] [CrossRef] [Green Version]
  2. Wang, J.; Tian, J.; Lu, X. Assessment of Stream Habitat Quality in Naoli River Watershed, China. Shengtai Xuebao/Acta Ecol. Sin. 2010, 30, 481–486. [Google Scholar]
  3. Jomaa, I.; Auda, Y.; Abi Saleh, B.; Hamzé, M.; Safi, S. Landscape Spatial Dynamics over 38 Years under Natural and Anthropogenic Pressures in Mount Lebanon. Landsc. Urban Plan. 2008, 87, 67–75. [Google Scholar] [CrossRef]
  4. Su, W.; Gu, C.; Yang, G.; Chen, S.; Zhen, F. Measuring the Impact of Urban Sprawl on Natural Landscape Pattern of the Western Taihu Lake Watershed, China. Landsc. Urban Plan. 2010, 95, 61–67. [Google Scholar] [CrossRef]
  5. Bai, L.; Xiu, C.; Feng, X.; Liu, D. Influence of Urbanization on Regional Habitat Quality: A Case Study of Changchun City. Habitat Int. 2019, 93, 102042. [Google Scholar] [CrossRef]
  6. Zhong, L.; Wang, J. Evaluation on Effect of Land Consolidation on Habitat Quality Based on InVEST Model. Nongye Gongcheng Xuebao/Trans. Chin. Soc. Agric. Eng. 2017, 33, 250–255. [Google Scholar] [CrossRef]
  7. Watson, R.T.; Sebunya, K.; Levin, L.A.; Eisenhauer, N.; Lavorel, S.; Hickler, T.; Lundquist, C.; Gasalla, M.; Reyers, B. Post-2020 Aspirations for Biodiversity. One Earth 2021, 4, 893–896. [Google Scholar] [CrossRef]
  8. Wu, T.; Cui, Y.; Lian, A.; Tian, Y.; Li, R.; Liu, X.; Yan, J.; Xue, Y.; Liu, H.; Wu, B. Vehicle Emissions of Primary Air Pollutants from 2009 to 2019 and Projection for the 14th Five-Year Plan Period in Beijing, China. J. Environ. Sci. (China) 2023, 124, 513–521. [Google Scholar] [CrossRef]
  9. Durrant, R.; Ely, A. Deliberative-Analytic Approaches to Ecosystem Services as a Way Forward for the Land Sparing/Sharing Debate. Land Use Policy 2022, 116, 106061. [Google Scholar] [CrossRef]
  10. Capriolo, A.; Boschetto, R.G.; Mascolo, R.A.; Balbi, S.; Villa, F. Biophysical and Economic Assessment of Four Ecosystem Services for Natural Capital Accounting in Italy. Ecosyst. Serv. 2020, 46, 101207. [Google Scholar] [CrossRef]
  11. Mohan, C.; Levine, F. ARIES/IM: An Efficient and High Concurrency Index Management Method Using Write-Ahead Logging. ACM Sigmod Rec. 1992, 21, 371–380. [Google Scholar] [CrossRef]
  12. Aneseyee, A.B.; Noszczyk, T.; Soromessa, T.; Elias, E. The InVEST Habitat Quality Model Associated with Land Use/Cover Changes: A Qualitative Case Study of the Winike Watershed in the Omo-Gibe Basin, Southwest Ethiopia. Remote Sens. 2020, 12, 1103. [Google Scholar] [CrossRef] [Green Version]
  13. Xu, J.; Xie, G.; Xiao, Y.; Li, N.; Yu, F.; Pei, S.; Jiang, Y. Dynamic Analysis of Ecological Environment Quality Combined with Water Conservation Changes in National Key Ecological Function Areas in China. Sustainability 2018, 10, 1202. [Google Scholar] [CrossRef] [Green Version]
  14. Chen, Y.; Qiao, F.; Jiang, L. Effects of Land Use Pattern Change on Regional Scale Habitat Quality Based on InVEST Model-a Case Study in Beijing. Beijing Daxue Xuebao (Ziran Kexue Ban)/Acta Sci. Nat. Univ. Pekin. 2016, 52, 553–562. [Google Scholar] [CrossRef]
  15. Liu, Q.; Yang, D.; Cao, L.; Anderson, B. Assessment and Prediction of Carbon Storage Based on Land Use/Land Cover Dynamics in the Tropics: A Case Study of Hainan Island, China. Land 2022, 11, 244. [Google Scholar] [CrossRef]
  16. Chu, L.; Zhang, X.-R.; Wang, T.-W.; Li, Z.-X.; Cai, C.-F. Spatial-Temporal Evolution and Prediction of Urban Landscape Pattern and Habitat Quality Based on CA-Markov and InVEST Model. Chin. J. Appl. Ecol. 2018, 29, 4106–4118. [Google Scholar] [CrossRef]
  17. Wu, J.-S.; Cao, Q.-W.; Shi, S.-Q.; Huang, X.-L.; Lu, Z.-Q. Spatio-Temporal Variability of Habitat Quality in Beijing-Tianjin-Hebei Area Based on Land Use Change. Chin. J. Appl. Ecol. 2015, 26, 3457–3466. [Google Scholar]
  18. Chen, Z.; Yu, P.; Chen, Y.; Jiang, S.; Bai, S.; Gu, S. Spatio-Temporal Changes of Water Resources Ecosystem Services in the Hanjiang River Basin Based on the Shared Socioeconomic Pathway. Chin. J. Eco-Agric. 2021, 29, 1800–1814. [Google Scholar] [CrossRef]
  19. Ding, Q.; Chen, Y.; Bu, L.; Ye, Y. Multi-scenario Analysis of Habitat Quality in the Yellow River Delta by Coupling Flus with Invest Model. Int. J. Environ. Res. Public Health 2021, 18, 2389. [Google Scholar] [CrossRef] [PubMed]
  20. Li, Y.; Duo, L.; Zhang, M.; Wu, Z.; Guan, Y. Assessment and Estimation of the Spatial and Temporal Evolution of Landscape Patterns and Their Impact on Habitat Quality in Nanchang, China. Land 2021, 10, 1073. [Google Scholar] [CrossRef]
  21. Liang, Y.; Liu, L.; Huang, J. Integrating the SD-CLUE-S and InVEST Models into Assessment of Oasis Carbon Storage in Northwestern China. PLoS ONE 2017, 12, e0172494. [Google Scholar] [CrossRef] [PubMed]
  22. Zhang, X.R.; Li, A.N.; Nan, X.; Lei, G.B.; Wang, C.B. Multi-scenario simulation of land use change along China-Pakistan Economic Corridor through coupling FLUS model with SD mode. J. Geo-Inf. Sci. 2020, 22, 2393–2409. [Google Scholar] [CrossRef]
  23. Wang, Z.; Li, X.; Mao, Y.; Li, L.; Wang, X.; Lin, Q. Dynamic Simulation of Land Use Change and Assessment of Carbon Storage Based on Climate Change Scenarios at the City Level: A Case Study of Bortala, China. Ecol. Indic. 2022, 134, 108499. [Google Scholar] [CrossRef]
  24. Liang, X.; Guan, Q.; Clarke, K.C.; Liu, S.; Wang, B.; Yao, Y. Understanding the Drivers of Sustainable Land Expansion Using a Patch-Generating Land Use Simulation (PLUS) Model: A Case Study in Wuhan, China. Comput. Environ. Urban Syst. 2021, 85, 101569. [Google Scholar] [CrossRef]
  25. Zhang, S.; Zhong, Q.; Cheng, D.; Xu, C.; Chang, Y.; Lin, Y.; Li, B. Landscape Ecological Risk Projection Based on the PLUS Model under the Localized Shared Socioeconomic Pathways in the Fujian Delta Region. Ecol. Indic. 2022, 136, 108642. [Google Scholar] [CrossRef]
  26. Meng, C.H.; Wang, Y.; Zhuang, Y.S.; Su, W.; Li, A.; Duan, L.J.; Sun, T.B.; Xu, G.M. Research on Ecosystem Service Evaluation of Jilin Province Based on InVEST Model. J. Green Sci. Technol. 2021, 23, 5. [Google Scholar] [CrossRef]
  27. Yu, H.; Yang, J.; Sun, D.; Li, T.; Liu, Y. Spatial Responses of Ecosystem Service Value during the Development of Urban Agglomerations. Land 2022, 11, 165. [Google Scholar] [CrossRef]
  28. The 14th Five-Year Plan for the National Economic and Social Development of Jilin Province and the Vision for 2035. Available online: http://www.jl.gov.cn/zw/yw/jlyw/202104/t20210424_8037957.html (accessed on 31 March 2022).
  29. Zhang, P.; Wang, J.Z.; Li, C.J.; Jin, R.; Zhu, W.H.; Yan, H.Q. Spatio-temporal dynamics of habitat quality in Jilin Province based on land cover change. Agric. Sci. J. Yanbian Univ. 2021, 43, 8. [Google Scholar] [CrossRef]
  30. Ren, J.; Xie, R.; Zhu, H.; Zhao, Y.; Zhang, Z. Comparative Study on the Abilities of Different Crack Parameters to Estimate the Salinity of Soda Saline-Alkali Soil in Songnen Plain, China. Catena 2022, 213, 106221. [Google Scholar] [CrossRef]
  31. Xia, J.; Ren, J.; Zhang, S.; Wang, Y.; Fang, Y. Forest and Grass Composite Patterns Improve the Soil Quality in the Coastal Saline-Alkali Land of the Yellow River Delta, China. Geoderma 2019, 349, 25–35. [Google Scholar] [CrossRef]
  32. Resource and Enviorment Science and Data Center. Available online: https://www.resdc.cn/DOI/DOI.aspx?DOIid=54 (accessed on 31 March 2022).
  33. Chen, Y.; Guo, F.; Wang, J.; Cai, W.; Wang, C.; Wang, K. Provincial and Gridded Population Projection for China under Shared Socioeconomic Pathways from 2010 to 2100. Sci. Data 2020, 7, 1–13. [Google Scholar] [CrossRef] [Green Version]
  34. Wang, B.; Cheng, W. Effects of Land Use/Cover on Regional Habitat Quality under Different Geomorphic Types Based on InVEST Model. Remote Sens. 2022, 14, 1279. [Google Scholar] [CrossRef]
  35. Han, J.; Hayashi, Y.; Cao, X.; Imura, H. Application of an Integrated System Dynamics and Cellular Automata Model for Urban Growth Assessment: A Case Study of Shanghai, China. Landsc. Urban Plan. 2009, 91, 133–141. [Google Scholar] [CrossRef]
  36. O’Keeffe, J.; Pluchinotta, I.; De Stercke, S.; Hinson, C.; Puchol-Salort, P.; Mijic, A.; Zimmermann, N.; Collins, A.M. Evaluating Natural Capital Performance of Urban Development through System Dynamics: A Case Study from London. Sci. Total Environ. 2022, 824, 133–141. [Google Scholar] [CrossRef] [PubMed]
  37. Wang, X.; Che, L.; Zhou, L.; Xu, J. Spatio-Temporal Dynamic Simulation of Land Use and Ecological Risk in the Yangtze River Delta Urban Agglomeration, China. Chin. Geogr. Sci. 2021, 31, 829–847. [Google Scholar] [CrossRef]
  38. Prasad, P.; Loveson, V.J.; Chandra, P.; Kotha, M. Evaluation and Comparison of the Earth Observing Sensors in Land Cover/Land Use Studies Using Machine Learning Algorithms. Ecol. Inform. 2022, 68, 101522. [Google Scholar] [CrossRef]
  39. Ai, B.; Xie, D.; Ma, S.; Jiang, H. An EasyCA Model with Few Steady Variables and Clone Stamp Strategy for Simulation of Urban Growth in Metropolitan Areas. Ecol. Model. 2022, 468, 109950. [Google Scholar] [CrossRef]
  40. Wang, X.; Yao, Y.; Ren, S.; Shi, X. A Coupled FLUS and Markov Approach to Simulate the Spatial Pattern of Land Use in Rapidly Developing Cities. J. Geo-Inf. Sci. 2022, 24, 100–113. [Google Scholar] [CrossRef]
  41. Chen, X.; Yu, L.; Du, Z.; Xu, Y.; Zhao, J.; Zhao, H.; Zhang, G.; Peng, D.; Gong, P. Distribution of Ecological Restoration Projects Associated with Land Use and Land Cover Change in China and Their Ecological Impacts. Sci. Total Environ. 2022, 825, 153938. [Google Scholar] [CrossRef]
  42. Xue, C.; Zhang, H.; Wu, S.; Chen, J.; Chen, X. Spatial-Temporal Evolution of Ecosystem Services and Its Potential Drivers: A Geospatial Perspective from Bairin Left Banner, China. Ecol. Indic. 2022, 137, 108760. [Google Scholar] [CrossRef]
  43. Liu, X.; Liang, X.; Li, X.; Xu, X.; Ou, J.; Chen, Y.; Li, S.; Wang, S.; Pei, F. A Future Land Use Simulation Model (FLUS) for Simulating Multiple Land Use Scenarios by Coupling Human and Natural Effects. Landsc. Urban Plan. 2017, 168, 94–116. [Google Scholar] [CrossRef]
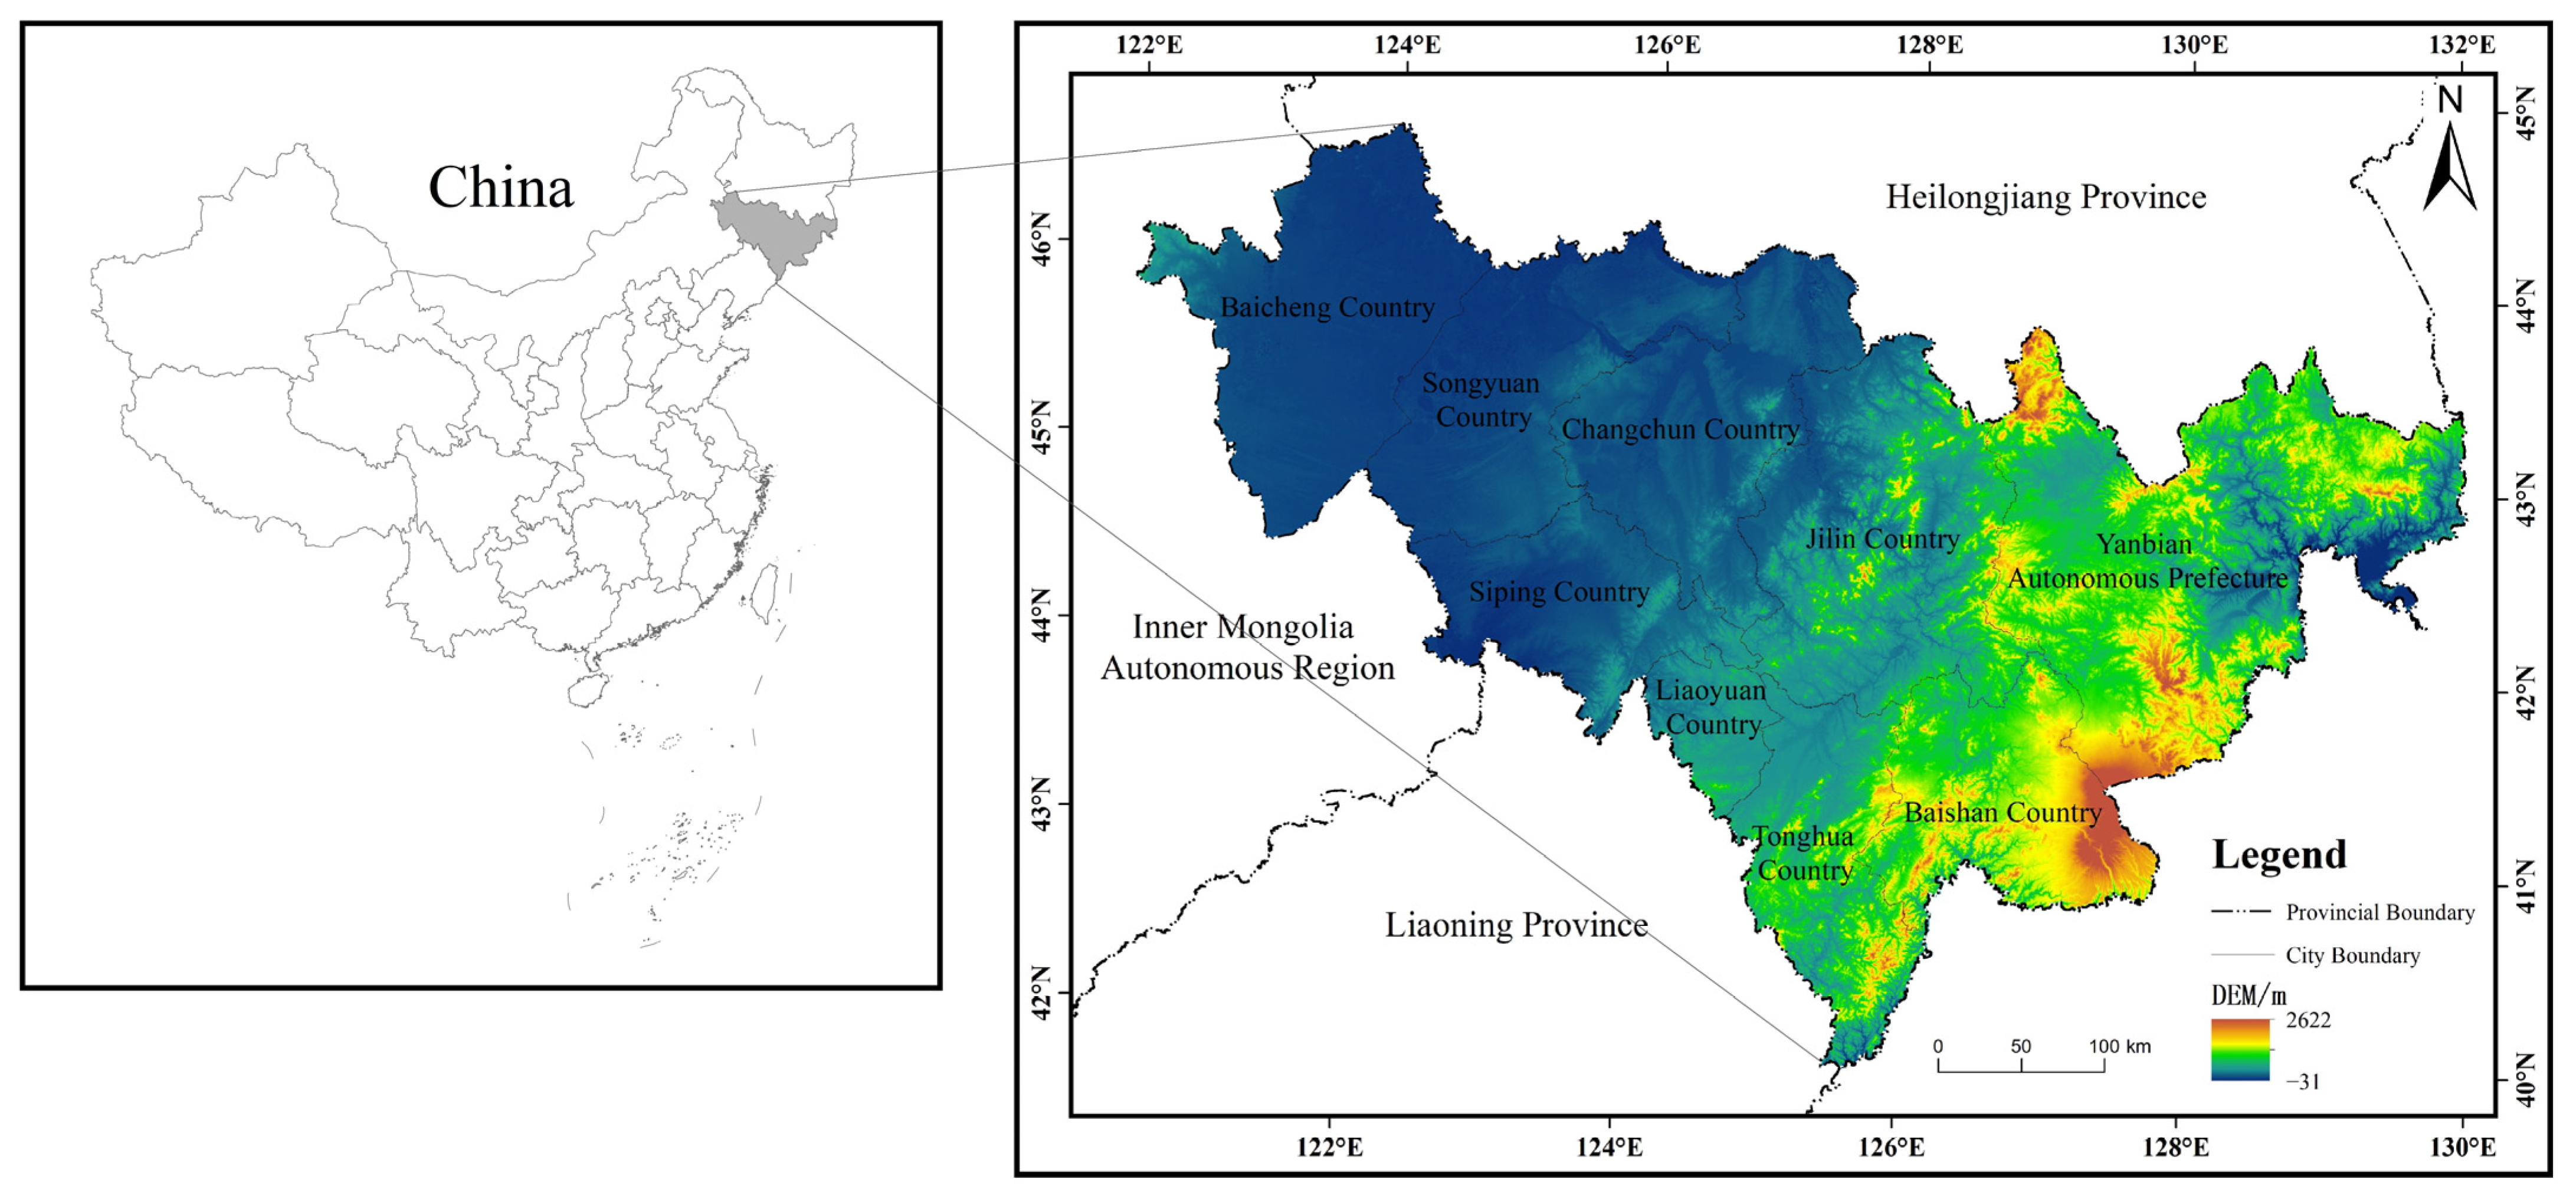
Figure 1. Location of the Jilin Province in China.
Sustainability 14 05303 g001
Figure 2. Driving factors of land use in Jilin Province: (a) distance to highway; (b) distance to railway; (c) distance to city center; (d) DEM; (e) slope; (f) precipitation; (g) temperature; (h) GDP; (i) population.
Sustainability 14 05303 g002
Figure 3. General modeling framework of the integrated SD–PLUS and InVEST model.
Sustainability 14 05303 g003
Figure 4. Causality diagram of land-use SD in Jilin Province.
Sustainability 14 05303 g004
Figure 5. Comparison of the SD simulation results with the actual quantity.
Sustainability 14 05303 g005
Figure 6. Comparison of the simulation results with the real results.
Sustainability 14 05303 g006
Figure 7. Simulation results of land demand in 2030.
Sustainability 14 05303 g007
Figure 8. Land-use map of 2030 in (Scenario 1Scenario 4). ((Scenario 1) refers to Inertial growth; (Scenario 2) refers to Rapid expansion; (Scenario 3) refers to Ecological priority; (Scenario 4) refers to Coordinated development)).
Sustainability 14 05303 g008
Figure 9. Comparison of land-use simulation results in Changchun. ((S1) refers to Inertial growth; (S2) refers to Rapid expansion; (S3) refers to Ecological priority; (S4) refers to Coordinated development)).
Sustainability 14 05303 g009
Figure 10. The spatial distribution and changes in Jilin’s habitat quality in 1995, 2015: (a) the habitat quality of Jilin Province in 1995; (b) the habitat quality of Jilin Province in 2015; (c) changes in the habitat quality in Jilin Province from 1995 to 2015.
Sustainability 14 05303 g010
Figure 11. The spatial distribution of the. habitat quality in (S1S4). ((S1) refers to Inertial growth; (S2) refers to Rapid expansion; (S3) refers to Ecological priority; (S4) refers to Coordinated development)).
Sustainability 14 05303 g011
Figure 12. Area ratio of each habitat quality level of Jilin Province in 1995–2030.
Sustainability 14 05303 g012
Table 1. Data source and relative data descriptions.
CategoryData NameData TypeData SourceData Description
Land use 1995–2015 Land-use data of Jilin ProvinceRaster/30 mResource and Environment Science and Data Center (www.resdc.cn) (accessed on 25 March 2022)Used ArcMap 10.6 to Process the data and finally included 9 land types.
Socioeconomic dataGDPStatistical dataStatistical Bureau of Jilin ProvinceUsed for SD model input and data verification.
Population
Industrial output value data
Water dataNatural Resources Bureau of Jilin Province
Driving factorsDEMRaster/30 mGeospatial Data Cloud (gscloud.cn) (accessed on 18 March 2022)Used ENVI 5.3 to process data.
SlopeCalculated from DEA
Distance to railwayNatural Resources Bureau of Jilin ProvinceThe distance data were calculated using the ArcGIS Euclidean distance tool.
Distance to highway
Distance to city center
Annual average temperatureResource and Environment Science and Data Center (www.resdc.cn) (accessed on 25 March 2022)The inverse distance interpolation tool (IDW) in ArcGIS was used to interpolate the national data, and on this basis, the data of Jilin Province was extracted according to the boundary.
Annual average precipitation
GDP distributionRaster/1 kmResource and Environment Science and Data Center (www.resdc.cn) (accessed on 25 March 2022)After clipping, interpolation and resampling, it was converted to 30 m grid.
Population distribution
Restricted areaNatural reserveRaster/30 mNatural Resources Bureau of Jilin ProvinceIncluded national-, provincial-, municipal- and county-level nature reserves.
Table 3. Neighborhood weights of all land-use types.
Land-Use TypeNeighborhood Weights
Cultivated land0.041
Forest0.085
Grassland0.346
Water0.089
Wetland0.022
Urban construction land0.311
Rural settlements0.066
Bare land0.032
Saline–alkali land0.008
Table 4. Land-use transformation matrix.
ScenarioLand-Use TypeCultivated LandForestGrasslandWaterWetlandUrban Construction LandRural
Settlements
Bare LandSaline–Alkali Land
S1 and S2Cultivated land111111111
Forest111111111
Grassland111111111
Water111111111
Wetland111111111
Urban construction land000001010
Rural settlements111111111
Bare land111111111
Saline–alkali land111111111
S3 and S4Cultivated land111111111
Forest111011110
Grassland101111111
Water011111110
Wetland111110011
Urban construction land000001110
Rural settlements111001110
Bare land111111110
Saline–alkali land111110011
Table 5. Threat factors and weight in study area.
Threat FactorsMaximum Distance/kmWeightDecay
Cultivated land40.6Linear
Urban construction land80.9Exponential
Rural settlements40.6Exponential
Bare land2.50.7Exponential
Saline–alkali land2.50.3Linear
Table 6. Sensitivity of land-use types to threat factors.
Types of LULCHabitatCultivated LandUrban Construction LandRural SettlementsBare LandSaline–Alkali Land
Cultivated land0.40.60.50.350.20.2
Forest10.50.80.60.50.2
Grassland0.70.450.70.50.250.2
Water0.950.610.750.20.15
Wetland0.80.70.750.50.70.3
Urban construction land000000
Rural settlements000000
Bare land0.10.050.050.050.10.1
Saline–alkali land0.50.20.20.150.10.1
Table 7. Simulation error in the system dynamic model.
Unit (km2)Cultivated LandForestGrass LandWaterWetlandUrban Construction LandRural SettlementsBare LandSaline–Alkali Land
2015
Simulation value
75,585.584,800.26799.73123.14430.11755.65789.9902.48080.3
2015
Actual value
75,637.084,832.86863.63256.94580.61736.75636.0315.98097.9
Relative error (%)−0.07−0.04−0.93−4.11−3.29+1.09+2.73+185.96−0.22
Publisher’s Note: MDPI stays neutral with regard to jurisdictional claims in published maps and institutional affiliations.