
Gender Disparities in the Access and Use of Urban Public Transport in Abuja, Nigeria


Abstract
:1. Introduction
- What is the structure of public transport services in terms of men’s and women’s accessibility and usage in Abuja?
- What are the various experiences of men and women in accessing and using public transport services in Abuja?
- What challenges do men and women encounter in accessing and using public transport systems in Abuja?
- What interventions can be recommended to address gender disparities in public transport access in Abuja?
2. Literature Review
2.1. The Structure and Institutional Arrangement of Urban Transportation in Africa
2.2. Gender Differences in Access to Public Transport Services
3. Methods
3.1. Research Design
3.2. Data Collection Techniques
3.3. Data Analysis
4. Results
4.1. Qualitative Data
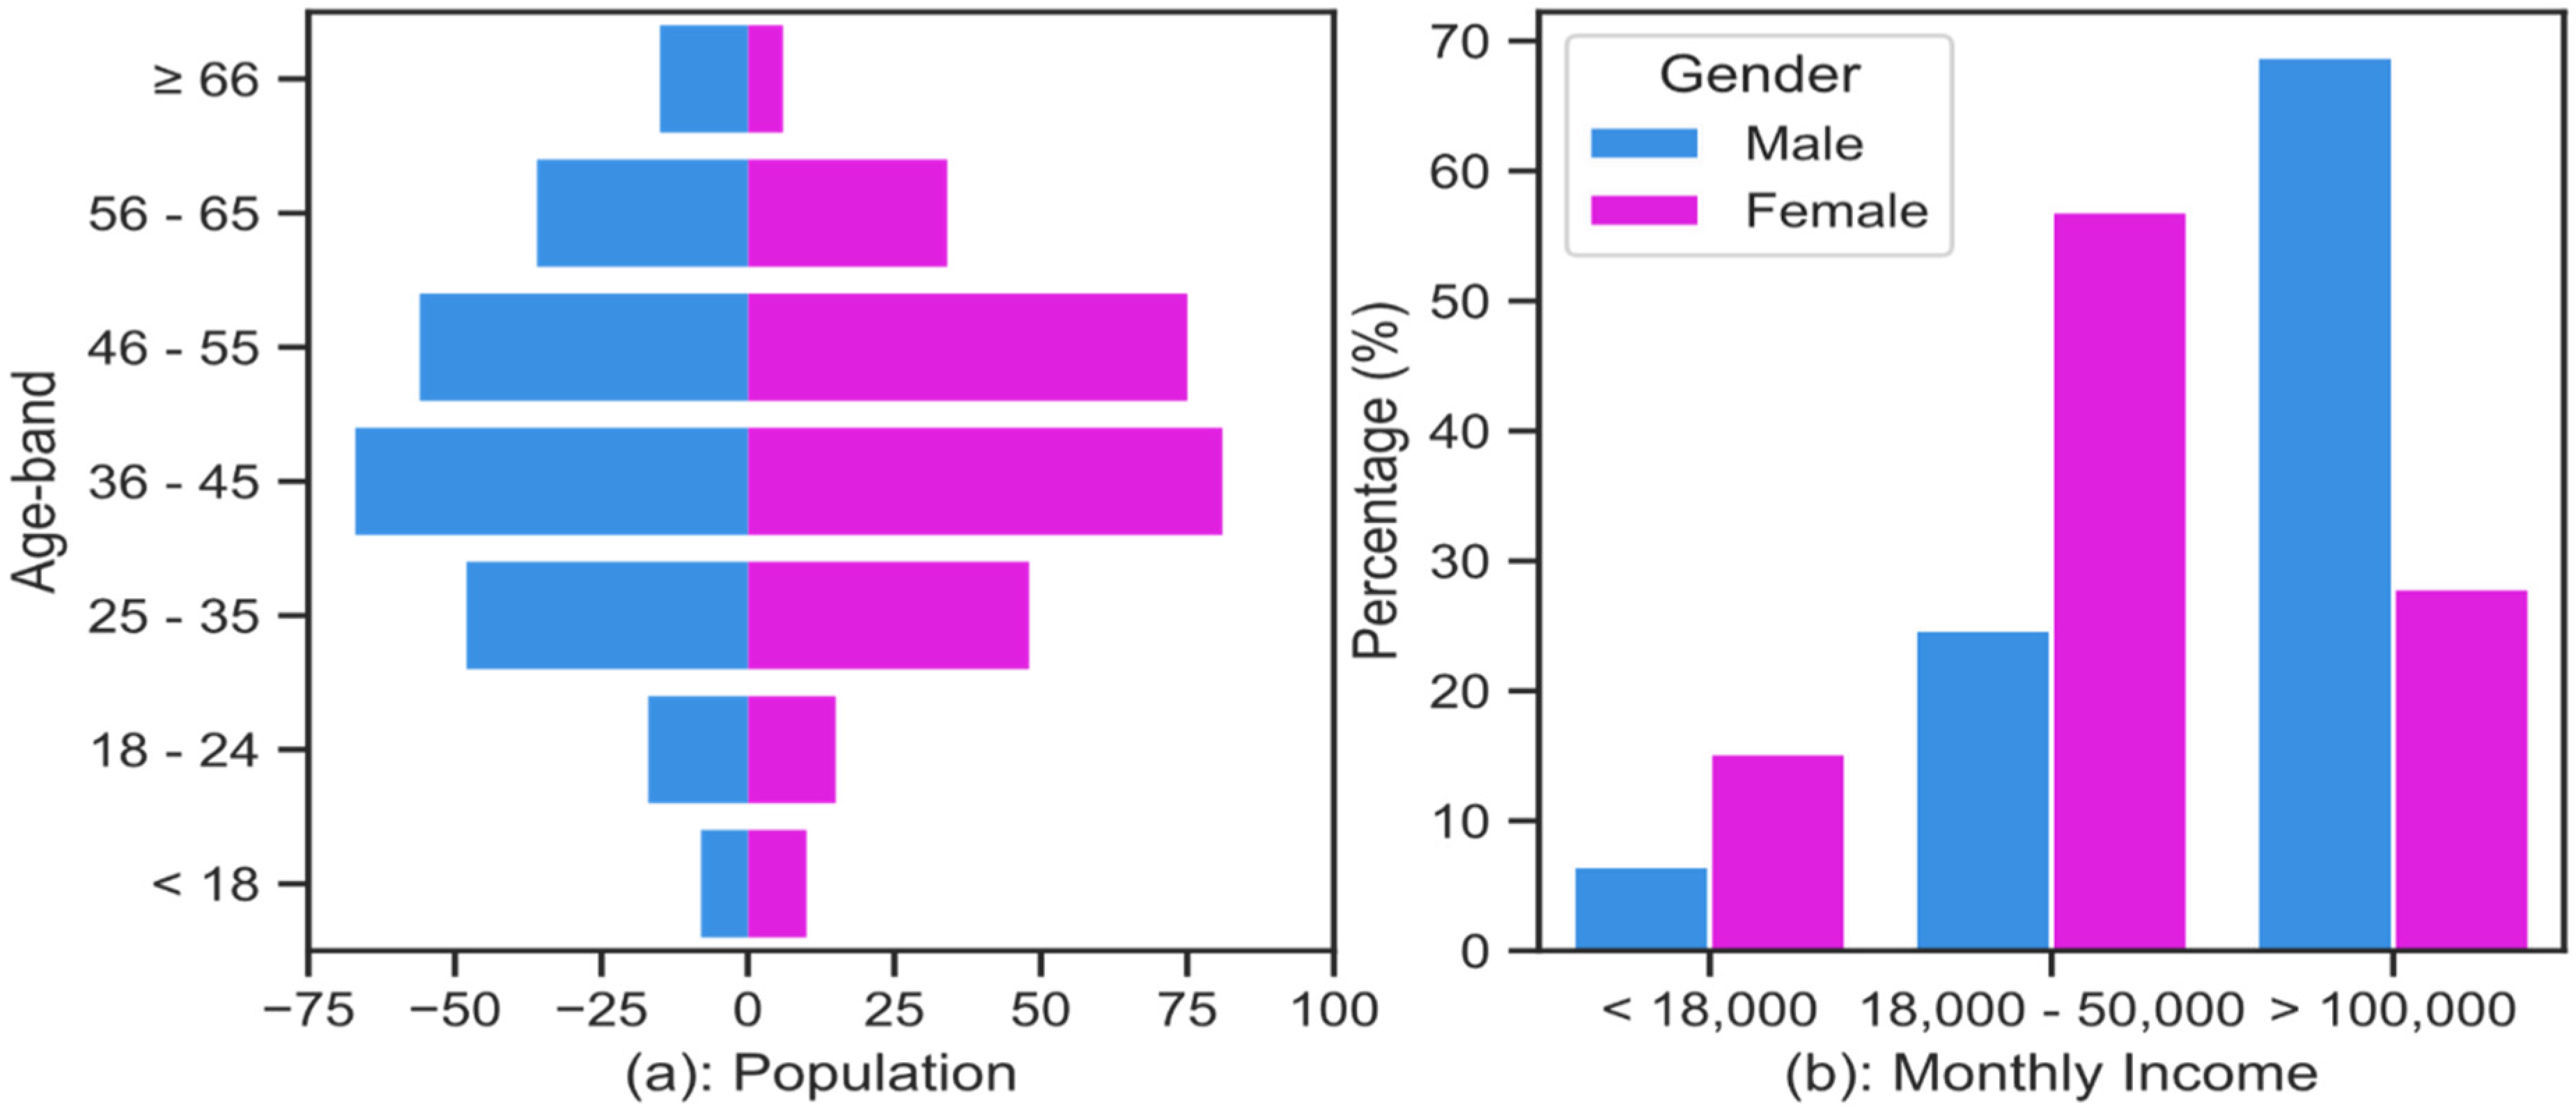
4.2. Demographic Characteristics
4.3. Trip-Related Characteristics
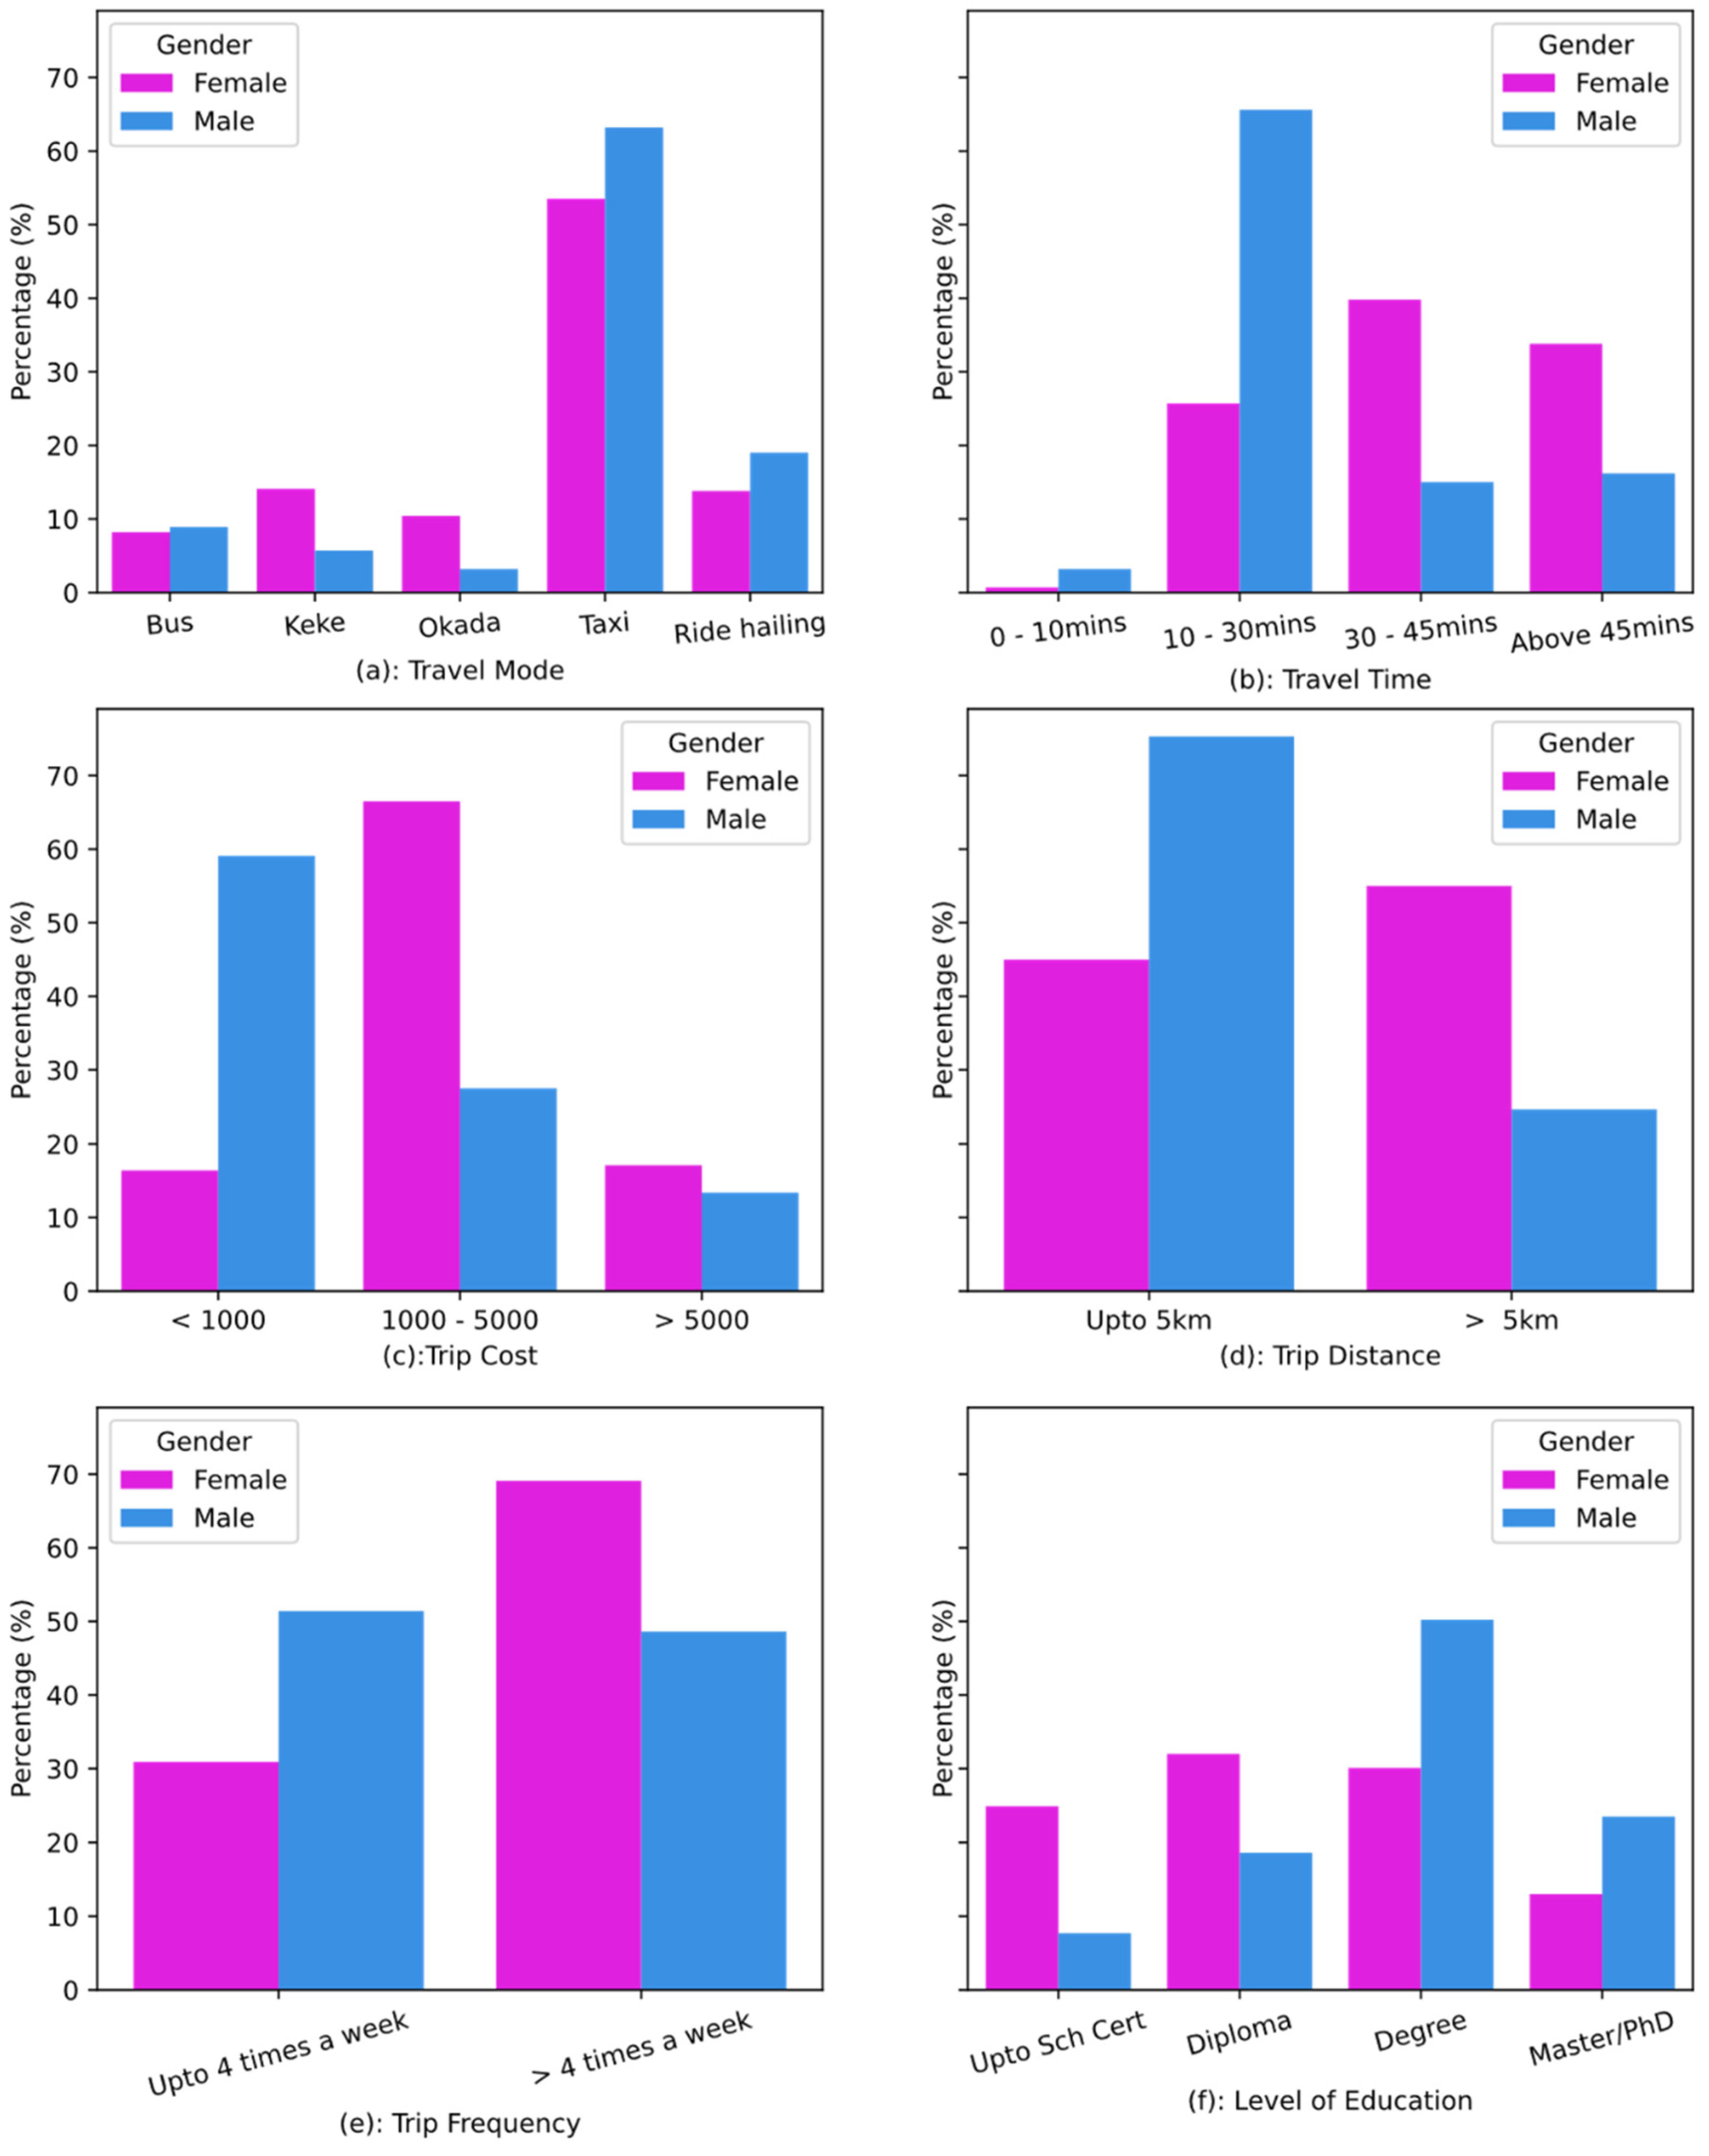
- TC3: “Trip time of day” between Males (n = 246) and Females (n = 265), U = 19322.00, W = 49703.00, Z = −8.83, p = 0.00, and KS (Z = 4.81, p = 0.00). Males have a mean rank of 202.04, while females have a mean rank of 306.09. This means that women’s patterns significantly differ from men’s. Women have no definitive time they use public transport, possibly due to women’s complex trips patterns and the theorised triple burdens of women [33,46], while men have structured times at which they use public transport services.
- TC4: “Public transport usage” between Males (n = 246) and Females (n = 265), U = 14847.00, W = 50092.00, Z = −12.30, p = 0.00, and KS (Z = 6.15, p = 0.00). Males have a mean rank of 328.15, while females have a mean rank of 189.03. This indicates that males have much more flexibility over their choice of public transport usage and appear less captive than females. Comparatively, men were found to earn a higher income than women (refer to Figure 1b) and therefore are more likely to be able to afford to own a car than women.
- TC6: “Frequency of trip” between Males (n = 246) and Females (n = 265), U = 23171.50, W = 53552.50, Z = −5.81, p = 0.00, and KS (Z = 2.34, p = 0.00). Men have a mean rank of 217.69, while the mean rank of women is 291.56. The significant difference in ranking between men and women indicates that women make more trips than men. The findings support the assertion that women make more trips than men [45].
- TC7: “Trip cost” between Males (n = 246) and Females (n = 265), U = 19986.50, W = 50367.50, Z = −8.25, p = 0.00, and KS (Z = 4.83, p = 0.00). The mean rank of women (303.58) compared with 204.75 for men suggests that women spend more on transport fares than men. Women’s high number of trips coupled with their lower earnings implies that women spend a higher proportion of their income on transport than men. This is one of the reasons for poverty among women in sub-Saharan Africa [47].
- TC8: “Trip duration” between Males (n = 246) and Females (n = 265), U = 19175.00, W = 49556.00, Z = −8.62, p = 0.00, and KS (Z = 4.78, p = 0.00). Men have a mean rank of 201.45 compared to a mean rank of 306.64 for women. The results indicate that women spend more time travelling than men. This result buttress the findings of Ng and Acker [4]. The amount of time women spend travelling could have a significant impact on their space–activity–time budget [48] and consequently on job options and wellbeing.
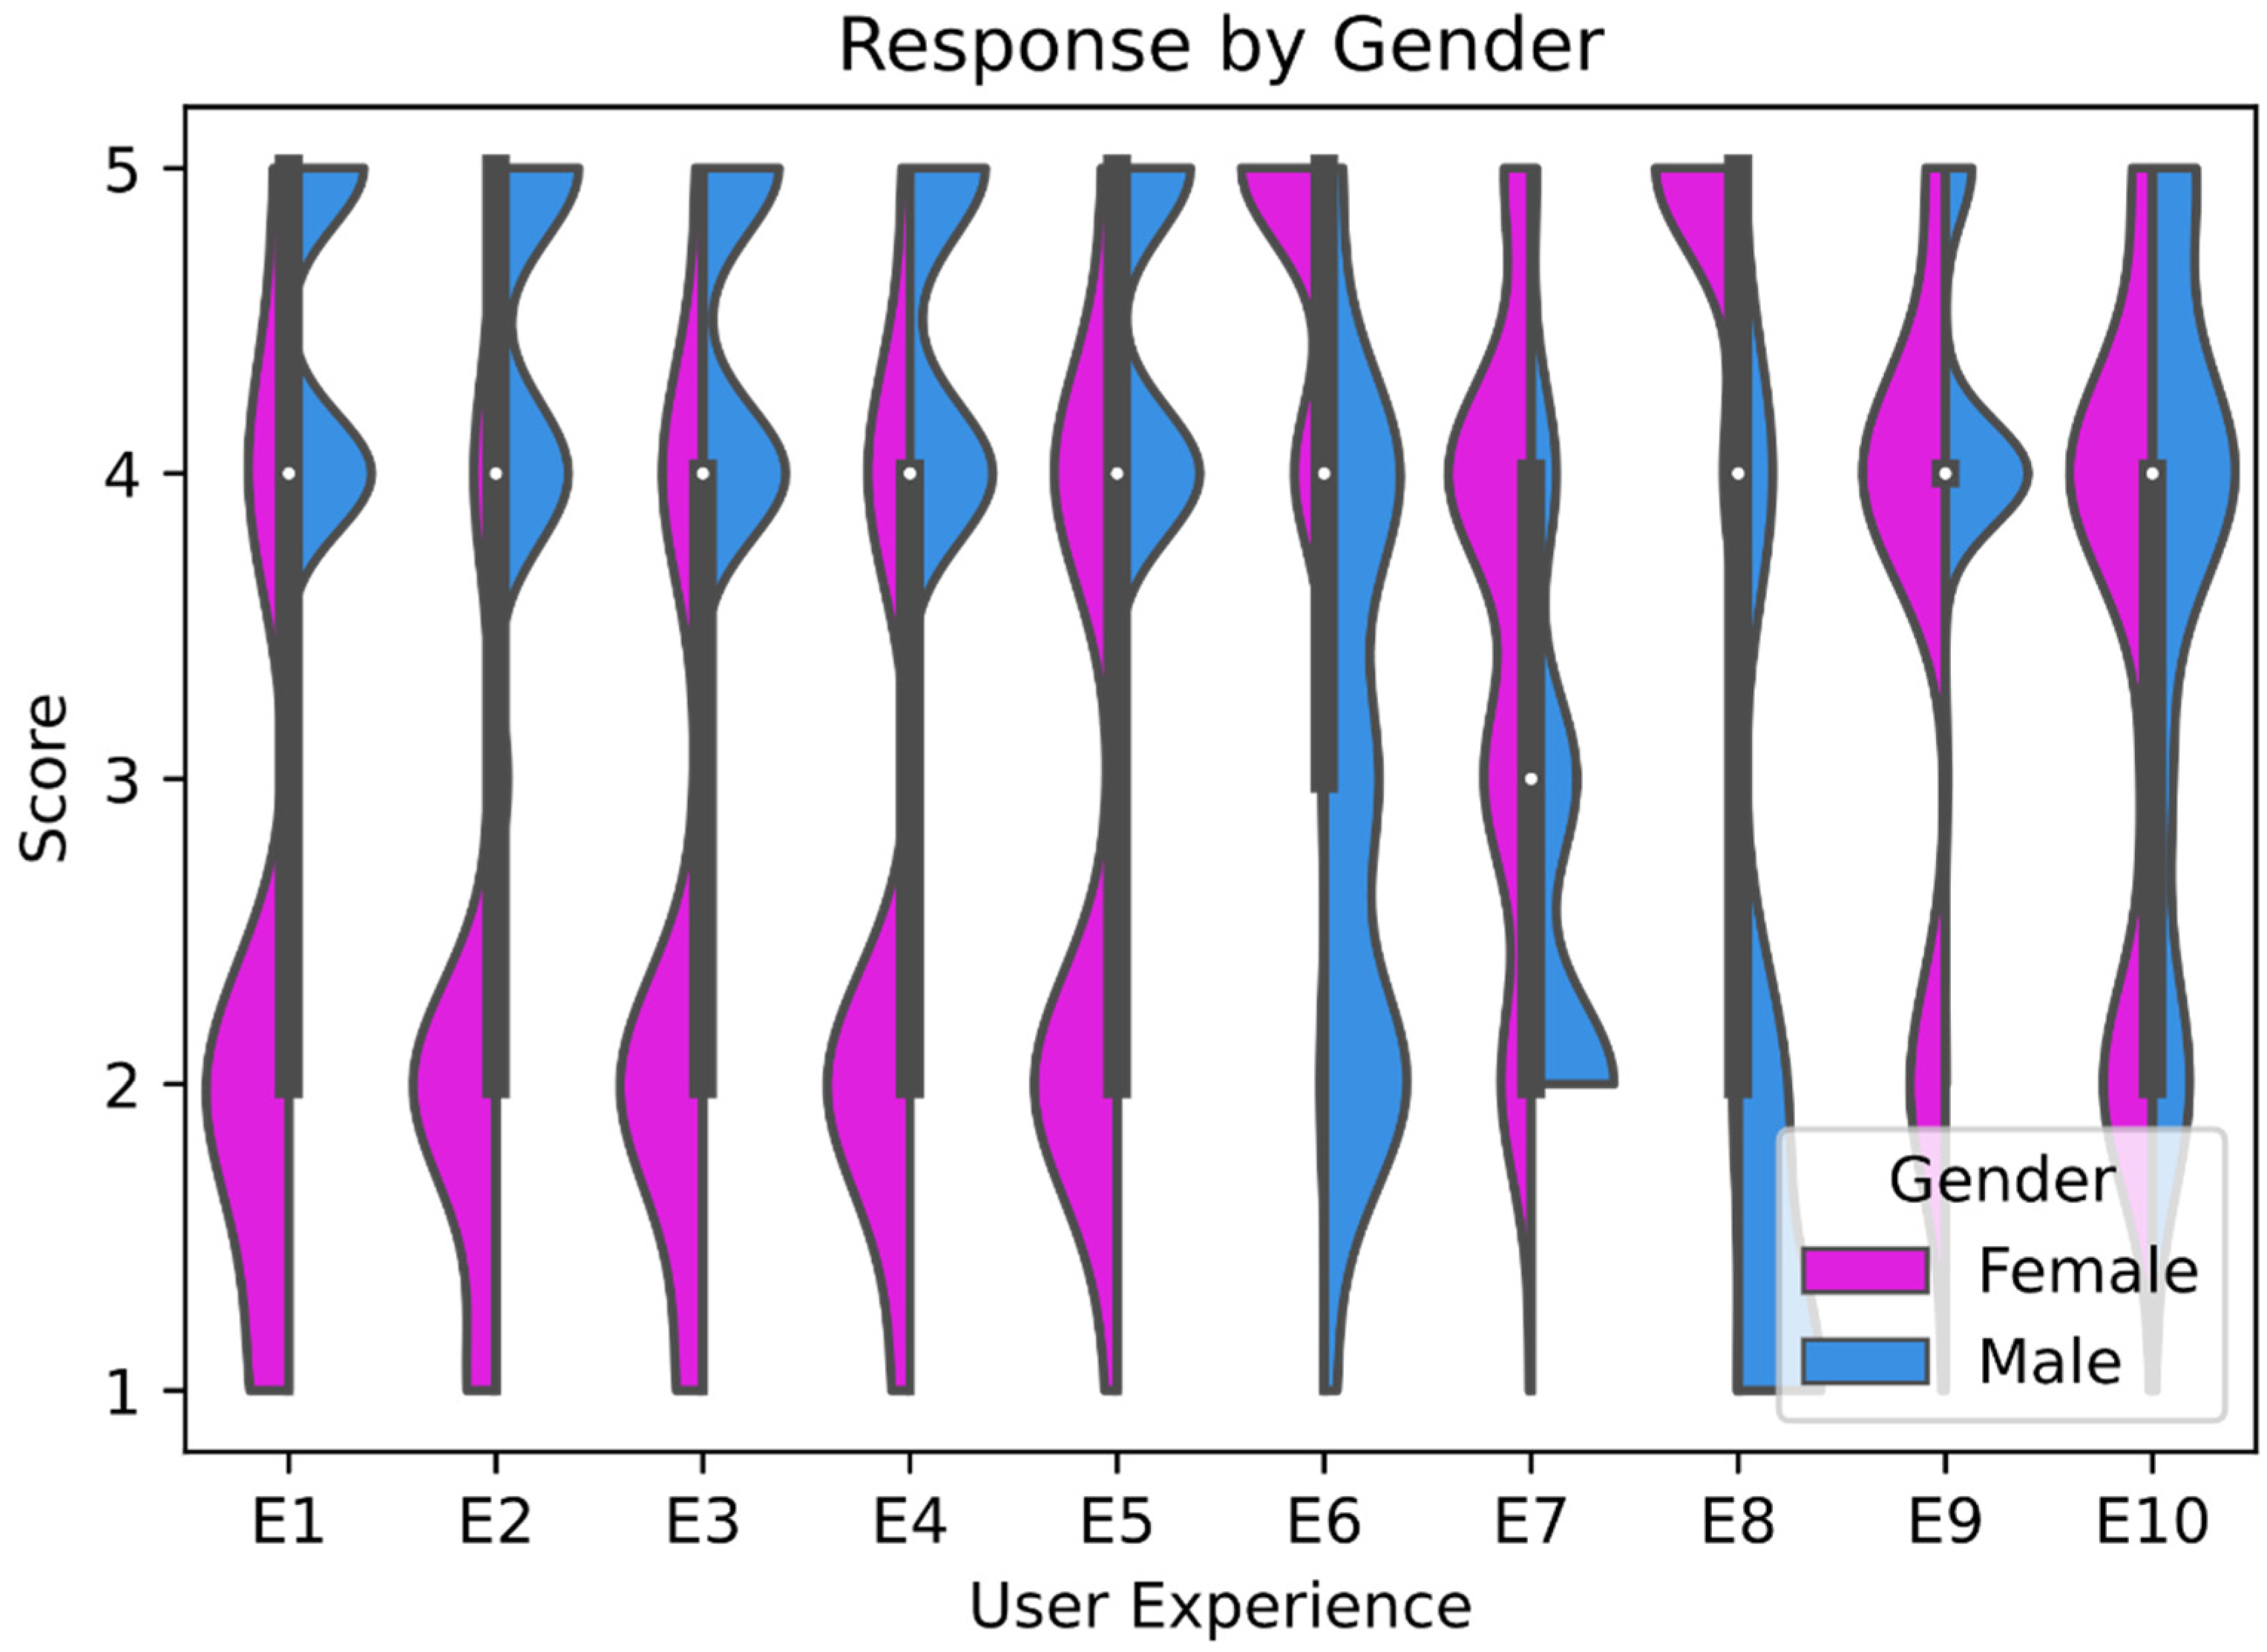
4.4. Experiences in the Access and Use of Public Transport Services in Abuja
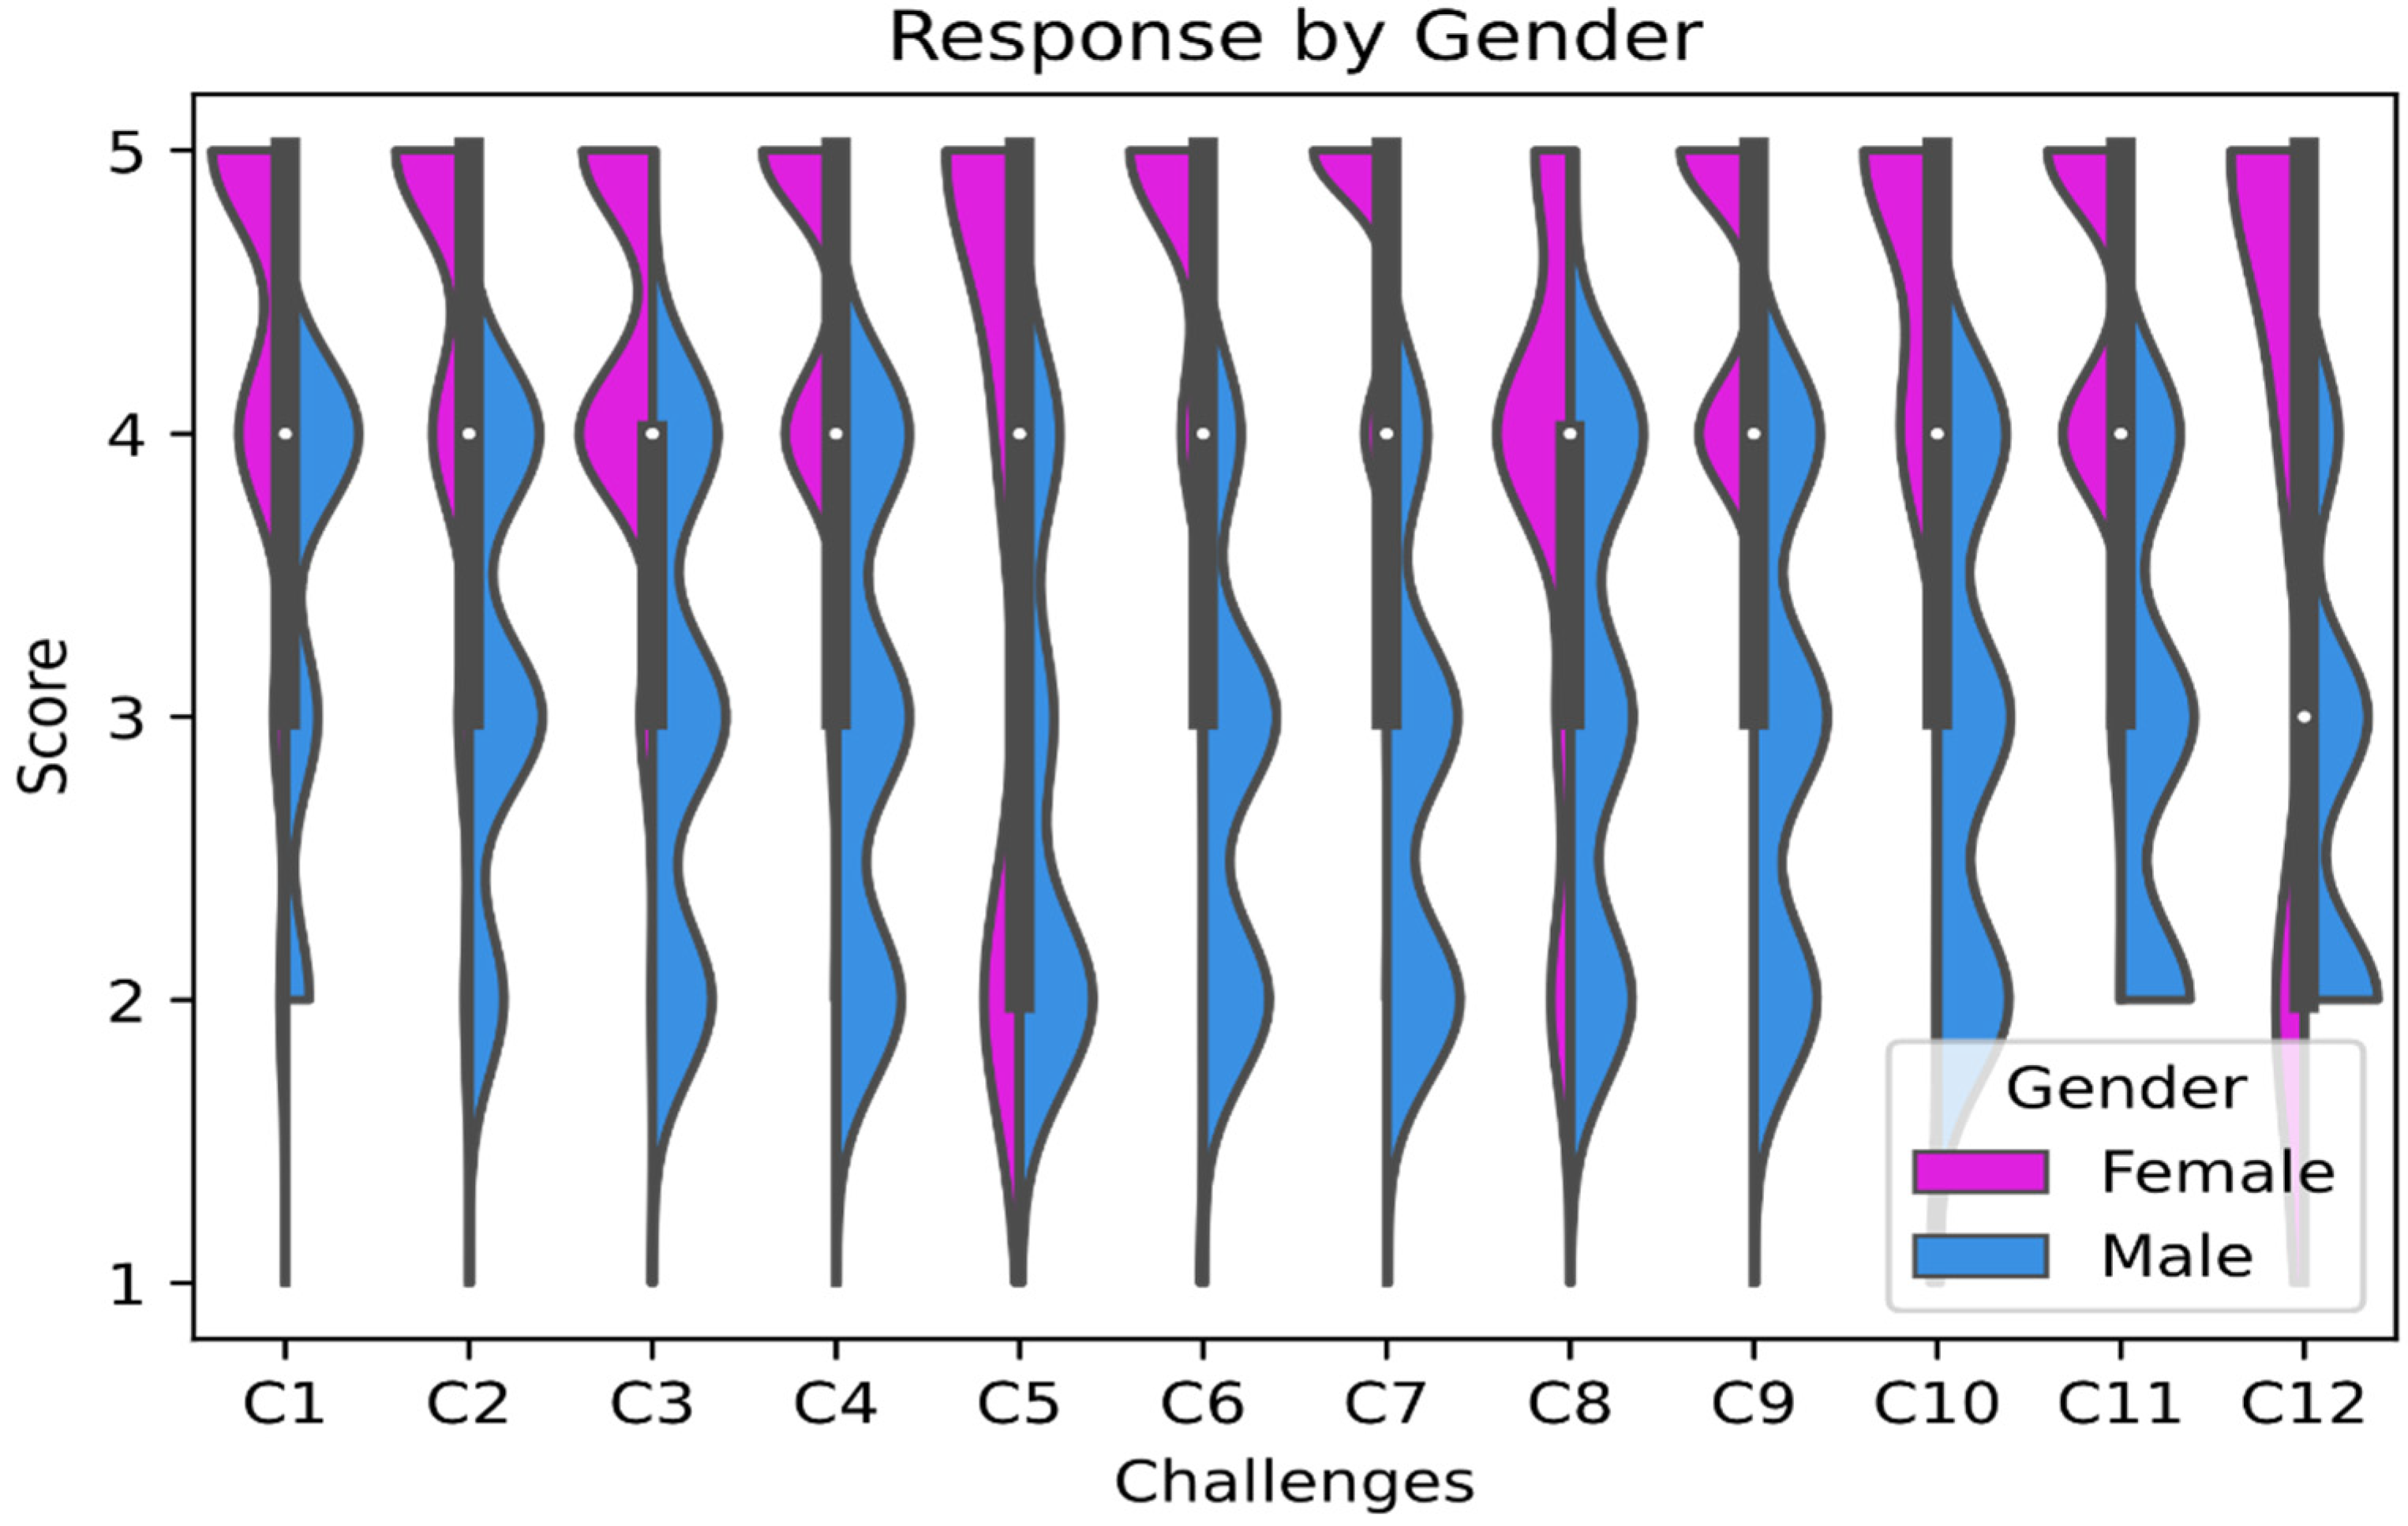
4.5. Challenges against Gender Equity in Service Delivery
4.6. The Need to Ensure Gender Equity
4.7. Discussion
5. Conclusions
Limitations and Areas for Future Studies
Author Contributions
Funding
Institutional Review Board Statement
Informed Consent Statement
Data Availability Statement
Acknowledgments
Conflicts of Interest
References
- United Nations Development Programme. Africa Human Development Report 2016 Accelerating Gender Equality and Women’s Empowerment in Africa. Available online: https://hdr.undp.org/sites/default/files/afhdr_2016_lowres_en.pdf (accessed on 25 October 2021).
- Havet, N.; Bayart, C.; Bonnel, P. Why do Gender Differences in Daily Mobility Behaviours persist among workers? Transp. Res. Part A Policy Pract. 2021, 145, 34–48. [Google Scholar] [CrossRef]
- Peters, D. Gender and Sustainable Urban Mobility. Global Report on Human Settlements. Available online: https://www.researchgate.net/publication/281102413_Gender_and_Sustainable_Urban_Mobility_Official_Thematic_Study_for_the_2013_UN_Habitat_Global_Report_on_Human_Settlements (accessed on 28 August 2021).
- Ng, W.-S.; Acker, A. Understanding Urban Travel Behaviour by Gender for Efficient and Equitable Transport Policies. Available online: https://www.itf-oecd.org/understanding-urban-travel-behaviour-gender-efficient-and-equitable-transport-policies (accessed on 10 October 2021).
- Loukaitou-Sideris, A.; Ceccato, V. Sexual violence in transit environments: Aims, scope, and context. In Transit Crime and Sexual Violence in Cities, 1st ed.; Routledge: Oxfordshire, UK, 2020; pp. 3–11. [Google Scholar]
- Scheiner, J.; Holz-Rau, C. Gendered travel mode choice: A focus on car deficient households. J. Transp. Geogr. 2012, 24, 250–261. [Google Scholar] [CrossRef]
- Arora, D. Gender differences in time-poverty in rural Mozambique. Rev. Soc. Econ. 2015, 73, 196–221. [Google Scholar] [CrossRef] [Green Version]
- Institute for Transportation & Development Policy. Access and Gender: Access for All Series. Available online: https://itdpdotorg.wpengine.com/wp-content/uploads/2018/05/access_for_all_series_1_baja.pdf (accessed on 11 October 2021).
- Holz-Rau, C.; Scheiner, J. Land-use and transport planning–A field of complex cause-impact relationships. Thoughts on transport growth, greenhouse gas emissions and the built environment. Transp. Policy 2019, 74, 127–137. [Google Scholar] [CrossRef]
- Lecompte, M.C.; Pablo, B.S.J. Transport systems and their impact con gender equity. Transp. Res. Procedia 2017, 25, 4245–4257. [Google Scholar] [CrossRef]
- Badiora, A.I.; Odufuwa, B.O. Fear dynamics in public places: A case study of urban shopping centers. J. Place Manag. Dev. 2019, 12, 248–270. [Google Scholar] [CrossRef]
- Kwan, M.; Kotsev, A. Gender differences in commute time and accessibility in Sofia, Bulgaria: A study using 3 D geovisualisation. Geogr. J. 2015, 181, 83–96. [Google Scholar] [CrossRef]
- Singh, Y.J. Is smart mobility also gender-smart? J. Gend. Stud. 2020, 29, 832–846. [Google Scholar] [CrossRef]
- Campisi, T. Gender equality on developing transport system in sicily: A consideration on regional scale. AIP Conf. Proc. 2021, 2343, 15–19. [Google Scholar]
- Kumar, A.; Barrett, F. Stuck in Traffic: Urban Transport in Africa. Office 2008, 1, 70. [Google Scholar]
- Rodrigue, J.-P.; Comtois, C.; Slack, B. The Geography of Transport Systems, 5th ed.; Routledge: London, UK, 2016. [Google Scholar]
- Solanke, M.O. Challenges of urban transportation in Nigeria. Int. J. Dev. Sustain. 2013, 2, 891–901. [Google Scholar]
- Adeyinka, A.M. Assessment of the quality of urban transport services in Nigeria. Acad. J. Interdiscip. Stud. 2013, 2, 49. [Google Scholar] [CrossRef]
- Ogunbodede, E. Urban Road Transportation in Nigeria from 1960 to 2006: Problems, Prospects and Challenges. Ethiop. J. Environ. Stud. Manag. 2008, 1, 7–18. [Google Scholar] [CrossRef]
- Gaunt, R. Breadwinning moms, caregiving dads: Double standard in social judgments of gender norm violators. J. Fam. Issues 2013, 34, 3–24. [Google Scholar] [CrossRef] [Green Version]
- Transformative Urban Mobility Initiative. Gender and Urban Transport iNUA#3: Implementing the New Urban. Available online: https://sutp.org/files/contents/documents/resources/L_iNUA/iNUA-Paper.Gender-and-Urban-Transport.pdf (accessed on 4 September 2021).
- Minelgaitė, A.; Dagiliūtė, R.; Liobikienė, G. The Usage of Public Transport and Impact of Satisfaction in the European Union. Sustainability 2020, 12, 9154. [Google Scholar] [CrossRef]
- Eurobarometer, F. Attitudes of Europeans towards Tourism. Available online: https://europa.eu/eurobarometer/surveys/detail/2283 (accessed on 14 August 2021).
- Klinger, T.; Kenworthy, J.R.; Lanzendorf, M. Dimensions of urban mobility cultures–a comparison of German cities. J. Transp. Geogr. 2013, 31, 18–29. [Google Scholar] [CrossRef] [Green Version]
- Adetunji, M.A.; Aloba, O. The level of compliance of commercial motorcyclists to traffic rules on urban roads in South Western Nigeria. J. Educ. Soc. Res. 2014, 4, 345. [Google Scholar]
- Mahadevia, D.; Advani, D. Gender differentials in travel pattern–the case of a mid-sized city, Rajkot, India. Transp. Res. Part D Transp. Environ. 2016, 44, 292–302. [Google Scholar] [CrossRef]
- Withers, M.M. Communication in the transportation sector. Available online: https://www.academia.edu/53804357/Communication_in_the_transportation_sector?from_sitemaps=true&version=2 (accessed on 28 August 2021).
- Berkovitch, N.; Berqôvîč, N. From motherhood to citizenship: Women’s rights and international organizations. JHU Press 1999, 30, 619. [Google Scholar]
- Leuenberger, D.Z.; Lutte, R. Sustainability, Gender Equity, and Air Transport: Planning a Stronger Future. Public Work. Manag. Policy 2022, 1087724X221075044. [Google Scholar] [CrossRef]
- Lu, X.; Pas, E.I. Socio-demographics, activity participation and travel behavior. Transp. Res. Part A Policy Pract. 1999, 33, 1–18. [Google Scholar] [CrossRef]
- Kang, L.; Xiong, Y.; Mannering, F.L. Statistical analysis of pedestrian perceptions of sidewalk level of service in the presence of bicycles. Transp. Res. Part A Policy Pract. 2013, 53, 10–21. [Google Scholar] [CrossRef]
- Rahman, M.T.; Nahiduzzaman, K. Examining the walking accessibility, willingness, and travel conditions of residents in Saudi cities. Int. J. Environ. Res. Public Health 2019, 16, 545. [Google Scholar] [CrossRef] [Green Version]
- Gupta, N. Triple burden on women in science: A cross-cultural analysis. Curr. Sci. 2005, 89, 1382–1386. [Google Scholar]
- McCusker, K.; Gunaydin, S. Research using qualitative, quantitative or mixed methods and choice based on the research. Perfusion 2015, 30, 537–542. [Google Scholar] [CrossRef]
- Overton, J.; van Diermen, P. Using quantitative techniques. In Development Fieldwork; Scheyvens, R., Storey, D., Eds.; Sage Publications Inc: New York, NY, USA, 2003. [Google Scholar]
- Henry, G.T. Practical sampling. In The SAGE Handbook of Applied Social Research Methods; SAGE Publications: Thousand Oaks, CA, USA, 2009; Volume 2, pp. 77–105. [Google Scholar]
- Sharma, G. Pros and cons of different sampling techniques. Int. J. Appl. Res. 2017, 3, 749–752. [Google Scholar]
- Etikan, I.; Bala, K. Developing questionnaire base on selection and designing. Biom. Biostat Int. J. 2017, 5, 5–7. [Google Scholar] [CrossRef] [Green Version]
- Condomines, B.; Hennequin, É. Studying sensitive issues: The contributions of a mixed approach. Rev. Interdiscip. Manag. Homme Entrep. 2014, 14, 3–19. [Google Scholar] [CrossRef]
- Van Selm, M.; Jankowski, N.W. Conducting online surveys. Qual. Quant. 2006, 40, 435–456. [Google Scholar] [CrossRef]
- Onwuegbuzie, A.J. A Qualitative Framework for Collecting and Analysing Data in Focus Group Research. Int. J. Qual. Methods 2009, 8, 1–21. [Google Scholar] [CrossRef] [Green Version]
- Pallant, J. SPSS Survival Manual: A Step by Step Guide to Data Analysis Using IBM SPSS, 7th ed.; Routledge: London, UK, 2020. [Google Scholar]
- Nachar, N. The Mann-Whitney U: A Test for Assessing Whether Two Independent Samples Come from the Same Distribution. Tutor. Quant. Methods Psychol. 2008, 4, 13–20. [Google Scholar] [CrossRef]
- Omoregie, N.; Abraham, I.O. Persistent Gender Inequality in Nigerian Education. Available online: https://www.semanticscholar.org/paper/Persistent-Gender-Inequality-in-Nigerian-Education-Omoregie/48f11ca274d9c68202c322bdf865d3e9f15e6a40 (accessed on 23 August 2021).
- Jorritsma, P.; Schaap, N.T.W. Families on the Run: How do Dutch Households with Young Children Organize Their Travel Behavior. Available online: https://www.researchgate.net/profile/Nina-Schaap/publication/280087588_Families_on_the_run_How_do_Dutch_households_with_young_children_organize_their_travel_behavior/links/55a7b21608ae0b4e87126d28/Families-on-the-run-How-do-Dutch-households-with-young-children-organize-their-travel-behavior.pdf (accessed on 25 August 2021).
- McLaren, H.J. COVID-19 and women’s triple burden: Vignettes from Sri Lanka, Malaysia, Vietnam and Australia. Soc. Sci. 2020, 9, 87. [Google Scholar] [CrossRef]
- Batana, Y.M. Multidimensional Measurement of Poverty among Women in Sub-Saharan Africa. Soc. Indic. Res. 2013, 112, 337–362. [Google Scholar] [CrossRef]
- Wikström, P.O.H. Activity fields and the dynamics of crime: Advancing knowledge about the role of the environment in crime causation. J. Quant. Criminol. 2010, 26, 55–87. [Google Scholar] [CrossRef]
- Nwankwo, C.; BARİMODA, F. Adequacy of Urban Mass Transit Bus System and Commuters’ Modal Choice in Abuja. J. Transp. Logist. 2019, 4, 1–10. [Google Scholar] [CrossRef]
- Nwankwo, C.O.; Fawohunre, F.A.; Obasanjo, O.T. Abuja Urban Mass Transit Company Operations Impact on Passengers’ Movement within Abuja Metropolis. Eur. J. Res. Soc. Sci. 2016, 4, 31–41. [Google Scholar]
- Sunday, O.M.; Ademola, O.J. GIS application for determining public transport access level in the Federal Capital Territory (FCT), Abuja-Nigeria. J. Geogr. Reg. Plan. 2016, 9, 154–163. [Google Scholar]
- Odumosu, A.O. A Study of Bus. Provision and Use in Metropolitan Lagos; University of Lagos: Yaba, Nigeria, 2004. [Google Scholar]
- Kamargianni, M.; Polydoropoulou, A. Gender differences in on-line social networking and travel behavior of adolescents. In Proceedings of 5th International Conference on Women’s Issues in Transportation Federation Internationale De L’Automobile (FIA) Institut Francais des Sciences et Technologies des Transports, de l’Aménagement et des Réseaux (IFSTTAR) Bureau of Transportation StatisticsTra, Paris, France, 14–16 April 2014. [Google Scholar]
- Hurez, C.; Richer, C. Does the City’s Pulse Beat at the Same Rate for Men and Women? Gender Time-Geography. Available online: https://halshs.archives-ouvertes.fr/halshs-01126793/document (accessed on 5 January 2022).
- Aloulou, F.; Ghannouchi, I. The impact of ownership and contractual practice on the technical efficiency level of the public transport operators: An international comparison. Res. Transp. Bus. Manag. 2021, 100707. [Google Scholar] [CrossRef]
- Sörensen, L. How much flexibility does rural public transport need? –Implications from a fully flexible DRT system. Transp. Policy 2021, 100, 5–20. [Google Scholar] [CrossRef]
- Stachyra, R.; Roman, K. Analysis of Accessibility of Public Transport in Warsaw in the Opinion of Users. Postmod. Open. 2021, 12, 384–403. [Google Scholar] [CrossRef]
- Belwal, R.; Belwal, S. Public transportation services in Oman: A study of public perceptions. J. Public Transp. 2010, 13, 1. [Google Scholar] [CrossRef] [Green Version]
- Silveira, T.C.; Krainer, C.W.; Krainer, J.A.; Omano, C.A.; Matoski, A.; Santo, A.L.; Moreira, A.R. Does Gender Influence Travel Satisfaction with Public Transport? Available online: https://www.semanticscholar.org/paper/Does-gender-influence-travel-satisfaction-with-Silveira-Krainer/a4a814298fdee53789900cb9a1c82890a766d40e (accessed on 5 January 2022).
- Mitra, I.; Sankar, M.M. Navigating the Insight of Gender Disparity Issues in Tourism: A Conceptual Study. Atna J. Tour. Stud. 2020, 15, 45–54. [Google Scholar] [CrossRef]


| A: Socio-Demographics | B: Travel Characteristics | Sections C–E | ||||||
|---|---|---|---|---|---|---|---|---|
| Variables | Scale | Variables | Scale | Variables | Scale | |||
| A.1 | Gender | Closed responses | B.1 | Terminal | Closed responses | C | User Perceptions and Experiences | 5-point Likert Scale |
| A.2 | Age | B.2 | Travel Mode | |||||
| A.3 | Marital Status | B.3 | Time of Day | |||||
| A.4 | Educational Status | B.4 | Trip Purpose | D | Barriers and Challenges | |||
| A.5 | Occupation | B.5 | Trip Frequency | |||||
| A.6 | Income | B.6 | Travel Cost | |||||
| A.7 | Household Size | B.7 | Travel Time | E | Suggestions for Gender Equity | |||
| A.8 | License | B.8 | Travel Distance | |||||
| Variable | Frequency | Percentage | ||||
|---|---|---|---|---|---|---|
| Male | Female | Male (%) | Female (%) | Total (%) | ||
| Gender | Male | 246 | – | 48.14 | – | 48.14 |
| Female | – | 265 | – | 51.86 | 51.86 | |
| Marital Status | Single | 82 | 51 | 16.05 | 9.98 | 26.03 |
| Married | 144 | 180 | 28.18 | 35.23 | 63.41 | |
| Widowed | 12 | 21 | 2.35 | 4.11 | 6.46 | |
| Separated | 3 | 3 | 0.59 | 0.59 | 1.17 | |
| Divorced | 5 | 10 | 0.98 | 1.96 | 2.94 | |
| Main Occupation | Farming | 18 | 14 | 3.52 | 2.74 | 6.26 |
| Self-employed | 55 | 51 | 10.76 | 9.98 | 20.74 | |
| Unemployed | 44 | 51 | 8.61 | 9.98 | 18.59 | |
| Civil Servant | 101 | 77 | 19.77 | 15.07 | 34.83 | |
| Business/Trader | 28 | 71 | 5.48 | 13.89 | 19.37 | |
| Others | 0 | 1 | 0.00 | 0.20 | 0.20 | |
| Household Size | 1 | 49 | 15 | 9.59 | 2.94 | 12.52 |
| 2 | 90 | 18 | 17.61 | 3.52 | 21.14 | |
| More than 2 | 107 | 232 | 20.94 | 45.40 | 66.34 | |
| Driver’s License | Yes | 181 | 30 | 35.42 | 5.87 | 41.29 |
| No | 65 | 235 | 12.72 | 45.99 | 58.71 | |
| Variable | Frequency | Percentage | ||||
|---|---|---|---|---|---|---|
| Male | Female | Male (%) | Female (%) | Total (%) | ||
| Terminal | AYA | 35 | 38 | 6.85 | 7.44 | 14.29 |
| Area 1 Junction | 32 | 43 | 6.26 | 8.41 | 14.68 | |
| Deidei | 50 | 35 | 9.78 | 6.85 | 16.63 | |
| New Nyanya | 61 | 50 | 11.94 | 9.78 | 21.72 | |
| Mararraba | 35 | 43 | 6.85 | 8.41 | 15.26 | |
| Berger Junction | 33 | 56 | 6.46 | 10.96 | 17.42 | |
| Time | Morning | 101 | 45 | 19.77 | 8.81 | 28.57 |
| Afternoon | 21 | 13 | 4.11 | 2.54 | 6.65 | |
| Evening | 44 | 8 | 8.61 | 1.57 | 10.18 | |
| Anytime of the Day | 80 | 199 | 15.66 | 38.94 | 54.60 | |
| Public Transport | Yes | 48 | 196 | 9.39 | 38.36 | 47.75 |
| No, I combine it with private transport | 198 | 69 | 38.75 | 13.50 | 52.25 | |
| Purpose of Your Trip | Work | 148 | 173 | 28.96 | 33.86 | 62.82 |
| School/Education | 23 | 19 | 4.50 | 3.72 | 8.22 | |
| Recreation | 30 | 11 | 5.87 | 2.15 | 8.02 | |
| Medical | 16 | 20 | 3.13 | 3.91 | 7.05 | |
| Religion | 17 | 12 | 3.33 | 2.35 | 5.68 | |
| Shopping | 11 | 29 | 2.15 | 5.68 | 7.83 | |
| Others | 1 | 1 | 0.20 | 0.20 | 0.39 | |
| S/N | Trip Characteristics | Mann–Whitney U | Wilcoxon W | Z | Asymp. Sig. (2-Tailed) | Kolmogorov–Smirnov Z | Asymp. Sig. (2-Tailed) |
|---|---|---|---|---|---|---|---|
| TC3 | Trip Time of Day | 19,322.00 | 49,703.00 | −8.83 | 0.00 | 4.81 | 0.00 |
| TC4 | Public Transport Usage | 14,847.00 | 50,092.00 | −12.30 | 0.00 | 6.15 | 0.00 |
| TC6 | Frequency of Trip | 23,171.50 | 53,552.50 | −5.81 | 0.00 | 2.34 | 0.00 |
| TC7 | Trip Cost | 19,986.50 | 50,367.50 | −8.25 | 0.00 | 4.83 | 0.00 |
| TC8 | Trip Duration | 19,175.00 | 49,556.00 | −8.62 | 0.00 | 4.78 | 0.00 |
| TC9 | Trip Distance | 22,825.00 | 53,206.00 | −6.77 | 0.00 | 3.38 | 0.00 |
| S/N | Experiences | Mean | Mean | Std. Deviation | t-Value | Sig. (2-Tailed) | |
|---|---|---|---|---|---|---|---|
| Male | Female | ||||||
| E9 | Public transport fulfils my daily travel requirements in terms of work commute and other trips | 4.20 | 3.56 | 3.87 | 0.90 | 9.28 | 0.000 |
| E6 | The public transport mode I use for my daily commute has a high transportation fare | 3.02 | 4.60 | 3.84 | 1.21 | 6.33 | 0.000 |
| E5 | My preferred public transport mode is fast | 4.39 | 2.92 | 3.63 | 1.20 | 2.42 | 0.016 |
| E8 | I use public transport because I do not have a car | 2.51 | 4.66 | 3.62 | 1.37 | 2.02 | 0.044 |
| E10 | I will always wait for my most preferred vehicle at the bus terminal regardless of time | 3.69 | 3.42 | 3.55 | 1.08 | 1.00 | 0.318 |
| E4 | My preferred public transport mode is always available | 4.38 | 2.60 | 3.46 | 1.30 | −0.77 | 0.443 |
| E1 | My preferred public transport mode is safe in terms of accessibility and usage | 4.45 | 2.49 | 3.43 | 1.39 | −1.07 | 0.287 |
| E3 | My preferred public transport mode is reliable | 4.39 | 2.51 | 3.41 | 1.32 | −1.52 | 0.129 |
| E2 | My preferred public transport mode is comfortable | 4.38 | 2.26 | 3.28 | 1.39 | −3.56 | 0.000 |
| E7 | The route I use for my daily commute is always congested | 2.70 | 3.55 | 3.14 | 1.00 | −8.14 | 0.000 |
| S/N | Experience | Mann–Whitney U | Wilcoxon W | Z | Asymp. Sig. (2-Tailed) | Kolmogorov–Smirnov Z | Asymp. Sig. (2-Tailed) |
|---|---|---|---|---|---|---|---|
| E1 | My preferred public transport mode is safe in terms of accessibility and usage | 8136.0 | 43,381.0 | −15.34 | 0.00 | 7.70 | 0.00 |
| E2 | My preferred public transport mode is comfortable | 5293.0 | 40,538.0 | −16.97 | 0.00 | 8.47 | 0.00 |
| E3 | My preferred public transport mode is reliable | 7237.0 | 42,482.0 | −15.89 | 0.00 | 7.46 | 0.00 |
| E4 | My preferred public transport mode is always available | 8339.5 | 43,584.5 | −15.32 | 0.00 | 7.22 | 0.00 |
| E5 | My preferred public transport mode is fast | 11,187.0 | 46,432.0 | −13.61 | 0.00 | 5.93 | 0.00 |
| E6 | The public transport mode I use for my daily commute has a high transportation fare | 7911.0 | 38,292.0 | −15.53 | 0.00 | 7.06 | 0.00 |
| E7 | The route I use for my daily commute is always congested | 17,038.0 | 47,419.0 | −9.75 | 0.00 | 4.45 | 0.00 |
| E8 | I use public transport because I do not have a car | 4605.5 | 34,986.5 | −18.11 | 0.00 | 8.59 | 0.00 |
| E9 | Public transport fulfils my daily travel requirements in terms of work commute and other trips | 22,843.0 | 58,088.0 | −6.97 | 0.00 | 3.07 | 0.00 |
| E10 | I will always wait for my most preferred vehicle at the bus terminal regardless of the time | 28,057.5 | 63,302.5 | −2.92 | 0.00 | 1.30 | 0.07 |
| S/N | Challenges | Mean | Mean | Std. Deviation | t-Value | Sig. (2-Tailed) | |
|---|---|---|---|---|---|---|---|
| Male | Female | ||||||
| C6 | Facilities such as seating, backrests, and restrooms are adequate and convenient for all genders and abilities | 3.60 | 4.61 | 4.12 | 0.87 | 16.09 | 0.000 |
| C4 | Inadequate public transport services to match the high rate of population and demand in the area | 3.67 | 4.51 | 4.11 | 0.71 | 19.35 | 0.000 |
| C1 | Unstable transportation fare | 3.41 | 4.37 | 3.90 | 0.94 | 9.74 | 0.000 |
| C2 | Poor vehicle maintenance | 3.21 | 4.42 | 3.84 | 1.01 | 7.55 | 0.000 |
| C7 | Harassment on public transport is common along my travel route | 2.85 | 4.73 | 3.83 | 1.16 | 6.38 | 0.000 |
| C9 | Overcrowding/long queuing at the terminal | 3.03 | 4.50 | 3.79 | 1.03 | 6.40 | 0.000 |
| C11 | Long waiting time at the terminal | 2.97 | 4.45 | 3.74 | 1.04 | 5.18 | 0.000 |
| C10 | The facility and service available within the terminal is appropriate (especially under harsh weather conditions) | 3.00 | 4.40 | 3.73 | 1.19 | 4.33 | 0.000 |
| C3 | Fewer public buses at the terminal | 3.04 | 4.34 | 3.72 | 1.00 | 4.88 | 0.000 |
| C8 | Having an ATM at the bus station is not necessary | 3.09 | 3.86 | 3.49 | 1.00 | −0.24 | 0.807 |
| C5 | Adequate lighting in the terminal and the area around the terminal | 2.84 | 3.95 | 3.42 | 1.28 | −1.47 | 0.144 |
| C12 | Availability of hygiene facilities at the terminal | 2.79 | 3.92 | 3.38 | 1.28 | −2.16 | 0.031 |
| S/N | Challenges | Mann–Whitney U | Wilcoxon W | Z | Asymp. Sig. (2-Tailed) | Kolmogorov–Smirnov Z | Asymp. Sig. (2-Tailed) |
|---|---|---|---|---|---|---|---|
| C1 | Unstable transportation fare | 12,952.0 | 43,333.0 | −12.54 | 0.00 | 5.91 | 0.00 |
| C2 | Poor vehicle maintenance | 9932.0 | 40,313.0 | −14.19 | 0.00 | 6.47 | 0.00 |
| C3 | Fewer public buses at the terminal | 8758.5 | 39,139.5 | −14.98 | 0.00 | 6.50 | 0.00 |
| C4 | Inadequate public transport services to match the high rate of population and demand in the area | 11,786.0 | 42,167.0 | −13.65 | 0.00 | 6.08 | 0.00 |
| C5 | Adequate lighting in the terminal and the area around the terminal | 16,687.0 | 47,068.0 | −9.97 | 0.00 | 5.72 | 0.00 |
| C6 | Facilities such as seating, backrests, and restrooms are not adequate and convenient for all genders and abilities | 8207.0 | 38,588.0 | −15.63 | 0.00 | 7.91 | 0.00 |
| C7 | Harassment on public transport is common along my travel route | 3021.5 | 33,402.5 | −18.57 | 0.00 | 8.46 | 0.00 |
| C8 | Having an ATM at the bus station is not necessary | 18,350.0 | 48,731.0 | −9.03 | 0.00 | 4.25 | 0.00 |
| C9 | Overcrowding/long queuing at the terminal | 6440.0 | 36,821.0 | −16.38 | 0.00 | 7.02 | 0.00 |
| C10 | The facility and service available within the terminal is appropriate (especially under harsh weather conditions) | 8696.0 | 39,077.0 | −14.89 | 0.00 | 6.76 | 0.00 |
| C11 | Long waiting time at the terminal | 6504.5 | 36,885.5 | −16.30 | 0.00 | 7.17 | 0.00 |
| C12 | Availability of hygiene facilities at the terminal | 16,646.5 | 47,027.5 | −9.90 | 0.00 | 6.09 | 0.00 |
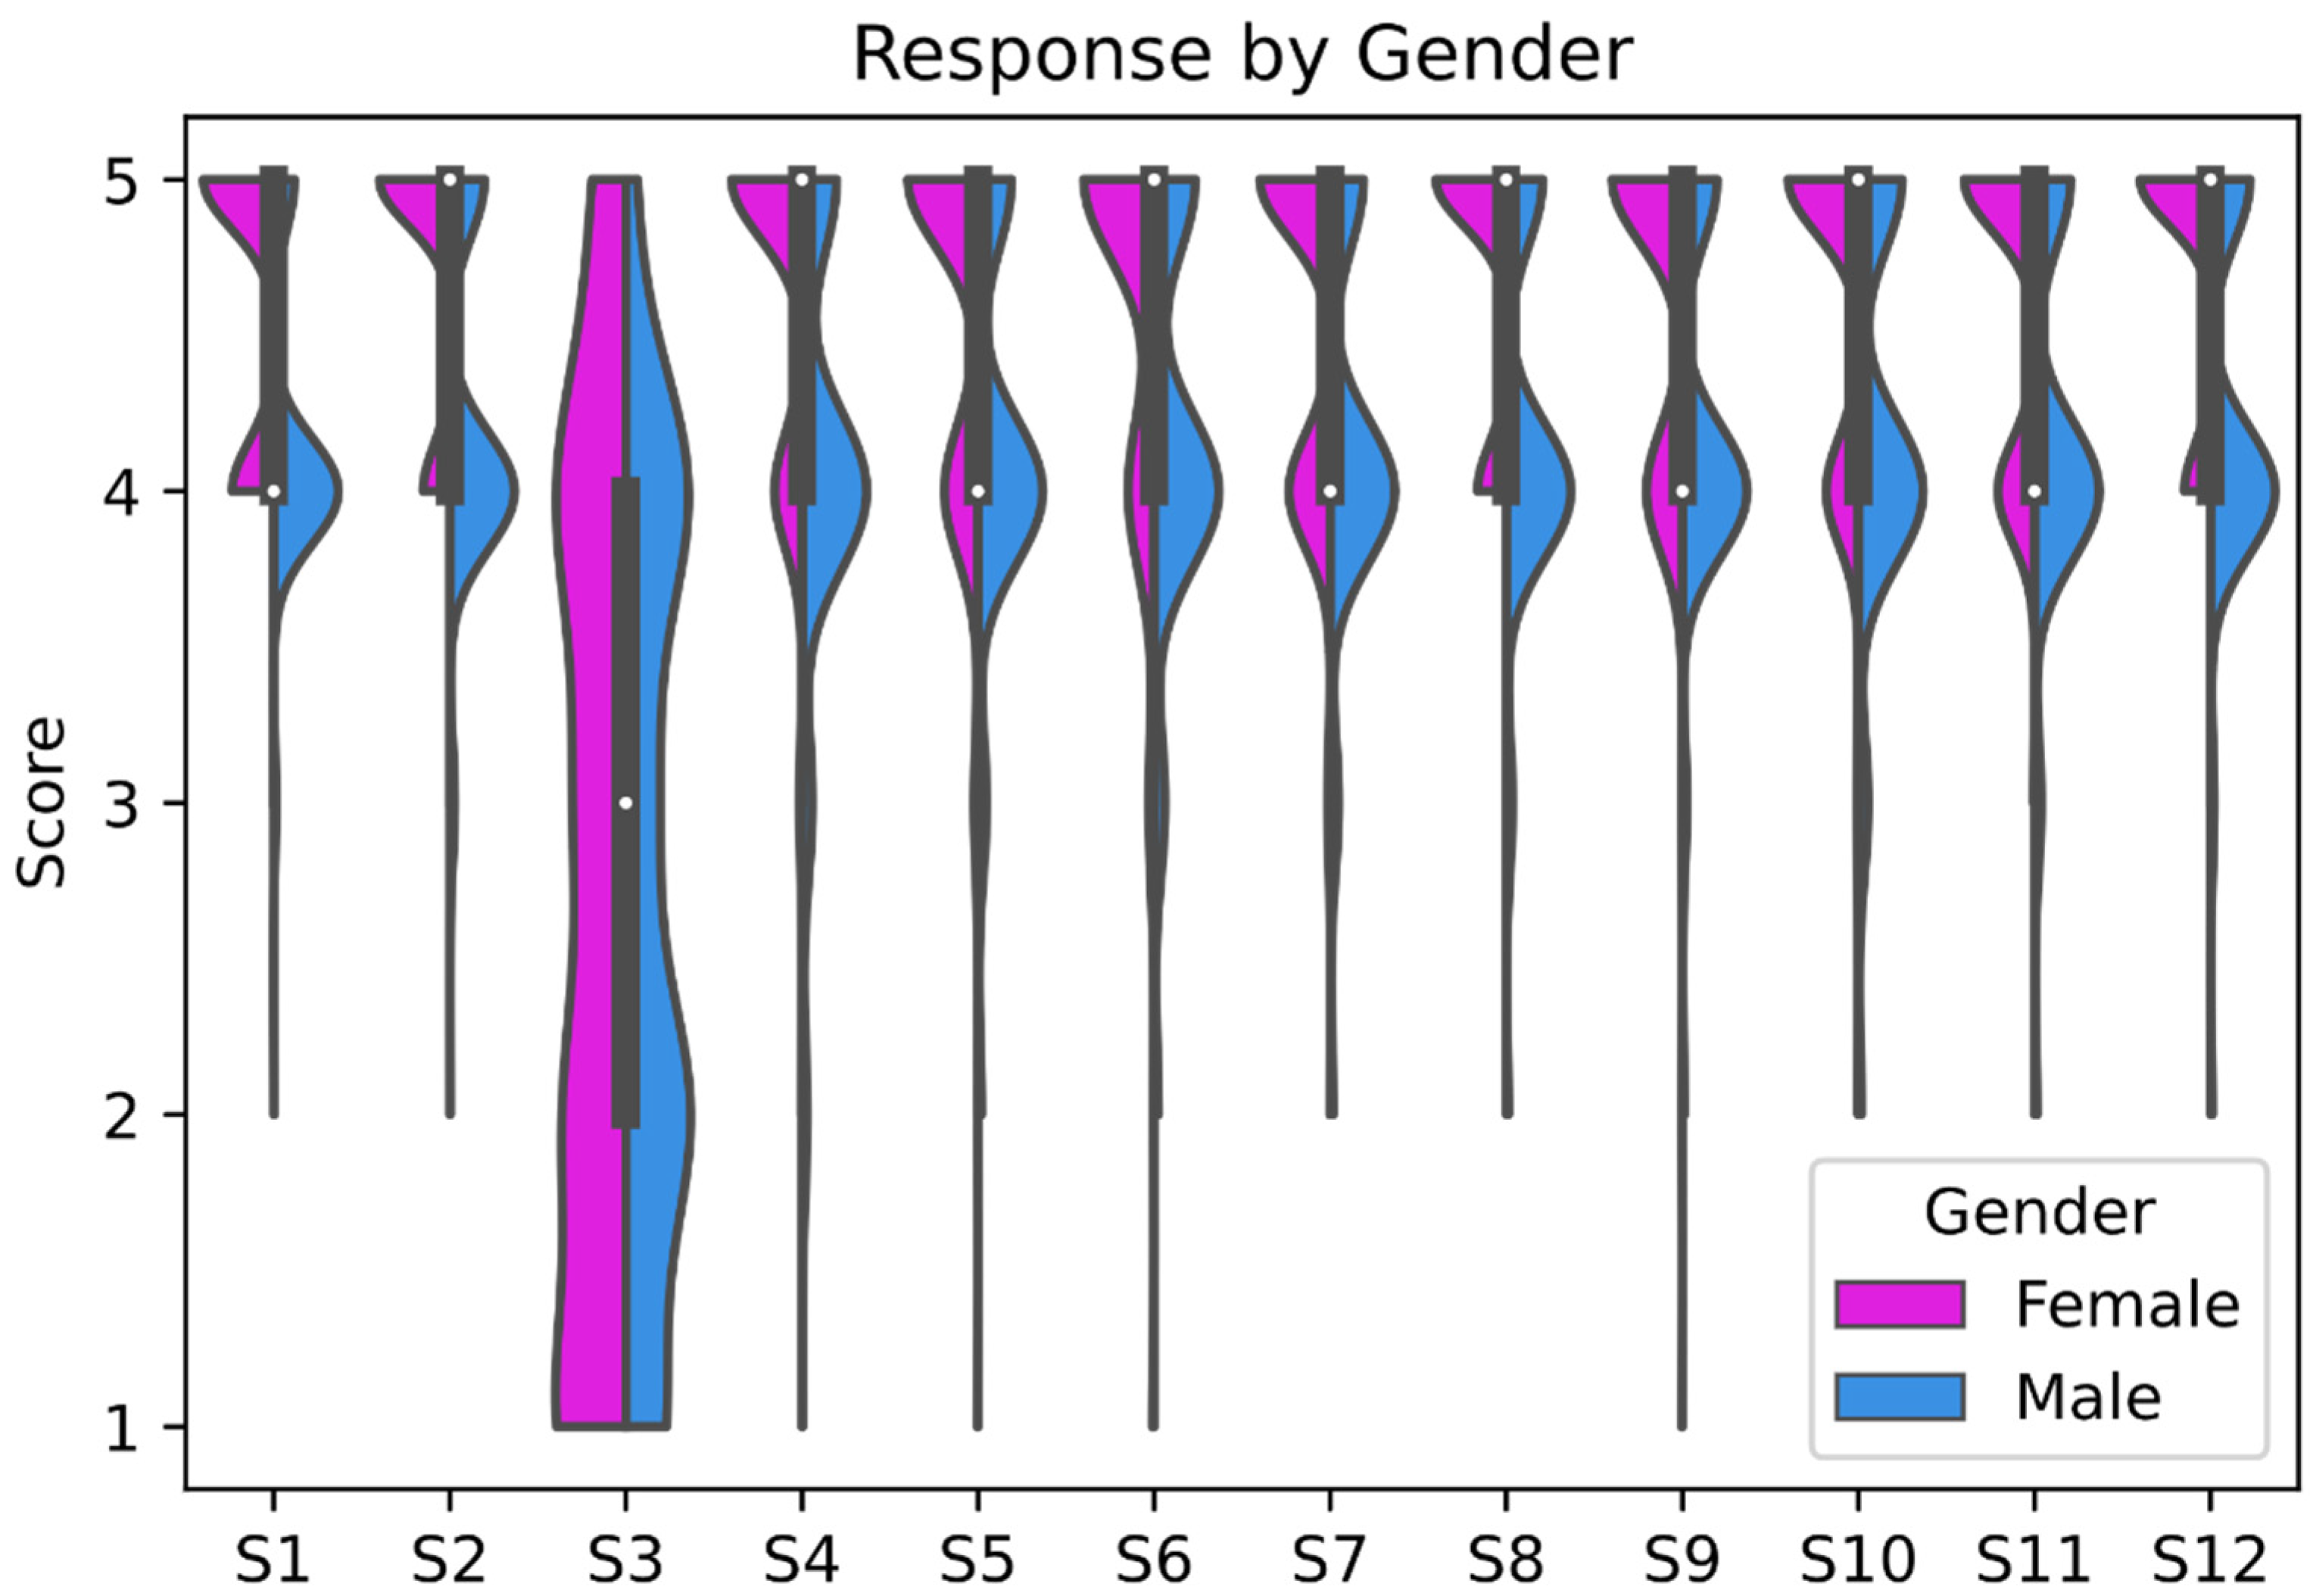
| S/N | Solutions | Mean | Mean | Std. Deviation | t-Value | Sig. (2-Tailed) | Mean Difference | |
|---|---|---|---|---|---|---|---|---|
| Male | Female | |||||||
| S12 | Reduction in the number of passengers in taxis | 4.30 | 4.73 | 4.52 | 0.57 | 40.25 | 0.000 | 1.021 |
| S2 | Cleaner commercial vehicles | 4.28 | 4.73 | 4.51 | 0.55 | 41.52 | 0.000 | 1.015 |
| S8 | Reduce cost of public transportation fare | 4.24 | 4.71 | 4.48 | 0.60 | 36.78 | 0.000 | 0.981 |
| S10 | Construction of more waiting areas with hygiene facilities | 4.23 | 4.65 | 4.45 | 0.65 | 32.97 | 0.000 | 0.950 |
| S11 | Construction of alternative routes to ease the challenge of traffic congestion | 4.22 | 4.64 | 4.44 | 0.62 | 34.00 | 0.000 | 0.936 |
| S9 | Allowing bikes and tricycles (Keke) in strategic areas to facilitate easy movement and reduce pressure on taxis | 4.25 | 4.60 | 4.43 | 0.65 | 32.43 | 0.000 | 0.932 |
| S1 | Provision of more transportation options suitable for all mobility needs (comfortable seats and backrests, adequate space) | 4.20 | 4.63 | 4.42 | 0.54 | 38.63 | 0.000 | 0.923 |
| S4 | Proactive maintenance of existing buses | 4.11 | 4.66 | 4.40 | 0.73 | 27.96 | 0.000 | 0.897 |
| S7 | Construction of more terminals | 4.17 | 4.59 | 4.39 | 0.65 | 30.79 | 0.000 | 0.889 |
| S5 | Effective management system at bus terminals | 4.16 | 4.58 | 4.38 | 0.71 | 28.21 | 0.000 | 0.882 |
| S6 | Collaboration between government and private sectors | 4.18 | 4.56 | 4.38 | 0.79 | 25.16 | 0.000 | 0.876 |
| S3 | Provision of incentives to drivers | 2.70 | 2.74 | 2.72 | 1.30 | −13.55 | 0.000 | −0.778 |
| S/N | Solutions | Mann–Whitney U | Wilcoxon W | Z | Asymp. Sig. (2-Tailed) | Kolmogorov–Smirnov Z | Asymp. Sig. (2-Tailed) |
|---|---|---|---|---|---|---|---|
| S1 | Provision of more transportation options suitable for all mobility needs; comfortable seats, backrests, and adequate space | 19,228.0 | 49,609.0 | −9.23 | 0.00 | 4.50 | 0.00 |
| S2 | Cleaner commercial vehicles | 19,172.0 | 49,553.0 | −9.24 | 0.00 | 4.50 | 0.00 |
| S3 | Provision of incentives to drivers | 32,276.0 | 62,657.0 | −0.20 | 0.84 | 0.77 | 0.59 |
| S4 | Proactive maintenance of existing buses | 18,852.0 | 49,233.0 | −9.21 | 0.00 | 4.53 | 0.00 |
| S5 | Effective management system at bus terminals | 21,147.5 | 51,528.5 | −7.67 | 0.00 | 3.89 | 0.00 |
| S6 | Collaboration between government and private sectors | 21,928.5 | 52,309.5 | −7.13 | 0.00 | 3.82 | 0.00 |
| S7 | Construction of more terminals | 21,552.5 | 51,933.5 | −7.43 | 0.00 | 3.55 | 0.00 |
| S8 | Reduce cost of public transportation fare | 19,604.5 | 49,985.5 | −8.87 | 0.00 | 4.25 | 0.00 |
| S9 | Allowing bikes and tricycles (Keke) in strategic areas to facilitate easy movement and reduce pressure on taxis | 21,989.0 | 52,370.0 | −7.21 | 0.00 | 3.61 | 0.00 |
| S10 | Construction of more waiting areas with hygiene facilities | 21,643.0 | 52,024.0 | −7.42 | 0.00 | 3.54 | 0.00 |
| S11 | Construction of alternative routes to ease the challenge of traffic congestion | 21,433.5 | 51,814.5 | −7.57 | 0.00 | 3.61 | 0.00 |
| S12 | Reduction in the number of passengers in taxis | 20,216.5 | 50,597.5 | −8.54 | 0.00 | 4.14 | 0.00 |
| Grouping Variable: Gender; KS = Kolmogorov–Smirnov | |||||||
Publisher’s Note: MDPI stays neutral with regard to jurisdictional claims in published maps and institutional affiliations. |
© 2022 by the authors. Licensee MDPI, Basel, Switzerland. This article is an open access article distributed under the terms and conditions of the Creative Commons Attribution (CC BY) license (https://creativecommons.org/licenses/by/4.0/).
Share and Cite
Abdullah, A.; Ababio-Donkor, A.; Adams, C.A. Gender Disparities in the Access and Use of Urban Public Transport in Abuja, Nigeria. Sustainability 2022, 14, 5219. https://doi.org/10.3390/su14095219
Abdullah A, Ababio-Donkor A, Adams CA. Gender Disparities in the Access and Use of Urban Public Transport in Abuja, Nigeria. Sustainability. 2022; 14(9):5219. https://doi.org/10.3390/su14095219
Chicago/Turabian StyleAbdullah, Amatullah, Augustus Ababio-Donkor, and Charles Anum Adams. 2022. "Gender Disparities in the Access and Use of Urban Public Transport in Abuja, Nigeria" Sustainability 14, no. 9: 5219. https://doi.org/10.3390/su14095219
APA StyleAbdullah, A., Ababio-Donkor, A., & Adams, C. A. (2022). Gender Disparities in the Access and Use of Urban Public Transport in Abuja, Nigeria. Sustainability, 14(9), 5219. https://doi.org/10.3390/su14095219