Article

Differences in Ecological Traits between Plants Grown In Situ and Ex Situ and Implications for Conservation

1
Key Laboratory of Resource Plants, West China Subalpine Botanical Garden, Institute of Botany, Chinese Academy of Sciences, Beijing 100093, China
2
University of Chinese Academy of Sciences, Beijing 100049, China
*
Author to whom correspondence should be addressed.
Sustainability 2022, 14(9), 5199; https://doi.org/10.3390/su14095199
Submission received: 9 February 2022 / Revised: 13 April 2022 / Accepted: 13 April 2022 / Published: 26 April 2022
(This article belongs to the Topic Climate Change and Environmental Sustainability)

Abstract

:
Ex situ conservation plays an important role in maintaining global plant biodiversity and protects thousands of wild plants. Plant conservation in botanical gardens is an important part of ex situ conservation; however, little attention has been given to whether plant ecophysiological traits change and whether plant conservation goals are reached following ex situ conservation. In this study, tree and shrub plants were selected from Shanxi, Beijing of China and from Beijing Botanical Garden, and plants with good growth and similar ages were randomly selected to measure their light response curves, CO2 response curves with a portable photosynthesis system (Li-6400XT), relative chlorophyll contents using a chlorophyll meter (SPAD-502) and leaf water potential using a dew point water potential meter (WP4C). In comparison with cultivated plants, wild plants had higher water use efficiencies among all plants considered (by 92–337%) and greater light use efficiencies among some of plants considered (by 107–181%), while light response curves and CO2 response curves for wild plants were either higher or lower compared with cultivated plants. Ecological traits of wild and cultivated plants changed more as a result of habitat factors than due to plant factors. The initial slope of the light response curve, net photosynthetic rate at light saturation, light saturation point, maximum light energy utilization efficiency, maximum water use efficiency, leaf water content, and the leaf water potential of wild plants were larger or equal to those of cultivated plants, while dark respiration rate (by 63–583%) and light compensation point (by 150–607%) of cultivated plants were higher than those of wild plants. This research compared the ecophysiological traits of common green space plants cultivated in botanical gardens and distributed in different areas in wild environments. The response of plant ecophysiological traits to the changing environment has important theoretical and practical significance for wild plant conservation and urban green space system construction.

1. Introduction

Green plants are the primary producers in the ecosystems on earth. These plants are directly or indirectly essential for the survival of many wild ecosystems and agrobiodiverse landscapes and have immense cultural importance [1,2]. An estimated 20% of plants are threatened with extinction, and plant diversity is currently being lost at an unprecedented rate [3,4]. The extinction threat is largely anthropogenic in origin, driven by habitat degradation, invasive plant stress, resource overexploitation, and climate change [4,5]. Plants need additional protection in their native habitats, and samples need to be collected for preservation in botanical gardens and arboreta [5]. Conservation plans for plants are related to their maintenance either in situ (e.g., protected areas) or ex situ (e.g., botanical gardens, seed banks and tissue culture collections) [3,6]. Furthermore, it is crucial to protect the integrity and diversity of natural resources by saving endangered plants, establishing national parks and natural reserves, and assessing the protection status of plants and ecosystems, as stated in the main mission of the International Union for Conservation of Nature (IUCN) [7].
Ex situ conservation acts as a back-up for certain segments of plant diversity that might otherwise be lost in nature and in human-dominated ecosystems [8,9], and it enables the conservation of thousands of wild plants within national and international facilities [3]. Plant conservation in botanical gardens is an important part of ex situ conservation; it conserves plant diversity ex situ and can prevent extinction through integrated conservation actions [4].
Many of the most impressive living plant collections, seed banks, and herbaria are located in botanical gardens [10]. Botanical gardens have a rich tradition of leading plant research and conservation programs, and gardens can take full advantage of their extensive collections and expertise to build large-scale programs to combat effects of climate change on global plant biodiversity [10]. Although ex situ conservation of plants in botanical gardens has played a major role in plant protection for more than 100 years, whether plant traits change with environmental conditions after ex situ conservation and whether plant conservation goals are reached require further assessment. Botanical gardens grow a wide variety of plants in a single location, and with a high level of care, they can create a reasonably consistent environment. The grounds of the gardens are often carefully mulched, weeded, fertilized, irrigated, and kept free of pests. Individual plants are often well spaced and grown under conditions considered ideal for plants [11,12]. Thus, growth conditions of wild plants change upon ex situ conservation in botanical gardens.
Compared with wild environments, the planting density of plants in botanical gardens is sparse, the understory is less structured, and environmental conditions for plant growth are relatively adequate and usually not restricted by lighting conditions [13]. With the lower elevation of botanical gardens and influence of human activities, plants are exposed to higher temperatures and CO2 concentrations [13]. Botanical gardens create artificial conservation conditions using irrigation over a long period of time, providing sufficient water resources [12]. However, important issues, such as plant acclimatization to novel, artificial environments, the loss of acclimation to the natural environment and the subsequent fitness decline under natural conditions have received less attention [14]. At the same time, the problems and risks associated with ex situ cultivation in botanical gardens have been recognized, and the acclimatization of wild plants to local environmental conditions may simultaneously cause the loss of acclimations to their natural origins [14].
Plant functional traits determine plant growth, survival and reproduction and are direct indicators for assessing their acclimation to the environment, including their morphological and physiological traits [10,15], therefore, functional traits, including ecophysiological traits, are thought to be important in determining the fitness of introduced plants [16]. However, few studies have focused on the differences between the functional traits of wild and cultivated plants. At present, the evaluation of the growth status of cultivated plants in botanical gardens mostly focuses on genetic resources, flowering period, morphological traits, anatomical structure, and plant cultivation experiences [14]. There are almost no research reports on whether the ecophysiological traits of the plants change after exchanging habitats from the wild to ex situ sites.
Ecophysiological traits of plants are easily affected by environmental conditions, and studies of leaf physiological traits can advance our understanding of adaptability of plants to environmental change [17]. Generally, at temperatures higher or lower than optimum, physiological processes decrease with increasing long-term light availability within the canopy or at elevated CO2 levels, photosynthetic capacity increases [18,19]. In water-limited environments, high water use efficiency (WUE) has been considered a trait contributing to plant success at the community level [20]. Leaf physiological trait indicators, such as leaf maximum photosynthetic rate, dark respiration, and transpiration, are strongly related to leaf-level CO2 assimilation, water exchange, and light capture strategies [17]. Therefore, an understanding of how leaf physiological traits interact with changing environments plays an important role in the conservation and management of plants in botanical gardens. By applying ecophysiological methods to assess the fitness of ex situ conservation, we can achieve a more accurate understanding of the acclimation mechanisms of plants to their environments under natural conditions and the environmental fitness of long-term botanical garden conservation. We can then scientifically set cultivation conditions, which will provide a theoretical basis for the fitness of plant conservation [14].
We hypothesized that the ecophysiological traits of plants change after long-term ex situ conservation. To test this hypothesis, we chose plants of five tree and three shrub species naturally distributed in Shanxi Province and Beijing, China, that are also cultivated in the Beijing Botanical Garden and measured their light response curves, CO2 response curves, light energy and water-use efficiency, and physiological water utilization traits. The objectives of this research were to explore the following questions: (a) Which ecophysiological traits of plants changed after ex situ conservation? (b) Are there differences in the ranges of changes in ecophysiological traits of wild plants in different regions after ex situ conservation? (c) Is the acclimation of trees and shrubs after ex situ conservation the same? Answering these questions provides a theoretical basis for ex situ conservation management in botanical gardens.

2. Materials and Methods

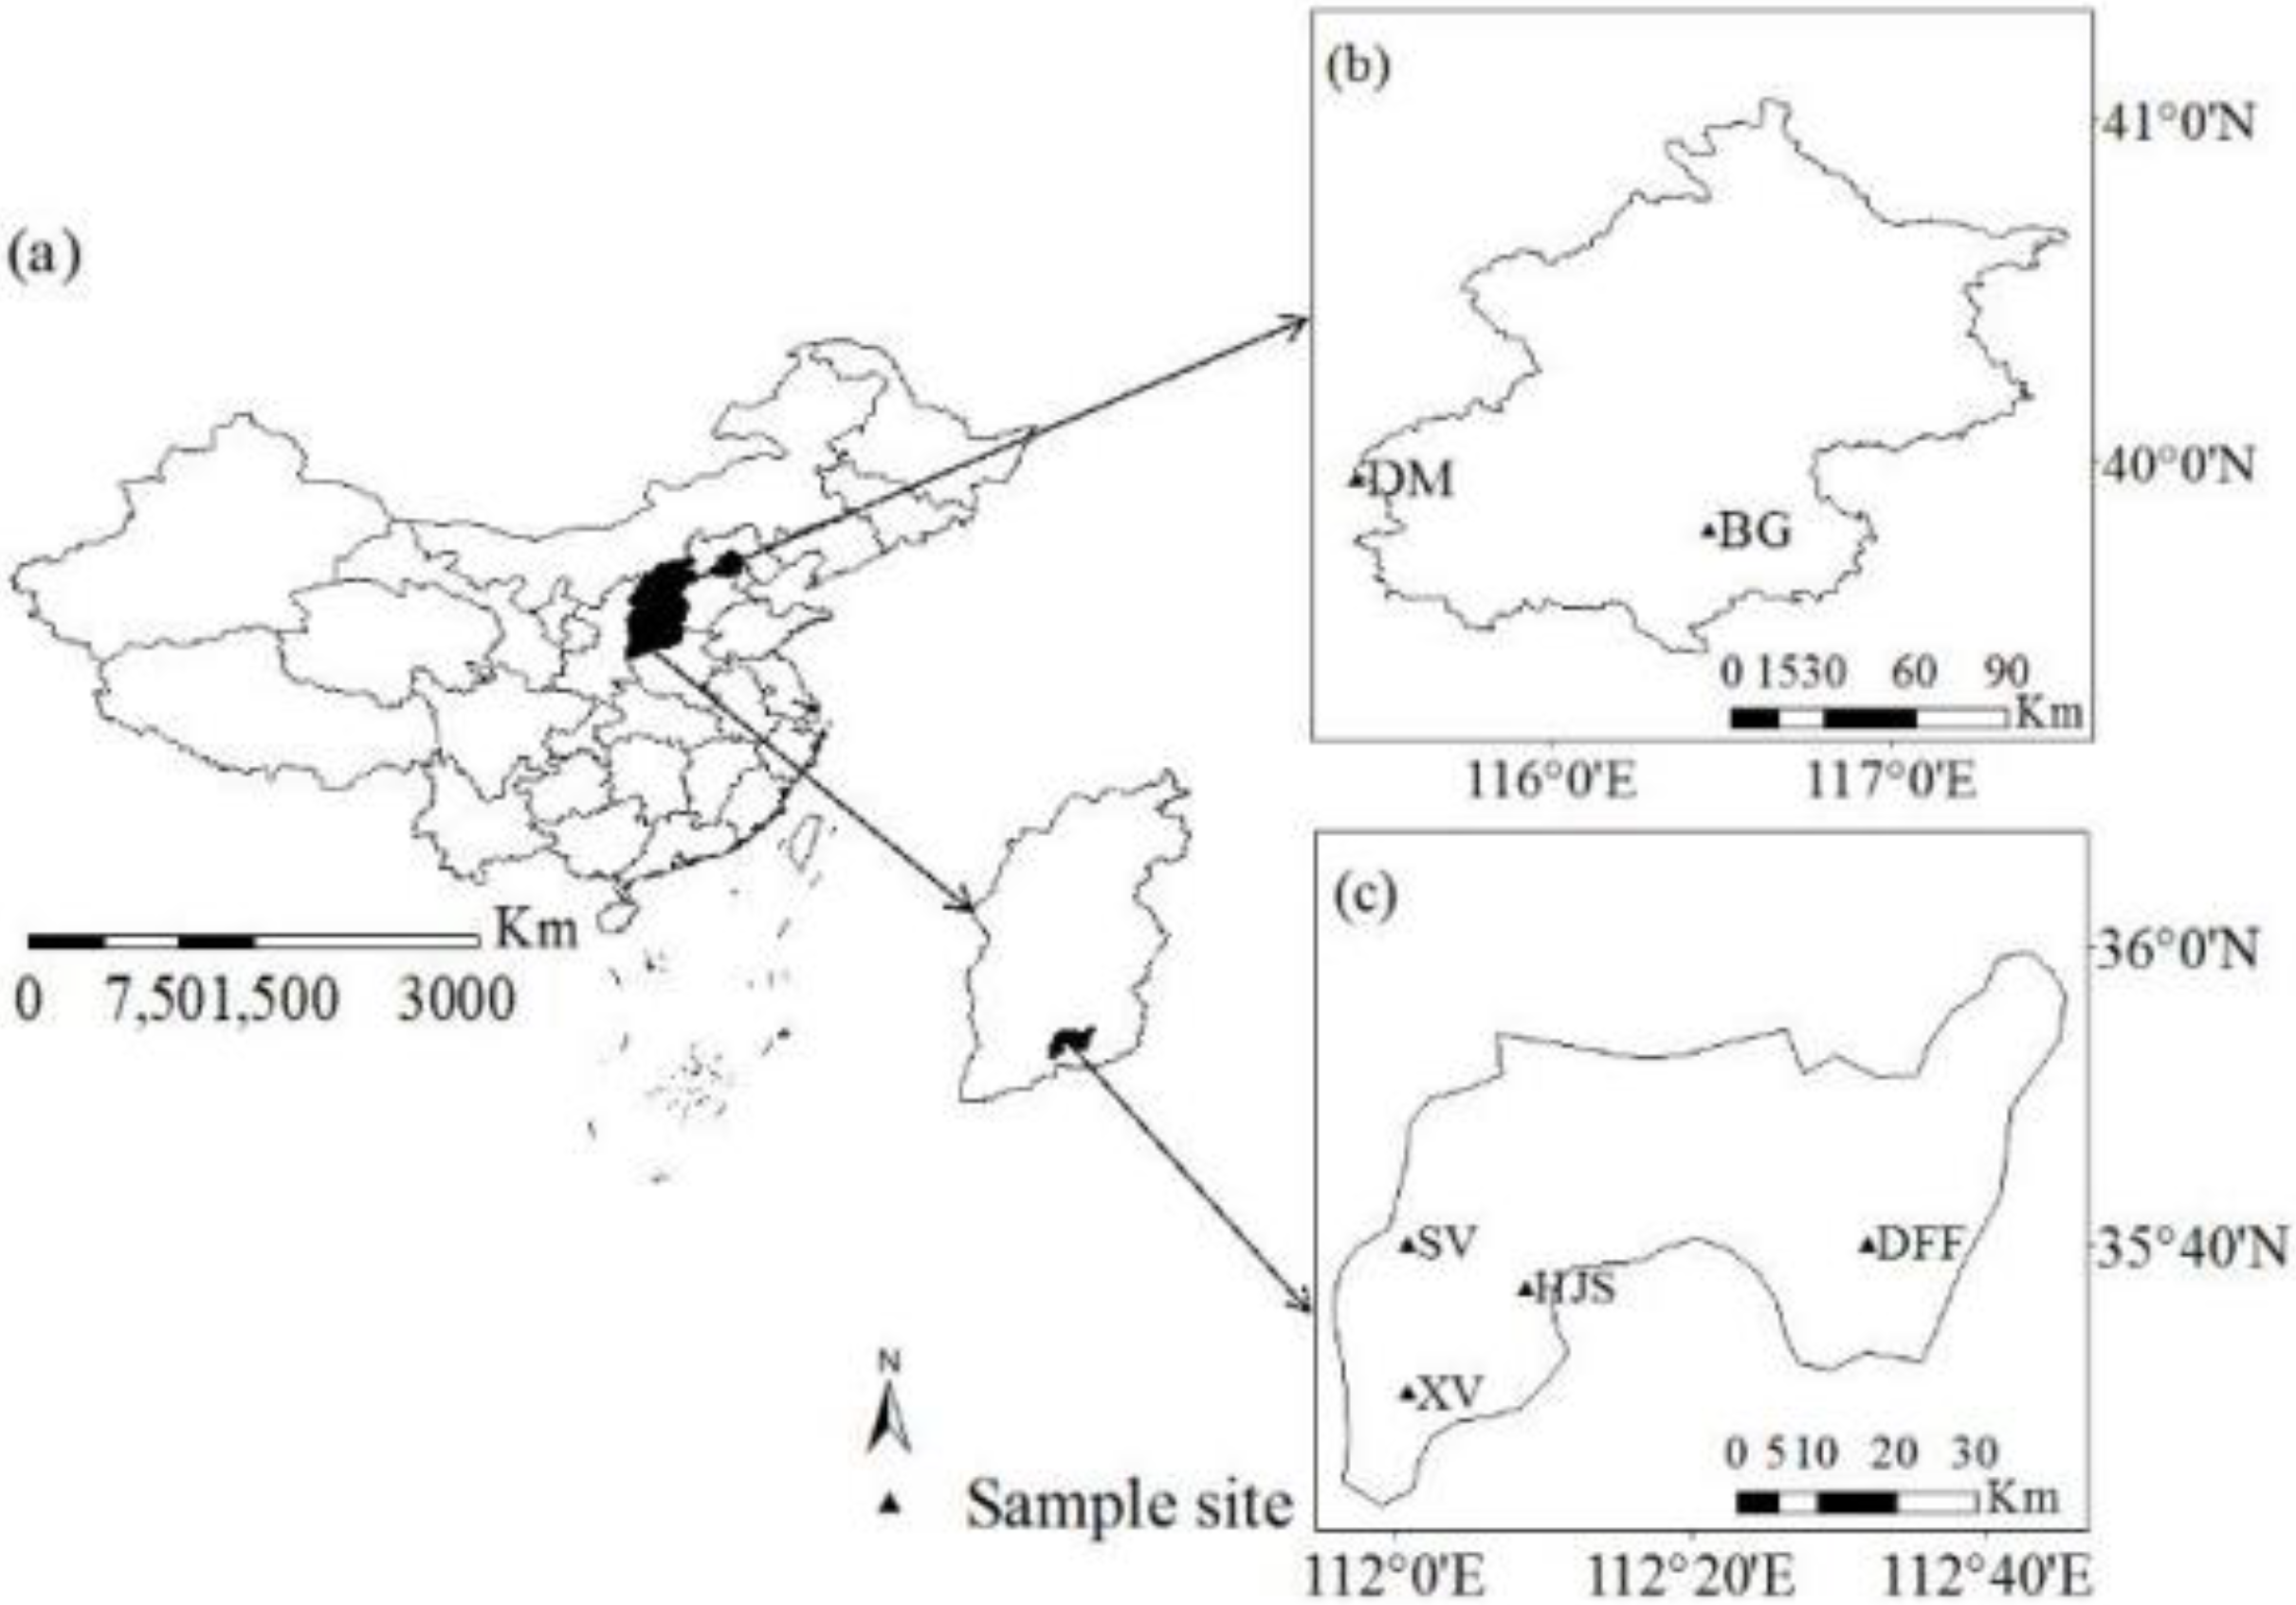
2.1. Study Area and Plants

Wild plants (plants distributed in natural habitats (in situ)) of four tree species, i.e., Amygdalus davidiana, Acer truncatum, Quercus aliena var. Acutiserrata, and Cotinus coggygria, and one shrub plant, Forsythia suspense, which are naturally distributed in Qinshui County, Shanxi Province, China, were selected (Table S1). Qinshui County (35°24′–36°00′ N, 112°47′–115°55′ E) is at the junction of the Taihang, Taiyue, and Zhongtiao Mountains [21]. The altitude ranges from 511–2358 m. The climate in Qinshui County belongs to the warm temperate monsoon climate. Summer rainfall is mostly concentrated between July and September. The annual precipitation ranges from 560–750 mm. The annual average temperature is 10.3 °C [22]. The average temperature in August is 21.7 °C, the extreme minimum daily temperature in August is 17.6 °C, and the extreme maximum daily temperature in August is 27.3 °C (http://data.cma.cn/data, accessed on 20 August 2021). The wild plants in this area are located on four plots, namely, Haojiashan in Zhongcun Township (35°37′ N, 112°9′ E), Duanshi Forest Farm (35°40′ N, 112°32′ E), Shuiquan Village in Beitan Township (35°40′ N, 112°1′ E), and Xiachuan Village in Zhongcun Township (35°30′ N, 112°1′ E) (Figure 1).
Wild plants from three tree species, i.e., A. davidiana, A. truncatum and Syringa pekinensis, and two shrub species, i.e., Rhododendron mucronulatum and Sambucus williamsii, found naturally in Dongling Mountain in Beijing were selected. Dongling Mountain, one part of the Taihang Mountains, is located at 39°55′–40°05′ N, 115°20′–115°35′ E, and has a temperate monsoon climate with mountain characteristics. The annual average temperature is 6.5 °C, and the annual precipitation is 600 mm [23]. The average temperature in August is 24.8 °C, the extreme minimum daily temperature in August is 20.4 °C, and the extreme maximum daily temperature in August is 29.8 °C (http://data.cma.cn/data, accessed on 20 August 2021) (Table S1, Figure 1).
Cultivated plants (plants cultivated in a botanical garden (ex situ)), including all plants distributed at the two sites above, were grown at the Beijing Botanical Garden, Institute of Botany, Chinese Academy of Sciences (hereafter, referred to as cultivated plants). Plants were planted by seeds in the nursery and then translated to the garden. The garden is located southeast of Fragrant Hill and 18 km from the center of Beijing (39°48′ N, 116°28′ E) at an elevation of 76 m above sea level. The garden experiences a temperate monsoon climate. The mean annual temperature is 11.6℃, and the mean annual precipitation is 634.2 mm [24]. The average temperature in August is 25.9 °C, the extreme minimum daily temperature in August is 21.8 °C, and the extreme maximum daily temperature in August is 30.6 °C (http://data.cma.cn/data, accessed on 20 August 2021) (Table S1, Figure 1).
Among all plants of the eight species, A. davidiana and A. truncatum existed in all three sites, Q. aliena, C. coggygria and F. suspensa existed in Shanxi Province and the Beijing Botanical Garden, and S. pekinensis, R. mucronulatum, and S. williamsii existed in Beijing and the Beijing Botanical Garden.
At the three sites, the field data for studied plants were measured during August 2019 and 2020. For each species, three plant individuals with good growth, no obvious diseases and insect pests, and of a consistent age were randomly selected according to the records of the Beijing Botanical Garden and growth status and size of plants. Each plant individual was selected from a 10 m × 10 m plot. Three individuals of each species, and three leaves for each individual, were measured. From each plant, leaves were selected from the top of the middle branches on the sunny side for in situ measurements. Only one species was measured in one day to ensure that the measurement periods were similar. Leaves were chosen from the south side of 2 m position of the trees, and the top of the shrub was chosen for the following measurements.

2.2. Gas Exchange and Leaf Photosynthesis

The light response and CO2 curves were measured on sunny days. For each species, three individuals with good growth and a consistent age were randomly selected. One leaf from each of three different plants was measured between 9:00 and 11:00 in the morning.
The light response curves (LRCs) of leaves for different plants were determined with a portable photosynthesis system (Li-6400XT, LI-COR, Lincoln, NE, USA). Before measurement, the instrument was preheated and calibrated each day, and the small steel cylinder was calibrated to ensure that the CO2 injection system could control the stability of the CO2 concentration in the sample chamber. The flow rate of the instrument was set to 500 mol·s−1. Measurements were carried out at a relative humidity of 50–60% and a leaf temperature of 25 °C using a standard leaf chamber (2 × 3 cm). A red–blue LED light source with a Li-6400XT configuration was used to control the Photosynthetic Photon Flux Density (PPFD) [25]. The CO2 supply concentration was controlled at 400 μmol·m−2·s−1. We set the PPFD to 1800, 1500, 1200, 1000, 800, 600, 400, 200, 150, 100, 50, 20 and 0 μmol·m−2·s−1 to obtain the LRC. When PPFD = 0 μmol·m−2·s−1, the photosynthetic rate (Pn) was the dark respiration rate (Rd, μmol·m−2·s−1).
The CO2 response curves were obtained at saturation light intensities and CO2 concentrations of 400, 300, 200, 100, 50, 400, 600, 800, 1000, 1200, 1500 and 1800 μmol·mol−1. Other parameter configurations for the photosynthesis system were the same as those used for the measurements of the light response curves.
The stomatal conductance (Gs), transpiration rate (Tr), stomatal restriction (Ls), Pn and intercellular CO2 concentration (Ci) were measured when the light intensity reached saturation and the CO2 concentration was 400 μmol·m−2·s−1. The water use efficiency (WUE) under saturated light intensity was calculated using the following Equation [26]:
WUE = Pn/Tr

2.3. Relative Chlorophyll Content (SPAD)

The relative chlorophyll content of leaves in similar positions were measured using a chlorophyll meter (SPAD-502, Konica Minolta Sensing, Inc., Osaka, Japan) for their light response curves.

2.4. Leaf Water Potential

Leaf water potential (φ, MPa) was measured using a dew point water potential meter (WP4C, METER Group, Inc., Pullman, WA, USA). Fresh and healthy leaves in similar positions were collected from the plants, and their light response curves were measured during the daytime and then placed in an icebox until testing. The WP4 instrument was warmed up for 30 min before measurements. The leaves were shredded and placed in the sample box of the WP4 instrument. The sample volume did not exceed 1/2 of the sample box volume, and the water potential value was recorded.

2.5. Leaf Water Content

Leaf water content (LWC) was measured using a drying method [27]. Fresh leaves were collected from positions similar to where the light response curves were measured, weighed and placed in an envelope before taking them back to the laboratory. After drying in an oven at 105 °C for one hour, the leaf samples were transferred to 80 °C and dried to a constant weight, and then the dried leaves were weighed. The LWC of the leaves were calculated using the following equation [27,28]:
LWC = (W1 − W2)/W1 × 100%
where W1 represents the fresh weight of the leaves and W2 represents the dry weight of the leaves.

2.6. Data Analyses

2.6.1. Light Response Curve Fitting

The right-angle hyperbola correction model with the highest fitting accuracy was used to fit the photosynthetic response curve [29]:
Pn = α 1 β   I 1 + γ   I I Rd
where α is the initial slope of the light response curve, i.e., AQY (μmol·m−2·s−1); β and γ are the suppression coefficient and saturation coefficient, respectively; I is the photosynthetic light quantum flux density (μmol·m−2·s−1); and Rd is the dark respiration rate (μmol·m−2·s−1).
From Equation (3), the light saturation point (LSP), the light compensation point (LCP) and the net photosynthetic rate at light saturation (Pnmax) can be obtained:
LSP = β + γ β 1 γ
LCP = α γ Rd ( γ Rd α ) 2 4 α β Rd 2 α β
Pnmax = α ( β + γ β γ ) 2 Rd

2.6.2. Light Energy Utilization Efficiency (LUE) and Water Use Efficiency (WUE) Curve Fitting

The LUE of the plant leaves can be obtained [29,30]:
LUE = Pn I = α 1 β   I 1 + γ   I Rd I
From Equation (7), the maximum light energy utilization efficiency (LUEmax) and saturated light intensity corresponding to the maximum light energy utilization efficiency (Il-sat) can be obtained:
Il-sat = 1 α ( β + γ ) Rd γ
LUEmax = α 1 β   Il-sat 1 + γ   Il-sat Rd Il-sat
According to the definition of WUE from Equation (1), the WUE of the plant leaves can be obtained [26,29,30]:
WUE = Pn Tr = 1 Tr ( α 1 β I 1 γ I I Rd ) = α 1 1 β 1 I 1 γ 1 I I R d 1
where Rd1 = Rd/Tr.
From Equation (10), the maximum water use efficiency (WUEmax) and saturated light intensity corresponding to the maximum water use efficiency (Iw-sat) can be obtained:
Iw-sat = ( β 1 + γ 1 ) / β 1 1 γ 1
WUEmax = α 1 ( β 1 + γ 1 β 1 γ 1 ) 2 R d 1

2.7. Statistical Test

To compare leaf traits of different life forms between natural sites and botanical gardens, leaf trait data of trees, shrubs, and all plants in natural sites and botanical gardens were averaged. One-way analysis of variance (ANOVA) was used to test differences in data between sites and plants, results were considered significantly different when p < 0.05. When significant differences were found, Tukey’s test was used to separate differences between means (p < 0.05) [31]. Linear regression was used to analyze the relationship between Pnmax and SPAD and LUEmax and WUEmax of wild plants and cultivated plants. All statistical analyses were performed using SPSS Statistics 21.0 (SPSS Inc., Chicago, IL, USA).

3. Results

When comparing A. davidiana and A. truncatum in Shanxi, Beijing and the botanical gardens, among the 18 F values, 12 values for sites and 4 values for plants for the 18 parameters were significant (p < 0.05) (Table 1). When comparing Q. aliena, C. coggygria and F. suspensa in Shanxi and the botanical gardens and S. pekinensis, R. mucronulatum and S. williamsii in Beijing and the botanical gardens, among the 18 F values, 11 values for sites and 9 values for plants for interactions for the 18 parameters were significant (p < 0.05) (Table 2).

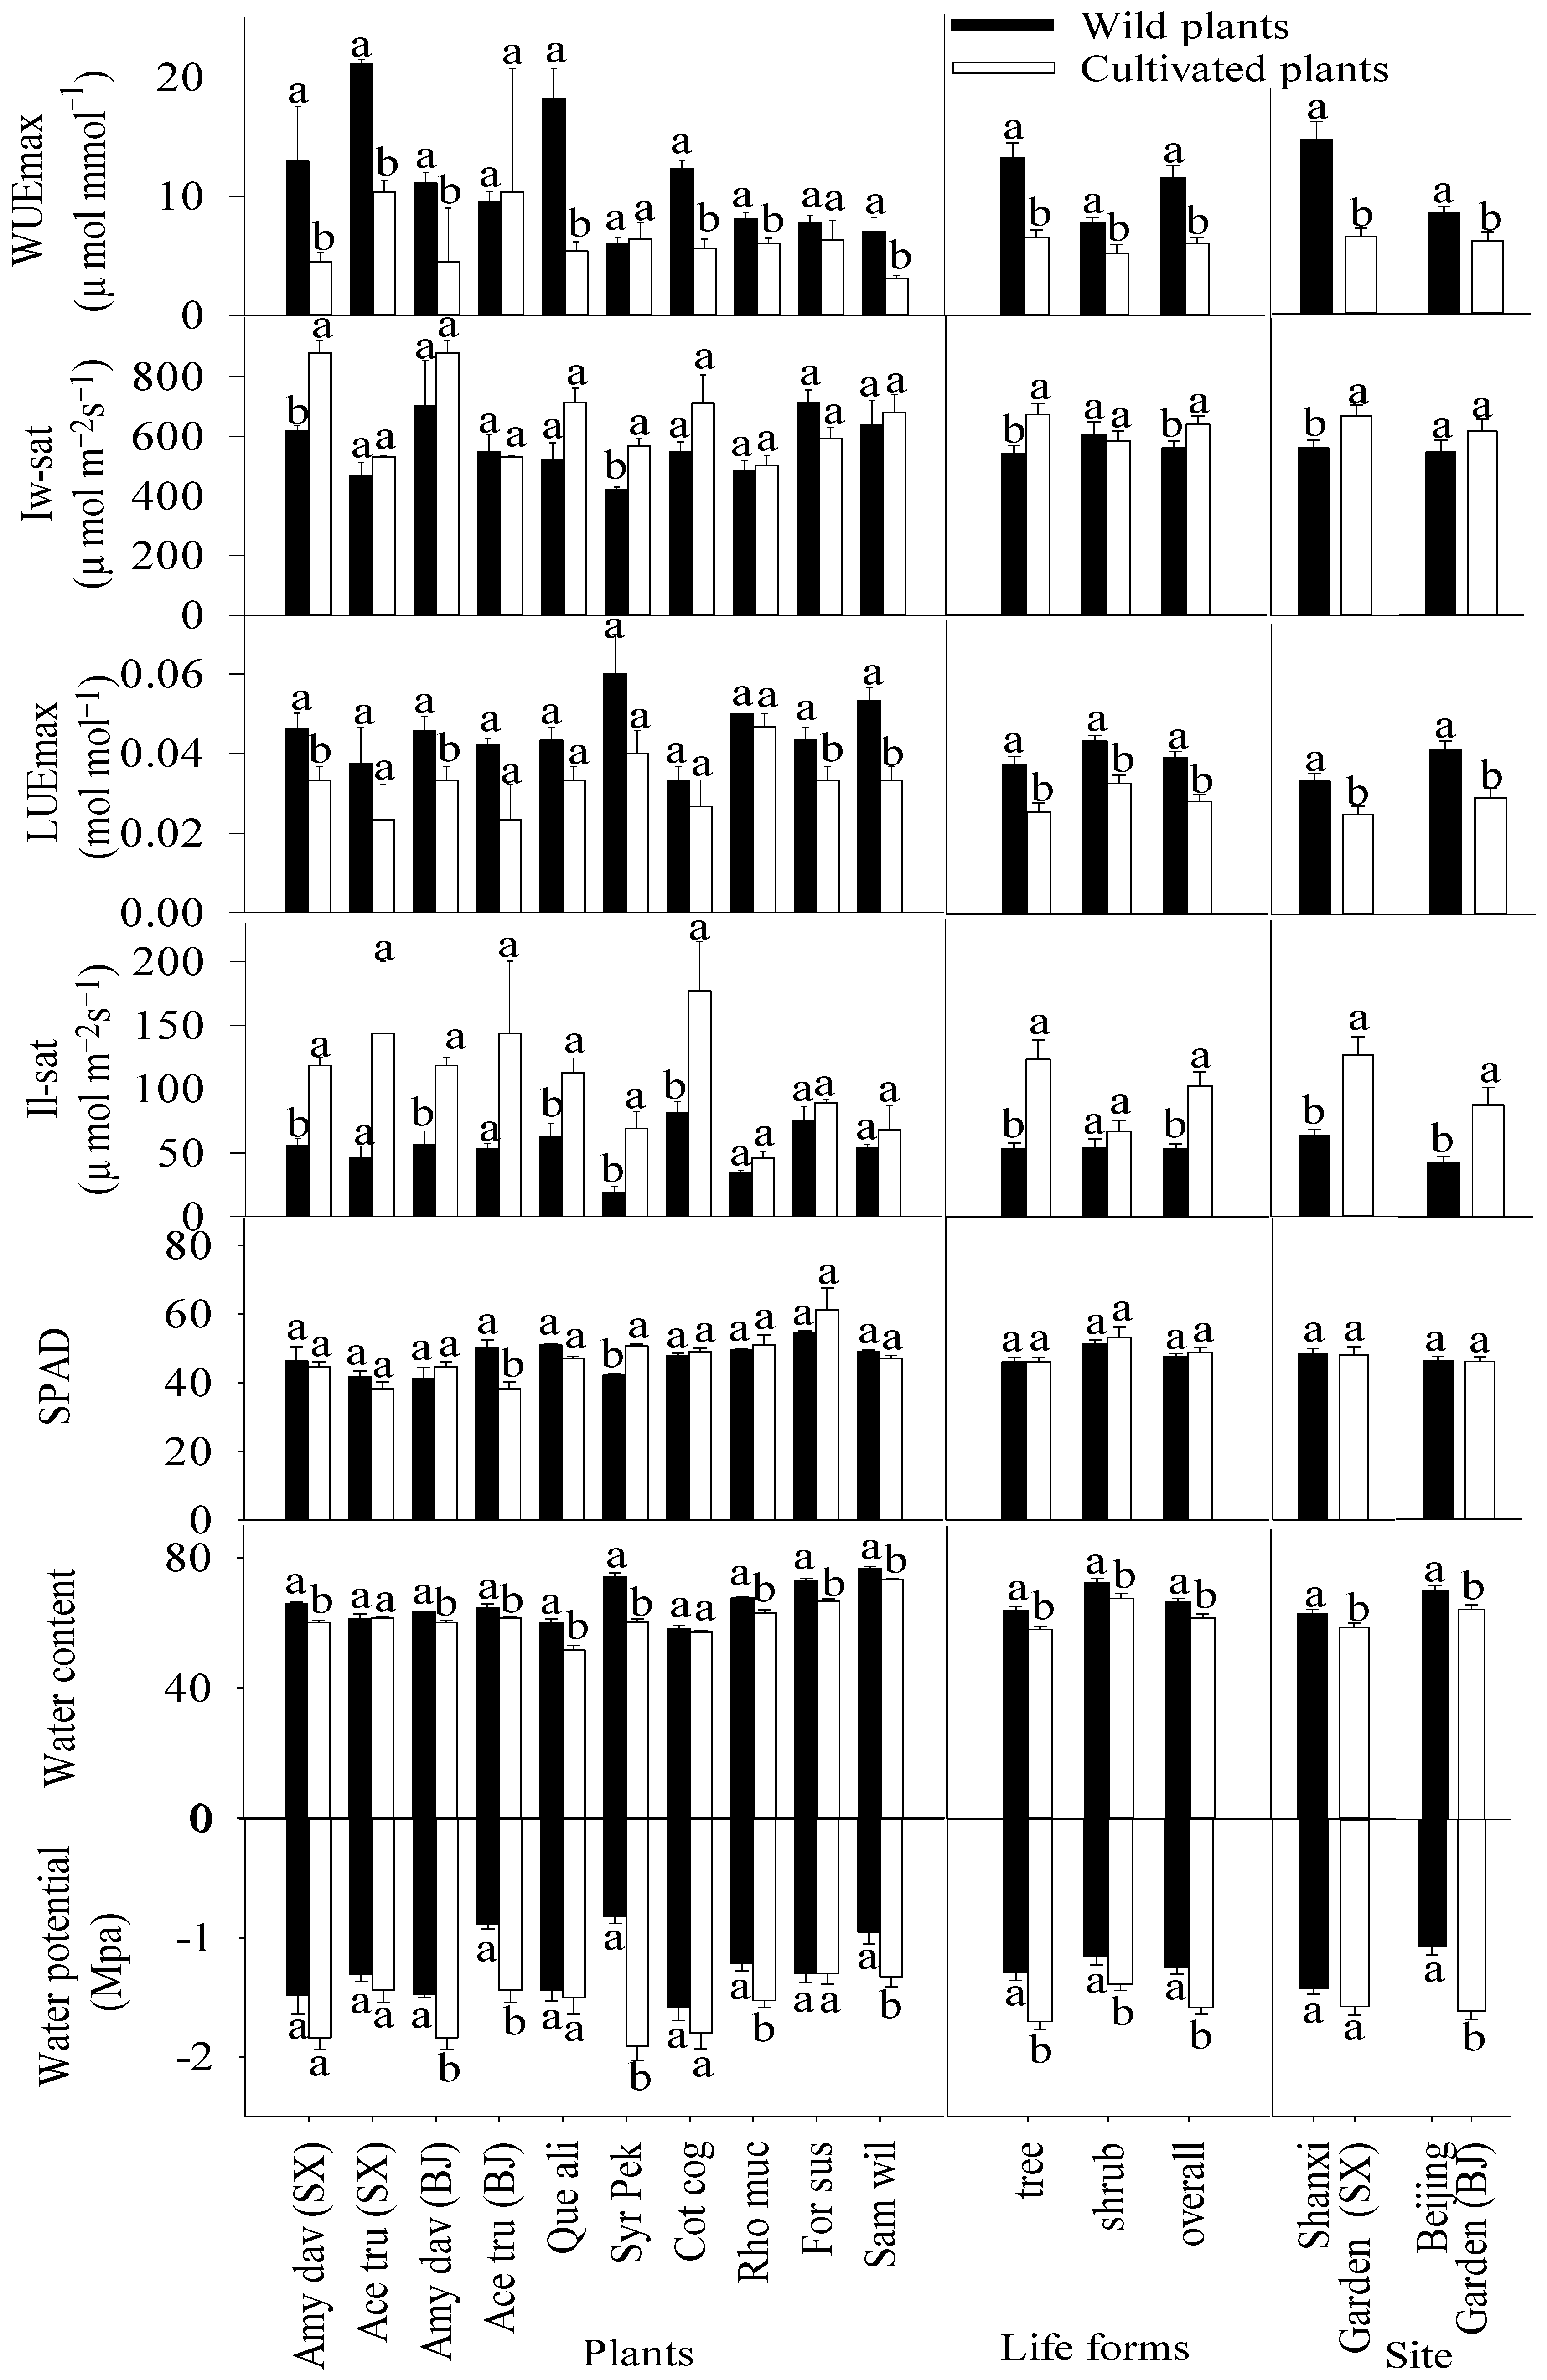
3.1. WUEmax, LUEmax, Relative Chlorophyll Content and Water Physiology of Plants in Natural Sites and Botanical Gardens

Compared with the plants in the botanical gardens, the WUEmax, LUEmax, LWC and water potential of wild plants were significantly higher at the levels of trees, shrubs and overall, while the Iw-sat and Il-sat of wild plants were significantly lower. The plants in Shanxi and Beijing had similar changes in WUEmax, LUEmax, LWC and Il-sat after ex situ conservation, but the changes in Iw-sat and water potential were different. Compared with the plants in the botanical gardens, the WUEmax, LUEmax and LWC were significantly higher for the wild plants averaged in Shanxi and Beijing, but the Il-sat was significantly lower. The Iw-sat in Shanxi was significantly lower, but it showed no significant difference in Beijing. There was no significant difference in water potential in Shanxi, but water potential in Beijing was significantly higher. SPAD showed no significant differences over tree, shrub or overall levels and had no significant differences for the plants averaged in Shanxi and Beijing (Figure 2).

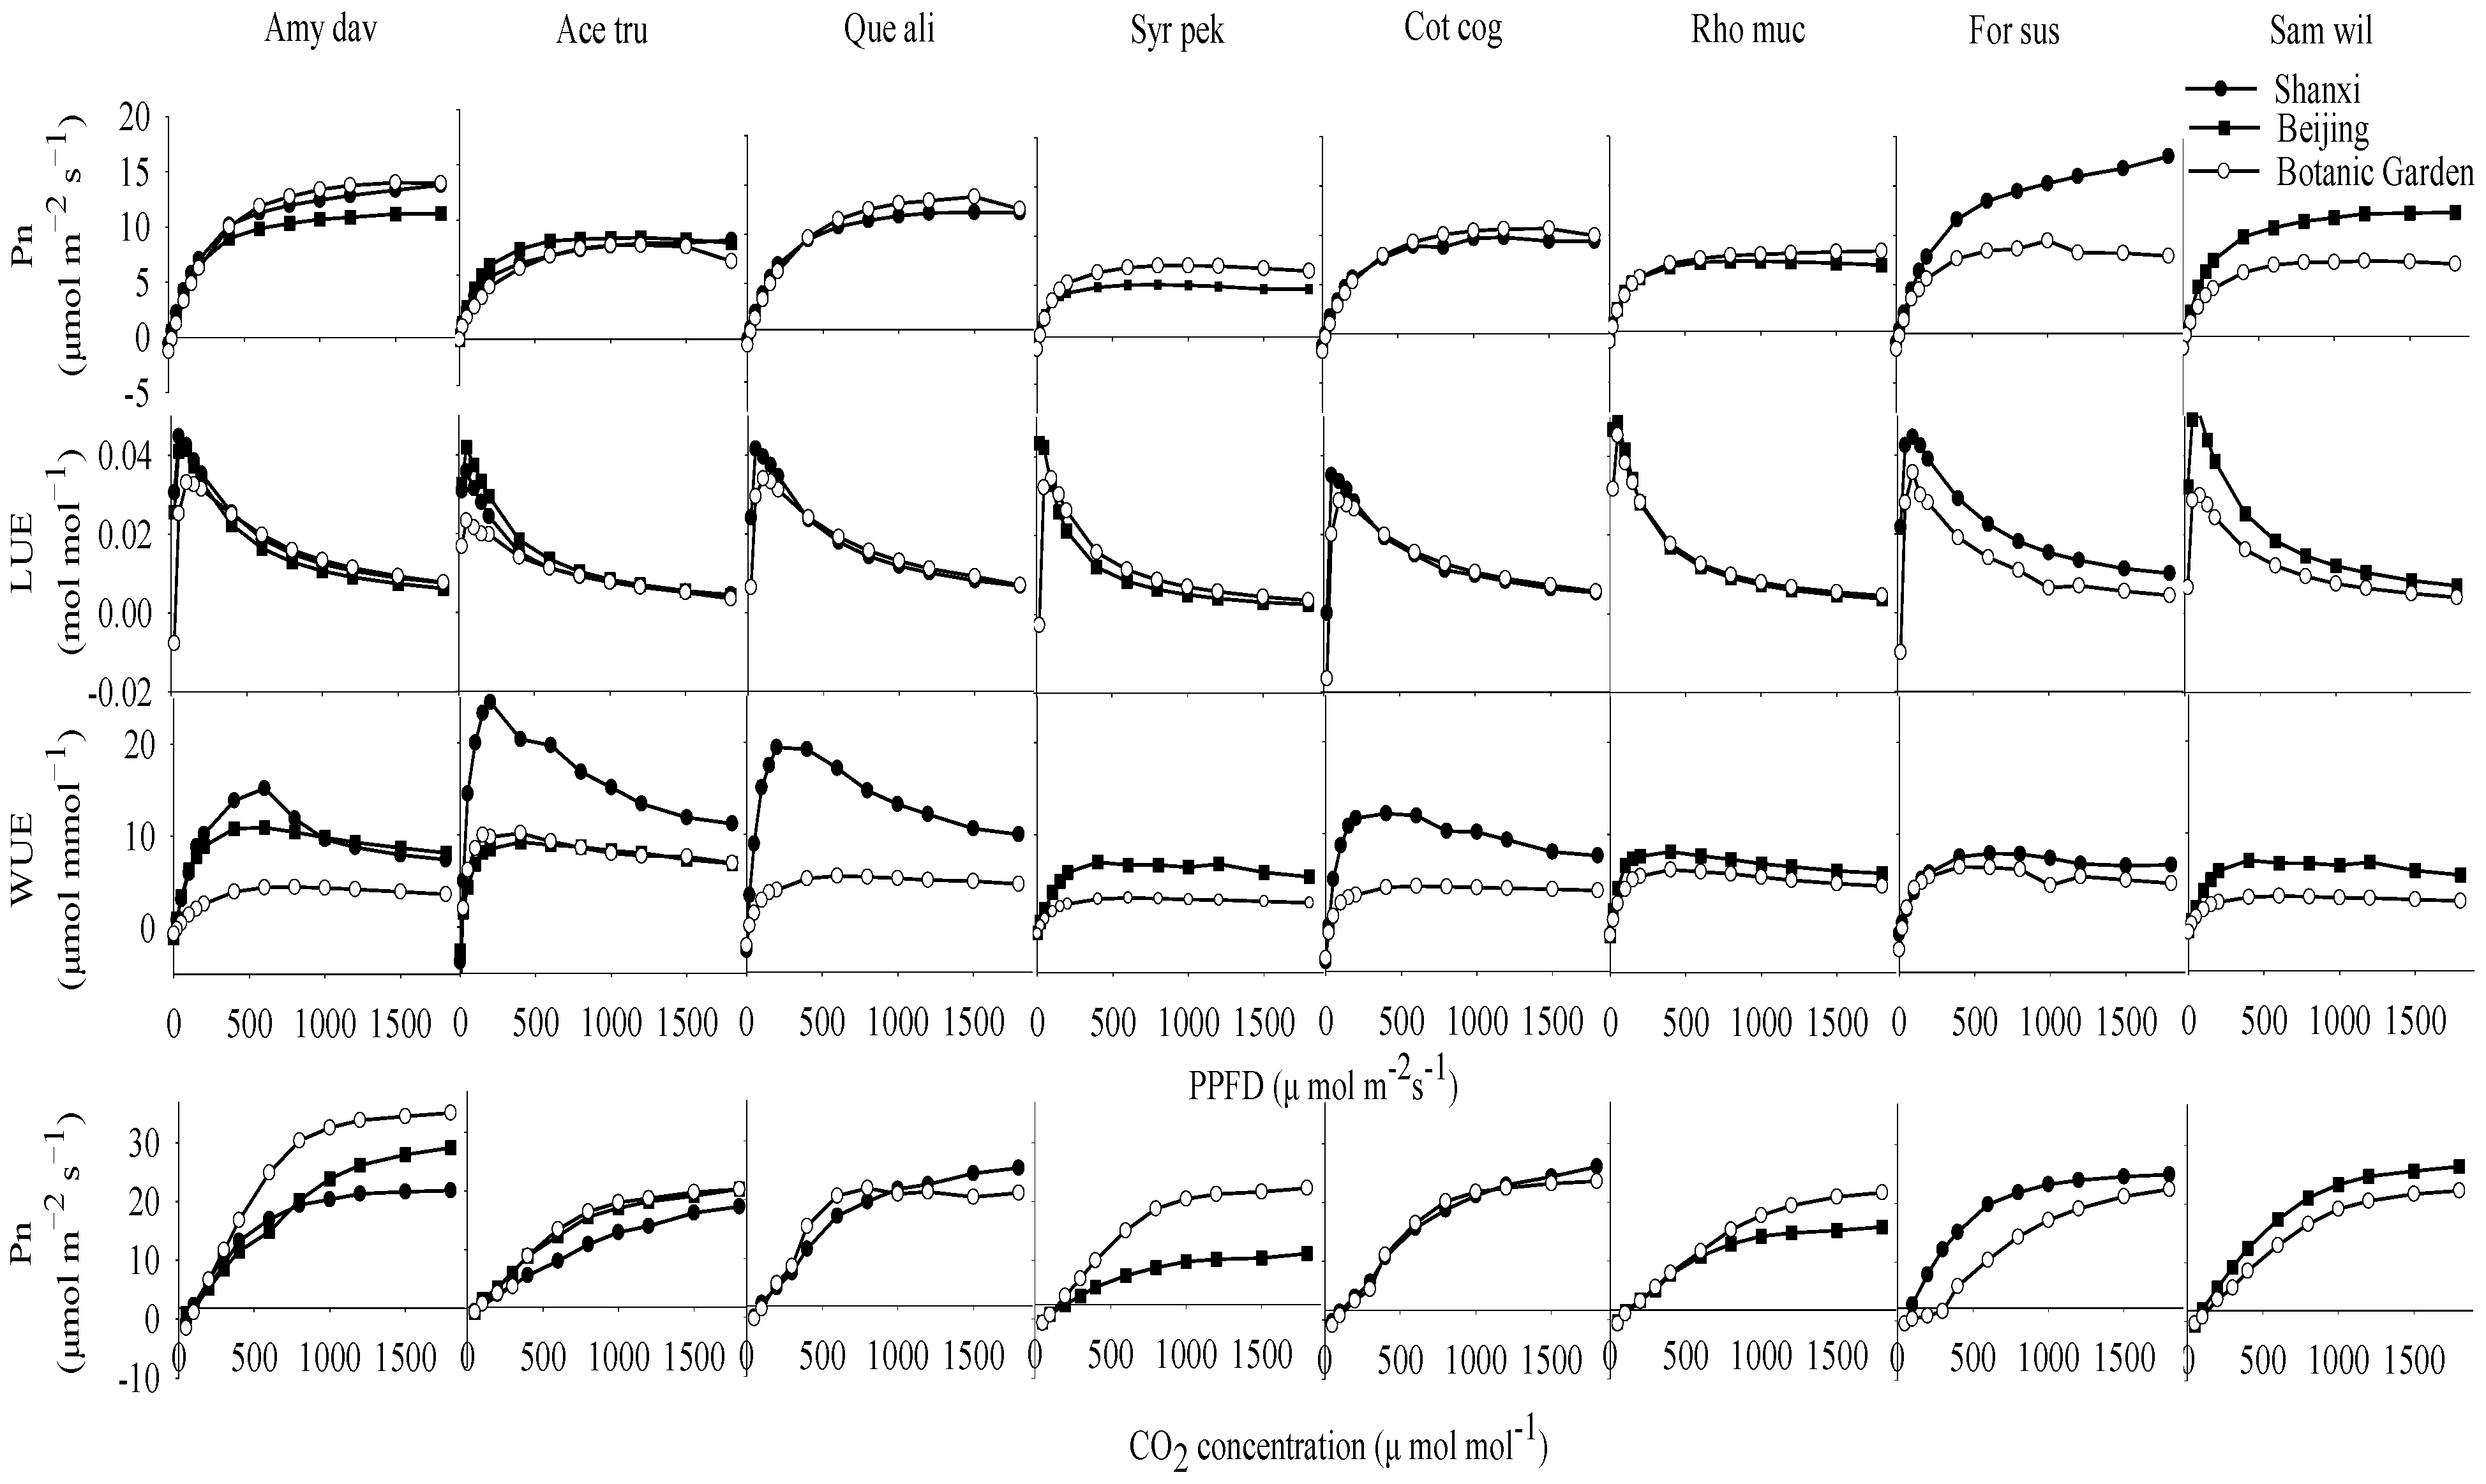
3.2. Light Response, CO2 Response, Light Energy and Water Use Efficiency Curves

The light response curve was lower in the natural sites than in the botanical gardens for A. davidiana, Q. aliena var. Acutiserrata, S. pekinensis, C. coggygria and R. mucronulatum; it was higher in the natural sites than in the botanical gardens for A. truncatum, F. suspensa and S. williamsii; and A. truncatum exhibited photoinhibition under the high light intensity present in botanical gardens.
The CO2 response curve was lower in the natural sites than in the botanical gardens for A. davidiana, A. truncatum, S. pekinensis and R. mucronulatum; it was higher in the natural sites than in the botanical gardens for F. suspensa and S. williamsii; and it was lower in the natural sites than in the botanical gardens for Q. aliena and C. coggygria at low CO2 concentrations and higher at high CO2 concentrations. The LUE curves were higher in the natural sites than in the botanical gardens for F. suspensa and S. williamsii; they were higher in the natural sites than in the botanical gardens for A. davidiana, A. truncatum, Q. aliena var. Acutiserrata, S. pekinensis, C. coggygria and R. mucronulatum under low light intensity and were similar under high light intensity. The WUE curves were higher in the natural sites than in the botanical gardens for all plants (Figure 3).

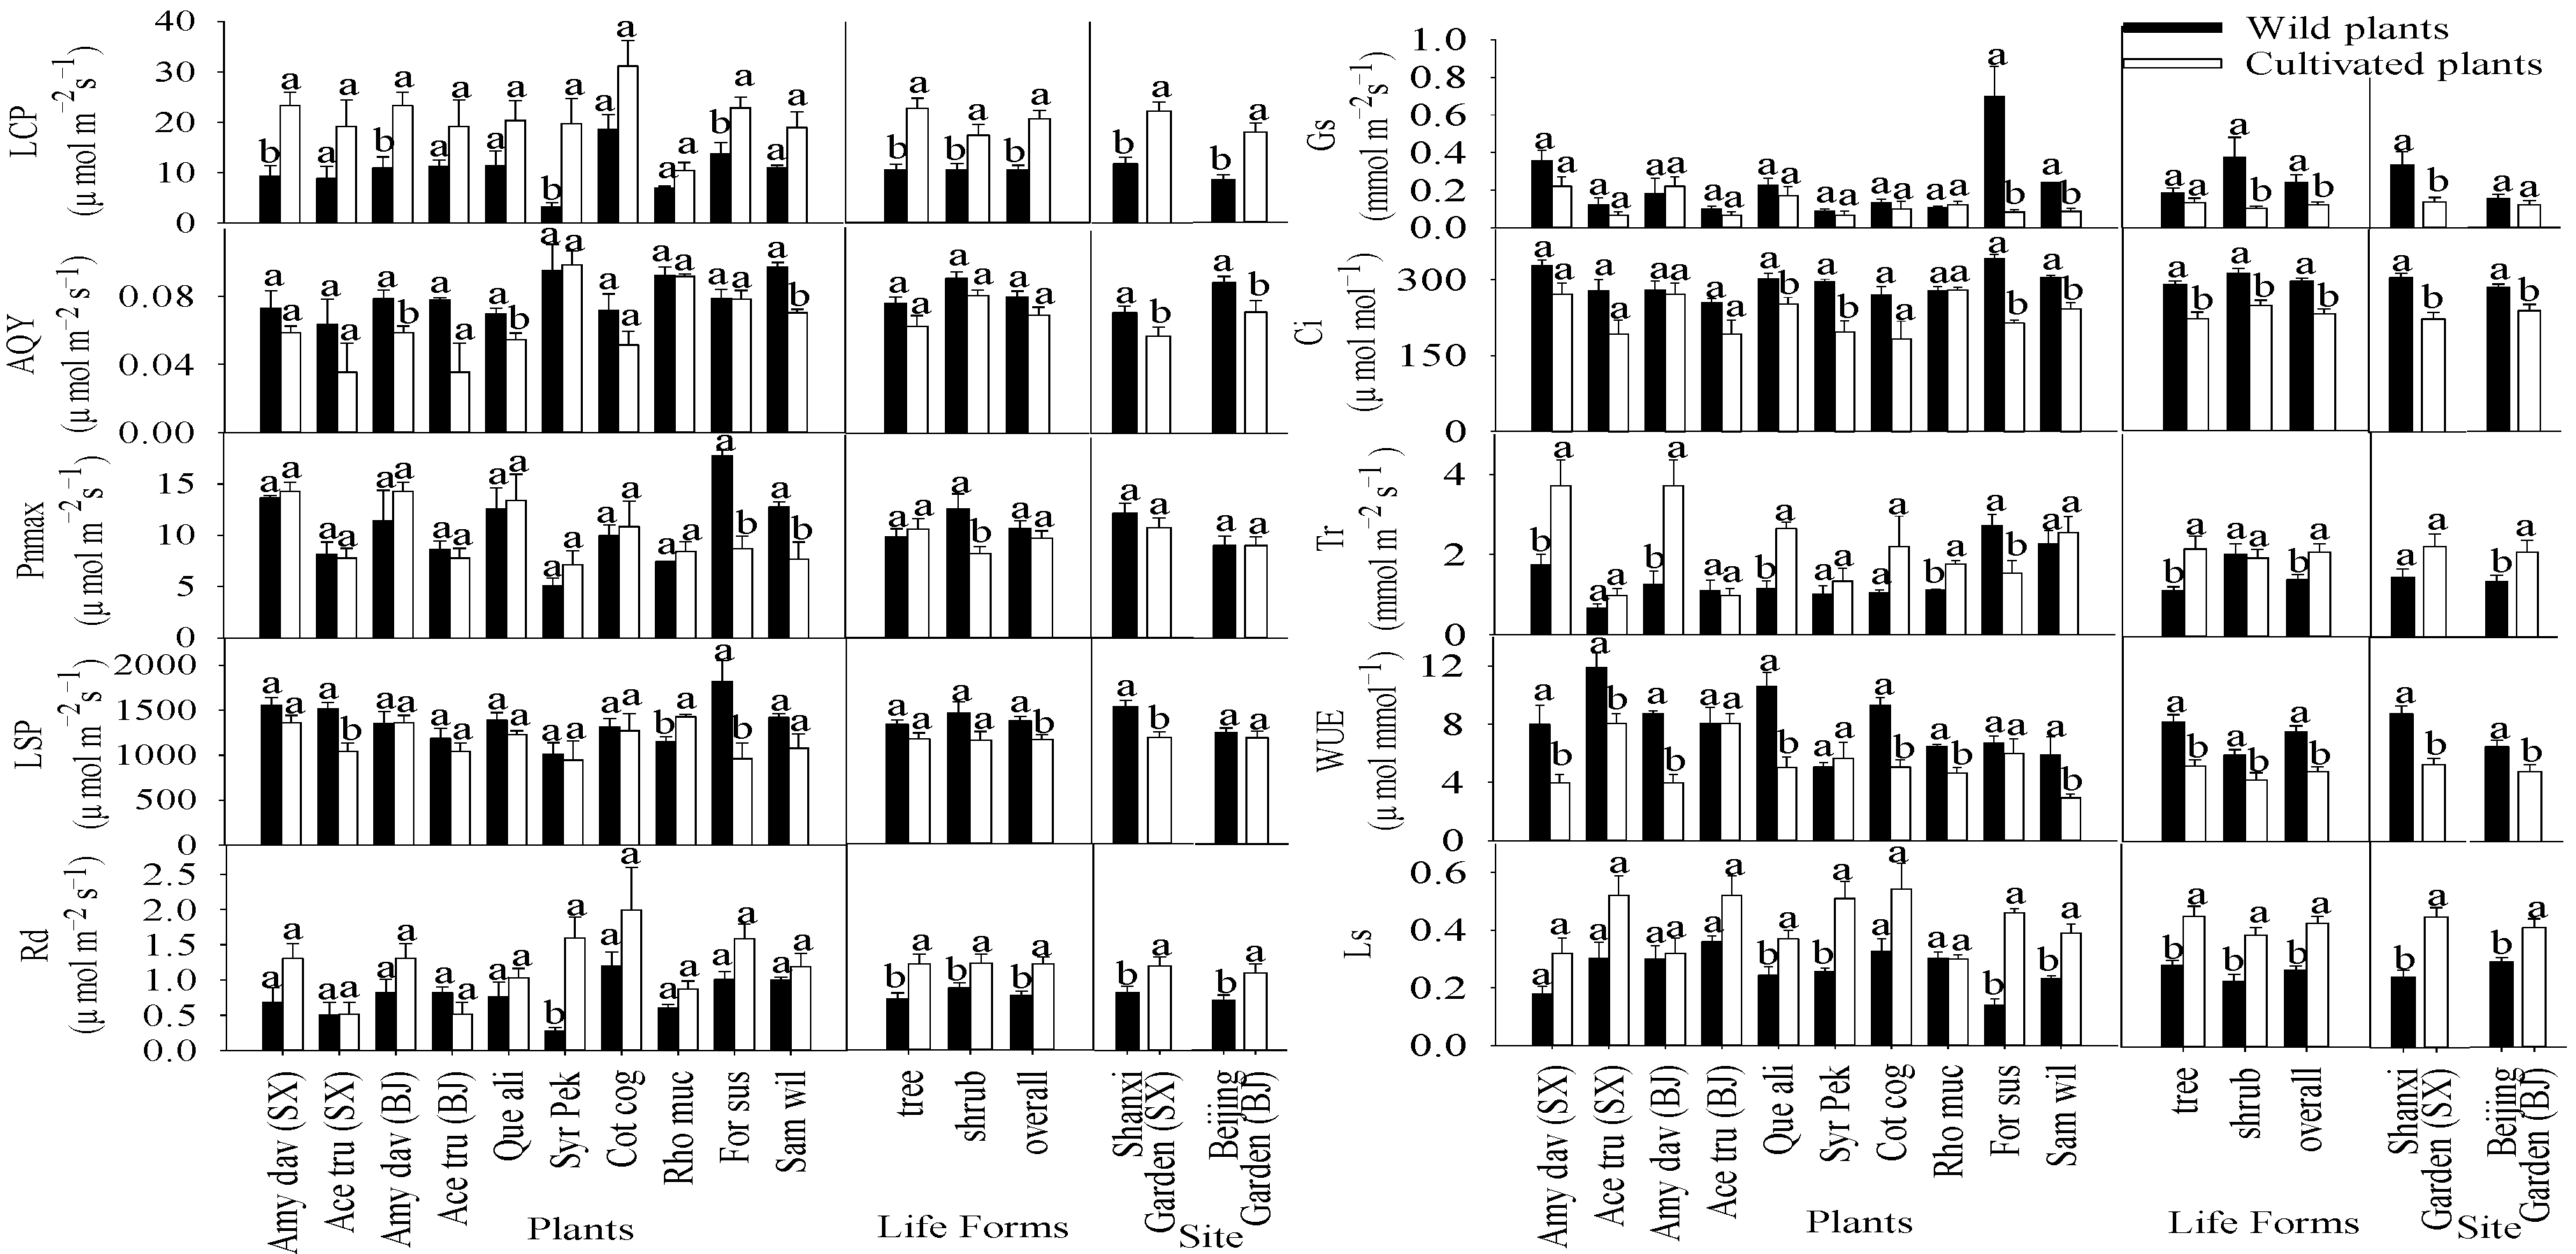
3.3. Photosynthetic Parameters of Plants in Natural Sites and Botanical Gardens

Compared with the plants in the botanical gardens, the changes in Pnmax, LSP, LCP, Il-sat, Iw-sat, WUEmax, Gs, Ci, Tr, WUE and Ls in Beijing were lower than those in Shanxi, and the changes in AQY, Rd, LUEmax and SPAD in Shanxi and Beijing were similar (Figure 2 and Figure 4).
The WUEmax of plants distributed in Shanxi and Beijing was negatively correlated with LUEmax, and their relationship could be represented by the following equation: WUEmax = 17.26 − 181.00 LUEmax (R2 = 0.78, p < 0.001); in contrast, there was no significant linear relationship between WUEmax and LUEmax for these plants cultivated in the botanical gardens (Figure 5).
The Pnmax of the plants distributed in Shanxi and Beijing was positively correlated with SPAD, and the regression equation was Pnmax = −18.47 + 0.61 SPAD (R2 = 0.95, p < 0.001). The Pnmax of the plants cultivated in the botanical gardens was negatively correlated with SPAD, and the regression equation was Pnmax = 15.08 − 0.1 SPAD (R2 = 0.53, p < 0.001) (Figure 5).

4. Discussion

4.1. Ecophysiological Traits of the Same Plants in Different Habitats

Light and water are essential environmental factors for the growth and development of plants, and suitable light and water conditions can promote growth and development [32]. Botanical gardens are under artificial management and cultivation and are different from the natural environment in terms of light, moisture, temperature, CO2, etc. [12,13]. Plants in gardens are generally widely spaced and exposed to high lighting conditions, combined with irrigation and fertilization practices common in gardening, as well as human-mediated alleviation of environmental stresses, therefore, plants grown in gardens achieve much higher rates of photosynthesis than non-cultivated native plants grown under a wide range of biological and environmental stresses in natural environments [12,13].
In our study, the light response curves of the cultivated A. davidiana were higher than those of the wild plants, while the light response curves of the cultivated A. truncatum were lower than those of the wild plants, indicating that different plants had different responses to protected environments. Furthermore, plants in urban ecosystems are exposed to higher temperatures and CO2 levels than plants in rural areas [12,13]. In our study, the CO2 response curves of the cultivated plants of A. davidiana and A. truncatum were higher than those of the wild plants, indicating that the cultivated plants can better adapt to higher concentrations of CO2.
Light use efficiency and water use efficiency are essential traits of adaptability to climate change [33,34]. Water use efficiency is an important indicator that couples photosynthesis and water physiological processes of plant leaves and represents ability of plants to fix CO2 with same degree of water consumption. Plants may adapt to drought conditions by increasing WUE [35]. Therefore, integrative traits, such as WUE and LUE, changed more significantly than single traits, such as LCP, LSP, Tr, and Gs. In our study, both wild plants and cultivated plants reached their maximum value for LUE under low light intensities, indicating that low-light environmental conditions were beneficial for increasing LUE. The LUE curves of the cultivated plants of A. davidiana and A. truncatum were lower than those of the wild plants. This may be because most of the wild plants were growing in multilayered structural communities, where plants had been exposed to insufficient light for a long time and plants needed to make full use of any available light to meet their needs. However, planting density of plants in botanical gardens is sparse, and plants received higher light intensities, which led to a decline in the LUE of the cultivated plants. The WUE curves of the cultivated A. davidiana were lower than those of the wild plants, which may be due to the long-term watering and irrigation conditions in botanical gardens, and the water-use capacity of the cultivated A. davidiana was thus reduced.

4.2. Are the Ranges of Changes in the Ecophysiological Traits of Plants after Ex Situ Conservation in Different Regions Consistent?

Different geographical environments have specific impacts on the ecophysiological traits of plants [36]. In our study, most ecophysiological traits were affected by habitat. After ex situ conservation, the ranges of changes in AQY, Rd and LUEmax of wild plants in Beijing were basically the same as those in Shanxi, indicating that the main reason for the changes in the above parameters was the cultivation of the plants in botanical gardens. After ex situ conservation, the changes in the other photosynthetic parameters of wild plants in Beijing were smaller than those in Shanxi. This may be because the cultivated plants and the wild plants in Beijing had similar geographical environments in terms of latitude and longitude, and the cultivated plants and the wild plants in Shanxi were different in terms of latitude, longitude and altitude.

4.3. Response of Ecophysiological Traits to Ex Situ Conservation

The environment of the plants changed during ex situ conservation, and the plants may have changed their ecophysiological traits to adapt to new environments [17]. In general, the high values of these physiological traits represent acquisitive strategies (high productivity) for plants, while low values represent conservative strategies (low productivity) [17]. In our study, the Pn of most of the plants cultivated in the botanical gardens increased, indicating that the conservation of the plants in a good-inducing environment was conducive to the enhancement of photosynthetic capacity, but their light and water use efficiencies decreased. In general, the LCP, Rd, Iw-sat, Il-sat, Ls and Tr of the plants increased after conservation, indicating that the cultivated plants developed the ability to use stronger light intensities, and the light intensity required to achieve LCP, LUEmax and WUEmax were greater than that of the wild plants. The cultivated plants were more likely to be restricted by respiration, transpiration and stomatal factors and the increased consumption of photosynthetic organic matter. The AQY, Pnmax, LSP, WUEmax, LUEmax, Gs, Ci and WUE of the plants decreased after conservation, indicating that the ability of plants to use weaker light intensities decreased. The lower LCP and Rd of the wild plants indicate that they can make better use of the weaker light intensities in their environment, leading to a higher LUE in the natural environment.
The LWC and φ of plants have a certain correlation with drought resistance; under drought conditions, the LWC and φ values are relatively low, and they gradually decrease with increasing water stress [37,38]. However, our results indicate that, although the cultivated plants in the botanical garden were under irrigation conditions, they had lower LWC and φ values than wild plants. Previous studies have shown that temperature and light intensity affect leaf moisture, and plants may suffer from excessive light energy and a risk of dehydration under high temperatures and strong light intensities [39]. The excessive light intensity present in the botanical gardens accelerates the Tr of plant leaves, which may be the main reason for the decrease in the LWC and φ values, indicating that proper understory structure and leaf shading are beneficial for the preservation of leaf water.
Previous studies have shown that trees are generally more responsive than other functional types to climate change and are more responsive to elevated CO2 levels, showing a higher Pnmax [40]. In our study, except for Pnmax and Tr, the traits of the trees and shrubs changed in the same way. The Pnmax and Tr of the wild trees were lower than those of the cultivated plants, while those of the wild shrubs were higher than those of the cultivated plants. This may be because trees and shrubs of the cultivated plants grow in an environment with sufficient light, while the wild plants are usually sheltered from each other in complex forest communities. Higher light intensities are beneficial for photosynthesis and increase the transpiration rate of trees at the top of the community, but they can cause the photoinhibition of shrubs in the understory of forests and lead to a decrease in Pnmax and Tr.

4.4. Implications for Fitness of Ex Situ Plants Conservation

Managing traits will be the main challenge for maintaining valuable ex situ living collections, and this requires precise guidelines and clear recommendations [14]. The ecophysiological traits of plants may change as they adapt to new environments [17]. After long-term conservation, this may lead to significant changes in plants, and the plants may not be suitable for natural environments and therefore cannot be returned to natural environments, especially if the plants evolve into new individuals, reducing the fitness of conservation [41,42]. In this research, most of the ecophysiological traits of wild plants changed during ex situ conservation, which led to differences between the wild plants and the cultivated plants. Although ex situ conservation in botanical gardens could protect wild plants, the cultivated plants reduced their own performance, reduced light and water use efficiency, and increased respiratory consumption, making them less fit to survive in natural environments.
Therefore, ex situ conservation should consider the growth environment of wild plants, such as the rainfall and multilayer structure conditions, to minimize the changes in the ecophysiological traits of plants due to conservation. During ex situ conservation, attention should be given to the growth rate of plants and the use of external environments [43], and overprotective measures should be reduced so that plants can grow better after they return to their natural environment.
Although ecophysiological traits were the dominant force in this ex situ conservation assessment, more studies are needed to obtain a more comprehensive understanding. It is necessary to combine our findings with other traits of plants, such as the reproductive behavior and genetics of ex situ conservation collections [41,44]. Such analysis can recognize the potential threats to cultivated plants and help to optimize their ex situ conservation, ensuring that the most suitable plants are maintained for reintroduction into the wild. This also provides theoretical references for IUCN’s work in saving endangered plants.

5. Conclusions

Wild plants change their ecophysiological traits to adapt to the conservation environment of botanical gardens, leading to differences between wild plants and cultivated plants. After conservation in a botanical garden, the higher respiration rate and stomatal restriction of the plants, as well as the lower LWC, φ, water and light utilization efficiency and photosynthetic accumulation, are not conducive to plant photosynthesis. After ex situ conservation, the AQY, Rd and LUEmax of plants changed in similar ranges, and the ranges of changes in Pnmax, LSP, LCP, Il-sat, Iw-sat, WUEmax, Gs, Ci, Tr, Ls, WUE, φ, and LWC were slightly different, but the trends of the trait changes after conservation were the same. The results can help us better understand the ecological adaptation strategies of plants after long-term conservation in a botanical garden and provide a theoretical basis for improving the management level of artificial conservation in botanical gardens.

Supplementary Materials

The following supporting information can be downloaded at: https://www.mdpi.com/article/10.3390/su14095199/s1, Table S1: Locations for eight wild species and conservation species.

Author Contributions

Q.S.: methodology, investigation, formal analysis, visualization and writing—original draft. L.L., J.Z., S.Y., X.L. and J.G.: investigation. Y.Z.: methodology, conceptualization, data curation, formal analysis, funding acquisition, methodology, validation, writing—review & editing. All authors have read and agreed to the published version of the manuscript.

Funding

This research was funded by National Key R & D Program of China [2018YFC0506903].

Institutional Review Board Statement

Not applicable.

Informed Consent Statement

Not applicable.

Acknowledgments

This work was supported by National Key R & D Program of China (2018YFC0506903). We thank two anonymous reviewers and the editor for their effort to review this manuscript.

Conflicts of Interest

The authors declare no conflict of interest.

References

  1. Rivers, M.; Shaw, K.; Beech, E.; Jones, M. Conserving the World’s Most Threatened Trees: A Global Survey of Ex Situ Collections; BGCI: Richmond, UK, 2015; Available online: https://globaltrees.org/wp-content/uploads/2015/10/webLR.pdf (accessed on 10 October 2021).
  2. Lundholm, J.T. Green roof plant species diversity improves ecosystem multifunctionality. J. Appl. Ecol. 2015, 52, 726–734. [Google Scholar] [CrossRef]
  3. Li, D.Z.; Pritchard, H.W. The science and economics of ex situ plant conservation. Trends Plant Sci. 2009, 14, 614–621. [Google Scholar] [CrossRef] [PubMed]
  4. Mounce, R.; Smith, P.; Brockington, S. Ex situ conservation of plant diversity in the world’s botanic gardens. Nat. Plants 2017, 3, 795–802. [Google Scholar] [CrossRef] [PubMed]
  5. Charles, D. The threat to the world’s plants. Science 2008, 320, 1000. [Google Scholar] [CrossRef] [PubMed]
  6. Werden, L.K.; Sugii, N.C.; Weisenberger, L.; Keir, M.J.; Koob, G.; Zahawi, R.A. Ex situ conservation of threatened plant species in island biodiversity hotspots: A case study from Hawai’i. Biol. Conserv. 2020, 243, 108435. [Google Scholar] [CrossRef]
  7. Lambertini, M.; Leape, J.; Marton-Lefevre, J.; Mitter-Meier, R.A.; Rose, M.; Robinson, J.; Stuart, S.; Waldman, B.; Genovesi, P. Invasives: A Major Conservation Threat. Science 2011, 333, 404–405. [Google Scholar] [CrossRef]
  8. Cohen, J.I.; Williams, J.T.; Plucknett, D.L.; Shands, H. Ex situ conservation of plant genetic resources: Global development and environmental concerns. Science 1991, 253, 866–872. [Google Scholar] [CrossRef]
  9. McCarthy, J.K.; Wiser, S.K.; Bellingham, P.J.; Beresford, R.M.; Campbell, R.E.; Turner, R.; Richardson, S.J. Using spatial models to identify refugia and guide restoration in response to an invasive plant pathogen. J. Appl. Ecol. 2021, 58, 192–201. [Google Scholar] [CrossRef]
  10. Hultine, K.R.; Majure, L.C.; Nixon, V.S.; Arias, S.; Búrquez, A.; Goettsch, B.; Puente-Martinez, R.; Zavala-Hurtado, J. The role of botanical gardens in the conservation of cactaceae. Biosience 2016, 66, 1057–1065. [Google Scholar] [CrossRef] [Green Version]
  11. Primack, R.B.; Miller-Rushing, A.J. The role of botanical gardens in climate change research. New Phytol. 2009, 182, 303–313. [Google Scholar] [CrossRef]
  12. Egerer, M.H.; Lin, B.; Threlfall, C.G.; Kendal, D. Temperature variability influences urban garden plant richness and gardener water use behavior, but not planting decisions. Sci. Total Environ. 2018, 646, 111–120. [Google Scholar] [CrossRef] [PubMed]
  13. Niinemets, U.; Penuelas, J. Gardening and urban landscaping: Significant players in global change. Trends Plant Sci. 2008, 13, 60–65. [Google Scholar] [CrossRef] [PubMed]
  14. Ensslin, A.; Tschope, O.; Burkart, M.; Joshi, J. Fitness decline and adaptation to novel environments in ex situ plant collections: Current knowledge and future perspectives. Biol. Conserv. 2015, 192, 394–401. [Google Scholar] [CrossRef]
  15. Lou, Y.J.; Kapfer, J.; Smith, P.; Liu, Y.; Jiang, M.; Lu, X.G.; Ashcroft, M. Abundance changes of marsh plant species over 40 years are better explained by niche position water level than functional traits. Ecol. Indic. 2020, 117, 106639. [Google Scholar] [CrossRef]
  16. Malecore, E.M.; Dawson, W.; Kempel, A.; Muller, G.; van Kleunen, M. Nonlinear effects of phylogenetic distance on early-stage establishment of experimentally introduced plants in grassland communities. J. Ecol. 2019, 107, 781–793. [Google Scholar] [CrossRef] [Green Version]
  17. Han, T.T.; Ren, H.; Wang, J.; Lu, H.F.; Song, G.M.; Chazdon, R.L. Variations of leaf eco-physiological traits in relation to environmental factors during forest succession. Ecol. Indic. 2020, 117, 106511. [Google Scholar] [CrossRef]
  18. Onoda, Y.; Hirose, T.; Hikosaka, K. Does leaf photosynthesis adapt to CO2-enriched environments? An experiment on plants originating from three natural CO2 springs. New Phytol. 2009, 182, 698–709. [Google Scholar] [CrossRef]
  19. Niinemets, U.; Keenan, T.F.; Hallik, L. A worldwide analysis of within-canopy variations in leaf structural, chemical and physiological traits across plant functional types. New Phytol. 2015, 205, 973–993. [Google Scholar] [CrossRef] [Green Version]
  20. Tsialtas, J.T.; Handley, L.L.; Kassioumi, M.T.; Veresoglou, D.S.; Gagianas, A.A. Interspecific variation in potential water-use efficiency and its relation to plant species abundance in a water-limited grassland. Funct. Ecol. 2001, 15, 605–614. [Google Scholar] [CrossRef]
  21. Cai, Y.D.; Liu, D.M.; Yao, Y.B.; Li, J.G.; Qiu, Y.K. Geological controls on prediction of coalbed methane of No. 3 coal seam in Southern Qinshui Basin, North China. Int. J. Coal Geol. 2011, 88, 101–112. [Google Scholar] [CrossRef]
  22. Lu, X. The annual cycle of molt in the Cape hare Lepus capensis in northern China: Pattern, timing and duration. Acta Theri. 2003, 48, 373–384. [Google Scholar] [CrossRef]
  23. Guo, L.D.; Huang, G.R.; Wang, Y. Seasonal and tissue age influences on endophytic fungi of Pinus tabulaeformis (Pinaceae) in the Dongling Mountains, Beijing. J. Integr. Plant Biol. 2008, 50, 997–1003. [Google Scholar] [CrossRef] [PubMed]
  24. Song, X.Y.; Bera, S.; Yao, Y.F.; David, K.F.; Li, C.S. Tree barks as a natural trap for airborne spores and pollen grains from China. Chin. Sci. Bull. 2014, 59, 2331–2339. [Google Scholar] [CrossRef]
  25. Lobo, F.D.; de Barro, M.P.; Dalmagro, H.J.; Dalmolin, A.C.; Pereira, W.; de Souza, C.; Vourlitis, G.; Ortiz, C. Fitting net photosynthetic light-response curves with Microsoft Excel a critical look at the models. Photosynthetic 2013, 51, 445–456. [Google Scholar] [CrossRef]
  26. Tarin, T.; Nolan, R.H.; Medlyn, B.E.; Cleverly, J.; Eamus, D. Water-use efficiency in a semi-arid woodland with high rainfall variability. Glob. Change Biol. 2019, 26, 496–508. [Google Scholar] [CrossRef]
  27. Garnier, E.; Laurent, G. Leaf anatomy, specific mass and water content of common annual and perennial grasses. New Phytol. 1994, 128, 725–736. [Google Scholar] [CrossRef]
  28. Freschet, G.H.; Swart, E.M.; Cornelissen, J.H.C. Integrated plant phenotypic responses to contrasting above-and below-ground resources: Key roles of specific leaf area and root mass fraction. New Phytol. 2015, 206, 1247–1260. [Google Scholar] [CrossRef]
  29. Ye, Z.P.; Suggett, D.J.; Robakowski, P.; Kang, H.J. A mechanistic model for the photosynthesis-light response based on the photosynthetic electron transport of photosystem II in C3 and C4 species. New Phytol. 2013, 199, 110–120. [Google Scholar] [CrossRef]
  30. Still, C.J.; Randerson, J.T.; Fung, I.L. Large-scale plant light-use efficiency inferred from the seasonal cycle of atmospheric CO(2). Glob. Change Biol. 2004, 10, 1240–1252. [Google Scholar] [CrossRef] [Green Version]
  31. Loi, F.; Cordova, L.A.; Zhang, R.; Pajarinen, J.; Lin, T.H.; Goodman, S.B.; Yao, Z.Y. The effects of immunomodulation by macrophage subsets on osteogenesis in vitro. Stem Cell Res. Ther. 2016, 7, 15. [Google Scholar] [CrossRef] [Green Version]
  32. Brown, C.E.; Mickelbart, M.V.; Jacobs, D.F. Leaf physiology and biomass allocation of backcross hybrid American chestnut (Castanea dentata) seedlings in response to light and water availability. Tree Physiol. 2014, 34, 1362–1375. [Google Scholar] [CrossRef] [PubMed]
  33. Sim, D.A.; Rahman, A.F.; Cordova, V.D.; Baldocchi, D.D.; Flanagan, B.; Goldstein, A.; Hollinger, D.; Mission, M.; Monson, R.; Schmid, H.; et al. Midday values of gross CO2 flux and light use efficiency during satellite overpasses can be used to directly estimate eight-day mean flux. Agric. For. Meteorol. 2005, 131, 1–12. [Google Scholar] [CrossRef]
  34. Xu, H.; Xiao, J.F.; Zhang, Z.Q.; Ollinger, S.V.; Hollinger, D.Y.; Pan, Y.D.; Wan, J.M. Canopy photosynthetic capacity drives contrasting age dynamics of resource use efficiencies between mature temperate evergreen and deciduous forests. Glob. Change Biol. 2020, 26, 6156–6167. [Google Scholar] [CrossRef] [PubMed]
  35. Peters, W.; van der Velde, I.R.; van Schaik, E.; Miller, J.B.; Ciais, P.; Duarte, H.; van der Laan-Luijkx, I.; van der Molen, M.; Scholze, M.; Schaeferet, K.; et al. Increased water-use efficiency and reduced CO2 uptake by plants during droughts at a continental scale. Nat. Geosci. 2018, 11, 774. [Google Scholar] [CrossRef]
  36. Takanashi, S.; Kosugi, Y.; Matsuo, N.; Tani, M.; Ohte, N. Patchy stomatal behavior in broad-leaved trees grown in different habitats. Tree Physiol. 2006, 26, 1565–1578. [Google Scholar] [CrossRef] [Green Version]
  37. Badr, A.; Bruggemann, W. Comparative analysis of drought stress response of maize genotypes using chlorophyll fluorescence measurements and leaf relative water content. Photosynthetica 2020, 58, 638–645. [Google Scholar] [CrossRef] [Green Version]
  38. Ding, Y.L.; Nie, Y.P.; Chen, H.S.; Wang, K.L.; Querejeta, J.I. Water uptake depth is coordinated with leaf water potential, water-use efficiency and drought vulnerability in karst vegetation. New Phytol. 2020, 229, 1339–1353. [Google Scholar] [CrossRef]
  39. Li, Y.; Song, X.; Li, S.; Salter, W.T.; Barbour, M.M. The role of leaf water potential in the temperature response of mesophyll conductance. New Phytol. 2020, 225, 1193–1205. [Google Scholar] [CrossRef]
  40. Ainsworth, E.A.; Long, S.P. What have we learned from 15 years of free-air CO2 enrichment (FACE)? A meta-analytic review of the responses of photosynthesis, canopy properties and plant production to rising CO2. New Phytol. 2005, 165, 351–371. [Google Scholar] [CrossRef]
  41. Rucinska, A.; Puchalski, J. Comparative molecular studies on the genetic diversity of an ex situ garden collection and its source population of the critically endangered polish endemic plant Cochlearia polonica E. Frohlich. Biodivers. Conserv. 2011, 20, 401–413. [Google Scholar] [CrossRef]
  42. Griffith, M.P.; Calonje, M.; Meerow, A.W.; Tut, F.; Kramer, A.T.; Hird, A.; Magellan, T.M.; Husby, C.E. Can botanic garden cycad collection capture the genetic diversity in a wild population? Int. J. Plant Sci. 2015, 176, 1–10. [Google Scholar] [CrossRef] [Green Version]
  43. Zanetti, M.; Dayrell, R.L.C.; Wardil, M.V.; Damasceno, A.; Fernandes, T.; Castilho, A.; Santos, F.M.G.; Silveira, F.A.O. Seed functional traits provide support for ecological restoration and ex situ conservation in the threatened amazon ironstone outcrop flora. Front. Plant Sci. 2020, 11, 599496. [Google Scholar] [CrossRef] [PubMed]
  44. Gerstenberg, T.; Hofmann, M. Perception and preference of trees: A psychological contribution to tree species selection in urban areas. Urban For. Urban Green 2016, 15, 103–111. [Google Scholar] [CrossRef]
Figure 1. The location of the study sites in Shanxi and Beijing of China. Abbreviations: Dongling Mountain (DM), Botanical Garden (BG), Shuiquan Village (SV), Xiachuan Village (XV), Haojiashan (HJS) and Duanshi Forest Farm (DFF). (a) China, (b) Beijing, (c) Shanxi.
Sustainability 14 05199 g001
Figure 2. Relative chlorophyll content (SPAD), leaf water content (LWC), leaf water potential (φ), maximum light energy use efficiency (LUEmax), maximum water use efficiency (WUEmax) and their corresponding saturated light intensity (Il-sat, Iw-sat) of wild and cultivated plants (Mean [SE], n = 3), and plants in life forms (tree: wild plants n = 18, cultivated plants n = 12; shrub: wild plants n = 12, cultivated plants n = 12; overall: wild plants n = 30, cultivated plants n = 24) and in sites (each bar with 5 species, three replicates for each species. n = 15). Bars with different lowercase letters are significantly different between wild and cultivated plants (p < 0.05). Amy dav (SX), Amy dav (BJ), Ace tru (SX) and Ace tru (BJ) represent Amygdalus davidiana in Shanxi and Beijing, Acer truncatum in Shanxi and Beijing, respectively. Plant abbreviations are shown in Table S1.
Sustainability 14 05199 g002
Figure 3. Light energy use efficiency (LUE), water use efficiency (WUE), light response and CO2 response curves (Mean [SE], n = 3) of wild and cultivated plants. Plant abbreviations are shown in Table S1.
Sustainability 14 05199 g003
Figure 4. The photosynthetic parameters of wild and cultivated plants, and plants in life forms and in sites. Bars with different lowercase letters are significantly different between wild and cultivated plants (p < 0.05). Other description is same as Figure 2.
Sustainability 14 05199 g004
Figure 5. Relationship between net photosynthetic rate at light saturation (Pnmax) and SPAD value, LUEmax and WUEmax. Abbreviations: wild plants regression line (WSRL), cultivated plants regression line (CSRL).
Sustainability 14 05199 g005
Table 1. Results of a one-way ANOVA with plants (Amygdalus davidiana and Acer truncatum) and sites (Shanxi, Beijing and botanical garden).
ParametersEffect
SitesPlants
AQY3.74 ns0.27 ns
Rd7.56 **0.15 ns
Pnmax4.80 *5.40 *
LSP3.91 *0.75 ns
LCP22.77 ***0.00 ns
Il-sat51.36 ***0.45 ns
LUEmax2.33 ns0.33 ns
Iw-sat11.57 **2.93 ns
WUEmax19.93 ***1.85 ns
φ27.21 ***11.59 **
LWC11.77 **1.87 ns
SPAD0.23 ns0.48 ns
Pn4.79 *5.34 *
Gs2.07 ns6.40 *
Ci2.40 ns2.84 ns
Tr23.09 ***1.40 ns
Ls2.38 ns2.85 ns
WUE25.01 ***2.28 ns
df21
F-values are shown. ***, p < 0.001; **, p < 0.01; *, p < 0.05; ns, p ≥ 0.05. Abbreviations: apparent quantum efficiency (AQY), dark respiration rate (Rd), net photosynthetic rate at light saturation (Pnmax), light saturation point (LSP), light compensation point (LCP), maximum light energy use efficiency (LUEmax), saturated light intensity under LUEmax (Il-sat), maximum water use efficiency (WUEmax), saturated light intensity under WUEmax (Iw-sat), leaf water potential (φ), leaf water content (LWC), relative chlorophyll content (SPAD), photosynthetic rate (Pn), stomatal conductance (Gs), intercellular CO2 concentration (Ci), transpiration rate (Tr), stomatal restriction (Ls) and water use efficiency (WUE).
Table 2. Results of a one-way ANOVA with plants and sites.
ParametersEffect
SitesPlants
BSBBBSBB
AQY0.756 ns2.19 ns2.94 ns1.32 ns
Rd7.61 *22.12 ***4.07 *2.66 ns
Pnmax2.70 ns0.65 ns1.47 ns8.16 **
LSP8.08 *0.18 ns0.24 ns3.70 ns
LCP13.75 **20.96 ***3.82 ns3.14 ns
Il-sat12.76 **9.71 **4.04 *2.53 ns
LUEmax7.11 *11.27 **2.78 ns0.87 ns
Iw-sat2.94 ns3.28 ns0.20 ns8.36 **
WUEmax39.62 ***8.34 *6.07 *3.20 ns
φ1.00 ns76.12 ***6.29 *5.07 *
LWC44.69 ***139.20 ***124.26 ***91.05 ***
SPAD0.23 ns3.11 ns5.48*2.34 ns
Pn2.81 ns0.66 ns1.89 ns8.11 **
Gs15.34 **17.67 **7.33 **16.30 ***
Ci36.12 ***33.20 ***5.50 *4.70 *
Tr2.69 ns3.67 ns0.99 ns11.81 *
Ls35.71 ***31.27 ***5.51 *4.24 *
WUE35.92 ***5.75 *2.13 ns1.50 ns
df1122
F-values are shown. ***, p < 0.001; **, p < 0.01; *, p < 0.05; ns, p ≥ 0.05. Plants are shown in Table S1. Comparison between Shanxi and botanical garden (BS), and between Beijing and botanical garden (BB). Other abbreviations are the same with Table 1.
Publisher’s Note: MDPI stays neutral with regard to jurisdictional claims in published maps and institutional affiliations.

