
Agroforestry Suitability for Planning Site-Specific Interventions Using Machine Learning Approaches

 ,
,  ,
,  ,
,
Abstract
1. Introduction
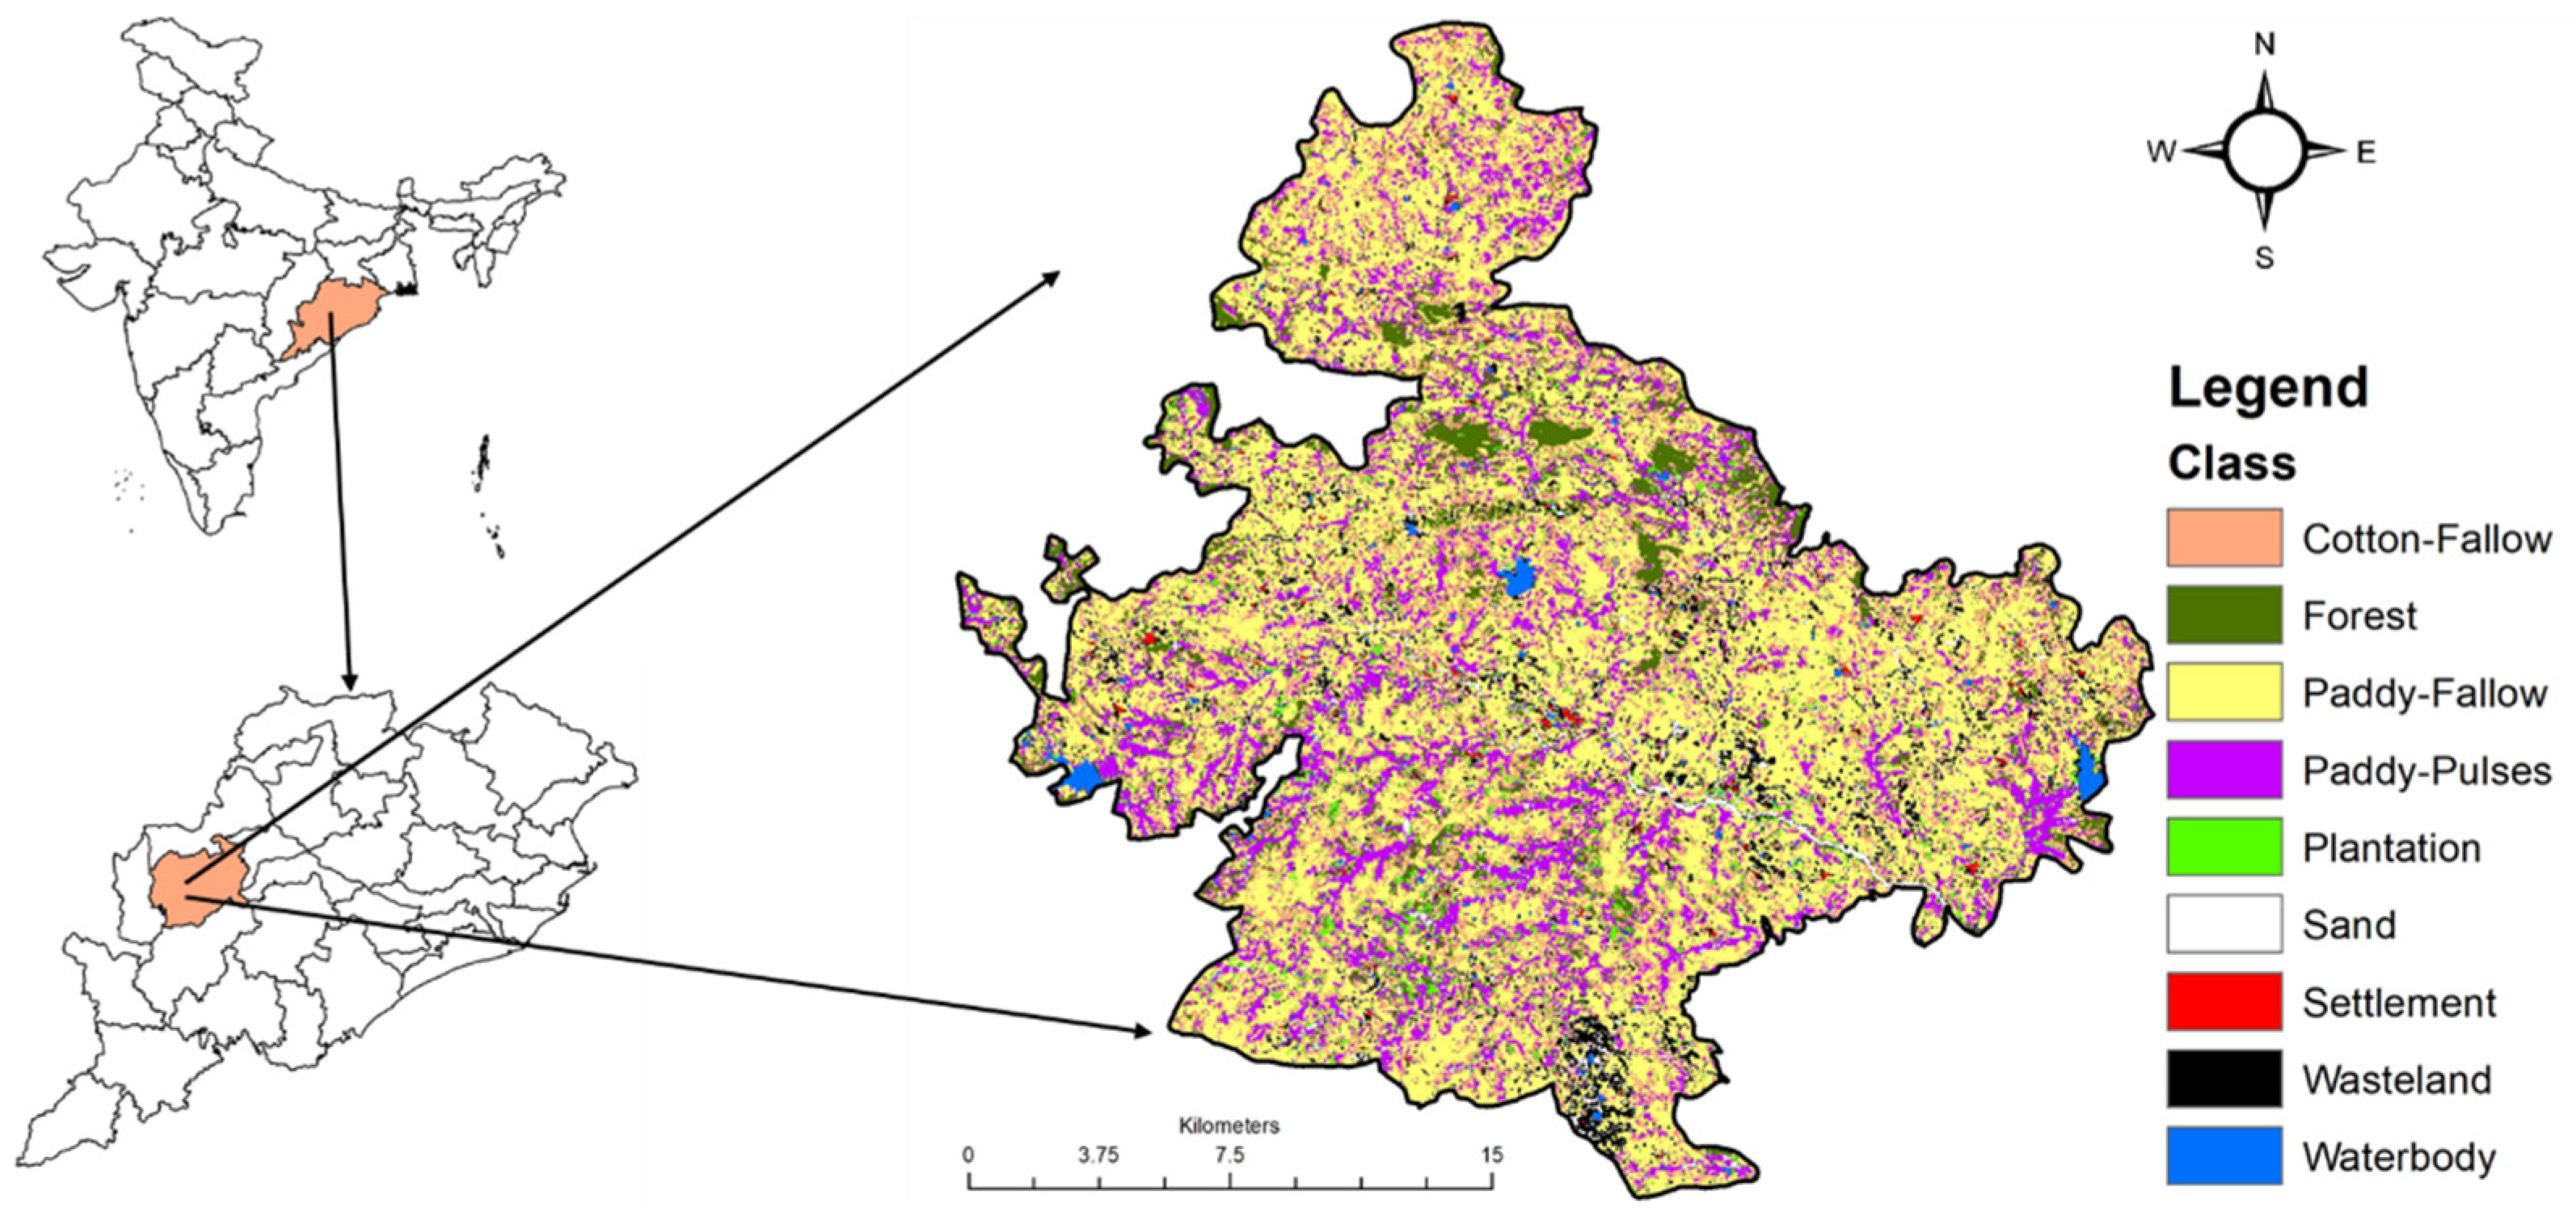
2. Study Area
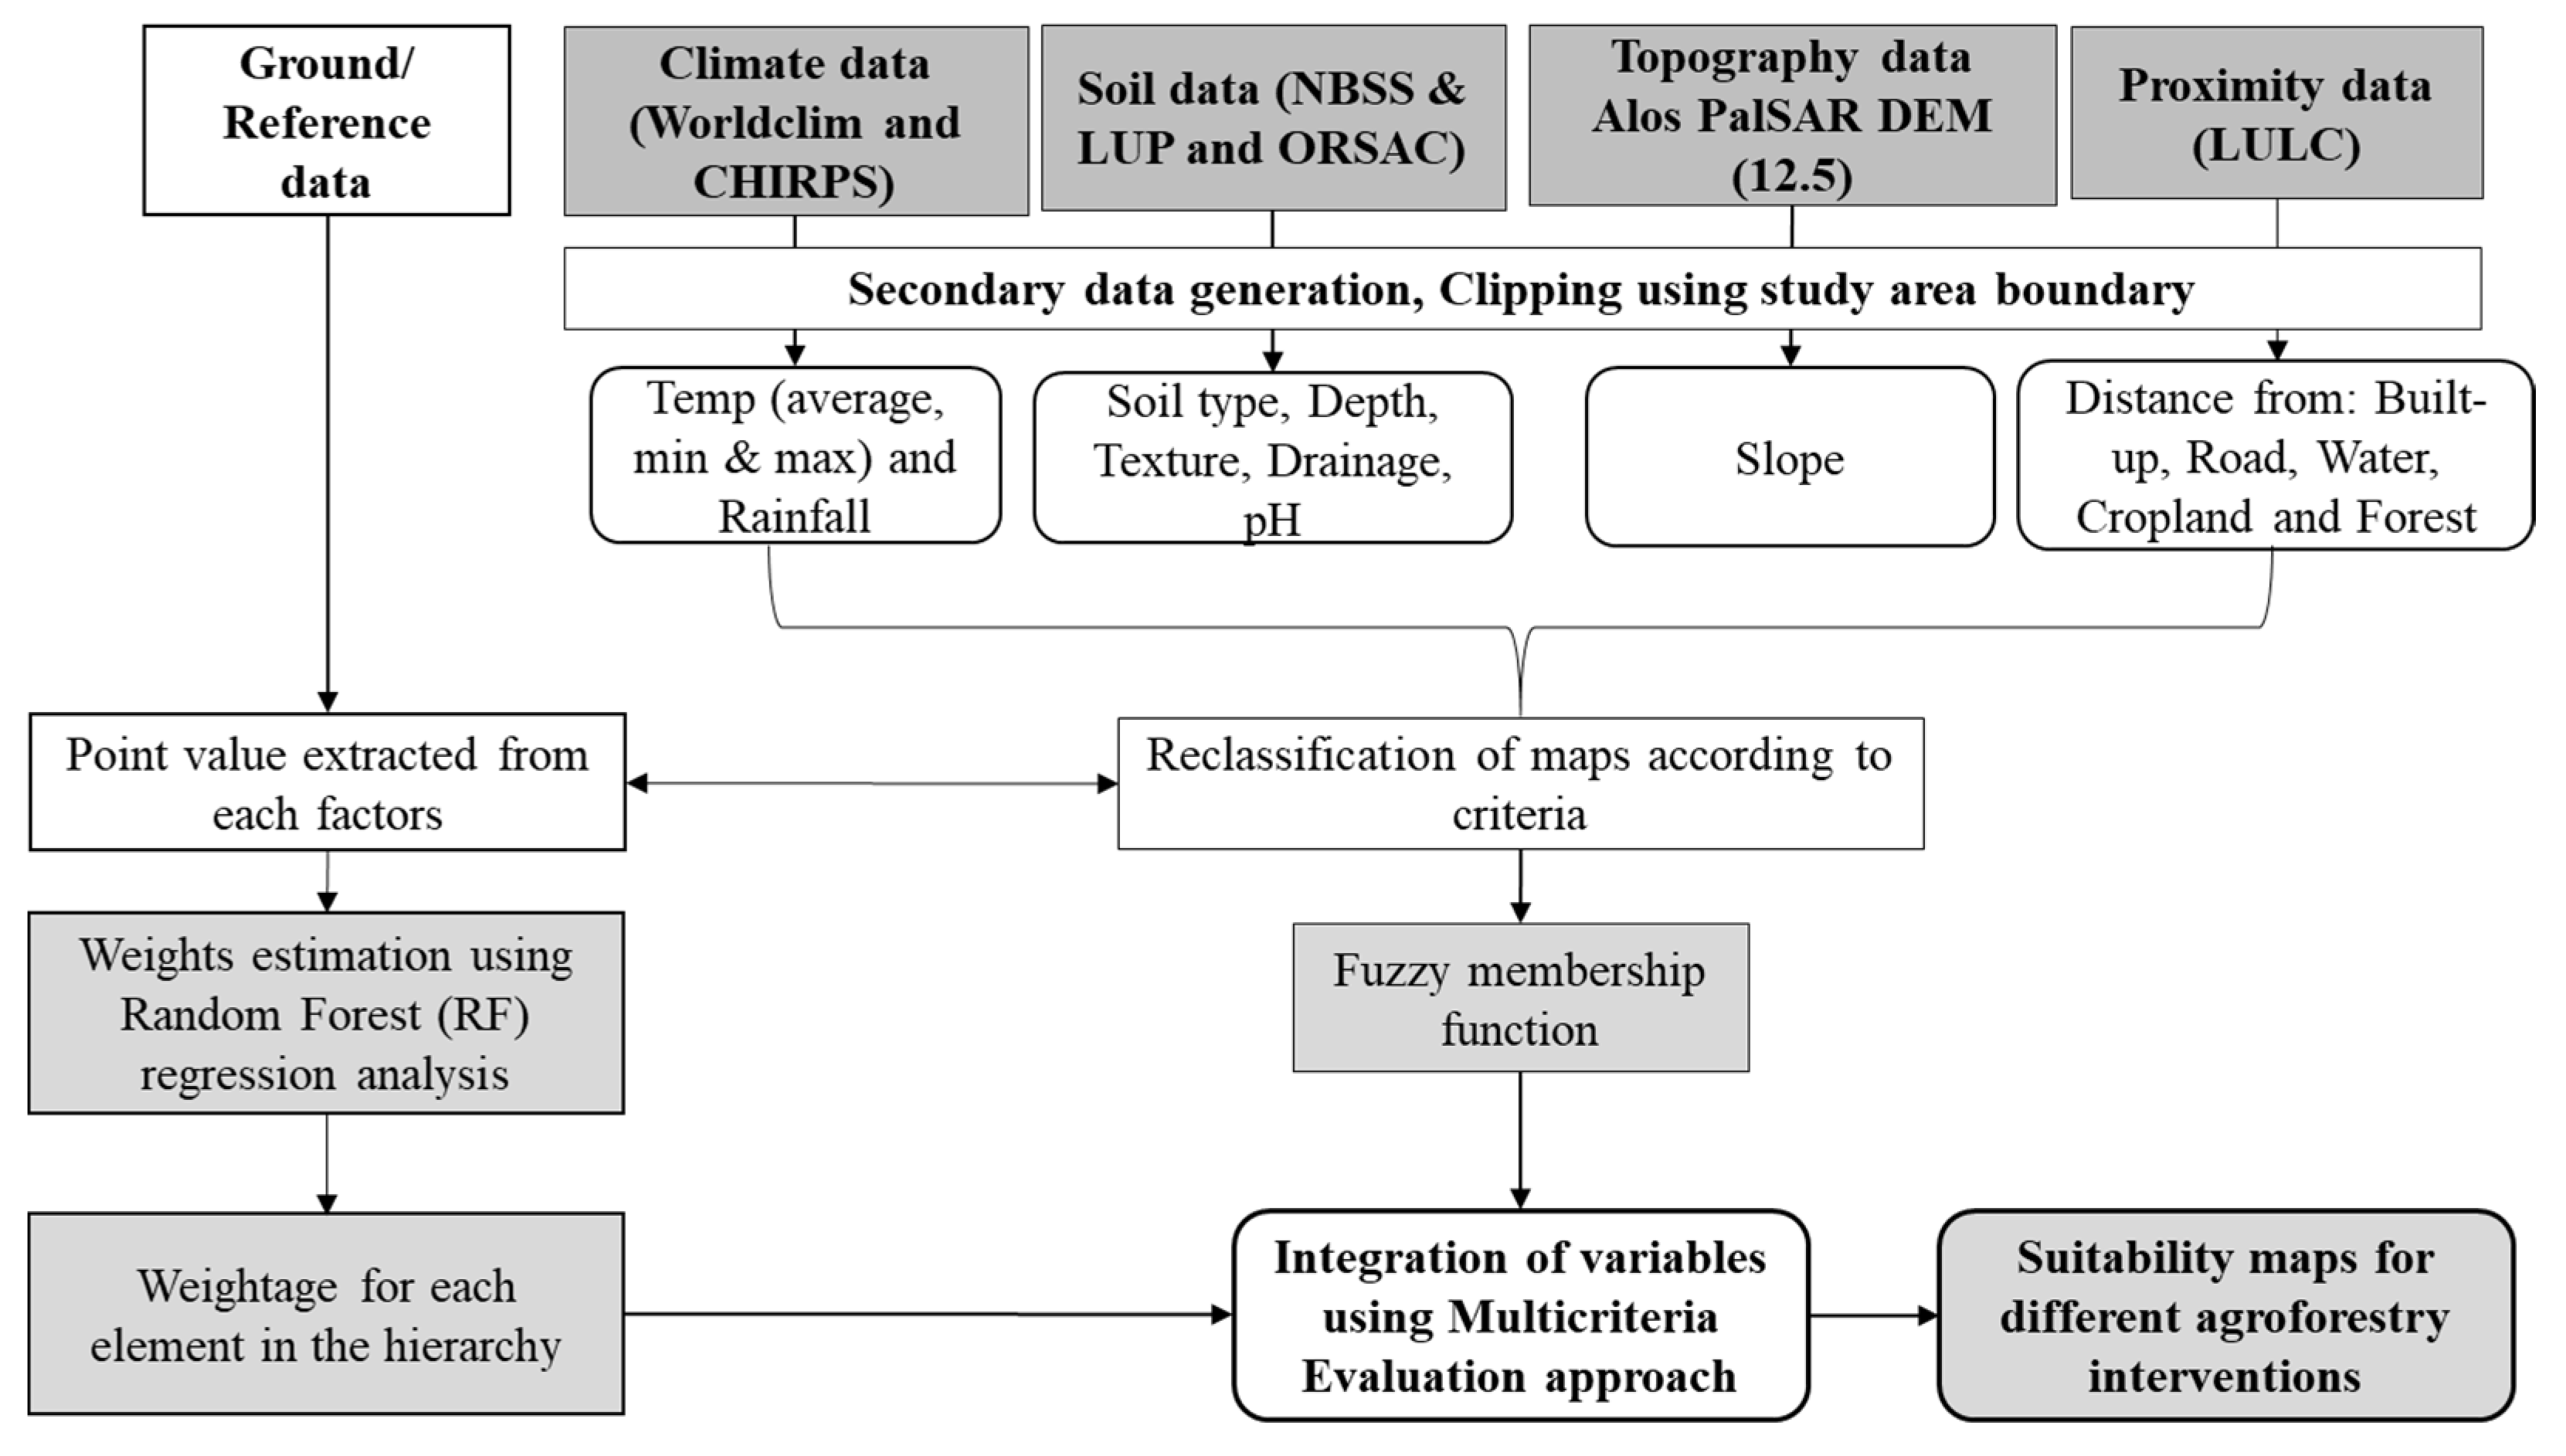
3. Materials and Methods
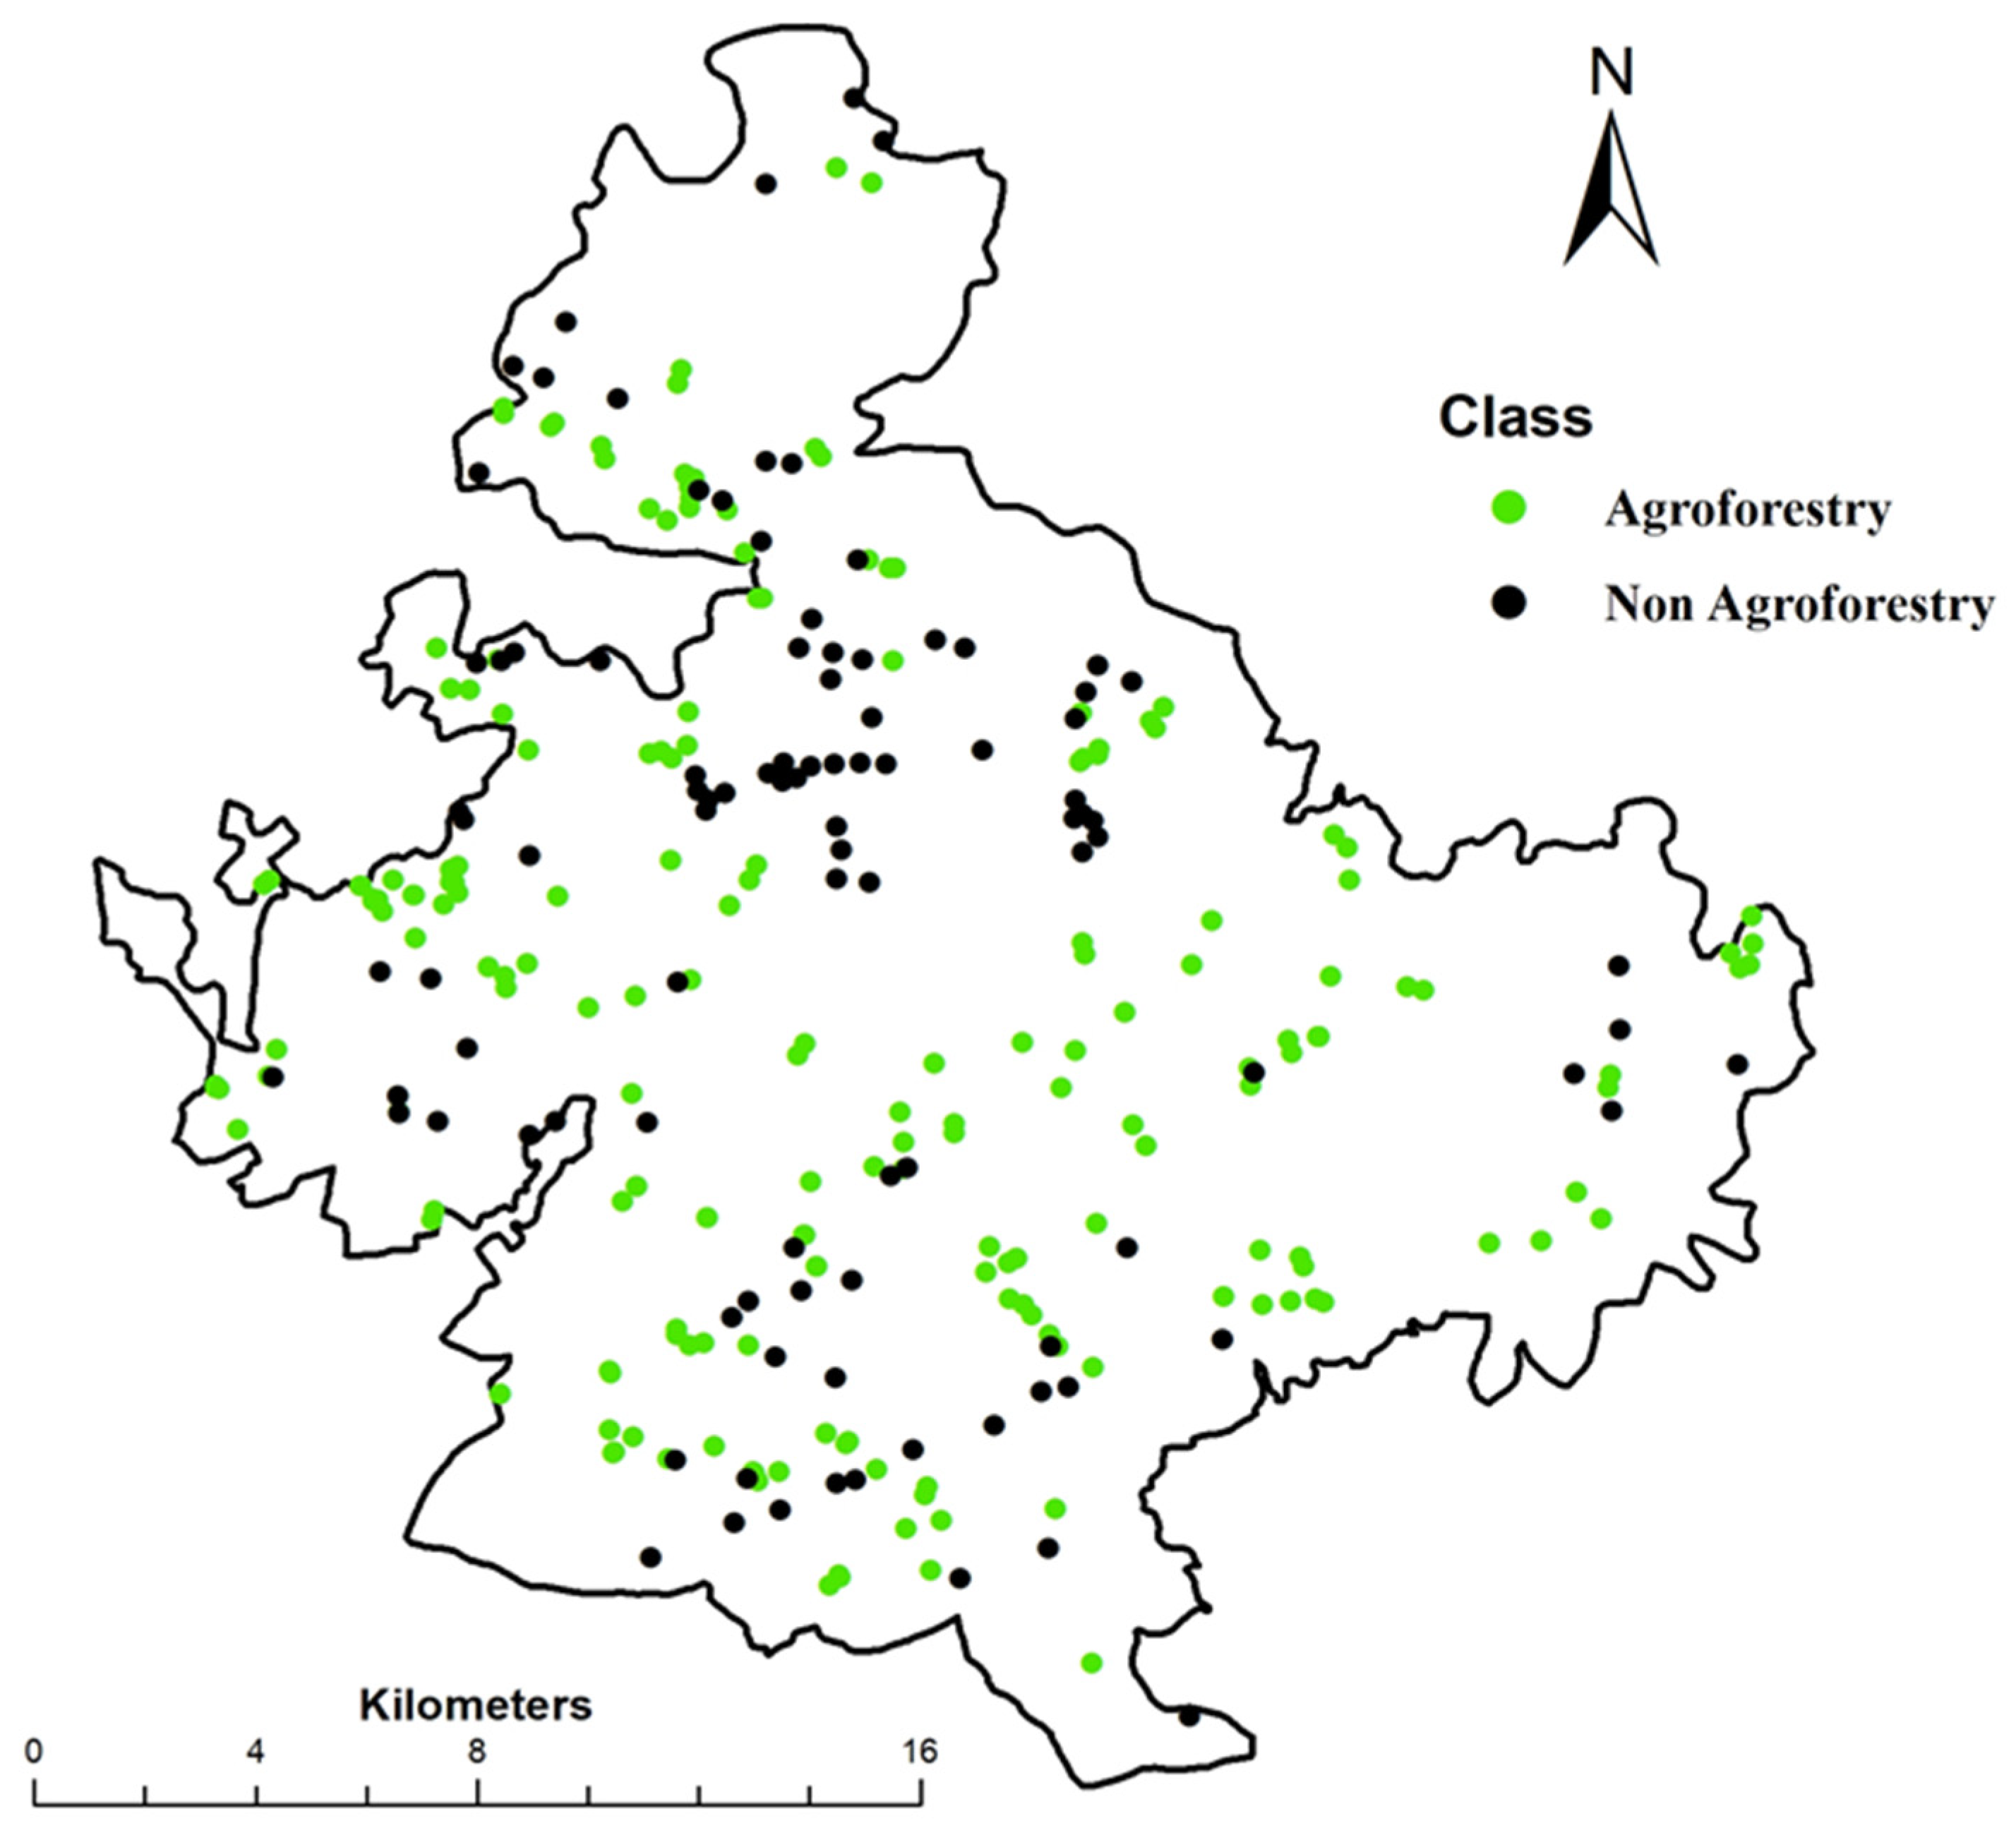
3.1. Satellite and Field Data
3.2. Selection of Variables for the Agroforestry Land Suitability Analysis
3.3. Standardization and Ranking of Each Variable of Criteria
3.4. Weight Calculation and Assignment to the Variables
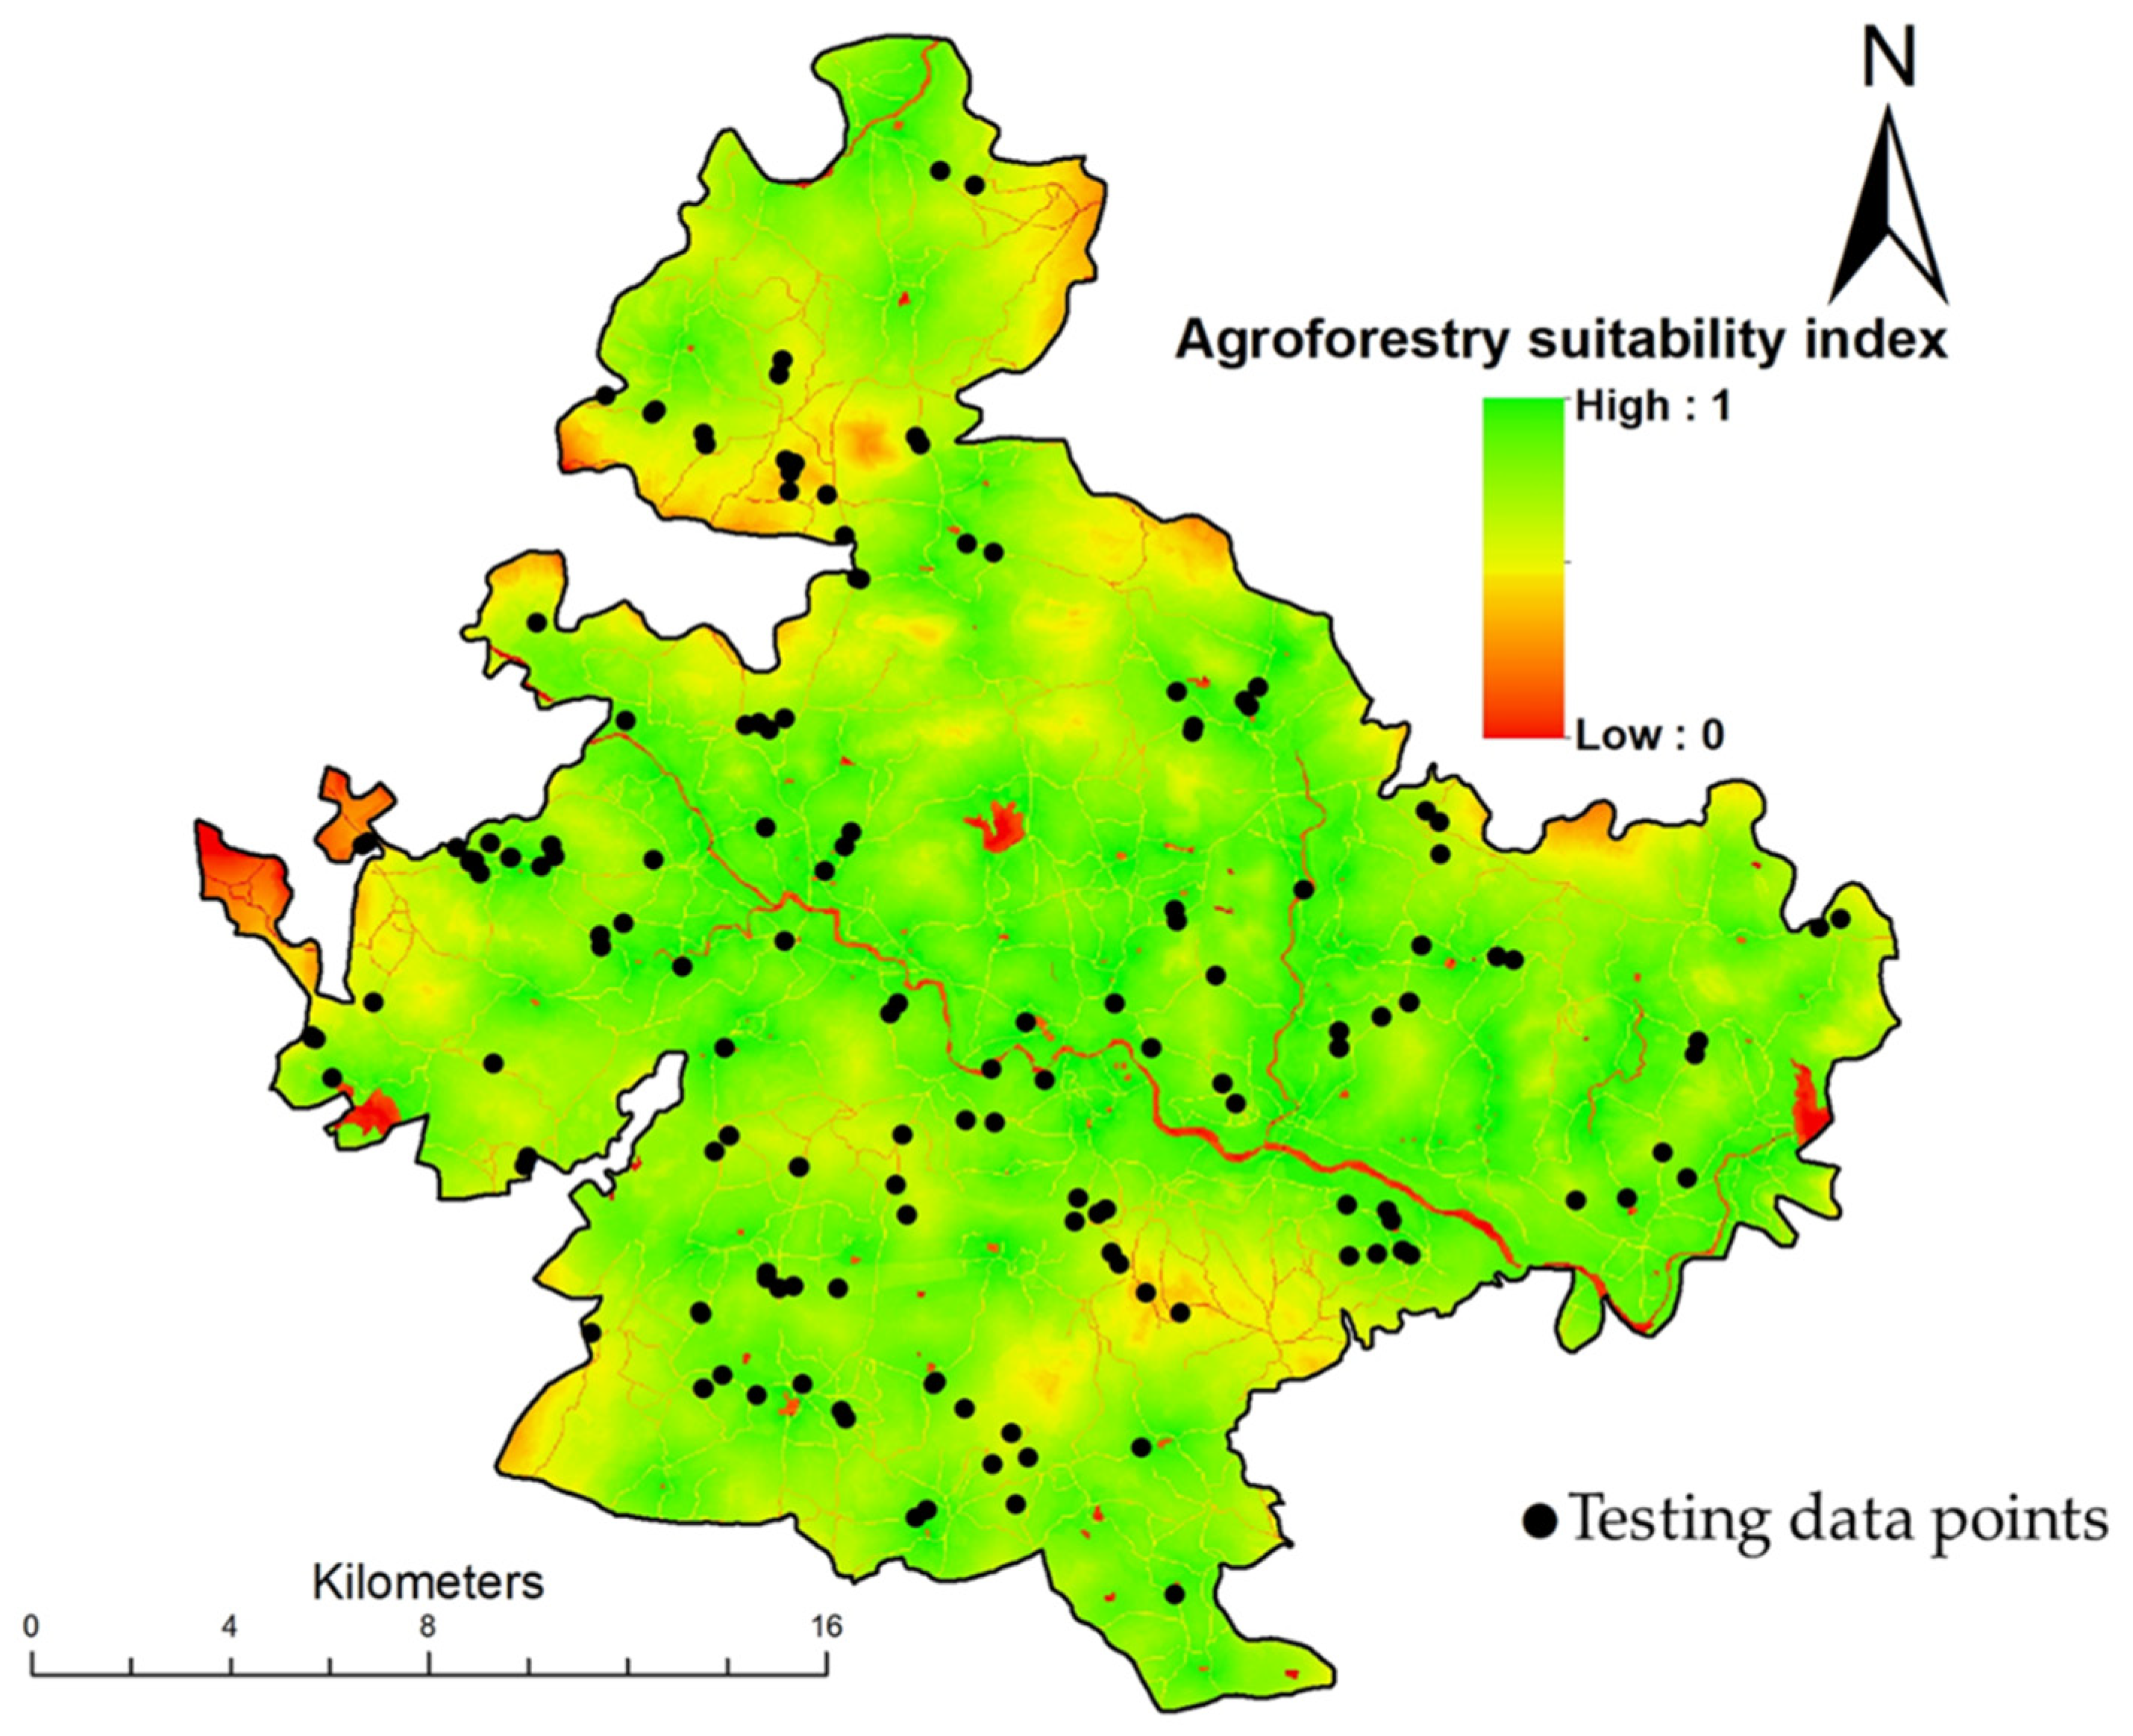
3.5. Agroforestry Suitability Model Generation and Validation
3.6. Generating Suitability Maps for Various Agroforestry Interventions
4. Results
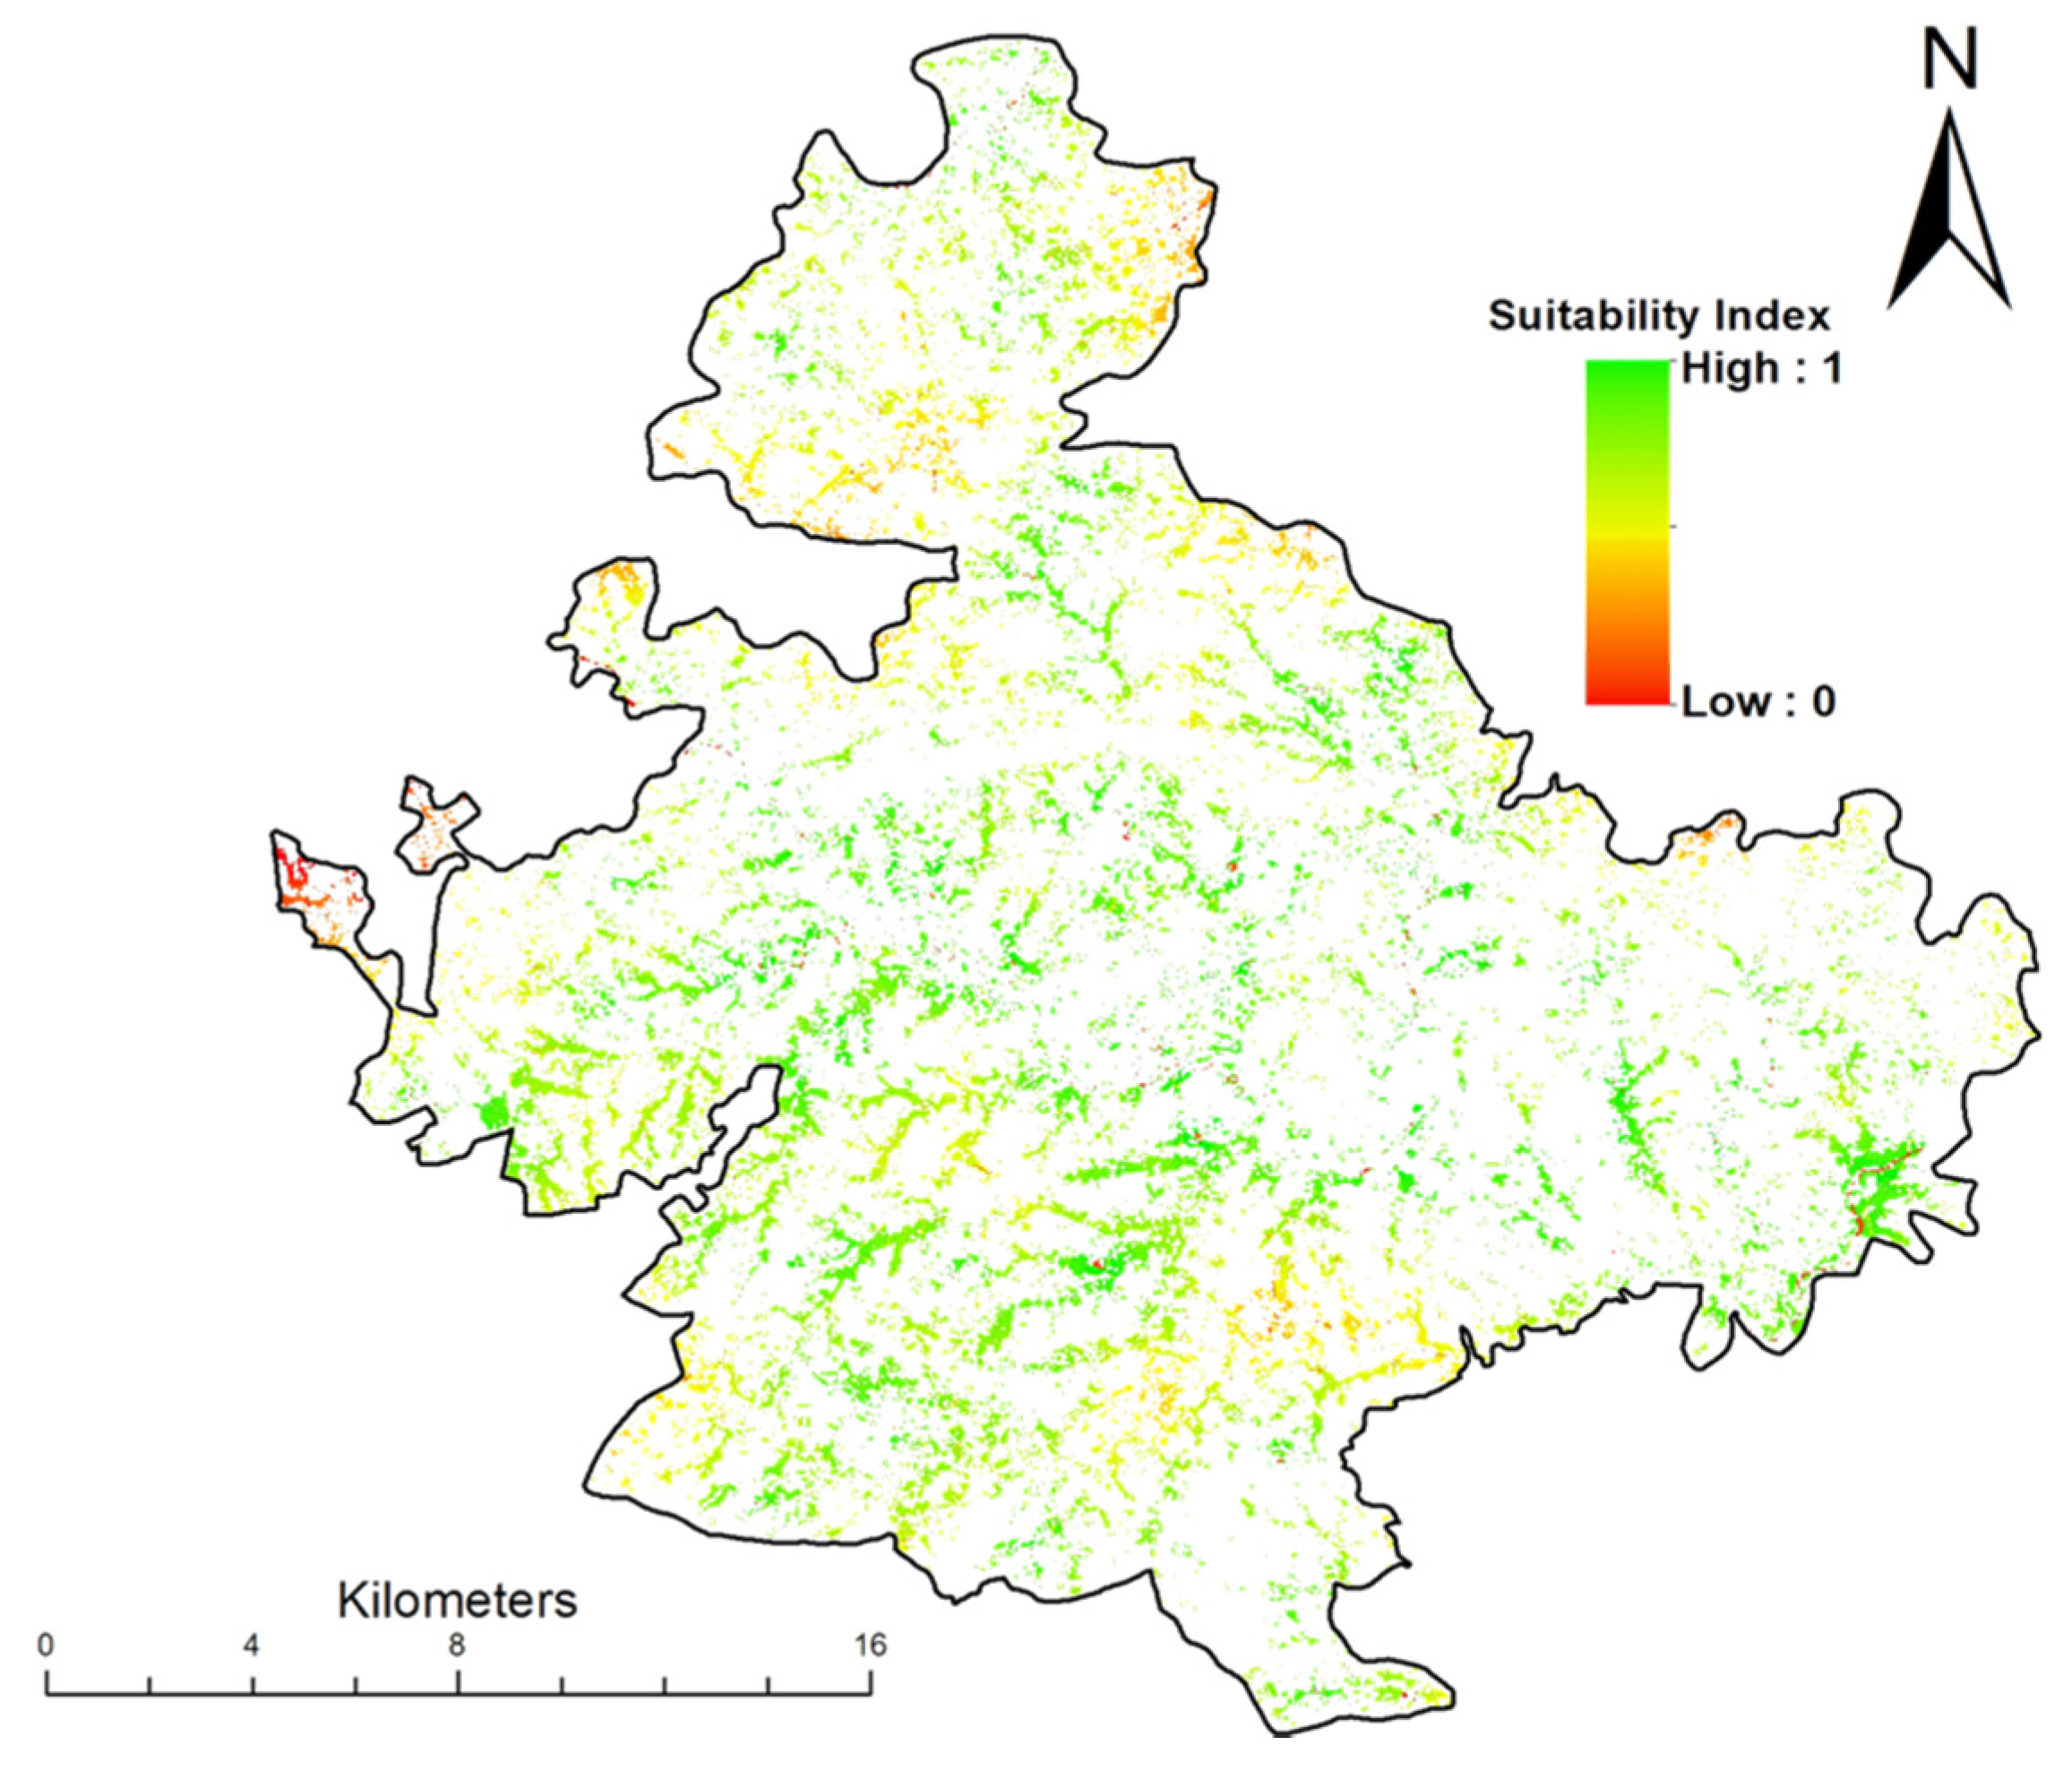
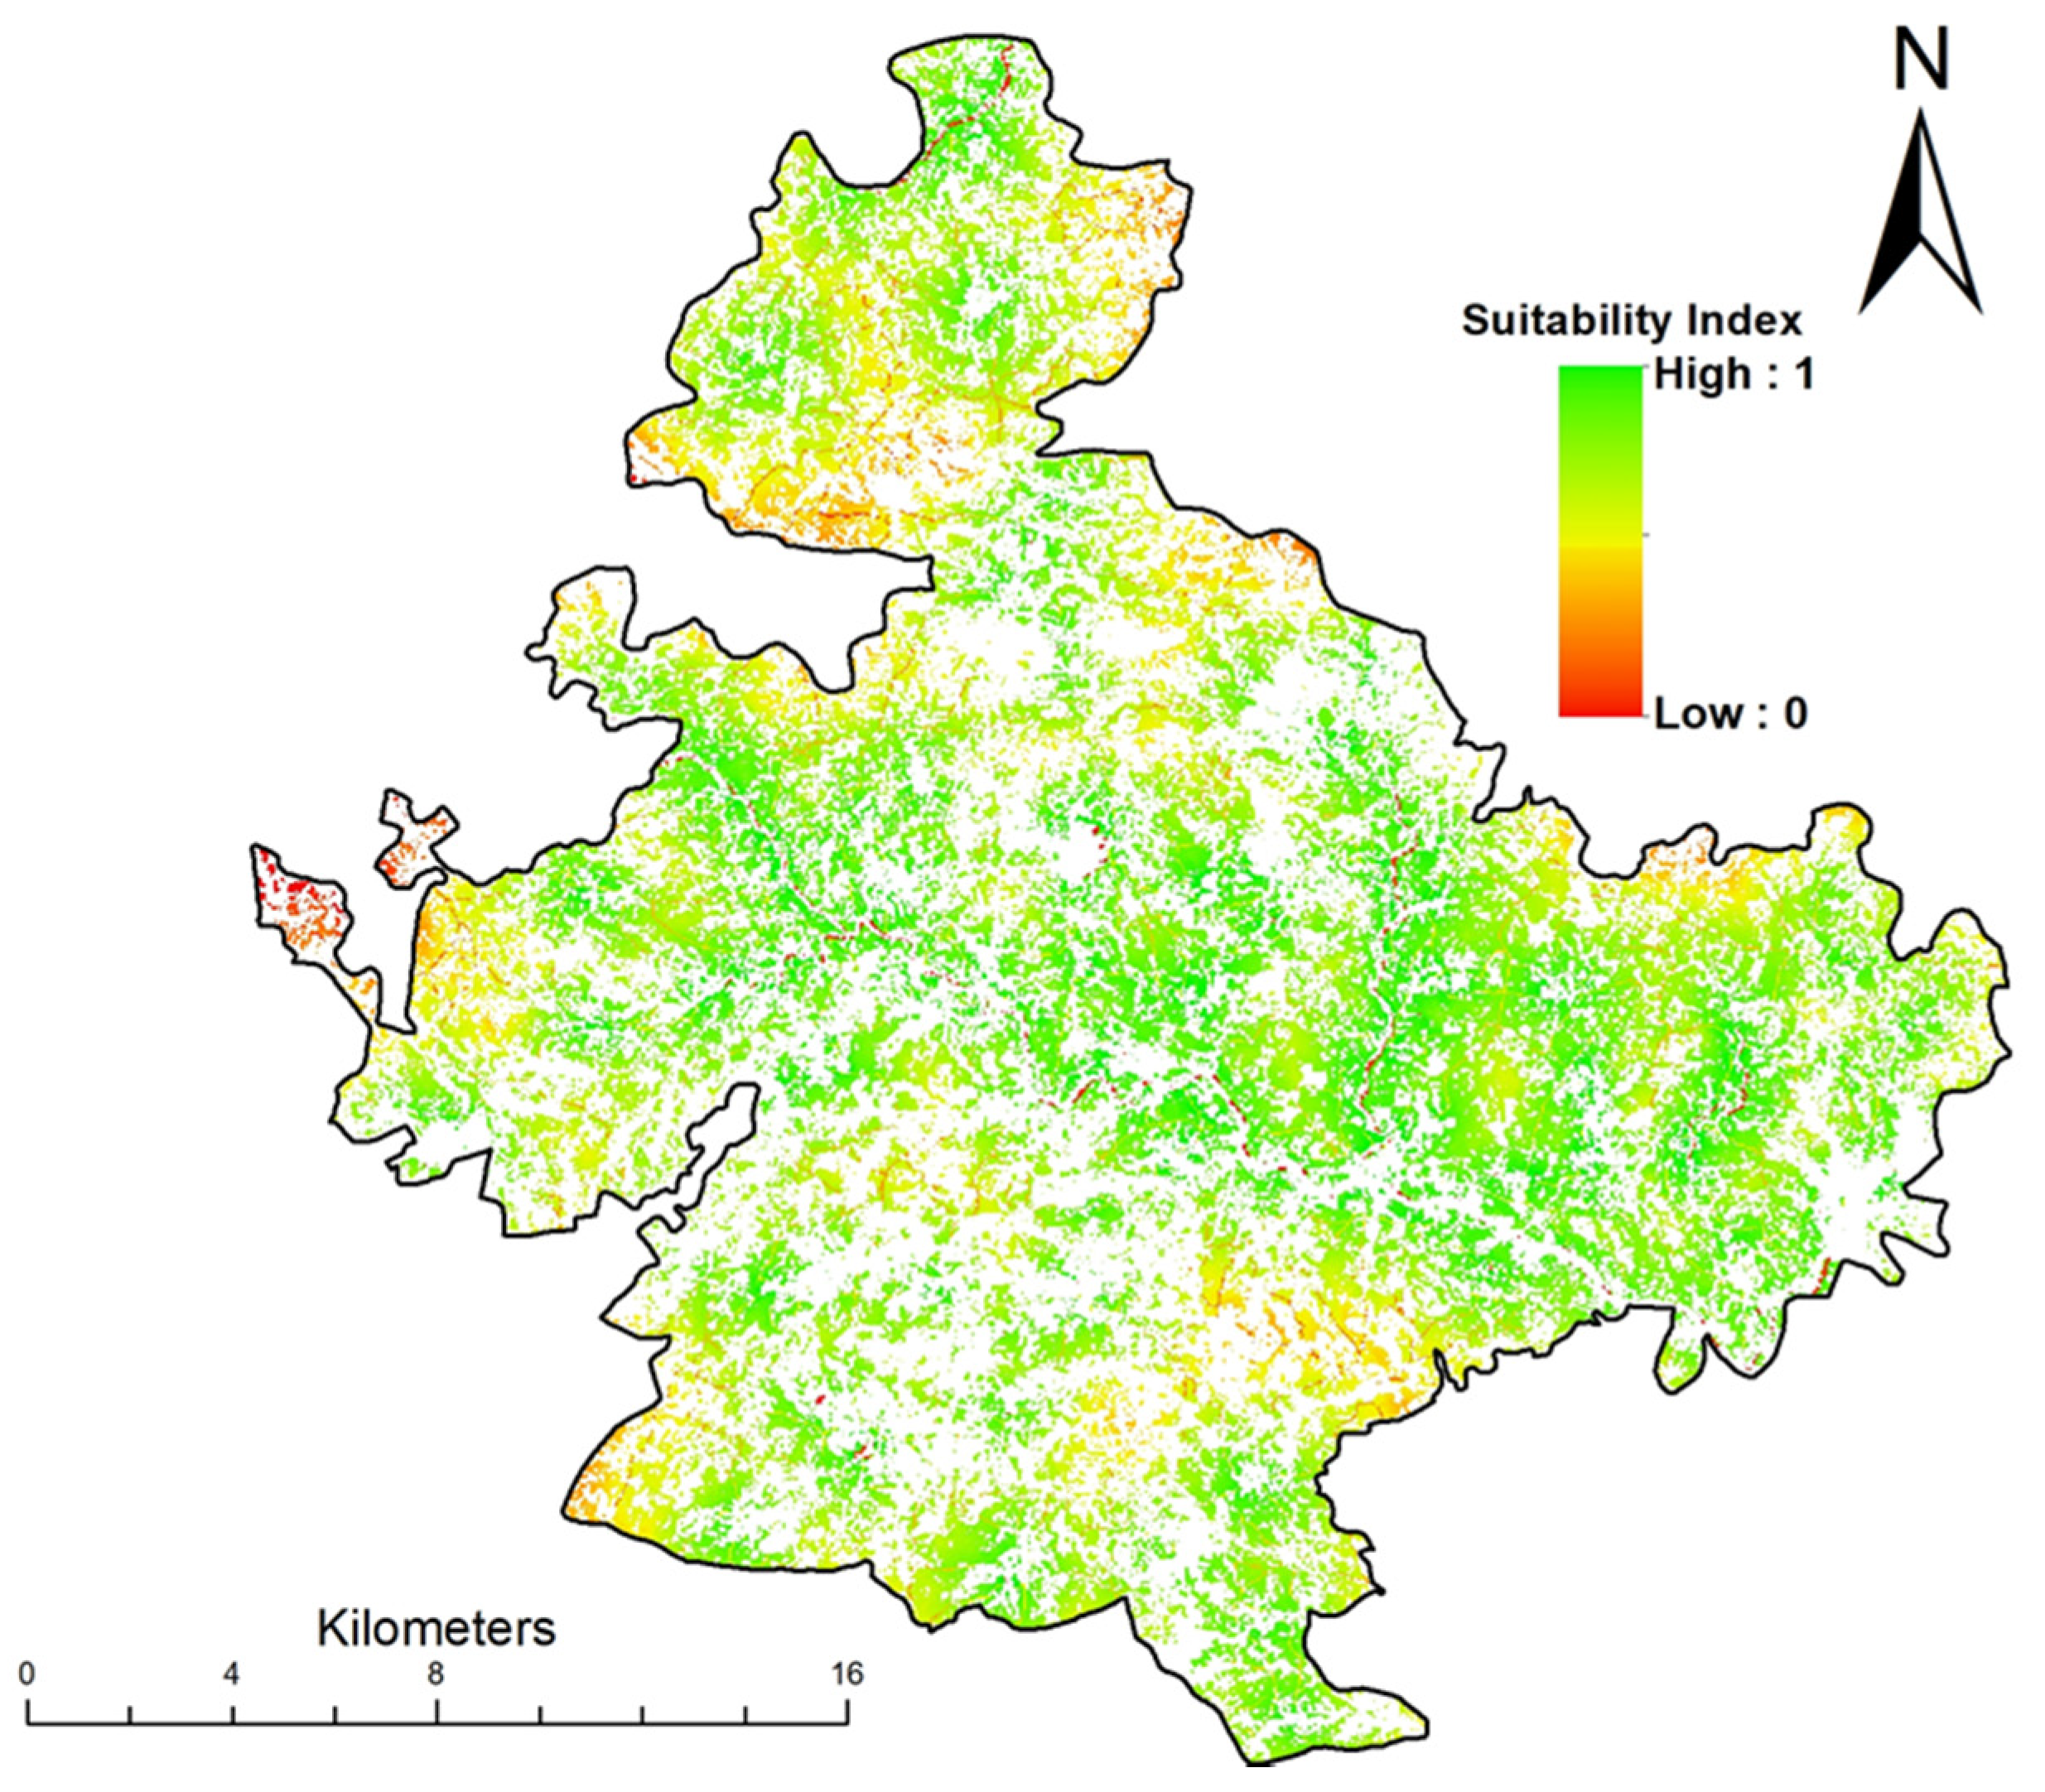
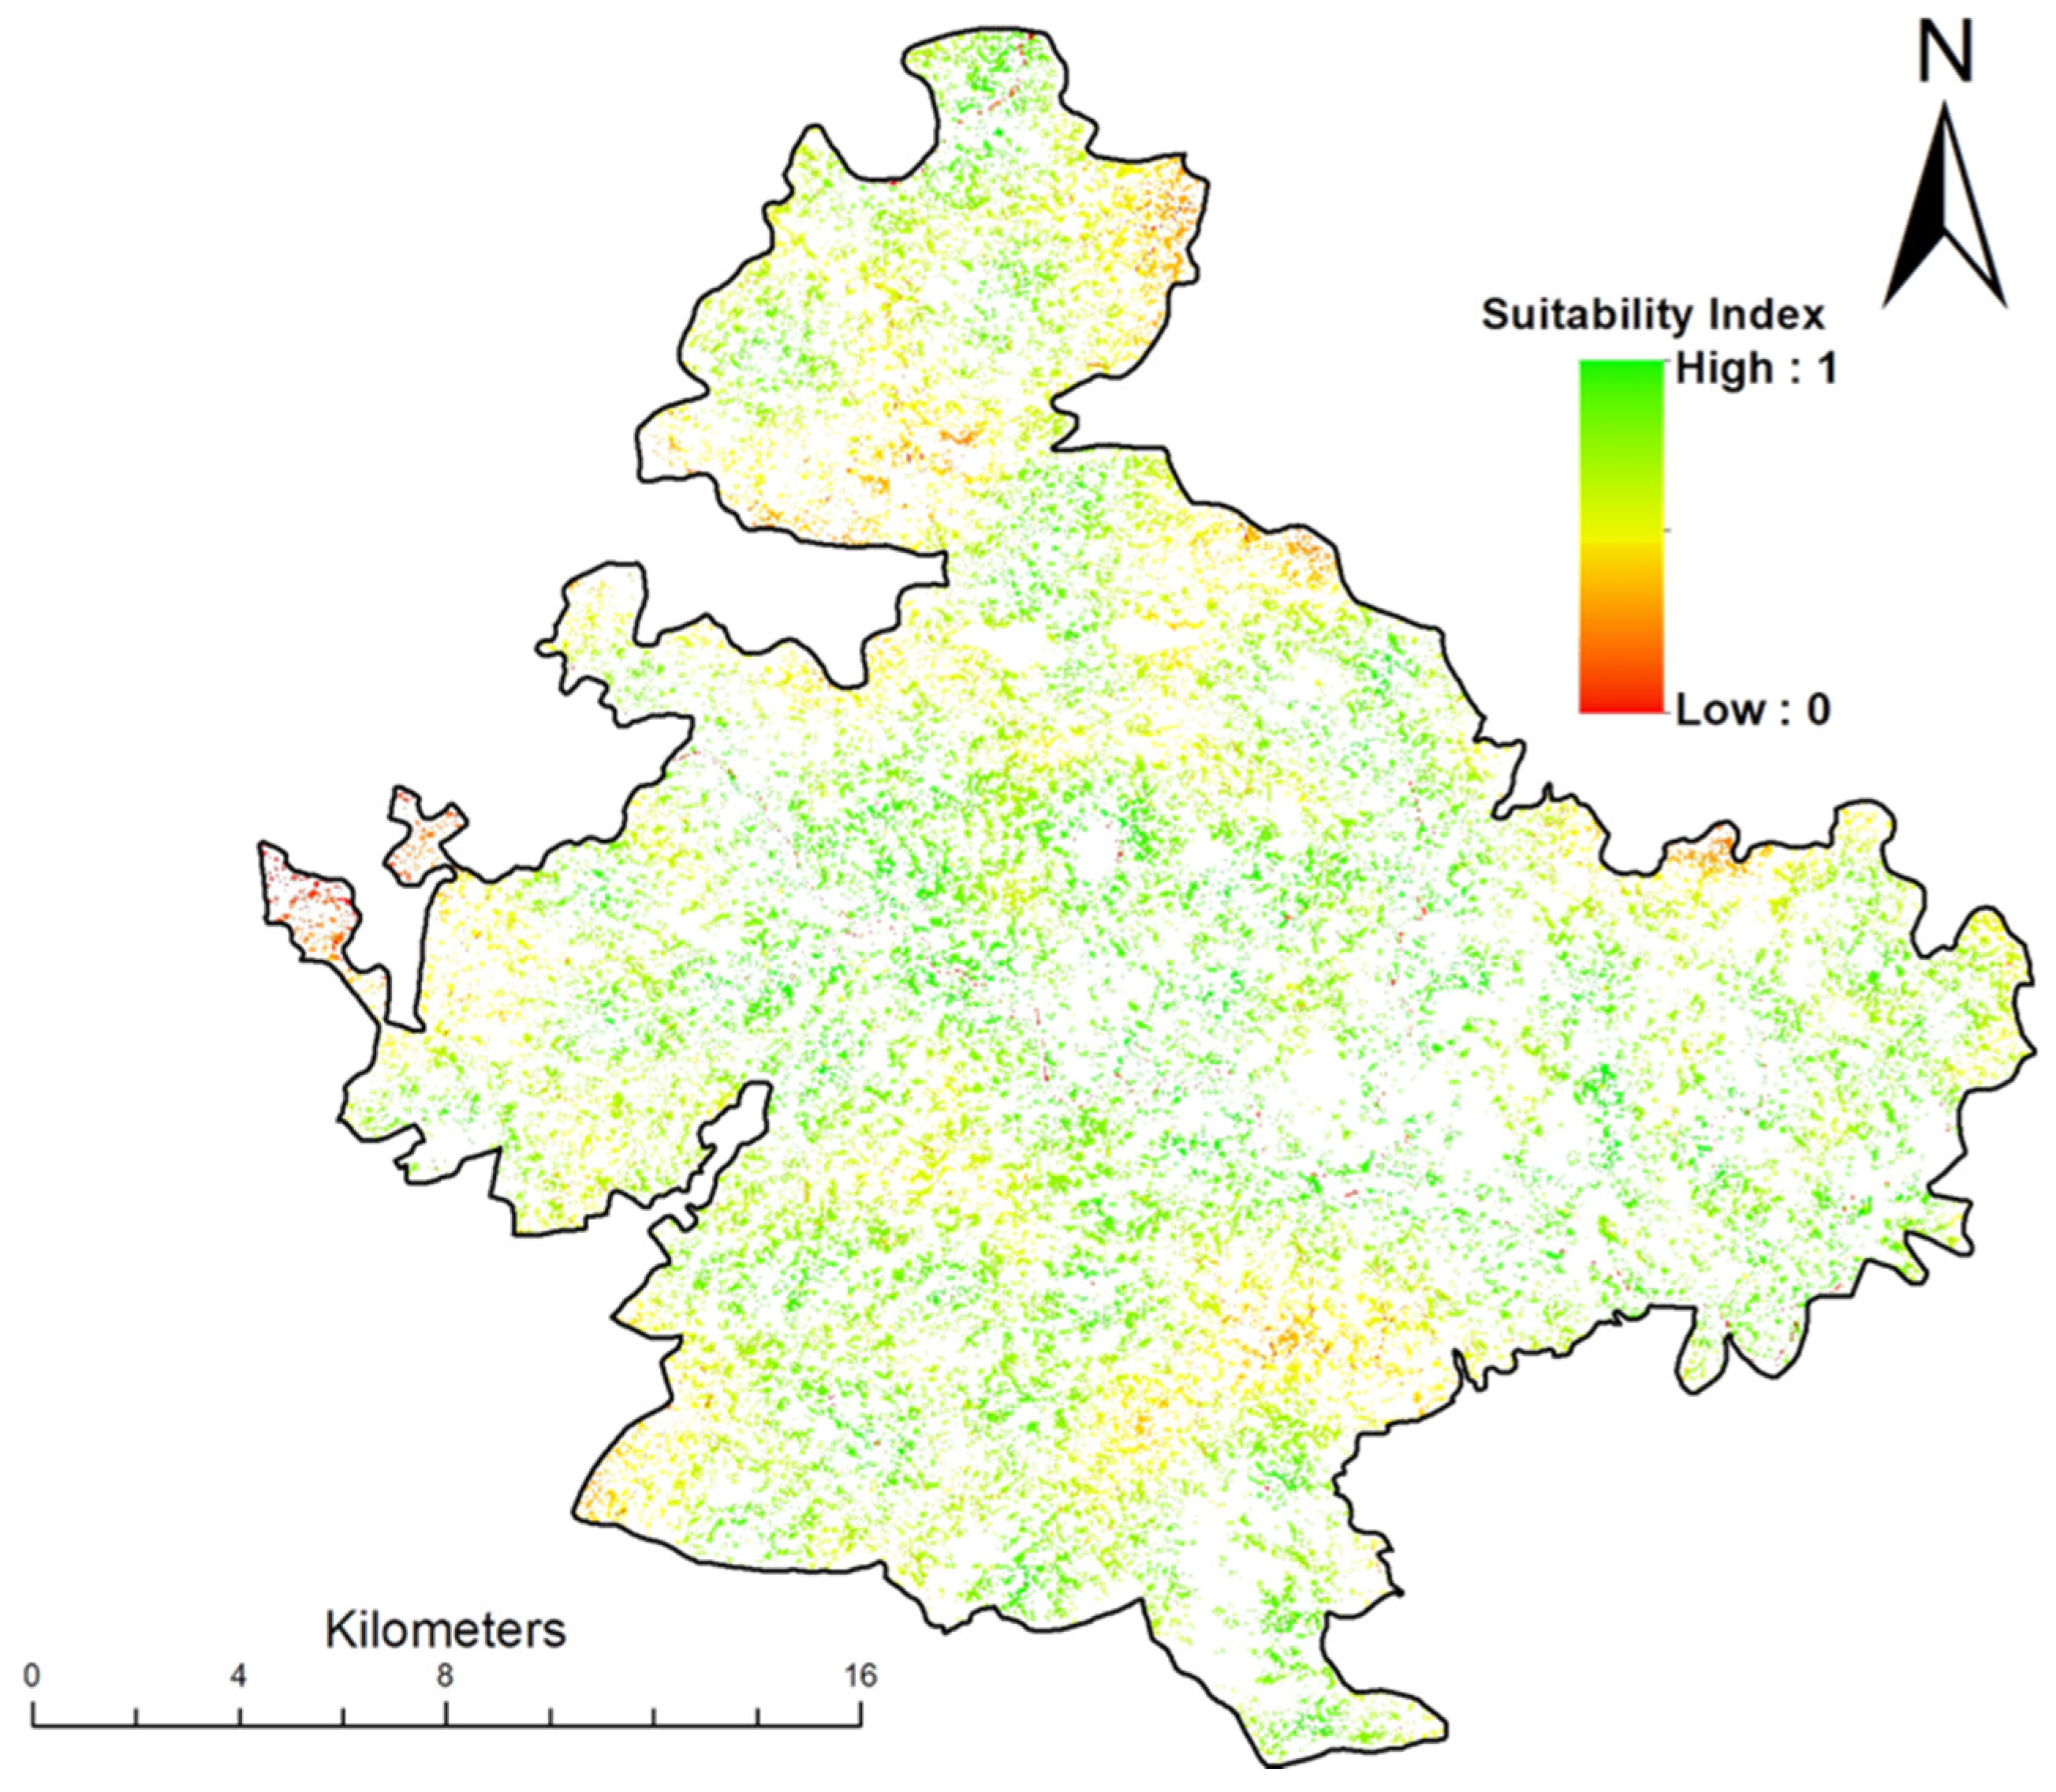
4.1. Agroforestry Interventions
4.1.1. Bund and Boundary Plantation and Intercropping
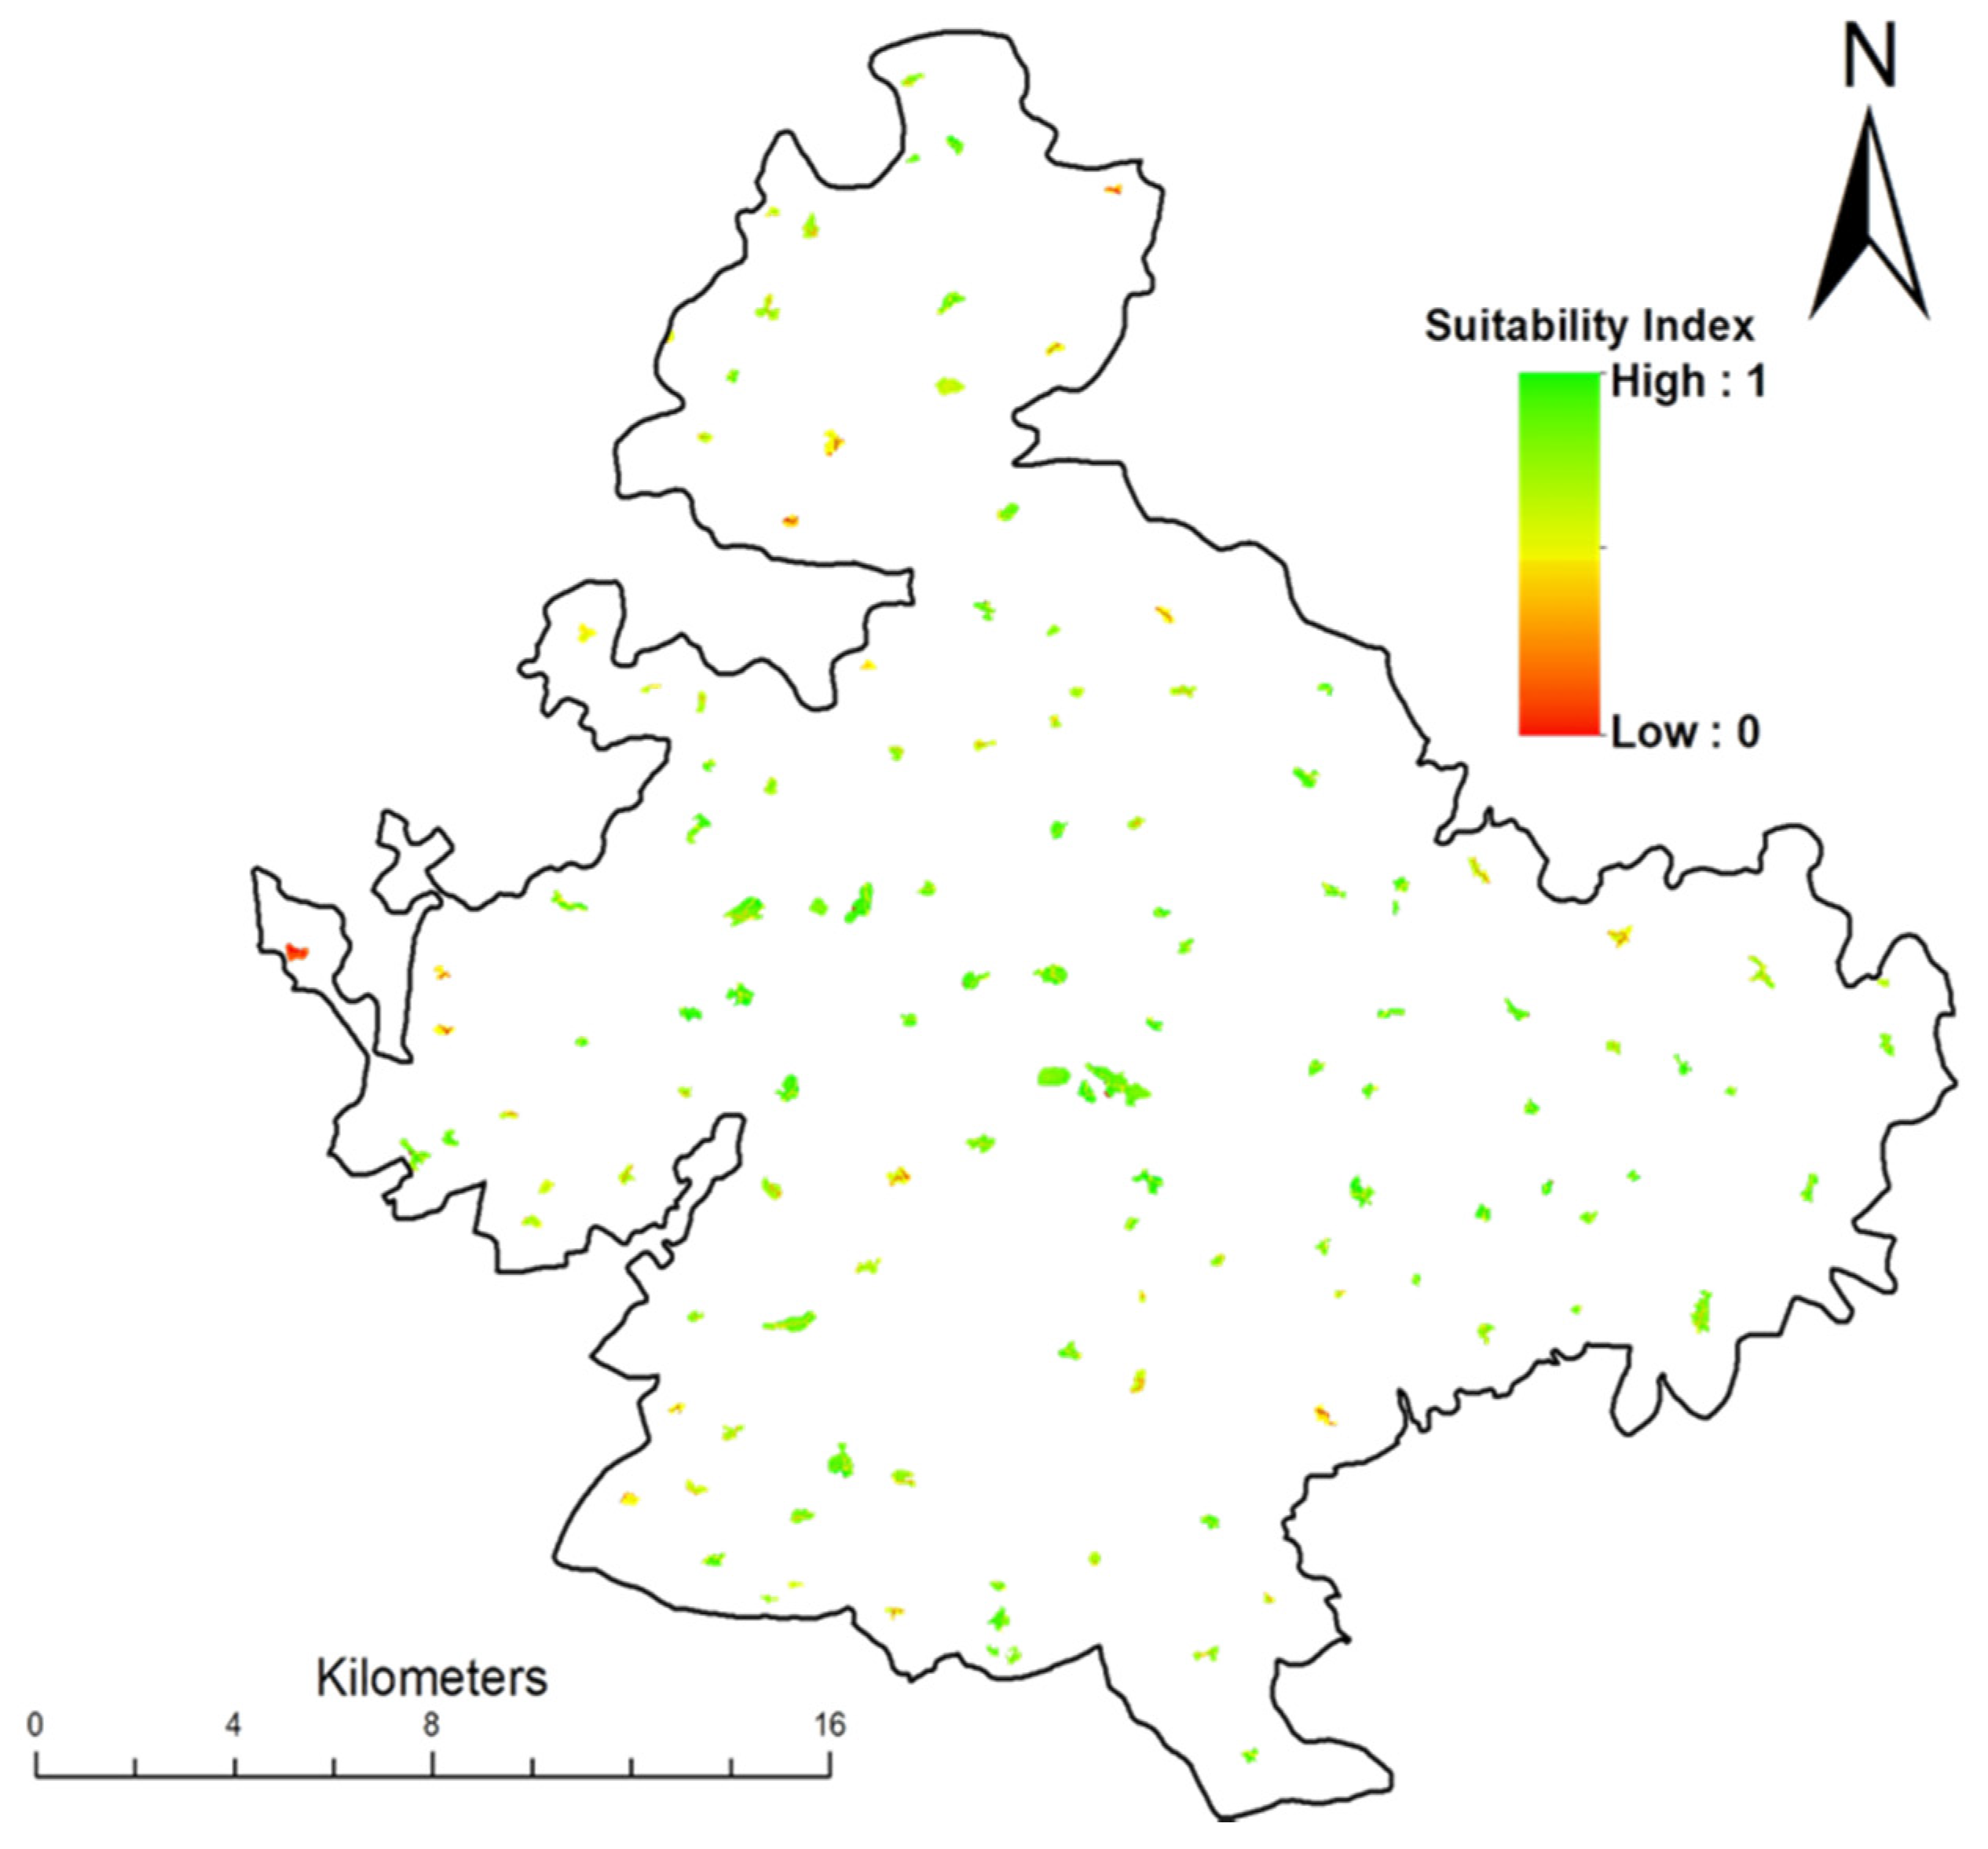
4.1.2. Home Gardens
4.1.3. Block/Bulk Plantation
5. Discussion
6. Conclusions
Supplementary Materials
Author Contributions
Funding
Institutional Review Board Statement
Informed Consent Statement
Data Availability Statement
Acknowledgments
Conflicts of Interest
References
- Nair, P.K.R. Classification of agroforestry systems. Agrofor. Syst. 1985, 3, 97–128. [Google Scholar] [CrossRef]
- Leakey, R.R.B. Definition of Agroforestry Revisited. Multifunct. Agric. 2017, 8, 5–6. [Google Scholar] [CrossRef]
- Ramachandran Nair, P.K. Agroforestry: Practices and Systems. Encycl. Agric. Food Syst. 2014, 1, 270–282. [Google Scholar] [CrossRef]
- Gold, M.A.; Garrett, H.E. Agroforestry nomenclature, concepts, and practices. In North American Agroforestry: An Integrated Science and Practice, 2nd ed.; John Wiley & Sons: Hoboken, NJ, USA, 2009. [Google Scholar]
- Mbow, C.; Smith, P.; Skole, D.; Duguma, L.; Bustamante, M. Achieving mitigation and adaptation to climate change through sustainable agroforestry practices in africa. Curr. Opin. Environ. Sustain. 2014, 6, 8–14. [Google Scholar] [CrossRef]
- Cooper, R.; Dejong, D.V.; Forsythe, R.; Ross, T.W. Cooperation without reputation: Experimental evidence from prisoner’s dilemma games. Games Econ. Behav. 1996, 12, 187–218. [Google Scholar] [CrossRef]
- Kiptot, E.; Franzel, S.; Degrande, A. Gender, agroforestry and food security in Africa. Curr. Opin. Environ. Sustain. 2014, 6, 104–109. [Google Scholar] [CrossRef]
- Waldron, A.; Garrity, D.; Malhi, Y.; Girardin, C.; Miller, D.C.; Seddon, N. Agroforestry Can Enhance Food Security While Meeting Other Sustainable Development Goals. Trop. Conserv. Sci. 2017, 10. [Google Scholar] [CrossRef]
- Ramos, N.C.; Gastauer, M.; de Almeida Campos Cordeiro, A.; Meira-Neto, J.A.A. Environmental filtering of agroforestry systems reduces the risk of biological invasion. Agrofor. Syst. 2015, 89, 279–289. [Google Scholar] [CrossRef]
- Asbjornsen, H.; Hernandez-Santana, V.; Liebman, M.; Bayala, J.; Chen, J.; Helmers, M.; Ong, C.K.; Schulte, L.A. Targeting perennial vegetation in agricultural landscapes for enhancing ecosystem services. Renew. Agric. Food Syst. 2014, 29, 101–125. [Google Scholar] [CrossRef]
- Hernandez, R.R.; Debenport, S.J.; Leewis, M.C.C.E.; Ndoye, F.; Nkenmogne, K.I.E.; Soumare, A.; Thuita, M.; Gueye, M.; Miambi, E.; Chapuis-Lardy, L.; et al. The native shrub, Piliostigma reticulatum, as an ecological “resource island” for mango trees in the Sahel. Agric. Ecosyst. Environ. 2015, 204, 51–61. [Google Scholar] [CrossRef][Green Version]
- NRCAF. The Vision-2050; Ministry of Agriculture: New Delhi, India, 2013.
- Plieninger, T.; Muñoz-Rojas, J.; Buck, L.E.; Scherr, S.J. Agroforestry for sustainable landscape management. Sustain. Sci. 2020, 15, 1255–1266. [Google Scholar] [CrossRef]
- Zinngrebe, Y.; Borasino, E.; Chiputwa, B.; Dobie, P.; Garcia, E.; Gassner, A.; Kihumuro, P.; Komarudin, H.; Liswanti, N.; Makui, P.; et al. Agroforestry governance for operationalising the landscape approach: Connecting conservation and farming actors. Sustain. Sci. 2020, 15, 1417–1434. [Google Scholar] [CrossRef]
- FAO. The State of Food Insecurity in the World; FAO: Roma, Italy, 2015. [Google Scholar]
- Nair, P.K.; Garrity, D. Agroforestry—The Future of Global Land Use, 1st ed.; Springer: Dordrecht, The Netherlands, 2012; ISBN 9789400746756. [Google Scholar]
- Nath, A.J.; Kumar, R.; Devi, N.B.; Rocky, P.; Giri, K.; Kumar, U.; Kumar, R.; Sahu, N.; Pandey, R. Agroforestry land suitability analysis in the Eastern Indian Himalayan region Agroforestry land suitability analysis in the Eastern Indian Himalayan region. Environ. Chall. 2021, 4, 100199. [Google Scholar] [CrossRef]
- Mourya, M.; Mehta, M. Farmer Producer Company: India’s Magic Bullet to Realise Select SDGs? Int. J. Rural Manag. 2021, 17, 115S–147S. [Google Scholar] [CrossRef]
- Dhyani, S.K. National agroforestry policy 2014 and the need for area estimation under agroforestry. Curr. Sci. 2014, 107, 9–10. [Google Scholar]
- Sharma, P.; Singh, M.K.; Tiwari, P.; Verma, K. Agroforestry systems: Opportunities and challenges in India. J. Pharmacogn. Phytochem. 2017, 1, 953–957. [Google Scholar]
- Dhyani, S.K.; Handa, A.K. Agroforestry in India and its potential for ecosystem services. In Agroforestry Systems in India: Livelihood Security & Ecosystem Services; Springer: New Delhi, India, 2014; pp. 345–365. [Google Scholar] [CrossRef]
- Nguyen, T.T.; Verdoodt, A.; Tran, V.Y.; Delbecque, N.; Tran, T.C.; Van Ranst, E. Design of a GIS and multi-criteria based land evaluation procedure for sustainable land-use planning at the regional level. Agric. Ecosyst. Environ. 2015, 200, 1–11. [Google Scholar] [CrossRef]
- Jamil, M.; Ahmed, R.; Sajjad, H. Land suitability assessment for sugarcane cultivation in Bijnor district, India using geographic information system and fuzzy analytical hierarchy process. GeoJournal 2018, 83, 595–611. [Google Scholar] [CrossRef]
- De La Rosa, D.; Van diepen, C.A. Qualitative and quantitative land evaluations. In Land Use and Land Cover, in Encyclopedia of Life Support System (EOLSS-UNESCO); Eolss Publishers: Oxford, UK, 2002. [Google Scholar]
- Talukdar, D.; Seenivasan, S.; Cameron, A.J.; Sacks, G. The association between national income and adult obesity prevalence: Empirical insights into temporal patterns and moderators of the association using 40 years of data across 147 countries. PLoS ONE 2020, 15, e0232236. [Google Scholar] [CrossRef]
- Ahmad, F.; Goparaju, L.; Qayum, A. Agroforestry suitability analysis based upon nutrient availability mapping: A GIS based suitability mapping. AIMS Agric. Food 2017, 2, 201–220. [Google Scholar] [CrossRef]
- Ahmad, F.; Uddin, M.M.; Goparaju, L.; Rizvi, J.; Biradar, C. Quantification of the Land Potential for Scaling Agroforestry in South Asia. KN-J. Cartogr. Geogr. Inf. 2020, 70, 71–89. [Google Scholar] [CrossRef]
- Memarbashi, E.; Azadi, H.; Barati, A.A.; Mohajeri, F.; Van Passel, S.; Witlox, F. Land-use suitability in Northeast Iran: Application of AHP-GIS hybrid model. ISPRS Int. J. Geo-Inf. 2017, 6, 396. [Google Scholar] [CrossRef]
- Dağıstanlı, C.; Turan, İ.D.; Dengiz, O. Evaluation of the suitability of sites for outdoor recreation using a multi-criteria assessment model. Arab. J. Geosci. 2018, 11, 492. [Google Scholar] [CrossRef]
- Everest, T.; Sungur, A.; Özcan, H. Determination of agricultural land suitability with a multiple-criteria decision-making method in Northwestern Turkey. Int. J. Environ. Sci. Technol. 2021, 18, 1073–1088. [Google Scholar] [CrossRef] [PubMed]
- Acharya, P.; Biradar, C.; Louhaichi, M.; Ghosh, S.; Hassan, S.; Moyo, H.; Sarker, A. Finding a suitable niche for cultivating cactus pear (Opuntia ficus-indica) as an integrated crop in resilient dryland agroecosystems of India. Sustainability 2019, 11, 5897. [Google Scholar] [CrossRef]
- Singh, R.K.; Biradar, C.; Sarker, A.; Dogra, A.; Rizvi, J. Mapping areas for growing pulses in rice fallows using multi-criteria spatial decisions. In Mapping, Monitoring, and Modeling Land and Water Resources; CRC Press: Boca Raton, FL, USA, 2021; pp. 21–32. [Google Scholar]
- Ahmad, F.; Uddin, M.M.; Goparaju, L.; Dhyani, S.K.; Oli, B.N.; Rizvi, J. Tree suitability modeling and mapping in Nepal: A geospatial approach to scaling agroforestry. Model. Earth Syst. Environ. 2020, 7, 169–179. [Google Scholar] [CrossRef]
- Chuma, G.B.; Cirezi, N.C.; Mondo, J.M.; Mugumaarhahama, Y.; Ganza, D.M.; Katcho, K.; Mushagalusa, G.N.; Serge, S.S. Suitability for agroforestry implementation around Itombwe Natural Reserve (RNI), eastern DR Congo: Application of the Analytical Hierarchy Process (AHP) approach in geographic information system tool. Trees For. People 2021, 6, 100125. [Google Scholar] [CrossRef]
- Elsheikh, R.; Mohamed Shariff, A.R.B.; Amiri, F.; Ahmad, N.B.; Balasundram, S.K.; Soom, M.A.M. Agriculture Land Suitability Evaluator (ALSE): A decision and planning support tool for tropical and subtropical crops. Comput. Electron. Agric. 2013, 93, 98–110. [Google Scholar] [CrossRef]
- Chen, Y.; Wu, B.; Chen, D.; Qi, Y. Using machine learning to assess site suitability for afforestation with particular species. Forests 2019, 10, 739. [Google Scholar] [CrossRef]
- Komolafe, E.O.; Awoyelu, I.O.; Ojetade, J.O. Predictive Modeling for Land Suitability Assessment for Cassava Cultivation. Comput. Electron. Agric. 2019, 9, 21–31. [Google Scholar] [CrossRef]
- Feng, Z.; Zhang, Z.; Zhang, Q.; Gongab, D. Evaluation of Soil Suitability for Cultivation Based on Back-Propagation Artificial Neural Network: The Case of Jiangxia District. Environ. Eng. Manag. J. 2018, 17, 229–235. [Google Scholar]
- Ahmad, F.; Goparaju, L.; Qayum, A. FAO guidelines and geospatial application for agroforestry suitability mapping: Case study of Ranchi, Jharkhand state of India. Agrofor. Syst. 2019, 93, 531–544. [Google Scholar] [CrossRef]
- Ahmad, F.; Uddin, M.M.; Goparaju, L. Agroforestry suitability mapping of India: Geospatial approach based on FAO guidelines. Agrofor. Syst. 2019, 93, 1319–1336. [Google Scholar] [CrossRef]
- Singh, J. Geospatial Assessment of Shift in Agroclimatic Suitability of Food Grains and Plantation Crops in Himachal Pradesh under Changing Climate; Indian Institute of Remote Sensing, ISRO: Dehradun, India, 2015.
- Zadeh, L.A. Fuzzy Sets. Inf. Control 1965, 8, 338–353. [Google Scholar] [CrossRef]
- McBratney, A.B.; Odeh, I.O.A. Application of fuzzy sets in soil science: Fuzzy logic, fuzzy measurements and fuzzy decisions. Geoderma 1997, 77, 85–113. [Google Scholar] [CrossRef]
- Burrough, P.A.; Macmillan, R.A.; van Deursen, W. Fuzzy classification methods for determining land suitability from soil profile observations and topography. J. Soil Sci. 1992, 43, 193–210. [Google Scholar] [CrossRef]
- Qiu, F.; Chastain, B.; Zhou, Y.; Zhang, C.; Sridharan, H. Modeling land suitability/capability using fuzzy evaluation. GeoJournal 2014, 79, 167–182. [Google Scholar] [CrossRef]
- Nisar Ahamed, T.R.; Gopal Rao, K.; Murthy, J.S.R. GIS-based fuzzy membership model for crop-land suitability analysis. Agric. Syst. 2000, 63, 75–95. [Google Scholar] [CrossRef]
- Sicat, R.S.; Carranza, E.J.M.; Nidumolu, U.B. Fuzzy modeling of farmers’ knowledge for land suitability classification. Agric. Syst. 2005, 83, 49–75. [Google Scholar] [CrossRef]
- Hoseini, Y. Use fuzzy interface systems to optimize land suitability evaluation for surface and trickle irrigation. Inf. Process. Agric. 2019, 6, 11–19. [Google Scholar] [CrossRef]
- Servati, M.; Momtaz, H.R.R.; Rezaei, H. Land Suitability Evaluation in Hashtrood Region by Fuzzy Analytical Hierarchy Processes (FAHP) for Irrigated Chickpea. J. Soil Manag. Sustain. Prod. 2017, 7, 153–166. [Google Scholar] [CrossRef]
- Mahabadi, N.Y.; Soltani, S.M. Applicability of fuzzy and fuzzy analytic hierarchy process methods to determine the optimum soil depth in land suitability evaluation for irrigated rice. Polish J. Soil Sci. 2021, 54, 103–122. [Google Scholar] [CrossRef]
- Kurtener, D.; Torbert, H.A.; Krueger, E. Evaluation of agricultural land suitability: Application of fuzzy indicators. Lect. Notes Comput. Sci. (Incl. Subser. Lect. Notes Artif. Intell. Lect. Notes Bioinform.) 2008, 5072, 475–490. [Google Scholar] [CrossRef]
- Özkan, B.; Dengiz, O.; Turan, İ.D. Site suitability analysis for potential agricultural land with spatial fuzzy multi-criteria decision analysis in regional scale under semi-arid terrestrial ecosystem. Sci. Rep. 2020, 10, 22074. [Google Scholar] [CrossRef] [PubMed]
- Atijosan, A.; Muibi, K.; Ogunyemi, S.; Adewoyin, J.; Badru, R.; Alaga, A.; Shaba, A. Agricultural Land Suitability Assessment using Fuzzy Logic and Geographic Information System Techniques. Int. J. Sci. Res. Sci. Technol. 2015, 1, 113–118. [Google Scholar]
- Liaw, A.; Wiener, M. Classification and Regression by randomForest. R News 2002, 2, 18–22. [Google Scholar]
- Adam, E.; Mutanga, O.; Abdel-Rahman, E.M.; Ismail, R. Estimating standing biomass in papyrus (Cyperus papyrus L.) swamp: Exploratory of in situ hyperspectral indices and random forest regression. Int. J. Remote Sens. 2014, 35, 693–714. [Google Scholar] [CrossRef]
- Breiman, L. Random Forests. Mach. Learn. 2002, 45, 5–32. [Google Scholar] [CrossRef]
- Senagi, K.; Jouandeau, N.; Kamoni, P. Using parallel random forest classifier in predicting land suitability for crop production. J. Agric. Inform. 2017, 8, 23–32. [Google Scholar] [CrossRef]
- Taghizadeh-Mehrjardi, R.; Nabiollahi, K.; Rasoli, L.; Kerry, R.; Scholten, T. Land suitability assessment and agricultural production sustainability using machine learning models. Agronomy 2020, 10, 573. [Google Scholar] [CrossRef]
- Ogunde, A.O.; Olanbo, A.R. A web-based decision support system for evaluating soil suitability for cassava cultivation. Adv. Sci. Technol. Eng. Syst. 2017, 2, 42–50. [Google Scholar] [CrossRef]
- Shi, M.; Xu, J.; Liu, S.; Xu, Z. Productivity-Based Land Suitability and Management Sensitivity Analysis: The Eucalyptus E. urophylla × E. grandis Case. Forests 2022, 13, 340. [Google Scholar] [CrossRef]
- Lahssini, S.; Lahlaoi, H.; Alaoui, H.M.; Hlal, E.A.; Bagaram, M.; Ponette, Q. Predicting Cork Oak Suitability in Maamora Forest Using Random Forest Algorithm. J. Geogr. Inf. Syst. 2015, 7, 202–210. [Google Scholar] [CrossRef]
- Panigrahi, D.; Mohanty, P.K.; Acharya, M.; Senapati, P.C. Optimal utilisation of natural resources for agricultural sustainability in rainfed hill plateaus of Orissa. Agric. Water Manag. 2010, 97, 1006–1016. [Google Scholar] [CrossRef]
- Singh, R.K.; Rizvi, J.; Behera, M.D.; Biradar, C. Automated crop type mapping using time-weighted dynamic time warping-A basis to derive inputs for enhanced food and Nutritional Security. Curr. Res. Environ. Sustain. 2021, 3, 100032. [Google Scholar] [CrossRef]
- DOAFP (Odisha). “Odisha Agriculture Statistics 2013-14.” Directorate of Agriculture and Food Production, Government of Odisha. 2015. Available online: https://farmer.gov.in/imagedefault/handbooks/BooKLet/ODISHA/ (accessed on 10 August 2020).
- ICRAF. Enabling Smallholders in Odisha to Produce and Consume More Nutritious Food through Agroforestry Systems; ICRAF: Nairobi, Kenya, 2020. [Google Scholar]
- Akinci, H.; Özalp, A.Y.; Turgut, B. Agricultural land use suitability analysis using GIS and AHP technique. Comput. Electron. Agric. 2013, 97, 71–82. [Google Scholar] [CrossRef]
- Pamučar, D.; Stević, Ž.; Sremac, S. A new model for determiningweight coefficients of criteria in MCDM models: Full Consistency Method (FUCOM). Symmetry 2018, 10, 393. [Google Scholar] [CrossRef]
- Ivanco, M.; Hou, G.; Michaeli, J. Sensitivity analysis method to address user disparities in the analytic hierarchy process. Expert Syst. Appl. 2017, 90, 111–126. [Google Scholar] [CrossRef]
- Doddabasawa; Chittapur, B.M.; Murthy, M.M. Structural analysis and mapping of agroforestry systems under irrigated ecosystem in north-eastern part of Karnataka, India. Agrofor. Syst. 2019, 93, 1701–1716. [Google Scholar] [CrossRef]


| Class | No. of Points | Species |
|---|---|---|
| Agroforestry Single species | 142 | Eucalyptus, Mango, Mahua, Teak |
| Agroforestry Mixed species | 58 | Teak, Gamahari, Khajur, Mahua, Chahar, etc. |
| Criteria | Variables | Unit | Agroforestry Classes/Fuzzy Scale for Continuous Data | Data Sources | |||
|---|---|---|---|---|---|---|---|
| Very High | High | Moderate | Low | ||||
| Soil | Soil type | Code | Fine loamy, clayey | Fine mixed | Course loamy | Clay sandy, Sandy | NBSS & LUP |
| Sandy loam | |||||||
| Depth | Mod deep | Mod shallow | Shallow | - | |||
| Texture | Fine | Fine to course | Course | - | |||
| Soil drainage | Very well | Well | Mod well | - | |||
| pH | −log(H+) | 6.5–7.5 | 5.5–6.5 | 7.5–8.5 | - | ||
| Topography | Slope | Degree | Sigmoidal decreasing | Alos PalSAR | |||
| Climate | Annual Mean Temperature | °C | Monotonically increasing linear | Worldclim | |||
| Annual Min. Temperature | |||||||
| Annual Max. Temperature | |||||||
| Rainfall | mm | Sigmoidal increasing | CHIRPS | ||||
| Socioeconomic | Distance from forest | meter | Monotonically decreasing linear | LULC | |||
| Distance from settlement | |||||||
| Distance from waterbody | |||||||
| Distance from cropland | |||||||
| Distance from road | Odisha Space Application Center (ORSAC) | ||||||
| LULC Classes | Criteria Table | |||
|---|---|---|---|---|
| LULC | Interventions | Species | Examples | |
| Agricultural land | (a) Double crop: Paddy-Pulses | Bund plantation | Fruit and wood (teak) plantation | Apple Ber Teak and Bamboo |
| (b) Single Crop: Paddy-Fallow | Intercropping and Bund plantation | Bund plantation-Wood plantation | Apple Ber Teak and Bamboo | |
| (c) Single Crop: Cotton-Fallow | Intercropping and Bund plantation | Intercropping-Orchard plantation | Intercropping with Mango with Cotton | |
| Built-up | Settlement areas | Home garden | Fruit and multipurpose plantation | Orchard, Amla, Lemon |
| Wasteland | Wasteland | Block/bulk plantation | Bamboo plantation | Bamboo |
| Sl. No. | Factors | Variable Importance | Relative Weight |
|---|---|---|---|
| 1 | Soil type | 1.06 | 0.01 |
| 2 | Depth | 3.41 | 0.05 |
| 3 | Texture | 2.27 | 0.03 |
| 4 | Drainage | 0.78 | 0.01 |
| 5 | pH | 2.38 | 0.03 |
| 6 | Slope | 0.85 | 0.01 |
| 7 | Mean temperature | 2.74 | 0.04 |
| 8 | Minimum temperature | 4.36 | 0.06 |
| 9 | Maximum temperature | 3.14 | 0.04 |
| 10 | Rainfall | 0.73 | 0.01 |
| 11 | Distance from settlement | 6.04 | 0.08 |
| 12 | Distance from road | 21.29 | 0.28 |
| 13 | Distance from water | 1.57 | 0.02 |
| 14 | Distance from cropland | 23.05 | 0.31 |
| 15 | Distance from forest | 1.03 | 0.01 |
| Classes | Interventions | LULC Area (ha) | Class Area (ha) | Class Area (%) | ||||||
|---|---|---|---|---|---|---|---|---|---|---|
| Low | Mod | High | Very High | Low | Mod | High | Very High | |||
| Double crop: Paddy-pulses | Bund and boundary plantation | 7311.4 | 6.56 | 10.31 | 692.47 | 6602.06 | 0.09 | 0.14 | 9.47 | 90.3 |
| Single crop: Paddy-fallow | Intercropping and Bund and boundary Plantation | 20,702.76 | 12.25 | 17.42 | 1650.21 | 19,022.88 | 0.08 | 0.06 | 7.97 | 91.89 |
| Single crop: Cotton-fallow | Intercropping and Bund and boundary plantation | 9970.14 | 10.05 | 7.18 | 927.08 | 9025.83 | 0.1 | 0.07 | 9.3 | 90.53 |
| Settlement | Home garden | 915.43 | 0.13 | 1.51 | 85.21 | 828.58 | 0.01 | 0.17 | 9.31 | 89.52 |
| Wasteland | Block/bulk plantation | 2823.98 | 1.91 | 4.74 | 289.27 | 2528.06 | 0.07 | 0.17 | 10.24 | 89.96 |
Publisher’s Note: MDPI stays neutral with regard to jurisdictional claims in published maps and institutional affiliations. |
© 2022 by the authors. Licensee MDPI, Basel, Switzerland. This article is an open access article distributed under the terms and conditions of the Creative Commons Attribution (CC BY) license (https://creativecommons.org/licenses/by/4.0/).
Share and Cite
Singh, R.K.; Behera, M.D.; Das, P.; Rizvi, J.; Dhyani, S.K.; Biradar, Ç.M. Agroforestry Suitability for Planning Site-Specific Interventions Using Machine Learning Approaches. Sustainability 2022, 14, 5189. https://doi.org/10.3390/su14095189
Singh RK, Behera MD, Das P, Rizvi J, Dhyani SK, Biradar ÇM. Agroforestry Suitability for Planning Site-Specific Interventions Using Machine Learning Approaches. Sustainability. 2022; 14(9):5189. https://doi.org/10.3390/su14095189
Chicago/Turabian StyleSingh, Raj Kumar, Mukunda Dev Behera, Pulakesh Das, Javed Rizvi, Shiv Kumar Dhyani, and Çhandrashekhar M. Biradar. 2022. "Agroforestry Suitability for Planning Site-Specific Interventions Using Machine Learning Approaches" Sustainability 14, no. 9: 5189. https://doi.org/10.3390/su14095189
APA StyleSingh, R. K., Behera, M. D., Das, P., Rizvi, J., Dhyani, S. K., & Biradar, Ç. M. (2022). Agroforestry Suitability for Planning Site-Specific Interventions Using Machine Learning Approaches. Sustainability, 14(9), 5189. https://doi.org/10.3390/su14095189