1. Introduction
Sustainability has grown since its definition by the World Commission on Environment and Development in 1987 [
1]. This worry has been transmitted to developers in some social sectors. However,
Sustainable Development Goals were not defined until 2015 as a response to the social demand related to environmental impact [
2].
Three main pillars define this sustainability concept. The most studied is the economic one. This pillar is related to the cost associated with one process, product, or service and has been the traditional choice criterion for deciding between alternatives. The second is the environmental pillar, related to the impact on the environment. Finally, the social pillar completes the sustainability profile. This part assesses how the society stakeholders are affected by one process, product, or service.
As stated before, the most studied sustainability criterion has been the economic impact. Researchers have been carrying out different studies to reduce the economic impact of their projects. The primary method of reducing the economic impact carried out by researchers has been through optimization techniques. This method has been applied extensively in construction sector elements, such as reinforced concrete bridge piers [
3], concrete road vaults [
4], buttressed walls [
5,
6] or facades [
7], among others. Other authors have applied different techniques to reach sustainable solutions considering other criteria besides the cost [
8,
9]. To evaluate the environmental impact of construction processes, researchers have been studying the life cycle assessment (LCA) of different construction activities [
10,
11,
12,
13] due to its contribution to the total carbon emissions to the environment [
14,
15]. This industry’s high impact is due to its cement requirements, which represent 5% of the global CO
2 emissions contribution [
16]. As a consequence, construction substantially impacts environmental pollution [
17]. Moreover, if the focus is on the sustainability assessment of the social pillar, there is a lack of study in comparison with the economic or the environmental pillars [
18,
19].
Researchers state that the lack of knowledge in the social assessment pillar is due to the ambiguity in the definition of the sustainability criteria related to social impact [
18,
20]. Nevertheless, the United Nations have set aside 6 of its 17 sustainable development goals for this part of sustainability. This marks a clear trend for public agencies to consider the social pillar an essential part of the overall sustainability analysis. As a response to this demand, there is a recent trend in studying the social assessment to give it the same importance as the study of economic and environmental sustainability [
19,
21].
Construction projects’ social sustainability assessment has an additional complication due to its stakeholder’s situation [
19]. Regarding social demands for the construction sector, this must satisfy not only the clients or the employees, but also the industry and community users’ needs [
22]. Furthermore, the final product obtained must consider the impact on future and present generations, considering the health and safety of the implied agents in the process [
23].
One of the most representative infrastructures of the constructions sector is bridges. Because of this, researchers have been developing different studies to assess its sustainability [
24]. As stated in Martínez-Muñoz et al. [
25] the central part of sustainability studies is focused on concrete bridges. This study also advises a lack of study in environmental and social LCA of composite bridges. A recent environmental LCA study focused the scope on the comparison of concrete and steel–concrete composite bridge (SCCB) alternatives [
26]. This study states that the percentage of recycled steel is crucial for the feasibility of SCCBs from an environmental point of view and presents SCCBs as an eco-friendly alternative for bridge design. Despite this, no LCA has yet been carried out that considers the social impact of SCCB. Some researchers have carried out different studies assessing different criteria for social assessment, such as noise, dust, and time [
27,
28,
29].
This study aims to assess the social feasibility of SCCBs compared with concrete bridges, using the LCA methodology. To reach this goal, four alternatives of bridges have been proposed for the comparison: prestressed concrete solid slab (PCSS), prestressed concrete lightened slab (PCLS), prestressed concrete box-girder (PCBG), and steel–concrete composite box-girder (CBG). A parametric study considered span lengths between 15 and 40 m to allow a broader comparison. Both environmental and social LCAs have been modeled for each span length to compare the results between both evaluations. Different steel recycling rates have been proposed for CBG alternatives to assess the relevance of the steel recycling process in SCCBs social LCA. The steel recycling rate is contingent upon the process of manufacturing the steel. The two main processes available to produce steel are basic oxygen furnace (BOF) and electric arc furnace (EAF). This process combines the iron with steel scrap obtained from the steel recycling process. The amount of steel scrap is between 90% and 100% for EAF and 10% and 30% for BOF. Modifying the BOF and EAF for steel production can model different manufacturing processes and, consequently, different steel recycling amounts. This difference in manufacturing processes is directly linked to the differences between countries’ steel production and technological development. This justifies the usefulness of this study to compare the impact of different bridge alternatives and their feasibility considering several steel manufacturing processes. With all of the above, the objective of this study is to compare different concrete and composite bridge solutions from the environmental and social impact points of view and, in addition, how the steel recycling ratio variation modifies the contribution of composite bridges to these impacts.
2. Materials and Methods
The life cycle analysis (LCA) methodology consists of modeling a process, product, or service, and assessing the contribution of every activity to the environment or the society, among others. All activities must be included since the raw material is extracted until the product finishes its service life to model the principal activity. This study conducted two assessments: the environmental life cycle assessment (E-LCA) and the social life cycle assessment (S-LCA). The methodology applied in this study follows the ISO 14040:2006 [
30] that describes the process to carry out the environmental analysis. It comprises four stages to obtain the assessment: goal and scope definition, inventory analysis, impact assessment, and interpretation of the results. For assessing the social impact, the most common guide is followed [
31]. The life cycle impact assessment (LCIA) chosen for this research is the recipe 2008 method [
32] for E-LCA and the social impacts weighting method for S-LCA. The selected databases for modeling are ecoinvent v3.7.1 and SOCA v2 to E-LCA and S-LCA, respectively.
The LCA methodology allows converting the data introduced from the life cycle inventory to impact and damage categories that help understand how the process affects specific indicators. The life cycle impact assessment (LCIA) methods are responsible for carrying out this transformation. With the information extracted from the models, the actors involved in the decision process between solutions can compare them to make their decision.
2.1. Goal and Scope Definition
This research poses two primary goals. The first one compares different bridge deck alternatives from environmental and social points of view. The second is related to the feasibility of these various alternatives between the environment and the social perspective. All bridge decks were considered as continuous beams so that the span length represents the highest of every span. This research considered six span lengths between 15 m and 40 m, increasing five meters from the initial to the final distance. The LCA method allows quantifying the impact of every deck solution objectively and comparing them. As stated by the bridges of Pang et al. [
33], the LCA analysis is helpful for three main purposes: comparison between designs options, comparison between different bridge materials alternatives, and assessment of new materials compared with traditional ones. All the other options must be similar in load, width, and location to compare accurately. This last criterion is crucial because if not met, the geotechnical or seismic conditions could change and, therefore, the design requirements of the bridge. The same location is considered for every bridge deck alternative to compare bridge decks.
2.1.1. Bridge Deck Type Definition
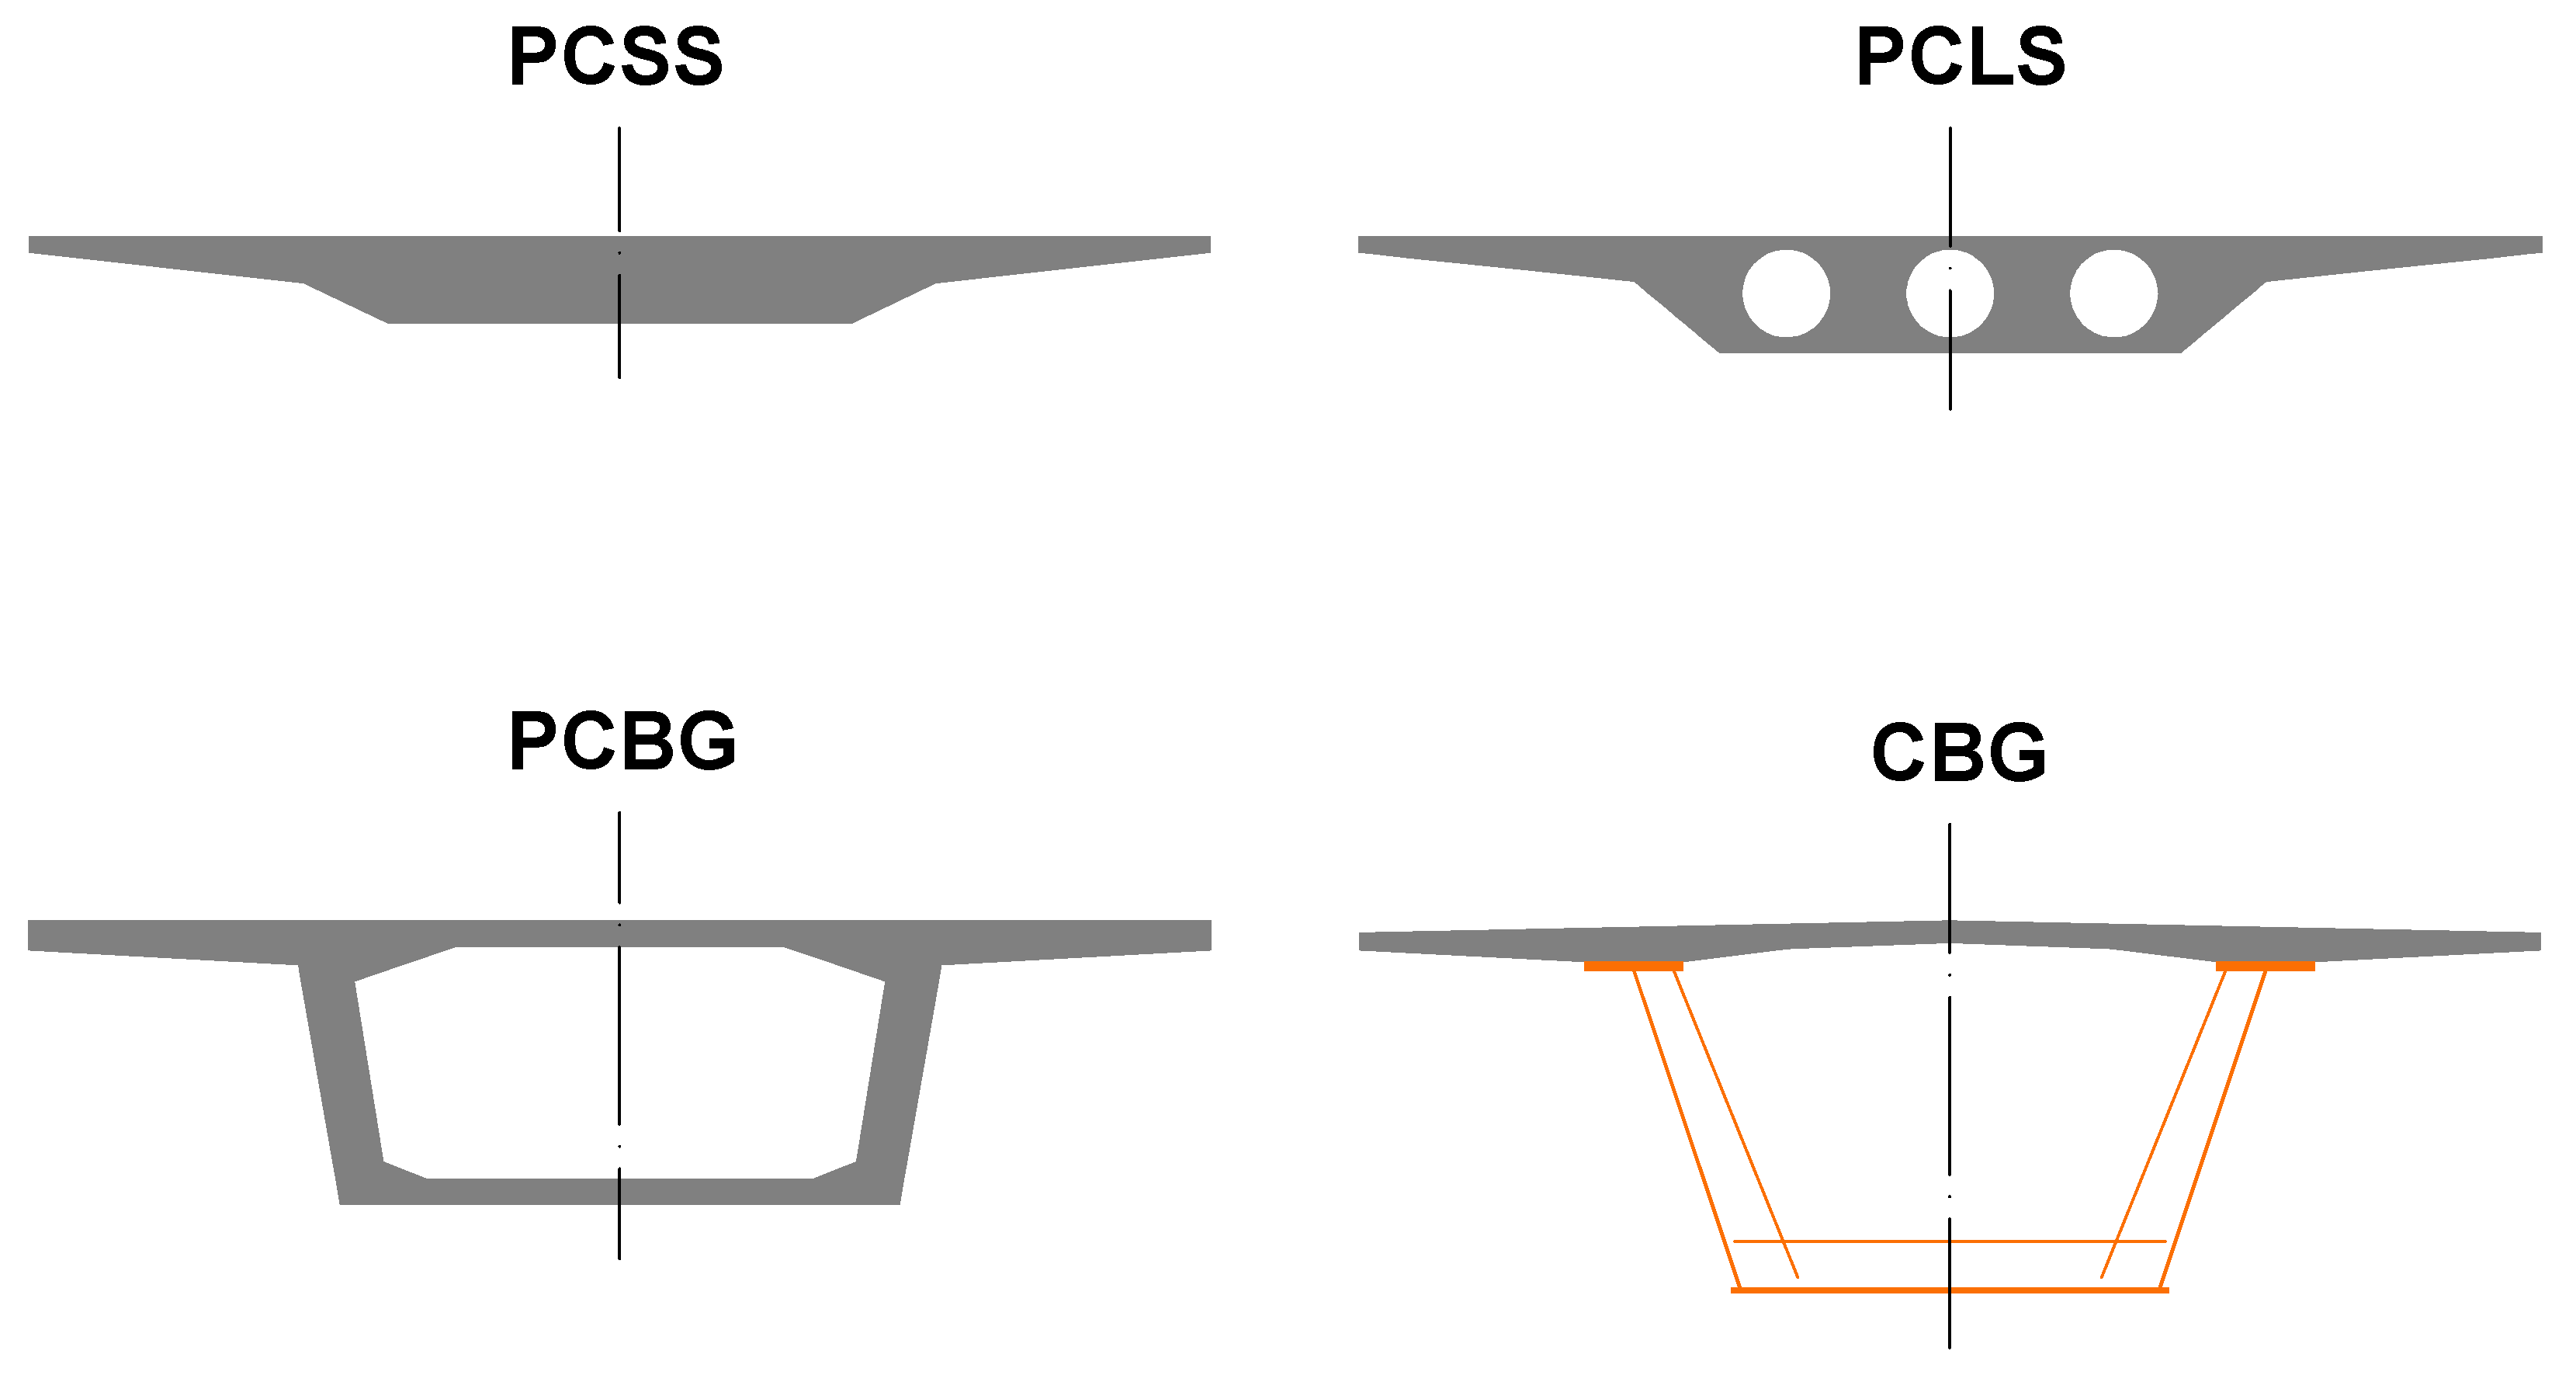
The structural beam system is one of the most common bridge types due to its simplicity and economic feasibility. The most crucial part of this type of bridge is the deck since it is responsible for resisting all the stresses associated with the acting loads. The choice of the deck type depends on different factors, such as constructability, aesthetics, or economy, among others. The bridge decks chosen are the same as those in the work of Martínez-Muñoz et al. [
26]: prestressed concrete solid slab (PCSS), prestressed concrete lightened slab (PCLS), prestressed concrete box-girder (PCBG), and composite box-girder (CBG). In
Figure 1, the standard geometry of these deck types is represented.
Its economic feasibility has defined traditional bridge deck type choosing. Considering this, PCSS and PCLS slabs have been applied in ranges between 15 m and 35 m. On the other hand, the box-girder bridges’ scope of use is defined between 25 m and 125 m, its regular use being from 35 m to 80 m. Concrete and steel are the most common materials used for box-girder alternatives. In this case, PCBG is made from prestressed concrete, such as slab-type alternatives. The primary material is concrete and steel to solve concrete tensile strength problems in these alternatives.
On the contrary, the CBG alternative is mainly made of a rolled steel beam to which a concrete slab is added on the upper part. This last alternative design concept is to locate every material in the zones that are more resistant, i.e., concrete in the areas with compressed fibers and steel in the areas with tensioned ones. As described before, two slab and two box-girder decks were selected. This study aims to provide several alternatives for environmental and social impact assessment to give designers information on which option is better in terms of the span length.
2.1.2. Phases of the Analysis
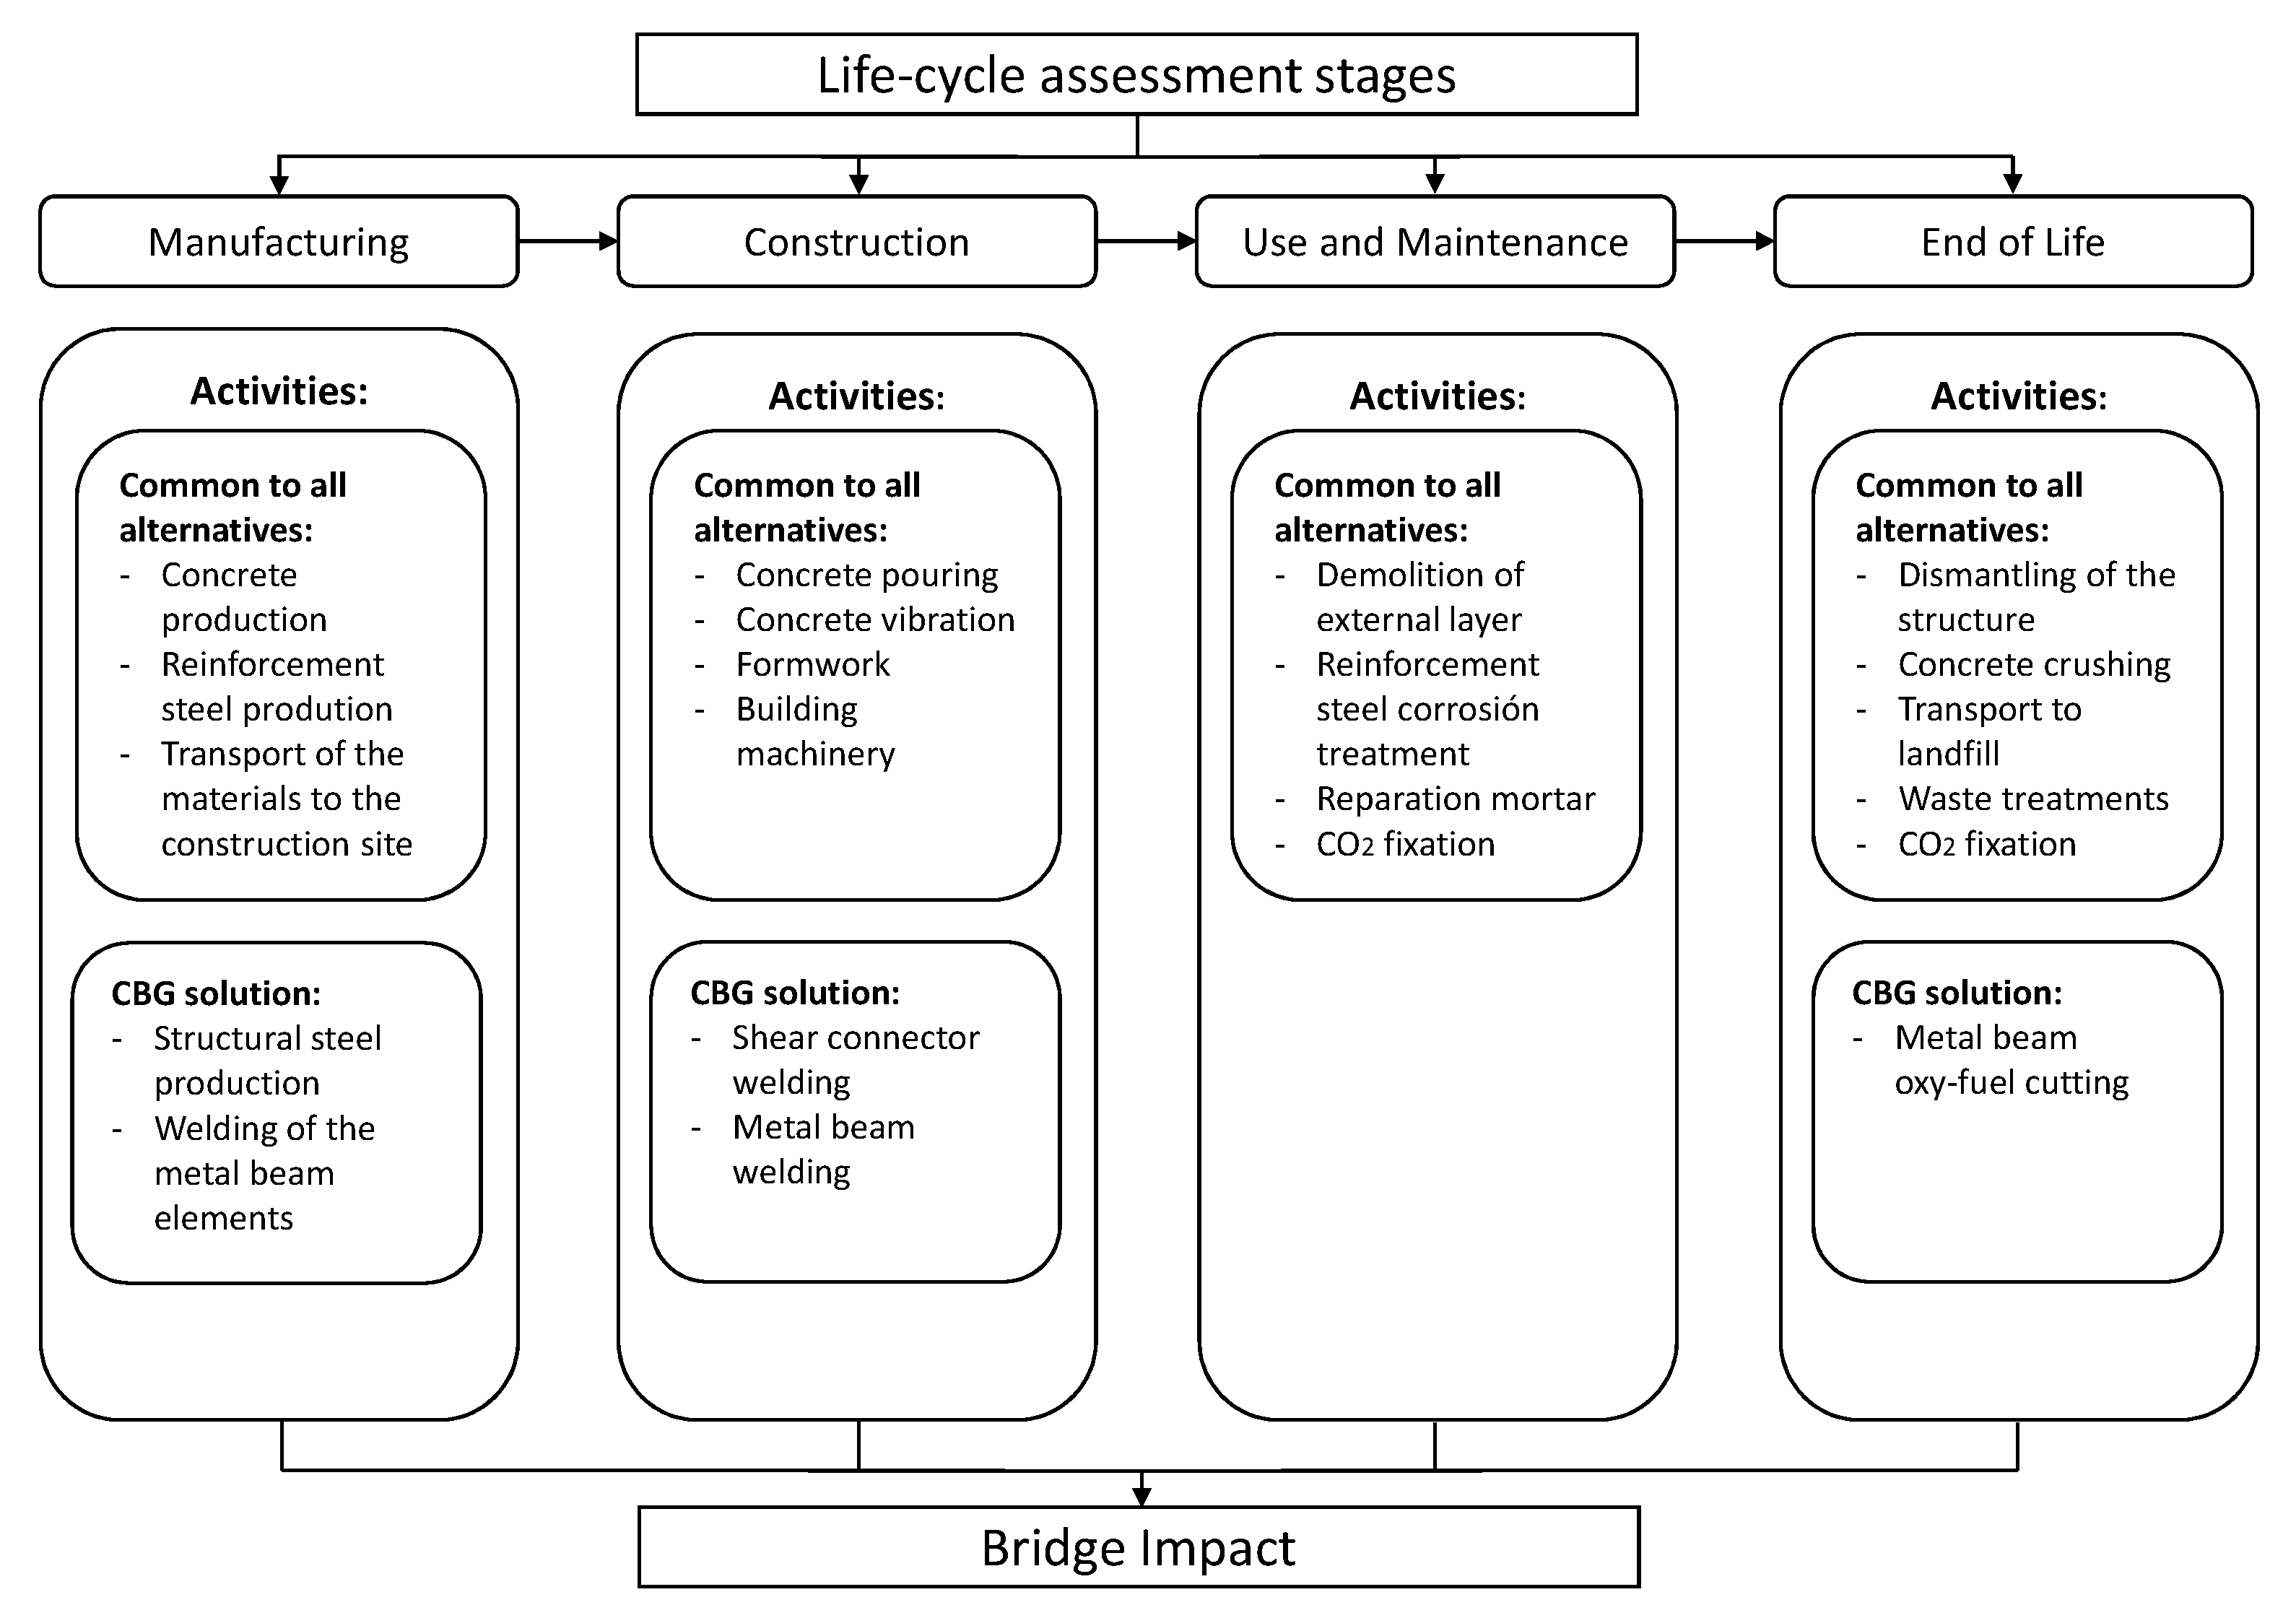
To consider a complete bridge LCA, it is defined in four stages. These stages consider all the activities necessary from the starting design to the final structure service life. These processes consider the manufacturing of the materials, the bridge construction, its maintenance, and its demolition and transportation of the materials to landfills. To view all this information, the structure of the LCA model considers the following stages: manufacturing, construction, use and maintenance, and end of life. This LCA follows the format of other bridge LCA studies [
21,
26].
Manufacturing
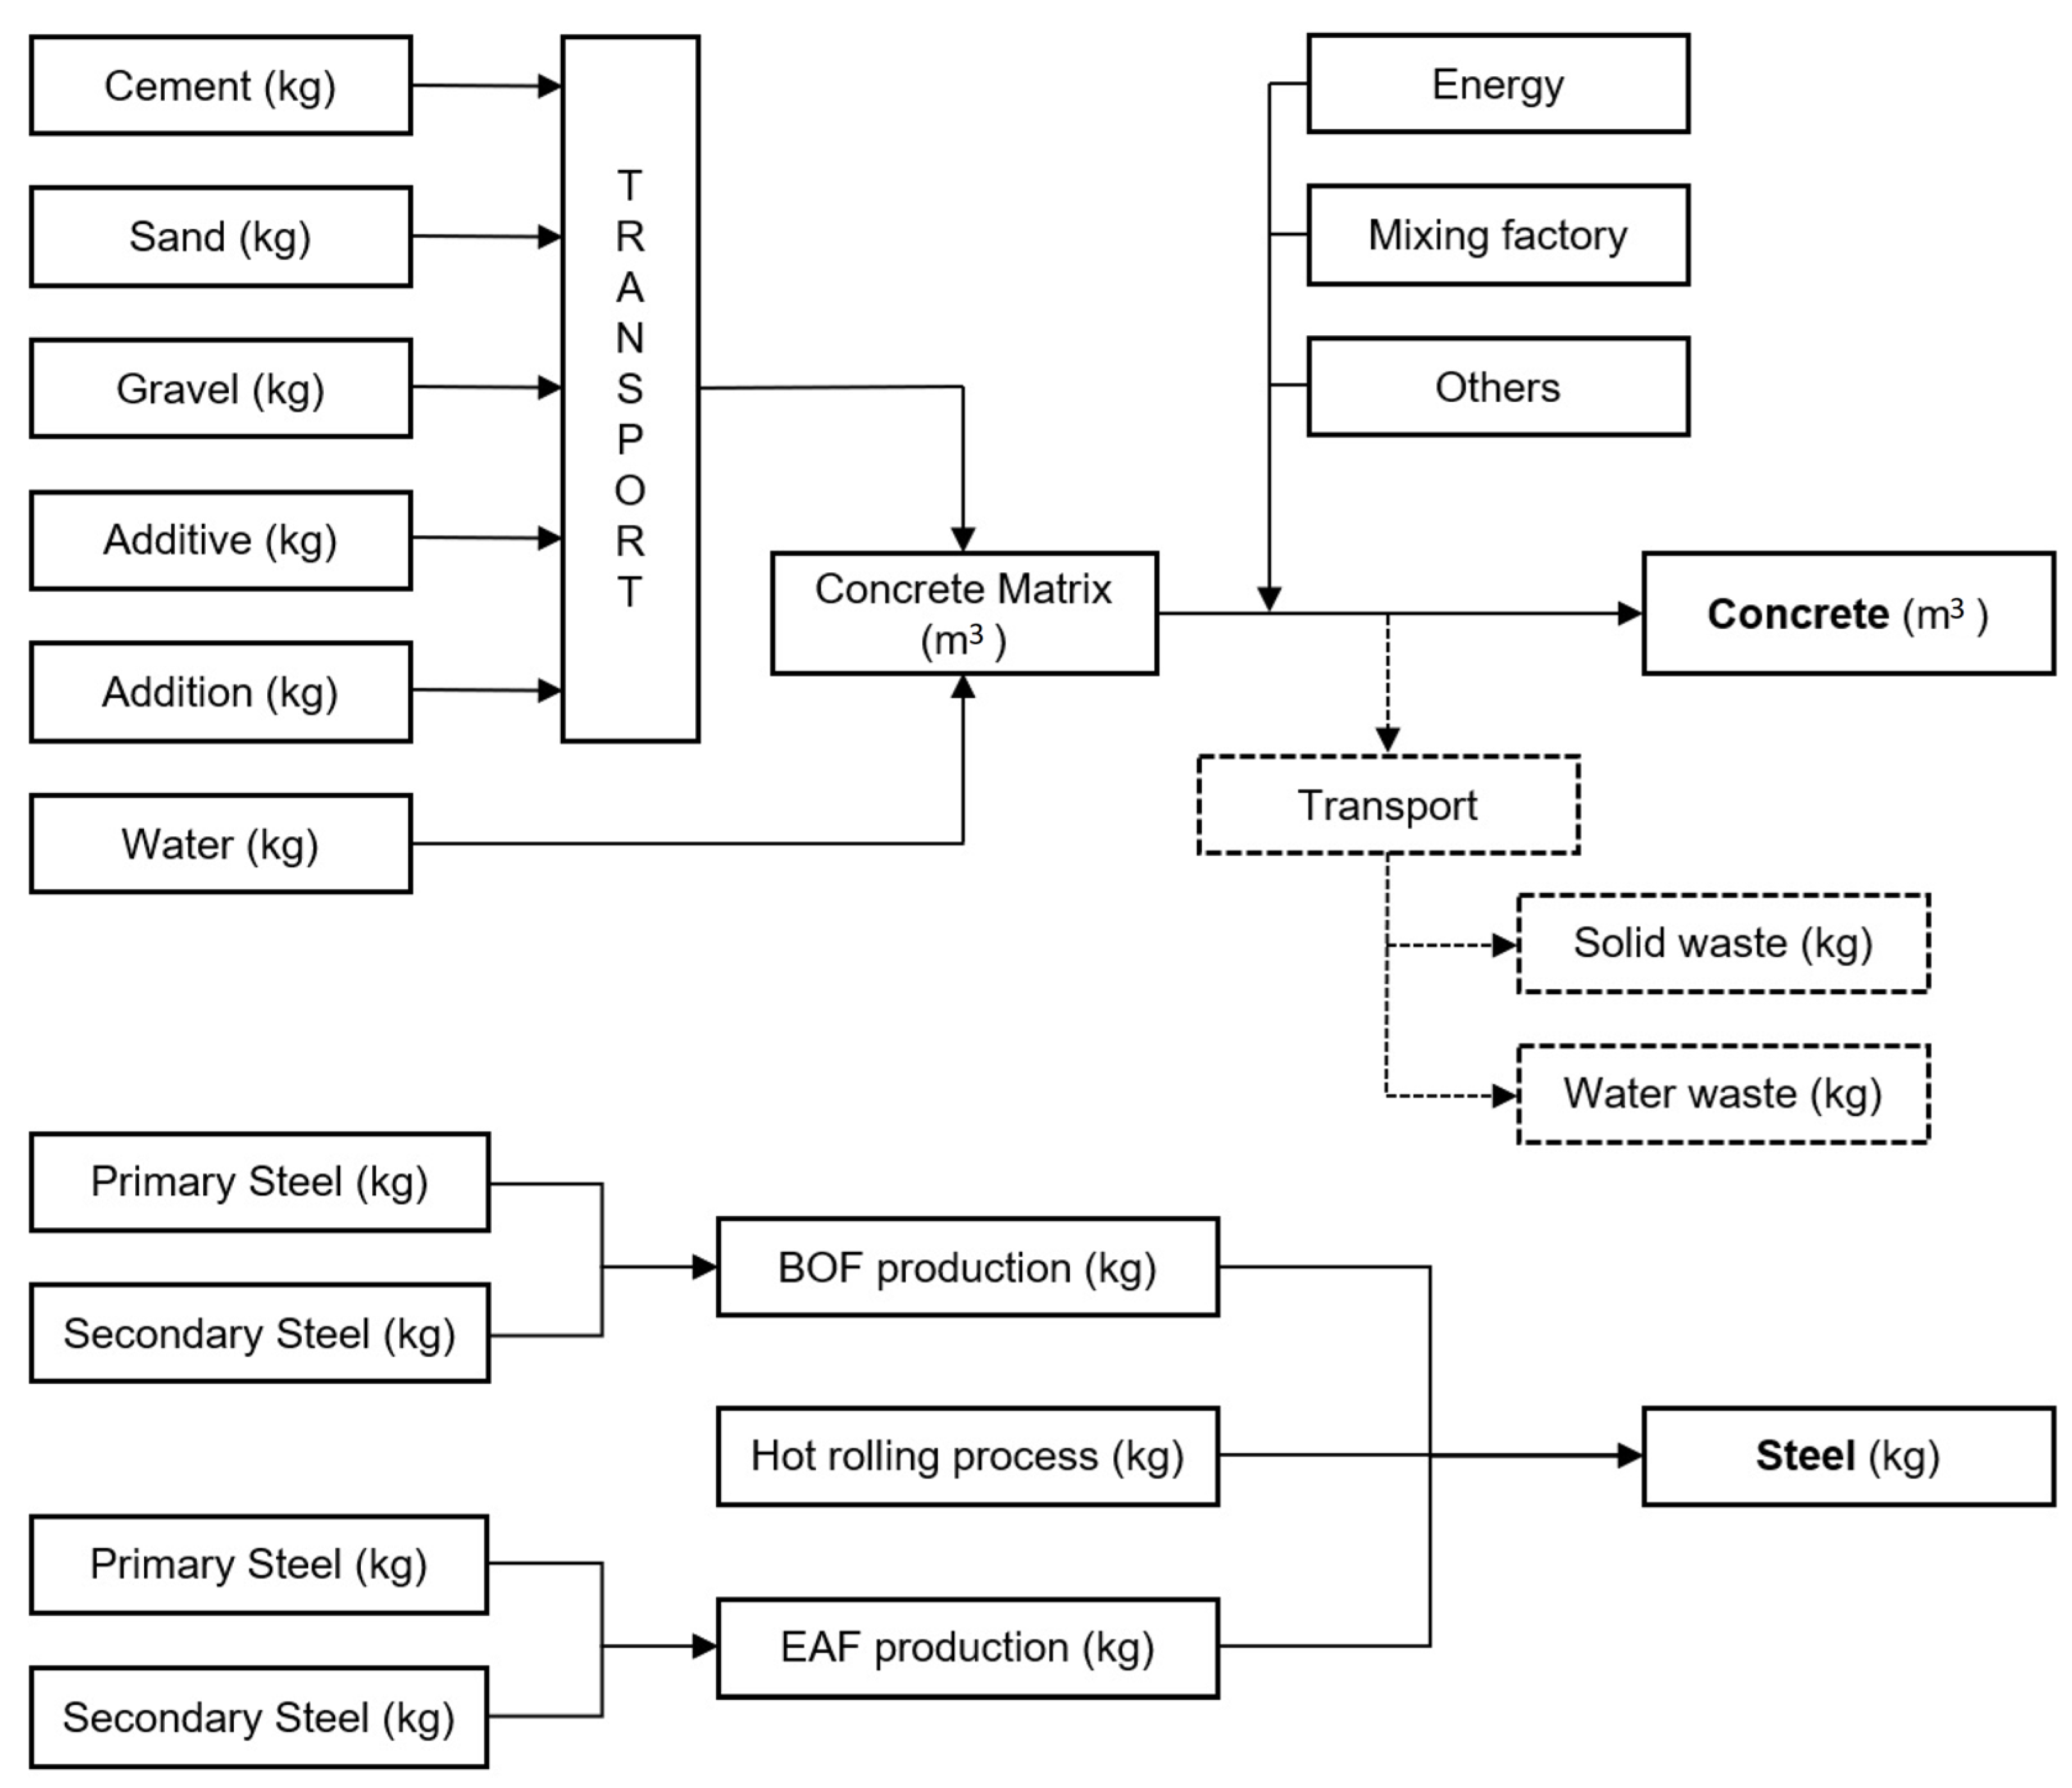
This stage includes all processes from the raw material extraction to the final building materials on the construction site. The most used materials in the construction industry are concrete and steel. Because of this, databases include processes that allow the introduction of these materials to the model. In this study, those processes are defined, adding the raw materials and determining the dosage. This process is described in
Figure 2.
The concrete matrix is composed mainly of cement, sand, gravel, and water. In addition, additives and additions can be added to the concrete matrix to give the concrete specific properties. Furthermore, the distance between the extraction site of every material must be added to the model. The final process includes the concrete matrix and the energy, the mixing factory, and the activities necessary to make one cubic meter of the modeled concrete to simulate the concrete mixing.
Marceau et al. [
34] state that for one cubic meter of concrete production, there is 24.5 kg of material waste, and the wastewater is 0.0348 m
3. To consider both the final concrete and the debris associated with the production, the exact amount of each material is defined by Equations (
2)–(
5) [
26].
The two main processes available to produce steel are basic oxygen furnace (BOF) and electric arc furnace (EAF). This process combines the iron with steel scrap obtained from the steel recycling process. The amount of steel scrap is between 90% and 100% for EAF and 10% and 30% for BOF [
35]. The use of recycled steel directly affects the sustainability of the alternative, and as a consequence, the EAF and BOF impacts give different results. Modifying the BOF and EAF for steel production can model other manufacturing processes and, consequently, different steel recycling amounts. This difference in manufacturing processes is directly linked to the differences between countries’ steel production and technological development. The BOF and EAF waste are considered in the database processes.
The percentage of recycled steel is essential for SCCBs due to the significant steel needed for its construction. Slight variations in the recycling rate give substantial differences in the SCCBs impact. From this point of view, it is essential to distinguish between hot rolled and rebar steel. Consequently, a percentage of 71% is considered for reinforcement bars, and 98% for hot rolled steel [
36]. This difference rate is due to the difficulty separating reinforcement bars steel from the concrete. Consequently, the steel scrap obtained from the reinforcement bars steel is lower.
Construction
The construction stage considers all the necessary processes to make the deck, considering the auxiliary elements and machinery, which depend on the bridge placement and type of construction. These processes are included in this LCA phase. In the SCCB case, welding processes are introduced. The construction method is modeled by considering the diesel consumption of the machinery obtained from the manufacturers’ data, the literature, or other databases.
Use and Maintenance
This stage encompasses all the processes necessary throughout the bridge life. These processes can be classified into three different categories: maintenance activities, CO2 fixation, and traffic detour. To make this maintenance work, sometimes bridge closure is needed. In this case, it implies a traffic detour, and as a consequence, an increase in the distance required to reach the same location generates a higher impact. This impact is affected by different factors, such as the location of the traffic type.
The maintenance phase can be managed in two different ways. Researchers have been reviewing different maintenance possibilities [
10,
11,
37]. In other studies, different scenarios have been assessed to evaluate its sustainability [
33]. If the bridge’s closure is needed, the closure time is defined. Processes required for maintenance depend on the bridge material. For example, if the steel selected is not corrosion-resistant in steel bridges, the maintenance operations must be repeated many times. These activities include removing the external layer and replacing them with a reparation mortar for concrete bridges. In this study, maintenance operations, including auxiliary machinery, materials, diesel consumption, and emissions due to traffic detours, are considered.
Some studies state that concrete fixes CO
2 during its carbonation process [
38,
39,
40]. Carbonation significantly affects reinforced concrete bridges, and three main factors determine it [
41]: the
ratio, the concentration of CO
2 in the environment, the climate conditions, and the steel depth. Carbonation produces passivation loss of reinforcement bars, reducing the impact on the environment. Lagerblad et al. [
42] researched CO
2 fixed by carbonation during the life cycle based on Fick’s first law. Equation (
6) allows to calculate the fixed CO
2 in which
k is the carbonation coefficient,
t is the service life,
A is the exposed area of concrete,
r is the ratio of CaO that is going to become carbonated,
C is the content of cement in one cubic meter of concrete,
k is the content of clinker in the cement,
L is the content of CaO in the clinker, and
is the molecular weight ratio of
. This equation is simplified by grouping the constants. Lagerblad et al. [
42] consider that
r takes the value of 0.75,
L of 0.65 and assume that
takes the value of 0.7857. Clearing out the equation with these constants, the expression changes to (
7). Concrete structures can fix CO
2 along its service life [
41].
End of Life
This phase includes all processes needed to dismantle the bridge. The principal method is demolishing the system, landfill transport, and waste treatment. Consequently, these processes are modeled by transportation distances and specific machinery. There are three main possibilities for materials waste: reuse, recycle or transportation to a landfill. In this research, concrete and steel are the most commonly used materials. This waste processing will depend on the needs of society in every case.
Many researchers have studied the steel recycling ratio. Hammervold et al. [
37] considered a 100% steel recycling ratio, and other authors such as Du et al. [
11] and Hettinguer et al. [
43] considered a lower value. Penadés-Plà et al. [
13] considered the Spanish average steel recycling ratio, 71%. The steel recycling ratio is associated with the construction location. It is possible to adjust the evaluation of the steel by controlling the recycling ratio in the LCA model.
The Spanish concrete regulation allows using 20% of concrete recycled coarse aggregates in new concretes [
44]. Different concrete recycling rates are defined [
10,
11,
43]. As described before, the concrete carbonation process always occurs. If all the concrete is crushed, the full concrete carbonation is produced due to the accessible surface increase [
41]. The concrete carbonation coefficient depends on the concrete’s strength [
42]. In this study, two concrete strengths, 30 and 40 MPa, are considered. The carbonation coefficients (
k) are 1.5 mm/year
0.5, 4 mm/year
0.5, 6 mm/year
0.5, 0.75 mm/year
0.5 and 1 mm/year
0.5, depending on whether the concrete is exposed, sheltered, indoors, wet or buried for 30 MPa concrete strength, and 1 mm/year
0.5, 2.5 mm/year
0.5, 3.5 mm/year
0.5, 0.5 mm/year
0.5 and 0.75 mm/year
0.5 for 40 MPa concrete strength. The crushed concrete maximum aggregate size is assumed to have a 10 mm diameter.
2.1.3. Functional Unit
This research considered a square meter as the functional unit to compare bridge deck alternatives. Different bridge locations can produce other impacts due to the placement conditions regarding geotechnical properties and seismicity. Moreover, the material’s production processes can be different.
2.2. Inventory Analysis
The inventory analysis consists of collecting data on materials and energy consumption to model the processes of the bridge life cycle. This study case takes the square meter of the bridge as a functional unit. These processes produce output in terms of emissions to the environment. The consideration of the production of every process gives the environmental impact associated with the product that is being assessed.
Software
The software used to model the bridge’s life cycle is OpenLCA from GreenDelta. This is an open-source program that allows LCA models to create and run. This was used extensively by the researcher’s community [
45].
This study has used two databases. The first one is the ecoinvent database [
46], version 3.7.1. This database is constantly updating and very reliable from the scientific point of view [
47]. Data given by the ecoinvent database are related to the environmental impact of processes. On the other hand, the social database used for this research is SOCA, version 2. This database takes data from PSILCA social database and assigns the processes in the ecoinvent 3.7.1 database their corresponding social impact. This allows researchers to use the ecoinvent database to model the social implications of their studies efficiently. The life cycle impact assessment (LCIA) chosen for this research is the recipe 2008 method [
32] for E-LCA and the social impacts weighting method for S-LCA. The selected databases for modeling are ecoinvent v3.7.1 and SOCA v2 to E-LCA and S-LCA, respectively.
Table 1 encompasses all the information about the databases, the LCIA methods used, the impact categories, and the damage categories. The impact categories give a more detailed view of various specific indicators. However, the damage categories group these indicators and show a more widespread impact. In this study, damage categories are used to compare the different alternatives to conclude. In
Table 1, the environmental assessment gives a result of three damage categories related to the impact on the ecosystems, the human health, and resources, while the social evaluation shows the implications associated with four different stakeholders: local community, society, value chain actors, and workers.
2.3. Bridge Deck Design
Table 2 shows the amounts of materials determined by each deck type and span length. These amounts were taken from the study of Martínez-Muñoz et al. [
26]. In this study, the quantity of materials was obtained from Yepes et al. [
48] for PCSS and PCLS alternatives. In contrast, for PCBG and CBG ones, the data were taken by applying the criteria defined in the Spanish Ministry of Public Works named “Obras de paso de nueva construcción” [
49].
Table 3 shows the material amount for the concretes considered in this research. The concrete decks are designed with C40/50 prestressed concrete, while for the CBG bridge deck, C30/37 reinforced concrete is considered. The most significant is the CBG alternative, where the structural steel beam that supports the slab is added.
As usual in bridge LCA modeling, four stages are considered for the life cycle model. The processes considered for the E-LCA modeling were collected from the ecoinvent database. The diesel consumption of machinery generated those processes that are not included in the database. For S-LCA, the database chosen is SOCA due to the ecoinvent processes PSILCA database social assessment addition.
2.3.1. Manufacturing
All the activities needed to manufacture materials are considered in the production phase. In addition, the transport is included, considering 30 km for concrete and 150 km for steel. The original ecoinvent database process considered concrete of the 30 MPa process. The 40 MPa concrete process is introduced following the description in
Figure 2.
Steel manufacturing is produced differently for modeling reinforcement bar and hot rolled steel. Ecoinvent database considers 19% of steel scrap for the BOF process and 100% for the EAF. Modifying these processes, a specific steel recycling ratio can be considered. Consequently, a 71% steel recycling ratio is modeled for reinforcement bars, while for hot rolled steel, two different recycling ratios are determined. Those ratios are 71% (CBG_71) and 98% (CBG_98). This rate difference is modeled to consider different countries’ materials reuse. In countries with lower developments, the reuse policies are less strict [
50].
Furthermore, the SCCB deck welding of the steel sheets is modeled. This is considered by using the ecoinvent database’s process.
2.3.2. Construction
Bridges building is modeled as on-site. The processes contemplated in this phase are concrete pouring, vibration and assembling of the different parts of SCCB alternatives and, furthermore, in concrete solutions, the tension of the active reinforcement steel. The auxiliary elements are modeled by introducing the diesel consumption data from the Bedec database [
51]. The diesel consumption is 123.42 MJ of energy per cubic meter of concrete and 10.2 MJ per kg of active reinforcement steel [
26]. The CO
2 emissions are 32.24 kg and 2.62 kg, respectively. The concrete selected does not have unique curation processes.
2.3.3. Use and Maintenance
Traffic detours are not considered necessary at this stage. Only the concrete needs repairs on activities because the steel chosen does not require maintenance activities. The machinery for the upkeep is estimated considering two different periods of actuation. The machinery consumption contemplated in this life cycle phase is 584.28 MJ, and the CO
2 emissions are 46.58 kg of CO
2 per square meter repaired [
26].
2.3.4. End of Life
In this stage, all demolition and transport to landfill processes are considered in the LCA model. The machinery needed for the deconstruction is considered for the concrete elements. In addition, the crushing process is considered to assume the full carbonation of concrete. On the other hand, only landfill transportation is modeled. The recycling process of steel is reflected in the manufacturing process. For SCCBs alternatives, steel sheet cutting is introduced.
2.4. Impact Assessment
The impact assessment results depend on the LCIA method chosen. LCIA methods transform from specific resources consumption and emissions to indicators. This transformation allows designers and researchers to understand the impact of activities better. As described in
Section 2.2, two LCIA methods are chosen for both E-LCA and S-LCA evaluations. As described in
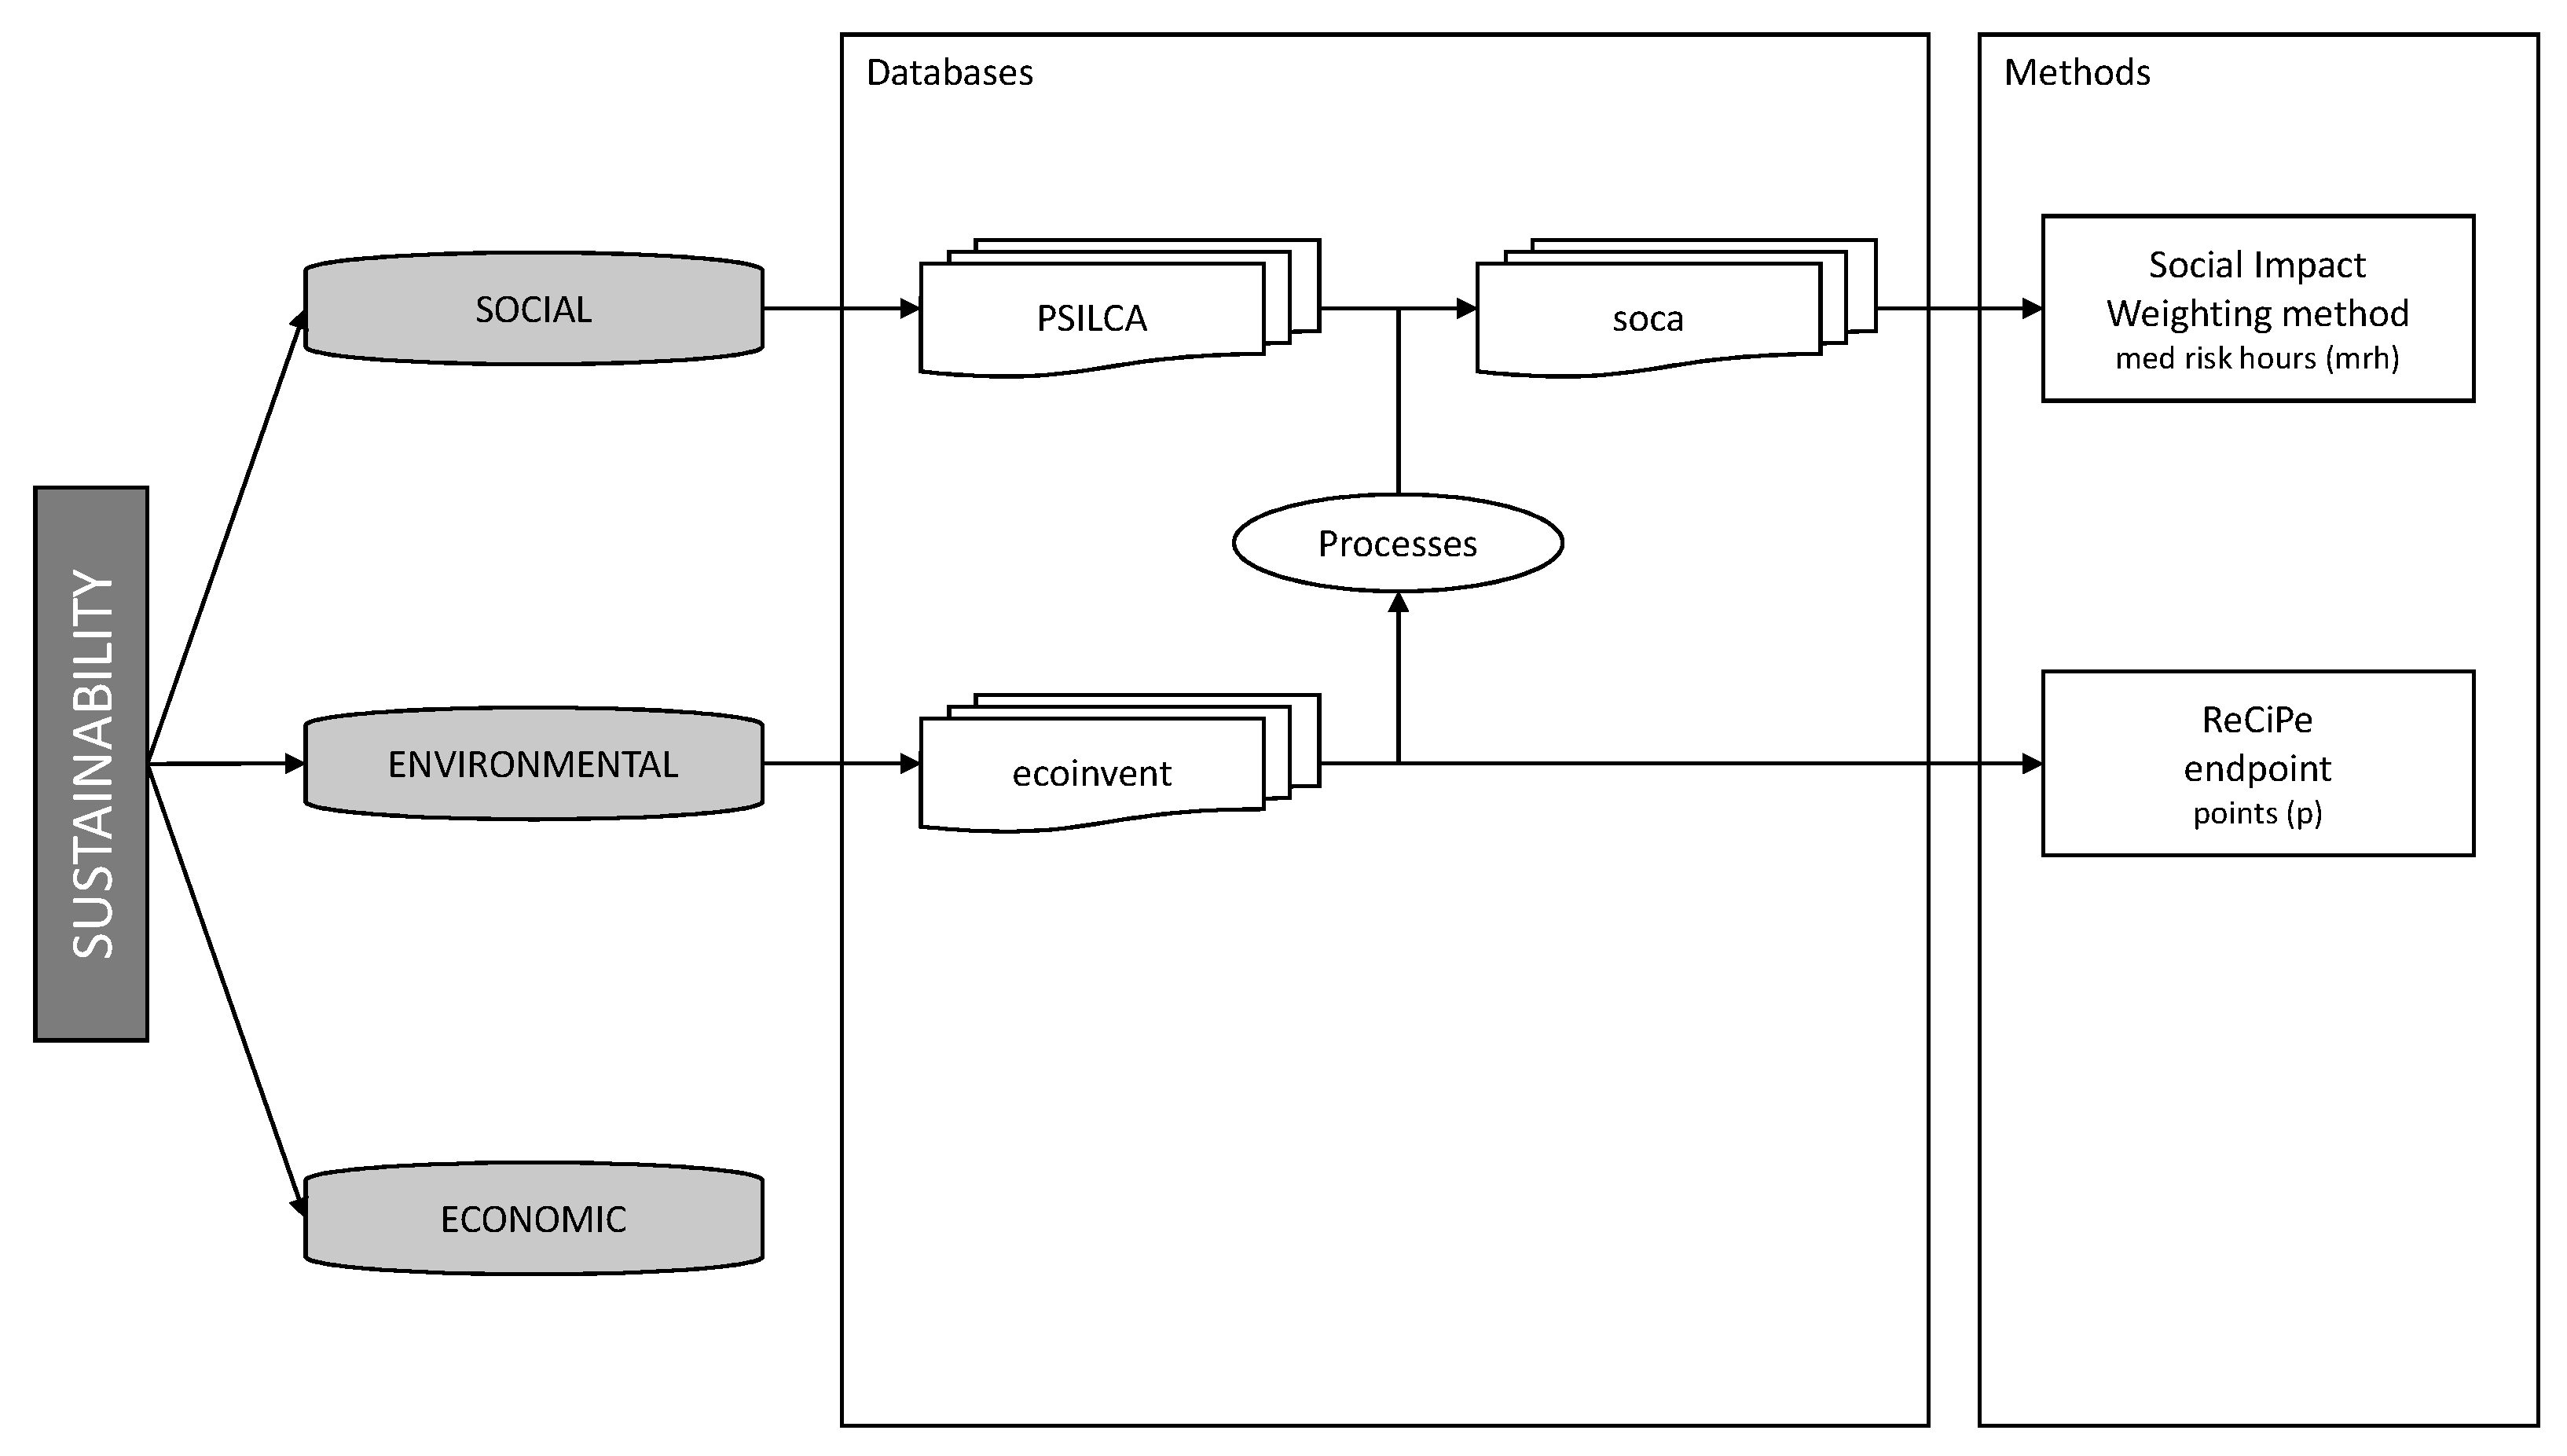
Table 1, the technique selected for E-LCA is recipe. This method gives, as a result, 18 indicators related to different environmental impacts. These indicators can be grouped into three main damage categories that focus on more general effects. Consequently, the interpretation of results is straightforward due to the lowest amount of information. Similarly, the social impact weighting method gives specific indicators and four damage categories. In
Figure 3, a schema of the relations between databases and methods used in this study is defined.
This research aims to compare the feasibility of different decks from the environmental and social points of view and the difference between those results. Accordingly, only the damage categories are considered for the study to understand the results quickly.
2.5. Interpretation
At this phase, the comparison of the different bridge alternatives is carried out. All processes and activity’s impact results are analyzed and compared. This interpretation depends on the research goal defined.
3. Lyfe Cycle Assessment
This research carried out the complete LCA of four different bridge decks. It is a cradle-to-grave analysis. This type of analysis considers all bridge processes, starting with the raw material extraction and ending with the demolition of the structure and the transportation of the materials obtained to landfills. Only the damage categories results are exposed in all graphs and tables to ease the comparison of alternatives. In
Figure 4, the processes considered for modeling the complete life cycle of every deck option are summarized. This processes follows the proposal in Martínez-Muñoz et al. [
26].
3.1. Environmental LCA
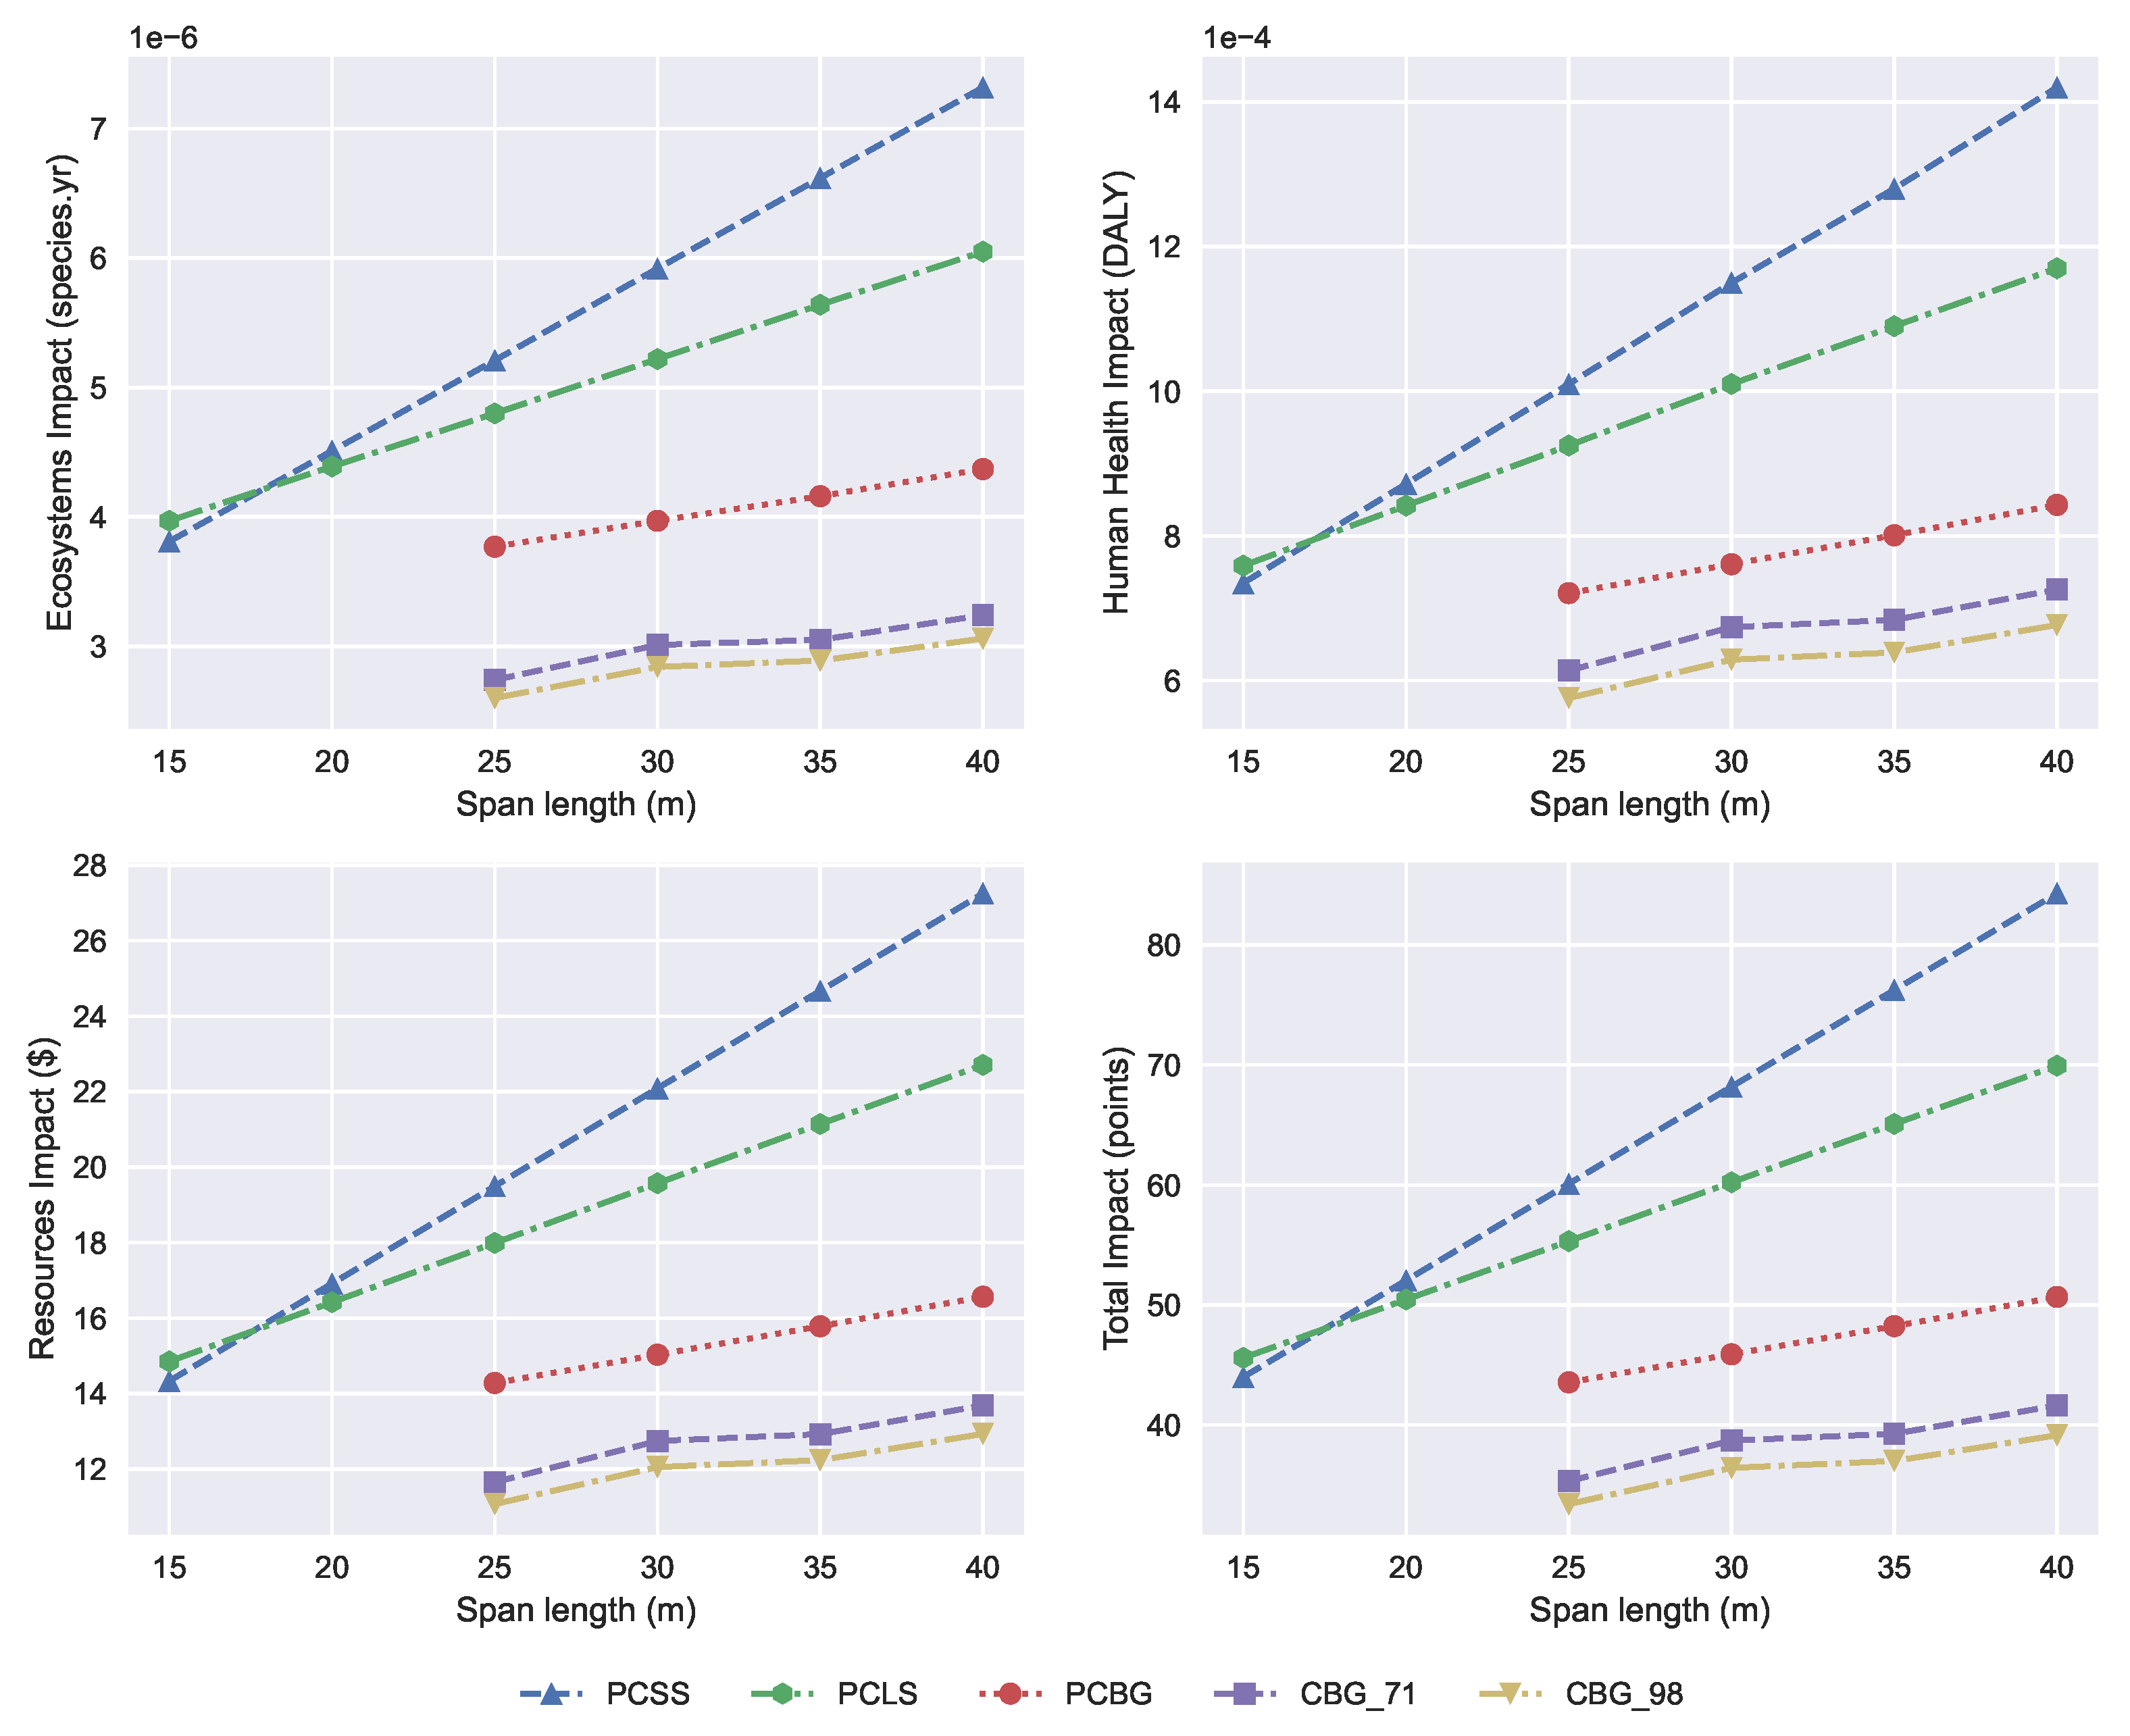
The LCIA method used to carry out the environmental assessment is recipe. As mentioned before, this LCIA method gives two alternatives of obtaining results. This study chooses the endpoint approach to obtain more easily comparable results. The results of the E-LCA show three damage categories: ecosystems impact, human health impact, and resources impact. The units of this damage category are species.yr, disability-adjusted life years (DALYs), and dollar ($), respectively. As the three damage categories give their results in different units, a normalization and weighting method is required to compare them. The Europe recipe H/A person/year is set as the weighting method in this research.
In this work, four bridge deck alternatives are proposed for its comparison: PCSS, PCLS, PCBG, and CBG. Two steel recycling ratios to consider different steel manufacturing processes for CBG alternatives are 71% (CBG_71) and 98% (CBG_98). These steel recycling rates correspond to those of reinforcement bars in Spain and the maximum recycling rate for hot rolling steel according to the World Steel Association [
35].
Results for the environmental analysis are represented in
Figure 5. As can be seen from the ecological point of view, PCSS is the best solution between 15 m and 18 m. PCLS becomes the best alternative up to 25 m, where box solutions are used from this point on. In span lengths between 25 m and 40 m, it can be seen in
Figure 5 that solutions with lower environmental impact are the best compared to others. For concrete solutions, the best alternative is the PCBG. In this case, the comparison between damage categories makes no sense due to the similarity of every damage category. The three damage categories are normalized and summed to give the same importance to total impact. From the results obtained for each damage category, the most ecofriendly solution is CBG_98. Furthermore, the more recycled steel is used, the more environmentally friendly the alternative is.
3.2. Social LCA
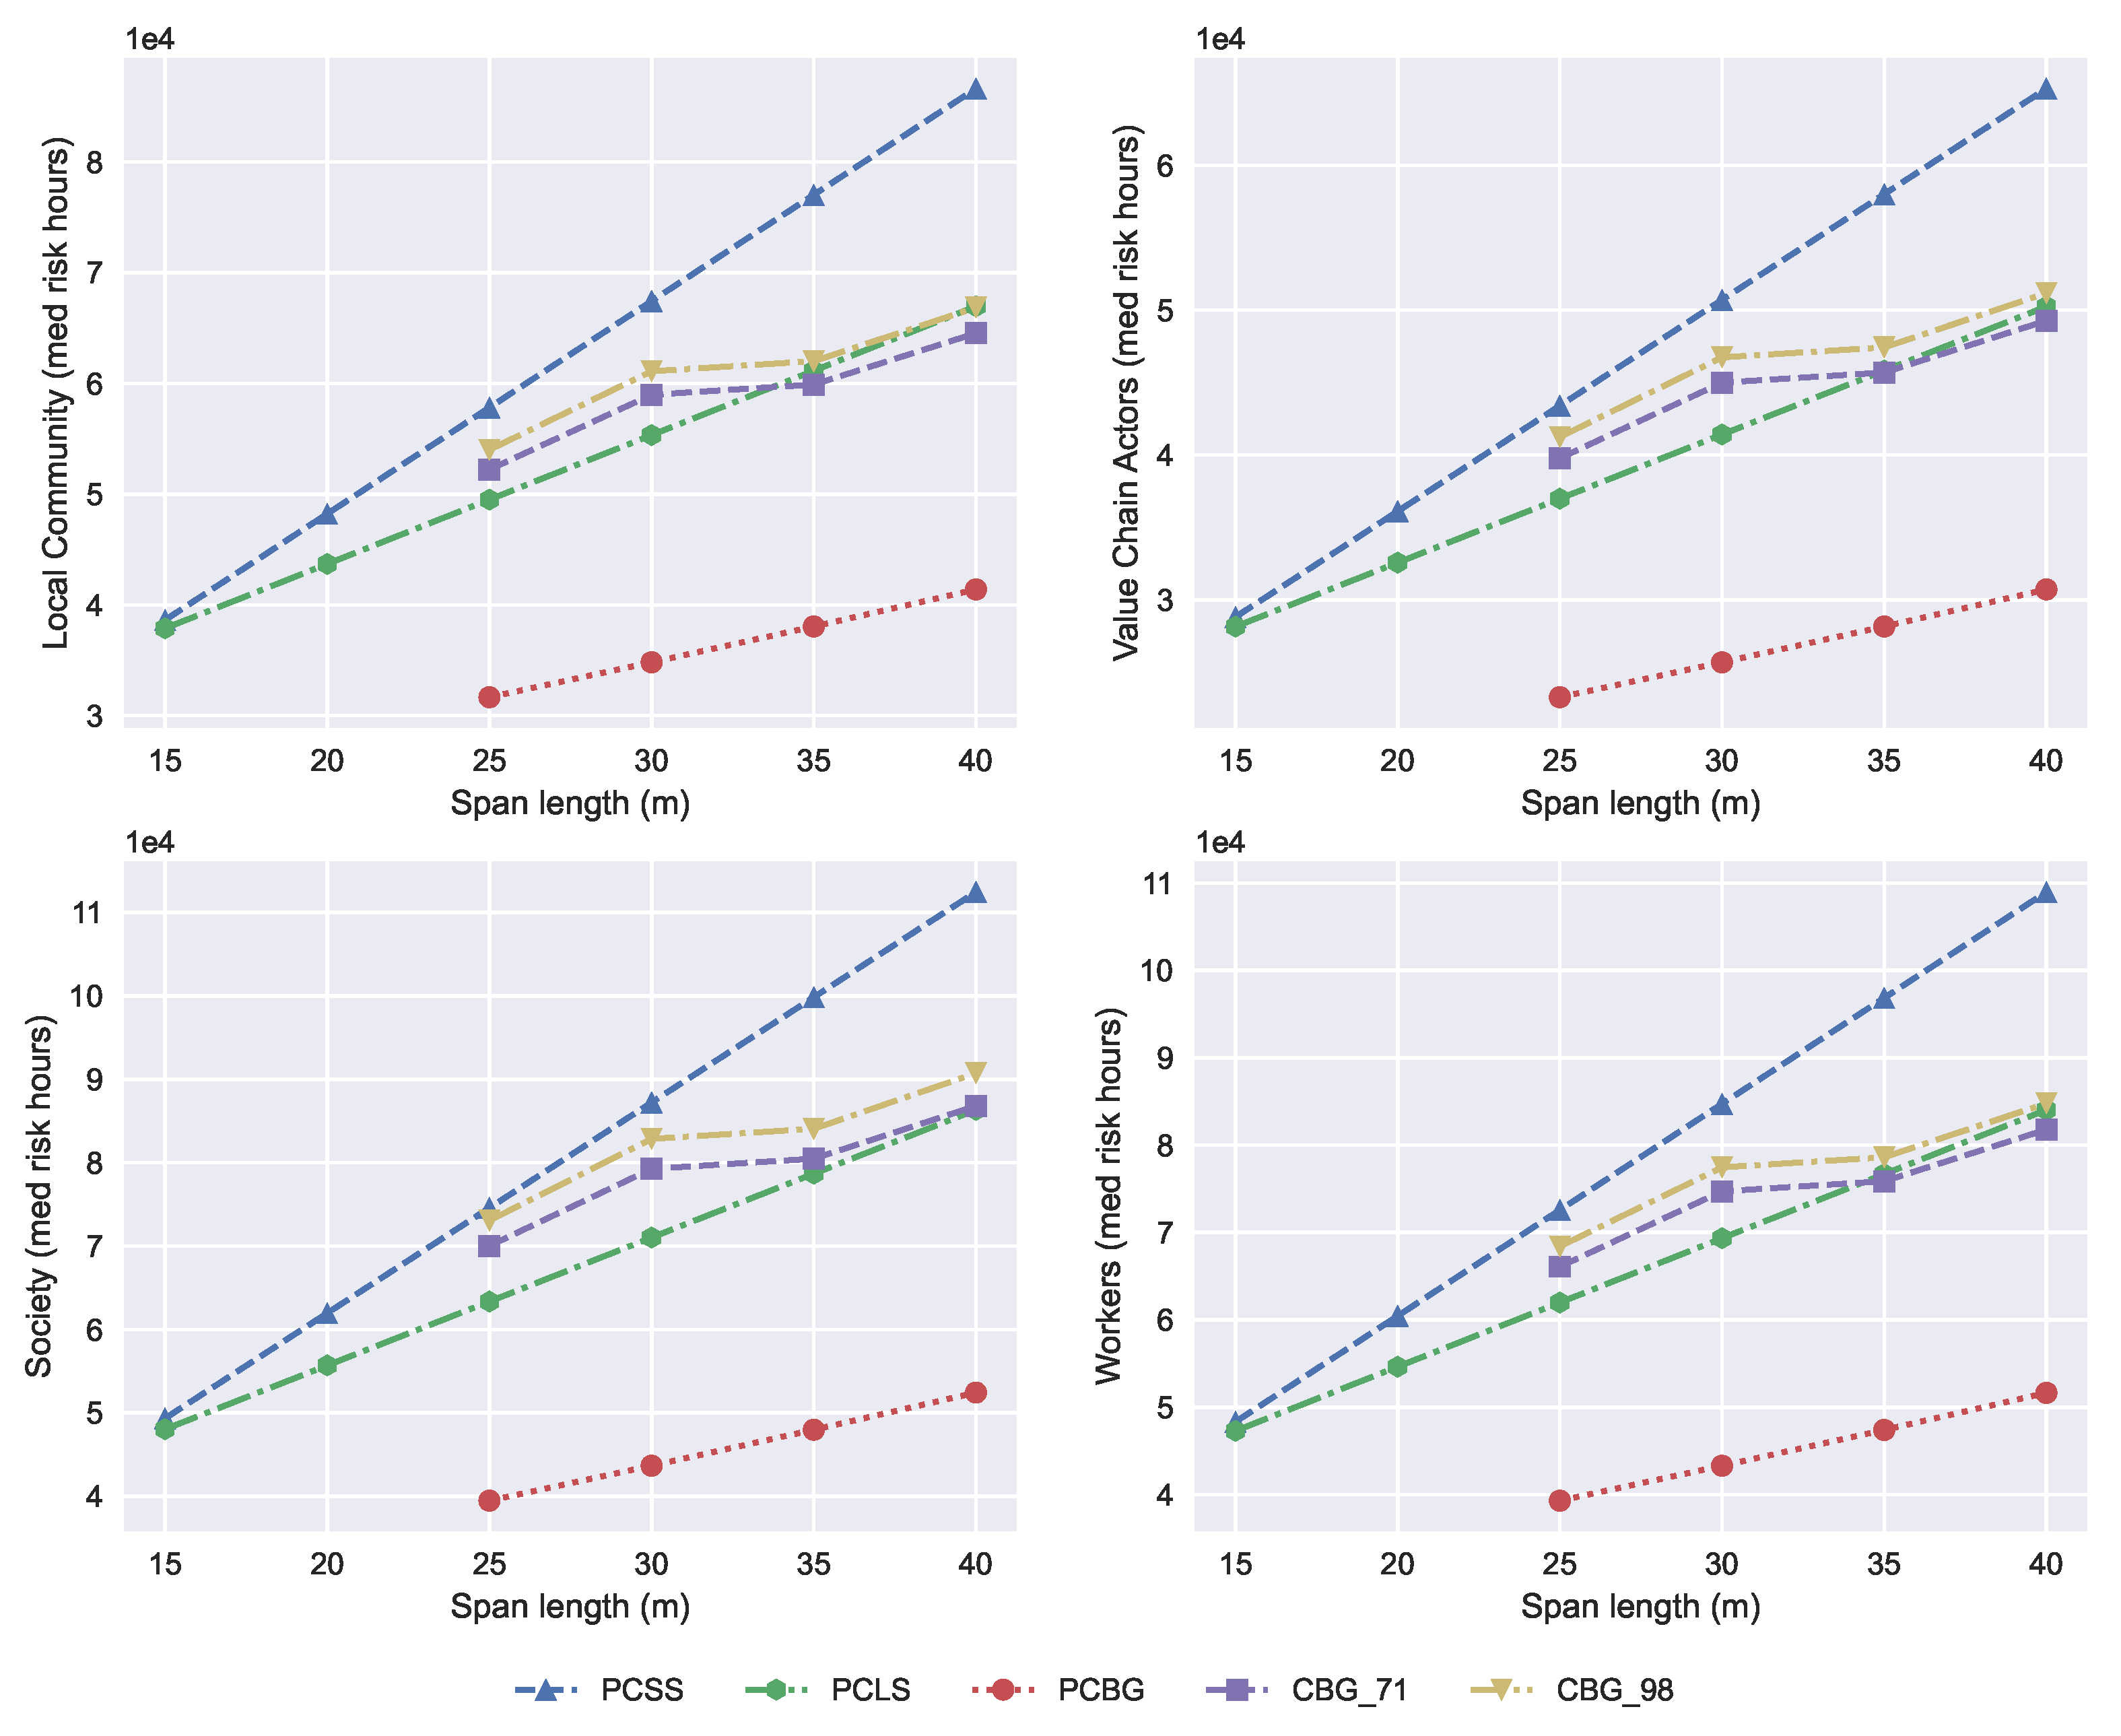
Social evaluation of bridge deck alternatives is carried out using the social impact weighting method as the LCIA method. This method, in a similar way to recipe, gives a series of indicators related to specific impact categories, as can be seen in
Table 1. For this case study, the indicators are collected in four categories related to the leading social stakeholders following the method in Penadés-Plà et al. [
21]. This impact categories grouping allows us to understand better the social impact of the alternatives and their comparison. The social stakeholders chosen are local community, value chain actors, society, and workers as defined in
Table 1.
Results from S-LCA give precise results regarding the feasibility of alternatives for each span length. From 15 m to 25 m, the best option is the PCLS. From this length, the PCBG is the best alternative from a social point of view. Regarding the CBG alternatives, it can be seen that its social feasibility is very low compared to PCBG, even below the PCLS solution with higher recycling rates (CBG_98). It can be observed that solutions with higher steel recycling ratios give higher social impact values for social damage categories, as can be seen in
Figure 6. If the analysis is focused on the slopes of the obtained lines, it can be seen that the impact on resources increases to a greater extent than the impact on human health, and this, in turn, is greater than the impact on the ecosystems.
4. Discussion
This research carried out a social and environmental impact assessment of four bridge deck alternatives. As it can be seen in
Section 3, results from both evaluations give opposite results. Regarding the feasibility of E-LCA options, the most suitable alternative for 25 m to 40 m span lengths is the CBG. Moreover, the increase in the steel scrap used for the steel manufacturing process reduces the impact of the CBG alternatives, with the CBG_98 alternatives being the best from the environmental point of view. On the contrary, for social assessment, this is a worse alternative than PCBG, and in addition, a higher steel recycling ratio gives, as a consequence, a higher social impact.
To get an idea of the cause of this contrast between LCA criteria, a more detailed study was carried out regarding the importance of stages for global analysis. In
Table 4, the total assessments for both social and environmental criteria are summarized for a 35 m solution. It can be observed that the solution with the most impact for both ecological and social assessments is the PCSS. However, the feasibility of solutions changes drastically between criteria. The CBG with 98% of recycled steel is the best, eco-friendly solution. It should be remembered that this is the usual steel recycling rate for hot rolled steel according to the World Steel Association [
35]. For social impact assessment, this changes, and the most socially sustainable solution is the PCBG, with the 98% of recycled steel CBG solution lagging behind the PCLS one.
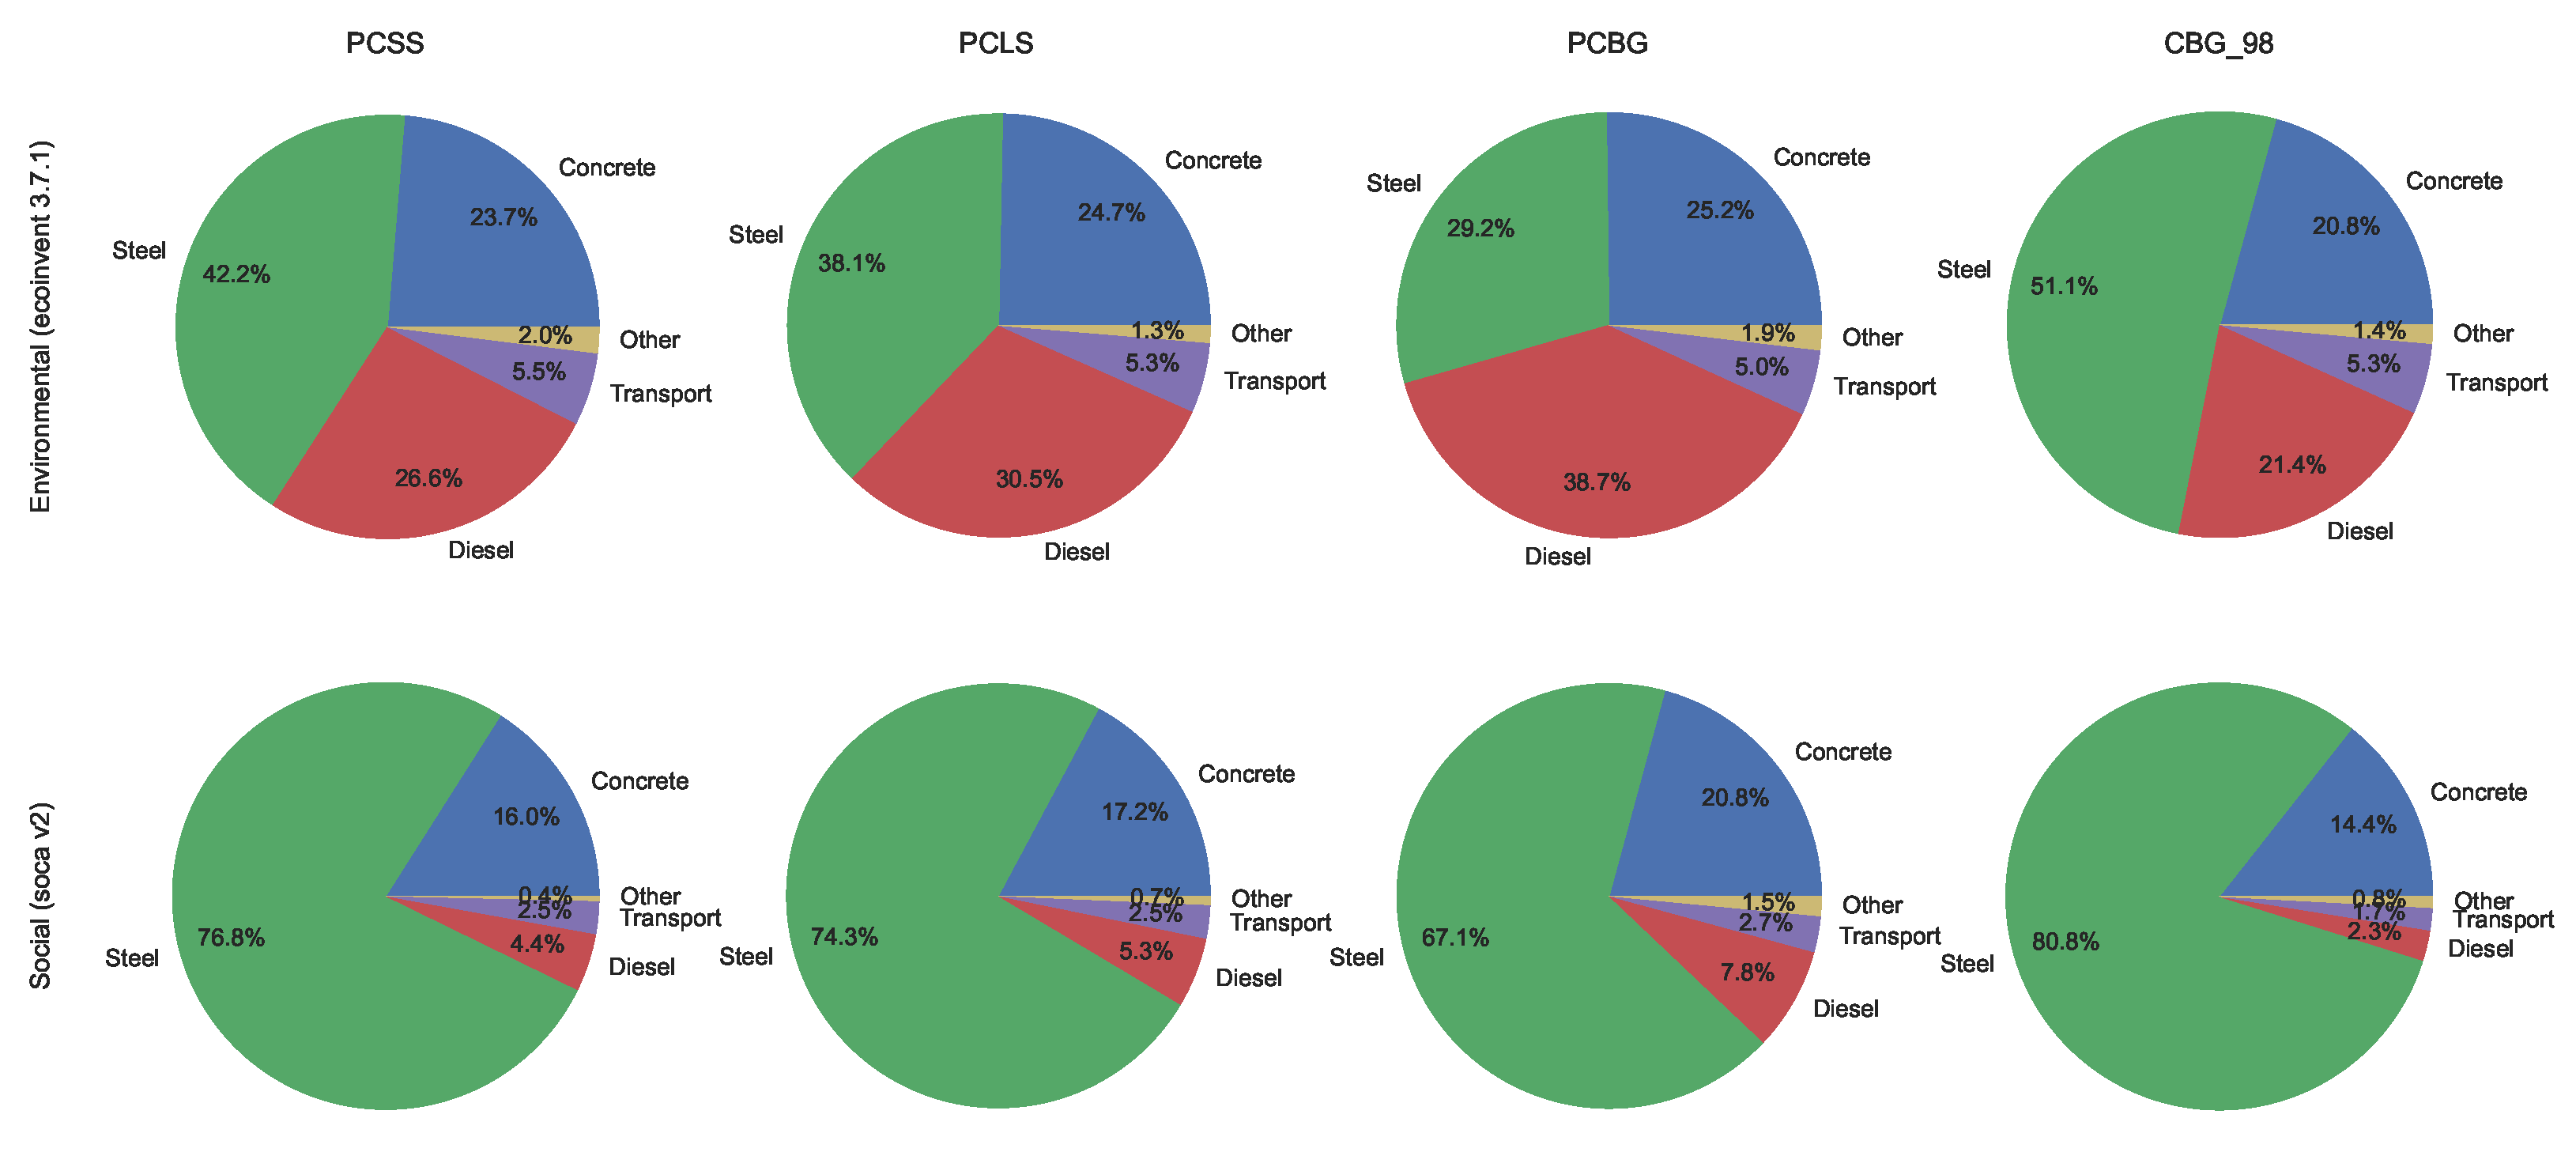
The difference between these two assessments is produced by the importance of steel to the total impact in both environmental and social assessments. In
Figure 7, the importance of every process is defined according to the results obtained from the LCA models. As can be seen, steel is the process that has the most significant impact on the total for both assessments. However, for social impact, this importance grows from 51.1% to 80.8% in the case of the CBG_98 alternative. Furthermore, regarding the steel manufacturing process in the environmental assessment, the impacts of one kg of steel considering 71% and 98% of steel scrap are 0.152 and 0.104 points. If the same analysis is carried out from the social perspective, the results are 1941.08 and 2066.51 med risk hours for one kg of steel considering 71% and 98% of steel scrap, respectively. Suppose we add that the importance of steel is more remarkable for the social analysis and that considering a higher percentage of steel recycling generates a more significant impact. In that case, we find the cause of these differences in effects. Suppose the analysis is focused on the slopes of the obtained lines. In that case, it can be seen that the impact growing the most is the impact on society, followed by the effect on workers, local community, and value chain actors.
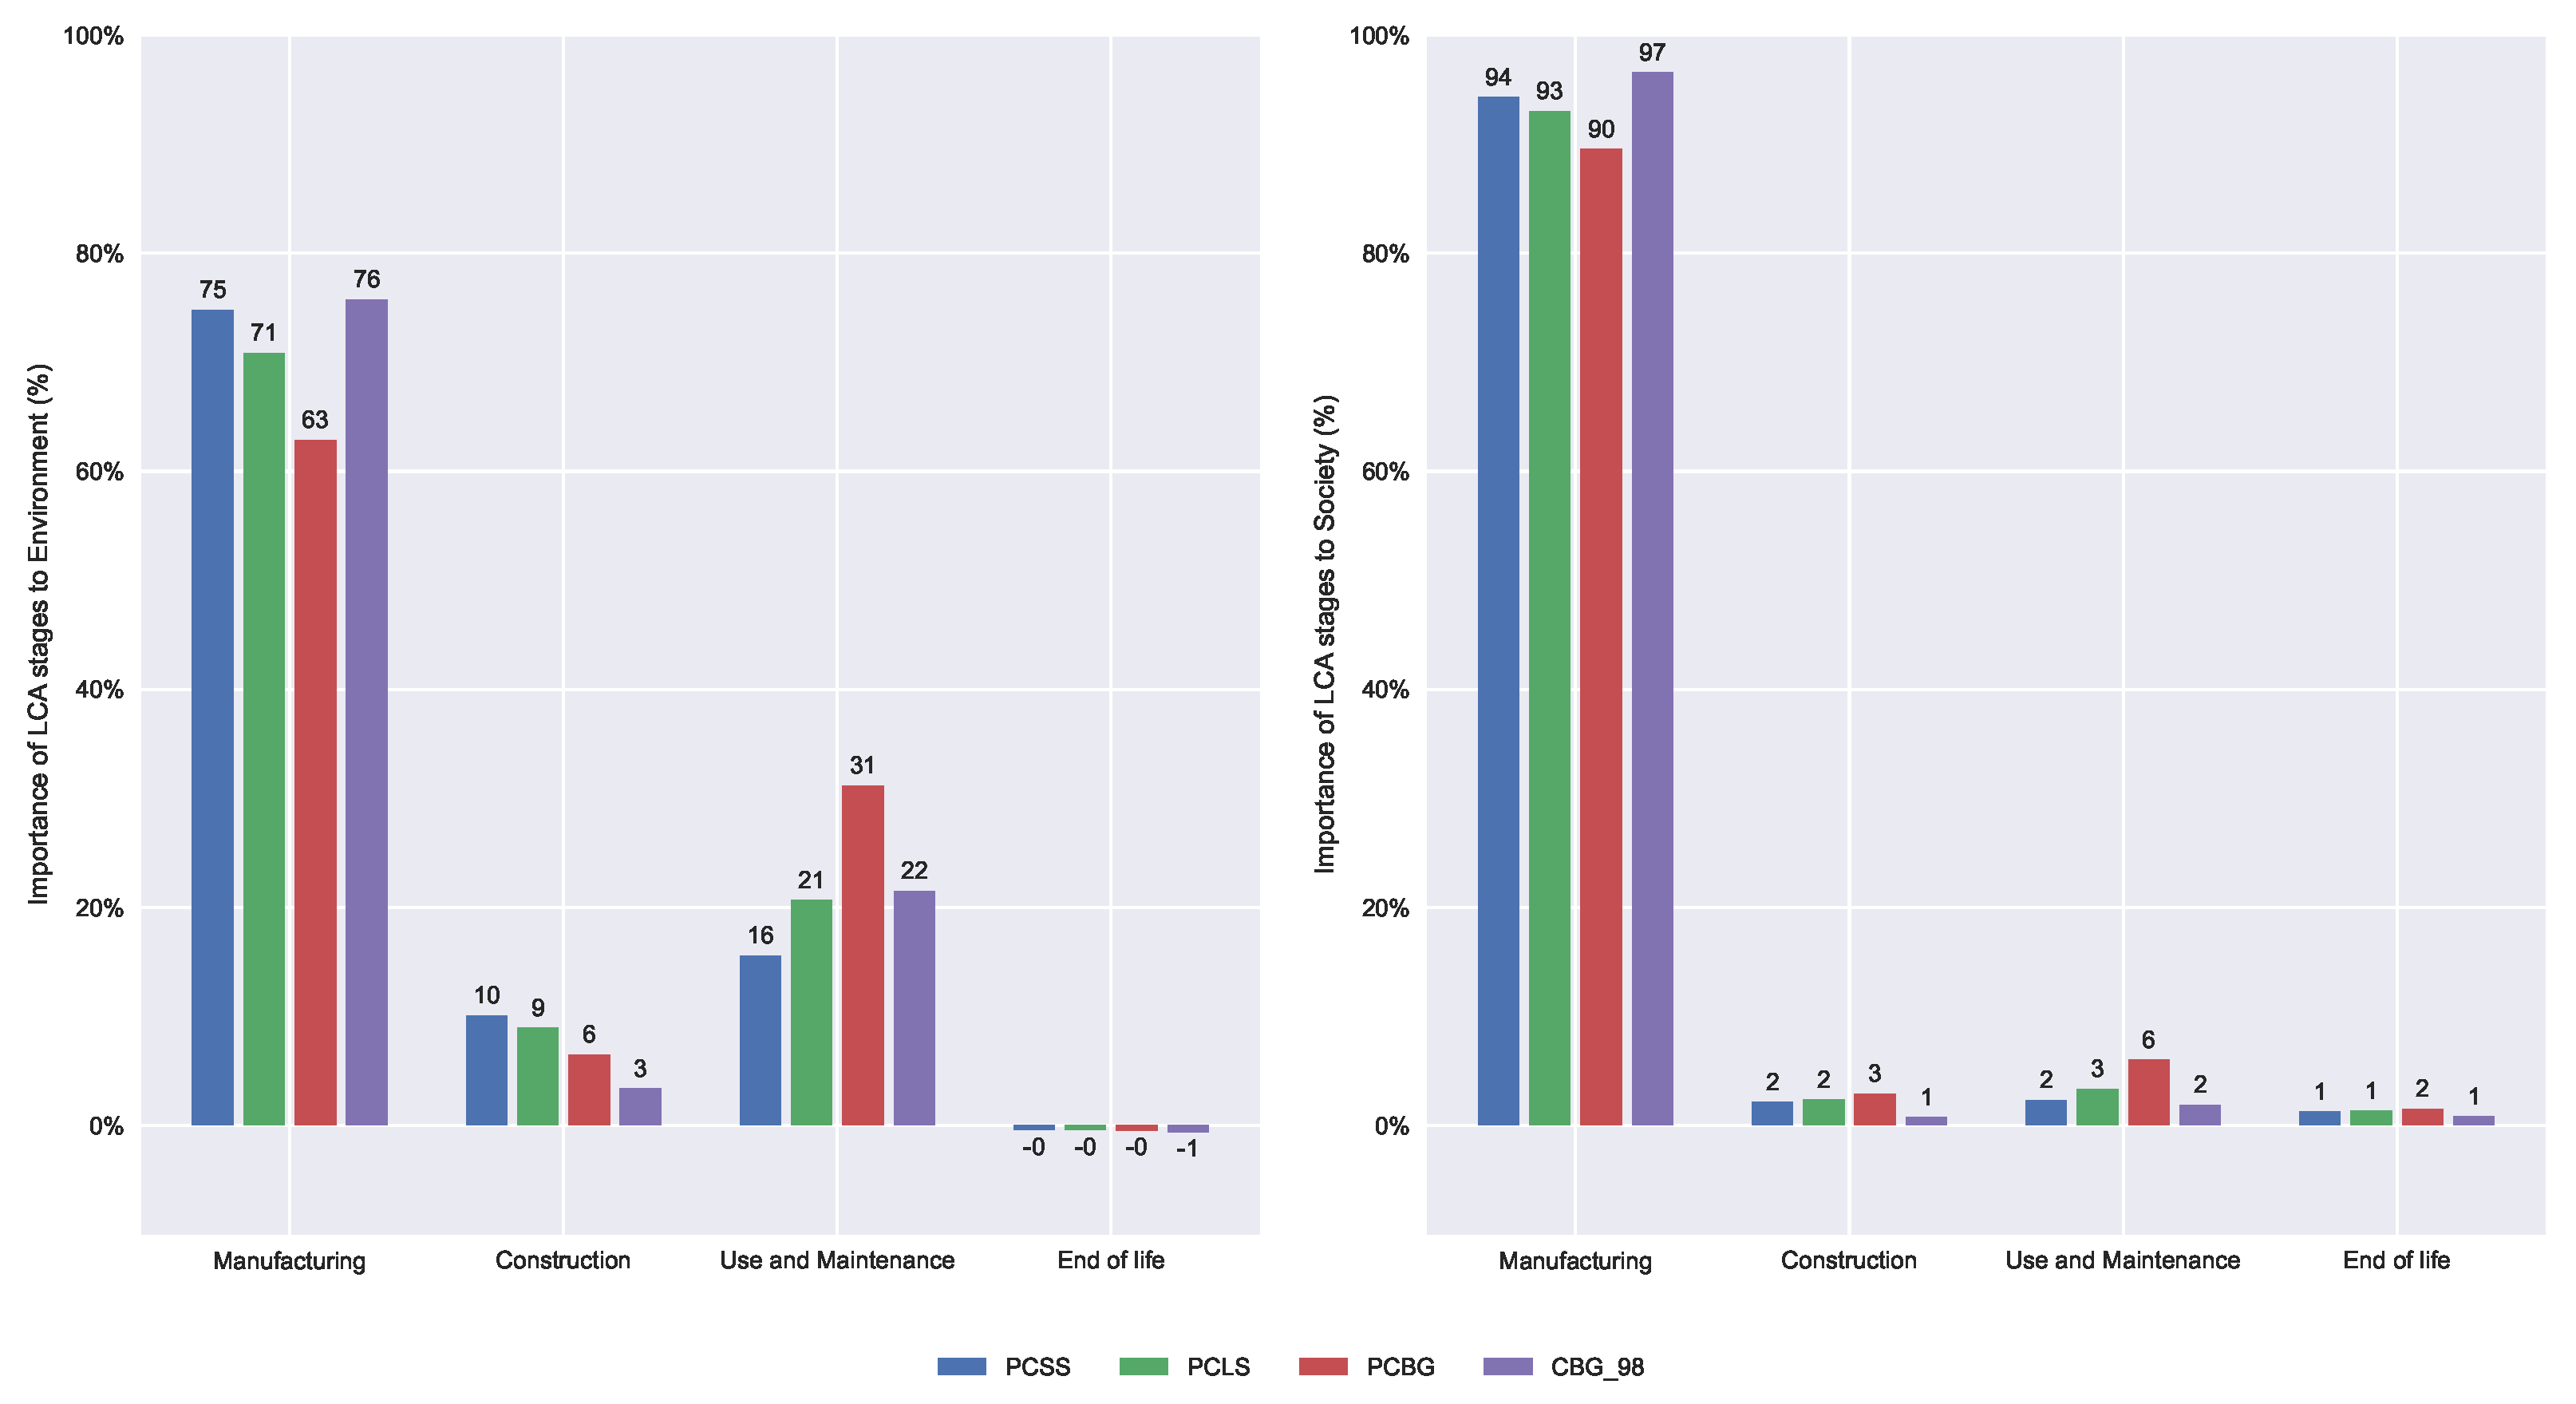
Finally, the importance of every bridge deck LCA stage of this study is defined in
Figure 8. Regarding the similarities of both assessments, it can be stated that manufacturing is the most critical stage for both social and environmental impacts. The next order by importance is the use and maintenance phase, followed by the construction and the end of life. One difference is observed between these two sustainability assessment criteria. The carbonation process reduces the use and maintenance and end-of-life stages for environmental assessment. In contrast, the carbonation reduction does not affect the total impact of the social evaluation. Another difference is observed between alternatives in the construction stage. For E-LCA, the PSCC alternative is the most impacting, while for the S-LCA, it is the PCBG.
5. Conclusions
This research compared the environmental and social impacts of different bridge deck alternatives. Usually, in span lengths between 15 m and 25 m, the options used are the PCSS and PCLS, taking economic feasibility as the criterion. In these studies, PCSS and PCLS are compared from the social and environmental points of view. This comparison gave the result taht the PCLS is a better alternative. In the span, the length ranges from 15 m to 18 m; PCSS is better than PCLS for the environmental assessment, but PCLS overcomes the PCSS in all length ranges for social impact.
The steel recycling ratio variation modifies the impact of alternatives. Still, in contrast with other studies made with older versions of this database, it is not crucial to define the feasibility of the options. From the environmental point of view, the more steel is recycled, the lower the ecological impact. On the contrary, for the social sustainability of deck alternatives, lower amounts of steel scrap reduce the global impact of the structure.
CO2 fixation by carbonation processes only impacts the environmental analysis, reducing the impact of the structure in use and maintenance and end of life stages. This reduction is less critical in composite solutions because the amount of concrete in this board type is minor to concrete alternatives. Regarding the social sustainability of the alternatives, carbonation, and consequently, the CO2 fixation produced in this process, does not affect the total assessment of the structure. This leads to the fact that the end-of-life phase, where the concrete is crushed, positively impacts the environmental analysis. At the same time, it does not positively impact the social analysis.
Regarding the material importance in the assessment, the steel impact is higher in environmental and social aspects. Finally, we assume higher values concerning other material contributions. Finally, the manufacturing stage has the most significant life cycle impact of all the alternatives, as found in other research studies with the same scope.
This research compares different bridge deck alternatives from the environmental and social sustainability points of view. In the main conclusion, the composite box girder alternatives are the most sustainable from the ecological point of view. However, the most suitable for social impact is the prestressed concrete box-girder solution. Consequently, the most sustainable choice of alternatives for bridge decks is mainly a multi-criteria decision-making problem that will depend on the weights assigned to every economic, environmental, and social pillar.
As a result of this study, researchers and designers can obtain information about the feasibility of concrete and composite alternatives proposed for analysis. The information regarding this feasibility is limited to the defined cross-section types of slab and box-girder bridges, their assessment from environmental and social points of view, and the span lengths between 15 m and 40 m. In future research studies, other composite bridge cross-section alternatives can be studied, such as twin I-girder bridges or plate girders, to examine if they improve the feasibility of composite options for social impact. Furthermore, optimization techniques can be applied to cross sections to obtain new designs, considering the social and environmental LCA impacts as objective functions.
Author Contributions
Conceptualization, D.M.-M. and V.Y.; methodology, D.M.-M.; software, D.M.-M.; validation, D.M.-M., J.V.M. and V.Y.; formal analysis, D.M.-M. and J.V.M.; investigation, D.M.-M.; resources, V.Y.; data curation, D.M.-M.; writing—original draft preparation, D.M.-M.; writing—review and editing, J.V.M. and V.Y.; visualization, D.M.-M.; supervision, J.V.M. and V.Y.; project administration, V.Y.; funding acquisition, V.Y. All authors have read and agreed to the published version of the manuscript.
Funding
This research was funded by: Grant PID2020-117056RB-I00 funded by MCIN/AEI/10.13039/501100011033 and by “ERDF A way of making Europe”. Grant FPU-18/01592 funded by MCIN/AEI/10.13039/501100011033 and by “ESF invests in your future”.
Informed Consent Statement
Not applicable.
Data Availability Statement
Acknowledgments
The authors gratefully acknowledge the funding received from the following research projects: Grant PID2020-117056RB-I00 funded by MCIN/AEI/10.13039/501100011033 and by “ERDF A way of making Europe”. Grant FPU-18/01592 funded by MCIN/AEI/10.13039/501100011033 and by “ESF invests in your future”.
Conflicts of Interest
The authors declare no conflict of interest.
Abbreviations
| LCA | Life Cycle Assessment |
| E-LCA | Environmental Life Cycle Assessment |
| S-LCA | Social Life Cycle Assessment |
| LCIA | Life Cycle Inventory Assessment |
| PCSS | Prestressed Concrete Solid Slab |
| PCLS | Prestressed Concrete Lightened Slab |
| PCBG | Prestressed Concrete Box Girder |
| SCCB | Steel–Concrete Composite Bridge |
| CBG | Composite Box Girder |
| BOF | Basic Oxygen Furnace |
| EAF | Electric Arc Furnace |
| p | points |
| mrh | med risk hours |
References
- WCED. Our Common Future; World Commission on Environment and Development: New York, NY, USA, 1987. [Google Scholar]
- WCED. Transforming Our World: The 2030 Agenda for Sustainable Development; World Commission on Environment and Development: New York, NY, USA, 2015. [Google Scholar]
- Martínez, F.J.; González-Vidosa, F.; Hospitaler, A.; Yepes, V. Heuristic optimization of RC bridge piers with rectangular hollow sections. Comput. Struct. 2010, 88, 375–386. [Google Scholar] [CrossRef]
- Carbonell, A.; González-Vidosa, F.; Yepes, V. Design of reinforced concrete road vaults by heuristic optimization. Adv. Eng. Softw. 2011, 42, 151–159. [Google Scholar] [CrossRef]
- Molina-Moreno, F.; García-Segura, T.; Martí, J.V.; Yepes, V. Optimization of buttressed earth-retaining walls using hybrid harmony search algorithms. Eng. Struct. 2017, 134, 205–216. [Google Scholar] [CrossRef]
- Martínez-Muñoz, D.; Martí, J.V.; García, J.; Yepes, V. Embodied Energy Optimization of Buttressed Earth-Retaining Walls with Hybrid Simulated Annealing. Appl. Sci. 2021, 11, 1800. [Google Scholar] [CrossRef]
- Ata-Ali, N.; Penadés-Plà, V.; Martínez-Muñoz, D.; Yepes, V. Recycled versus non-recycled insulation alternatives: LCA analysis for different climatic conditions in Spain. Resour. Conserv. Recycl. 2021, 175, 105838. [Google Scholar] [CrossRef]
- García-Segura, T.; Penadés-Plà, V.; Yepes, V. Sustainable bridge design by metamodel-assisted multi-objective optimization and decision-making under uncertainty. J. Clean. Prod. 2018, 202, 904–915. [Google Scholar] [CrossRef]
- Yepes, V.; Dasi-Gil, M.; Martínez-Muñoz, D.; López-Desfilis, V.J.; Martí, J.V. Heuristic techniques for the design of steel-concrete composite pedestrian bridges. Appl. Sci. 2019, 9, 3253. [Google Scholar] [CrossRef] [Green Version]
- Du, G.; Karoumi, R. Life cycle assessment of a railway bridge: Comparison of two superstructure designs. Struct. Infrastruct. Eng. 2013, 9, 1149–1160. [Google Scholar] [CrossRef]
- Du, G.; Safi, M.; Pettersson, L.; Karoumi, R. Life cycle assessment as a decision support tool for bridge procurement: Environmental impact comparison among five bridge designs. Int. J. Life Cycle Assess. 2014, 19, 1948–1964. [Google Scholar] [CrossRef]
- Yusof, N.; Zainul Abidin, N.; Zailani, S.H.M.; Govindan, K.; Iranmanesh, M. Linking the environmental practice of construction firms and the environmental behaviour of practitioners in construction projects. J. Clean. Prod. 2016, 121, 64–71. [Google Scholar] [CrossRef]
- Penadés-Plà, V.; Martí, J.V.; García-Segura, T.; Yepes, V. Life-Cycle Assessment: A Comparison between Two Optimal Post-Tensioned Concrete Box-Girder Road Bridges. Sustainability 2017, 9, 1864. [Google Scholar] [CrossRef] [Green Version]
- Petek Gursel, A.; Masanet, E.; Horvath, A.; Stadel, A. Life-cycle inventory analysis of concrete production: A critical review. Cement Concr. Compos. 2014, 51, 38–48. [Google Scholar] [CrossRef]
- Ramesh, T.; Prakash, R.; Shukla, K.K. Life cycle energy analysis of buildings: An overview. Energy Build. 2010, 42, 1592–1600. [Google Scholar] [CrossRef]
- Årskog, V.; Fossdal, S.; Gjørv, O.E. Life-Cycle Asessment of Repair and Maintenance Systems for Concrete Structures. In Proceedings of the International Workshop on Sustainable Development and Concrete Technology, Beijing, China, 20–21 May 2004. [Google Scholar]
- Shen, L.Y.; Lu, W.; Yao, H.; Wu, D.H. A computer-based scoring method for measuring the environmental performance of construction activities. Autom. Constr. 2005, 14, 297–309. [Google Scholar] [CrossRef]
- Murphy, K. The social pillar of sustainable development: A literature review and framework for policy analysis. Sustain. Sci. Pract. Policy 2012, 8, 15–29. [Google Scholar] [CrossRef] [Green Version]
- Montalbán-Domingo, L.; García-Segura, T.; Sanz, M.A.; Pellicer, E. Social sustainability criteria in public-work procurement: An international perspective. J. Clean. Prod. 2018, 198, 1355–1371. [Google Scholar] [CrossRef]
- Vallance, S.; Perkins, H.C.; Dixon, J.E. What is social sustainability? A clarification of concepts. Geoforum 2011, 42, 342–348. [Google Scholar] [CrossRef]
- Penadés-Plà, V.; Martínez-Muñoz, D.; García-Segura, T.; Navarro, I.; Yepes, V. Environmental and Social Impact Assessment of Optimized Post-Tensioned Concrete Road Bridges. Sustainability 2020, 12, 4265. [Google Scholar] [CrossRef]
- Valdes-Vasquez, R.; Klotz, L.E. Social Sustainability Considerations during Planning and Design: Framework of Processes for Construction Projects. J. Constr. Eng. Manag. 2013, 139, 80–89. [Google Scholar] [CrossRef]
- Almahmoud, E.; Doloi, H. Assessment of Social Sustainability in Construction Projects Using Social Network Analysis. J. Int. Bus. Res. Mark. 2018, 3, 35–46. [Google Scholar] [CrossRef] [Green Version]
- Navarro, I.J.; Penadés-Plà, V.; Martínez-Muñoz, D.; Rempling, R.; Yepes, V. Life cycle sustainability assessment for multi-criteria decision making in bridge design: A review. J. Civil Eng. Manag. 2021, 26, 690–704. [Google Scholar] [CrossRef]
- Martínez-Muñoz, D.; Martí, J.V.; Yepes, V. Steel-Concrete Composite Bridges: Design, Life Cycle Assessment, Maintenance, and Decision-Making. Adv. Civil. Eng. 2020, 2020, 8823370. [Google Scholar] [CrossRef]
- Martínez-Muñoz, D.; Martí, J.V.; Yepes, V. Comparative Life Cycle Analysis of Concrete and Composite Bridges Varying Steel Recycling Ratio. Materials 2021, 14, 4218. [Google Scholar] [CrossRef]
- Gervásio, H.; Simões da Silva, L. A probabilistic decision-making approach for the sustainable assessment of infrastructures. Expert Syst. Appl. 2012, 39, 7121–7131. [Google Scholar] [CrossRef]
- Sabatino, S.; Frangopol, D.M.; Dong, Y. Sustainability-informed maintenance optimization of highway bridges considering multi-attribute utility and risk attitude. Eng. Struct. 2015, 102, 310–321. [Google Scholar] [CrossRef]
- Chen, Z.; Abdullah, A.B.; Anumba, C.J.; Li, H. ANP Experiment for Demolition Plan Evaluation. J. Constr. Eng. Manag. 2014, 140, 06013005. [Google Scholar] [CrossRef]
- ISO. Environmental Management, Life Cycle Assessment Principles and Framework (ISO 14040:2006); International Organization for Standardization: Geneva, Switzerland, 2006. [Google Scholar]
- Benoît, C.; Mazijn, B. Guidelines for Social Life Cycle Assessment of Products; UNEP/SETAC Life Cycle Initiative, Sustainable Product and Consumption Branch: Paris, France, 2011; Volume 15. [Google Scholar]
- Goedkoop, M.; Heijungs, R.; Huijbregts, M.; De Schryver, A.; Struijs, J.; Van Zelm, R. ReCiPe 2008. Report I: Characterisation; Ministry of Housing, Spatial Planning and Environment (VROM): Barendrecht, The Netherlands, 2009; pp. 1–44. [Google Scholar]
- Pang, B.; Yang, P.; Wang, Y.; Kendall, A.; Xie, H.; Zhang, Y. Comparative life cycle cost assessment of painted and hot-dip galvanized bridges. Int. J. Life Cycle Assess. 2015, 20, 1300–1311. [Google Scholar] [CrossRef]
- Marceau, M.; Nisbet, M.; Vangeem, M. Life Cycle Inventory of Portland Cement Concrete; Report 2137a; Portland Cement Association: Skokie, IL, USA, 2002. [Google Scholar]
- Worldsteel. Life Cycle Inventory Methodology Report for Steel Products; World Steel Association: Brussels, Belgium, 2017. [Google Scholar]
- SRI. Construction|SRI-Steel Recycling Institute. Available online: https://www.steelsustainability.org/construction (accessed on 30 January 2021).
- Hammervold, J.; Reenaas, M.; Brattebø, H. Environmental Life Cycle Assessment of Bridges. J. Bridge Eng. 2013, 18, 153–161. [Google Scholar] [CrossRef]
- Collins, F. Inclusion of carbonation during the life cycle of built and recycled concrete: Influence on their carbon footprint. Int. J. Life Cycle Assess. 2010, 15, 549–556. [Google Scholar] [CrossRef]
- Dodoo, A.; Gustavsson, L.; Sathre, R. Carbon implications of end-of-life management of building materials. Resour. Conserv. Recycl. 2009, 53, 276–286. [Google Scholar] [CrossRef]
- García-Segura, T.; Yepes, V. Multiobjective optimization of post-tensioned concrete box-girder road bridges considering cost, CO2 emissions, and safety. Eng. Struct. 2016, 125, 325–336. [Google Scholar] [CrossRef]
- García-Segura, T.; Yepes, V.; Alcalá, J. Life cycle greenhouse gas emissions of blended cement concrete including carbonation and durability. Int. J. Life Cycle Assess. 2014, 19, 3–12. [Google Scholar] [CrossRef]
- Lagerblad, B. Carbon Dioxide Uptake During Concrete Life Cycle—State of the Art; Swedish Cement and Concrete Research Institute: Borås, Sweden, 2005. [Google Scholar]
- Hettinger, A.; Birat, J.; Hechler, O.; Braun, M. Sustainable Bridges—LCA for a Composite and a Concrete Bridge; Economical Bridge Solutions Based on Innovative Composite Dowels and Integrated Abutments: Ecobridge; Springer Vieweg: Berlin/Helderburg, Germany, 2015. [Google Scholar] [CrossRef]
- MFOM. Instrucción de Hormigón Estructural (EHE-08); Ministerio de Fomento: Madrid, Spain, 2011. [Google Scholar]
- Ciroth, A. ICT for environment in life cycle applications openLCA—A new open source software for Life Cycle Assessment. Int. J. Life Cycle Assess. 2007, 12, 209. [Google Scholar] [CrossRef]
- Frischknecht, R.; Rebitzer, G. The ecoinvent database system: A comprehensive web-based LCA database. J. Clean. Prod. 2005, 13, 1337–1343. [Google Scholar] [CrossRef]
- Pascual-González, J.; Guillén-Gosálbez, G.; Mateo-Sanz, J.M.; Jiménez-Esteller, L. Statistical analysis of the ecoinvent database to uncover relationships between life cycle impact assessment metrics. J. Clean. Prod. 2016, 112, 359–368. [Google Scholar] [CrossRef]
- Yepes, V.; Díaz, J.; González-Vidosa, F.; Alcalá, J. Statistical Characterization of Prestressed Concrete Road Bridge Decks. Rev. de la Construcción 2009, 8, 95–108. [Google Scholar]
- MFOM. Obras de Paso de Nueva Construcción; Ministerio de Fomento: Madrid, Spain, 2000. [Google Scholar]
- Zhang, Y.; Mao, Y.; Jiao, L.; Shuai, C.; Zhang, H. Eco-efficiency, eco-technology innovation and eco-well-being performance to improve global sustainable development. Environ. Impact Assess. Rev. 2021, 89, 106580. [Google Scholar] [CrossRef]
- Catalonia Institute of Construction Technology. BEDEC ITEC Materials Database. Available online: https://metabase.itec.cat/vide/es/bedec (accessed on 30 January 2022).
| Publisher’s Note: MDPI stays neutral with regard to jurisdictional claims in published maps and institutional affiliations. |
© 2022 by the authors. Licensee MDPI, Basel, Switzerland. This article is an open access article distributed under the terms and conditions of the Creative Commons Attribution (CC BY) license (https://creativecommons.org/licenses/by/4.0/).


