The Evolution of Land Resource Carrying Capacity in 35 Major Cities in China
Abstract
:1. Introduction
2. Definition of Land Resource Carrying Capacity
3. Analysis Method for the Evolution of LRCC
3.1. Measurement Model for Land Resource Carrying Capacity
3.2. Determination of Carrying Status Interval of Land Resources by Boxplots
4. Study Area and Research Data
4.1. Study Area
4.2. Research Data
5. Results and Discussion
5.1. Results of LRCC
5.2. Evolution of Land Resource Carrying Capacity between Major Cities in China
5.2.1. The Results of LRCC Intervals between Major Cities in China
5.2.2. Overall Evolution of LRCC in 35 Major Chinese Cities
5.2.3. Temporal Evolution of LRCC in 35 Major Chinese Cities
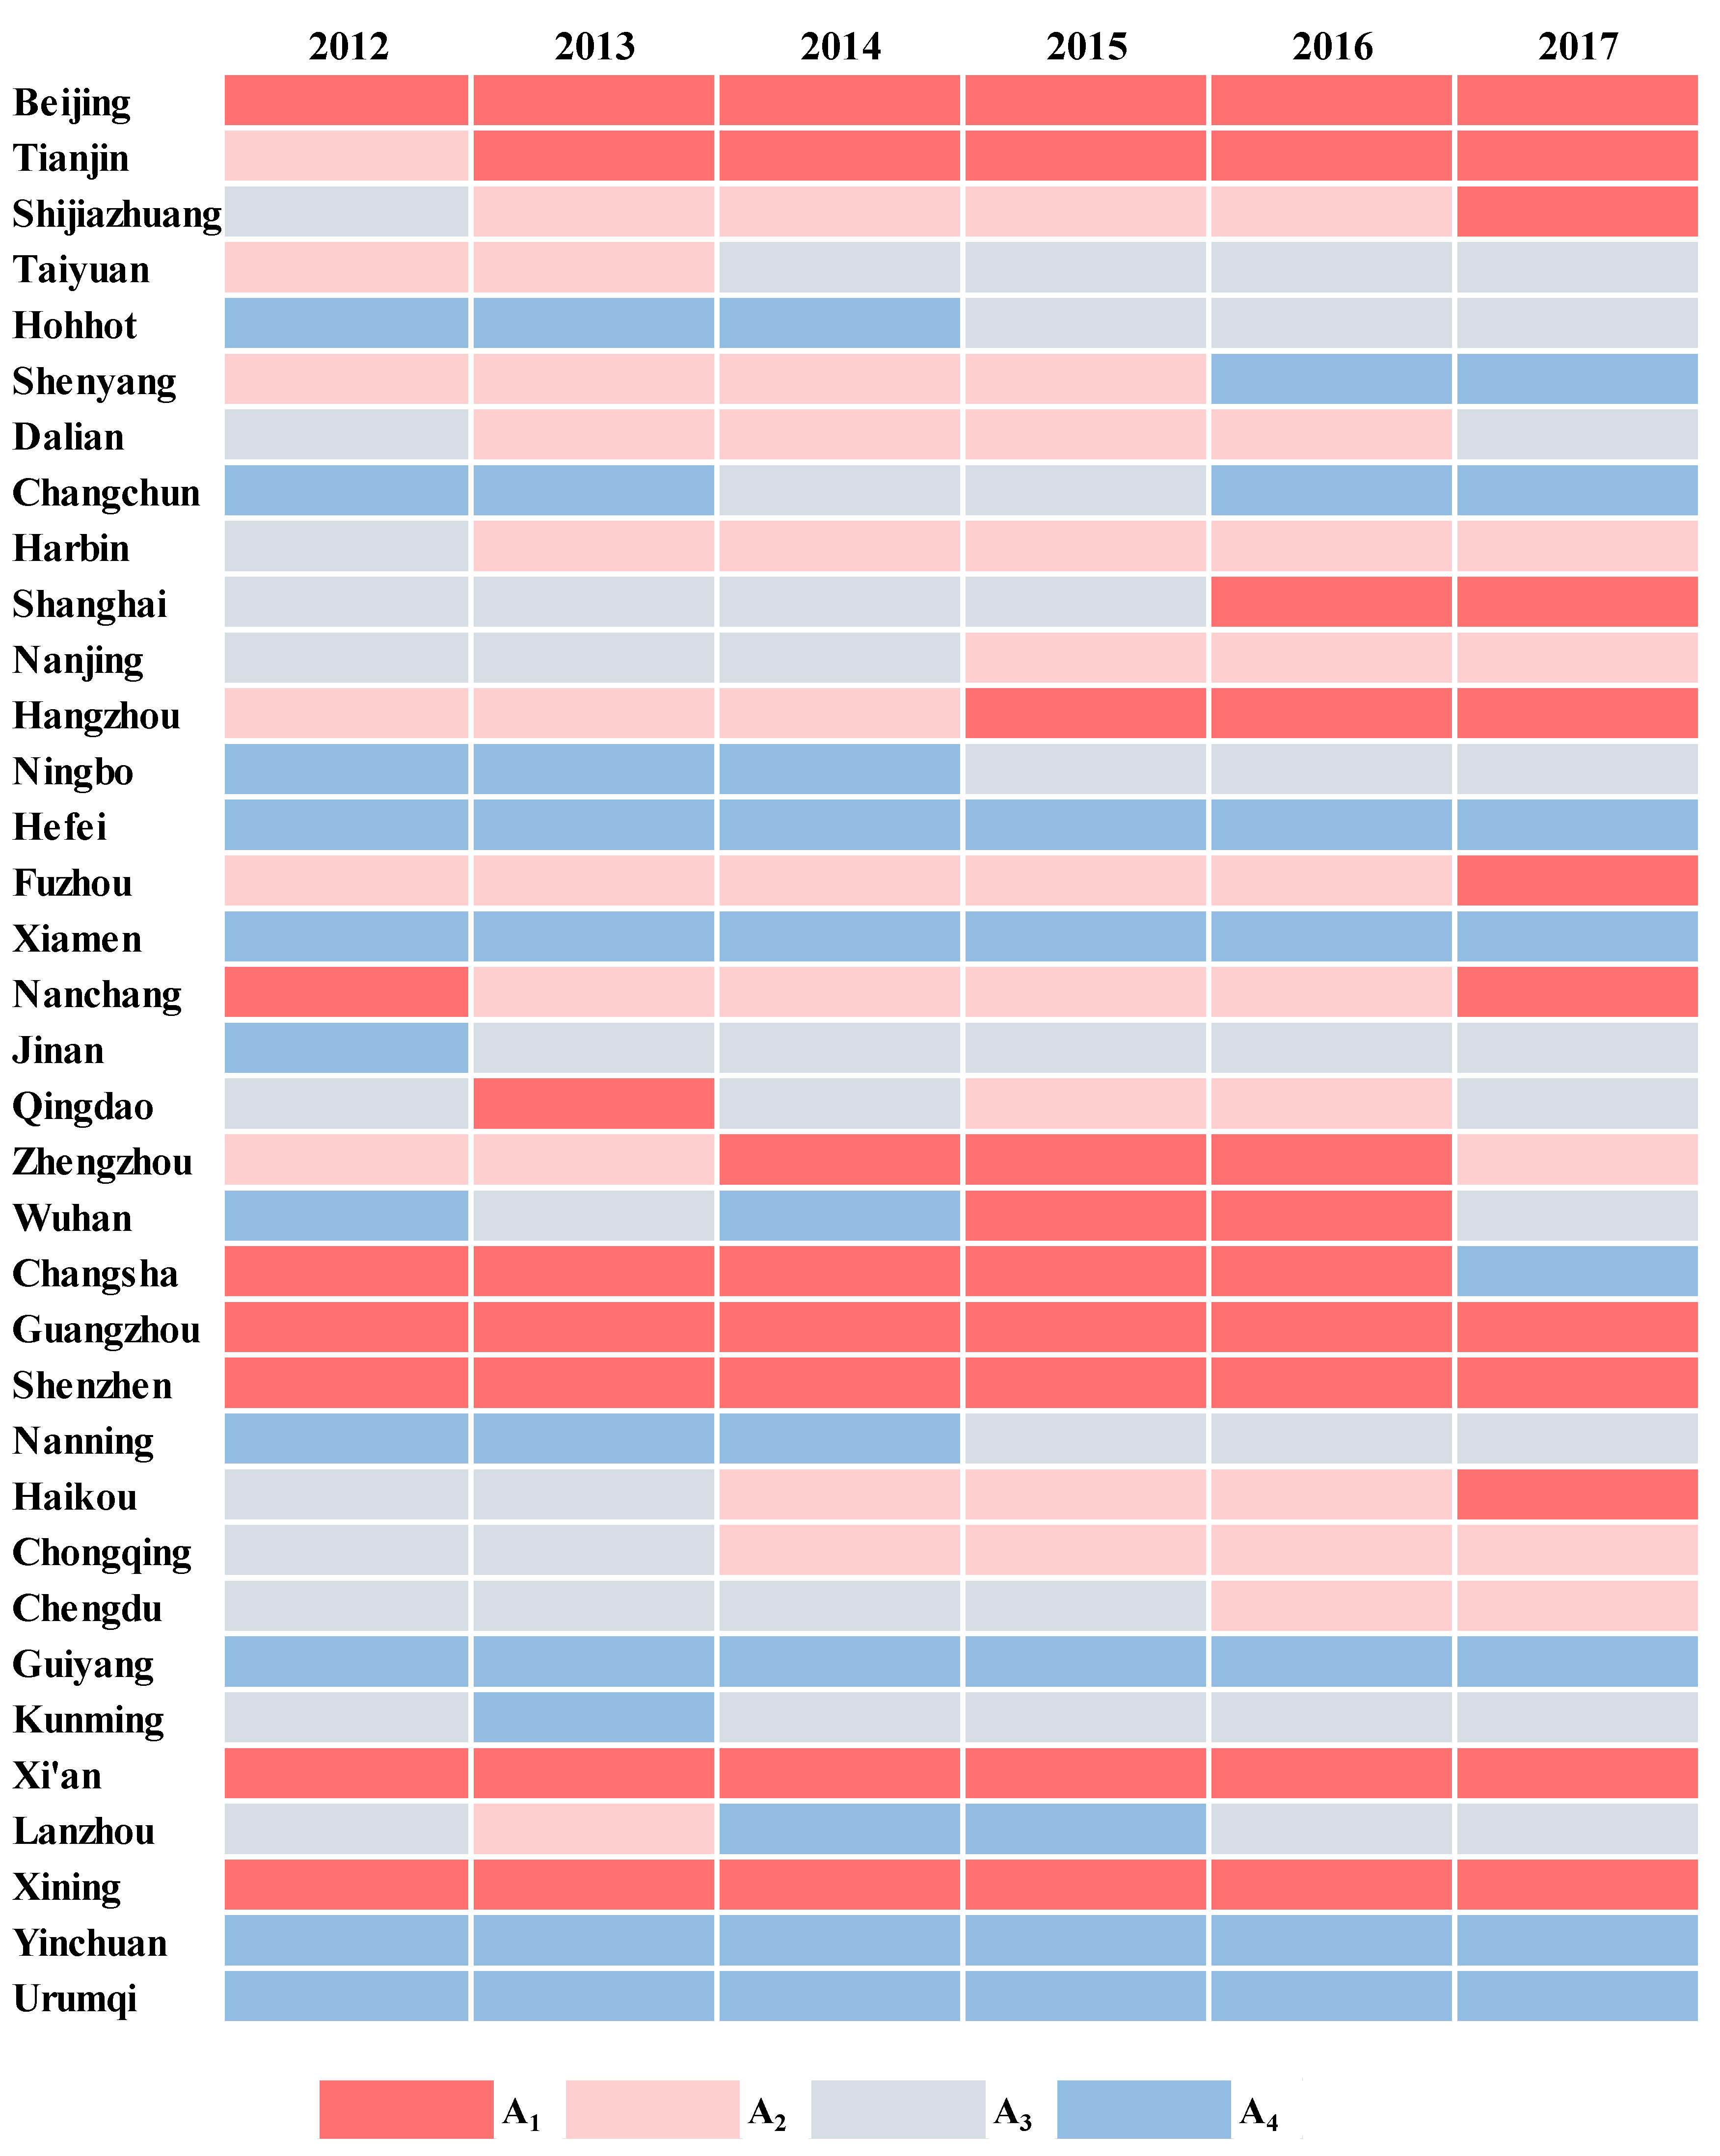
- ①
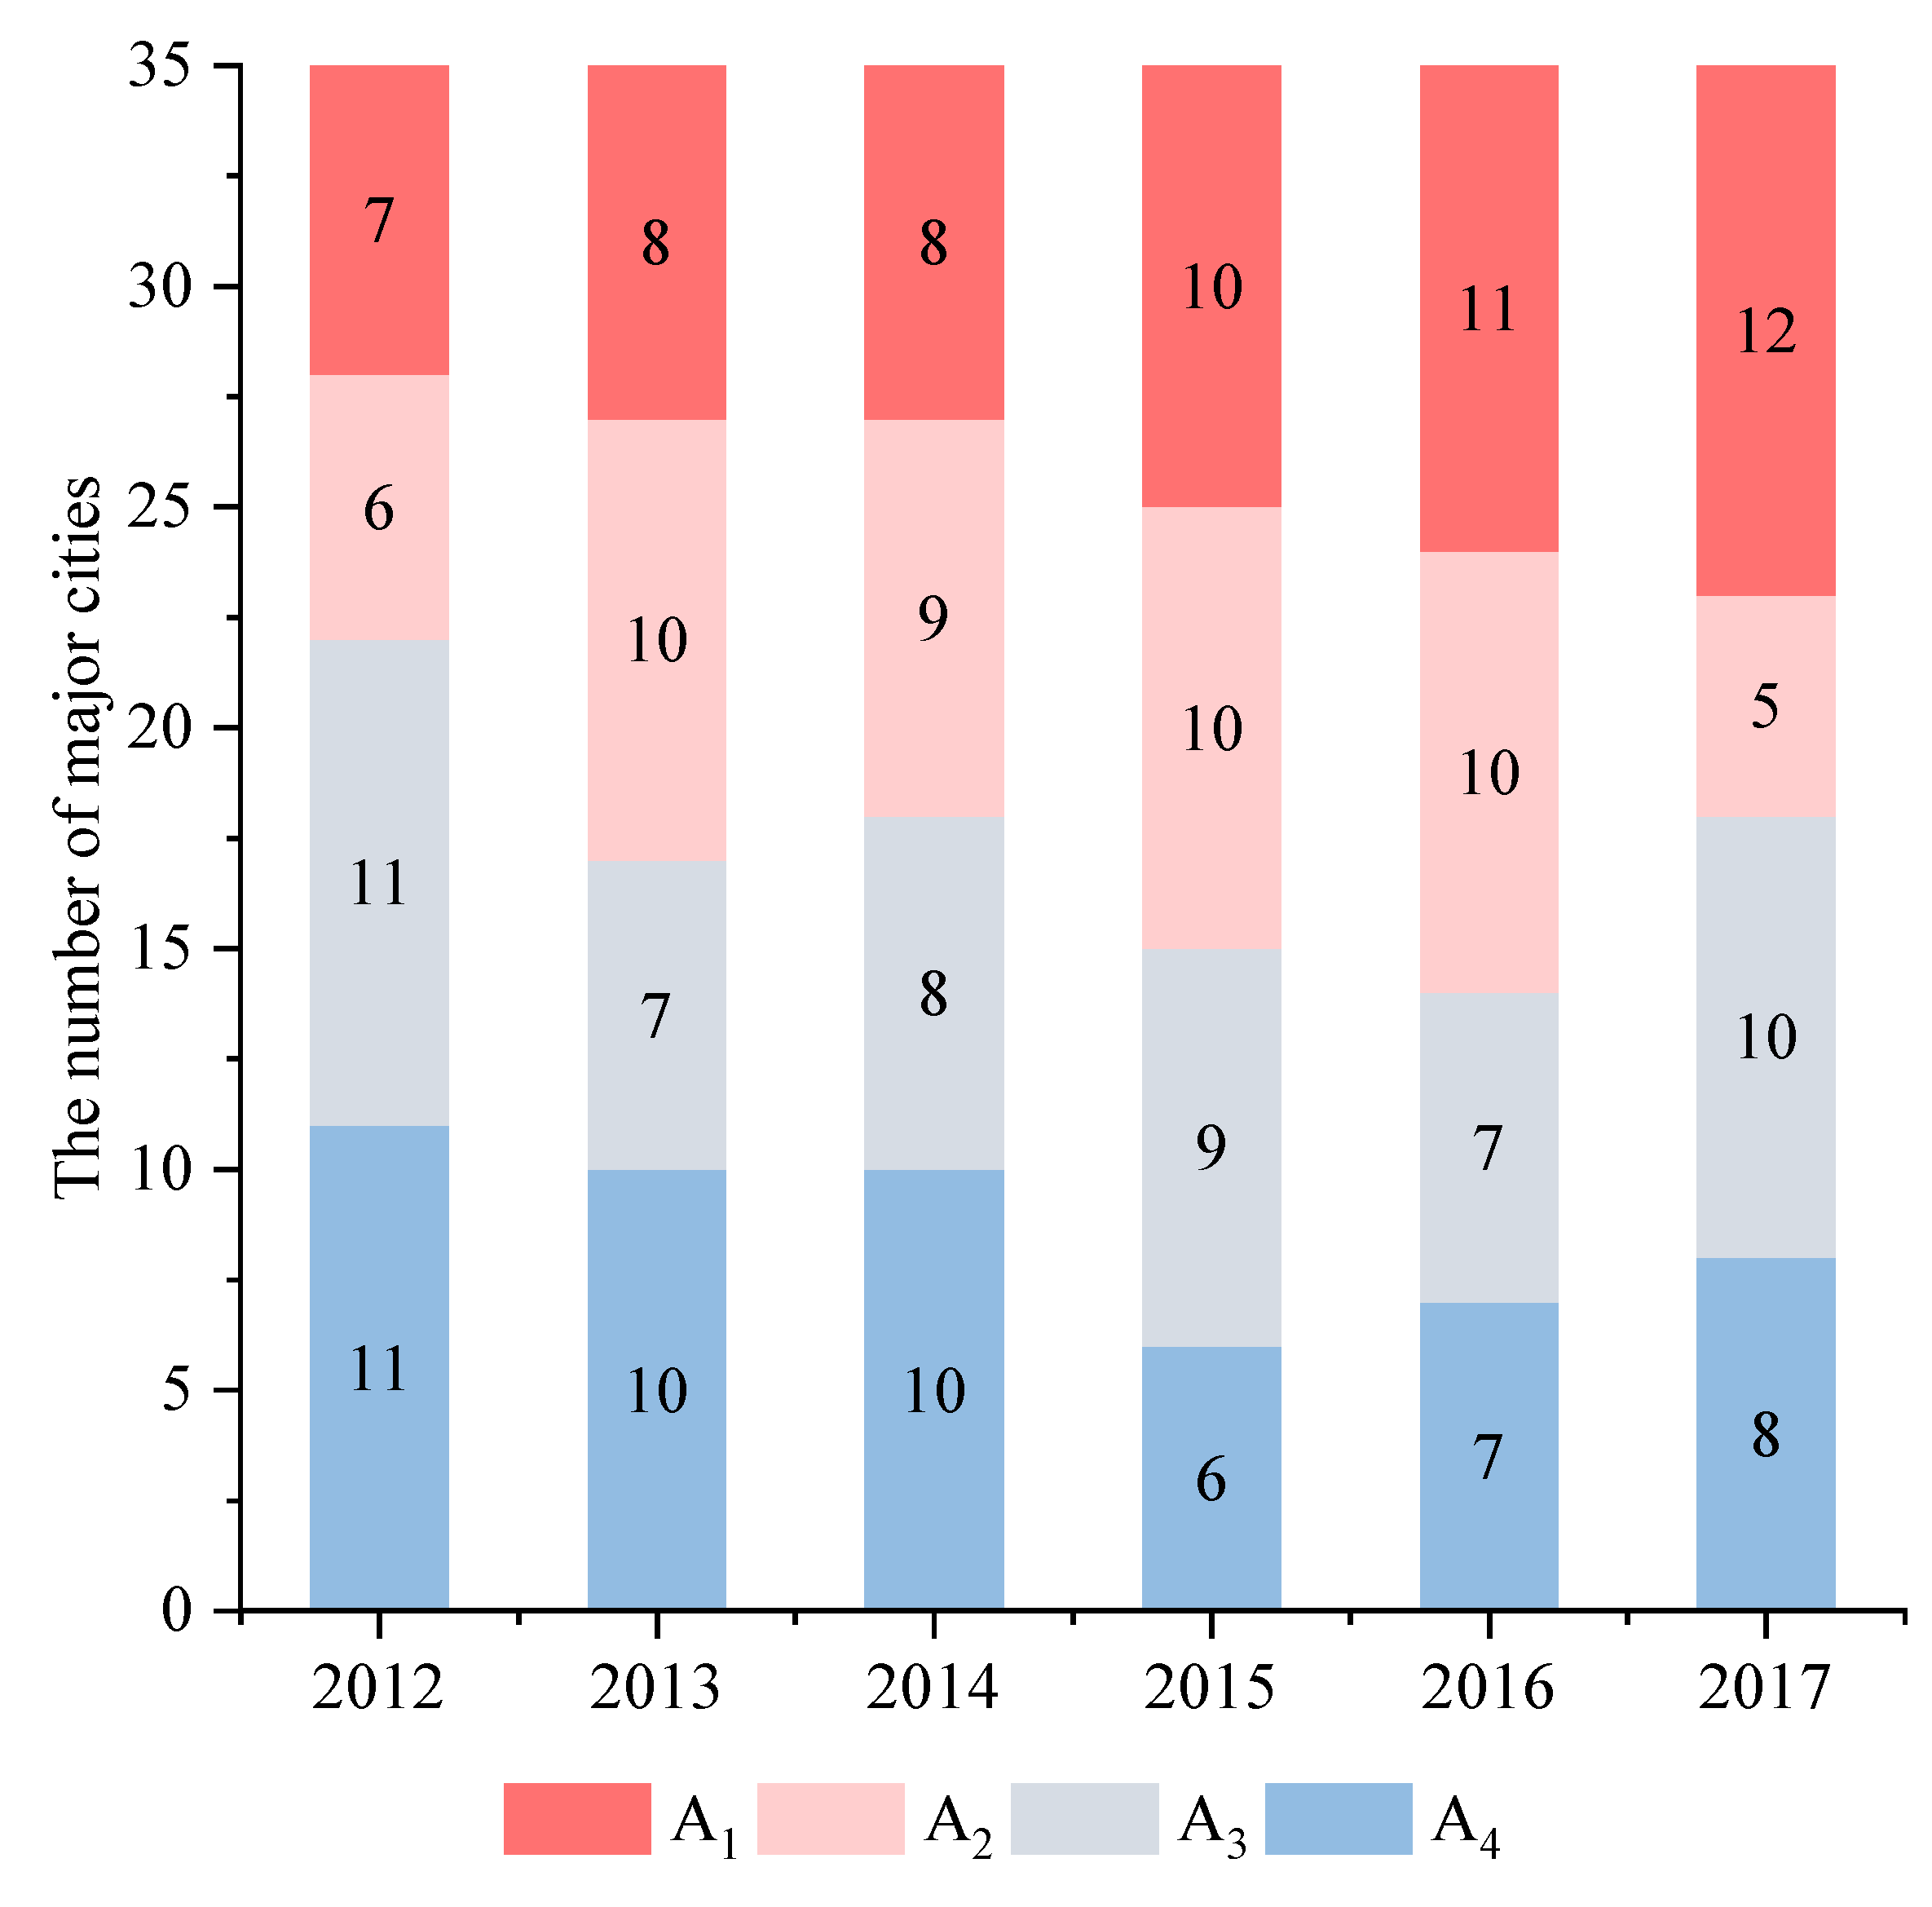
- Cities dominated by a relatively unbalanced situation with socio-economic development higher than the carrying capacity of land resources (A1)
- ②
- Cities dominated by a relatively unbalanced situation, with socio-economic development lower than the carrying capacity of land resources (A4)
- ③
- Cities dominated by a relatively balanced situation with socio-economic development slightly higher than the carrying capacity (A2)
- ④
- Cities dominated by a relatively balanced situation with socio-economic development slightly lower than the carrying capacity (A3)
6. Conclusions
Author Contributions
Funding
Institutional Review Board Statement
Informed Consent Statement
Data Availability Statement
Conflicts of Interest
References
- Wackernagel, M.; Schulz, N.B.; Deumling, D.; Linares, A.C.; Jenkins, M.; Kapos, V.; Monfreda, C.; Loh, J.; Myers, N.; Norgaard, R.; et al. Tracking the ecological overshoot of the human economy. Proc. Natl. Acad. Sci. USA 2002, 99, 9266–9271. [Google Scholar] [CrossRef] [PubMed] [Green Version]
- WWF. Living Planet Report 2020—Bending the Curve of Biodiversity Loss; WWF: Gland, Switzerland, 2020. [Google Scholar]
- Duan, W.; He, B.; Nover, D.; Fan, J.; Yang, G.; Chen, W.; Meng, H.; Liu, C. Floods and associated socioeconomic damages in China over the last century. Nat. Hazards 2016, 82, 401–413. [Google Scholar] [CrossRef]
- Li, M.; Kwan, M.-P.; Wang, F.; Wang, J. Using points-of-interest data to estimate commuting patterns in central Shanghai, China. J. Transp. Geogr. 2018, 72, 201–210. [Google Scholar] [CrossRef]
- Niu, L.; Zhang, Z.; Peng, Z.; Liang, Y.; Liu, M.; Jiang, Y.; Wei, J.; Tang, R. Identifying Surface Urban Heat Island Drivers and Their Spatial Heterogeneity in China’s 281 Cities: An Empirical Study Based on Multiscale Geographically Weighted Regression. Remote Sens. 2021, 13, 4428. [Google Scholar] [CrossRef]
- Jin, X.; Li, C. Paradigm shift in the study of land carrying capacity: An overview. J. Nat. Resour. 2018, 33, 526–540. (In Chinese) [Google Scholar]
- Chen, X.P.; Wu, C.F.; Fang, K. Differentiation and comparison of the paradigms for the carrying capacity of resources and environment. China Land Sci. 2020, 34, 17–24. (In Chinese) [Google Scholar]
- Allan, W. The African Husband Man; Oliver and Boyd: Edinburg, UK, 1965. [Google Scholar]
- Zhang, Q.A.; Zhang, F.F.; Wu, G.Y.; Mai, Q. Spatial spillover effects of grain production efficiency in China: Measurement and scope. J. Clean. Prod. 2021, 278, 10. [Google Scholar] [CrossRef]
- Wackernagel, M.; Rees, E.W. Our Ecological Footprint-Reducing Human Impact on the Earth; New Society Publishers: Gabriola, BC, Canada, 1996. [Google Scholar]
- Barrahmoune, A.; Lahboub, Y.; El Ghmari, A. Ecological footprint accounting: A multi-scale approach based on net primary productivity. Environ. Impact Assess. Rev. 2019, 77, 136–144. [Google Scholar] [CrossRef]
- Cheng, K.; Fu, Q.; Cui, S.; Li, T.; Pei, W.; Liu, D.; Meng, J. Evaluation of the land carrying capacity of major grain-producing areas and the identification of risk factors. Nat. Hazards 2016, 86, 263–280. [Google Scholar] [CrossRef]
- Guo, S.; Li, C.; Liu, S.; Zhou, K. Land carrying capacity in rural settlements of three gorges reservoir based on the system dynamic model. Nat. Resour. Modeling 2018, 31, e12152. [Google Scholar] [CrossRef]
- Tang, Y.; Yuan, Y.B.; Zhong, Q.Y. Evaluation of Land Comprehensive Carrying Capacity and Spatio-Temporal Analysis of the Harbin-Changchun Urban Agglomeration. Int. J. Environ. Res. Public Health 2021, 18, 521. [Google Scholar] [CrossRef] [PubMed]
- Luo, W.; Ren, Y.; Shen, L.; Zhu, M.; Jiang, Y.; Meng, C.; Zhang, P. An evolution perspective on the urban land carrying capacity in the urbanization era of China. Sci. Total Environ. 2020, 744, 140827. [Google Scholar] [CrossRef]
- Huang, N.S.; Kuang, Y.Q. The carrying capacity of resources and the problems of sustainable development in Guangdong province. Econ. Geogr. 2000, 20, 52–56. (In Chinese) [Google Scholar]
- Zhao, P.Y.; Guo, J.S.; Cui, Q.; Zhang, J.Q.; Feng, W.Y. Spatiotemporal analysis of the relative carrying capacity of resources in Xinzhou city based on improved model of carrying capacity related to resources. Res. Soil Water Conserv. 2017, 24, 341–347. (In Chinese) [Google Scholar]
- Rockstrom, J.; Steffen, W.; Noone, K.; Persson, A.; Chapin, F.S.; Lambin, E.F.; Lenton, T.M.; Scheffer, M.; Folke, C.; Schellnhuber, H.J.; et al. A safe operating space for humanity. Nature 2009, 461, 472–475. [Google Scholar] [CrossRef]
- Dao, H.; Peduzzi, P.; Friot, D. National environmental limits and footprints based on the Planetary Boundaries framework: The case of Switzerland. Glob. Environ. Chang. 2018, 52, 49–57. [Google Scholar] [CrossRef] [Green Version]
- FAO. A Framework for Land Evaluation; FAO Soil Bulletin 32; FAO: Rome, Italy, 1976. [Google Scholar]
- Borgstrom, G. The Hungry Planet: The Modern World at the Edge of Famine; Collier: New York, NY, USA, 1965. [Google Scholar]
- Shi, Y.; Wang, H.; Yin, C. Evaluation method of urban land population carrying capacity based on GIS—A case of Shanghai, China. Comput. Environ. Urban Syst. 2013, 39, 27–38. [Google Scholar] [CrossRef]
- Shi, Y.; Shi, S.; Wang, H. Reconsideration of the methodology for estimation of land population carrying capacity in Shanghai metropolis. Sci. Total Environ. 2019, 652, 367–381. [Google Scholar] [CrossRef]
- Mellanby, K. Can Britain Feed Itself? Merlin Press: London, UK, 1975. [Google Scholar]
- Shen, L.Y.; Shu, T.H.; Liao, X.; Yang, N.; Ren, Y.T.; Zhu, M.C.; Cheng, G.Y.; Wang, J.H. A new method to evaluate urban resources environment carrying capacity from the load-and-carrier perspective. Resour. Conserv. Recycl. 2020, 154, 16. [Google Scholar] [CrossRef]
- Liao, X.; Ren, Y.; Shen, L.; Shu, T.; He, H.; Wang, J. A “carrier-load” perspective method for investigating regional water resource carrying capacity. J. Clean. Prod. 2020, 269, 122043. [Google Scholar] [CrossRef]
- Meng, C.; Du, X.; Ren, Y.; Shen, L.; Cheng, G.; Wang, J. Sustainable urban development: An examination of literature evolution on urban carrying capacity in the Chinese context. J. Clean. Prod. 2020, 277, 122802. [Google Scholar] [CrossRef]
- Wang, J.H.; Ren, Y.T.; Shu, T.H.; Shen, L.Y.; Liao, X.; Yang, N.; He, H.M. Economic perspective-based analysis on urban infrastructures carrying capacity—A China study. Environ. Impact Assess. Rev. 2020, 83, 12. [Google Scholar] [CrossRef]
- Wang, J.; Ren, Y.; Shen, L.; Liu, Z.; Wu, Y.; Shi, F. A novel evaluation method for urban infrastructures carrying capacity. Cities 2020, 105, 102846. [Google Scholar] [CrossRef]
- Zhu, M.C.; Shen, L.Y.; Tam, V.W.Y.; Liu, Z.; Shu, T.H.; Luo, W.Z. A load-carrier perspective examination on the change of ecological environment carrying capacity during urbanization process in China. Sci. Total Environ. 2020, 714, 17. [Google Scholar] [CrossRef]
- Daily, G.C. Nature’s Services: Societal Dependence on Natural Ecosystems; Island Press: Washington, DC, USA, 1997. [Google Scholar]
- Liu, Z.; Ren, Y.; Shen, L.; Liao, X.; Wei, X.; Wang, J. Analysis on the effectiveness of indicators for evaluating urban carrying capacity: A popularity-suitability perspective. J. Clean. Prod. 2020, 246, 119019. [Google Scholar] [CrossRef]
- Department of Urban and Social, National Bureau of Statistics. China City Statistical Yearbook; China Statistics Press: Beijing, China, 2020. (In Chinese)
- Ministry of Housing and Urban-Rural Development. China County Construction Statistical Yearbook; China Statistics Press: Beijing, China, 2012–2017. (In Chinese)
- Department of Urban and Social, National Bureau of Statistics. China City Statistical Yearbook; China Statistics Press: Beijing, China, 2013–2018. (In Chinese)
- Ministry of Housing and Urban-Rural Development. China City Construction Statistical Yearbook; China Statistics Press: Beijing, China, 2012–2017. (In Chinese)
- National Bureau of Statistics. China Statistical Yearbook; China Statistics Press: Beijing, China, 2013–2018. (In Chinese)
- Chen, J.D.; Gao, M.; Cheng, S.L.; Hou, W.X.; Song, M.L.; Liu, X.; Liu, Y.; Shan, Y.L. County-level CO2 emissions and sequestration in China during 1997–2017. Sci. Data 2020, 7, 12. [Google Scholar] [CrossRef] [PubMed]
- Du, X.; Shen, L.; Wong, S.W.; Meng, C.; Yang, Z. Night-time light data based decoupling relationship analysis between economic growth and carbon emission in 289 Chinese cities. Sust. Cities Soc. 2021, 73, 103119. [Google Scholar] [CrossRef]
- MLR. Notice on Strict Enforcement of Land Use Standards to Vigorously Promote Land Saving and Intensive Land Use. Available online: http://www.gov.cn/zwgk/2012-09/13/content_2224087.htm (accessed on 20 July 2021). (In Chinese)
- Johnston, K.L.; White, K.M. Binge-drinking: A test of the role of group norms in the theory of planned behaviour. Psychol. Health 2003, 18, 63–77. [Google Scholar] [CrossRef] [Green Version]
- Li, D.J.; Zhang, H. An analysis of the relationship between Beijing’s industrial structure and economic growth and the possible reasons. J. Northeast. Univ. 2013, 15, 148–153. (In Chinese) [Google Scholar]
- Li, C.; Zhang, H.Y.; Lu, J.; Tan, B. Relation between population control and industrial structure optimization of Beijing. Urban Probl. 2013, 2–6. (In Chinese) [Google Scholar] [CrossRef]
- Huang, J.; Ma, B.B.; Xue, D.Q. Research on land use efficiency and optimal strategies in Xi’an based on SE-DEA model. Arid. Zone Res. 2015, 32, 630–636. (In Chinese) [Google Scholar]
- Cheng, S.L.; Chen, Y.T.; Meng, F.X.; Chen, J.D.; Liu, G.Y.; Song, M.L. Impacts of local public expenditure on CO2 emissions In Chinese cities: A spatial cluster decomposition analysis. Resour. Conserv. Recycl. 2021, 164, 105217. [Google Scholar] [CrossRef]
- Qi, M.Z.; Xu, F. A study on population regulation mechanism for mega-cities in China during the 13th Five-Year. Chin. J. Popul. Sci. 2017, 25–34, 126–127. Available online: http://202.202.43.73:8000/rwt/CNKI/https/NNYHGLUDN3WXTLUPMW4A/kcms/detail/detail.aspx?dbcode=CJFD&dbname=CJFDLAST2017&filename=ZKRK201702004&uniplatform=NZKPT&v=akNWhLWU8hMHmva4FFGPDin6AShpYwprZJg1yLJkT_8sUrwG0qj3UBTr8XMJAZ6E (accessed on 11 October 2021). (In Chinese).
- Cheung, S.F.; Chan, D.K.S.; Wong, Z.S.Y. Reexamining the theory of planned behavior in understanding wastepaper recycling. Environ. Behav. 1999, 31, 587–612. [Google Scholar] [CrossRef]
- Zhang, J.W.; Bai, L.B.; Yang, M.L. Spatial and temporal evolution of Yinchuan urban expansion in the last 30 years. Res. Soil Water Conserv. 2019, 359–365. (In Chinese) [Google Scholar] [CrossRef]
- Tian, X.J. Ningxia’s Economic Development Achievements, Challenges and Development Paths in the 20 Years of Western Development. Soc. Sci. Ningxia 2020, 86–93. Available online: http://202.202.43.73:8000/rwt/CNKI/https/NNYHGLUDN3WXTLUPMW4A/kcms/detail/detail.aspx?dbcode=CJFD&dbname=CJFDLAST2020&filename=LXSK202004011&uniplatform=NZKPT&v=OjfYvFXYnbuvrD9CT_cR-Rivs4b3EWkR6SIeTB5gFj9twyZGGLVa2n6AnUwiQVvG (accessed on 11 October 2021). (In Chinese).
- Shi, F. Study on the path of high-quality development of central cities in the Yellow River Basin. J. Humanit. 2020, 5–9. Available online: http://202.202.43.73:8000/rwt/CNKI/http/NNYHGLUDN3WXTLUPMW4A/kcms/detail/43.1126.K.20201011.1042.002.html (accessed on 11 October 2021). (In Chinese).
- Qu, Y.; Long, H.L. The economic and environmental effects of land use transitions under rapid urbanization and the implications for land use management. Habitat Int. 2018, 82, 113–121. [Google Scholar] [CrossRef]
- GB 50137-2011; The Code for Classification of Urban Land Use and Planning Standards of Development Land. China Academy of Urban Planning and Design: Beijing, China, 2011. (In Chinese)
- Greaves, M.; Zibarras, L.D.; Stride, C. Using the theory of planned behavior to explore environmental behavioral intentions in the workplace. J. Environ. Psychol. 2013, 34, 109–120. [Google Scholar] [CrossRef]
- An, S.W.; Zhang, J.J. Research on the high-quality development of the Shanxi. Econ. Probl. 2019, 1–8. (In Chinese) [Google Scholar] [CrossRef]
| The Meanings of ρi−j | |
|---|---|
|
|
|
|
|
|
|
|
|
|
|
|
|
|
|
|
|
|
|
|
| City | 2012 | 2013 | 2014 | 2015 | 2016 | 2017 | Average |
|---|---|---|---|---|---|---|---|
| Beijing | 0.373 | 0.372 | 0.369 | 0.367 | 0.38 | 0.398 | 0.377 |
| Tianjin | 0.29 | 0.305 | 0.306 | 0.306 | 0.307 | 0.32 | 0.306 |
| Shijiazhuang | 0.246 | 0.256 | 0.262 | 0.274 | 0.281 | 0.318 | 0.273 |
| Taiyuan | 0.284 | 0.282 | 0.243 | 0.238 | 0.224 | 0.222 | 0.249 |
| Hohhot | 0.179 | 0.174 | 0.214 | 0.237 | 0.224 | 0.222 | 0.208 |
| Shenyang | 0.274 | 0.28 | 0.262 | 0.267 | 0.219 | 0.195 | 0.250 |
| Dalian | 0.241 | 0.256 | 0.267 | 0.273 | 0.256 | 0.246 | 0.257 |
| Changchun | 0.218 | 0.215 | 0.222 | 0.227 | 0.189 | 0.198 | 0.212 |
| Harbin | 0.252 | 0.259 | 0.267 | 0.269 | 0.271 | 0.283 | 0.267 |
| Shanghai | 0.229 | 0.237 | 0.244 | 0.252 | 0.373 | 0.392 | 0.288 |
| Nanjing | 0.227 | 0.232 | 0.244 | 0.254 | 0.253 | 0.264 | 0.246 |
| Hangzhou | 0.27 | 0.278 | 0.287 | 0.303 | 0.306 | 0.299 | 0.291 |
| Ningbo | 0.195 | 0.207 | 0.204 | 0.23 | 0.245 | 0.252 | 0.222 |
| Hefei | 0.191 | 0.19 | 0.193 | 0.199 | 0.197 | 0.191 | 0.194 |
| Fuzhou | 0.262 | 0.269 | 0.271 | 0.273 | 0.287 | 0.295 | 0.276 |
| Xiamen | 0.213 | 0.206 | 0.197 | 0.196 | 0.191 | 0.215 | 0.203 |
| Nanchang | 0.301 | 0.28 | 0.284 | 0.292 | 0.293 | 0.297 | 0.291 |
| Jinan | 0.217 | 0.224 | 0.226 | 0.229 | 0.233 | 0.232 | 0.227 |
| Qingdao | 0.237 | 0.347 | 0.249 | 0.258 | 0.253 | 0.247 | 0.265 |
| Zhengzhou | 0.265 | 0.278 | 0.301 | 0.314 | 0.321 | 0.29 | 0.295 |
| Wuhan | 0.189 | 0.252 | 0.214 | 0.343 | 0.35 | 0.251 | 0.267 |
| Changsha | 0.335 | 0.314 | 0.316 | 0.338 | 0.349 | 0.183 | 0.306 |
| Guangzhou | 0.35 | 0.323 | 0.343 | 0.451 | 0.466 | 0.468 | 0.400 |
| Shenzhen | 0.377 | 0.389 | 0.409 | 0.436 | 0.455 | 0.485 | 0.425 |
| Nanning | 0.221 | 0.211 | 0.219 | 0.227 | 0.228 | 0.235 | 0.224 |
| Haikou | 0.248 | 0.239 | 0.255 | 0.253 | 0.263 | 0.462 | 0.287 |
| Chongqing | 0.247 | 0.247 | 0.254 | 0.259 | 0.268 | 0.277 | 0.259 |
| Chengdu | 0.23 | 0.226 | 0.228 | 0.251 | 0.258 | 0.271 | 0.244 |
| Guiyang | 0.217 | 0.207 | 0.207 | 0.198 | 0.212 | 0.194 | 0.206 |
| Kunming | 0.252 | 0.221 | 0.237 | 0.25 | 0.252 | 0.241 | 0.242 |
| Xi’an | 0.404 | 0.367 | 0.378 | 0.351 | 0.387 | 0.294 | 0.364 |
| Lanzhou | 0.25 | 0.259 | 0.2 | 0.218 | 0.228 | 0.238 | 0.232 |
| Xining | 0.344 | 0.355 | 0.354 | 0.364 | 0.375 | 0.37 | 0.360 |
| Yinchuan | 0.178 | 0.161 | 0.154 | 0.161 | 0.154 | 0.151 | 0.160 |
| Urumqi | 0.162 | 0.159 | 0.16 | 0.182 | 0.178 | 0.16 | 0.167 |
| Average | 0.256 | 0.259 | 0.258 | 0.273 | 0.278 | 0.276 | - |
Publisher’s Note: MDPI stays neutral with regard to jurisdictional claims in published maps and institutional affiliations. |
© 2022 by the authors. Licensee MDPI, Basel, Switzerland. This article is an open access article distributed under the terms and conditions of the Creative Commons Attribution (CC BY) license (https://creativecommons.org/licenses/by/4.0/).
Share and Cite
Luo, W.; Jin, C.; Shen, L. The Evolution of Land Resource Carrying Capacity in 35 Major Cities in China. Sustainability 2022, 14, 5178. https://doi.org/10.3390/su14095178
Luo W, Jin C, Shen L. The Evolution of Land Resource Carrying Capacity in 35 Major Cities in China. Sustainability. 2022; 14(9):5178. https://doi.org/10.3390/su14095178
Chicago/Turabian StyleLuo, Wenzhu, Chi Jin, and Liyin Shen. 2022. "The Evolution of Land Resource Carrying Capacity in 35 Major Cities in China" Sustainability 14, no. 9: 5178. https://doi.org/10.3390/su14095178
APA StyleLuo, W., Jin, C., & Shen, L. (2022). The Evolution of Land Resource Carrying Capacity in 35 Major Cities in China. Sustainability, 14(9), 5178. https://doi.org/10.3390/su14095178


