Article

The Evolution of Land Resource Carrying Capacity in 35 Major Cities in China

1
School of Economics and Management, Chongqing University of Posts and Telecommunications, Chongqing 400065, China
2
International Research Center for Sustainable Built Environment, Chongqing University, Chongqing 400045, China
3
Faculty of Architecture and the Built Environment, Delft University of Technology, 2628 BL Delft, The Netherlands
4
School of Management Science and Real Estate, Chongqing University, Chongqing 400044, China
*
Author to whom correspondence should be addressed.
Sustainability 2022, 14(9), 5178; https://doi.org/10.3390/su14095178
Submission received: 24 March 2022 / Revised: 19 April 2022 / Accepted: 20 April 2022 / Published: 25 April 2022

Abstract

:
With the rapid development of urbanization, it is necessary to understand the evolution of land resource carrying capacity (LRCC), so as to avoid irreversible damage to the land resources system in a specific region. Therefore, this paper aims to study the evolution of LRCC by four carrying status intervals of land resources. LRCC based on an evolutionary perspective can help the government manage land resources dynamically and rationally. This study defines LRCC from a carrier–load perspective and considers a higher or lower LRCC when facing the unbalanced relationship between socio-economic development and the supply capacity of land resources. Then, boxplots are used to investigate the LRCC in 35 major cities in China at different time points from 2012 to 2017. The results indicate that there was an increase in the number of cities with LRCC values in the unbalanced interval, with socio-economic development higher than the supply capacity of land resources. Shijiazhuang, Dalian, Harbin, Fuzhou, Chongqing, Kunming, and Taiyuan had LRCC values leaning towards an unbalanced situation. The main drivers that cause the phenomena mentioned above include policy, socio-economic development, and land use change. This study not only improves the understanding of the relationship between socio-economic development and the supply capacity of land resources and identifies the main drivers, but also provides a basis for control of LRCC according to the identifications of the main drivers.

1. Introduction

Regarding whether the demand placed on land resources by human activities exceeds their supply capacity, previous studies [1,2] report that, if land resources carry more population than they can bear, irreversible damage to the land resources system will happen in a specific region. With the rapid development of urbanization in China, the socio-economic activities of the increasing urban population have imposed pressures that exceed the supply capacity of land resources in some land subsystems. For example, flood disasters that occurred in recent years in Beijing are the result of the insufficiency of the drainage system’s carrying capacity to manage flood discharge [3]. The frequent traffic congestion in Shanghai is the consequence of the urban vehicle flow gradually exceeding the supply capacity of urban roads and public transportation facilities associated with the urbanization process [4]. Urbanization is a significant phenomenon of human activity that alters land use and cover, which leads to the emergence of urban heat islands [5]. Therefore, an imbalance between the supply capacity of land resources and the pressure exerted by human activities occurs frequently. Because the LRCC system (LRCC system includes the elements and the relationships among elements. The elements include human socio-economic activities and environmental pollution, as well as land resources. The relationships are the carrying of land resources to human socio-economic activities and environmental pollution is an open and changing system, it should be explored based on an evolutionary perspective by combining both the supply capacity of land resources and the pressure exerted by human activities in order to help the government to determine whether the carrying status of land resources is unbalanced, thus providing a basis for land resource management.
Opinions in the literature [6,7] on the existing paradigms of LRCC can be classified into the following five types: LRCC based on food as a limiting factor [8,9], LRCC based on the ecological footprint [10,11], LRCC based on multiple factors [12,13,14,15], LRCC based on a reference region [16,17], and LRCC based on the planetary boundary framework [18,19]. Allan [8] first proposed studying LRCC from the perspective of food as a limiting factor. This perspective was expanded by FAO [20], which studied LRCC by establishing a novel method that divides several agro-ecological cells in each country according to structure, spatial layout, and cultivation time of species. The perception of LRCC based on the ecological footprint originates from the concept of Ghost Acreage presented by Borgstrom [21] in 1965. Wackernagel and Rees [10] extended the concept of Ghost Acreage and studied LRCC, which was expressed by the surplus or deficit carrying status of land resources via comparing pressure with supply capacity. Shi et al. [22,23] studied LRCC based on multiple factors and selected many LRCC evaluation indicators from four aspects, namely, urban construction space, agricultural production space, industrial development space, and ecological protection space, according to the theory of multifunctional land use. Huang and Kuang were the first to propose studying LRCC based on a reference region [16]; they calculated the LRCC of a study area depending on its stock of land resources, but used the per capita possession of land resources in a reference region. Rockstrom et al. [18] studied LRCC based on the planetary boundary framework by using the proportion of cultivated land as an evaluation indicator. Their results show that a safe operating space is 15%, and the current value is 11.7%.
The above discussions reveal some research gaps in existing studies. Firstly, few studies have explored LRCC from the perspective of evolution. Secondly, few studies have selected evaluation indicators according to the carrying relationships between the pressure exerted by human activities and the supply capacity of land resources. Thirdly, previous studies classified the carrying status of land resources into categories and considered the higher carrying status the better. To address the research gaps in previous studies, this paper aims to study (a) the relationship between socio-economic development and the supply capacity of land resources in 35 Chinese major cities during 2012–2017; (b) the main drivers that cause the relationship. The evaluation results based on the evolutionary perspective can help governments understand the carrying status of land resources at every time point for each study area. Therefore, governments can formulate policies to ensure that the carrying status of land resources is controlled at a reasonable level. Because the problems of LRCC in other countries will be similar to China’s, other governments around the world can also adopt these policies in order to regulate LRCC.
The rest of the paper is structured as follows. Section 2 defines LRCC based on a carrier–load perspective. Section 3 details the LRCC assessment model established in this study based on the carrying relationships between land carriers and land loads; then, LRCC, expressed by the carrying status of land resources, is classified by using Boxplots. Section 4 and Section 5 present an empirical study conducted to explore the carrying status of land resources from the evolutionary perspective in 35 major Chinese cities from 2012 to 2017. Finally, conclusions, including policy implications, are provided in Section 6.

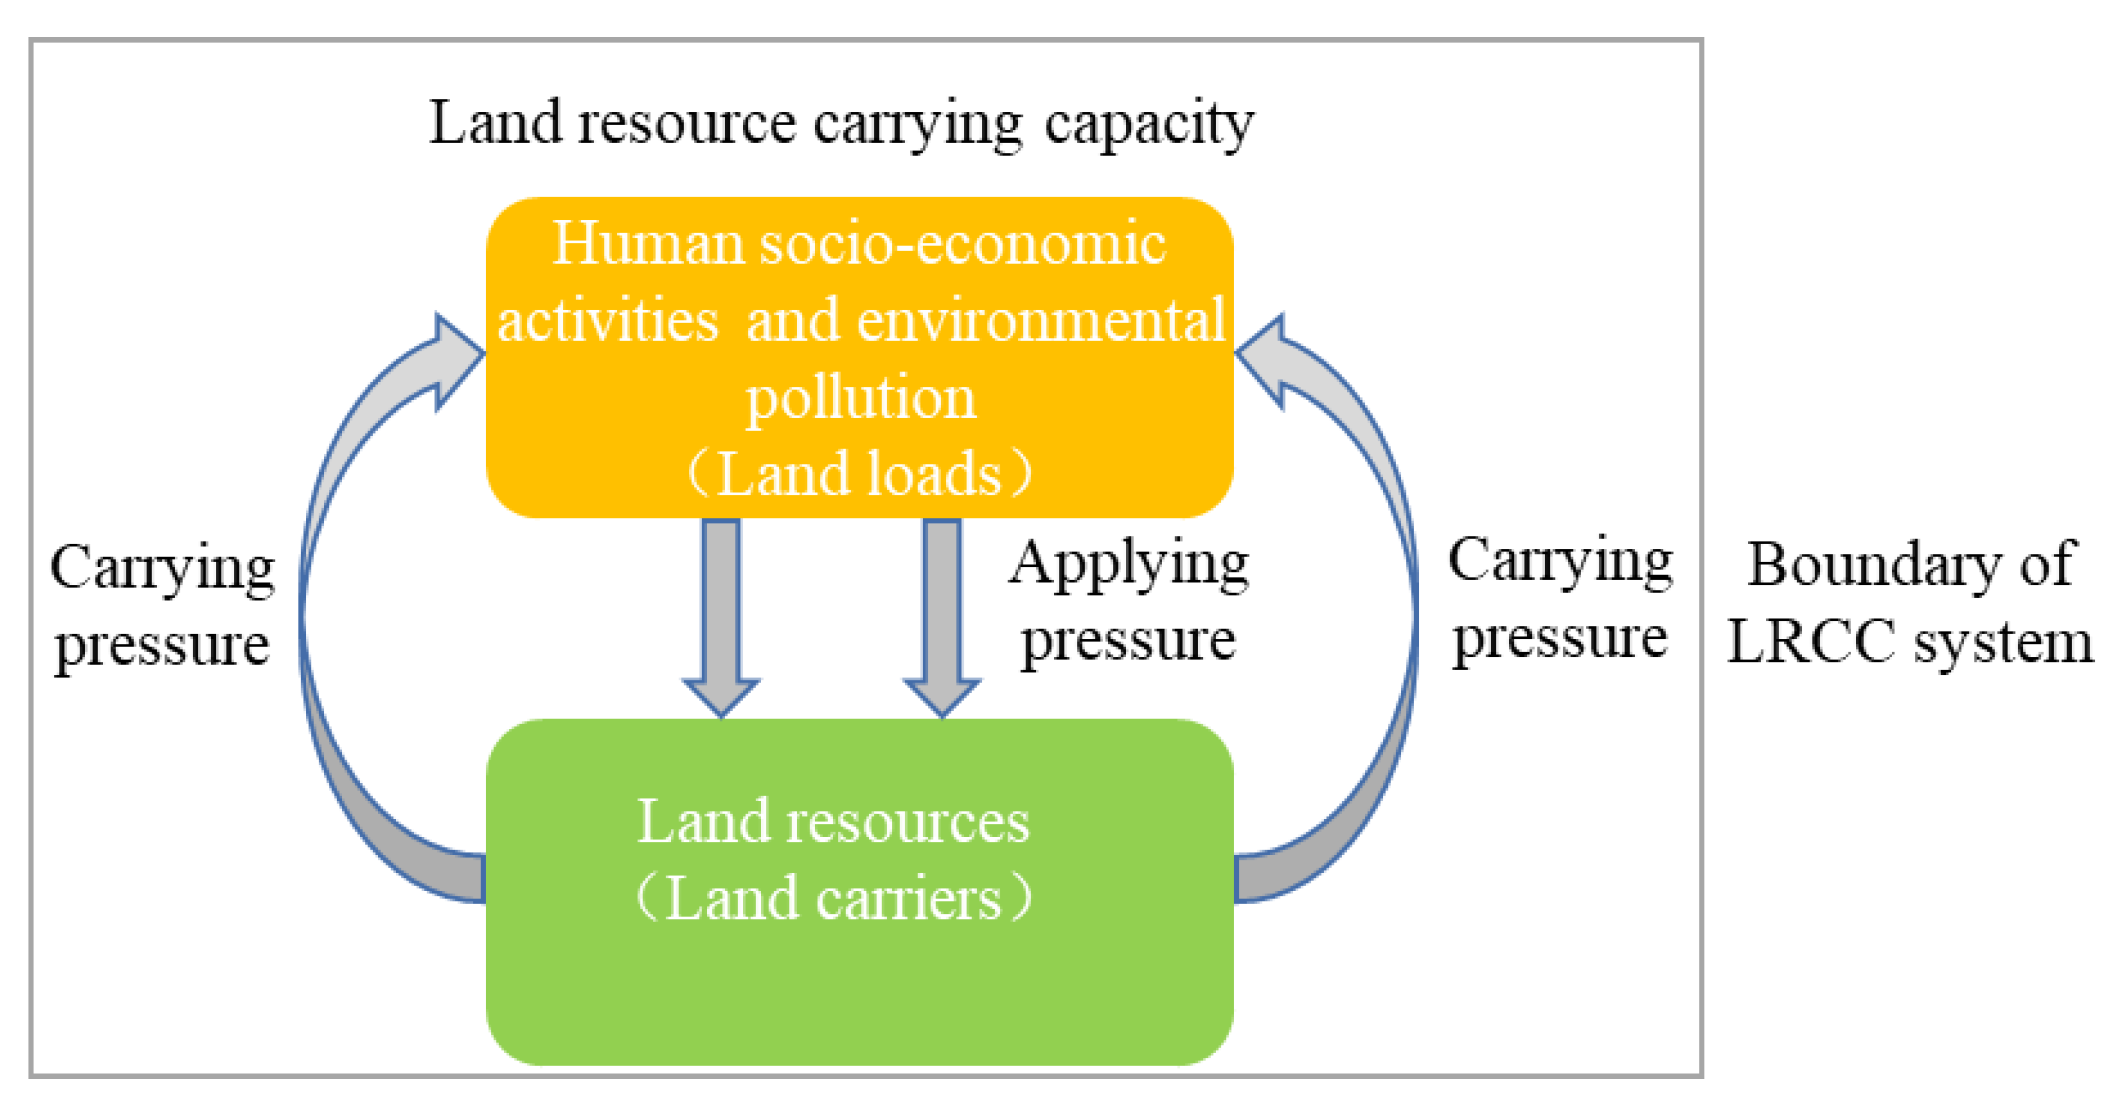
2. Definition of Land Resource Carrying Capacity

Different terrestrial ecosystems, such as cultivated land, forestland, garden land, grassland, water, residential land, and industrial land, are composed of various land resources, namely, biotic components (e.g., plants and microorganisms) and abiotic components (e.g., light, soil, air, and temperature) [20]. Adequate and rational use of land resources can create more social and economic benefits, while excessive use may lead to the unsustainable development of land resources. On the other hand, land resources are rich in some regions, but have not been fully utilized.
The existing definitions of LRCC can be summarized from the following two aspects. One aspect considers the existence of a carrying threshold. For example, Mellanby [24] considered LRCC as the carrying threshold, which was expressed by the size of the population using land resources at a specific time point for a specific region. Another aspect holds that the carrying threshold does not exist, and LRCC is instead defined as the carrying status, namely, the carrying intensity. For example, Luo et al. [15] argued that LRCC refers to the carrying status of land resources at a specific time point for a specific region.
In the urbanization process, the pressure exerted by human activities will gradually approach or even exceed the supply capacity of land resources. When the pressure is close to the critical status for the supply capacity of land resources, the land resource system will show an ability to resist the pressure and adjust itself, so the pressure and the supply capacity of land resources will maintain a relative dynamic balance. The process by which the land resource system absorbs pressure exerted by human activities and regenerates its functions, as mentioned above, can be analogized to a physical material or member (namely, a carrier) that is subjected to a load, as defined in physics. Furthermore, previous research has applied a carrier–load perspective based on physics to study the environmental resource carrying capacity [25], water resource carrying capacity [26], land resource carrying capacity [15], urban carrying capacity [27], urban infrastructure carrying capacity [28,29], and ecological carrying capacity [30]. Although evaluating LRCC based on a carrier–load perspective has been proposed in the literature [15], LRCC is not defined, and it has been assumed that, the larger the value of LRCC, the better. This paper expands on the discussion of LRCC in [15] and posits that LRCC is not a carrying threshold for land resources, but is the carrying status for land resources based on a carrier–load perspective, as shown in Figure 1.
According to Figure 1, human socio-economic activities and environmental pollution, acting as land loads, require various functions provided by land resources, and land resources as land carriers can deal with the pressure caused by human activities. For example, humans obtain food from cultivated land, garden land, and grassland. Residential land provides space for human habitation. In the definition of LRCC based on a carrier–load perspective, land carriers ( C ) are the functions provided by various types of land resources, and land loads ( L ) are the pressure exerted by human activities. The definition of LRCC in this study is significantly different from the concept of ecosystem services. Ecosystem services are the conditions and processes through which natural ecosystems and the species that make them up sustain and fulfill human life [31]. In this paper, the theory of multifunctional land use originating from the theory of ecosystem services is used to assess land carriers ( C ).
According to the literature, environmental resource carrying capacity [25] is defined as the ratio of the load imposed on the environmental resource to the environmental resource carrier. Therefore, the LRCC equation is as follows.
ρ = L C ,
A higher ρ means that land resources are carrying too much pressure, while a lower ρ means that land resources are underutilized, which is potentially wasteful.

3. Analysis Method for the Evolution of LRCC

The analysis of the evolution of LRCC in this study is divided into two steps: calculation of assessment models for LRCC and classification of the carrying status intervals of land resources using Boxplots.

3.1. Measurement Model for Land Resource Carrying Capacity

By referring to [15], the measurement model for LRCC is shown as follows:
ρ = j = 1 5 i = 1 9 ω i j × ρ i j * ,
where ρ is land resource carrying capacity; ρ i j * represents the normalized individual land resource carrying capacity ρi−j; and ω i j is the weighting value of the ratio index ρ i j * calculated by the equal weight method; numbers 5 and 9, respectively, are the number of land load and land carrier indicators.
The individual land resource carrying capacity ρi−j is constituted by the relationships between land carriers and land loads according to Equation (1), and the relationships can refer to the literature [15]. The land carrier indicators are nine types of land use area, and the land load indicators include social load, economic load and environmental load. These land carriers and land loads constitute 20 types of ρi−j, the meanings of which are shown in Table 1.

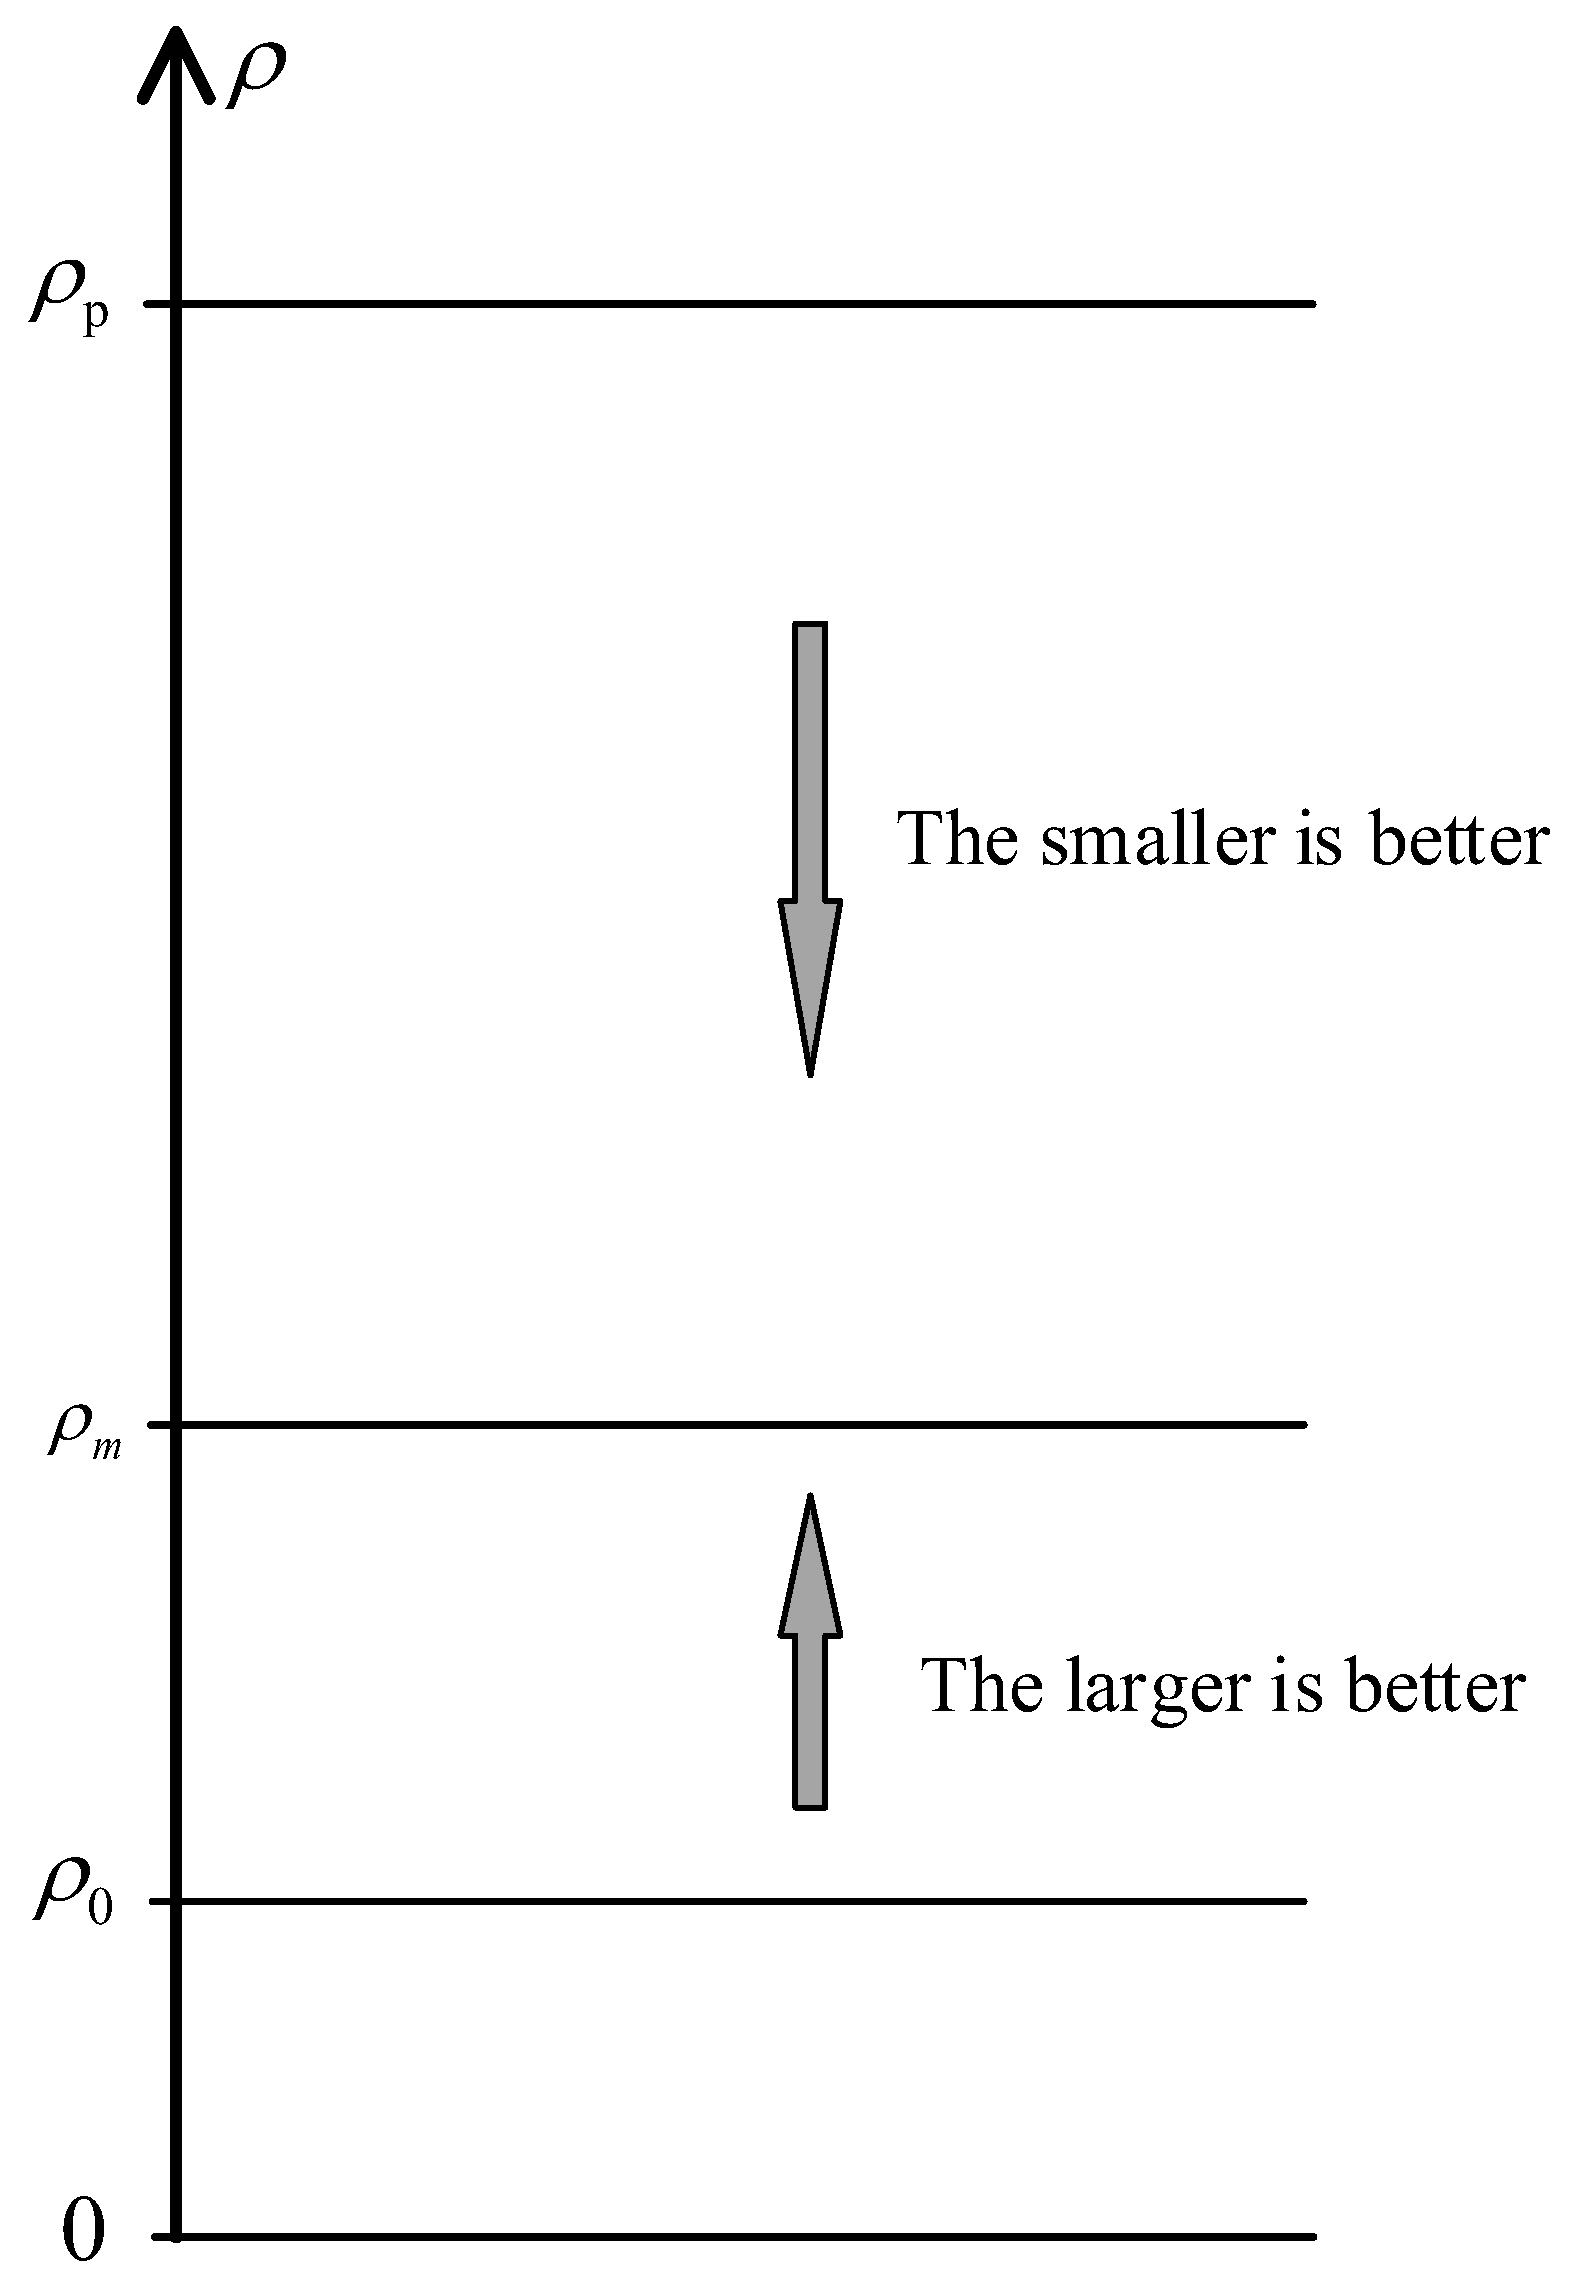
3.2. Determination of Carrying Status Interval of Land Resources by Boxplots

Determining how to scientifically understand and analyze the results is an important part of exploring the LRCC based on an evolutionary perspective. Therefore, a theoretical framework is needed to guide the exploration of the LRCC. In this study, the carrying status intervals of land resources were determined by using Boxplots.
The previous description in Section 2 suggests that a larger ρ is not necessarily better, nor is a smaller ρ . A suitable carrying status of land resources should be set, the fundamental purpose of which is to ensure a balance between the carrying capacity of land resources and the pressure exerted by human activities, in order to realize the sustainable use of land resources. In regions with relatively high socio-economic development, ρ is generally high because of the relatively large consumption of or damage to land resources, and they should maintain ρ at a relatively low carrying status. In other words, it is better to have a lower ρ in these regions, but there should be a lower limit because a value that is too low means the ineffective use and waste of land resources. On the other hand, in regions with relatively lagging socio-economic development, ρ is generally low, and they should pursue socio-economic development. In other words, it is better to have a higher ρ in these regions, but there should be an upper limit to avoid irreversible damage to land resources. The discussion above is represented in Figure 2.
As shown in Figure 2, ρ 0 is the original LRCC in a region and is not equal to zero, because there must be human socio-economic activities in that region. ρ m denotes the ideal LRCC, namely, the ideal lower limit for regions where smaller is better or the ideal upper limit for regions where larger is better. ρ p represents the potential ultimate LRCC limit, and irreversible damage to land resources in a region occurs when ρ exceeds ρ p .
Since the LRCC system is complex, it is difficult to directly determine the above-mentioned ρ 0 , ρ m , and ρ p . Therefore, a specific approach is needed to find alternative variables to ρ 0 , ρ m , and ρ p . In this study, statistics are used as the three alternative variables. Specifically, the three variables are determined by the distribution of LRCC in every sample region at a certain time point. To describe the distribution of LRCC more precisely, the Boxplot statistical method was chosen. The Boxplot method expresses the distribution of data based on a five-number summary: the minimum, first quartile, median, third quartile, and maximum [32]. In this study, the first quartile ( Q 1 ), median ( Q 2 ), and third quartile ( Q 3 ) were calculated across all samples of ρ in year t.
After calculating Q 1 , Q 2 , and Q 3 , the average of each of these three values was determined. Specifically, the average value of Q 1 is defined as the socio-economic development lower than the carrying capacity of land resources, which is represented by ρ l u . The average value of Q 2 is defined as the socio-economic development approach to the carrying capacity of land resources, which is expressed by ρ * . The average value of Q 3 is defined as socio-economic development higher than the carrying capacity of land resources.
According to ρ l u , ρ * , and ρ v l described above, the carrying status of land resources is divided into four intervals: the relatively unbalanced intervals A 4 ( ρ < ρ l u ) and interval A 1 ( ρ ρ v l ), the relatively balanced interval A 3 ( ρ l u ρ < ρ * ) and the interval A 2 ( ρ * ρ < ρ v l ). Among the four intervals, socio-economic development is lower or higher than the carrying capacity of land resources in interval A 4 or A 1 , and is approached in interval A 3 and A 2 . Therefore, A 3 and A 2 are relatively reasonable, while A 4 and A 1 intervals should be the focus of attention.
In a time series, ρ changes dynamically. The types of fluctuation include smooth fluctuation, fluctuation with an upward trend, and fluctuation with a downward trend. The three fluctuation types represent the ability of land carriers to resist land loads and adjust accordingly.
To identify the common reasons for the evolution of LRCC under four intervals, namely A 1 , A 2 , A 3 , and A 4 , it is necessary to analyze principal components ρ i j . For study area n in year t under an interval, the calculation of proportion made by Equation (3):
P i j = ω i j × ρ i j * ρ ,
Every P i j is arranged in descending order for area n in year t under an interval. When P i j is equal to 90% or bigger than this, the principal components ρ i j are identified for study area n in year t . To obtain the principal components for study area n , the intersection of principal components in every year is calculated. Similarly, principal components under a LRCC interval are obtained by calculating the intersection of principal components in every study area.

4. Study Area and Research Data
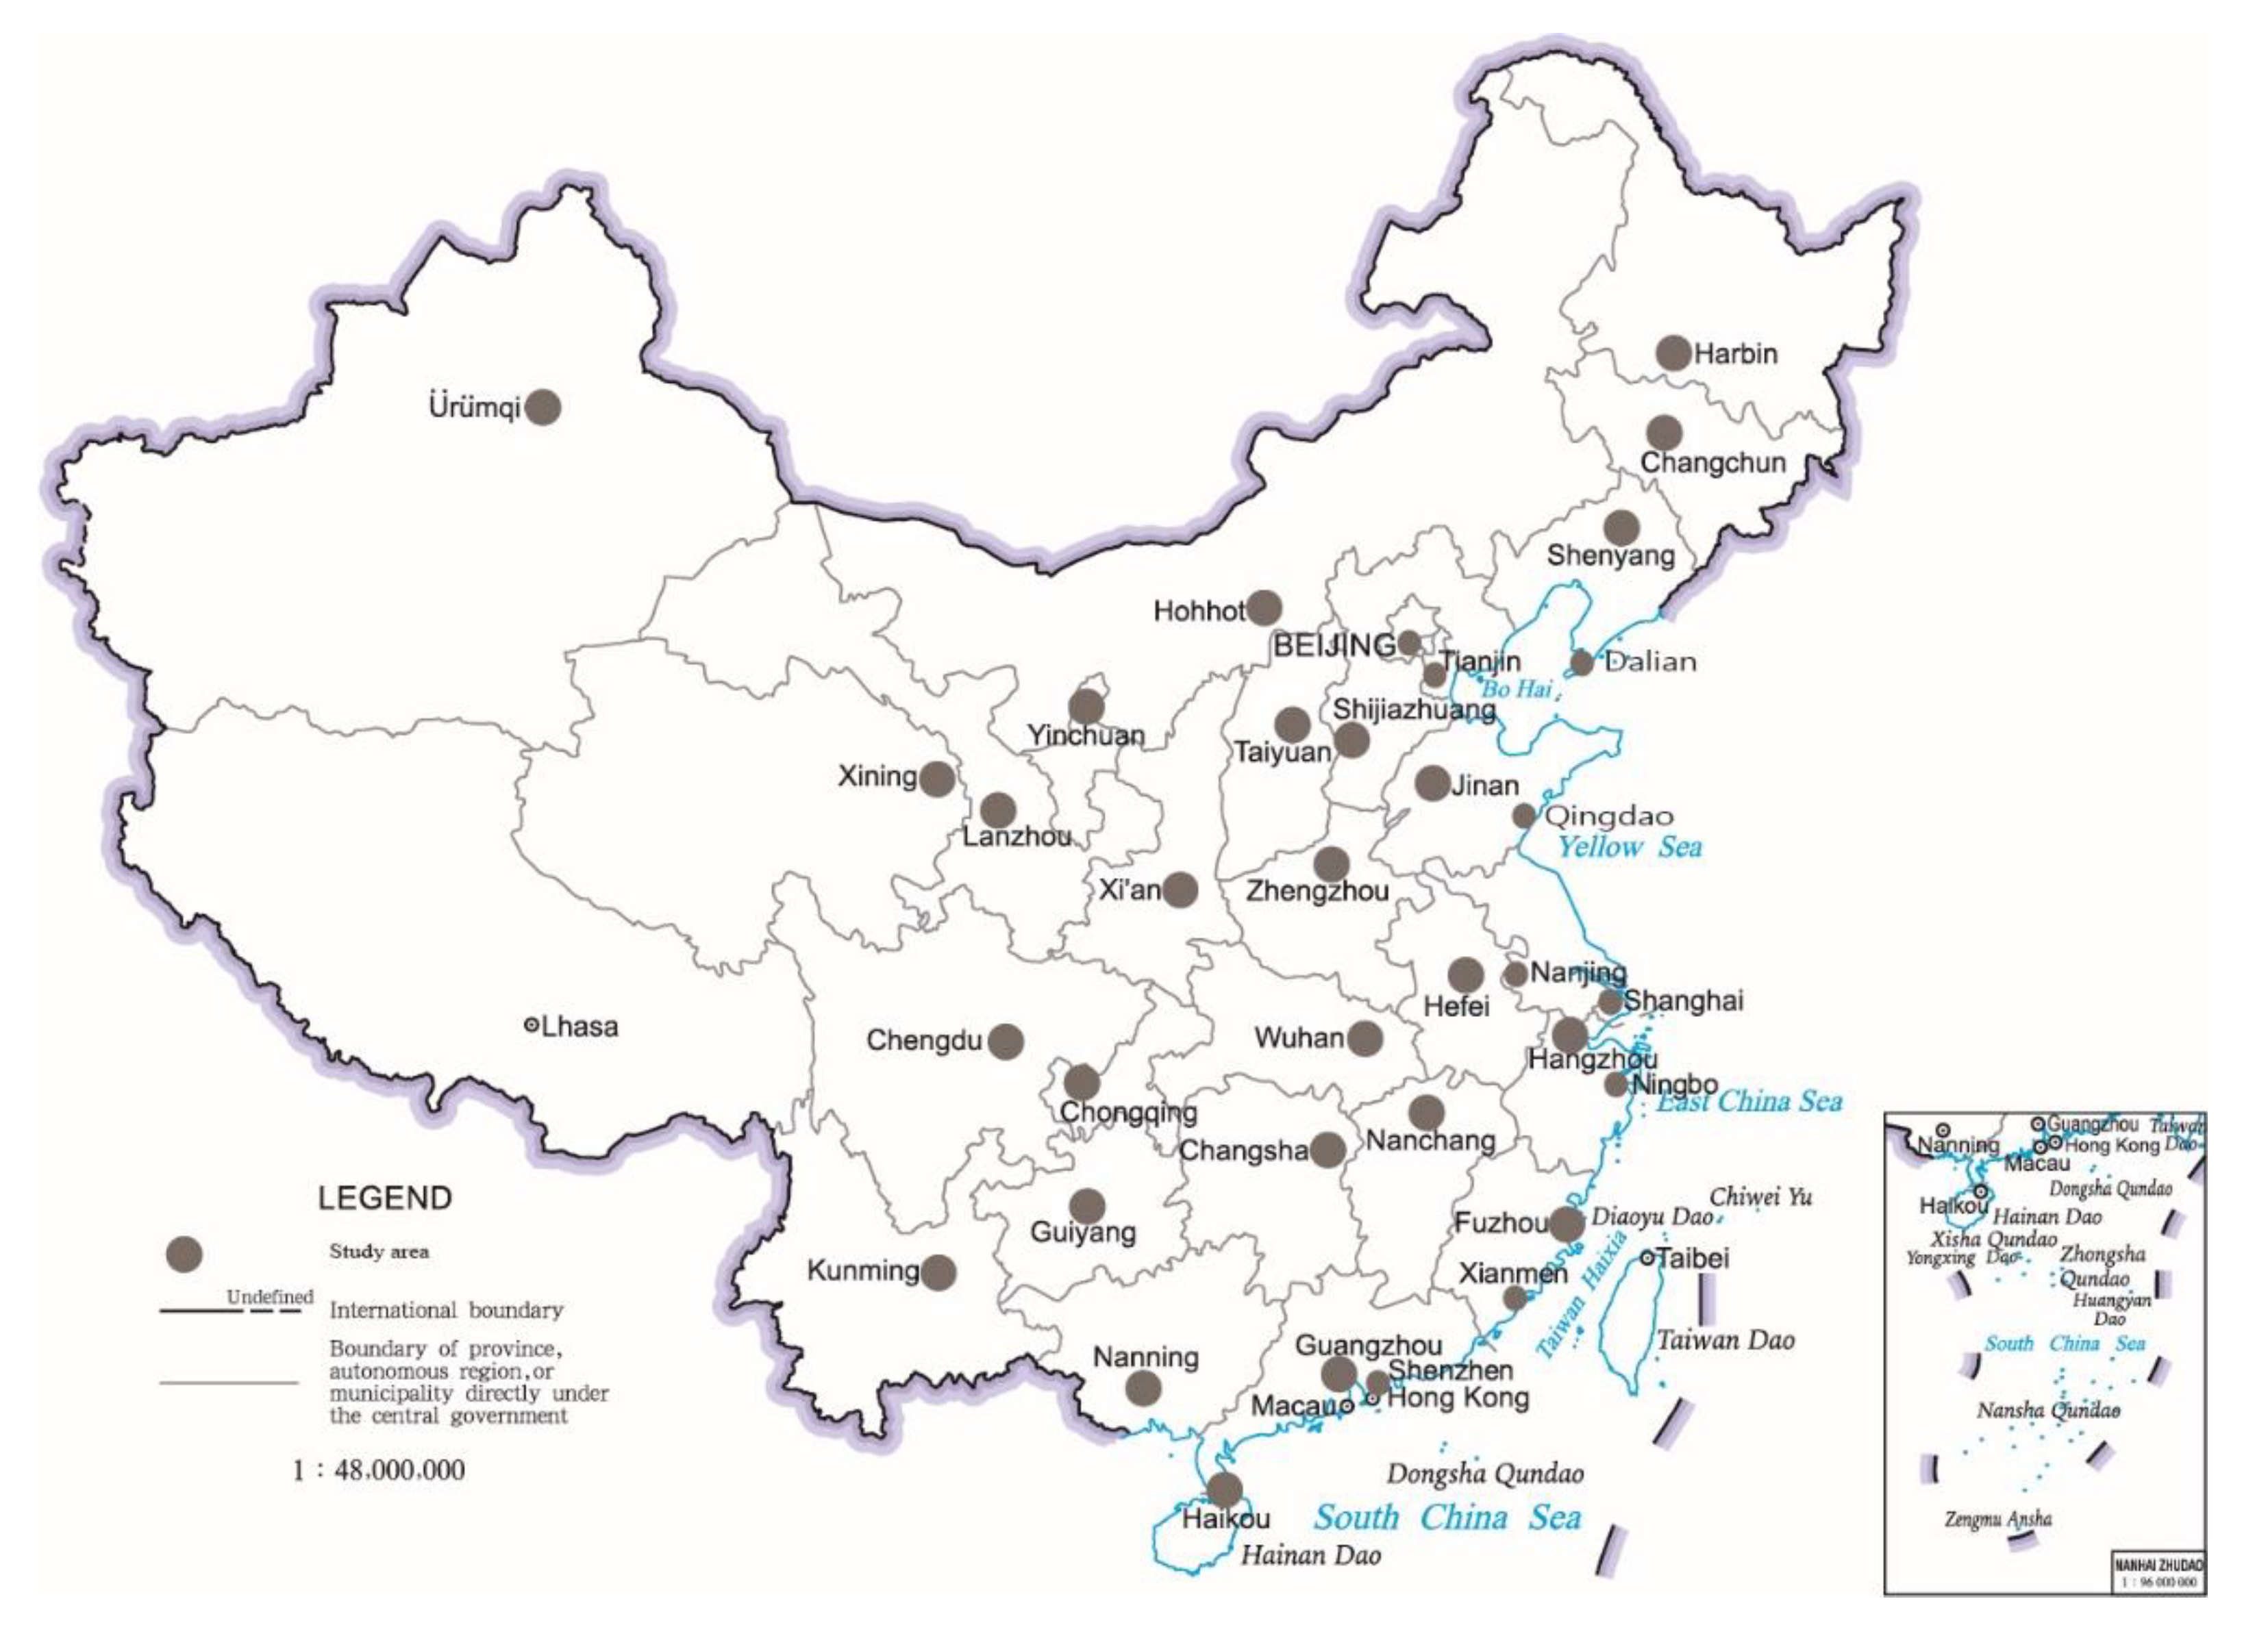
4.1. Study Area

Our dataset consists of 35 major cities in China over the period from 2012 to 2017. These are all large cities (according to the State Council’s Notification on the Adjustment of the Standard for the Classification of City Scale (No. 51 [2014] of the State Council), cities with a resident population of less than half a million in urban areas are small cities; cities with a resident population of more than half a million and less than one million in urban areas are medium-sized cities; cities with a resident population of more than one million and less than five million in urban areas are large cities; cities with a resident population of more than five million and less than ten million in urban areas are huge cities. Cities with a resident population of more than 10 million are considered megacities.) with populations greater than one million and are leading the way in social and economic development in China. Among the 684 cities in China [33], the 35 major cities make up a quarter of the total urban population. These cities represent all of China’s municipalities, provincial capitals, and sub-provincial cities, providing a better indication of the carrying capacity of land resources at different points in time. Figure 3 shows the location of these cities.

4.2. Research Data

The data used in this paper were drawn from a range of official statistical yearbooks, including the China County Construction Statistical Yearbook (2012–2017) [34], China City Statistical Yearbook (2013–2018) [35], China City Construction Statistical Yearbook (2012–2017) [36], China Statistical Yearbook (2013–2018) [37], and Carbon Emission Accounts and Datasets (CEADs) (2012–2017) (https://www.ceads.net.cn/ accessed on 20 October 2021). Carbon emissions (the molecule of ρ 8 5 and ρ 9 5 ) in the 35 major cities were determined from the CEADs website, which discloses data on carbon emissions from [38] published in Scientific Data. The data on the CEAD’s website are also applicable to broader socio-economic contexts. For example, they were employed to study the decoupling relationship between economic growth and carbon emissions in 289 Chinese cities (see reference [39]). Data on the other indicators are from the official statistical yearbooks mentioned above, which have been the foundation of many previous studies [25,26,28,29,30] in Chinese socio-economic contexts.
Owing to the implementation of the Planning Standards of Development and Code for Classification of Urban Land Use in 2012, the statistical caliber of land use/cover types has changed. To avoid differences in statistical caliber, the empirical research data used in this study are from the period 2012–2017. The weight value of ρ i j * is calculated according to equal weight method. There are 20 ρ i j * in total, and because each LRCC is equally important, the weight value ( ω i j ) is equal to 1 20 .

5. Results and Discussion

5.1. Results of LRCC

By applying the obtained data to calculate individual LRCC ( ρ i j ), normalized individual LRCC ( ρ i j * ) and LRCC ( ρ ) according to Equation (2), we obtained the values of the LRCC ( ρ ) for the 35 sample cities between 2012 and 2017. The results are shown in Table 2.
As can be seen from Table 2, ρ varied greatly among the 35 cities between 2012 and 2017, with the maximum value being for Shenzhen in 2017 (0.485), and the minimum value being for Yinchuan in 2017 (0.151). The overall variation in ρ for the 35 sample cities has a range of (0.151, 0.485). Furthermore, the fluctuation of ρ varied from city to city. For example, the fluctuation range is (0.367, 0.398) for Beijing and (0.159, 0.182) for Urumqi. Moreover, the mean values of ρ for the 35 cities varied significantly between 2012 and 2017. The three cities with the highest values are Shenzhen (0.425), Guangzhou (0.4), and Beijing (0.377), whereas the three cities that ranked lowest are Hefei (0.194), Urumqi (0.167), and Yinchuan (0.16).

5.2. Evolution of Land Resource Carrying Capacity between Major Cities in China

Based on the results in Table 2, this section analyzes the evolution patterns of LRCC in 35 major cities in China, including the division of LRCC intervals and the evolutionary analysis of LRCC.

5.2.1. The Results of LRCC Intervals between Major Cities in China

Based on the results in Table 2, the corresponding parameters of the LRCC values for each year were calculated by applying the Boxplot method: first quartile ( Q 1 ), median quartile ( Q 2 ), and third quartile ( Q 3 ). Their mean values were then calculated, which yielded ρ l u = 0.222, ρ * = 0.253, and ρ v l = 0.294. According to these three values, the LRCC performance was divided into four intervals, namely, the interval A 4 ( ρ < 0.222 ), the interval A 3 ( 0.222 ρ < 0.253 ), the interval A 2 ( 0.253 ρ < 0.294 ), and A 1 ( ρ 0.294 ).
By using the ρ results in Table 2 and the interval classification criteria ( A 1 A 4 ) mentioned above, the temporal evolution of the LRCC for the 35 major cities in 2012–2017 was determined, as shown in Figure 4.

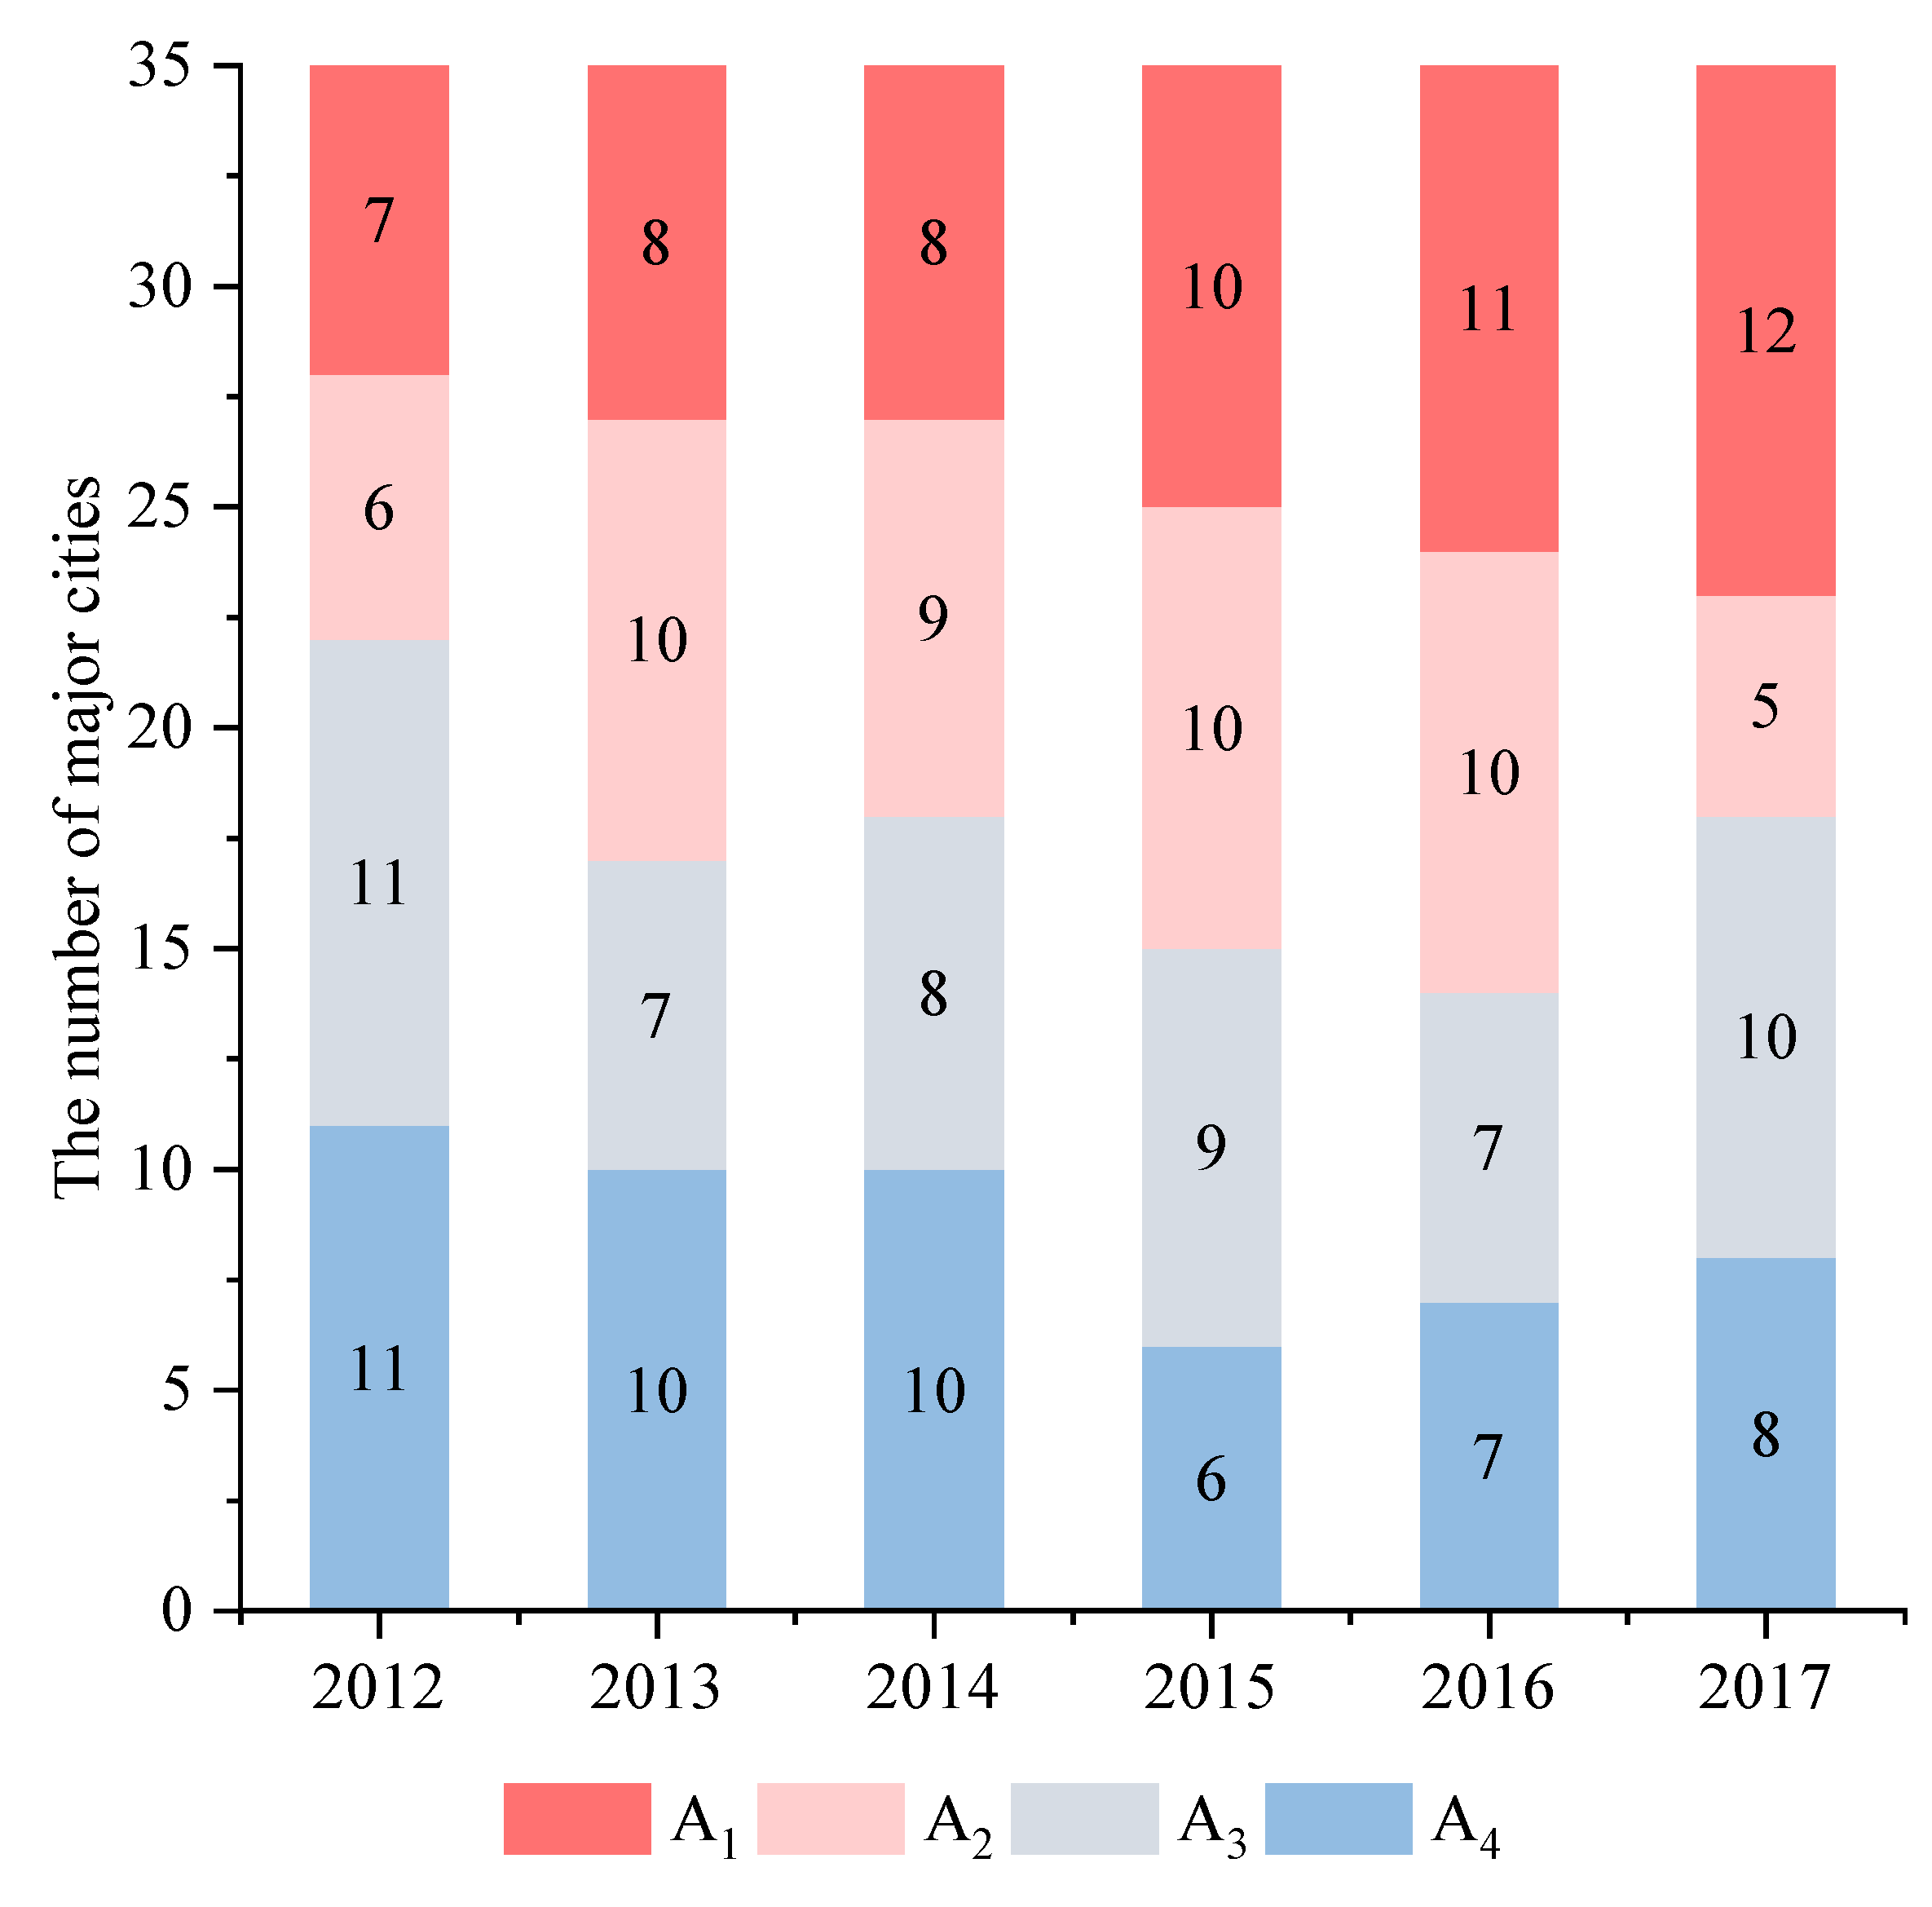
5.2.2. Overall Evolution of LRCC in 35 Major Chinese Cities

To analyze the overall evolution patterns of the LRCC in the 35 sample cities, the number of cities in each of the four different LRCC performance intervals in Figure 4 was statistically plotted over time. The results are shown in Figure 5.
As can be seen in Figure 5, the number of cities in the four different LRCC performance intervals changed significantly over the period 2012–2017. Specifically, the number of cities in the A1 and A3 intervals increased, while that in the A4 interval decreased. This indicates that the intensity of land loads on land carriers increased between 2012 and 2017 in 35 major cities in China. This may be attributed to China’s strong efforts in recent years to promote economical and intensive land use, which have increased the level of utilization of land resource carriers. For example, Notice on Strict Enforcement of Land Use Standards to Vigorously Promote Land Saving and Intensive Land Use [40], issued by the Ministry of Land and Resources (now renamed the Ministry of Natural Resources) in 2012, stated that localities should strictly follow the various land policies issued by the State and resolutely implement the control targets for construction land for highways, railways, civil aviation transport airports, electric power, and coal, oil, and gas projects, among others. In addition, the sizes of land lots and floor area ratio standards for real estate land should be controlled. These initiatives have been proven to enhance the carrying capacity of urban construction land for socio-economic activities [41].

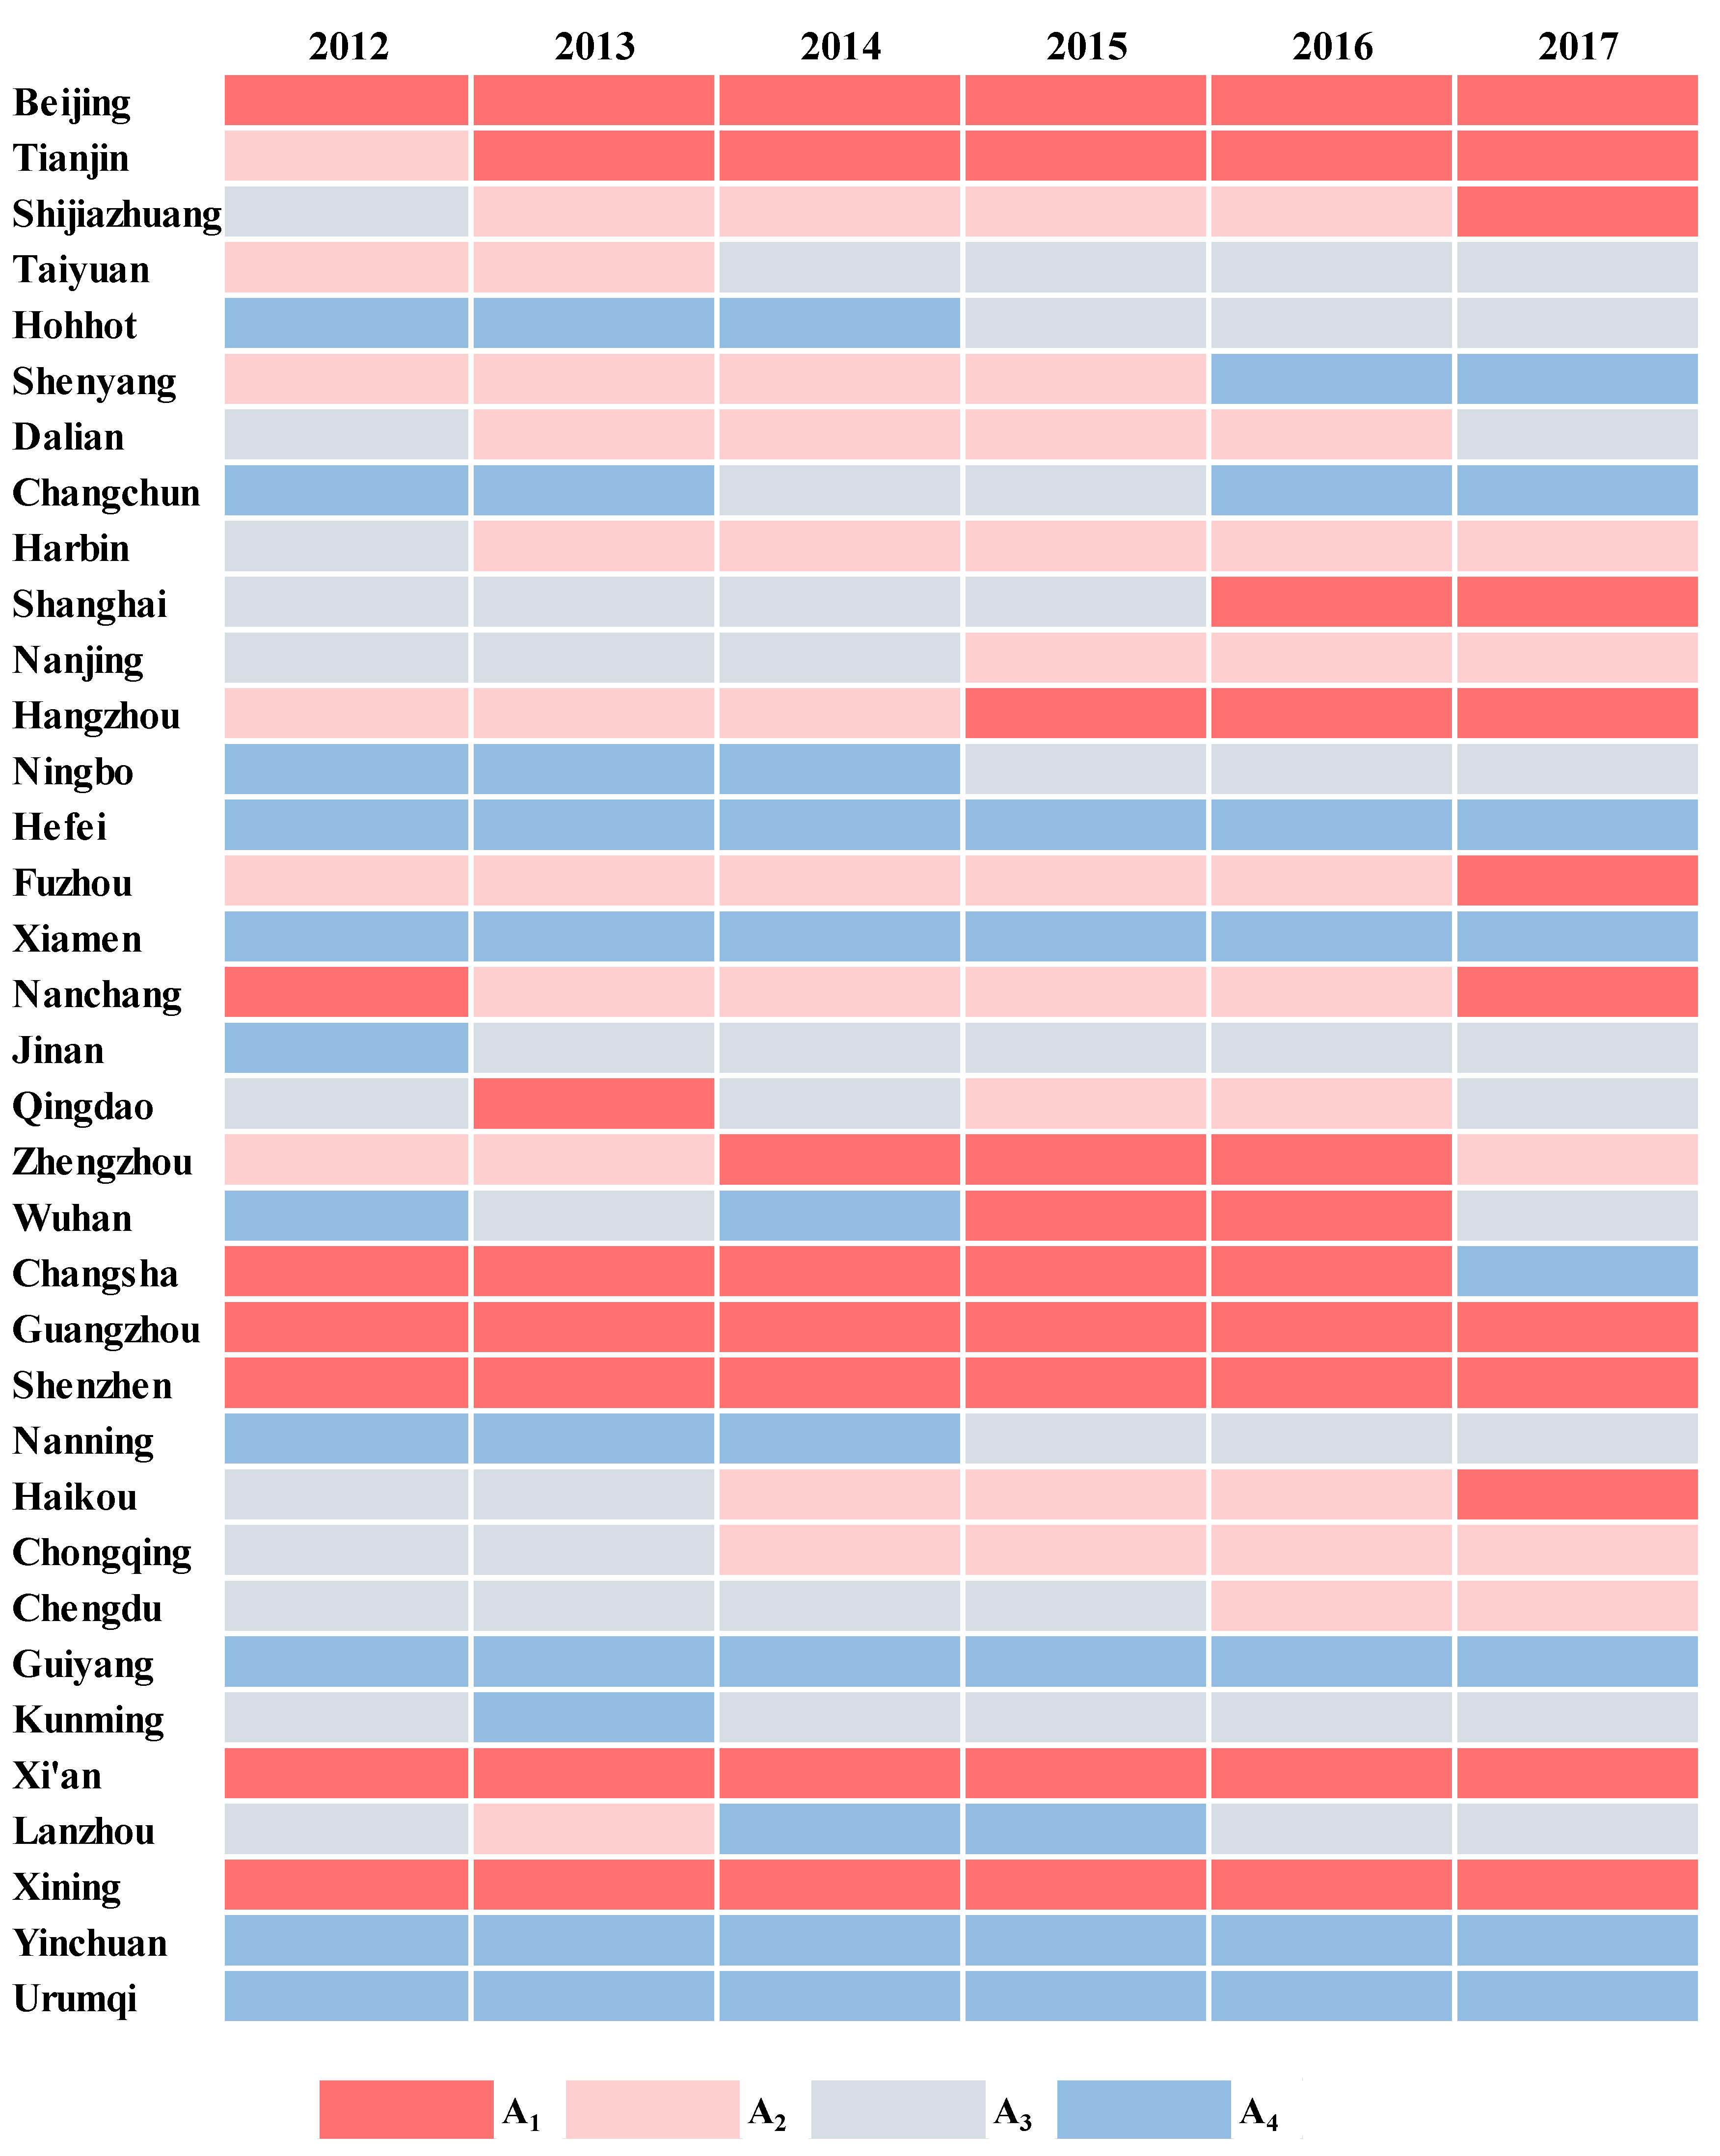
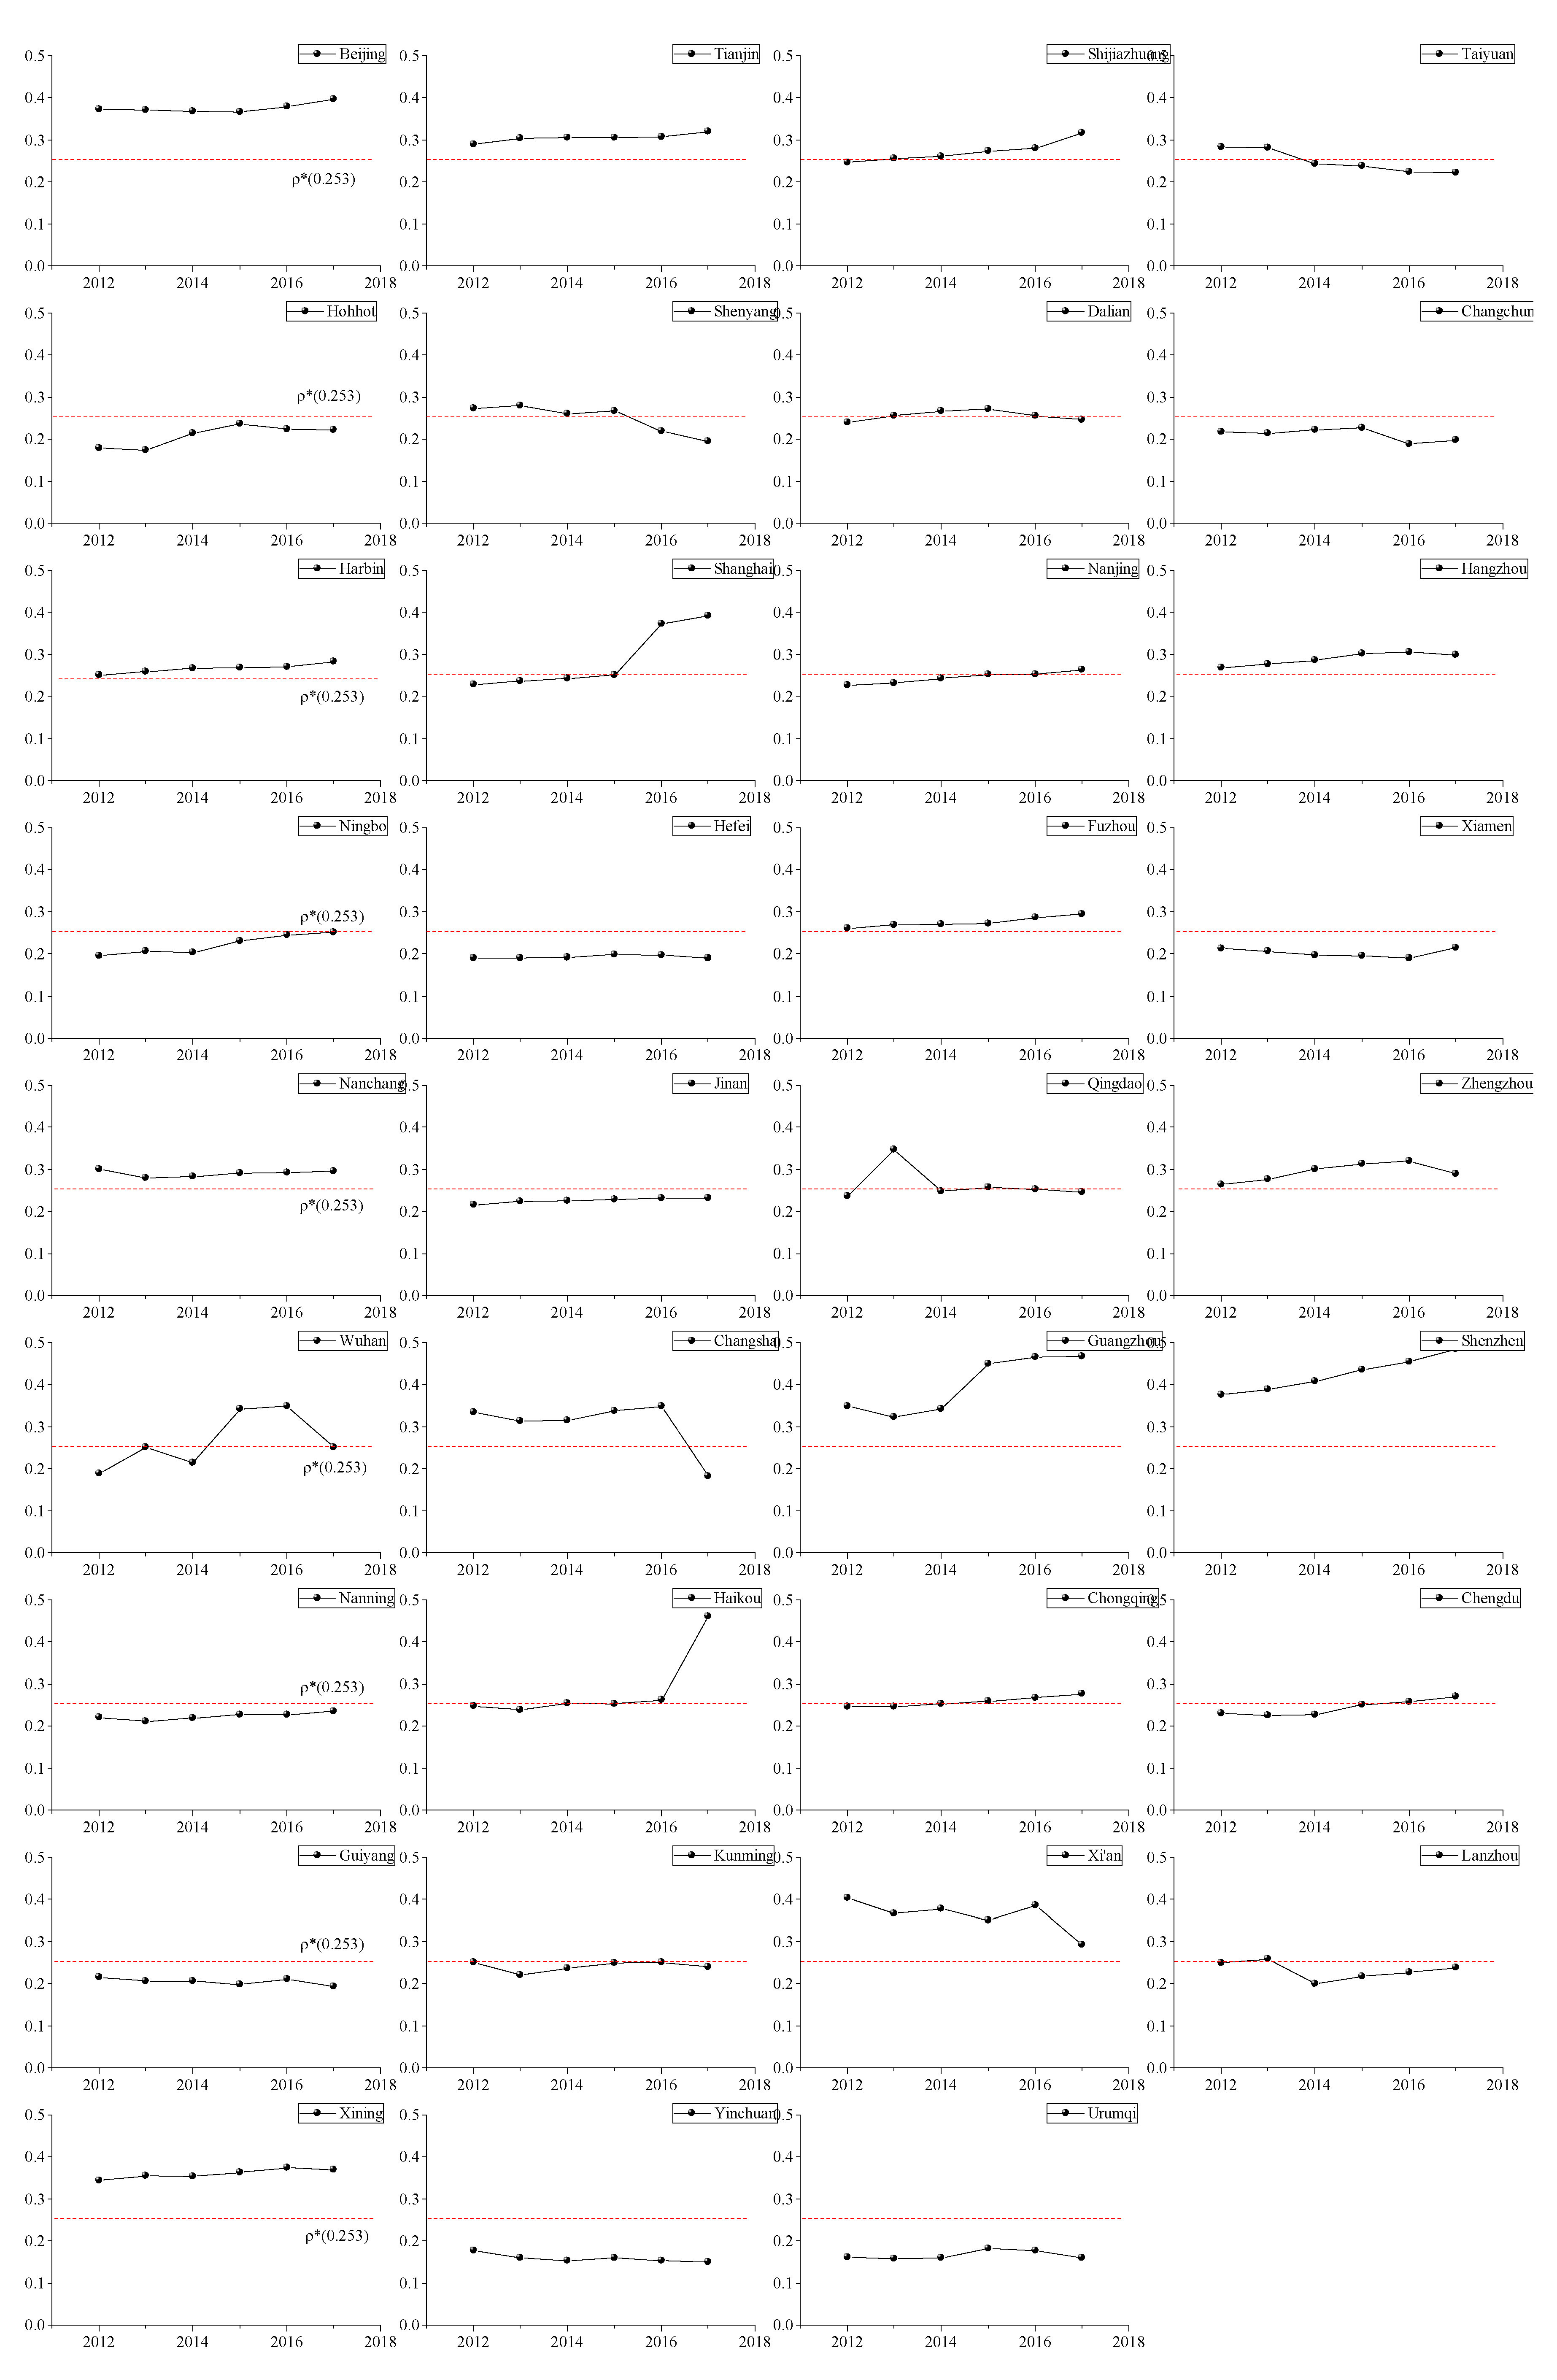
5.2.3. Temporal Evolution of LRCC in 35 Major Chinese Cities

Figure 4 also shows that the variations in the values of LRCC exhibit significant variability among cities. To illustrate these changes, the results in Table 2 are plotted as graphs to show the evolution of LRCC values in individual cities (see Figure 6). In Figure 6, the red line, which indicates ρ * = 0.253, acts as a reference to observe if the values of LRCC are reasonable or not.
In this study, four categories are defined based on the characteristics of the LRCC evolution in these cities: (i) cities with fluctuating variations dominated by a relatively unbalanced interval with socio-economic development higher than the carrying capacity of land resources (A1); (ii) cities with fluctuating variations dominated by a relatively unbalanced interval with socio-economic development lower than the carrying capacity (A4); (iii) cities with fluctuating variations dominated by a relatively balanced interval with socio-economic development slightly higher than the carrying capacity (A2); and (iv) cities with fluctuating variations dominated by a relatively balanced interval with socio-economic development slightly lower than the carrying capacity. The following discussion provides a detailed analysis of each of the three different types of fluctuations (smooth fluctuation, fluctuation with an upward trend, and fluctuation with a downward trend) for each type of city.
Cities dominated by a relatively unbalanced situation with socio-economic development higher than the carrying capacity of land resources (A1)
As can be seen from Figure 4, the LRCC values of Beijing, Guangzhou, Shenzhen, Xi’an, and Xining were in the A1 interval for 6 years, and those of Tianjin and Changsha were in the A1 interval for most of the years. By the analysis method of principal components shown in Section 3.2, it is considered that ρ 9 5 , ρ 8 5 , and ρ 1 1 are the reasons why the seven major cities are in interval A1. As can be seen from Figure 6, the LRCC values of Beijing, Guangzhou, Shenzhen, Xining, and Tianjin, the five cities that are mainly in the A1 interval, show a fluctuating upward trend above ρ * = 0.253 (red line) over the 6 study years in general, with Shenzhen and Guangzhou showing larger fluctuations. Taking Beijing as an example, the industrial structure in the city has shifted from secondary to tertiary industries since 1978, and technological progress has led to increased efficiency in various industries with high carbon emissions. This has boosted Beijing’s economic development and enabled the city to carry a greater economic load per unit of construction land [42]. In addition, tertiary industry in Beijing has attracted a large labor force, which has greatly contributed to the city’s population increase. As a result, Beijing has been carrying a greater social load per unit of land used for construction [43]. Thus, the adjustment of the industrial structure is potentially the main driver in Beijing from 2012 to 2017.
Another type of evolutionary pattern is that of cities where LRCC values above ρ * = 0.253 (red line) fluctuate with a downward trend, including Xi’an and Changsha. In Xi’an, for example, only Weiyang District has experienced rapid socio-economic development, while other districts and counties in the city have either developed slowly (e.g., Baqiao District, Chang’an District, and Gaoling County) or have shown a trend of regressive development (e.g., Yanliang County, Zhouzhi County, and Xincheng District). This is due to the relocation of the new administrative center of Xi’an to the Weiyang District, which has taken the initiative to maximize the integration of urban resources and improve the efficiency of their use [44]. While Yanliang and Zhouzhi counties have been increasing their urban construction land, fixed asset investment, and fiscal expenditure, the large amount of input has not increased output due to factors such as low location status, poor urban construction land conditions, policy orientation, and unreasonable management. In conclusion, regressive socio-economic development may be the main driver causing the fluctuating downward trend of LRCC dominated by interval A1 for Xi’an from 2012 to 2017.
From the above discussions, this paper suggests that the seven major cities should adopt differentiated policy measures to reduce carbon emissions (the molecule of ρ 9 5 and ρ 8 5 ). As Cheng et al. [45] indicated, cities with carbon emissions higher than the national average, including Beijing, Guangzhou, Shenzhen, and Tianjin, will be contained in the list of key governance issues, giving priority to addressing the difficulties faced by the four cities in achieving carbon emissions reduction. On the other hand, cities with carbon emissions lower than the national average, including Xi’an, Xining, and Changsha, should be assigned a ranking based on carbon emissions under similar socio-economic conditions. Especially, Beijing should focus on controlling population size so that the individual LRCC ( ρ 1 1 ) can be lowered to an extent. Firstly, Beijing should establish a top-level institutional design for population regulation and perform overall planning to ensure that population regulation matches the stage and goal of economic development. Secondly, administrative division should be suspended, and overall industrial planning in the metropolitan area should be established by Beijing to ease population size. Thirdly, Beijing should gradually set up and improve a unified platform for population information registration and information sharing to understand dynamic population changes [46].
Cities dominated by a relatively unbalanced situation, with socio-economic development lower than the carrying capacity of land resources (A4)
As can be seen from Figure 4, the LRCC values of six cities—Changchun, Hefei, Xiamen, Guiyang, Yinchuan, and Urumqi—are predominantly in interval A4. By the analysis method of principal components shown in Section 3.2, it is considered that ρ 8 5 and ρ 4 1 are the reasons why the six major cities are dominated by a relatively unbalanced situation, with socio-economic development lower than the carrying capacity of land resources. Moreover, according to Figure 6, the LRCC values of Hefei and Urumqi show a fluctuating upward trend. Taking Hefei as an example, although its LRCC value is in the low-use interval, the city is actively proposing measures to improve the efficiency of land use. At the beginning of the study period, it had a relatively large supply of land carriers and relatively small land loads, so its LRCC was in interval A4. In recent years, the Hefei municipal government has promulgated a series of policies for the disposal of idle land resources, such as the Measures for the Disposal of Idle Land promulgated in 2009 [47]. These measures have revitalized the stock of land resources, solved the plight of a large amount of idle land resources, and improved the use of land carriers for socio-economic activities, resulting in a fluctuating upward trend in the ρ value. This trend for Hefei from 2012 to 2017 is possibly driven by the publication of measures relating to the use of land resources in recent years. Such cities should maintain the upward trend of ρ , maintaining ρ values that fluctuate around ρ * as they approach the relatively ideal state value of ρ * .
However, the LRCC values of Changchun, Xiamen, Guiyang, and Yinchuan tended to fluctuate downwards during the study period. Taking Yinchuan as an example, its socio-economic scale grew at a slower rate than the scale of urban construction land, and this phenomenon is possibly the main driver causing the city’s LRCC values to fluctuate, with a downward trend dominated by low-use intervals from 2012 to 2017. Zhang et al. [48] attributed the expansion of urban construction land in Yinchuan from 2012 to 2017 to the renovation of old urban areas, the development of new urban areas, and the construction of external transportation, such as the completion of the construction of the BRT1 line, the underground integrated corridor project of Huaiyuan West Road, the underground integrated corridor project of Mancheng South Street and Mancheng North Street, the Yinxi high-speed railway project, and the Yinchuan Binhe Yellow River Bridge project. It can be seen that Yinchuan invested less in land resources for developing social and economic measures during the study period and only planned and built a major power equipment production base, wind power equipment, photovoltaic product research and development and production base, electronic information industry base, and biomedical industry base [49]. On the other hand, Yinchuan suffered from the weak innovation capacity of existing industries. To optimize and enhance Yinchuan’s LRCC, initiatives such as strictly controlling the increase in urban land resources, revitalizing idle industrial land resources and abandoned land resources, and optimizing the land use structure are suggested. Specifically, the state could consider building an innovation research and development base and intellectual property trading center in the Yellow River Basin, with Xi’an and Zhengzhou as the twin nuclei, which, through intellectual property trading, could stimulate the full spillover of market-based innovations to cities, including Yinchuan, with weak innovation capacity. In addition, the nation could also use the Yangling Agricultural High-Tech Industry Demonstration Zone in the suburbs of Xi’an as a basis for upgrading the science and technology level of agriculture and downstream industries in the Yellow River Basin, cultivating a team of professional farmers and expanding the development and growth of the processing and manufacturing industries of agricultural and livestock products in cities such as Yinchuan [50].
To increase land use efficiency in the six major cities, initiatives such as strictly controlling the increase in urban land resources, revitalizing idle industrial land resources and abandoned land resources, and optimizing the land use structure are suggested. Taking the strict control of the increase in urban land resources as an example, such cities should control the quantity of urban land resources for outdated or high-polluting industries and should encourage high-tech industrial land resources [51], so that the individual LRCC ( ρ 4 1 ) can be higher, to an extent.
Cities dominated by a relatively balanced situation with socio-economic development slightly higher than the carrying capacity (A2)
Figure 4 illustrates that seven cities—Shijiazhuang, Shenyang, Dalian, Harbin, Fuzhou, Nanchang, and Chongqing—are situated predominantly in interval A2. By the analysis method of principal components shown in Section 3.2, it is considered that ρ 9 5 , ρ 8 5 , and ρ 2 1 are the reasons why the seven major cities are dominated by a relatively balanced situation with socio-economic development slightly higher than the carrying capacity. Furthermore, as seen in Figure 6, the values of LRCC in five cities—Shijiazhuang, Dalian, Harbin, Fuzhou, and Chongqing—either lie above or cross the ρ * = 0.253 line (red line), showing a fluctuating upward trend. In the case of Dalian, a possible explanation is that the government in this city has continued to exercise reasonable control over the size of all types of urban construction land in recent years, in accordance with the provisions of the Urban Land Classification and Planning and Construction Land Standards issued in 2011 [52]. These control initiatives have led to the fluctuating upward trend of LRCC values in Dalian over the six study years.
In contrast, the LRCC values of Shenyang and Nanchang show a fluctuating downward trend, with Shenyang being the more volatile of the two. This can be attributed to the fact that Shenyang is in the northeast region, which is an old industrial base. In the past, the industrial structure of these old bases was dominated by heavy industry, which resulted in the growth in the scale of industrial land, whereas in recent years the northeast region has actively explored the transformation of its industrial structure, leading to a decrease in the growth rate of urban construction land supply. In addition, its urban population size, economic scale, and carbon emissions had slight downward trends over the study period. The fluctuating downward trend of LRCC dominated by high-use intervals for Shenyang during the period 2012–2017 is probably influenced by the foundation of an industrial structure dominated by heavy industry and to the adjustment of the industrial structure.
Cities dominated by a relatively balanced situation with socio-economic development slightly lower than the carrying capacity (A3)
From Figure 4, five cities—Taiyuan, Shanghai, Jinan, Chengdu, and Kunming—are predominantly in interval A3. By the analysis method of principal components shown in Section 3.2, it is considered that ρ 9 5 , ρ 8 5 , ρ 4 1 , ρ 2 1 , and ρ 8 1 are the reasons why the five major cities are dominated by a relatively balanced situation with socio-economic development slightly lower than the carrying capacity. From Figure 6, the LRCC values for Shanghai, Jinan, and Chengdu exhibit a fluctuating upward trend. Using Jinan as an example, the growth rate of land loads in the city was significantly higher than that of land carriers during this period, implying that the degree of utilization of land carriers in Jinan has increased along with socio-economic development. This trend has possibly been driven by the publication of measures to improve the utilization of urban construction land in recent years. For example, Jinan’s department for managing land and resources, in collaboration with the city’s development and reform department and commerce department, has been strictly gate-keeping new urban industrial land by reviewing indicators such as investment intensity, total investment, and land size, in order for industrial projects to be introduced. The department for managing land and resources in Jinan encourages industrial enterprises to use their land to expand and build new plants to improve the carrying capacity of the stock of urban industrial land [53].
For Taiyuan and Kunming, the LRCC values have a fluctuating downward trend. In Taiyuan, for example, the city’s population rose and then fell between 2012 and 2017, and the economic development was relatively slow. An and Zhang [54] argued that the urban population size and economic scale of Taiyuan are far lower than those of Shanghai, Beijing, and Chongqing. On the basis of their viewpoint, this paper assumes that Taiyuan is in a period of low socio-economic scale development, and the growth rate of this scale is lower than that of the scale of urban construction land. Therefore, this is possibly the main driver of the evolution of Taiyuan’s LRCC from interval A2 to A3, with a tendency to evolve towards interval A4 (see Figure 4 and Figure 6). In light of this situation, the Taiyuan metropolitan area should promote the establishment of a new national-level district, the Taiyuan Fenhe New District, to form a growth pole for the economic development of the Taiyuan metropolitan area. In addition, the Taiyuan metropolitan area should strengthen the specialized division of the labor force with neighboring urban areas and fully utilize the industrial support function of the town clusters surrounding the Taiyuan metropolitan area [54]. The aim is to optimize Taiyuan’s LRCC value ( ρ ) while ensuring that ρ fluctuates around the relatively ideal LRCC value, ρ * .

6. Conclusions

Based on an evolutionary perspective, this study investigated the LRCC at different time points in 35 major Chinese cities from 2012 to 2017 by using boxplots. Several key conclusions were drawn: (a) During the study period (2012–2017), there was an increase in the number of cities with LRCC values in the relatively unbalanced interval, with socio-economic development higher than the supply capacity of land resources, while the number of cities in the relatively unbalanced interval, with socio-economic development lower than the supply capacity of land resources, decreased significantly. (b) In some major cities, such as Beijing, Guangzhou, Shenzhen, Xining, Tianjin, Changchun, Xiamen, Guiyang, and Yinchuan, LRCC values were becoming more and more unbalanced. (c) In some major cities, such as Shijiazhuang, Dalian, Harbin, Fuzhou, Chongqing, Kunming, and Taiyuan, their LRCC values were tilted towards the unbalanced situation. (d) The main drivers that cause the phenomena mentioned above include policy, socio-economic development, and land use change.
The main contribution of this study is as follows. LRCC is defined based on the “carrier–load” perspective, and a higher or a lower LRCC is considered as an unbalanced situation between socio-economic development and carrying capacity of land resources. A method for exploring LRCC based on an evolutionary perspective by using Boxplots is presented for 35 major Chinese cities from 2012 to 2017. The results of this study provide a valuable reference for government managers to understand LRCC in major cities during China’s urbanization process.
The study also provides some policy implications. In general, considering the large spatial differences among major cities, appropriate measures should be applied according to local conditions. Specifically, for cities where LRCC values are mainly in the unbalanced interval, with socio-economic development higher than the carrying capacity of land resources, the authorities involved should adopt differentiated policy measures to reduce carbon emissions. Cities with carbon emissions higher than the national average, including Beijing, Guangzhou, Shenzhen, and Tianjin, will be contained in the list of key governance issues, giving priority to addressing the difficulties faced by the four cities in achieving carbon emissions reduction. On the other hand, cities with carbon emissions lower than the national average, including Xi’an, Xining, and Changsha, should be assigned a ranking based on carbon emissions under similar socio-economic conditions [45]. For cities where the LRCC is mainly in the unbalanced interval, with socio-economic development lower than the carrying capacity of land resources, initiatives such as strictly controlling the increase in urban land resources, revitalizing idle industrial land resources and abandoned land resources, and optimizing the land use structure are suggested. Taking the strict control of the increase in urban land resources as an example, such cities should control the quantity of urban land resources for outdated or high-polluting industries and should encourage high-tech industrial land resources [51].
This research has some limitations. Due to constraints in data availability, (a) only six years of data were used for the time series in this study. With the short time span, the comparison of LRCC evolution across major cities is not significant. Further studies that include longer periods are suggested. (b) Looking only at 35 major cities in China with sound socio-economic development, it is suggested that some cities in China with poor socio-economic conditions, and better developed cities elsewhere in the world, can be chosen as samples to explore spatial differences in future study.

Author Contributions

W.L. and C.J. participated in the design of this study. C.J. and W.L. collected and processed the relevant data. W.L. and wrote the text and drew diagrams. C.J. and L.S. reviewed and edited this study. All authors have read and agreed to the published version of the manuscript.

Funding

This research is supported by the Fundamental Research Funds for Talent Introduction Fund Project of Chongqing University of Posts and Telecommunications (Project No. “K2022-43”) and the Central Universities of China (Project No. “2020CDJSK03PT18” and “2021CDJSKZD03”).

Institutional Review Board Statement

Not applicable.

Informed Consent Statement

Not applicable.

Data Availability Statement

The data presented in this study are available on request from first author.

Conflicts of Interest

The authors declare no conflict of interest.

References

  1. Wackernagel, M.; Schulz, N.B.; Deumling, D.; Linares, A.C.; Jenkins, M.; Kapos, V.; Monfreda, C.; Loh, J.; Myers, N.; Norgaard, R.; et al. Tracking the ecological overshoot of the human economy. Proc. Natl. Acad. Sci. USA 2002, 99, 9266–9271. [Google Scholar] [CrossRef] [PubMed] [Green Version]
  2. WWF. Living Planet Report 2020—Bending the Curve of Biodiversity Loss; WWF: Gland, Switzerland, 2020. [Google Scholar]
  3. Duan, W.; He, B.; Nover, D.; Fan, J.; Yang, G.; Chen, W.; Meng, H.; Liu, C. Floods and associated socioeconomic damages in China over the last century. Nat. Hazards 2016, 82, 401–413. [Google Scholar] [CrossRef]
  4. Li, M.; Kwan, M.-P.; Wang, F.; Wang, J. Using points-of-interest data to estimate commuting patterns in central Shanghai, China. J. Transp. Geogr. 2018, 72, 201–210. [Google Scholar] [CrossRef]
  5. Niu, L.; Zhang, Z.; Peng, Z.; Liang, Y.; Liu, M.; Jiang, Y.; Wei, J.; Tang, R. Identifying Surface Urban Heat Island Drivers and Their Spatial Heterogeneity in China’s 281 Cities: An Empirical Study Based on Multiscale Geographically Weighted Regression. Remote Sens. 2021, 13, 4428. [Google Scholar] [CrossRef]
  6. Jin, X.; Li, C. Paradigm shift in the study of land carrying capacity: An overview. J. Nat. Resour. 2018, 33, 526–540. (In Chinese) [Google Scholar]
  7. Chen, X.P.; Wu, C.F.; Fang, K. Differentiation and comparison of the paradigms for the carrying capacity of resources and environment. China Land Sci. 2020, 34, 17–24. (In Chinese) [Google Scholar]
  8. Allan, W. The African Husband Man; Oliver and Boyd: Edinburg, UK, 1965. [Google Scholar]
  9. Zhang, Q.A.; Zhang, F.F.; Wu, G.Y.; Mai, Q. Spatial spillover effects of grain production efficiency in China: Measurement and scope. J. Clean. Prod. 2021, 278, 10. [Google Scholar] [CrossRef]
  10. Wackernagel, M.; Rees, E.W. Our Ecological Footprint-Reducing Human Impact on the Earth; New Society Publishers: Gabriola, BC, Canada, 1996. [Google Scholar]
  11. Barrahmoune, A.; Lahboub, Y.; El Ghmari, A. Ecological footprint accounting: A multi-scale approach based on net primary productivity. Environ. Impact Assess. Rev. 2019, 77, 136–144. [Google Scholar] [CrossRef]
  12. Cheng, K.; Fu, Q.; Cui, S.; Li, T.; Pei, W.; Liu, D.; Meng, J. Evaluation of the land carrying capacity of major grain-producing areas and the identification of risk factors. Nat. Hazards 2016, 86, 263–280. [Google Scholar] [CrossRef]
  13. Guo, S.; Li, C.; Liu, S.; Zhou, K. Land carrying capacity in rural settlements of three gorges reservoir based on the system dynamic model. Nat. Resour. Modeling 2018, 31, e12152. [Google Scholar] [CrossRef]
  14. Tang, Y.; Yuan, Y.B.; Zhong, Q.Y. Evaluation of Land Comprehensive Carrying Capacity and Spatio-Temporal Analysis of the Harbin-Changchun Urban Agglomeration. Int. J. Environ. Res. Public Health 2021, 18, 521. [Google Scholar] [CrossRef] [PubMed]
  15. Luo, W.; Ren, Y.; Shen, L.; Zhu, M.; Jiang, Y.; Meng, C.; Zhang, P. An evolution perspective on the urban land carrying capacity in the urbanization era of China. Sci. Total Environ. 2020, 744, 140827. [Google Scholar] [CrossRef]
  16. Huang, N.S.; Kuang, Y.Q. The carrying capacity of resources and the problems of sustainable development in Guangdong province. Econ. Geogr. 2000, 20, 52–56. (In Chinese) [Google Scholar]
  17. Zhao, P.Y.; Guo, J.S.; Cui, Q.; Zhang, J.Q.; Feng, W.Y. Spatiotemporal analysis of the relative carrying capacity of resources in Xinzhou city based on improved model of carrying capacity related to resources. Res. Soil Water Conserv. 2017, 24, 341–347. (In Chinese) [Google Scholar]
  18. Rockstrom, J.; Steffen, W.; Noone, K.; Persson, A.; Chapin, F.S.; Lambin, E.F.; Lenton, T.M.; Scheffer, M.; Folke, C.; Schellnhuber, H.J.; et al. A safe operating space for humanity. Nature 2009, 461, 472–475. [Google Scholar] [CrossRef]
  19. Dao, H.; Peduzzi, P.; Friot, D. National environmental limits and footprints based on the Planetary Boundaries framework: The case of Switzerland. Glob. Environ. Chang. 2018, 52, 49–57. [Google Scholar] [CrossRef] [Green Version]
  20. FAO. A Framework for Land Evaluation; FAO Soil Bulletin 32; FAO: Rome, Italy, 1976. [Google Scholar]
  21. Borgstrom, G. The Hungry Planet: The Modern World at the Edge of Famine; Collier: New York, NY, USA, 1965. [Google Scholar]
  22. Shi, Y.; Wang, H.; Yin, C. Evaluation method of urban land population carrying capacity based on GIS—A case of Shanghai, China. Comput. Environ. Urban Syst. 2013, 39, 27–38. [Google Scholar] [CrossRef]
  23. Shi, Y.; Shi, S.; Wang, H. Reconsideration of the methodology for estimation of land population carrying capacity in Shanghai metropolis. Sci. Total Environ. 2019, 652, 367–381. [Google Scholar] [CrossRef]
  24. Mellanby, K. Can Britain Feed Itself? Merlin Press: London, UK, 1975. [Google Scholar]
  25. Shen, L.Y.; Shu, T.H.; Liao, X.; Yang, N.; Ren, Y.T.; Zhu, M.C.; Cheng, G.Y.; Wang, J.H. A new method to evaluate urban resources environment carrying capacity from the load-and-carrier perspective. Resour. Conserv. Recycl. 2020, 154, 16. [Google Scholar] [CrossRef]
  26. Liao, X.; Ren, Y.; Shen, L.; Shu, T.; He, H.; Wang, J. A “carrier-load” perspective method for investigating regional water resource carrying capacity. J. Clean. Prod. 2020, 269, 122043. [Google Scholar] [CrossRef]
  27. Meng, C.; Du, X.; Ren, Y.; Shen, L.; Cheng, G.; Wang, J. Sustainable urban development: An examination of literature evolution on urban carrying capacity in the Chinese context. J. Clean. Prod. 2020, 277, 122802. [Google Scholar] [CrossRef]
  28. Wang, J.H.; Ren, Y.T.; Shu, T.H.; Shen, L.Y.; Liao, X.; Yang, N.; He, H.M. Economic perspective-based analysis on urban infrastructures carrying capacity—A China study. Environ. Impact Assess. Rev. 2020, 83, 12. [Google Scholar] [CrossRef]
  29. Wang, J.; Ren, Y.; Shen, L.; Liu, Z.; Wu, Y.; Shi, F. A novel evaluation method for urban infrastructures carrying capacity. Cities 2020, 105, 102846. [Google Scholar] [CrossRef]
  30. Zhu, M.C.; Shen, L.Y.; Tam, V.W.Y.; Liu, Z.; Shu, T.H.; Luo, W.Z. A load-carrier perspective examination on the change of ecological environment carrying capacity during urbanization process in China. Sci. Total Environ. 2020, 714, 17. [Google Scholar] [CrossRef]
  31. Daily, G.C. Nature’s Services: Societal Dependence on Natural Ecosystems; Island Press: Washington, DC, USA, 1997. [Google Scholar]
  32. Liu, Z.; Ren, Y.; Shen, L.; Liao, X.; Wei, X.; Wang, J. Analysis on the effectiveness of indicators for evaluating urban carrying capacity: A popularity-suitability perspective. J. Clean. Prod. 2020, 246, 119019. [Google Scholar] [CrossRef]
  33. Department of Urban and Social, National Bureau of Statistics. China City Statistical Yearbook; China Statistics Press: Beijing, China, 2020. (In Chinese)
  34. Ministry of Housing and Urban-Rural Development. China County Construction Statistical Yearbook; China Statistics Press: Beijing, China, 2012–2017. (In Chinese)
  35. Department of Urban and Social, National Bureau of Statistics. China City Statistical Yearbook; China Statistics Press: Beijing, China, 2013–2018. (In Chinese)
  36. Ministry of Housing and Urban-Rural Development. China City Construction Statistical Yearbook; China Statistics Press: Beijing, China, 2012–2017. (In Chinese)
  37. National Bureau of Statistics. China Statistical Yearbook; China Statistics Press: Beijing, China, 2013–2018. (In Chinese)
  38. Chen, J.D.; Gao, M.; Cheng, S.L.; Hou, W.X.; Song, M.L.; Liu, X.; Liu, Y.; Shan, Y.L. County-level CO2 emissions and sequestration in China during 1997–2017. Sci. Data 2020, 7, 12. [Google Scholar] [CrossRef] [PubMed]
  39. Du, X.; Shen, L.; Wong, S.W.; Meng, C.; Yang, Z. Night-time light data based decoupling relationship analysis between economic growth and carbon emission in 289 Chinese cities. Sust. Cities Soc. 2021, 73, 103119. [Google Scholar] [CrossRef]
  40. MLR. Notice on Strict Enforcement of Land Use Standards to Vigorously Promote Land Saving and Intensive Land Use. Available online: http://www.gov.cn/zwgk/2012-09/13/content_2224087.htm (accessed on 20 July 2021). (In Chinese)
  41. Johnston, K.L.; White, K.M. Binge-drinking: A test of the role of group norms in the theory of planned behaviour. Psychol. Health 2003, 18, 63–77. [Google Scholar] [CrossRef] [Green Version]
  42. Li, D.J.; Zhang, H. An analysis of the relationship between Beijing’s industrial structure and economic growth and the possible reasons. J. Northeast. Univ. 2013, 15, 148–153. (In Chinese) [Google Scholar]
  43. Li, C.; Zhang, H.Y.; Lu, J.; Tan, B. Relation between population control and industrial structure optimization of Beijing. Urban Probl. 2013, 2–6. (In Chinese) [Google Scholar] [CrossRef]
  44. Huang, J.; Ma, B.B.; Xue, D.Q. Research on land use efficiency and optimal strategies in Xi’an based on SE-DEA model. Arid. Zone Res. 2015, 32, 630–636. (In Chinese) [Google Scholar]
  45. Cheng, S.L.; Chen, Y.T.; Meng, F.X.; Chen, J.D.; Liu, G.Y.; Song, M.L. Impacts of local public expenditure on CO2 emissions In Chinese cities: A spatial cluster decomposition analysis. Resour. Conserv. Recycl. 2021, 164, 105217. [Google Scholar] [CrossRef]
  46. Qi, M.Z.; Xu, F. A study on population regulation mechanism for mega-cities in China during the 13th Five-Year. Chin. J. Popul. Sci. 2017, 25–34, 126–127. Available online: http://202.202.43.73:8000/rwt/CNKI/https/NNYHGLUDN3WXTLUPMW4A/kcms/detail/detail.aspx?dbcode=CJFD&dbname=CJFDLAST2017&filename=ZKRK201702004&uniplatform=NZKPT&v=akNWhLWU8hMHmva4FFGPDin6AShpYwprZJg1yLJkT_8sUrwG0qj3UBTr8XMJAZ6E (accessed on 11 October 2021). (In Chinese).
  47. Cheung, S.F.; Chan, D.K.S.; Wong, Z.S.Y. Reexamining the theory of planned behavior in understanding wastepaper recycling. Environ. Behav. 1999, 31, 587–612. [Google Scholar] [CrossRef]
  48. Zhang, J.W.; Bai, L.B.; Yang, M.L. Spatial and temporal evolution of Yinchuan urban expansion in the last 30 years. Res. Soil Water Conserv. 2019, 359–365. (In Chinese) [Google Scholar] [CrossRef]
  49. Tian, X.J. Ningxia’s Economic Development Achievements, Challenges and Development Paths in the 20 Years of Western Development. Soc. Sci. Ningxia 2020, 86–93. Available online: http://202.202.43.73:8000/rwt/CNKI/https/NNYHGLUDN3WXTLUPMW4A/kcms/detail/detail.aspx?dbcode=CJFD&dbname=CJFDLAST2020&filename=LXSK202004011&uniplatform=NZKPT&v=OjfYvFXYnbuvrD9CT_cR-Rivs4b3EWkR6SIeTB5gFj9twyZGGLVa2n6AnUwiQVvG (accessed on 11 October 2021). (In Chinese).
  50. Shi, F. Study on the path of high-quality development of central cities in the Yellow River Basin. J. Humanit. 2020, 5–9. Available online: http://202.202.43.73:8000/rwt/CNKI/http/NNYHGLUDN3WXTLUPMW4A/kcms/detail/43.1126.K.20201011.1042.002.html (accessed on 11 October 2021). (In Chinese).
  51. Qu, Y.; Long, H.L. The economic and environmental effects of land use transitions under rapid urbanization and the implications for land use management. Habitat Int. 2018, 82, 113–121. [Google Scholar] [CrossRef]
  52. GB 50137-2011; The Code for Classification of Urban Land Use and Planning Standards of Development Land. China Academy of Urban Planning and Design: Beijing, China, 2011. (In Chinese)
  53. Greaves, M.; Zibarras, L.D.; Stride, C. Using the theory of planned behavior to explore environmental behavioral intentions in the workplace. J. Environ. Psychol. 2013, 34, 109–120. [Google Scholar] [CrossRef]
  54. An, S.W.; Zhang, J.J. Research on the high-quality development of the Shanxi. Econ. Probl. 2019, 1–8. (In Chinese) [Google Scholar] [CrossRef]
Figure 1. Conceptual schematic diagram of land resource carrying capacity. Source: Designed by the author.
Sustainability 14 05178 g001
Figure 2. The interval of LRCC ( ρ ). Source: Designed by the author.
Sustainability 14 05178 g002
Figure 3. Spatial distribution in 35 major cities. Source: Redrawn by the author from http://bzdt.ch.mnr.gov.cn/, accessed on 20 October 2021.
Sustainability 14 05178 g003
Figure 4. Distribution of LRCC ρ among 35 major cities from 2012 to 2017.
Sustainability 14 05178 g004
Figure 5. The number of major cities in each interval from 2012 to 2017.
Sustainability 14 05178 g005
Figure 6. The evolution of LRCC ρ in 35 major cities from 2012 to 2017.
Sustainability 14 05178 g006
Table 1. The meanings of ρi−j.
The Meanings of ρi−j
  • The number of populations carried per urban residential land area (ρ1−1)
  • The added value of tertiary industry carried per urban residential land area (ρ1−4)
  • The number of populations carried per area of urban land for public administration and public services (ρ2−1)
  • The added value of tertiary industry carried per area of urban land for public administration and public services (ρ2−4)
  • The number of populations supported per area of urban land for commercial and business facilities (ρ3−1)
  • The added value of tertiary industry supported per area of urban land for commercial and business facilities (ρ3−4)
  • The number of populations supported per urban industrial land area (ρ4−1)
  • The added value of secondary industry supported per urban industrial land area (ρ4−3)
  • The number of populations carried per area of urban land for logistics and warehouses (ρ5−1)
  • The added value of tertiary industry supported per area of urban land for logistics and warehouses (ρ5−4)
  • The number of populations carried per area of urban land for road, street and transportation facilities (ρ6−1)
  • The added value of tertiary industry carried per area of urban land for road, street and transportation facilities (ρ6−4)
  • The number of populations supported per area of urban land for municipal utilities (ρ7−1)
  • The added value of secondary industry supported per area of urban land for municipal utilities (ρ7−3)
  • The number of populations supported per area of urban land for green space and squares (ρ8−1)
  • The carbon emission supported by urban land for green spaces and squares (ρ8−5)
  • The number of populations carried per area of other types of land (ρ9−1)
  • The added value of primary industry carried per area of other types of land (ρ9−2)
  • The added value of tertiary industry carried per area of other types of land (ρ9−4)
  • The carbon emission supported per area of other types of land (ρ9−5)
Table 2. Land resource carrying capacity ρ in 35 major cities from 2012 to 2017.
City201220132014201520162017Average
Beijing0.3730.3720.3690.3670.380.3980.377
Tianjin0.290.3050.3060.3060.3070.320.306
Shijiazhuang0.2460.2560.2620.2740.2810.3180.273
Taiyuan0.2840.2820.2430.2380.2240.2220.249
Hohhot0.1790.1740.2140.2370.2240.2220.208
Shenyang0.2740.280.2620.2670.2190.1950.250
Dalian0.2410.2560.2670.2730.2560.2460.257
Changchun0.2180.2150.2220.2270.1890.1980.212
Harbin0.2520.2590.2670.2690.2710.2830.267
Shanghai0.2290.2370.2440.2520.3730.3920.288
Nanjing0.2270.2320.2440.2540.2530.2640.246
Hangzhou0.270.2780.2870.3030.3060.2990.291
Ningbo0.1950.2070.2040.230.2450.2520.222
Hefei0.1910.190.1930.1990.1970.1910.194
Fuzhou0.2620.2690.2710.2730.2870.2950.276
Xiamen0.2130.2060.1970.1960.1910.2150.203
Nanchang0.3010.280.2840.2920.2930.2970.291
Jinan0.2170.2240.2260.2290.2330.2320.227
Qingdao0.2370.3470.2490.2580.2530.2470.265
Zhengzhou0.2650.2780.3010.3140.3210.290.295
Wuhan0.1890.2520.2140.3430.350.2510.267
Changsha0.3350.3140.3160.3380.3490.1830.306
Guangzhou0.350.3230.3430.4510.4660.4680.400
Shenzhen0.3770.3890.4090.4360.4550.4850.425
Nanning0.2210.2110.2190.2270.2280.2350.224
Haikou0.2480.2390.2550.2530.2630.4620.287
Chongqing0.2470.2470.2540.2590.2680.2770.259
Chengdu0.230.2260.2280.2510.2580.2710.244
Guiyang0.2170.2070.2070.1980.2120.1940.206
Kunming0.2520.2210.2370.250.2520.2410.242
Xi’an0.4040.3670.3780.3510.3870.2940.364
Lanzhou0.250.2590.20.2180.2280.2380.232
Xining0.3440.3550.3540.3640.3750.370.360
Yinchuan0.1780.1610.1540.1610.1540.1510.160
Urumqi0.1620.1590.160.1820.1780.160.167
Average0.2560.2590.2580.2730.2780.276-
Publisher’s Note: MDPI stays neutral with regard to jurisdictional claims in published maps and institutional affiliations.

