Article

Measurement of Innovation-Driven Development Performance of Large-Scale Environmental Protection Enterprises Investing in Public–Private Partnership Projects Based on the Hybrid Method

1
School of Maritime Economics and Management, Dalian Maritime University, Dalian 116026, China
2
School of Information Management, Jiangxi University of Finance and Economics, Nanchang 330032, China
3
School of Economics and Management, Liaoning University of Technology, Jinzhou 121001, China
*
Authors to whom correspondence should be addressed.
Sustainability 2022, 14(9), 5096; https://doi.org/10.3390/su14095096
Submission received: 11 March 2022 / Revised: 21 April 2022 / Accepted: 21 April 2022 / Published: 23 April 2022
(This article belongs to the Special Issue Sustainability and Performance Management System)

Abstract

:
Innovation is an important driving force for realizing high-quality economic development, which puts forward higher requirements for environmental protection enterprises to meet the dual goals of economic development and ecological protection. In order to better evaluate the innovation-driven development performance of environmental protection enterprises, a hybrid method is applied in this paper. Based on the sample data of 20 large-scale environmental protection enterprises investing in public–private partnership (PPP) projects from 2018 to 2020, the innovation-driven development performance is measured. The results show that the innovation-driven efficiency of environmental protection enterprises for infrastructure construction is significantly different, and the improvement of pure technical efficiency of environmental protection enterprises is obviously better than scale efficiency. Furthermore, the reasons influencing the innovation efficiency are analyzed and discussed. The results suggest that more attention should be paid to the transformation of labor and capital in environmental protection enterprises, and the use of innovation-driven resources should be optimized. Future studies can apply the hybrid method to measure the innovation-driven performance of environmental protection enterprises in other countries, so as to verify the effectiveness of the hybrid method proposed in this paper and overcome the limitations of the research conclusions.

1. Introduction

Practicing sustainable development is the guiding principle and action program of enterprise development, and sustainable innovation is the foundation and motivation of sustainable development [1]. Innovation-driven development performance is the embodiment of an enterprise’s innovation ability, and the measurement of innovation-driven development performance helps to judge whether an enterprise has the ability of sustainable development. International economic competition and even comprehensive national strength competition can also be said to be a competition of innovative ability [2]. The innovation-driven development strategy is vigorously implemented in China, and the innovation mechanism is constantly improved. Therefore, the transformation of scientific and technological achievements into practical, productive forces has been accelerated. No matter what industry, the industry development and change brought about by innovation are immeasurable. So, at present and for some time to come, it is necessary to shift from development driven by factors of production and investment to innovation-driven development.
The environmental protection enterprises in this study refer to those engaged in water pollution control, air pollution control, noise control, and solid waste treatment. The environmental protection industry is one of the most complicated industries, and it needs great efforts due to various challenging factors in project planning and research. The construction of the environmental protection industry has been promoted to the top of the national strategy in recent years in China. According to the data of the China Environmental Protection Industry Association, from 2015 to 2020, the operating income of China’s environmental protection industry grew at an average annual rate of 14.1%. It is estimated that by 2025, the operating income of China’s environmental protection industry is expected to exceed 3 trillion yuan, including air pollution prevention and control of about 310 billion yuan, water pollution prevention and control of 1.1 trillion yuan, solid waste treatment of about 1.3 trillion yuan, a resource utilization of about 60 billion yuan, and environmental monitoring of about 180 billion yuan. The most innovative companies are also the most sustainable, and the existing study results show that there is a positive correlation between innovation and enterprise sustainability [3]. The innovation-driven development performance of environmental protection enterprises is characterized by the allocation of relevant human resources, financial resources and capital, and the transformation efficiency of resource value and patent output. Furthermore, the ratio of valid patent application to related investment is also obtained, and the emphasis is on “creating and application” to transform patent achievements into productive forces and realize the economic benefits of intellectual property development of environmental protection enterprises. In addition, compared with small and medium-sized enterprises, large-scale enterprises are more open to cooperation and sustainable development [4]. Therefore, the large-scale enterprises have more specific innovation strategies to promote sustainable development.
As one of the largest developing countries, China is facing investment pressure in climate change, environmental governance, social service construction, etc. The huge investment pressure makes the innovation mode, such as public–private partnership (PPP), attract attention. Understanding the strengths and weaknesses of an enterprise has an extremely important influence on its development. PPP mode can combine the strengths of participants and enhance the ability to resist risks. As an effective governance tool to promote the efficiency and upgrade investment projects across organizational boundaries, the PPP mode can promote innovation [5], which has been strongly promoted by the Chinese government. The PPP mode should serve the strategy of sustainable development and take the experience as well as the technology of social capital as the strong support for sustainable development.
Therefore, it is of great significance to study the innovation-driven development performance of large-scale enterprises investing in PPP projects. In the background of sustainable development, environmental protection enterprises should not only pay attention to quality and benefit, but also emphasize efficiency and performance. The vitality and creativity of social capital are stimulated through innovation drive, and the “value for money (VFM)” is realized. Based on this, a hybrid method including three-stage DEA is used to measure and analyze the input–output efficiency of large-scale environmental protection enterprises investing in PPP projects, which will evaluate their innovation-driven development performance in this paper.
The main contributions of this paper are as follows.
(1) An in-depth analysis of the optimal allocation of environmental protection enterprises driven by industrial transformation and upgrading is carried out, which provides theoretical support for further research and improvement of innovation performance of environmental protection enterprises.
(2) This paper, taking large-scale environmental protection enterprises investing in PPP projects as research samples, analyzes the economic value and social benefit value (i.e., the application value of PPP mode) introduced as environmental variables to make up for the deficiency of existing research samples.
(3) A hybrid method considering environmental influence and random error is used in this paper. Compared with the traditional measurement method, the conclusions obtained in this paper are more scientific, more accurate, and more realistic than the ones obtained in previous studies.
The rest of this paper is organized as follows. Section 2 briefly reviews the relationship among the PPP mode, innovation, and efficiency; analyzes the deficiencies of the existing studies; puts forward the research problem of this paper. In Section 3, a hybrid method is proposed, which is based on a three-stage DEA model for evaluating the innovation-driven development performance of the infrastructure industry under the PPP mode. In Section 4, the evaluation index system of innovation efficiency of environmental protection enterprises investing in PPP projects is established. In Section 5, using the proposed hybrid method and index system, the innovation-driven development performance of 20 large-scale environmental protection enterprises is studied. In Section 6, the results of applications are highlighted. Conclusions, recommendations, and limitations are discussed in Section 7 and Section 8, respectively.

2. Literature Review

The existing innovation theory is the continuous supplement and improvement of Schumpeter’s viewpoint. Innovation can be described as the result of a creative reaction, and the conditions of this reaction are the characteristics of the environment where innovation takes place [6]. It is generally believed that environmental innovation is positively related to enterprise performance [7]. Since China’s economic reform in 1978, the institutional foundation of the innovation system has been laid, and the innovation performance of countries, regions, enterprises, and individuals has made remarkable progress [8]. Brogaard et al. [9] believed that the vast majority of PPP projects are to promote enterprise innovation. Lember et al. [10] studied how and why innovations of PPP mode can affect the evolution and development of relevant private and public sector organizations. From the perspective of the relationship between PPP mode and innovation, a great deal of research results have been obtained. For example, Hermans et al. [11] studied how PPP mode affects the dynamic interaction of innovative systems; Ferraris et al. [12] redefined the innovation-driven cooperative management theory between enterprises and government; Davies et al. [13] put forward a theoretical model to determine the potential incentives and barriers to innovation; Rangel et al. [14] believed that the PPP mode maximizes the R&D innovation, but the degree of its impact on innovation depends on the industry. Callens et al. [15] believed that long-term contractual cooperation in PPP mode is one of the driving forces for project innovation. Akintoye et al. [16] pointed out that the PPP mode improved the quality and efficiency of infrastructure services, encouraged advanced practices, and created an environment conducive to innovation and development. From the application of PPP mode in energy and environmental protection projects, Shahbaz et al. [17] and Khan et al. [18] studied the impact of PPP project investment on consumption carbon emissions, especially energy investment, hindering environmental quality by increasing carbon emissions. However, technological innovation has a negative impact on carbon emissions, which indicates that the investment innovation and technological innovation in PPP mode should be conducted for clean energy field. In addition, Li et al. [19] reviewed the impact of PPP energy projects investment on long-term environmental sustainability and put forward a multi-pronged approach to achieving sustainable development. Adebayo et al. [20] indicated that the consumption of renewable energy and technological innovation are beneficial to the environment. Therefore, it is necessary to study innovation performance of enterprise-investing PPP projects, and Cheah et al. [21] have made some important contributions to the research of innovation and performance in public–private partnerships, which also provided reference for our study.
Innovation-driven green development is becoming more and more important for all countries. Some researchers have conducted theoretical and practical research on the relationship between innovation drive and sustainable development of industries and enterprises. For example, Odei et al. [22] showed that innovation performance is significantly and positively stimulated by enterprise characteristics (such as scale and ownership); Awan et al. [23] discussed how to organize knowledge management in enterprises to improve the performance of product innovation; Vrontis et al. [24] have established a framework to support small and medium-sized enterprises that implement innovation-driven initiatives, and the results show better development performance. Xu et al. [25] studied the influence of innovation-driven strategy on industrial agglomeration and industrial transformation. From the perspective of the innovation-driven development of environmental protection industry, some studies provide scientific support for green development. Green development is a systematic project, which should be realized through the combination of technological innovation, institutional innovation, and financial innovation [26]. Green innovation has become the theme of sustainable development of enterprises, and the operation model has a significant impact on the performance of green innovation [27]. For example, Li et al. [28] pointed out that green technology is essentially innovation-driven development of enterprises in the background of green development. Li et al. [29] believed that both the scale of government and enterprise are conducive to the innovation-driven development of the green industries. Yang et al. [30] discussed the relationship between environmental control and the efficiency of green innovation in environmental protection enterprises. Wang et al. [31] have built the evaluation system of innovation-driven development and green development, and improved the understanding of the interaction between innovation-driven development and green development in academic circles. Therefore, the research on the influence of innovation-driven development on enterprises will help enterprises to improve quality and benefit and provide guidance for the promotion of innovation ability.
The performance of innovation-driven development should consider both inputs and outputs. So, the relationship between sustainability as the innovation goal and innovation efficiency should be studied [32]. Bai et al. [33] mainly analyzed the influence of local government on the efficiency of regional innovation in China. Park [34] pointed out that the higher the internal research and development capability level of small and medium-sized enterprises are, the more cooperation activities can improve the innovation efficiency of enterprises. Fan et al. [35] measured the innovation efficiency of cities and the degree of collaborative innovation within the regions in China. From the perspective of the environmental protection industry, the pursuit of innovation efficiency is an important trade-off between economic development and environmental protection. For example, Yuan et al. [36] analyzed the influence of efficiency-based innovation on ecological total factor energy efficiency, and Luo et al. [37] used the Malmquist–Luenberger productivity index of the meta-frontier to measure the efficiency of green innovation. Based on the innovation value chain, Zhang et al. [38] used the super-efficiency data envelopment analysis (DEA) model to calculate the marine innovation efficiency of China’s coastal areas from 2006 to 2016; Shi et al. [39] pointed out that the performance of innovative enterprises in the two stages of the innovation process (R&D stage and commercialization stage) is inconsistent; Zhao et al. [40] measured the efficiency of green innovation and provide more precise methods; Hernandez-Vivanco et al. [41] believed that enterprises are facing the challenge of effectively allocating innovative resources to maximize their profits; Long et al. [42] used the global Malmquist–Luenberger (ML) method based on the Epsilon-based Measure (EBM) to evaluate the efficiency of green innovation. Therefore, in order to make green innovation meet the dual goals of economic development and ecological protection, research on the efficiency of green innovation has been paid continuous attention.
In summary, although existing studies have studied the PPP mode’s innovation promotion mechanism, innovation-driven development, and innovation efficiency, most of the research samples are regional or small and medium-sized enterprises, and relatively few large environmental protection enterprises. Furthermore, most studies focus on efficiency calculation, without considering environmental impact and random errors, which leads to inaccurate conclusions. In addition, for enterprises adopting the PPP mode, considering the profit orientation of social capital and the public welfare of government projects, research should pay more attention to the economic and social value, which puts forward new requirements for the innovation-driven development of enterprises.

3. Methodology

Whether the PPP mode promotes innovation, establishing an effective process to evaluate the performance of the infrastructure industry is essential to establish a model that can evaluate the innovation-driven development performance of the infrastructure industry under the PPP mode. In existing studies, the data envelopment analysis (DEA) method proposed by Charnes et al. [43] and the stochastic frontier analysis (SFA) method proposed by Aigner et al. [44] are widely used, but the functions’ formation and distribution assumptions of the SFA method are too strict. Commonly-used DEA models include the DEA-BCC (Banker, Charnes, and Cooper) model [45], the DEA-Malmquist [46], etc. According to the research objective and the required accuracy, a hybrid method based on a three-stage DEA model combining SFA and DEA is applied in this paper.
Compared with other methods for measuring efficiency, the DEA method does not need to establish a strict functional relationship among variables but can simultaneously evaluate the production performance of a multi-input and multi-output decision-making unit (DMU). At the same time, the DEA method has the characteristics of unit invariants, that is, the unit of input and output data does not affect the measurement results. In addition, the weight of the DEA model is generated by mathematical programming according to data, so it is not affected by subjective factors.

3.1. Limitations Analysis of the Traditional DEA Method

Although the DEA method has been widely used in performance evaluation, there are still some limitations in this method. There are two limitations in the traditional DEA method.
(1) There is no guarantee of the accuracy of the results obtained by the traditional DEA method. When the total number of DMU is close to the total number of input–output indicators, the input–output efficiency obtained by the DEA method deviates greatly from the actual situation.
(2) The technical effective units cannot be compared by the DEA method. Without considering the influence of random factors in the system, the input–output efficiency result obtained by the DEA method will be affected when there are special points in the samples.

3.2. Establishment of the Innovation-Driven Development Performance Evaluation Model Based on a Three-Stage DEA Method

Based on the previous analysis, the traditional DEA method has certain limitations. In view of the fact, it is necessary for the infrastructure industry under the PPP mode to find a suitable model to evaluate the innovation-driven development performance.

3.2.1. The Three-stage DEA Model

The three-stage DEA model is an improvement based on the traditional DEA model, which was proposed by Fried et al. [47]. In this paper, the input redundancy calculated in the first stage is taken as the dependent variable in the second stage, and the environmental variable is taken as the independent variable, which is conducted for the regression analysis by the SFA model. The analysis process is as follows.
Stage 1: Establishing the traditional DEA model. The objects, including 20 listed environmental protection enterprises under the PPP mode, are selected as the DMU, and each DMU (sample enterprise) consists of three index variables; there are m inputs and s outputs in each DMU. The model is established as:
max i = 1 m s i + r = 1 s s r + s . t . { j = 1 n λ j x i j + s i = θ * x i o i = 1 , 2 , ... , m j = 1 n λ j y r j s r + y r o r = 1 , 2 , ... , s j = 1 n λ j = 1 λ j 0 s i , s r + , 0 j = 1 , 2 , ... , n
where, θ * is the optimal solution; s i and s i + represent the relaxation of input and output, respectively; x, y, and j represent the input variables, output variables, and number of DMU respectively; λ is the unknown weight; x i and y r represent the i-th input and r-th output of the DMU (sample enterprise), respectively.
Stage 2: Regressing by SFA. The relaxation variable is corrected, and the regression function is constructed by SFA as:
s i j = f j ( z i , β j ) + v i j + u i j ( i = 1 , 2 , m ; j = 1 , 2 , n )
where β is the solve-for parameter; z is the environment variable; s i j is the relaxation variable of the i-th output of the j-th DMU (sample enterprise); f j is the influence function of each factor on the relaxation variable; v i j + u i j is the mixing error, and v i j and u i j represent the influence of random factors and management inefficiency, respectively. Finally, v i j and u i j are independent of each other, u i j ≥ 0, u i j ~ N + ( μ n , σ u j 2 ); γ = σ u j 2 /( σ v j 2 + σ u j 2 ) is defined under the hypothesis of γ = 0. If the original hypothesis is rejected, it indicates that the setting of the SFA model is reasonable.
The formula for adjusting the relaxation variable in the second stage is as follows.
x i j A = x i j + [ m a x j { z j β ^ i } z j β ^ i ] + [ m a x j { v i j ^ } v i j ^ ] , n = 1 , N , i = 1 , , I
where, x i j A represents the adjustment of the relaxation variable of the i-th output of the j-th DMU. The premise of the stochastic frontier model is the existence of the inefficiency term u i , which can be tested by the generalized likelihood ratio of one side, “ H 0 :   σ u 2 = 0   v s   H 1 :   σ u 2 > 0 ”.
Stage 3: Re-measuring efficiency using the first stage method. In the second stage, separate the influences of environmental factors and random errors to better reflect the true technical efficiency value, and compare with the measurement results in the first stage.

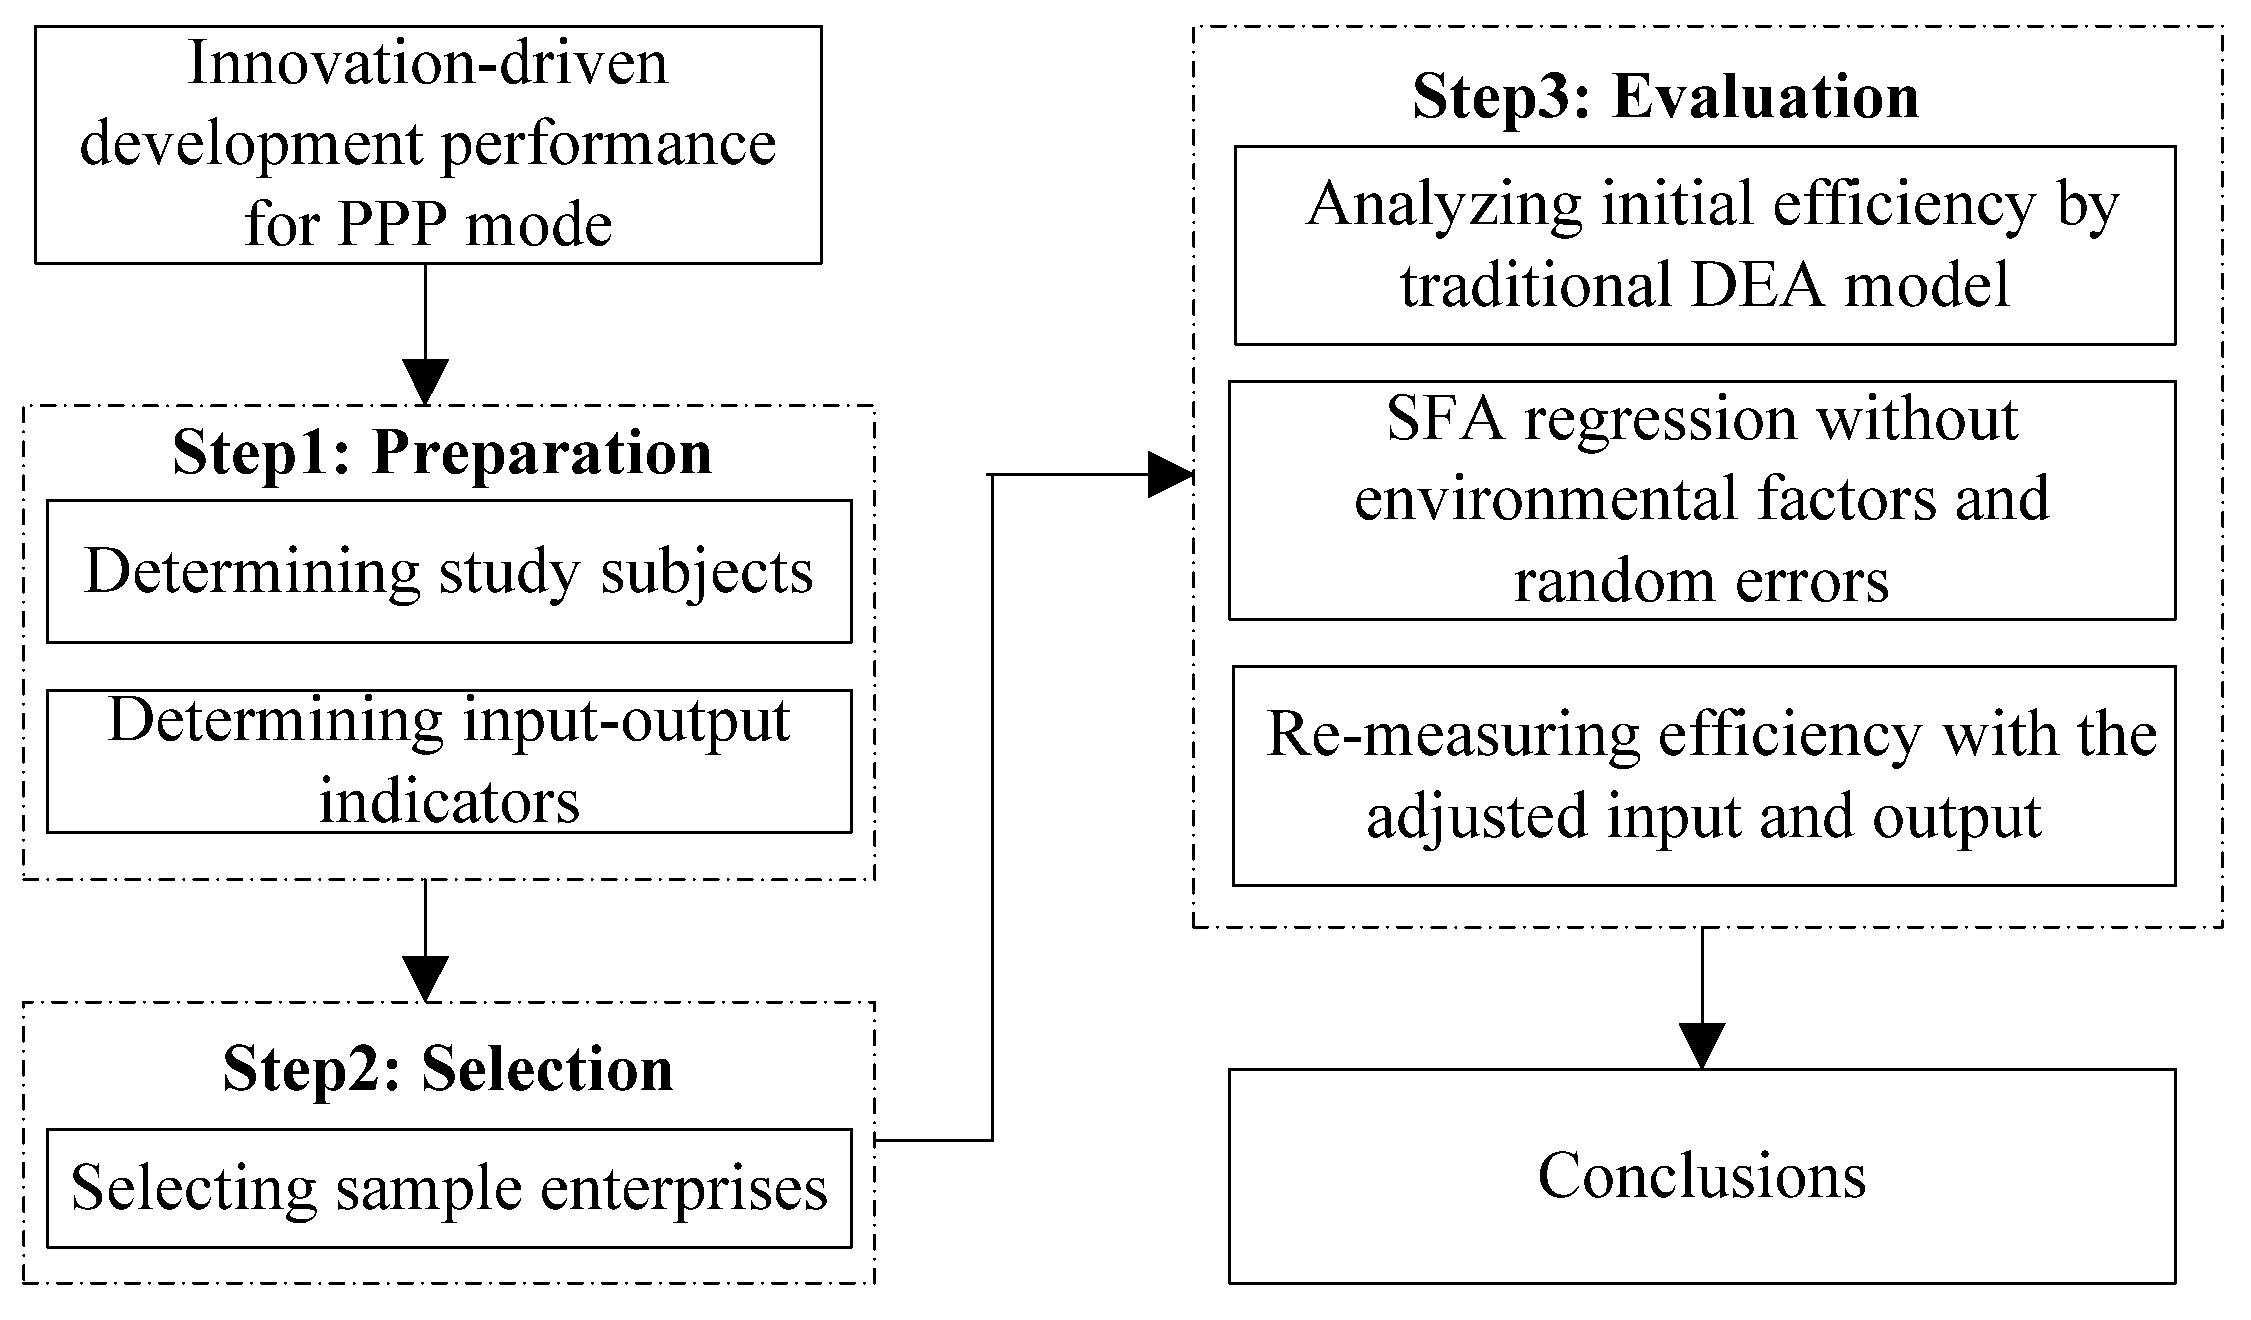
3.2.2. Establishment of the framework of system

The framework of the analysis system, which represents the innovation-driven development performance of the infrastructure industry under the PPP mode, consists of three steps: preparation, selection, and evaluation.
(1)
Preparation
First of all, study subjects should be determined before analysis, which has a great influence on the selection of indicators and samples. Furthermore, the input–output indicators are identified by some effective measures.
(2)
Selection
According to the study subjects, the selection of effective samples is important, and the data of samples selected should be comprehensive and accurate, which can meet the needs of the research.
(3)
Evaluation
In this step, the efficiency measures of sample enterprises are analyzed by the three-stage DEA model, and the conclusions can be obtained.
Based on the above analysis, the framework of evaluating innovation-driven development performance for the PPP mode is shown in Figure 1.

4. Index System and Sample Data Sources

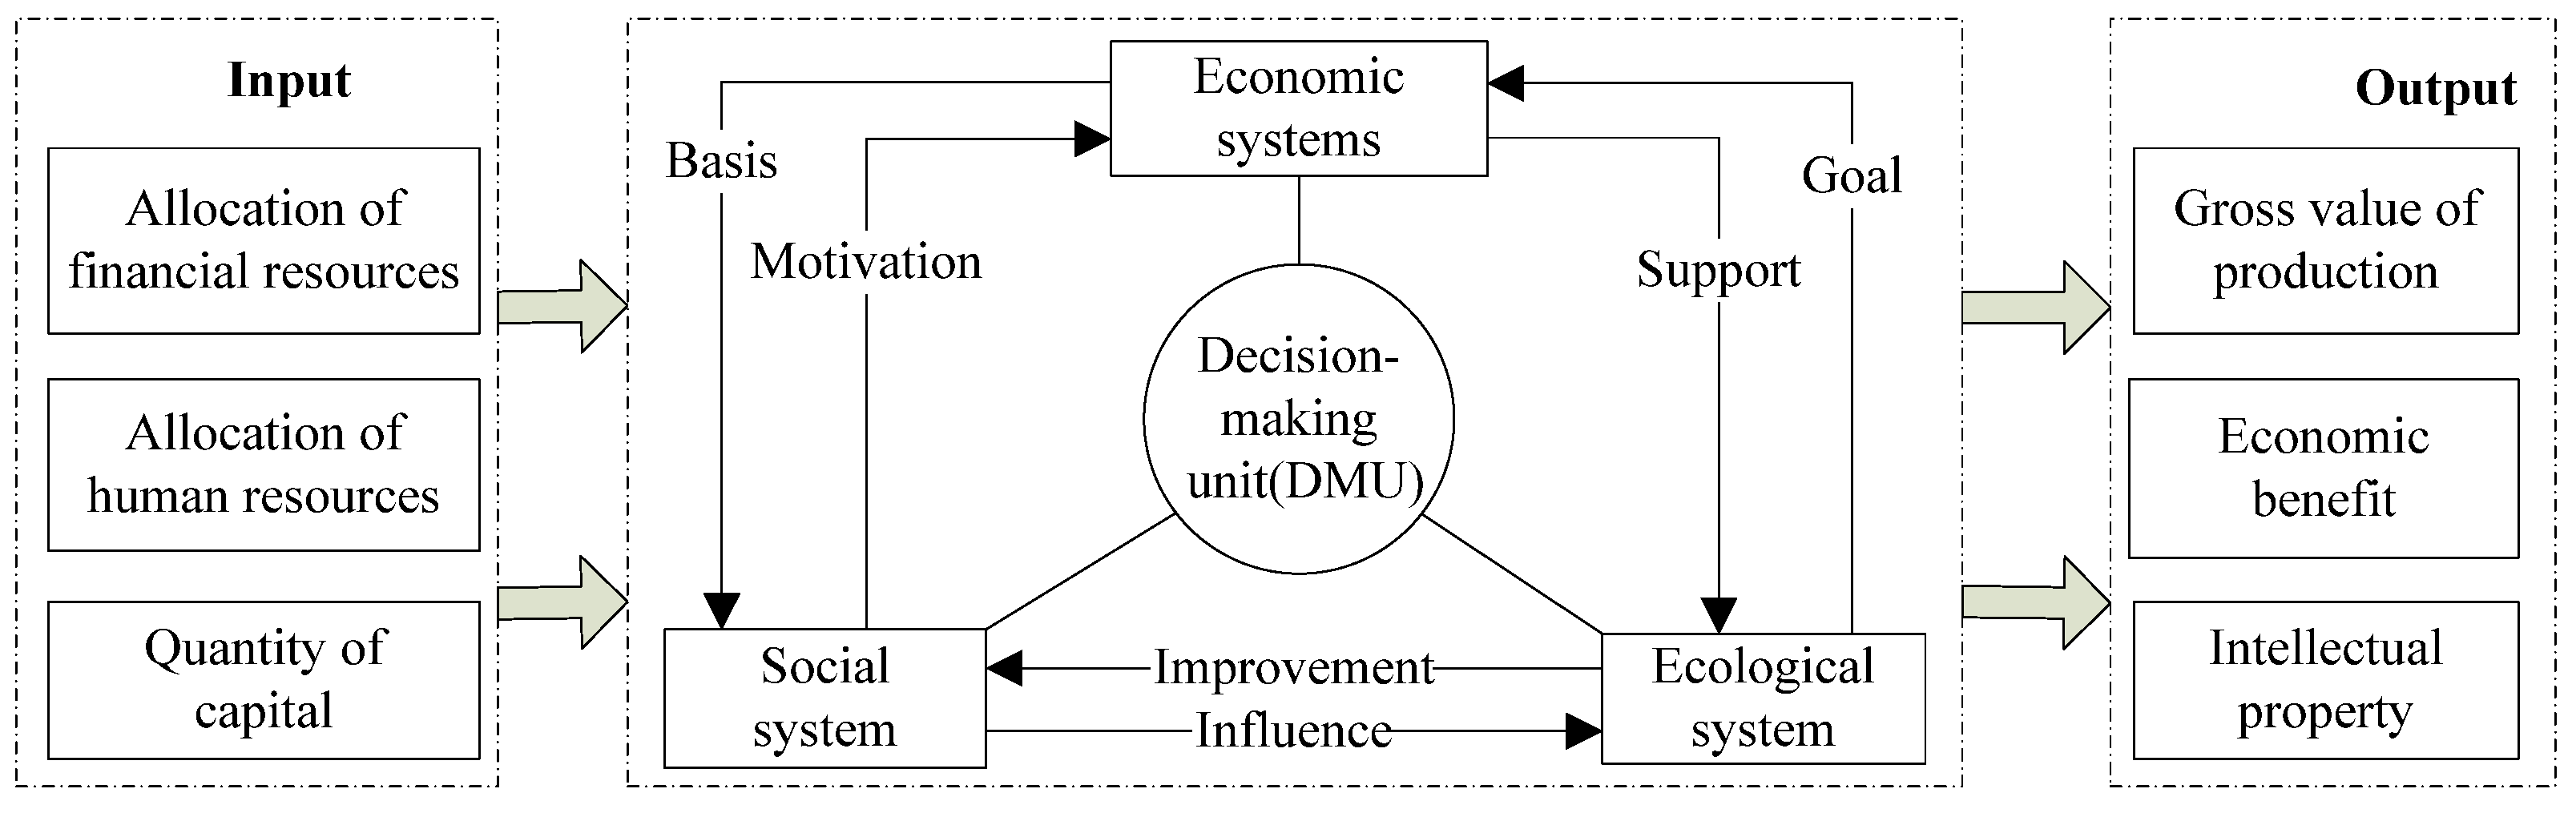
4.1. Construction of Index System

One of the key subjects of study in evaluating innovation-driven development performance for sample enterprises applying the PPP mode is to establish an effective index system.
The primary task of environmental protection enterprises is to create a healthy living and working environment. Only by the coordinated development of economy, society, and environment can a virtuous circle of sustainable development be achieved. Based on the view of the input–output effect, the economic, social, and environmental dimensions are considered in this paper. The theoretical framework of the input–output index of innovation efficiency is constructed, which is shown in Figure 2. The DMU represents the object of innovation efficiency evaluation in Figure 2, which is represented by a specific sample enterprise in this paper. On this basis of the theoretical framework, the evaluation index system of innovation efficiency of environmental protection enterprises is established, and the specific indexes are shown in Table 1.
The innovation efficiency of enterprises in environmental protection is influenced by many factors. Based on the existing studies [48,49,50,51], the word frequency statistical method is used to search the relevant literature related in the Web of Science (WOS) and the China National Knowledge Internet (CNKI), from 2011 to 2021. Under the principle of availability, quantification, and comparability of data, the input–output index of the innovation efficiency of the environmental protection enterprise is selected.

4.1.1. The Input Index of Innovation-Driven Development Performance of Environmental Protection Enterprises

Manpower and capital play an important role in the environmental protection industry. Effective use of manpower and capital in supply can significantly improve the environment [52]. Therefore, this study selects input index from the aspects of manpower and capital. First of all, investment in R&D is the precondition for the environmental protection industry to carry out technological innovation activities and achieve the effect of innovation-driven development, which belongs to the core expenditure of enterprises in the environmental protection industry to guarantee innovation-driven achievements and market competitive position [53,54]. Then, The number of R&D personnel is the manpower input of R&D in the process of innovation-driven solutions in the environmental protection industry [55,56]. Besides, in addition to the input of basic innovation resources such as R&D funds and R&D manpower, the amount of R&D capital embodies the connotation of innovation-driven industrial development with input elements [57,58], so the operation cost is taken as the input index of innovation-driven solutions in the environmental protection industry.

4.1.2. The Output Index of Innovation-Driven Development Performance of Environmental Protection Enterprises

The number of patents is the operational transformation of direct achievement and innovative achievement, which is a widely used measure of technological innovation output [59,60]. To some extent, net profit reflects the commercial realization and market acceptance of the patent technology innovation and other innovative achievements, which can be used as an indirect measure of the output of innovative operations [61]. Besides, the main business income can effectively reflect the innovative operation performance in terms of contract value, achievement transformation benefit, and patent output income [62,63]. The above indicators are of great significance for improving the innovation efficiency of environmental protection enterprises and promoting sustainable development. So, the main business income, net profit, and patent number of environmental protection enterprises are selected as the measurement indexes of variable outputs in this paper.

4.1.3. Exogenous Environmental Variables

Apart from the input variables and output variables, the exogenous environmental variables will also influence the innovation performance of the environmental protection industry. Combined with the influence of the PPP mode on innovation, the application value of the PPP mode is selected as the environment variable based on the characteristics and literature studies of the innovation efficiency. The application value of the PPP mode is mainly reflected in two aspects as follows.
(1)
Economic Value
The economic value is reflected in realizing the best use value of funds, reasonably sharing risks, considering the whole life cycle cost of the project as a whole, reducing the financial burden of the government, and improving the service level of infrastructure, etc. [64]. The ability of financial funds to undertake infrastructure construction directly is limited. Spending on infrastructure will not keep up with its growing needs; the government would be overwhelmed to do it all. If it is financed by the government, it will lead to potential risks of financial system and financial liability. According to the above analysis, the current liabilities are used to represent the economic value in this paper.
(2)
Social Value
The social value is reflected in transforming government functions, acquiring advanced technology and management experience of the private sector, improving the efficiency of capital use, promoting the project to be put into use, improving the investment environment, solving employment pressure, and protecting the environment (that is, reducing waste to meet the requirements of environmental protection without reducing the value of capital use), etc. [65,66]. According to the above analysis, the number of employed employees is used in this paper to represent the social value.

4.2. Selection of Sample Enterprises and Sample Data Sources

The data in this paper are from the websites of Shanghai and Shenzhen stock exchanges, the annual financial statements of environmental protection enterprises in the PPP concept section of Sina Finance and Economics, and the Statistical Announcement of National Economic and Social Development. To ensure the scientific nature, comparability, timeliness, simplicity, and operability of the data, the environmental protection enterprises are first selected from these two exchanges, then the annual financial statements of each enterprise from Sina Finance and Economics are collected with the company name and securities code. Then, the input and output indicators reflecting the innovation efficiency of environmental protection enterprises are calculated. In this study, the sample enterprises are the Daqian Ecology & Environment (Daqian), CSD Water Service, Haixia Environmental Protection (Haixia), Liantai Environmental Protection (Liantai), TianYu Eco-Environment (Tianyu), Longma Environmental Sanitation Equipment (Longma), Beijing GeoEnviron Engineering & Technology (BGE), Weiming En vironment Protection (Weiming), Shanghai Environment (Shanghai), Tianjin Capital Environmental Protection (Tianjin), Huaguang Environment & Energy (Huaguang), Grandblue Environment (Grandblue), Yuanda Environmental Protection (Yuanda), Beijing Capital (Beijing), Lvyin Landscape and Ecology (Lvyin), Lingnan Eco & Culture Tourism (Lingnan), Dongjiang Environment (Dongjiang), Wangneng Environment (Wangneng), Infore Environment Technology (Infore), and Central Plains Environment Protection (CPEP), respectively.

5. Results of Applications

5.1. The First Stage: Measuring and Analyzing the Innovation Efficiency of Original Input–Output Data

Without considering environmental variables and random errors, the innovation efficiency of environmental protection enterprises is preliminarily estimated, and the results are shown in Table 2.
After calculation, the mean of comprehensive technical efficiency (TE), pure technical efficiency (PE), and scale efficiency (SE) of environmental protection enterprises before adjustment are 0.653, 0.865, and 0.754, respectively, which indicate that there are still gaps of 34.7%, 13.5%, and 24.6% from the frontier of efficiency, respectively. The innovation-driven development performance of most environmental protection enterprises is below the efficiency frontier, which indicates that increasing the input cost of innovation-driven solutions in environmental protection enterprises in the short term cannot give full play to the drive effect. Thus, it can be seen that there is still much room to drive the development of environmental protection enterprises before adjustment.
From the measure of the traditional BCC-DEA model, four environmental protection enterprises are in the stage of optimizing innovation efficiency. The traditional measure also shows that the improvement of scale efficiency of the whole environmental protection industry from 2018 to 2020 is the main reason for the improvement of innovation-driven efficiency in the environmental protection industry, and the low pure technical efficiency of environmental protection enterprises leads to low driving efficiency. Unexpectedly, the average comprehensive efficiency level of environmental protection enterprises in Jiangsu and Chongqing, such as Daqian, Huaguang, Grandblue, Yuanda, etc., is obviously lower. The preliminary calculation results indicate that the innovation-driven efficiency of environmental protection enterprises is not entirely consistent with the degree of economic development.
While the economic level is also the basis for carrying out innovation activities and improving innovation efficiency, at the same time, the influence of complex environmental factors, such as the economic value and social value of the PPP mode on the innovation and development of environmental protection enterprises, have not been considered. In addition, the distribution of innovation resources in the environmental protection industry is unbalanced and in spatio-temporal heterogeneity, but the original model measurement does not consider these environmental factors. Therefore, the preliminary calculation results of innovation efficiency of environmental protection enterprises need to be further revised.

5.2. The Second Stage: Adjustment Analysis with the Stochastic Frontier Analysis (SFA)

The second stage is an econometric analysis of innovation efficiency based on the original input–output measurement results of the first stage. The input relaxation of the first stage is taken as an explained variable, and the economic value and social value of the PPP mode are taken as explanatory variables, which are used to perform regression with SFA and corrected calculation. The results are shown in Table 3.
It can be seen from Table 3 that the sigma-squared ( σ 2 ) and Gamma ( γ ) values of the SFA model with the input relaxation variable 1, and input relaxation variable 3 all pass the significance test at 1% level.
Therefore, the model and variable setting adopted in this study are reasonable, and economic value and social value are more important than random error to the technical efficiency of environmental protection enterprises. The LR (test of the one-sided error) test has also passed the significance test, which shows that it is reasonable to separate invalid terms by using the stochastic frontier method (SFA). So, it is necessary to control the environmental effect and random error of innovation efficiency difference in environmental protection enterprises.
To sum up, since economic value, social value, and random error have different influences on the innovation efficiency of DMU (environmental protection enterprises), SFA adjustment is needed to accurately reflect the actual efficiency level of DMU (environmental protection enterprises) in order to avoid the estimation deviation of innovation efficiency of different DMU (environmental protection enterprises).

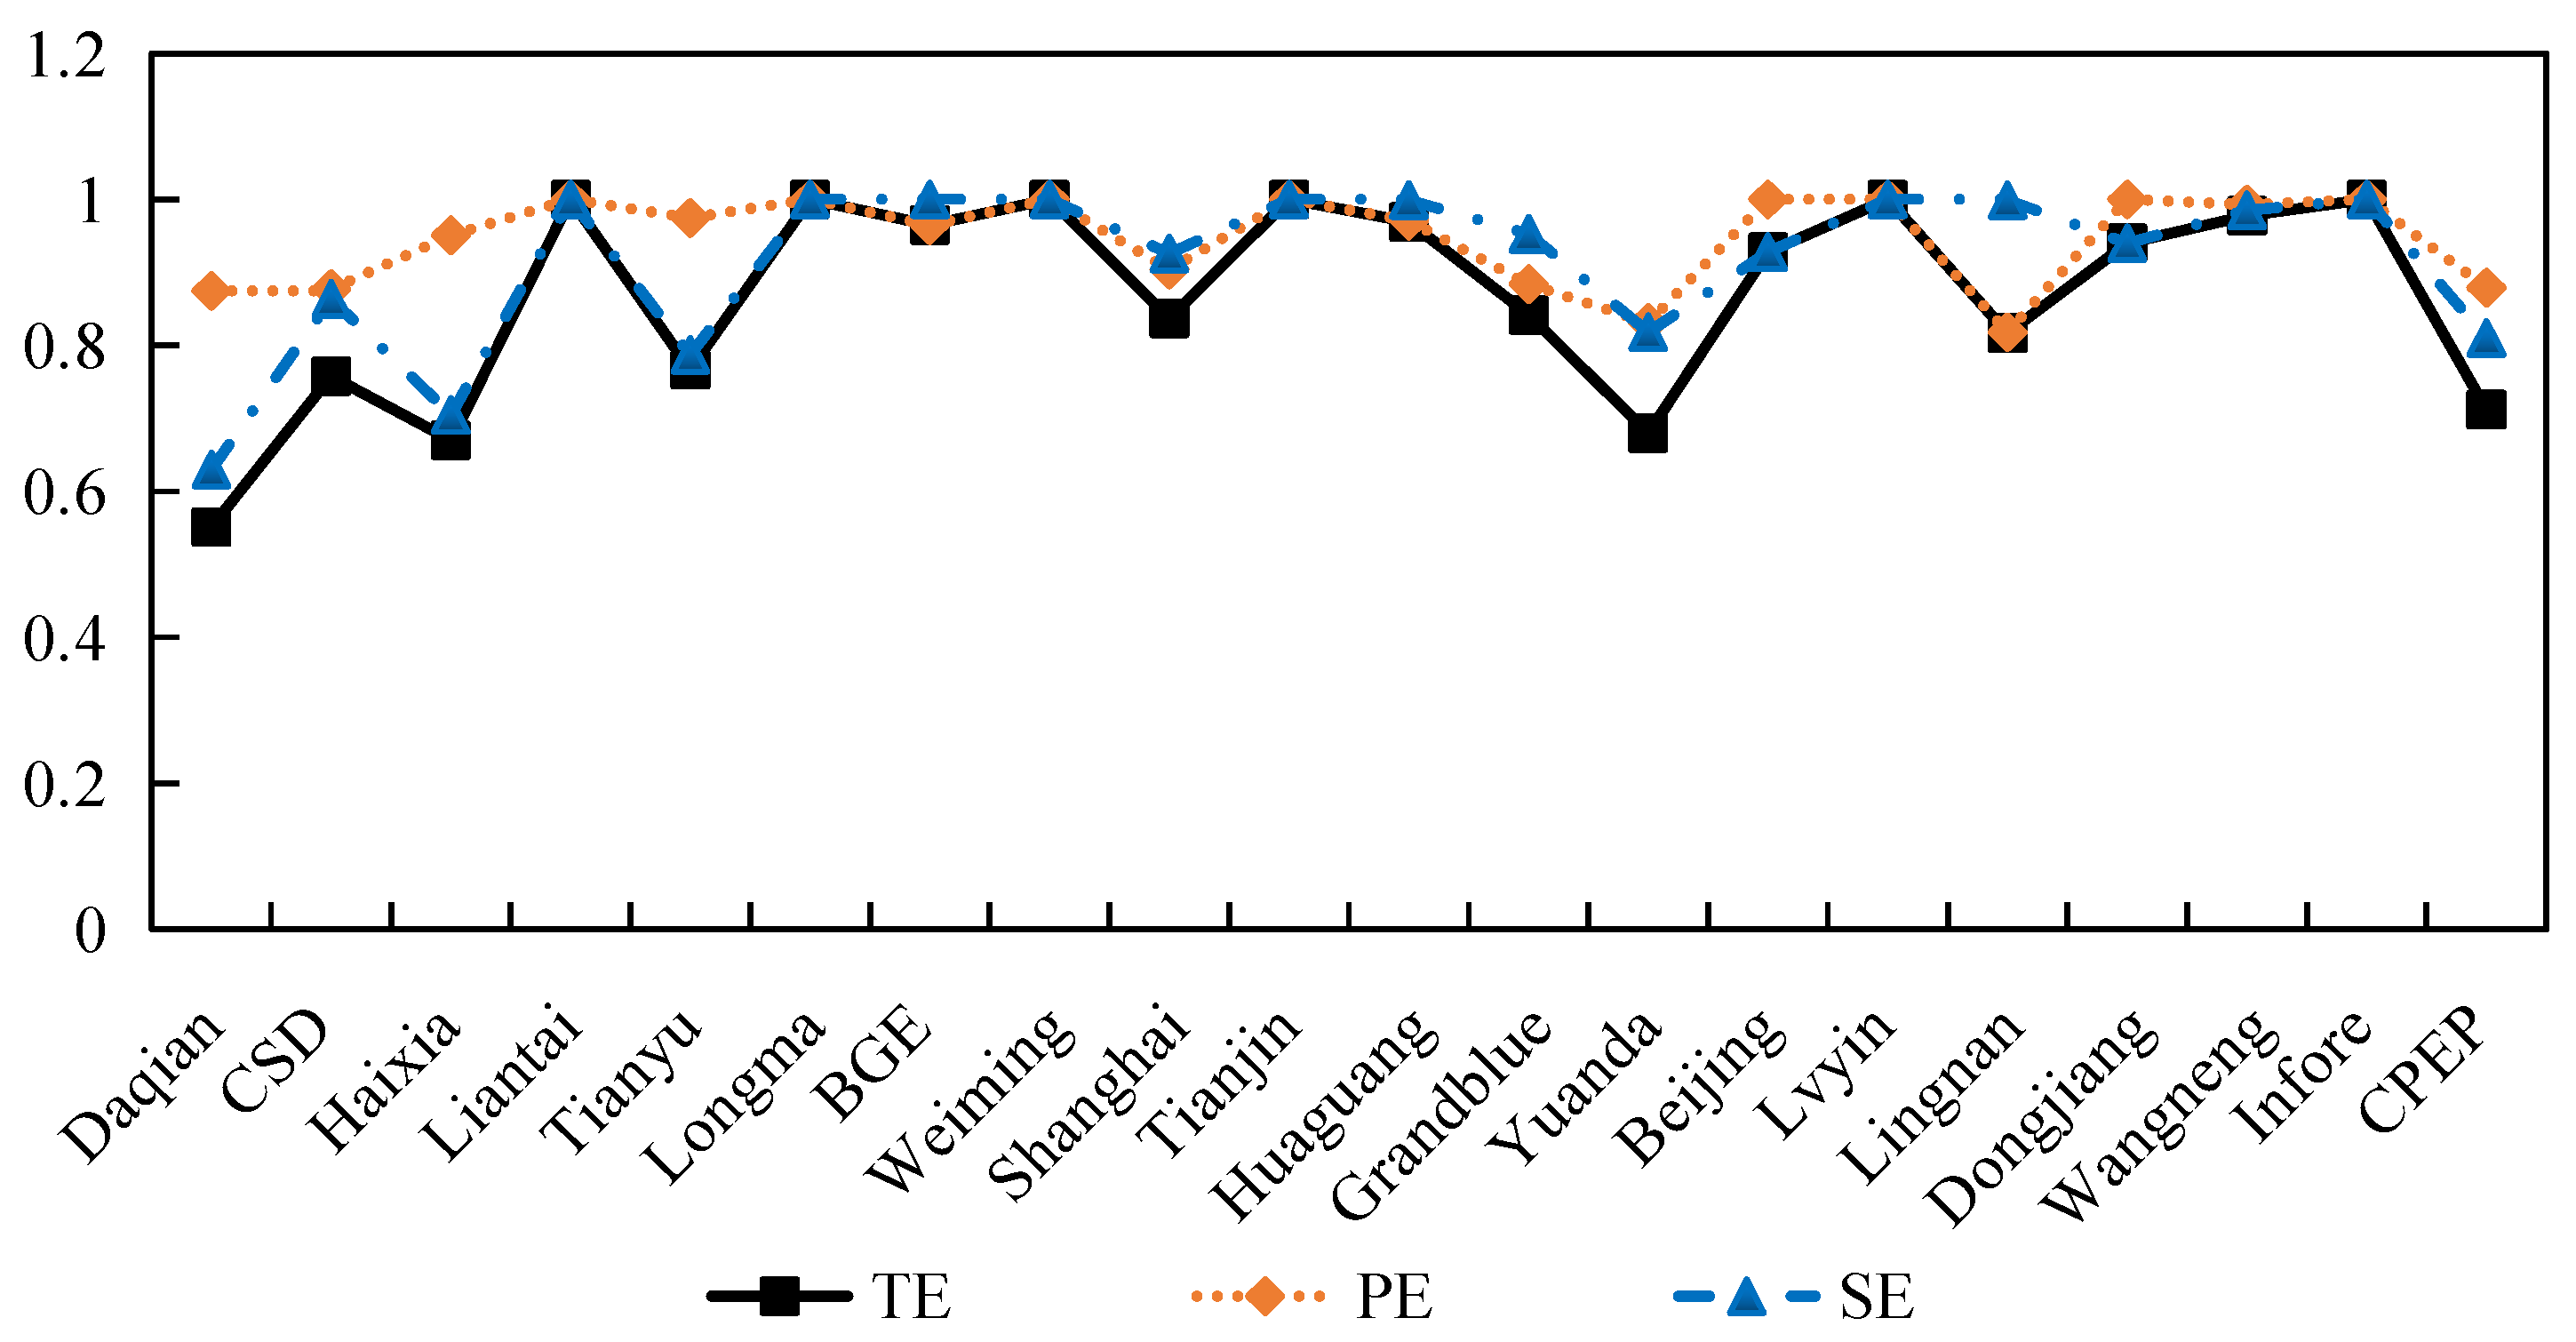
5.3. The Third Stage: Measuring and Analyzing the Innovation Efficiency after Adjustment

Based on the SFA factorization analysis and adjustment results, the input variables and the original output variables adjusted by the SFA model are recalculated by using model method in the first stage.
After adjusting environmental factors and random factors, the true innovation efficiency of environmental protection enterprises in the third stage can be obtained. The results are analyzed as follows.
(1) Longitudinal Change Features in Time
From Table 4 and Table 5, it can be seen that the adjusted innovation-driven development performance of environmental protection enterprises in 2018–2020 shows a certain trend of growth and improvement. In 2020, due to the epidemic situation, the innovation-driven super efficiency of the environmental protection industry declined slightly, while the pure technical efficiency still kept on the rise. The pure technical efficiency is relatively stable, which indicates that the adjustment of technology input structure of environmental protection enterprises has little fluctuation.
Furthermore, the source of the growth structure is explored from the pure technical efficiency and scale efficiency of decomposition. On the whole, pure technical efficiency is much higher than scale efficiency, which shows that the innovation-driven development performance of the environmental protection industry is obviously better than scale efficiency in the aspect of pure technical efficiency. There is also a significant difference between the pure technical efficiency and scale efficiency from 2018 to 2020. The pure technical efficiency has maintained a high level of improvement every year.
The scale efficiency shows a trend of decline after the increases, and it is in a state of continuous improvement of scale on the whole, but has not reached an effective state. This indicates the insufficient innovation scale effect inhibits the improvement of innovation-driven efficiency.
Overall, the average level of the innovation-driven development performance of environmental protection enterprises in 2018 was 0.633, that of environmental protection enterprises in 2019 was 0.71, and that of environmental protection enterprises in 2020 was 0.626, which indicates that the integral innovation efficiency of environmental protection enterprises is still at a low level, and the structure of industrial innovation and the comprehensive benefits of input–output are insufficient. The innovation-driven effect will not be obvious in the short term, and the costs of resource input, technology management, and scale improvement all need to develop. Efficient technological reform and the industrial innovation-driven development strategy and management level strongly promote the innovation-driven efficiency growth of the environmental protection industry. However, in the long run, the increasing technological innovation in the environmental protection industry can promote the sustainable development of enterprises driven by innovation in the future. In the future, efforts should be made to improve the scale efficiency of environmental protection enterprises.
(2) Horizontal Heterogeneity Comparison in Space
After adjustment, the innovation-driven performance of environmental protection enterprises shows significant spatial differences. From Table 6 and Figure 3, the level of innovation-driven development of different environmental protection enterprises is quite different. The innovation efficiency value of six environmental protection enterprises have reached the frontier level, while the minimum value is 0.551, which is not up to the frontier level. After the adjustment, the average innovation efficiency level of environmental protection enterprises is significantly higher than that before adjustment, and the stability of the conclusion is significantly affected by the controlled environmental factors and random errors. The scale efficiency of environmental protection enterprises before adjustment is the main factor to improve the comprehensive technical efficiency, while the pure technical efficiency of environmental protection enterprises with a focus on technical improvement and management perfection after adjustment is the main reason. At the same time, after the environmental factors are controlled, the overall result is more in line with the theoretical support of economics and the actual situation.
After environmental effects and random errors are considered, the innovation efficiency of environmental protection enterprises such as Daqian, CSD, Haixia, longma, BGE, Weiming, Shanghai, etc., has been significantly improved. Compared with the obvious underestimation before the adjustment, this adjustment is closer to the actual situation. The growth of innovation-driven efficiency of environmental protection enterprises mainly comes from the progress of pure technical efficiency, and the main reason for the continuous improvement of the technological change and management efficiency is the shortage of innovation scale, and the innovation-driven effect needs to be adjusted under the scale-oriented environmental protection enterprises.
From the nature of the enterprise, private enterprises and state-owned enterprises are mixed in the sample of environmental protection enterprises, p, which indicates the state-owned enterprises and private enterprises are the main forces of environmental protection construction under the target that carbon emissions will peak by 2030 and will be carbon neutral by 2060 (double-carbon target). Environmental improvement is a long-term trend, and ecological progress has been elevated to the top level of national strategy in China. Enhancing the innovation driving force of environmental protection enterprises, strengthening the ecological civilization construction of environmental protection enterprises, and solving the ecological environment problems are the new developments and new opportunities that environmental protection enterprises are facing.
(3) Analysis of environmental protection enterprises with optimal innovation efficiency
From the perspective of diminishing returns to scale, in order to further analyze the scale efficiency of the 20 environmental protection enterprises after adjustment, the scale efficiency is classified and compared. As can be seen from Table 6, only six environmental protection enterprises are in the optimal scale state, realizing an effectiveness of scale economies. The six environmental protection enterprises are in the state of easy improvement; five environmental protection enterprises are in the state of small scale, and two environmental protection enterprises are in the state of low technical efficiency. It can be seen that from 2018 to 2020, some environmental protection enterprises have reached the optimal scale of enterprises, some environmental protection enterprises have the problem of too large a scale, and some environmental protection enterprises have the problem of technical inefficiency. The environmental protection enterprises with the best performance only account for 30% of the selected samples, which are shown in Table 7.
(4) Comparative analysis before and after adjustment
From Table 2 of the first stage and Table 6 of the third stage before and after adjustment, it can be seen that the efficiency level has significant differences for some environmental protection enterprises and has minor differences for the others. The efficiency analysis of the model before adjustment, without environmental factors will lead to significant deviations of results.
Figure 4 shows that there is a significant difference between the innovation efficiency comparison chart before and after adjustment. Before the adjustment, only a small number of the sample enterprises are overestimated by the traditional model, and most sample enterprises are underestimated. On the whole, the average innovation efficiency before adjustment changes from 0.653 to 0.871 after adjustment. Among them, the average level of Beijing’s efficiency changed from 1.000 to 0.928, indicating that Beijing’s efficiency is overestimated due to the environmental impact, which is not in line with the actual situation. The average of pure technical efficiency before adjustment changed from 0.865 to 0.946 after adjustment, and the scale efficiency changed from 0.754 to 0.917 after adjustment. This shows that different environmental factors have different effects on input relaxation, and the efficiency measurement without considering environmental factors will lead to a certain degree of deviation in the evaluation of environmental protection enterprises. By controlling environmental factors and random error, all environmental protection enterprises are in the same environment, and the measured results after adjustment are quite different from those before adjustment, which can reflect the true innovation efficiency level of environmental protection enterprises more truly and effectively.

6. Discussion

In summary, the innovation-driven development performance of China’s large-scale environmental protection enterprises measured by the hybrid method proposed in this paper is basically consistent with the actual situation. With further revision of environmental variables, it objectively reflects the innovation-driven development performance of each enterprise. First of all, compared with the traditional DEA measurement used in existing literature research, the adjusted results are more in line with the economic regulation. The innovation efficiency of enterprises in economically developed areas was obviously underestimated before adjustment, such as in Daqian, etc. However, after calculation of the mixed methods, the calculation results have been improved and are closer to the actual situation. Secondly, based on the analysis of the longitudinal change features in time, the pure technical efficiency of each enterprise has kept a steady growth from 2018 to 2020. Although there was a slight decline in SE in 2020, it should be related to the impact of the epidemic. In the long run, if technological innovation is continuously promoted, the innovation-driven effect will be reflected. Then, based on the comparative results of the horizontal heterogeneity comparison in space, the significant impact of innovation efficiency is transformed from scale efficiency to pure technical efficiency because environmental effects and random errors are considered, which also suggests that the innovation-driven strategy of environmental protection enterprises should be adjusted under the current scale orientation. In addition, the analysis of the optimal innovation efficiency of environmental protection enterprises shows that only 6 out of the 20 environmental protection enterprises are in the optimal scale state, thus realizing the effectiveness of economies of scale. Therefore, compared with the traditional DEA method, this paper adopts the mixed analysis method, which takes into account the environmental factors and random error, and has obvious effects and advantages. The research results of this paper are more conducive to environmental protection enterprises investing in PPP projects to realize the gap with the best results, find out the reason for the gap, and provide theoretical support for further measures.

7. Conclusions and Recommendations

7.1. Conclusions

A hybrid method based on a three-stage analysis framework including the improved SFA model is applied to analyze the sample data of environmental protection enterprises from 2018 to 2020. Considering the influence of environmental factors and random errors on the innovation efficiency of environmental protection enterprises for the first time, the efficiency of environmental protection enterprises is analyzed by decomposing and correcting the input offset of the environmental protection enterprise. The efficiency gap among environmental protection enterprises is compared, and then the weak links of environmental protection enterprises and the new driver of growth are found out more truly. The main conclusions of this study are as follows.
(1) Compared with the DEA measurement results of environmental protection enterprises in the first stage, the measurement results in the third stage are more realistic and in line with reality, which shows that it is necessary to consider the environmental effect and random error to improve the efficiency of environmental protection enterprises. After random errors and environmental variables are eliminated, the innovation efficiency, technical efficiency, and scale efficiency of environmental protection enterprises have all improved, but the efficiency value of some samples has not reached the optimal scale, and there is still room for development.
(2) The improvement of pure technical efficiency is obviously better than that of scale efficiency, and the technical efficiency is the main power source for improving the innovation efficiency of environmental protection enterprises. In terms of time, the innovation-driven development performance of environmental protection enterprises rises first and then declines. There is a significant difference in space, and innovation-driven transformation of environmental protection enterprises is urgently needed. The innovation-driven effect is guided by the innovative production scale.
(3) Liantai, Longma, Weiming, Tianjin, Lvyin, and Infore are the optimal scale environmental protection enterprises. The environmental protection enterprises that can be easily improved include BGE, Shanghai, Huaguang, Beijing, Dongjiang, and Wangneng. The environmental protection enterprises with invalid technical efficiency are Grandblue and Lingnan, respectively. The sample enterprises with too small a scale are Daqian, CSD, Haixia, Yuanda, and CPEP. The Dongjiang is a sample of the too-large-scale enterprises.

7.2. Recommendations

Combined with the study conclusions, the following recommendations are proposed in this paper.
(1) Environmental factors have a significant impact on the innovation efficiency of environmental protection enterprises, so it is necessary to pay attention to the impact of environmental factors and control it.
To develop environmental protection enterprises and improve the efficiency of innovation, they must persist in technological innovation. Under the double-carbon target, China not only needs industrial restructuring, energy conservation, and environmental protection, but it also needs landscaping and ecological restoration, which are bound to push the ecological industry into a golden period of sustained and rapid development. Ecological construction has been promoted to a national strategic level in China, and favorable policies such as beautiful China, rural revitalization, new urbanization, and strengthening weak links in infrastructure construction have continued to increase. Driven by these policies, environmental protection enterprises are expected to usher in great opportunities of rapid development. Environmental protection enterprises should firmly seize the development opportunity, pay attention to innovation and development, enhance planning and design capabilities, build the core competitiveness, actively expand business areas, integrate the resources advantages, and constantly seek breakthroughs by using the PPP mode. They should also enhance the innovation and operation capabilities of environmental protection enterprises, ensure the sustainability and effectiveness of independent innovation capabilities of environmental protection enterprises, and enhance the brand and value of environmental protection enterprises.
(2) Environmental protection enterprises have entered a new stage of full implementation, optimizing and adjusting the ratio of labor and capital transformation structure in environmental protection enterprises.
The effective use of labor and capital can significantly reduce carbon emissions and ensure sustainable development. The corresponding redundancy of traditional capital elements will also increase, and the capital-intensive drive needs to be controlled reasonably to improve the efficiency of innovation capital transformation. New technologies and patents are conducive to promoting the effective allocation of innovation-driven resources in environmental protection enterprises. With the increase of the scale effect and competition effect, the efficiency can be improved, and the allocation of management system of intellectual property technology and R&D expenses can be gradually improved, so as to promote the effective utilization of innovation-driven resources. Attention should be paid to the spatial and temporal heterogeneity of the innovation-driven development performance of environmental protection enterprises, and targeted adjustments should be carried out for different years to promote the rational flow of innovation-driven resources. Based on the study conclusion, in the future, it is necessary to focus on improving the technical effect driven by innovation of environmental protection enterprises under the production scale, improving the knowledge accumulation, management system, research and development foundation, capital levels, and economic strength driven by technological innovation. This innovation can contribute to promoting the development of scientific methods and steps of innovation, strengthening the introduction, digestion, and absorption of technology, creating new management methods, giving full play to the benefits of digestion, absorption and re-innovation, and ensuring the long-behind technological advantages.
(3) By optimizing and innovating the use of driving resources of environmental protection enterprises, the operation mode of projects is innovated.
The level of innovation-driven development performance of environmental protection enterprises is consistent with the degree of economic development, economic value, and social value. After adjustment, the innovation-driven efficiency of environmental protection enterprises has improved significantly, but only a few environmental protection enterprises have reached the effective frontier. Therefore, we should strengthen and optimize the use of innovation-driven resources, avoid blindly invested resources, and further improve the economy and sustainability of innovation-driven scale. In addition, relying on the application value of PPP mode, on the one hand, it maximizes the value of capital use. Competition of enterprise’s environmental infrastructures can be increased through competitive choice of private partners; some of the risks can be transferred to the private sector, which can control them through economic assessment techniques, and the expertise and innovation of the private sector can be used to provide higher quality and more effective services. On the other hand, the social benefits are concerned. The PPP mode introduces a market competition mechanism and changes the traditional management mechanism, which is conducive to gaining advanced management experience and technology. The private sector is more efficient in the use of capital without succumbing to terms and conditions in the operation of projects and has more flexible management. It encourages the environmental protection infrastructure sector to transfer technology, improves the intermediate link of innovation-driven industrialization, and increases the innovation-driven conversion rate. At the same time, the commercialization and industrialization of scientific and technological output should be strengthened after innovation behavior, so as to realize operation transformation value and improve innovation efficiency on the basis of innovation achievements.

8. Limitations

There are some limitations in this study. First of all, perhaps most importantly, is the limitations of sample selection. Although this paper selects 20 environmental protection enterprises as samples, they are all limited to Chinese enterprises, which may have the effect of a specific country, and they limit the universality of the application of research conclusions. Therefore, although this study obtains some interesting rules through these samples, it will be better to conduct more case studies in other countries. In this way, more information can be obtained to see if the conclusions of this paper are applicable to similar enterprises in other countries. Another limitation is that the environmental impact of innovation-driven development performance is reflected in multiple aspects. This study is discussed from the perspective of the application value of the PPP mode, but there may be other important environmental factors. Further exploration of more complete and specific environmental impact analyses will be the focus of in-depth research in the future.
Despite these limitations, we believe that we highlight an interesting and understudied topic in the existing literature on innovation-driven development performance measures. It is believed that the findings can help improve the innovation-driven development performance of large-scale environmental protection enterprises investing in PPP projects. Next, it would be interesting to extend this research to samples from other countries and expand environmental variables in the future to see if similar conclusions can be reached.

Author Contributions

Conceptualization, N.W. and J.F.; methodology, N.W., J.F. and G.S.; software, J.F.; formal analysis, N.W. and G.S.; investigation, J.F. and N.W.; writing—original draft preparation, J.F.; writing—review and editing, J.F., N.W. and G.S. All authors have read and agreed to the published version of the manuscript.

Funding

This research was funded by the National Natural Science Foundation of China (Grant Nos. 62141302), the China Postdoctoral Science Foundation (Grant Nos. 2019M662265), and Socio-economic Development Research Project of Liaoning Provience (Grant Nos. 2022lslybkt-053).

Institutional Review Board Statement

Not applicable.

Informed Consent Statement

Not applicable.

Data Availability Statement

The data presented in this study are openly available in the Sina Finance and Economics.

Acknowledgments

We thank the editor and reviewers for their careful review and insightful comments.

Conflicts of Interest

The authors declare no conflict of interest.

References

  1. Santolaria, M.; Oliver-Sola, J.; Gasol, C.M.; Morales-Pinzón, T.; Rieradevall, J. Eco-design in innovation driven companies: Perception, predictions and the main drivers of integration. The Spanish example. J. Clean. Prod. 2011, 19, 1315–1323. [Google Scholar] [CrossRef]
  2. Sun, Y.N.; Wang, X.C.; Liu, Y. The Internal logic and practical orientation of adhering to innovation-driven development in the new era. J. Manag. 2019, 32, 1–8. (In Chinese) [Google Scholar]
  3. Sempere-Ripoll, F.; Estelles-Miguel, S.; Rojas-Alvarado, R.; Hervas-Oliver, J.L. Does technological innovation drive corporate sustainability? Empirical evidence for the european financial industry in catching-up and central and eastern europe countries. Sustainability 2020, 12, 2261. [Google Scholar] [CrossRef] [Green Version]
  4. Barbulescu, O.; Nicolau, C.; Munteanu, D. Within the entrepreneurship ecosystem: Is innovation clusters’ strategic approach boosting businesses’ sustainable development? Sustainability 2021, 13, 11762. [Google Scholar] [CrossRef]
  5. Jia, K.; Ou, C.Z. Innovative mechanism of PPP mode in promoting efficiency and upgrading of public investment: From the perspective of multiple objectives, negative externalities and Government scale. J. Financ. Account. 2020, 20, 3–8. (In Chinese) [Google Scholar]
  6. Antonelli, C. Innovation as a creative response a reappraisal of the schumpeterian legacy. Hist. Econ. Ideas 2015, 23, 99–118. [Google Scholar]
  7. Andries, P.; Stephan, U. Environmental Innovation and Firm Performance: How Firm Size and Motives Matter. Sustainability 2019, 11, 3585. [Google Scholar] [CrossRef] [Green Version]
  8. Li, Z.; Zhou, X.Z.; Jung, S. China’s 40-year road to innovation. Chin. Manag. Stud. 2019, 14, 335–357. [Google Scholar] [CrossRef]
  9. Brogaard, L. Innovative outcomes in public-private innovation partnerships: A systematic review of empirical evidence and current challenges. Public Manag. Rev. 2021, 23, 135–157. [Google Scholar] [CrossRef]
  10. Lember, V.; Petersen, O.H.; Scherrer, W. Understanding the relationship between infrastructure public-private partnerships and innovation. Ann. Public Coop. Econ. 2019, 90, 371–391. [Google Scholar] [CrossRef]
  11. Hermans, F.; Geerling-Eiff, F.; Potters, J. Public-private partnerships as systemic agricultural innovation policy instruments-Assessing their contribution to innovation system function dynamics. NJAS-Wagening J. Life Sci. 2019, 88, 76–95. [Google Scholar] [CrossRef]
  12. Ferraris, A.; Santoro, G.; Papa, A. The cities of the future: Hybrid alliances for open innovation Check tor projects. Futures 2018, 103, 51–60. [Google Scholar] [CrossRef]
  13. Davies, A.; Salter, A. The great experiment: Public–private partnerships and innovation in design, production, and operation of capital goods in the UK. In Flexibility and Stability in the Innovating Economy; McKelvey, M.H.M., Ed.; Oxford University Press: Oxford, UK, 2006; pp. 73–95. [Google Scholar]
  14. Rangel, T.; Galende, J. Innovation inpublic-private partnerships(PPPs): The Spanish case of highway concessions. Public Money Manag. 2010, 30, 49–54. [Google Scholar] [CrossRef] [Green Version]
  15. Callens, C.; Verhoest, K.; Boon, J. Combined effects of procurement and collaboration on innovation in public-private-partnerships: A qualitative comparative analysis of 24 infrastructure projects. Public Manag. Rev. 2021. [Google Scholar] [CrossRef]
  16. Akintoye, A.; Hardcastle, C.; Beck, M.; Chinyio, E.; Asenova, D. Achieving best value inprivate finance initiative project procurement. Constr. Manag. Econ. 2003, 21, 461–470. [Google Scholar] [CrossRef]
  17. Shahbaz, M.; Raghutla, C.; Song, M.; Zameer, H.; Jiao, Z. Public-private partnerships investment in energy as new determinant of CO2 emissions: The role of technological innovations in China. Energy Econ. 2020, 86, 104664. [Google Scholar] [CrossRef] [Green Version]
  18. Khan, Z.; Ali, M.; Kirikkaleli, D. The impact of technological innovation and public-private partnership investment on sustainable environment in China: Consumption-based carbon emissions analysis. Sustain. Dev. 2020, 28, 1317–1330. [Google Scholar] [CrossRef]
  19. Li, C.L.; Memon, J.A.; Thanh, T.L. The Impact of Public-Private Partnership Investment in Energy and Technological Innovation on Ecological Footprint: The Case of Pakistan. Sustainability 2021, 13, 10085. [Google Scholar]
  20. Adebayo, T.S.; Genc, S.Y.; Castanho, R.A.; Kirikkaleli, D. Do Public-Private Partnership Investment in Energy and Technological Innovation Matter for Environmental Sustainability in the East Asia and Pacific Region? An Application of a Frequency Domain Causality Test. Sustainability 2021, 13, 3039. [Google Scholar] [CrossRef]
  21. Cheah, S.L.Y.; Yoneyama, S.; Ho, Y.P. Performance management of public-private collaboration in innovation. Creat. Innov. Manag. 2019, 28, 563–574. [Google Scholar] [CrossRef]
  22. Odei, S.A.; Stejskal, J.; Prokop, V. Revisiting the Factors Driving Firms’ Innovation Performances: The Case of Visegrad Countries. J. Knowl. Econ. 2021, 12, 1331–1344. [Google Scholar] [CrossRef]
  23. Awan, U.; Nauman, S.; Sroufe, R. Exploring the effect of buyer engagement on green product innovation: Empirical evidence from manufacturers. Bus. Strategy Environ. 2021, 30, 463–477. [Google Scholar] [CrossRef]
  24. Vrontis, D.; Basile, G.; Andreano, M.S. The profile of innovation driven Italian SMEs and the relationship between the firms’ networking abilities and dynamic capabilities. J. Bus. Res. 2020, 114, 313–324. [Google Scholar] [CrossRef]
  25. Xu, S.; Yue, Q.D.; Lu, B.B. Grey correlation analysis on the synergistic development between innovation-driven strategy and marine industrial agglomeration: Based on China’s coastal provinces. Grey Syst.-Theory Appl. 2022, 12, 269–289. [Google Scholar] [CrossRef]
  26. Zhang, S.J. Looking to the future: Innovation-driven green development. Green Energy Environ. 2017, 2, 1–2. [Google Scholar] [CrossRef]
  27. He, X.; Huang, S.Z.; Chau, K.Y.; Shen, H.W.; Zhu, Y.L. A study on the effect of environmental regulation on green innovation performance: A case of green manufacturing enterprises in Pearl River Delta in China. EKOLOJI 2019, 28, 727–736. [Google Scholar]
  28. Li, X.W.; Long, H.Y. Research Focus, Frontier and knowledge base of green technology in china: Metrological research based on mapping knowledge domains. Pol. J. Environ. Stud. 2020, 29, 3003–3011. [Google Scholar] [CrossRef]
  29. Li, W.; Wang, J.; Chen, R.; Xi, Y.; Liu, S.Q.; Wu, F.; Masoud, M.; Wu, X. Innovation-driven industrial green development: The moderating role of regional factors. J. Clean. Prod. 2019, 222, 344–354. [Google Scholar] [CrossRef]
  30. Yang, Y.; Wang, Y. Research on the impact of environmental regulations on the green innovation efficiency of chinese industrial enterprises. Pol. J. Environ. Stud. 2021, 30, 1433–1445. [Google Scholar] [CrossRef]
  31. Wang, W.; Zhou, L.; Chen, W.; Wu, C. Research on the coordination characteristics and interaction between the innovation-driven development and green development of the Yangtze River Economic Belt in China. Environ. Sci. Pollut. Res. 2022, 29, 22952–22969. [Google Scholar] [CrossRef]
  32. Shin, J.; Kim, C.; Yang, H. The effect of sustainability as innovation objectives on innovation efficiency. Sustainability 2018, 10, 1966. [Google Scholar] [CrossRef] [Green Version]
  33. Bai, J.H.; Li, J. Regional innovation efficiency in China: The role of local government. Innov.-Organ. Manag. 2011, 13, 142–153. [Google Scholar] [CrossRef]
  34. Park, J.H. Open innovation of small and medium-sized enterprises and innovation efficiency. Asian J. Technol. Innov. 2018, 26, 115–145. [Google Scholar] [CrossRef]
  35. Fan, F.; Lian, H.; Wang, S. Can regional collaborative innovation improve innovation efficiency? An empirical study of Chinese cities. Growth Chang. 2020, 51, 440–463. [Google Scholar] [CrossRef]
  36. Yuan, B.L. Effectiveness-based innovation or efficiency-based innovation? Trade-off and antecedents under the goal of ecological total-factor energy efficiency in China. Environ. Sci. Pollut. Res. 2019, 26, 17333–17350. [Google Scholar] [CrossRef]
  37. Luo, X.; Zhang, W.Y. Green innovation efficiency: A threshold effect of research and development. Clean Technol. Environ. Policy 2021, 23, 285–298. [Google Scholar] [CrossRef]
  38. Zhang, Y.; Wang, S.H. Influence of marine industrial agglomeration and environmental regulation on marine innovation efficiency-From an innovation value chain perspective. Mar. Policy 2021, 134, 104807. [Google Scholar] [CrossRef]
  39. Shi, X.; Wu, Y.R.; Fu, D.H. Does University-Industry collaboration improve innovation efficiency? Evidence from Chinese Firms. Econ. Model. 2020, 86, 39–53. [Google Scholar] [CrossRef]
  40. Zhao, N.; Liu, X.J.; Pan, C.F. The performance of green innovation: From an efficiency perspective. Socio-Econ. Plan. Sci. 2021, 78, 101062. [Google Scholar] [CrossRef]
  41. Hernandez-Vivanco, A.; Cruz-Cazares, C.; Bernardo, M. Openness and management systems integration: Pursuing innovation benefits. J. Eng. Technol. Manag. 2018, 49, 76–90. [Google Scholar] [CrossRef]
  42. Long, X.L.; Sun, C.W.; Wu, C. Green innovation efficiency across China’s 30 provinces: Estimate, comparison, and convergence. Mitig. Adapt. Strateg. Glob. Chang. 2020, 25, 1243–1260. [Google Scholar] [CrossRef]
  43. Charnes, A.; Cooper, W.; Rhodes, E. Measuring the efficiency of decision making units. Eur. J. Oper. Res. 1978, 2, 429–444. [Google Scholar] [CrossRef]
  44. Aigner, D.; Lovell, C.K.; Schmidt, P. Formulation and estimation of stochastic frontier production function models. J. Econom. 1977, 6, 21–37. [Google Scholar] [CrossRef]
  45. Banker, R.D.; Charnes, A.; Cooper, W.W. Some models for estimating technical and scale inefficiencies in data envelopment analysis. Manag. Sci. 1984, 30, 1078–1092. [Google Scholar] [CrossRef] [Green Version]
  46. Chen, C.J.; Wu, H.L.; Lin, B.W. Evaluating the development of high-tech industries: Tai wan’s science park. Technol. Cast. Soc. Chang. 2006, 73, 452–465. [Google Scholar]
  47. Fried, H.O.; Lovell, C.A.K.; Schmidt, S.S.; Yaisawarng, S. Accounting for environmental effects and statistical noise in data envelopment analysis. J. Product. Anal. 2002, 17, 157–174. [Google Scholar] [CrossRef]
  48. Liang, N.; Yao, C.Q.; Gao, Y.F. Innovation efficiency evaluation of listed enterprises in the environmental protection industry based on dea method. Sci. Technol. Manag. Res. 2019, 39, 45–50. (In Chinese) [Google Scholar]
  49. Sun, H.M.; Zhu, W.Q. The Synergistic Effect of Innovation Investment Output and Efficiency on Environmental Protection Industry. Shanghai Econmic Rev. 2015, 11, 20–27. (In Chinese) [Google Scholar] [CrossRef]
  50. Tsai, B.H. Exploring the influence of enterprise resource planning (ERP) implementation on corporate performance using a modified data envelopment analysis (DEA) approach. Afr. J. Bus. Manag. 2011, 5, 5435–5448. [Google Scholar]
  51. Frank, A.G.; Benitez, G.B.; Lima, M.F. Effects of open innovation breadth on industrial innovation input-output relationships. Eur. J. Innov. Manag. 2021. [Google Scholar] [CrossRef]
  52. Sajid, M.J.; Gonzalez, E.D.S. The role of labor and capital in sectoral CO2 emissions and linkages: The case of China, India and the USA. Ecol. Indic. 2021, 131, 108241. [Google Scholar] [CrossRef]
  53. Chen, K.H.; Kou, M.T.; Fu, X.L. Evaluation of multi-period regional R&D efficiency: An application of dynamic DEA to China’s regional R&D systems. Omega-Int. J. Manag. Sci. 2018, 74, 103–114. [Google Scholar]
  54. Dobrzanski, P.; Bobowski, S. The Efficiency of R&D Expenditures in ASEAN Countries. Sustainability 2020, 12, 2686. [Google Scholar]
  55. Wang, L.C.; Tsai, H.Y. Evaluation of highway maintenance performance using data envelopment analysis (dea) in taiwan. J. Mar. Sci. Technol. -Taiwan 2009, 17, 145–155. [Google Scholar] [CrossRef]
  56. Kumar, S.; Dhingra, A.K.; Singh, B. Application of lean- kaizen concept for improving quality system of manufacturing firms. Int. J. Ind. Eng. -Theory Appl. Pract. 2021, 28, 563–576. [Google Scholar]
  57. Wang, E.C.; Huang, W.C. Relative efficiency of R & D activities: A cross-country study accounting for environmental factors in the DEA approach. Res. Policy 2007, 36, 260–273. [Google Scholar]
  58. Shiraz, R.K.; Hatami-Marbini, A.; Emrouznejad, A. Chance-constrained cost efficiency in data envelopment analysis model with random inputs and outputs. Oper. Res. 2020, 20, 1863–1898. [Google Scholar] [CrossRef] [Green Version]
  59. Zhang, Q.; Feng, R.T.; Yu., X. The ratio of patent granted, technology innovation and economic performance—an empirical test of patent contract theory. Soft Sci. 2013, 27, 9–13. (In Chinese) [Google Scholar]
  60. Dobrzanski, P. Innovation expenditures efficiency in central and eastern european countries. Zb. Rad. Ekon. Fak. U Rijeci-Proc. Rij. Fac. Econ. 2018, 36, 827–859. [Google Scholar]
  61. Bin, X. Evaluation of capital input and output efficiency of China’s ai enterprises based on DEA model. J. Intell. Fuzzy Syst. 2020, 38, 7033–7040. [Google Scholar] [CrossRef]
  62. Khan, I.U.; Karam, F.W. Intelligent business analytics using proposed input/output oriented data envelopment analysis DEA and slack based DEA models for US-airlines. J. Intell. Fuzzy Syst. 2019, 37, 8207–8217. [Google Scholar] [CrossRef]
  63. Wang, C.N.; Luu, Q.C.; Nguyen, T.K.L.; Day, J.D. Assessing bank performance using dynamic SBM model. Mathematics 2019, 7, 73. [Google Scholar] [CrossRef] [Green Version]
  64. Mansilla, P.; Vassallo, J.M. Innovative Infrastructure Fund to Ensure the Financial Sustainability of PPP Projects: The Case of Chile. Sustainability 2020, 12, 9965. [Google Scholar] [CrossRef]
  65. van den Hurk, M.; Hueskes, M. Beyond the financial logic: Realizing valuable outcomes in public-private partnerships in Flanders and Ontario. Environ. Plan. C-Politics Space 2017, 35, 784–808. [Google Scholar] [CrossRef]
  66. Caldwell, N.D.; Roehrich, J.K.; George, G. Social value creation and relational coordination in public-private collaborations. J. Manag. Stud. 2017, 54, 906–928. [Google Scholar] [CrossRef]
Figure 1. The basic framework of the system.
Sustainability 14 05096 g001
Figure 2. The theoretical framework of measure of innovation efficiency.
Sustainability 14 05096 g002
Figure 3. Spatial change of innovation-driven development performance of the environmental protection industry after adjustment.
Sustainability 14 05096 g003
Figure 4. Comparison of innovation efficiency before and after adjustment.
Sustainability 14 05096 g004
Table 1. Evaluation index system of innovation efficiency.
Investment
Category
VariablesDescription of
Variables
Unit
InputAllocation of financeR&D fundsCNY
Allocation of manpowerR&D manpowerPerson
Quantity of capitalOperation costCNY
OutputTotal output valueMain business incomeCNY
Economic benefitNet profitCNY
Intellectual propertyPatentsNumber
Environment VariablesEconomic valueCurrent liabilitiesCNY
Social valueEmployed employeesPerson
Table 2. Efficiency value and its decomposition before adjustment.
nDMUTEPESEReturns to Scale
1Daqian0.4300.5130.839Drs *
2CSD0.5690.6560.867drs
3Haixia0.5580.6180.903drs
4Liantai1.0001.0001.000-
5Tianyu0.7510.8140.923drs
6Longma0.7291.0000.729drs
7BGE0.4820.9620.501drs
8Weiming0.9031.0000.903drs
9Shanghai0.4650.8080.576drs
10Tianjin1.0001.0001.000-
11Huaguang0.450.9610.468drs
12Grandblue0.4530.8230.551drs
13Yuanda0.3810.6650.572drs
14Beijing1.0001.0001.000-
15Lvyin1.0001.0001.000-
16Lingnan0.4100.8150.503drs
17Dongjiang0.5821.0000.582drs
18Wangneng0.8600.9760.882drs
19Infore0.4801.0000.48drs
20CPEP0.5520.6900.800drs
* Drs stands for diminishing returns to scale.
Table 3. Calculation results of the stochastic frontier analysis (SFA).
VariablesInput Relaxation of Operation CostInput Slacks of R&D FundsInput Slacks of R&D
Manpower
CoefficientStandard-Error CoefficientStandard-Error CoefficientStandard-Error
Beta(constant)−1.1 × 10⁻⁴ ***1.00−3.0 × 10⁷ ***1.004.0 × 10 ***1.00
Economic value5.3 × 10−7 ***1.001.5 × 105 ***3.001.6 × 10−1 ***1.2 × 10⁻¹
Social value−1.1 × 10⁻⁹ ***1.00−5.5 × 10² ***2.0×10²−4.2 × 10⁻⁵ ***1.2 × 10⁻³
σ22.6 × 10⁻⁸ ***2.5 × 10¹⁵ ***1.2 × 10⁴ ***
γ9.3 × 10⁻¹ **1.00 ***1.00 ***
Log1.6 × 102−3.7 × 10²−1.1 × 10²
LR7.3 ***9.6 ***9.3 ***
**, *** is significant at the levels of 5% and 1%, respectively.
Table 4. The adjusted performance value and decomposition of innovation-driven development of the environmental protection industry from 2018 to 2020.
YearTEPESE
20180.6330.7780.781
20190.7100.8050.857
20200.6260.8440.741
Table 5. The adjusted time series change of innovation-driven development performance of the environmental protection industry from 2018 to 2020.
DMU2018 TE2019 TE2020 TE2018 PE2019 PE2020 PE2018 SE2019 SE2020 SE
Daqian1.0000.8241.0001.0000.8451.0001.0000.9761.000
CSD0.0200.3060.1080.4430.5920.1420.0460.5160.757
Haixia0.8820.7561.0001.0000.8681.0000.8820.8701.000
Liantai1.0001.0001.0001.0001.0001.0001.0001.0001.000
Tianyu0.3511.0000.3370.3751.0000.4390.9351.0000.768
Longma0.5000.2490.2580.5090.2581.0000.9820.9630.258
BGE0.3490.2710.3610.3700.3501.0000.9440.7740.361
Weiming0.2561.0001.0000.3461.0001.0000.741.0001.000
Shanghai0.6900.7420.3250.7311.0001.0000.9440.7420.325
Tianjin1.0001.0001.0001.0001.0001.0001.0001.0001.000
Huaguang0.5050.7161.0000.5971.0001.00000.8450.7161.000
Grandblue1.0000.1770.9581.0000.4760.9311.0000.3721.028
Yuanda0.9330.3730.1791.0000.6620.2400.9330.5630.747
Beijing1.0001.0001.0001.0001.0001.0001.0001.0001.000
Lvyin0.6500.5560.4091.0000.6001.0000.6500.9260.409
Lingnan1.0001.0000.2471.0001.0000.3331.0001.0000.74
Dongjiang0.1770.3920.3630.4920.4540.7850.3590.8630.463
Wangneng0.3261.0000.4241.0001.0001.0000.3261.0000.424
Infore1.0000.8481.0001.0001.0001.0001.0000.8481.000
CPEP0.0281.0000.5480.7031.0001.0000.0391.0000.548
Table 6. Efficiency value and its decomposition after adjustment.
nDMUTEPESEReturns to Scale
1Daqian0.5510.8750.630irs
2CSD0.7580.8770.864irs
3Haixia0.670.9510.705irs
4Liantai1.0001.0001.000-
5Tianyu0.7670.9750.787irs
6Longma1.0001.0001.000-
7BGE0.9650.9651.000-
8Weiming1.0001.0001.000-
9Shanghai0.8370.9040.926irs
10Tianjin1.0001.0001.000-
11Huaguang0.9690.9710.999irs
12Grandblue0.8420.8840.953irs
13Yuanda0.6800.8310.818irs
14Beijing0.9281.0000.928irs
15Lvyin1.0001.0001.000-
16Lingnan0.8170.8180.999irs
17Dongjiang0.9401.0000.94drs *
18Wangneng0.9780.9930.985irs **
19Infore1.0001.0001.000-
20CPEP0.7120.8790.810irs
* drs stands for diminishing returns to scale. ** irs stands for increasing returns to scale.
Table 7. Analysis of diminishing returns to scale.
ClassEnterprise Scale is Too LargeOptimal Scale of
Enterprise
A State of Easy
Improvement
A State of Technical InefficiencyEnterprise Scale is Too Small
Measuring StandardSE ≤ 0.9
(decreasing returns to scale)
TE = SE = 10.9 < SE ≤ 1
PE > 0.9
0.9 < SE ≤ 1
PE < 0.9
SE ≤ 0.9
(increasing returns to scale)
Number of The Enterprise16625
Sample Enterprise174, 6, 8, 10, 15, 197, 9, 11, 14, 17, 1812, 161, 2, 3, 13, 20
Publisher’s Note: MDPI stays neutral with regard to jurisdictional claims in published maps and institutional affiliations.

