Article

Development of a Rapid Inspection Driving Cycle for Battery Electric Vehicles Based on Operational Safety

School of Automobile, Chang’an University, Xi’an 710064, China
*
Author to whom correspondence should be addressed.
Sustainability 2022, 14(9), 5079; https://doi.org/10.3390/su14095079
Submission received: 23 March 2022 / Revised: 17 April 2022 / Accepted: 18 April 2022 / Published: 23 April 2022
(This article belongs to the Special Issue Intelligent Technologies in Energy Management of New Energy Vehicle)

Abstract

:
The aim of this paper is to solve the problem for battery electric vehicles of low-precision and time-consuming inspection. A novel method of driving cycle development for battery electric vehicles’ operational safety is proposed in this paper. First, three inspection items are proposed based on relevant testing standards. The inspection calculation method of operational safety is developed based on the acceleration changing rate. Then the multi-cycle inspection method with the stable pedal mode is developed, and the Gauss filtering algorithm is applied for data preprocessing. A rapid inspection driving cycle construction method based on support vector machine is proposed, and a driving cycle is built with a total time of 204 s by fusing and splicing kinematic fragments. Finally, the proposed inspection calculation method is used to validate the operational safety inspection items by tracking the established rapid inspection driving cycle based on the test bench. The results shown are those that qualified the range of acceleration changing rate for driving stability [−0.35, −0.04]. The range for gliding smoothness is [0.05, 0.09]. The range for braking coordination is [−0.04, 0.095]. The maximum RMSE between the constructed rapid inspection segments is 9%, and the maximum RMSE between the tested driving segments is 6%. Test results meet design requirements. The thresholds for operational safety inspection items are evaluated based on the test results. We set less than 0.5 as the safety threshold for driving stability. During the experiment, gliding was less than 0.1 as the safety threshold for gliding comfort, and during braking it was less than 0.1 as the safety threshold for vehicle braking coordination.

1. Introduction

As one of the best approaches for environment failure and air pollution, the new energy vehicle industry has been highly valued and vigorously developed by various countries [1,2,3]. China’s reasonable number of new energy vehicles reached 5 million in 2020 and will reach 17 million in 2030. Therefore, the development of new energy vehicles is regarded as a national development strategy [4,5,6].
Currently, in the study of electric vehicle driving range, battery energy management and vehicle operational safety are increasing; the driving cycle is commonly used to inspect electric vehicle driving range, battery states estimation, and energy management [7,8,9]. Several researchers proposed various applicable transient driving cycles in specific areas or on specific vehicles [10]. For example. the US Federal Test Procedure (FTP)-75 tests the fuel economy of vehicles in highway driving [11]. Japan’s driving cycle is mainly used to certify vehicle emissions and fuel consumption [12]. Depending on the duration of the driving cycle in different regions, Berzi et al. [13] proposed an electric vehicle driving cycle for detecting energy consumption and efficiency evaluation based on the current traffic development in the city of Florence. Hung et al. [14] developed an optimal Hong Kong urban driving cycle using vehicle performance values, vehicle velocity, and acceleration distribution to test and evaluate vehicle emission, which was easy to follow and could be substituted for other cycles. Zhao et al. [15,16] proposed a representative system construction method for urban driving cycle for battery electric vehicles in a case study in Xi’an city, which compared the driving range and energy consumption under different driving cycles, and the results showed that this driving cycle can effectively reduce energy consumption. In addition, other researchers have proposed different methods for the construction of the actual driving cycle. For example, Shi et al. [17] chose typical road driving cycles in Hefei, China, and defined 12 characteristic parameters to evaluate the constructed cycle. Shi et al. [18] designed driving cycles in Changchun, China by Markov property and laid a theoretical foundation for designing driving cycles and ECO driving (Economical and Ecological). Jing et al. [19] used linear discriminant analysis to construct a driving cycle in Tianjin, China. A new methodology was offered for building driving cycles and referenced value to related research; Wang et al. [20] analyzed driving characteristics and developed the driving cycles in 11 typical Chinese cities including Beijing and Shanghai. In addition, they proposed some important factors that lead to the significant differences in vehicle driving patterns among the cities. Peng et al. [21] gathered 18 buses’ routes; constructed a cyclic condition in Fuzhou, China; and developed a 1227 s speed-time series. These driving cycles exhibited more dynamic driving characteristics and could more accurately verify the energy consumption, power battery health status, and driving range of electric vehicles. The actual driving cycle is generally divided into four different kinematic fragments, including idling, accelerating, cruising, and decelerating [22]. The driving cycle velocity varies with the time changing and can only represent transient conditions in a special area and a specifically measured single sequence of defined length [23,24]. Therefore, the electric vehicle cannot follow the driving cycle and it cannot detect the safety hazards of the electric vehicle.
In response to the problem that transient driving cycles cannot be realistically followed, most of the official recognized electric vehicle range cycle testing in China uses the New European Driving Cycle (NEDC) [25]. Vehicle Mass Analysis System (VMAS) is commonly used for testing pollutant emissions, fuel consumption, and vehicle certification of fuel-powered passenger cars [26,27]. These characteristics of two driving cycles are because of a modal cycle consisting of a series of speed-time data, which are followed in the chassis dynamometer when testing the vehicle, usually for less than 30 min. Both the area-specific transient driving cycles and the official standard driving cycles have the following disadvantages.
(1)
Long cycle times. For example, the total durations of the NEDC, World Light Vehicle Test Cycle (WLTC), and China Light-Duty Vehicle Test Cycle-Passenger (CLTC-P) are 1180 s, 1800 s, and 1800 s. In addition, the amount of data and the complex combinations are difficult to find in real life.
(2)
The driving cycle inspection items are single and cannot complete the practical operation test, especially the dynamic test of electric vehicle operational safety.
The test of other components of electric vehicles is mainly reflected in the diagnosis of power battery, such as high and fast battery temperatures, charging, and discharging [28]. Diagnosis of these components is mainly done by sensor detection of limited characteristic parameters for faults, however, simultaneous sensor faults can be diagnosed as battery faults [29,30].
In summary, much of the current research work on electric vehicles is focused on developing a standard driving cycle, testing the energy consumption of the vehicle, or detecting hidden dangers in key electric vehicle components. However, there is very little research into the operational safety testing of electric vehicles, and there is still a gap based on the driving cycle for the operational safety testing of electric vehicles.
The intention of this paper is to solve the above problems. A novel method of developing a driving cycle is proposed based on the rapid inspection of operational safety, which could detect whether the electric vehicle operational safety system is abnormal in a short time and ensures the safety of the vehicle driving. The main contributions of our work are as follows.
(1)
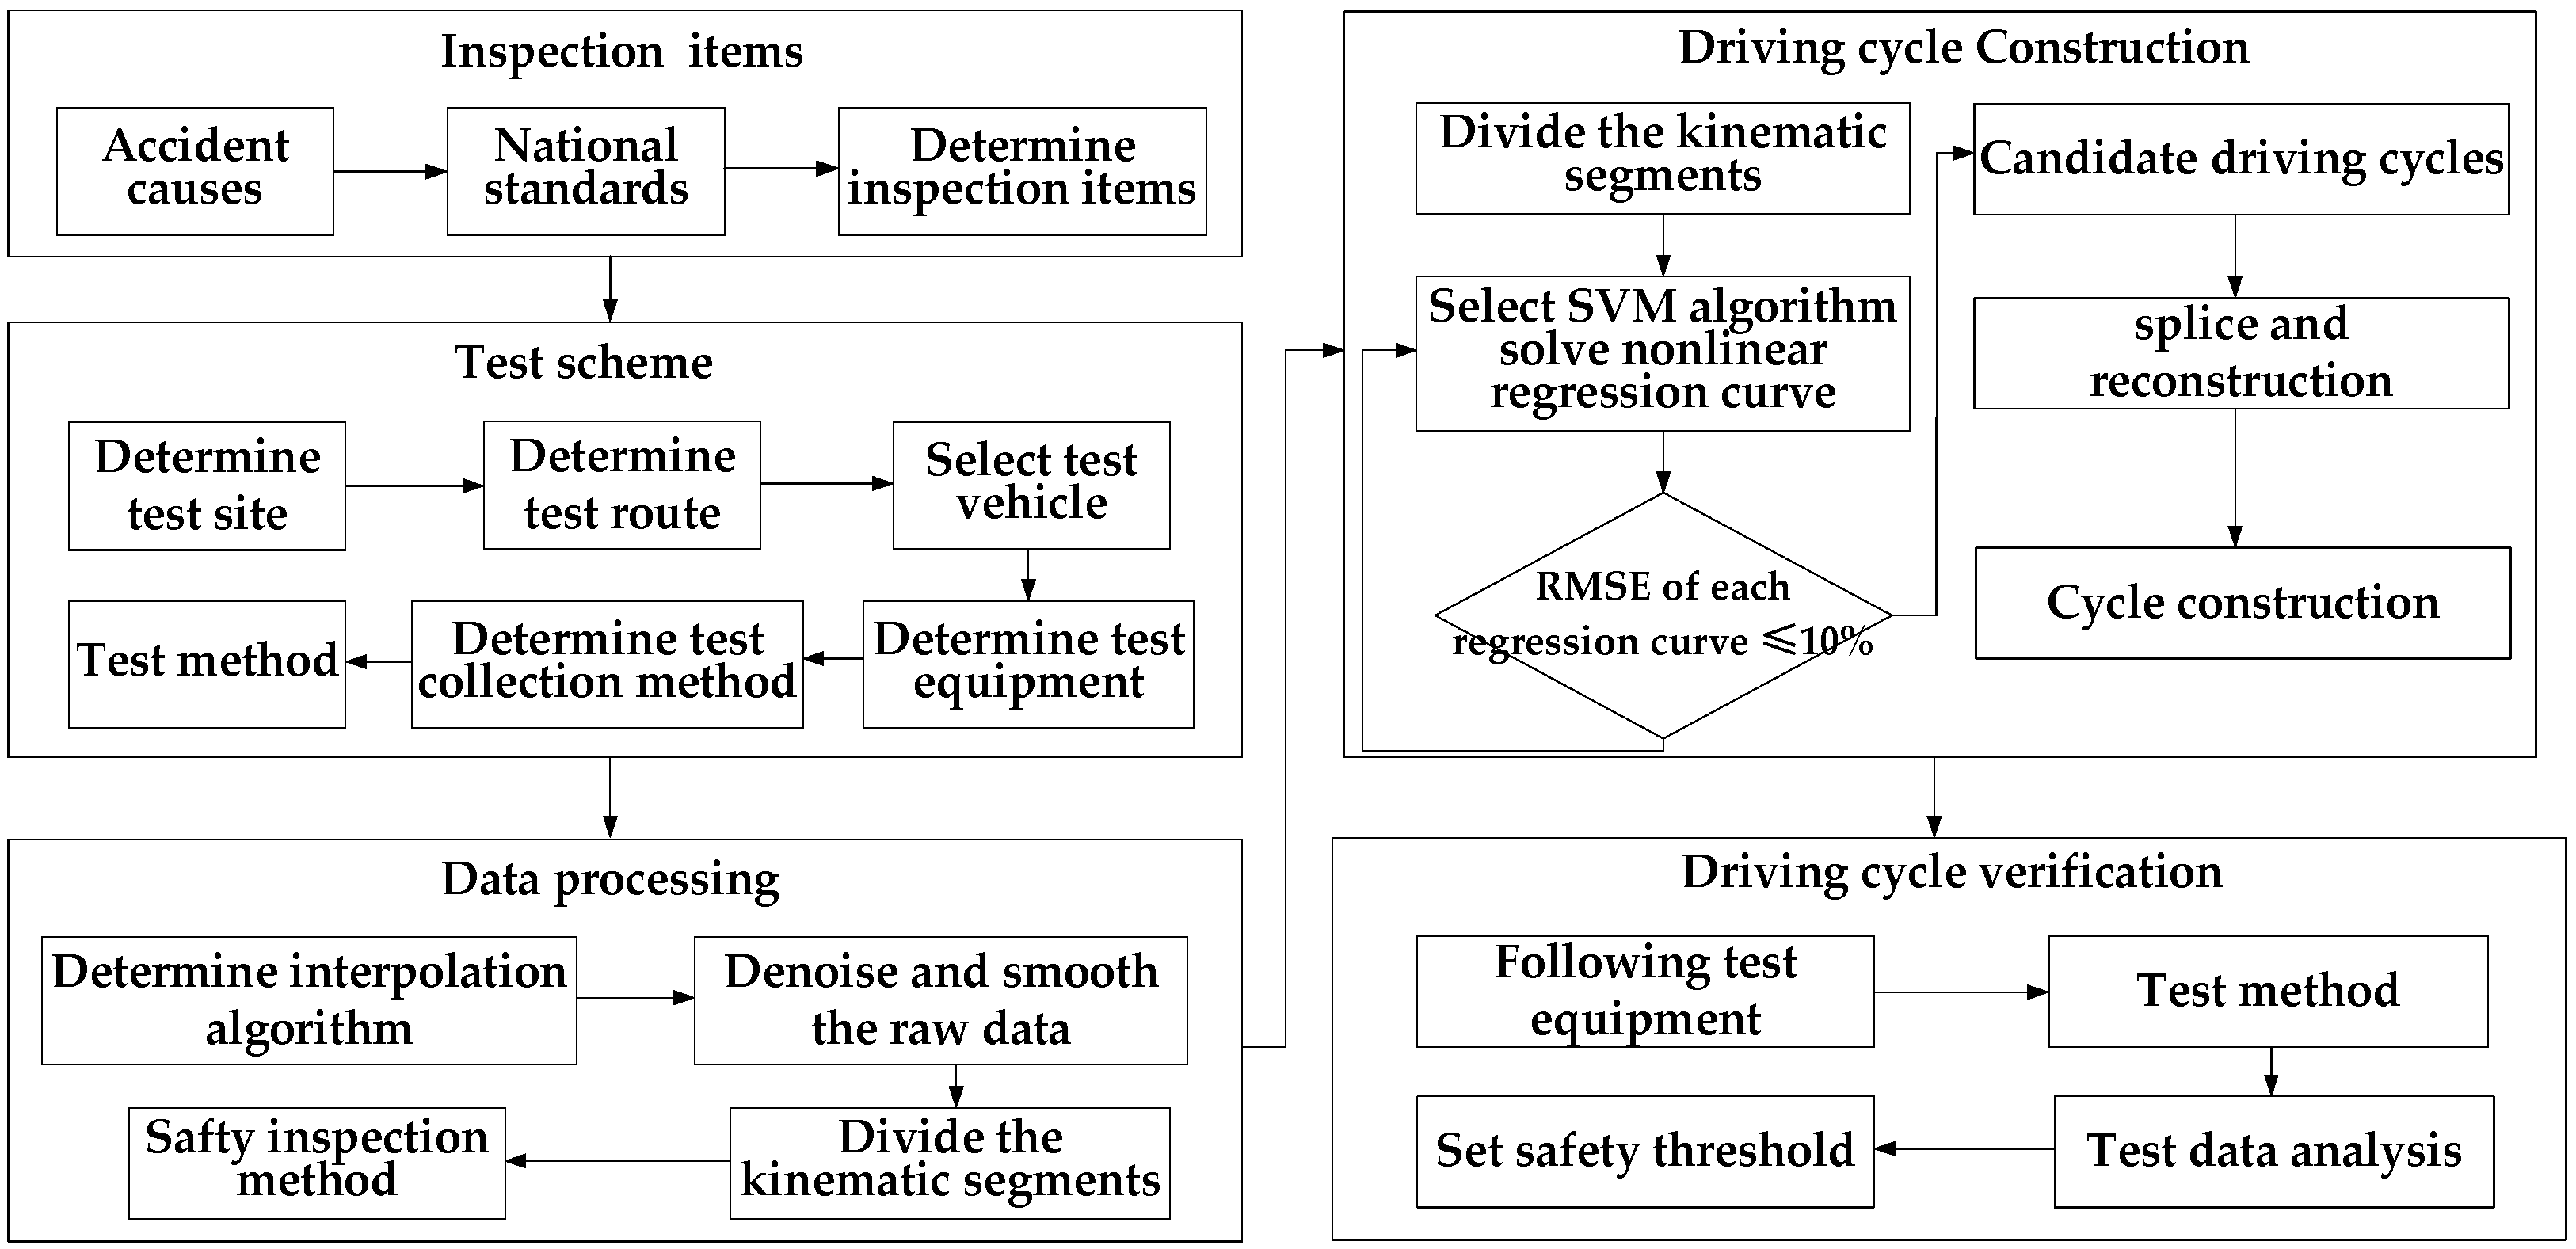
We innovatively propose three inspection items according to the operational safety of national standards. Meanwhile, an inspection calculation method of operational safety is developed based on the acceleration changing rate.
(2)
The multi-cycle inspection method with the stable pedal mode is developed and collects sufficient driving data by OBD. Gauss filtering algorithm is applied for data preprocessing. The support vector machine is adopted to construct the rapid inspection driving cycle.
(3)
Validation of the developed rapid driving cycle on the test bench. The thresholds for gliding safety, driving safety, and braking safety are evaluated based on the test results.
The methodology is illustrated in the form of a flow chart as shown in Figure 1. Compared to other driving cycles, this cycle focuses more on operational safety than on driving range and energy consumption, and could quickly detect operational safety hidden dangers for electric vehicles in a short time.

2. Electric Vehicle Inspection Items

In recent years, abnormal acceleration and braking failure of electric vehicles have frequently led to traffic accidents. The intervention of braking energy recovery strategy during the braking process has led to mutation in speed, which can easily cause accidents for the driver. Since 2005, China has distributed a series of standards for testing the operational safety performance of motor vehicles and electric vehicles. For example: GB21670-2008, GBT 12543-2009, GBT 18385-2005, GBT 35179-2017, and GB 38900-2020, which were strict testing standards for the acceleration performance and braking performance of the vehicles, as shown in Table 1.
According to the testing requirements of national standards on the safety of electric vehicles in this paper, gliding safety, driving safety, and braking safety were determined as the inspection items, respectively, which were directly related to operational safety. The main characteristics of the three inspection items are as follows:
Driving stability is an important indicator to evaluate driving safety during the driving of electric vehicles. If there is a large jitter in the acceleration of the vehicle within a short period, it will be very easy to cause a traffic accident, in addition to bringing a certain amount of discomfort to the driver and passengers. Therefore, driving stability is set as the inspection item in this paper. The indicator for gliding safety during the gliding is the gliding comfort. This is because if the vehicle jitters during the gliding process, it will lead to a slow or sharp down drop in velocity, which is very likely to cause traffic accidents. Therefore, gliding comfort is set as the inspection item. Braking coordination of electromechanical braking and regenerative braking is proposed as an important indicator to evaluate braking safety during the braking of an electric vehicle. When the coordination between electromechanical braking and regenerative braking is poor in the braking process, it will affect the braking performance. Therefore, the braking coordination is set as the inspection item.

3. Test Scheme

3.1. Test Site and Route Selection

The determination of the test route during the development of a conventional driving cycle requires the designation of an urban road in a certain area. However, the rapid inspection driving cycle is on a straight driving road to test in this paper. We do not need to consider road types, traffic flow, time periods, economic differences, and central business district. Therefore, the test route is chosen on the straight runway of the Chang’an University Internet of Vehicles and Intelligent Vehicles Test Field, in which the straight runway length is 1.1 km and the slope of the test route is 0°. So, there is no effect of vehicle slope resistance. The test site and route are shown in Figure 2.

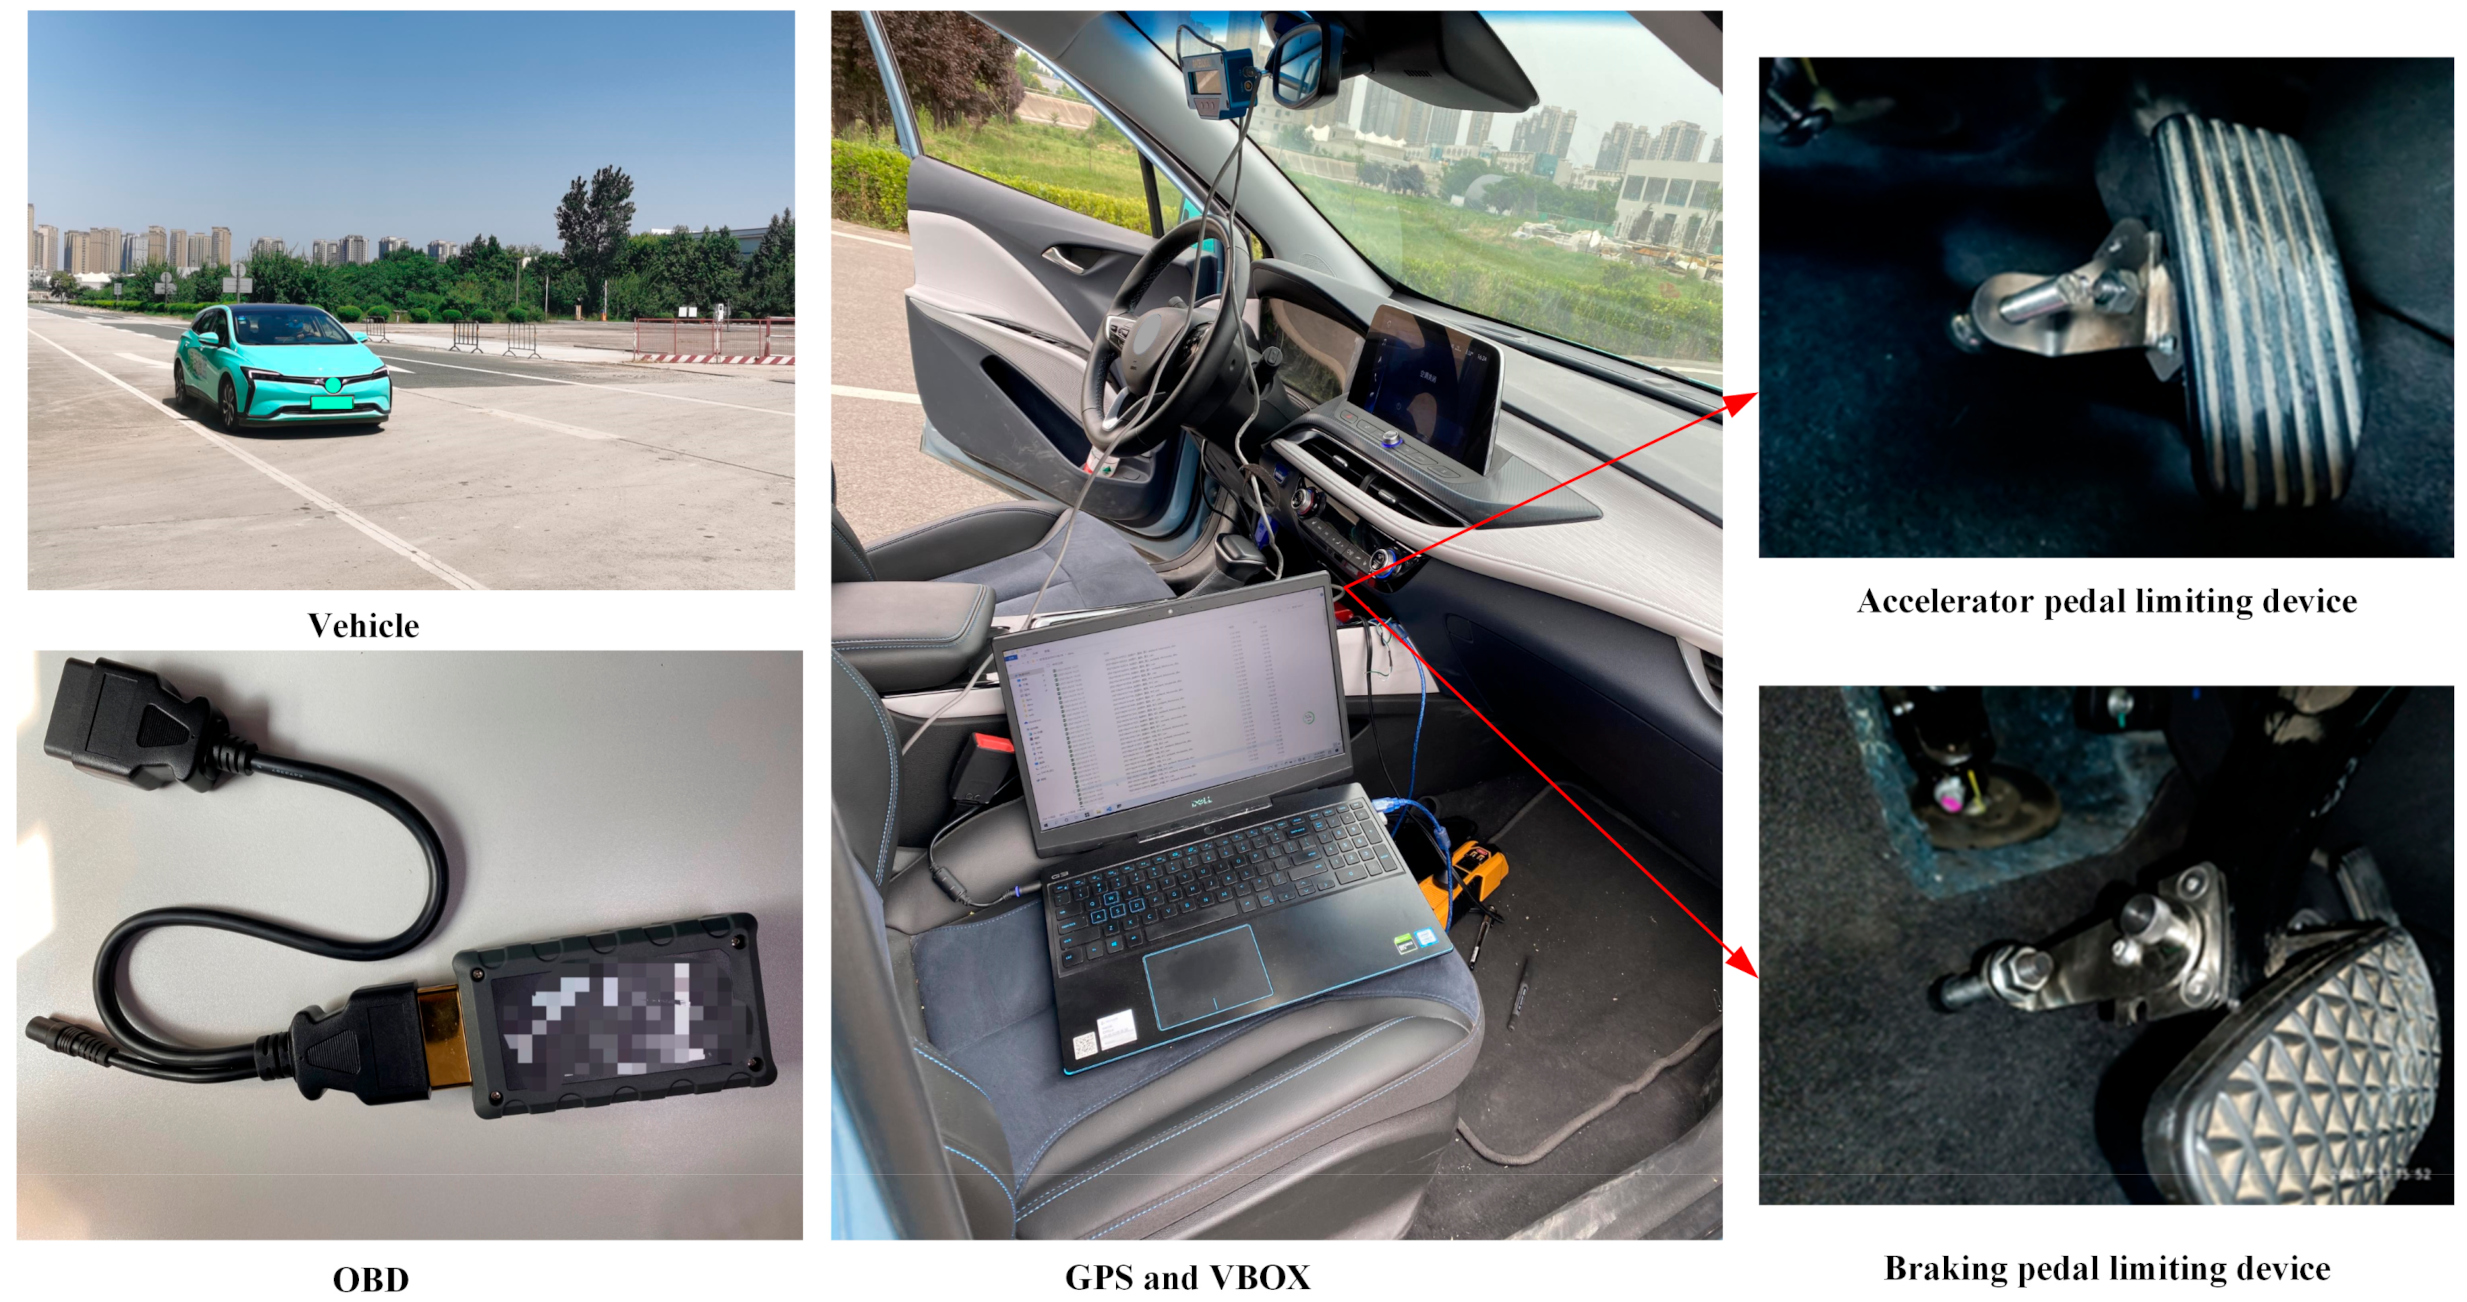
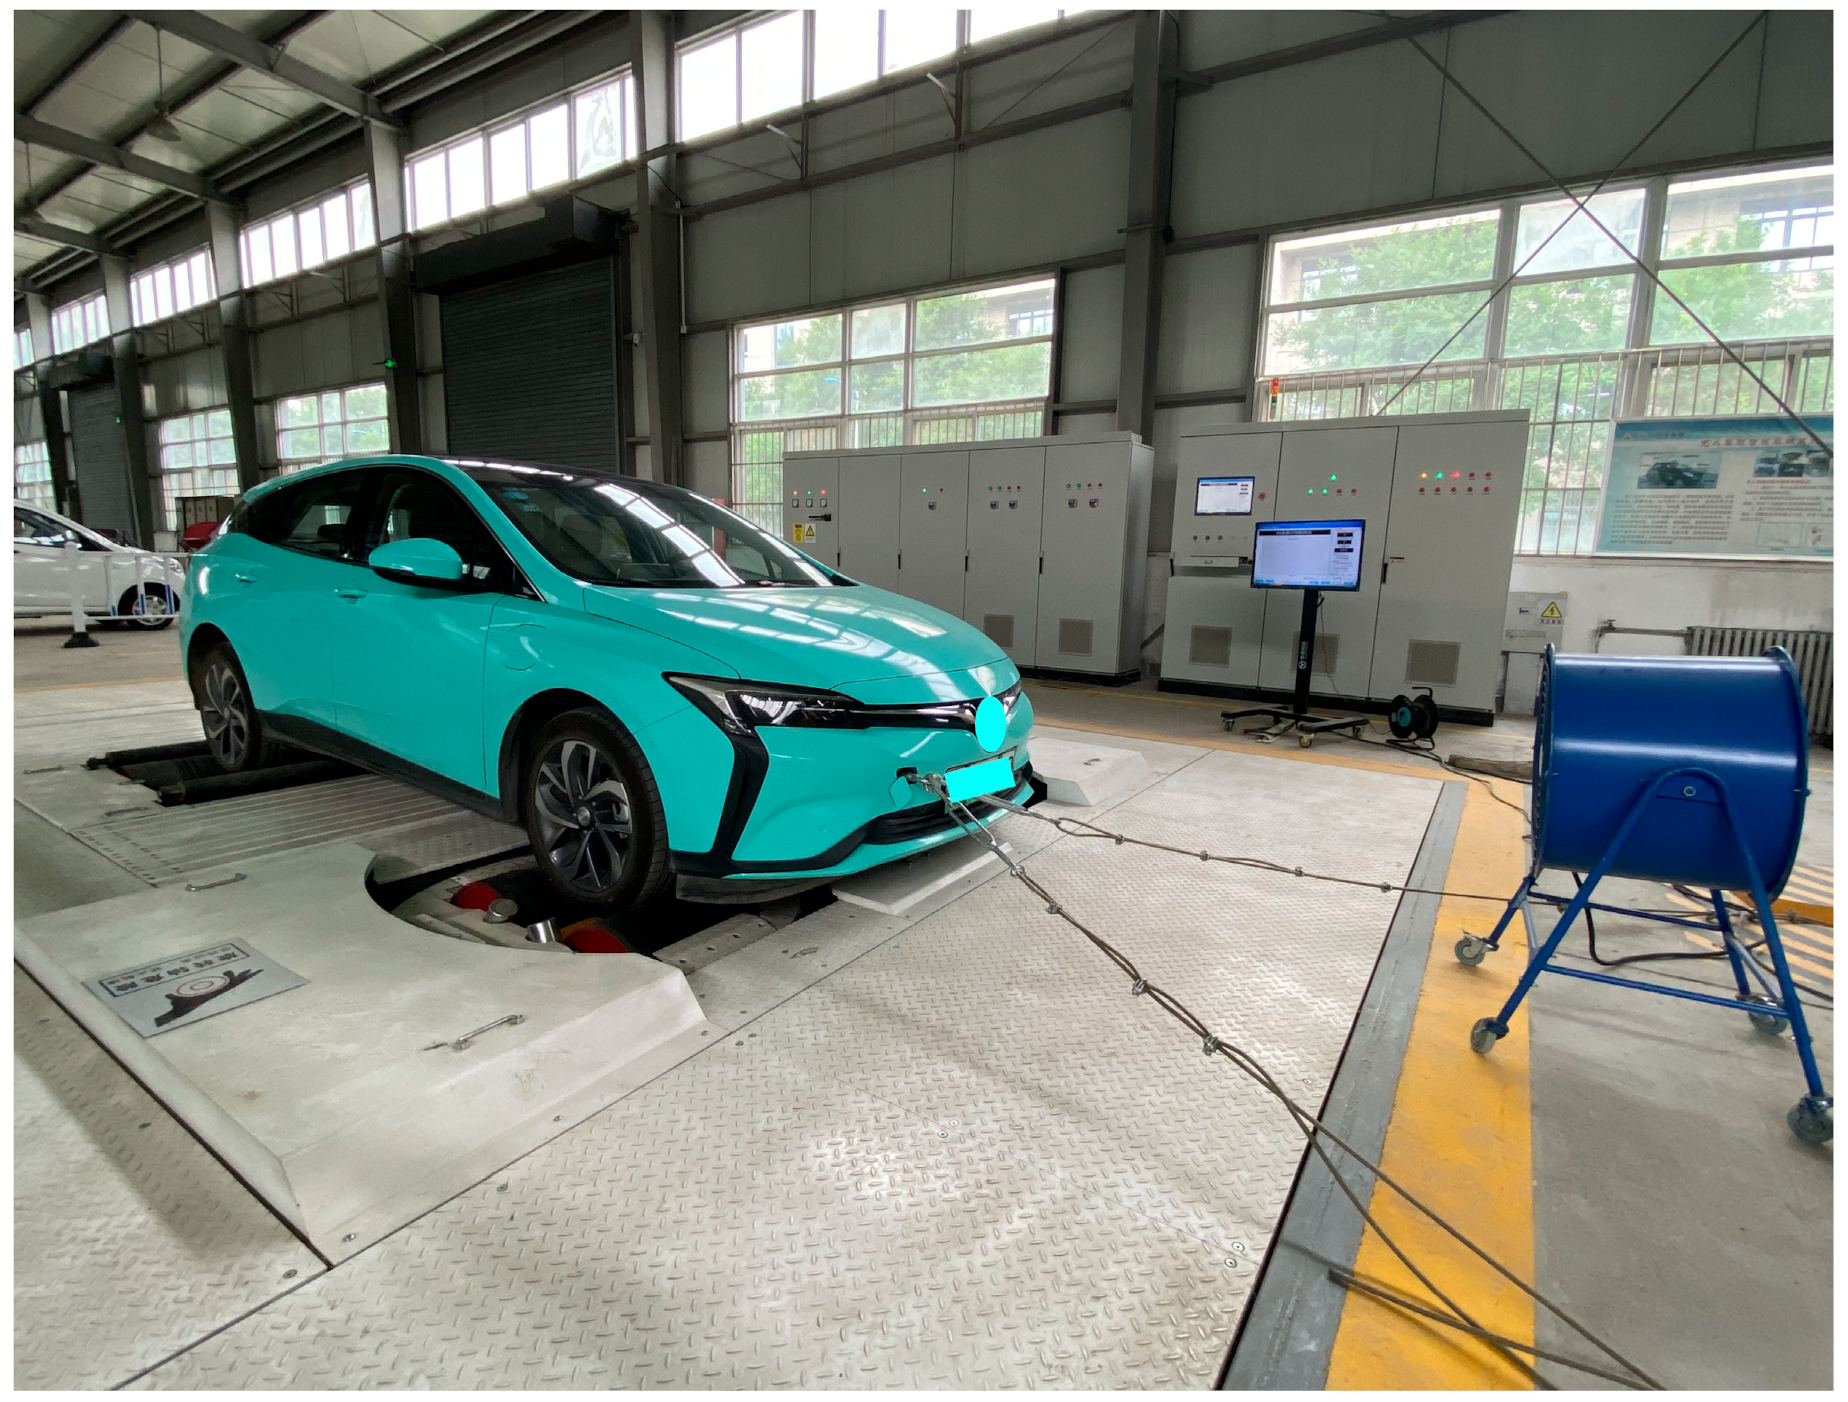
3.2. Data Collection and Test Method

We selected a battery electric vehicle as the test vehicle, which had more than 22,000 in the market and was a representative small family car among the battery electric vehicle in this paper. The technical parameters of the test vehicle are given in Table 2.
According to the NEDC, full section suburban cycle maximum acceleration was ≤1.5 m/s2, suburban cycle maximum deceleration was ≥−1.0 m/s2, urban cycle acceleration was ≥0.15 m/s2, and urban cycle deceleration was ≤−0.15 m/s2 [25]. So, the acceleration range of the acceleration segment was confirmed in [0.15 m/s2, 1.5 m/s2], the deceleration range of deceleration segment was [−1.5 m/s2, −0.15 m/s2], and the maximum speed was 65 km/h. To precisely determine the range of acceleration, a limit device was used to lock the accelerator/brake pedal opening. The driver drove the test vehicle to 65 km/h with three modes of accelerator pedal opening of 30%, 60%, and 90% respectively, then braked to 0 with three modes of brake pedal opening of 30%, 60%, and 90% respectively. Finally, the acceleration and deceleration values under different pedal modes were calculated. The results are shown in Figure 3.
The results showed that the maximum acceleration for 30% accelerator pedal opening was 1.45 m/s2, the maximum acceleration for 60% accelerator pedal opening was 2.66 m/s2, and the maximum acceleration for 90% accelerator pedal opening was 3.83 m/s2. The maximum deceleration for 30% brake pedal opening was 1.36 m/s2, the maximum deceleration for 60% brake pedal opening was 2.98 m/s2, and the maximum deceleration for 90% brake pedal opening was 4.45 m/s2. Therefore, 30% accelerator/brake pedal opening satisfies the design requirements in this paper. The accelerator and brake pedal mode were set at 30% pedal opening.
Based on the set pedal opening, the test method designed in this paper was divided into two parts. The first step was designed to accelerate the vehicle to 65 km/h with the 30% accelerator pedal opening and then released the accelerator pedal gliding to the minimum steady speed by the driver in vehicle SOC between 20 and 80%. The second step was in the same vehicle state, the driver accelerated the vehicle to 65 km/h with the 30% accelerator pedal opening, then released the accelerator pedal to take the vehicle gliding to 60 km/h, and braked the vehicle to 0 km/h with the 30% brake pedal opening. The test was repeated several times until it met the test requirements.
The methods of data collection include the chase car method, on-board measurement method, and a combination of both in the urban driving cycle [31]. The chase car method means the driver randomly follows the target vehicle on a predetermined route, and if the target vehicle drives out of the test area or behaves abnormally, the test vehicle will find another target to follow [32]. The on-board measurement method installs a global position system (GPS) and on-board diagnosis (OBD) on the test vehicle to record its driving information along a predetermined route to obtain reliable data with high cost [33,34]. To develop the rapid inspection driving cycle, this paper used data from real vehicle testing at specific speeds under real driving. So, it was an inspection driving cycle for operational safety, which did not require tracking measurements on urban vehicles. Therefore, on-board measurements were used to collect real-time data on driving in this paper. The GPS was used to collect the speed and time of the test vehicle to modify the OBD data, which was stored in real time on the PC. At the same time, this was undertaken to increase the validity and effectiveness of the test data and avoid spike data in the acceleration signal. Considering the OBD-collected data within the effective frequency range, the sampling frequency was set at 20 Hz in this paper. The test equipment is shown in Figure 4. In addition, the test was operated by one professional driver throughout to eliminate data jitter caused by different drivers.

4. Data Processing

The main function of data processing is to confirm velocity time series as well as to remove noise and duplicate data from the original data. This process had two steps. The first step was to interpolate the original data with a polynomial interpolation algorithm for 10 ms. The sampling frequency of OBD to collect the data was sampled at 20 Hz and after a single data collection test, the test results showed that the time interval between the collected data was 10 ms. So, the original data was interpolated at 10 ms. Due to the limitations of the OBD collection data, the collected velocity and time samples will have stopped repetitive data and therefore need to be interpolated to obtain a new speed–time relationship. The second step was to smooth the original data. The original data collected by the sensor often show burrs or sudden changes in the data, due to the driving environmental disturbances and buildings, and some disturbances in the driving environment can also affect the test data. A Gaussian smoothing algorithm was introduced to filter and denoise the data. Gaussian smoothing is a linear smoothing filter, which has a softer smoothing effect and better edge retention than mean filtering. The original and denoising data for the driving-gliding state speed is shown in Figure 5. According to the data results, the minimum speed of the braking energy recovery is 8 km/h. The driving-braking state speed is shown in Figure 6.
The motion data was divided into three different kinematic segments, including driving segments, gliding segments, and braking segments after data processing. To increase the accuracy of testing the operational safety of the electric vehicle, the three different kinematic segments were combined with the idling and cruising kinematic segments in the construction of the rapid inspection driving cycle.
To effectively inspect the safety of the driving, gliding, and braking according to the determined operational safety testing items, the velocity mutation in speed during the sliding time window was purposed as an evaluation index. Acceleration can be used as an important feature to evaluate velocity mutation, but as acceleration only reflects the velocity variation during the whole process, it cannot characterize its operational stability. Therefore, the first derivative of the acceleration in the sliding time window for each kinematic segment, i.e., the acceleration changing rate, is used as an indicator to evaluate its safety in this paper.
After testing the experimental data, t was used as the sliding time window, and the Δ t was determined as the velocity sampling interval according to the data sampling frequency. The acceleration calculation formula was established for all velocity segments, which can be written as:
a ( i ) = V ( i + Δ t ) V ( i ) t
Based on the acceleration results obtained, we selected t as the sliding time window, and determined the Δ t as the acceleration sampling interval. Finally, the acceleration changing rate was established for all kinematic segments, as shown in the following equation:
Δ a ( i ) = a ( i + Δ t ) a ( i ) t
where: i = ( 1 , 2 , 3 , , n Δ t ) .

5. Driving Cycle Construction

The construction of a rapid inspection driving cycle is crucial for testing the operational safety of electric vehicles, and the nonlinear classification of speed–time directly affects the test result. The support vector machine (SVM) algorithm is an effective method for solving nonlinear pattern recognition and is mainly used to solve classification and regression problems. The support vector machine was referenced to solve the problem of regression curves for the rapid driving cycle kinematic segments in this paper. The core idea of the regression problem requires sample data to construct bounded training sets, which can be represented as ( X i , Y i ) (i = 1, 2, 3, …, n). Where n is the number of samples, X is the input parameter, and Y is the output parameter. Regression aims to find the optimal function f ( x ) , which can be written as follows:
f ( x ) = w , x + b , b R
where , is the dot product; ω is the parameter vector; and b is the bias vector.
The dot product of two numbered sets that satisfy the Mercer condition can be approximated by a kernel function to reduce the complexity of the calculation in reproducing the kernel Hilbert space.
K ( x i , x j ) = ϕ ( x i ) , ϕ ( x j )
For the centralization of experimental datasets, the Gaussian radial basis kernel function has good generalization ability and good local data fitting ability [35]. So, the Gaussian radial basis kernel function was chosen as the kernel function of the support vector machine, which is as follows:
K ( x i , x ) = exp ( x i x 2 2 σ 2 )
where σ is the dot product. We set ω as a parameter vector, and ξ i and ξ i * as slack variables. The optimization problems will recast as follows:
min w 1 2 w 2 + C i = 1 1 ( ξ i + ξ i * )
s . t . Y i w ϕ ( x i ) b ε + ξ i Y i + w ϕ ( x i ) + b ε + ξ i * ξ i 0 , ξ i * 0 , i = 1 , 2 , , I , C > 0
where C is the penalty coefficient and C needs to be greater than 0; ε is an insensitive coefficient to control the width of the regression function for the region of insensitivity of the data sample [36].
To take the validity of the regression fitting data, we set up the root mean square error (RMSE) to indicate the curve dispersion, which is shown as follows:
R M S E = 1 n i = 1 n ( y i f ( x i ) ) 2 × 100 %
where y i is the regression value, and f ( x i ) is the true value.
A support vector machine algorithm was used to regress the original driving cycle curve. The results showed that the RMSE was less than 10%, therefore, the candidate driving cycles were acceptable.
To further establish a completely electric vehicle operation safety rapid inspection driving cycle and improve the accuracy of the inspection, three kinematic segments of driving, gliding, and braking segment were set. The kinematic segments are shown in Figure 7. The total duration of the driving kinematic segment was 11.3 s, the gliding kinematic segment was 14.8 s, and the braking kinematic segment was 12.2 s. The different kinematic segments were spliced together through the idling and cruising segments, so the driver could have sufficient preparation time to switch and follow each segment of the driving cycle. According to the time of NEDC, the time of idling and cruising segments was set at 10 s. According to the minimum braking energy recovery speed of 10 km/h for the inspection items, the speed of the cruising segments was set at 10 km/h in this paper.
The driving kinematic segments were divided into 0–65 km/h and 10–65 km/h, where the 10–65 km/h segment was the vehicle driving to 65 km/h and then for gliding inspection. The gliding kinematic segments were divided into 65–60 km/h and 60–10 km/h, where 65–60 km/h took the vehicle speed decline to the inspection speed and also provided preparation time for the driver to the next stage of the driving operation. The 10–65 km/h driving segment and 65–60 km/h gliding segment are shown in Figure 8. The idling was for the driver to adjust the driving state, so the waiting segment was set 5 s before the inspection started. The rapid inspection driving cycle of the electric vehicle was constructed by splice and reconstruction between the kinematic segments. The developed rapid inspection driving cycle is shown in Figure 9.
As can be seen from Figure 9, the total duration of the rapid inspection driving cycle is 204 s. There were three 0–65 km/h driving segments for inspecting the safety of the driving stability of the electric vehicle, three 65–10 km/h gliding segments for the inspection of the safety of the gliding comfort of the electric vehicle, three 60–0 km/h braking segments for the inspection of the safety of the braking coordination of the electric vehicle, and three 65–60 km/h gliding segments and three idling segments. The gliding segment was only set for this test vehicle, which cannot restrict the gliding time for different vehicles. Compared to the NEDC, this model avoided the problems of a high number of parked vehicles, long duration, and speed instability. This driving cycle provides a solution for accurate and rapid inspection of the operational safety of electric vehicles.
Based on the analysis of the testing data, the sliding time window was 0.5 s. Since the sampling frequency was 20 Hz, the speed sampling interval Δ t was 50. The range of acceleration changing rate was [−0.35, −0.04] for the driving segment, the range of acceleration changing rate for the gliding segment was [0.05, 0.09], and the range of acceleration changing rate for the braking segment was [−0.04, 0.095]. Results are shown in Figure 10.
As shown in Figure 10, the driving segment has the largest range of acceleration changing rate. As the vehicle accelerates from 0 to 65 km/h, the velocity difference becomes progressively smaller under the sliding time window, which causes the result to be a negative value. The trend of gradual flattening of the increasing velocity with a stable pedal opening is verified, and the qualified range of driving stability for the driving segment is [−0.35, −0.04]. The second interval range of acceleration changing rate is a braking segment. When the vehicle enters the braking state from gliding, the electromechanical brake starts to intervene to completely stop. The velocity difference in the sliding time window range becomes larger, so the acceleration changing rate fluctuates more, while there is no sudden change. The qualified range of braking coordination for the braking segment is [−0.04, 0.095]. The gliding segment has the smallest range of acceleration changing rate, which is mainly due to the intervention of the regenerative braking during the gliding process. The external dominant factors of velocity reduction are reduced, and the vehicle can find stability in gliding. The qualified range of the changing rate for gliding smoothness for the gliding segment is [0.05, 0.09].

6. Driving Cycle Verification

To verify the representativeness and typicality of the developed driving cycle, driving stability, gliding comfort, and braking coordination were detected for inspection based on the established operational safety test calculation method. The test vehicle was used to follow the rapid driving cycle on a testing bench in Chang’an university Automotive Performance Test Laboratory, which is shown in Figure 11. The vehicle inertia and loading force were matched before following the rapid driving cycle. Therefore, the bench could simulate the road test. The maximum permissible error range for the rapid driving cycle velocity and following velocity is [−2 km/h, 2 km/h]. If the following velocity exceeds the maximum permissible error range, the following test data is considered inefficient. Simultaneously, the driver selected the same professional person to operate the electric vehicle and obtained a large number of efficiency data after following the test.
Based on the analysis of the following test data, six driving segments were selected for calculation and obtained the range of the acceleration changing rate. The results showed the maximum driving acceleration changing rate was −0.49, and the minimum driving acceleration changing rate was −0.03. The maximum RMSE in the acceleration changing rate between the constructed rapid inspection driving segments and the tested driving segments was 9%. The maximum RMSE in the acceleration changing rate between the tested driving segments was 6%. Then, the range of acceleration changing rate of the six gliding segments was calculated. The result showed the maximum gliding acceleration changing rate was 0.13, and the minimum gliding acceleration changing rate was 0.03. The maximum RMSE in the acceleration changing rate between the constructed rapid inspection gliding segments and the tested gliding segments was 2.7%. The maximum RMSE in the acceleration changing rate between the tested gliding segments was 4%. The errors results were shown in Table 3. Finally, the range of the acceleration changing rate of six braking segments was calculated. The result showed a maximum braking acceleration changing rate of 0.1 and a minimum braking acceleration changing rate of 0.02. The maximum RMSE in the acceleration changing rate between the constructed rapid inspection braking segments and the tested braking segments was 6.9%. The maximum RMSE in the acceleration changing rate between the tested braking segments was 3.4%. The test results were valid and errors are in the calculated permissible range, which is shown in Figure 12.
In order to better reflect the results of the following test, this paper is built from both the construction of the rapid driving cycle and the following test. On the one hand, based on the sudden change of speed and the operability of the driver, the rapid condition designed in this paper has a low speed and a small pedal opening, which is conducive to the following test. On the other hand, we chose a professional driver to operate the vehicle, and after several simulation tests, it followed the rapid driving cycle well, and the speed error reached the minimum.
The testing results showed that the proposed rapid inspection method was very effective in verifying the operational safety of the electric vehicle. The changing rate of each acceleration was within a small range of variation, which could characterize the safety of the driving, gliding, and braking movement. The maximum changing rate of acceleration during driving at less than 0.5 is the safety threshold for driving stability. The maximum changing rate of acceleration during gliding is less than 0.1 as the safety threshold for gliding comfort. The maximum changing rate of acceleration during braking is less than 0.1 as the safety threshold for vehicle braking coordination.

7. Conclusions

The operational safety of the electric vehicle is the core in full vehicle safety, and accurate inspection of its safety hazard is a premise for ensuring the operational safety of electric vehicles. However, there is no testing of relevant items according to specific follow-on testing cycles in traditional electric vehicle operation safety inspection. To resolve this issue, an in-depth analysis of operational safety inspection technology at home and abroad, a rapid inspection method was proposed for electric vehicle operational safety. According to the inspection results, the conclusion is as follows:
(1)
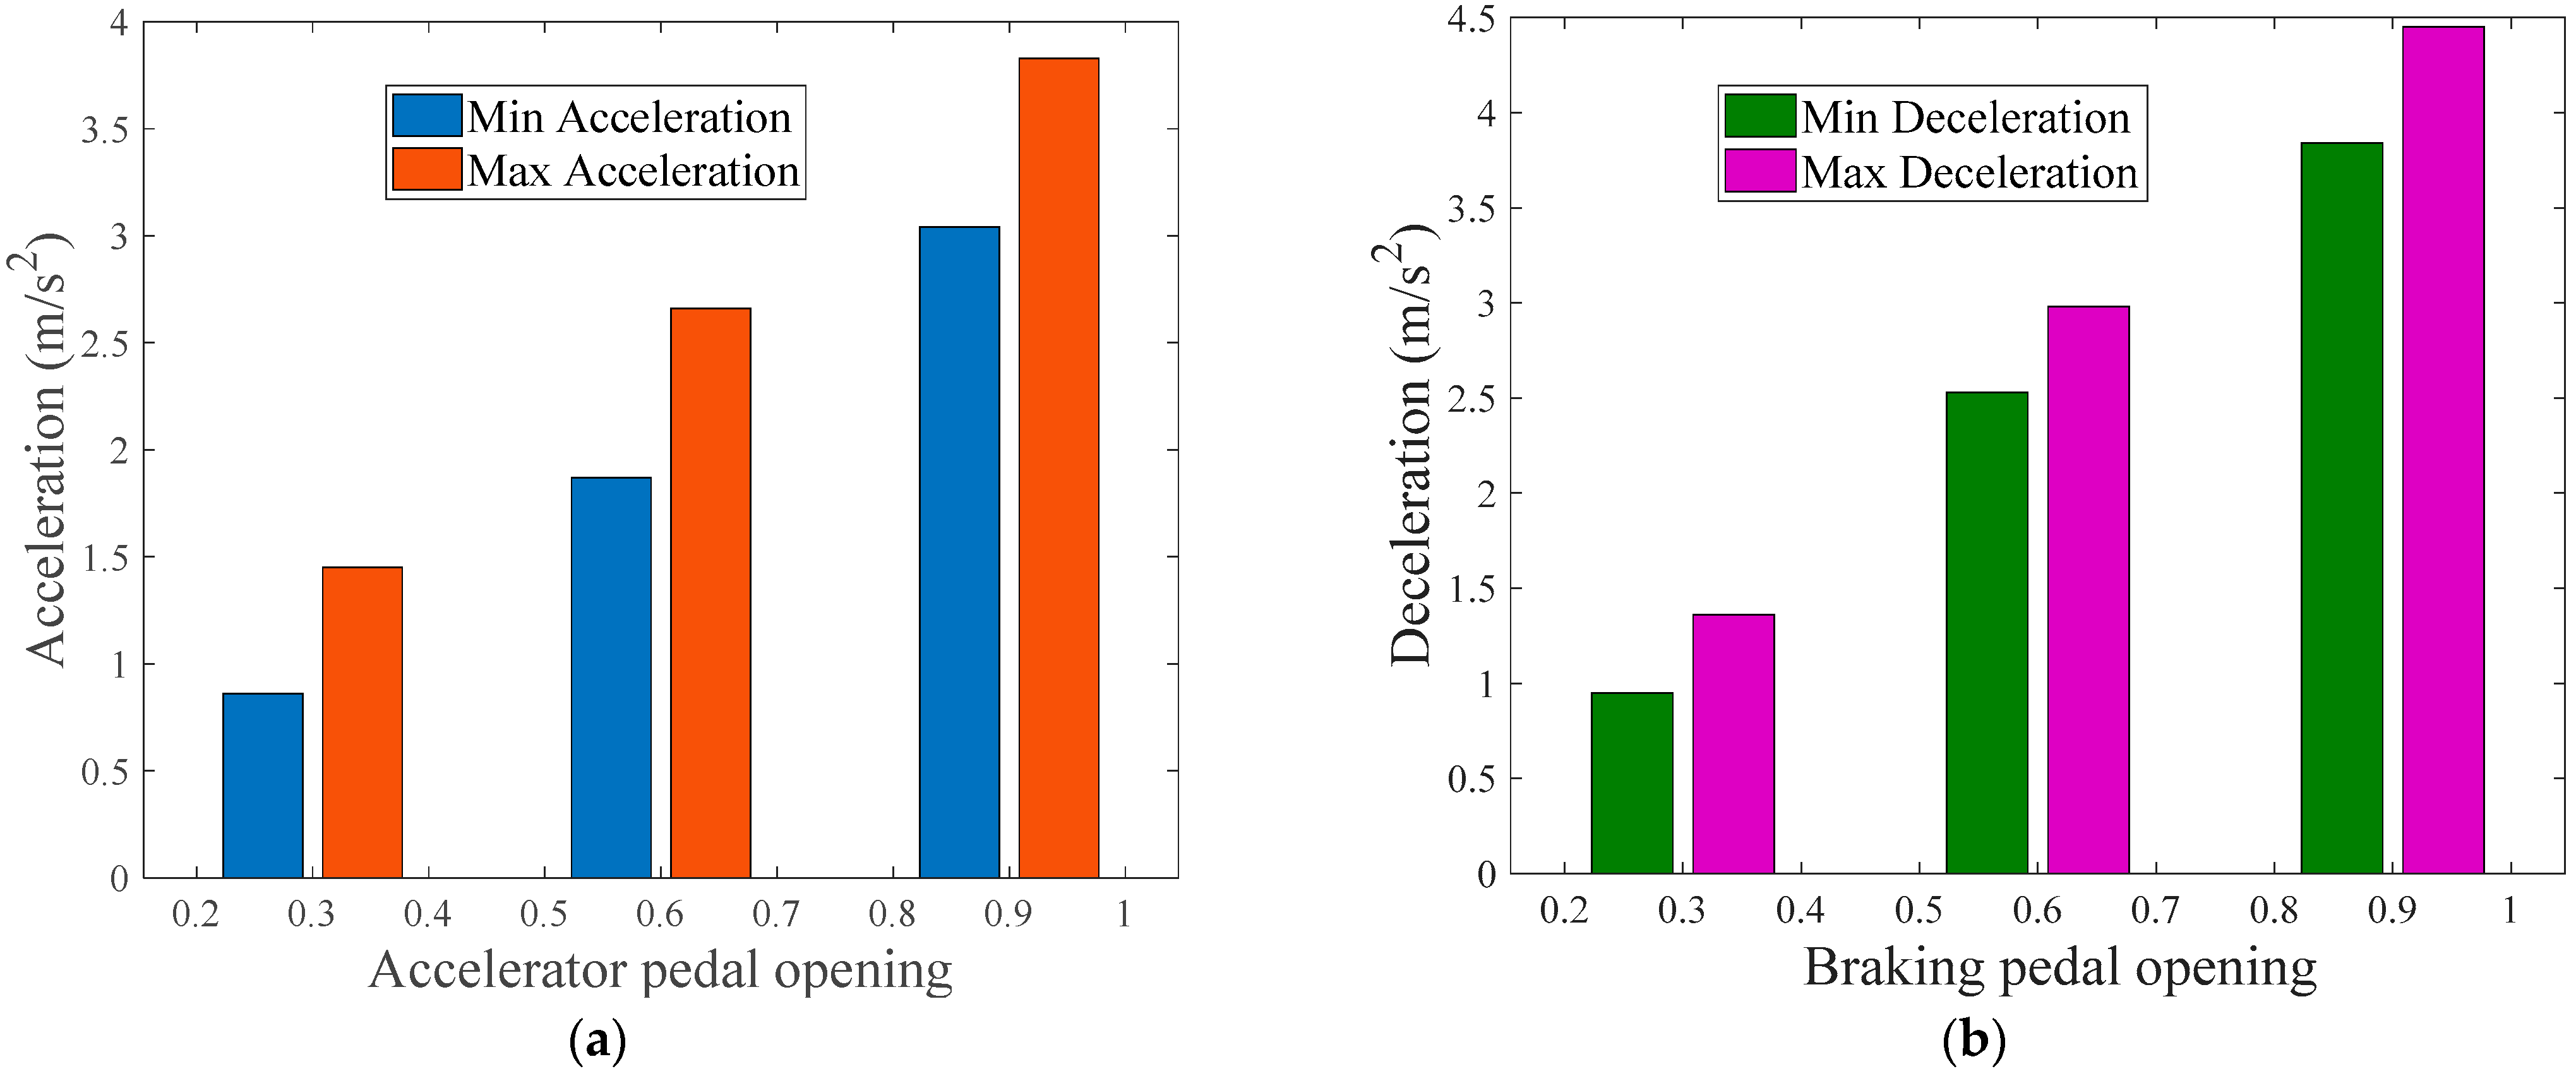
According to the existing electric vehicles inspection methods and means, combined with the relevant standards for electric vehicles and the accident causes, the electric vehicle safety inspection items were identified, which included gliding comfort, driving stability, and braking coordination. Then, an acceleration changing rate was purposed as an items inspection method based on the identified inspection items. Using the basic theory of the driving cycle, the accelerator/brake pedal opening, acceleration, and velocity were selected as test parameters. Then, a multi-cycle operational safety test method was proposed with stable pedal mode and set several accelerator/braking cycle tests were set to obtain the operational safety test data.
(2)
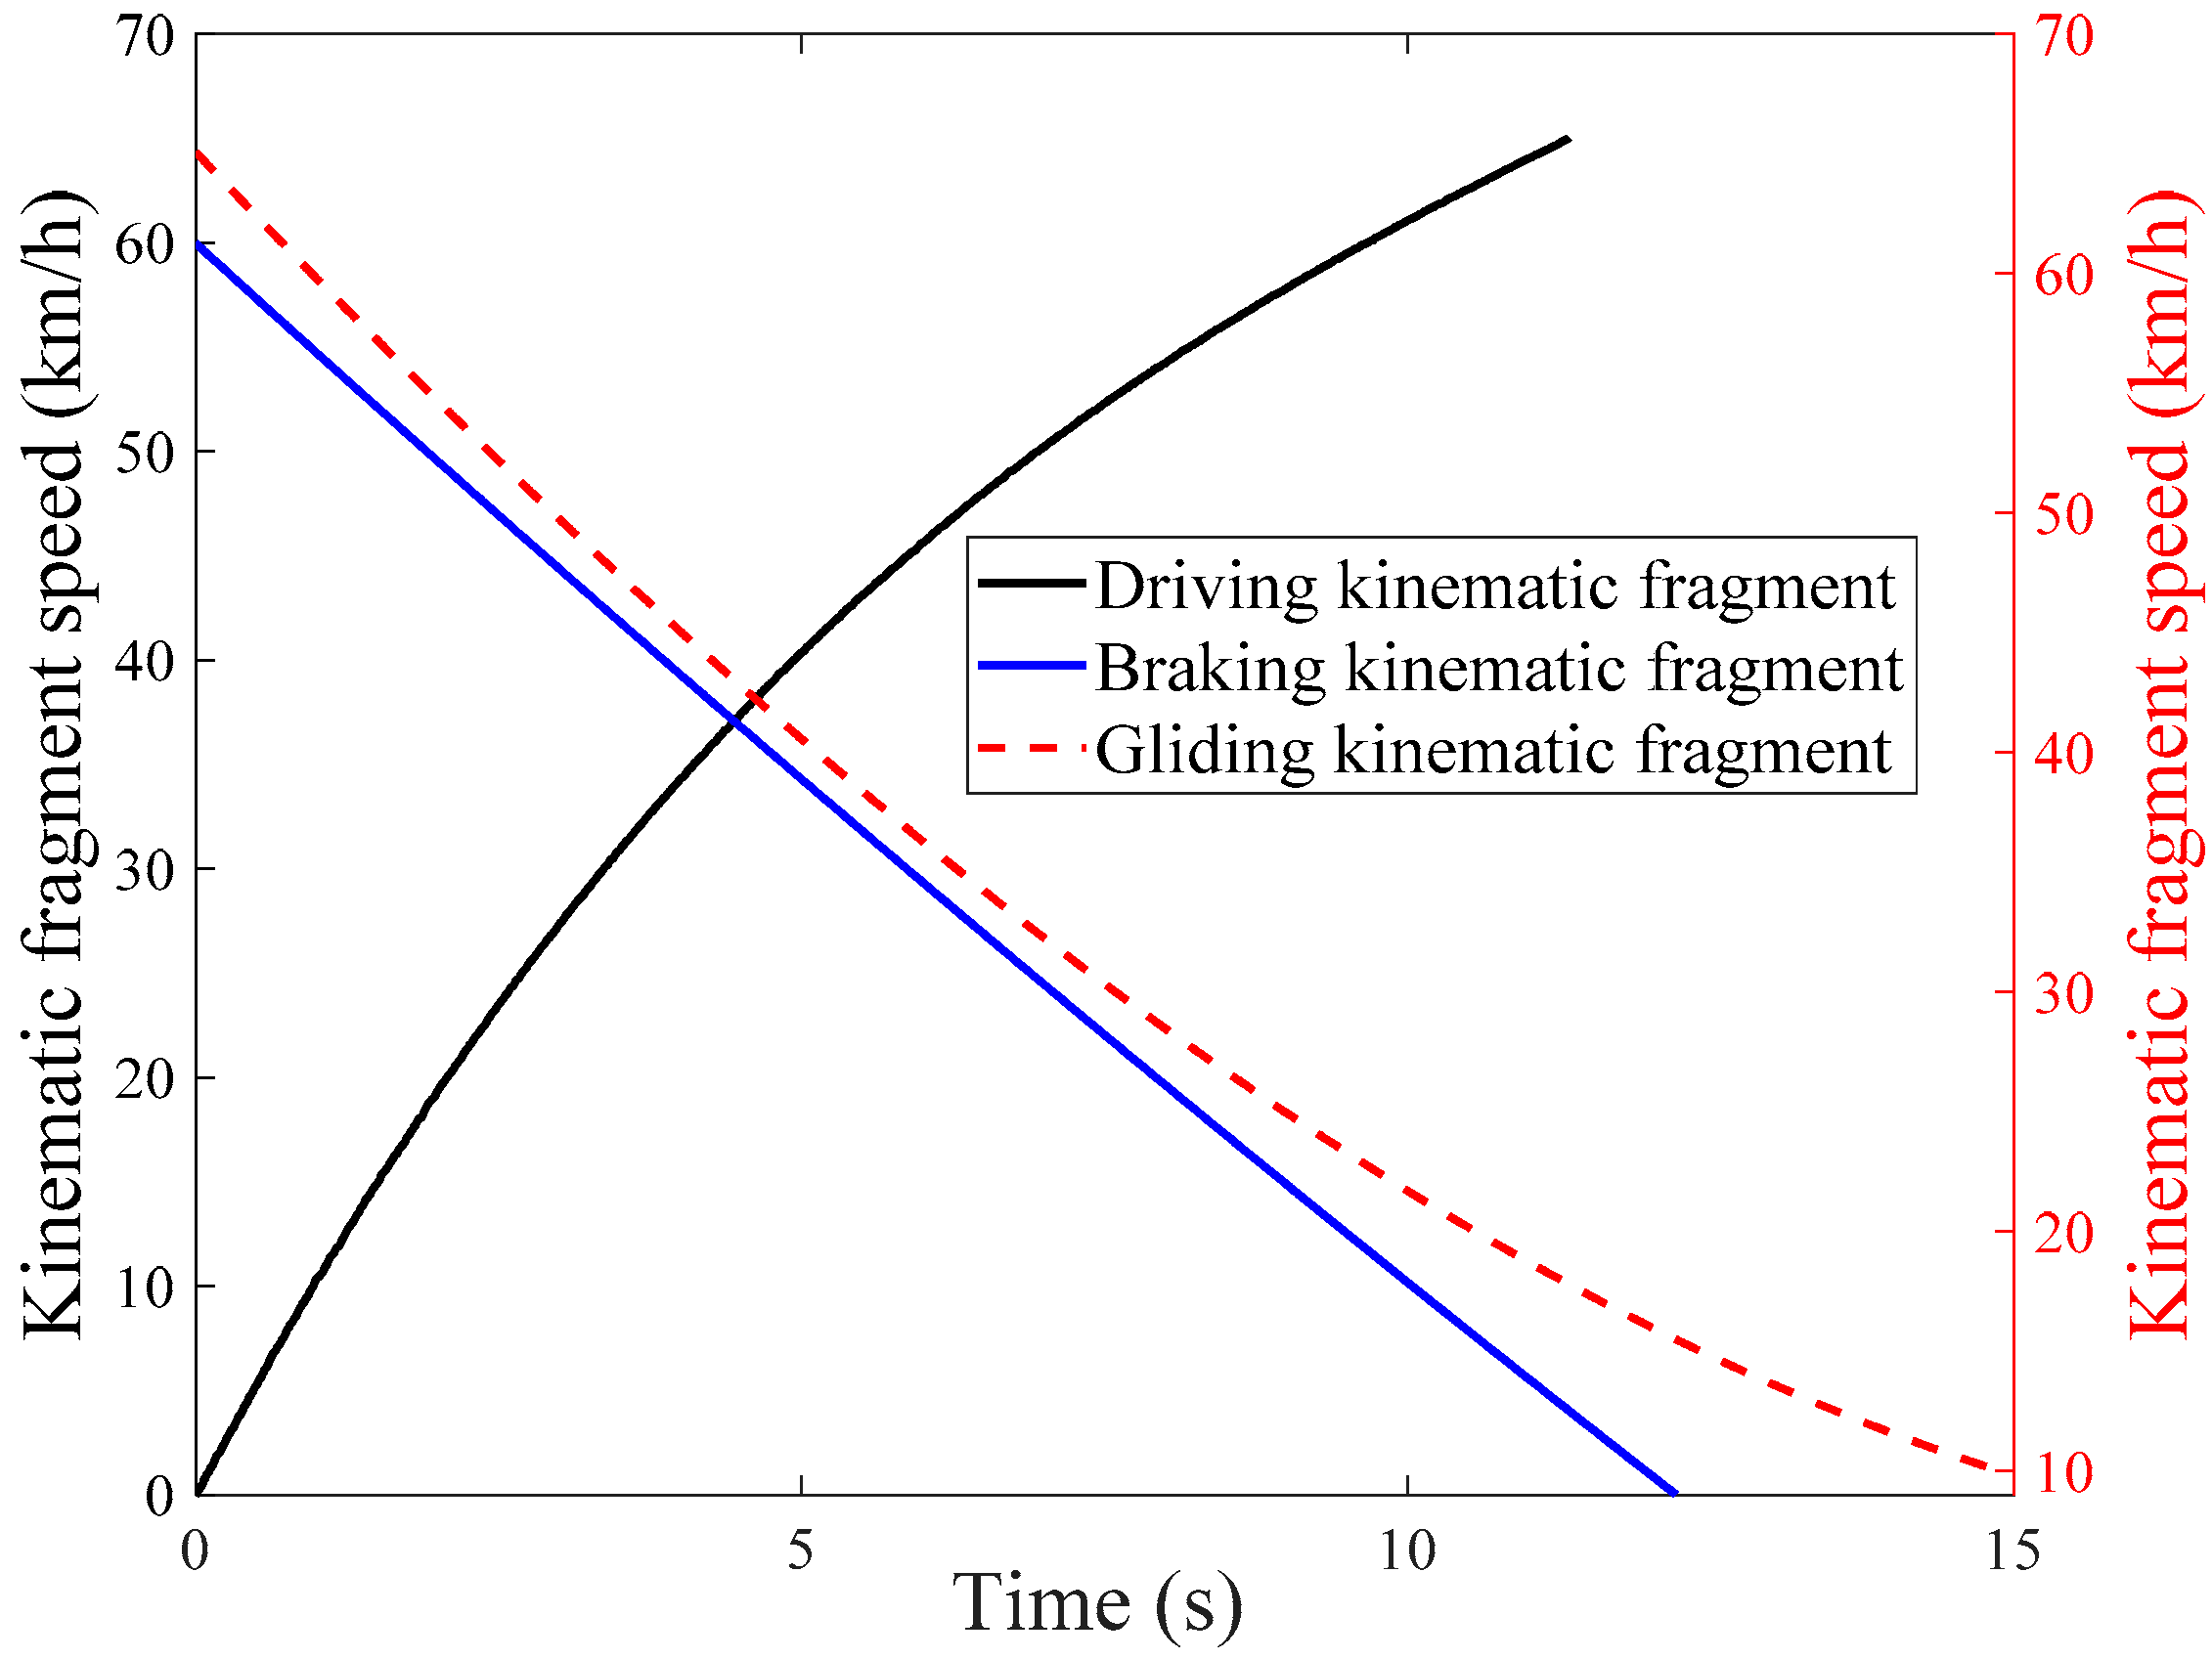
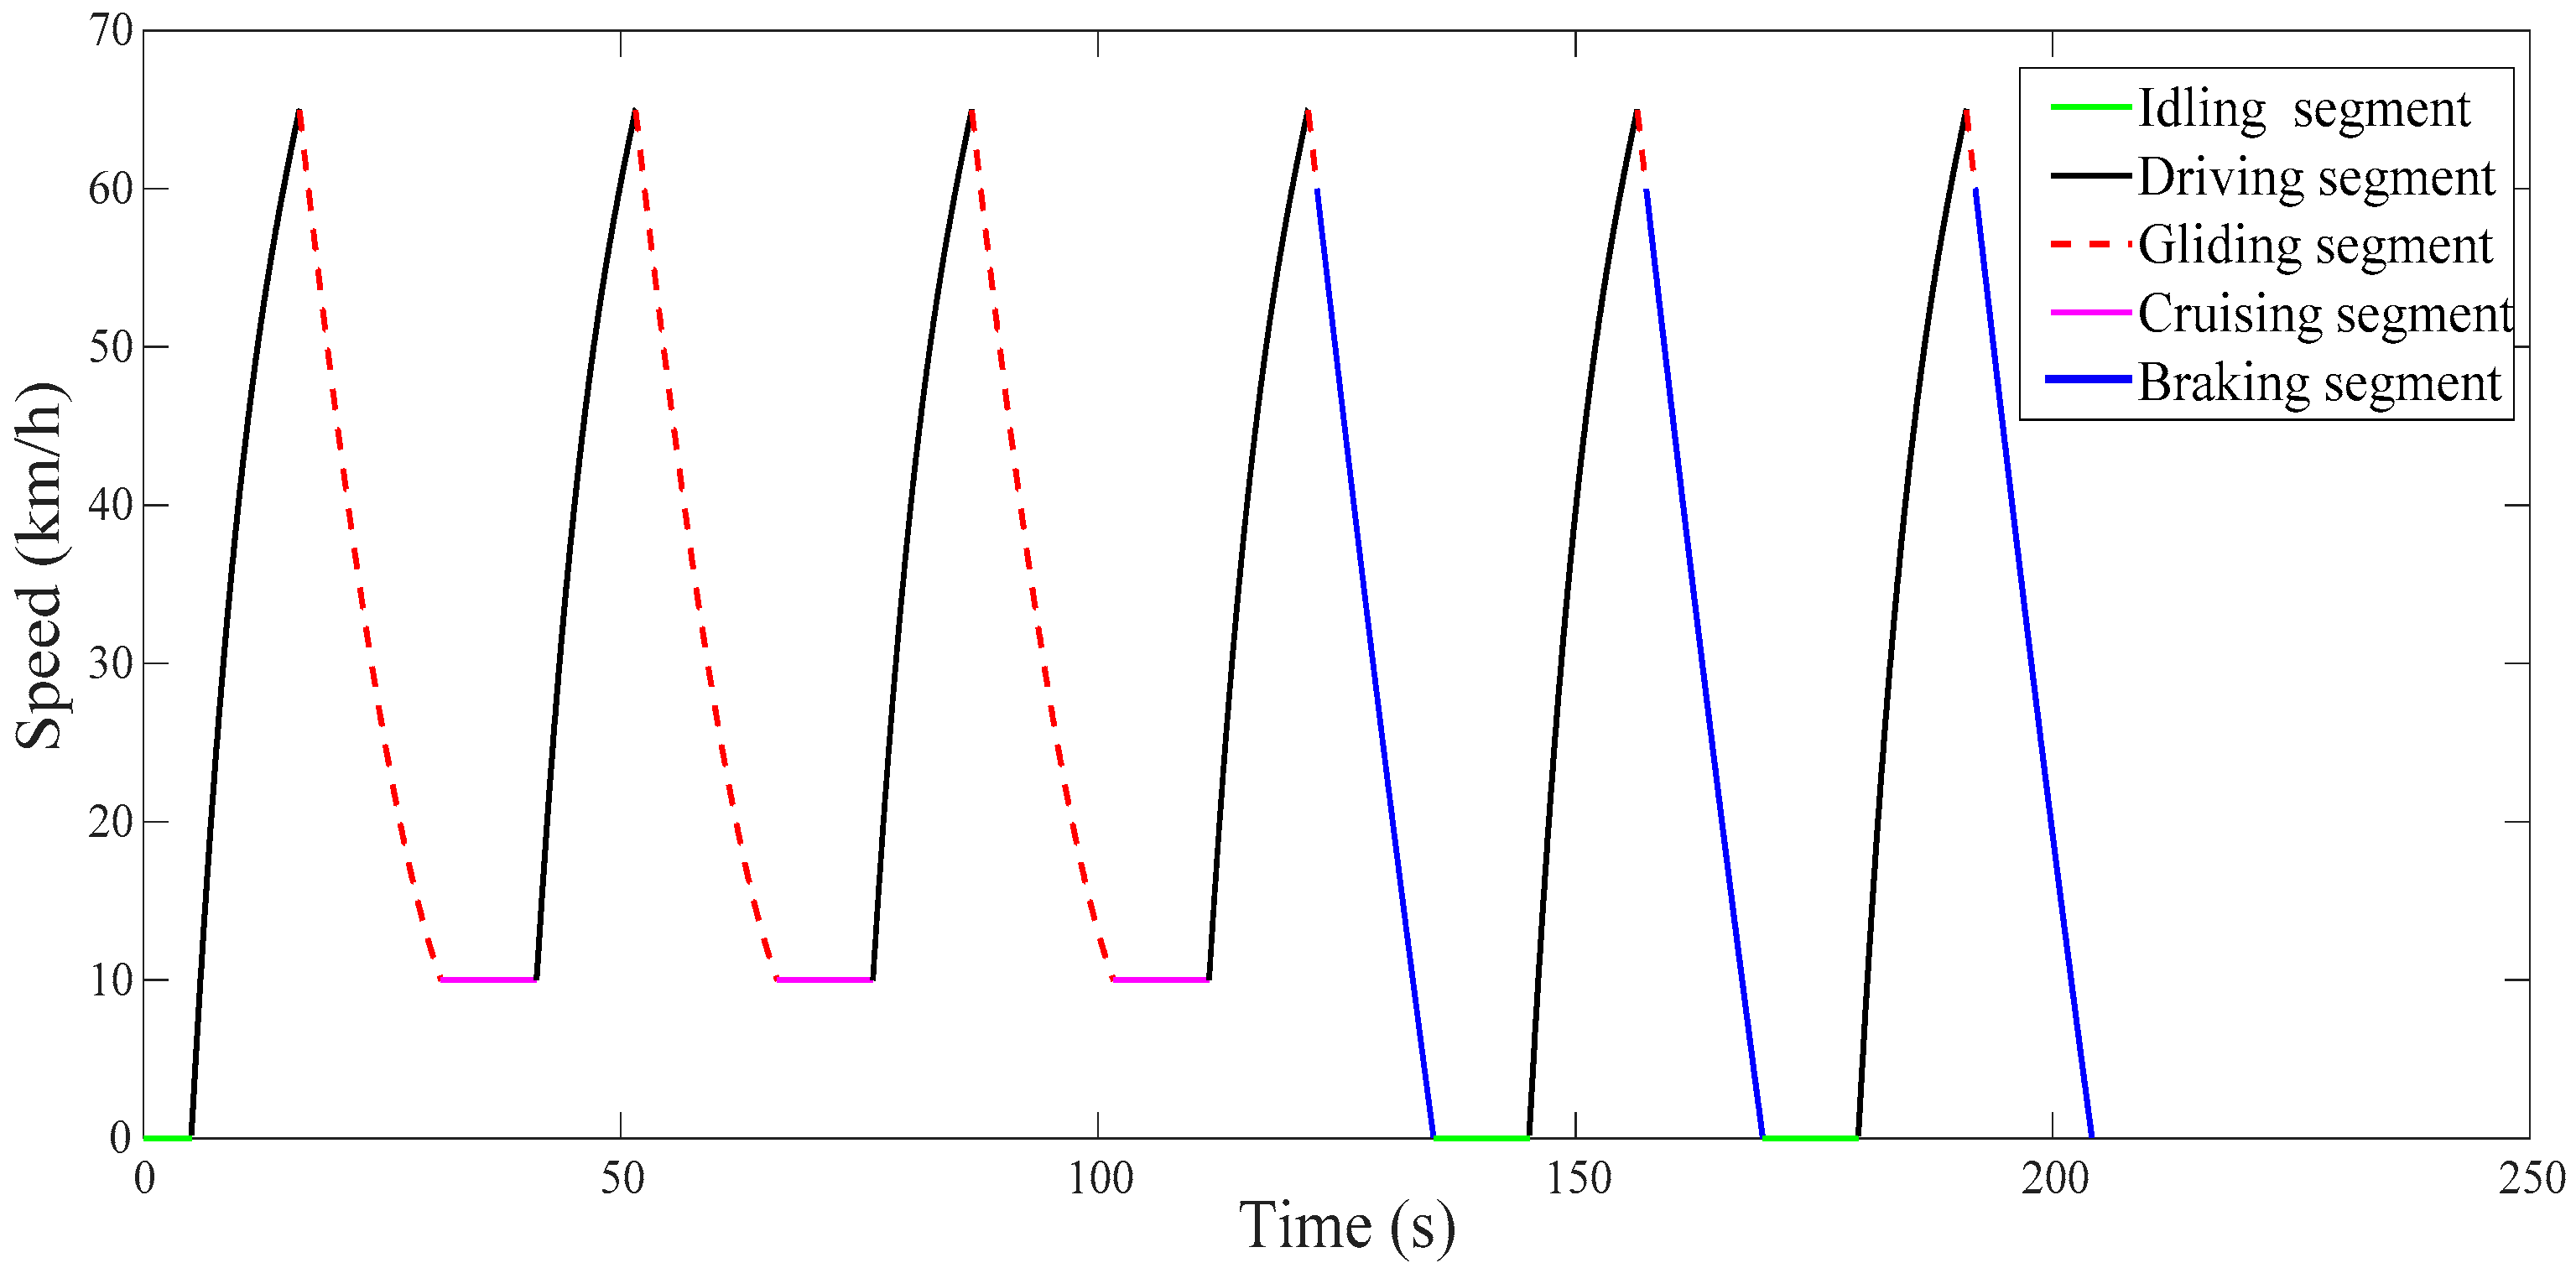
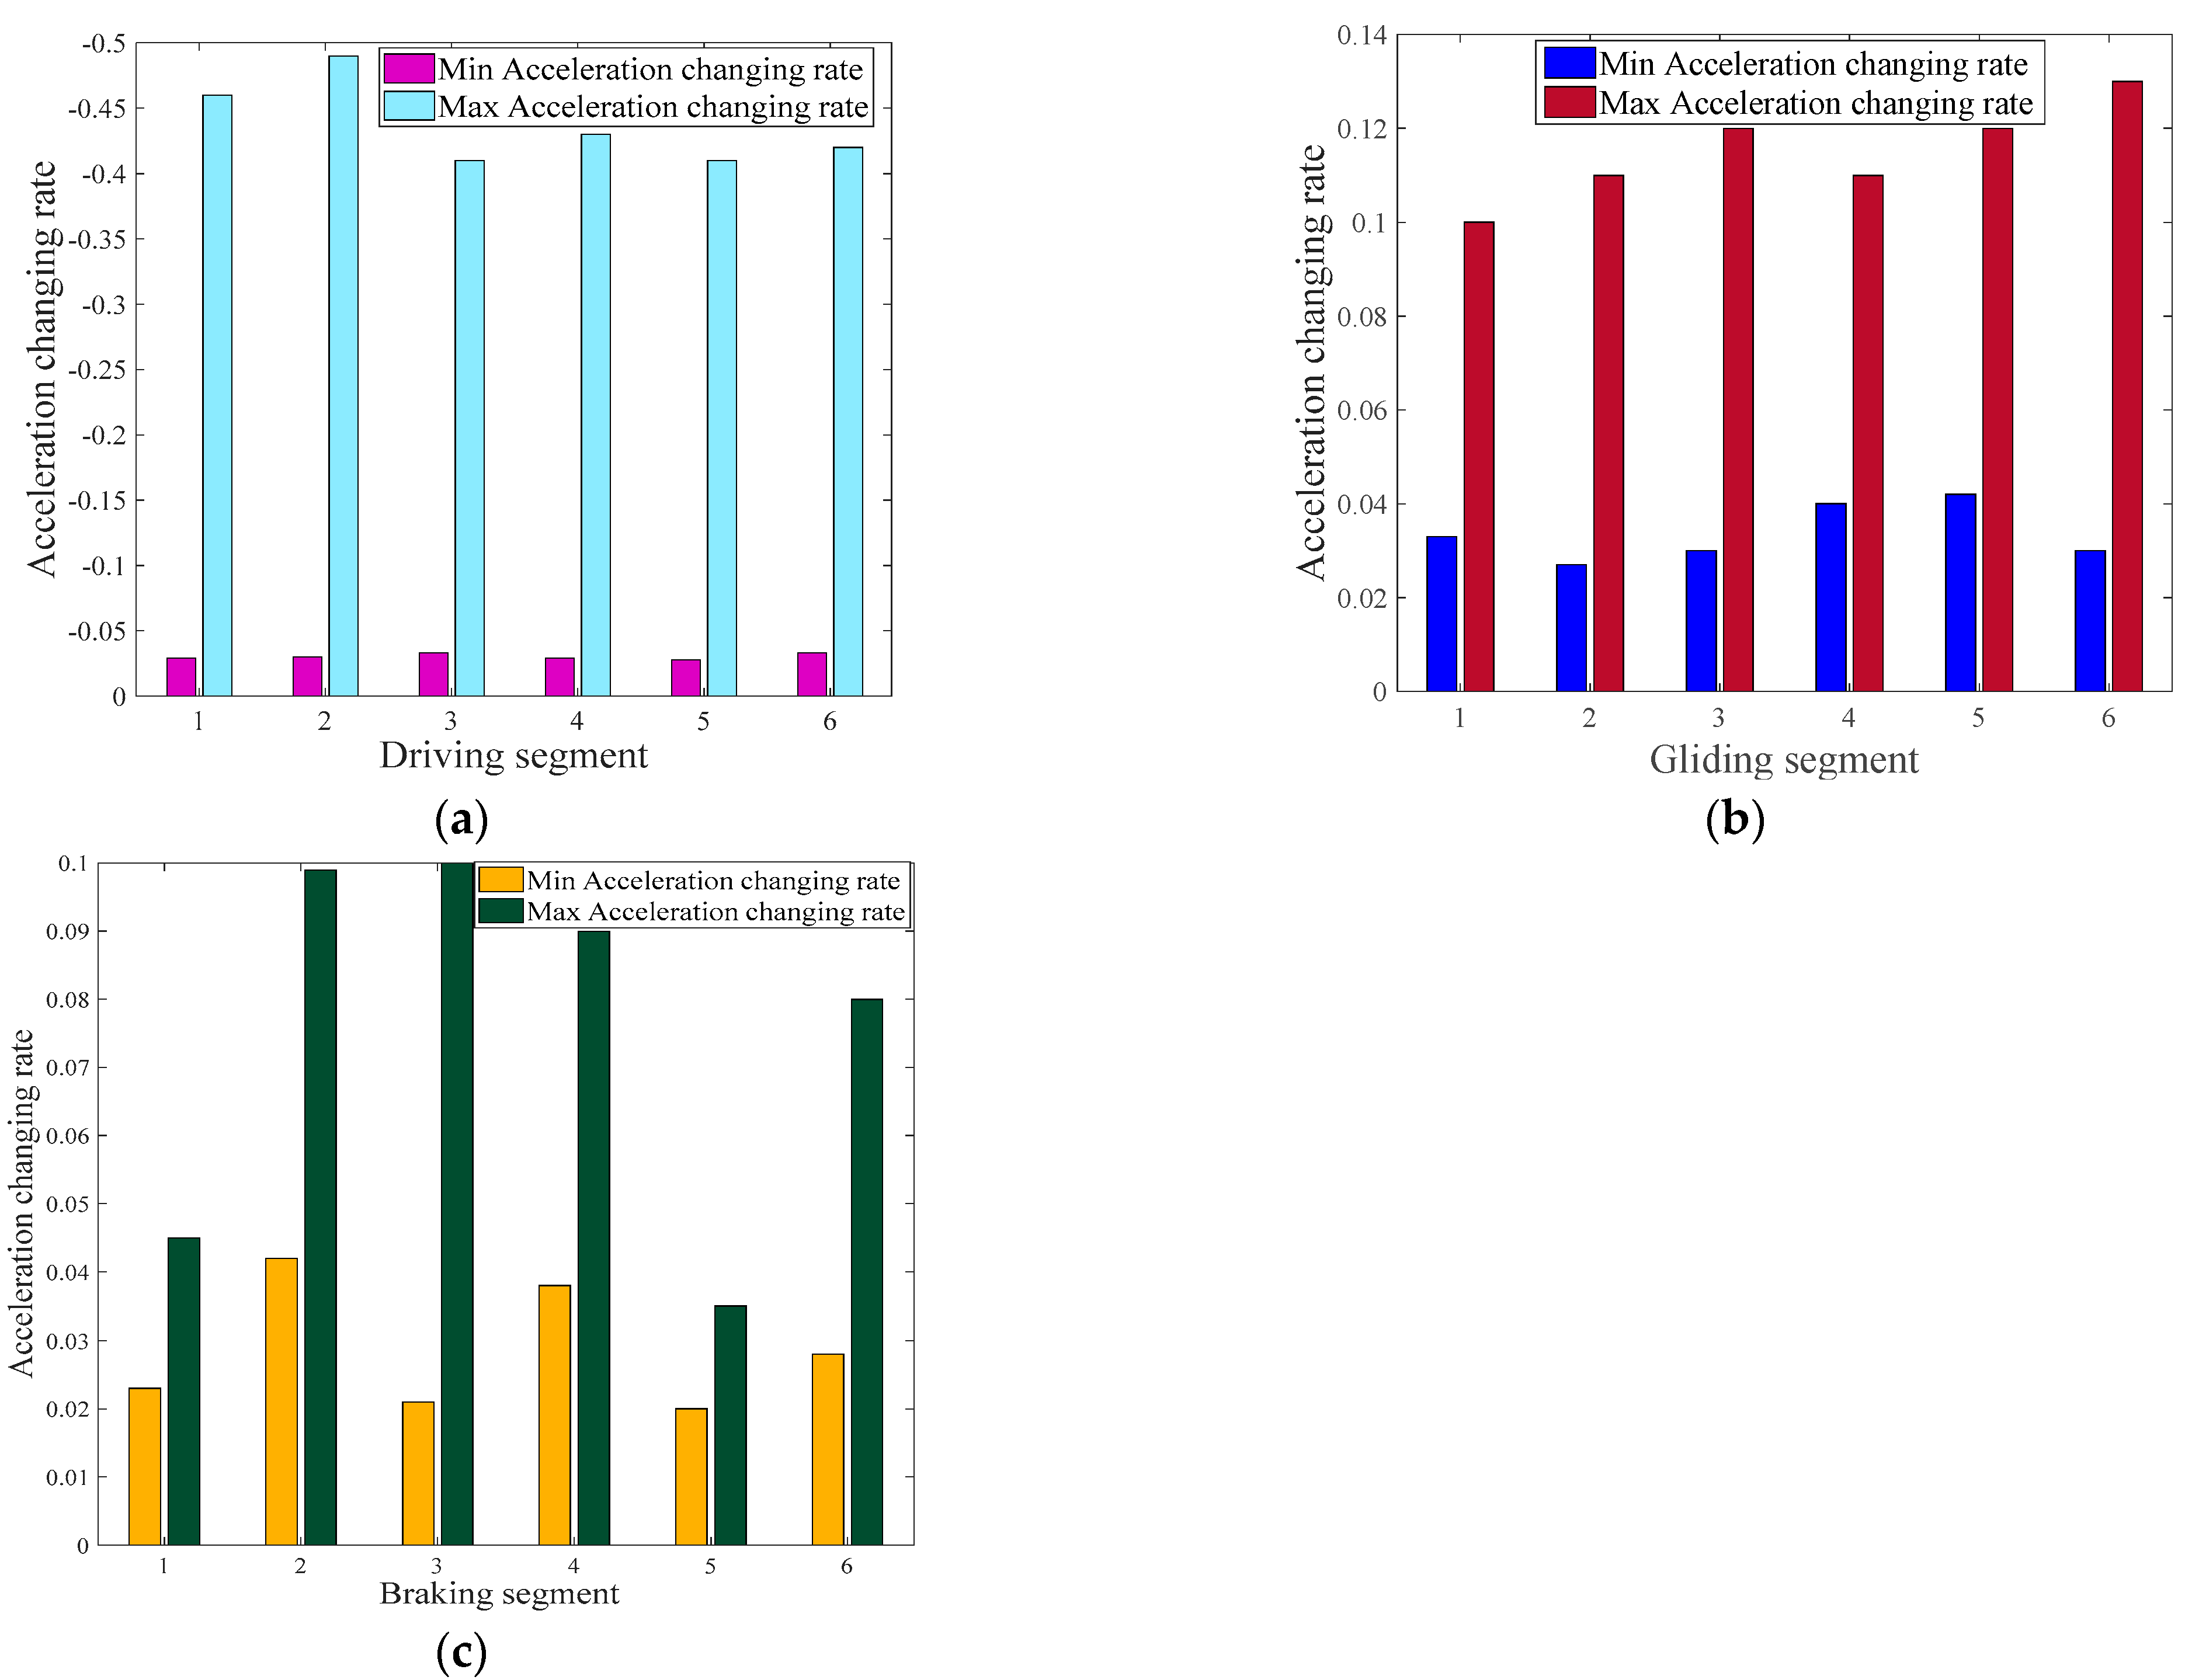
Advanced filtering algorithms were used to remove burrs and duplicate data from the collected data. A support vector machine was used for regression cycles and fused with a spliced rapid inspection driving cycle with a total time of 204 s for electric vehicles. Then the range of three kinematic segments stability was determined. Finally, this rapid inspection driving cycle was verified on the testing bench. The verification results showed that the maximum driving acceleration changing rate error was 9%. The maximum tested driving acceleration changing rate error was 6%, and the maximum verification gliding acceleration changing rate error was 2.7%. The maximum tested gliding acceleration changing rate error was 4%, and the maximum verification braking acceleration changing rate error was 6.9%. The maximum tested braking acceleration changing rate error was 3.4%. All three inspection items had a good calculation effect. The safety thresholds for driving acceleration changing rate were less than 0.5, the gliding acceleration changing rate was less than 0.1, and the braking acceleration changing rate was less than 0.1.
(3)
A rapid inspection driving cycle was established for the operational safety of electric vehicles, which provided some technical support for the “annual inspection” of electric vehicles. However, there are also certain limitations. For example, there are many models of electric vehicles with widely varying braking strategies. A single driver and changing different drivers may increase the calculation error. Therefore, further analysis can be performed for different braking energy recovery strategies, different vehicles and multi-cycle following correction.

Author Contributions

Conceptualization, Z.J. and J.M.; methodology, X.Z.; software, K.Z.; validation, Z.J.; formal analysis, Z.J.; investigation, X.L.; resources, J.M.; data curation, Z.J.; writing—original draft preparation, Z.J. and X.L.; writing—review and editing, J.M.; visualization, X.Z.; supervision, K.Z.; project administration, D.M.; funding acquisition, J.M. All authors have read and agreed to the published version of the manuscript.

Funding

This research was funded by the National Key Research and Development Program of China (2020YFB1600604), in part by the National Natural Science Foundation of China (52172362, 52002034), Major Science and Technology Projects of Shaanxi Province (2020ZDZX06-01-01); in part by the Fok Yingdong Young Teachers Fund Project (171103); and in part by the Key Research and Development Program of Shaanxi (2020ZDLGY16-01, 2020ZDLGY16-02, 2021ZDLGY12-01); and in part by the Natural Science Foundation of Shaanxi Province (2022JQ494), Fundamental Research Funds for the Central Universities, CHD (300102222108).

Institutional Review Board Statement

Not applicable.

Informed Consent Statement

Not applicable.

Data Availability Statement

The data presented in this study are available on request from the corresponding author.

Conflicts of Interest

The authors declare no conflict of interest.

Abbreviations

FTP-75Federal Test Procedure-75
ECOEconomical and Ecological
NEDCNew European Driving Cycle
VMASVehicle Mass Analysis System
WLTCWorld Light Vehicle Test Cycle
CLTC-PChina Light-Duty Vehicle Test Cycle-Passenger
GPSGlobal Position System
OBDOn-Board Diagnosis
t sliding time window
Δ t velocity sampling interval
a acceleration
Δ a acceleration changing rate
SVMSupport Vector Machine
b bias vector
, dot product
w parameter vector
f ( x ) optimal function
ϕ ( x i ) , ϕ ( x j ) kernel function
ξ i , ξ i * slack variable
C penalty coefficient
ε insensitive coefficient
RMSERoot Mean Square Error
y i regression value
f ( x i ) true value

References

  1. Du, J.; Ouyang, D. Progress of Chinese electric vehicles industrialization in 2015: A review. Appl. Energy 2017, 188, 529–546. [Google Scholar] [CrossRef]
  2. Palmer, K.; Tate, J.E.; Wadud, Z.; Nellthorp, J. Total cost of ownership and market share for hybrid and electric vehicles in the UK, US and Japan. Appl. Energy 2018, 209, 108–119. [Google Scholar] [CrossRef]
  3. Du, Z.; Lin, B.; Guan, C. Development path of electric vehicles in China under environmental and energy security constraints. Resour. Conserv. Recycl. 2019, 143, 17–26. [Google Scholar]
  4. Dong, F.; Liu, Y. Policy evolution and effect evaluation of new-energy vehicle industry in China. Resour. Policy 2020, 67, 101655. [Google Scholar] [CrossRef]
  5. Li, Y.; Zhang, Q.; Liu, B.; McLellan, B.; Gao, Y.; Tang, Y. Substitution effect of New-Energy Vehicle Credit Program and Corporate Average Fuel Consumption Regulation for Green-car Subsidy. Energy 2018, 152, 223–236. [Google Scholar] [CrossRef]
  6. Wang, Z.; Dong, X. Determinants and policy implications of residents’ new energy vehicle purchases: The evidence from China. Nat. Hazards 2016, 82, 155–173. [Google Scholar] [CrossRef]
  7. Yi, F.; Lu, D.; Wang, X.; Pan, C.; Tao, Y.; Zhou, J.; Zhao, C. Energy Management Strategy for Hybrid Energy Storage Electric Vehicles Based on Pontryagin’s Minimum Principle Considering Battery Degradation. Sustainability 2022, 14, 1214. [Google Scholar] [CrossRef]
  8. Brady, J.; O’Mahony, M. Development of a driving cycle to evaluate the energy economy of electric vehicles in urban areas. Appl. Energy 2016, 177, 165–178. [Google Scholar] [CrossRef]
  9. Liu, X.; Ma, J.; Zhao, X.; Zhang, Y.; Zhang, K.; He, Y. Integrated Component Optimization and Energy Management for Plug-In Hybrid Electric Buses. Processes 2019, 7, 477. [Google Scholar] [CrossRef] [Green Version]
  10. Mayakuntla, S.K.; Verma, A. A novel methodology for construction of driving cycles for Indian cities. Transp. Res. Part D Transp. Environ. 2018, 65, 725–735. [Google Scholar] [CrossRef]
  11. Mersky, A.C.; Samaras, C. Fuel economy testing of autonomous vehicles. Transp. Res. Part C Emerg. Technol. 2016, 65, 31–48. [Google Scholar] [CrossRef]
  12. Tsai, J.-H.; Chiang, H.-L.; Hsu, Y.-C.; Peng, B.-J.; Hung, R.-F. Development of a local real world driving cycle for motorcycles for emission factor measurements. Atmos. Environ. 2005, 39, 6631–6641. [Google Scholar] [CrossRef]
  13. Berzi, L.; Delogu, M.; Pierini, M. Development of driving cycles for electric vehicles in the context of the city of Florence. Transp. Res. Part D Transp. Environ. 2016, 47, 299–322. [Google Scholar] [CrossRef]
  14. Hung, W.T.; Tong, H.Y.; Lee, C.; Ha, K.; Pao, L.Y. Development of a practical driving cycle construction methodology: A case study in Hong Kong. Transp. Res. Part D Transp. Environ. 2007, 12, 115–128. [Google Scholar] [CrossRef]
  15. Zhao, X.; Zhao, X.; Yu, Q.; Ye, Y.; Yu, M. Development of a representative urban driving cycle construction methodology for electric vehicles: A case study in Xi’an. Transp. Res. Part D Transp. Environ. 2020, 81, 102279. [Google Scholar] [CrossRef]
  16. Zhao, X.; Ye, Y.; Ma, J.; Shi, P.; Chen, H. Construction of electric vehicle driving cycle for studying electric vehicle energy consumption and equivalent emissions. Environ. Sci. Pollut. Res. 2020, 27, 37395–37409. [Google Scholar] [CrossRef]
  17. Shi, Q.; Zheng, Y.; Wang, R.; Li, Y. The study of a new method of driving cycles construction. Procedia Eng. 2011, 16, 79–87. [Google Scholar] [CrossRef] [Green Version]
  18. Shi, S.; Lin, N.; Zhang, Y.; Cheng, J.; Huang, C.; Liu, L.; Lu, B. Research on Markov property analysis of driving cycles and its application. Transp. Res. Part D Transp. Environ. 2016, 47, 171–181. [Google Scholar] [CrossRef]
  19. Jing, Z.; Wang, G.; Zhang, S.; Qiu, C. Building Tianjin driving cycle based on linear discriminant analysis. Transp. Res. Part D Transp. Environ. 2017, 53, 78–87. [Google Scholar] [CrossRef]
  20. Wang, Q.; Huo, H.; He, K.; Yao, Z.; Zhang, Q. Characterization of vehicle driving patterns and development of driving cycles in Chinese cities. Transp. Res. Part D Transp. Environ. 2008, 13, 289–297. [Google Scholar] [CrossRef]
  21. Peng, Y.; Zhuang, Y.; Yang, H. Development of a representative driving cycle for urban buses based on the k-means cluster method. Clust. Comput. 2018, 2, 1–10. [Google Scholar]
  22. Wang, L.; Ma, J.; Zhao, X.; Li, X. Development of a Typical Urban Driving Cycle for Battery Electric Vehicles Based on Kernel Principal Component Analysis and Random Forest. IEEE Access 2021, 9, 15053–15065. [Google Scholar] [CrossRef]
  23. Lai, J.; Yu, L.; Song, G.; Guo, P.; Chen, X. Development of City-Specific Driving Cycles for Transit Buses Based on VSP Distributions: Case of Beijing. J. Transp. Eng. 2013, 139, 749–757. [Google Scholar] [CrossRef]
  24. Nesamani, K.; Subramanian, K. Development of a driving cycle for intra-city buses in Chennai, India. Atmos. Environ. 2011, 45, 5469–5476. [Google Scholar] [CrossRef]
  25. Shim, B.J.; Park, K.S.; Koo, J.M.; Jin, S.H. Work and speed based engine operation condition analysis for new European driving cycle (NEDC). J. Mech. Sci. Technol. 2014, 28, 755–761. [Google Scholar] [CrossRef]
  26. Zhang, X.; Liu, F.; Cai, F.; Dong, G.; Liu, J. Research on Influencing Factors on Errors of Vehicle Fuel Consumption Measured by Carbon Balance Method Based on VMAS. J. Highw. Transp. Res. Dev. 2012, 6, 84–88. [Google Scholar] [CrossRef]
  27. Wang, M.; Jin, B.; Li, S. Study on Emission Limits under VMAS for In-use Vehicles in Zhengzhou. Environ. Sci. Technol. 2019, 42, 214–220. [Google Scholar]
  28. Kang, Y.; Duan, B.; Zhou, Z.; Shang, Y.; Zhang, C. Online multi-fault detection and diagnosis for battery packs in electric vehicles. Appl. Energy 2020, 259, 114170. [Google Scholar] [CrossRef]
  29. Feng, X.; Weng, C.; Ouyang, M.; Sun, J. Online internal short circuit detection for a large format lithium ion battery. Appl. Energy 2016, 161, 168–180. [Google Scholar] [CrossRef] [Green Version]
  30. Xia, B.; Mi, C. A fault-tolerant voltage measurement method for series connected battery packs. J. Power Sources 2016, 308, 83–96. [Google Scholar] [CrossRef]
  31. Ho, S.; Wong, Y.; Chang, W. Developing Singapore Driving Cycle for passenger cars to estimate fuel consumption and vehicular emissions. Atmos. Environ. 2014, 97, 353–362. [Google Scholar] [CrossRef]
  32. Yu, Z.; Shi, S.; Wang, S.; Mu, Y.; Li, W.; Xu, C.; Zhang, M. Statistical inference-based research on sampling time of vehicle driving cycle experiments. Transp. Res. Part D Transp. Environ. 2017, 54, 114–141. [Google Scholar] [CrossRef]
  33. Arun, N.; Mahesh, S.; Ramadurai, G.; Nagendra, S.S. Development of driving cycles for passenger cars and motorcycles in Chennai, India. Sustain. Cities Soc. 2017, 32, 508–512. [Google Scholar] [CrossRef]
  34. Wang, Y.; Fujimoto, H.; Hara, S. Driving Force Distribution and Control for EV With Four In-Wheel Motors: A Case Study of Acceleration on Split-Friction Surfaces. IEEE Trans. Ind. Electron. 2017, 64, 3380–3388. [Google Scholar] [CrossRef]
  35. Tian, H.; Li, A.; Li, X. SOC estimation of lithium-ion batteries for electric vehicles based on multimode ensemble SVR. J. Power Electron. 2021, 21, 1365–1373. [Google Scholar] [CrossRef]
  36. Lu, J.; Zhang, Z.; Wu, Z.Q. Prediction of Surface Roughness for Compacted Graphite Cast Iron Based on Support Vector Machine. Surf. Technol. 2020, 49, 350–357. [Google Scholar]
Figure 1. Methodology for the development of the driving cycle.
Sustainability 14 05079 g001
Figure 2. Chang’an University internet of vehicles and intelligent vehicles test field.
Sustainability 14 05079 g002
Figure 3. Acceleration/deceleration values at different pedal openings: (a) Acceleration under different accelerator pedal openings; (b) Deceleration under the different braking pedal openings.
Sustainability 14 05079 g003
Figure 4. Test equipment.
Sustainability 14 05079 g004
Figure 5. Driving-gliding state speed.
Sustainability 14 05079 g005
Figure 6. Driving-braking state speed.
Sustainability 14 05079 g006
Figure 7. Different kinematic segment speeds.
Sustainability 14 05079 g007
Figure 8. The 10–65 km/h driving segment and 60–65 km/h gliding segment.
Sustainability 14 05079 g008
Figure 9. Rapid inspection driving cycle.
Sustainability 14 05079 g009
Figure 10. Acceleration changing rate for different segments.
Sustainability 14 05079 g010
Figure 11. Bench tracking test.
Sustainability 14 05079 g011
Figure 12. The results of the following test: (a) driving segment test results; (b) gliding segment test results; (c) braking segment test results.
Sustainability 14 05079 g012
Table 1. National testing standards.
StandardTest ContentTesting SignificanceTesting Indicator
GB21670-2008Technical requirements and testing methods for passenger car braking systemsTest the abnormal braking systems performanceBraking time and average deceleration
GB/T12543-2009Acceleration performance test methods for motor vehicleTest the abnormal acceleration performanceCoefficient of variation of velocity
GB/T18385-2005Electric vehicles power performance test methodsTest the abnormal acceleration performance of electric vehiclesThe arithmetic square root of acceleration time
QC/T 1089-2017Requirements and test methods for regenerative braking systems in electric vehiclesTest the abnormal braking systems performance of electric vehiclesCoefficient of variation of mean fully developed deceleration
GB 38900-2020Items and methods for safety technology inspection of motor vehiclesRegulation of motor vehicle safety technology inspectionDifferent tests, different indicators
Table 2. Technical parameters of the test vehicle.
ParameterSymbolValueUnit
Curb weight m e 1580Kg
Wheelbase L 2660mm
Vehicle body height h 1510mm
Maximum speed u max 150km/h
Motor rated power P e 110kW
Motor peak power P e max 135kW
Motor rated torque T e 350Nm
Motor rated speed n e 4000rpm
Motor peak torque T e max 350Nm
Motor peak speed n e max 7500rpm
Motor Maximum efficiency η 96%
Battery capacity Q 52.5kWh
Battery discharge depth D 80%
Nominal driving range S 410km
Nominal energy consumption q 13.1kWh/100 km
Table 3. The analysis of test results.
Kinematic SegmentsThe Qualified Range of StabilityThe Tested Range of StabilityThe RMSE between the Qualified and Tested ResultsThe RMSE between the Tested Results
driving segment[−0.35, −0.04][−0.49, −0.03]9%6%
gliding segment[0.05, 0.09][0.03, 0.13]2.7%4%
braking segment[−0.04, 0.095][0.02, 0.1]6.9%3.4%
Publisher’s Note: MDPI stays neutral with regard to jurisdictional claims in published maps and institutional affiliations.

