Article

Developing an Indicator System to Monitor City’s Sustainability Integrated Local Governance: A Case Study in Zhangjiakou

1
School of Architecture, Tianjin University, Tianjin 300072, China
2
APEC Sustainable Energy Center, Tianjin 300072, China
3
China State Construction Technical Center, Beijing 101300, China
4
China Association of Building Energy Efficiency, Beijing 100831, China
*
Author to whom correspondence should be addressed.
Sustainability 2022, 14(9), 5047; https://doi.org/10.3390/su14095047
Submission received: 23 March 2022 / Revised: 14 April 2022 / Accepted: 20 April 2022 / Published: 22 April 2022

Abstract

:
Indicator-based evaluation systems are critical for guiding and monitoring cities’ sustainable development. Zhangjiakou city is the national renewable energy demonstration zone in China, and is gaining more attention (being the co-host city of the 2022 Winter Olympic Games). It needs to seize the opportunities for its long-term sustainable development. An indicator system was developed to monitor the city’s sustainability. Local governance was integrated into an extended three-pillar evaluation model as the fourth dimension through the involvement of over 30 local government departments. Based on the interpretation of local demands, 118 assessment tools were reviewed and an international indicator inventory of 224 indicators was established. By analyzing the local relevance, 95 indicators were selected and categorized into eight modules (energy and carbon emission, resources and environment, harmony and well-being, economics and inclusion, key industries, innovation and smart, governance and efficiency, and internationalization). However, only 67 indicators were confirmed for value assignments after applicability assessment. Basic performance values (BPVs) were given as achievable goals during the 14th Five-Year Plan (FYP), and the excellent performance values (EPVs) were given towards carbon neutrality. All of the values were peer-reviewed and agreed by the local government while discrepancy still exists on carbon emission.

1. Introduction

Tackling climate change has become a topic of widespread concern in the international community. At present, a meaningful way to combat climate change is carbon reduction and has been widely concerned and recognized. In realizing a carbon reduction plan, cities play a critical role. Cities are responsible for about 70% of global carbon emissions [1] and consume two-thirds of the world’s energy [2]. There is an agreement of academic and policy that cities, or other types of urban settlements, are the nexus of sustainable city development and carbon emission reduction [3]. Moreover, cities are beset by socio-economic issues [4]. Therefore, integrating sustainable city development with energy transition is feasible and essential to achieving carbon reduction goals. As sustainable development guidelines, it is more practical to establish city sustainability evaluation systems to guide this transformation (which integrate energy issues and city development).
The concept of sustainable city development is still relatively open, various [5,6], and still changing and evolving [7]. The original sustainable city development concept emphasized intergenerational equity [8]. Nevertheless, in the case of a specific region, some localized goals and demands significant influence. For example, in the APEC region, optimization of production and output, minimization of pollution and efficient land use, and coordinated development between urban and rural areas are specific objectives [8,9]. This openness creates more opportunities for different stakeholders to participate and express their demands [10]. Furthermore, this also allows various evaluation approaches to try to drive and witness this process.
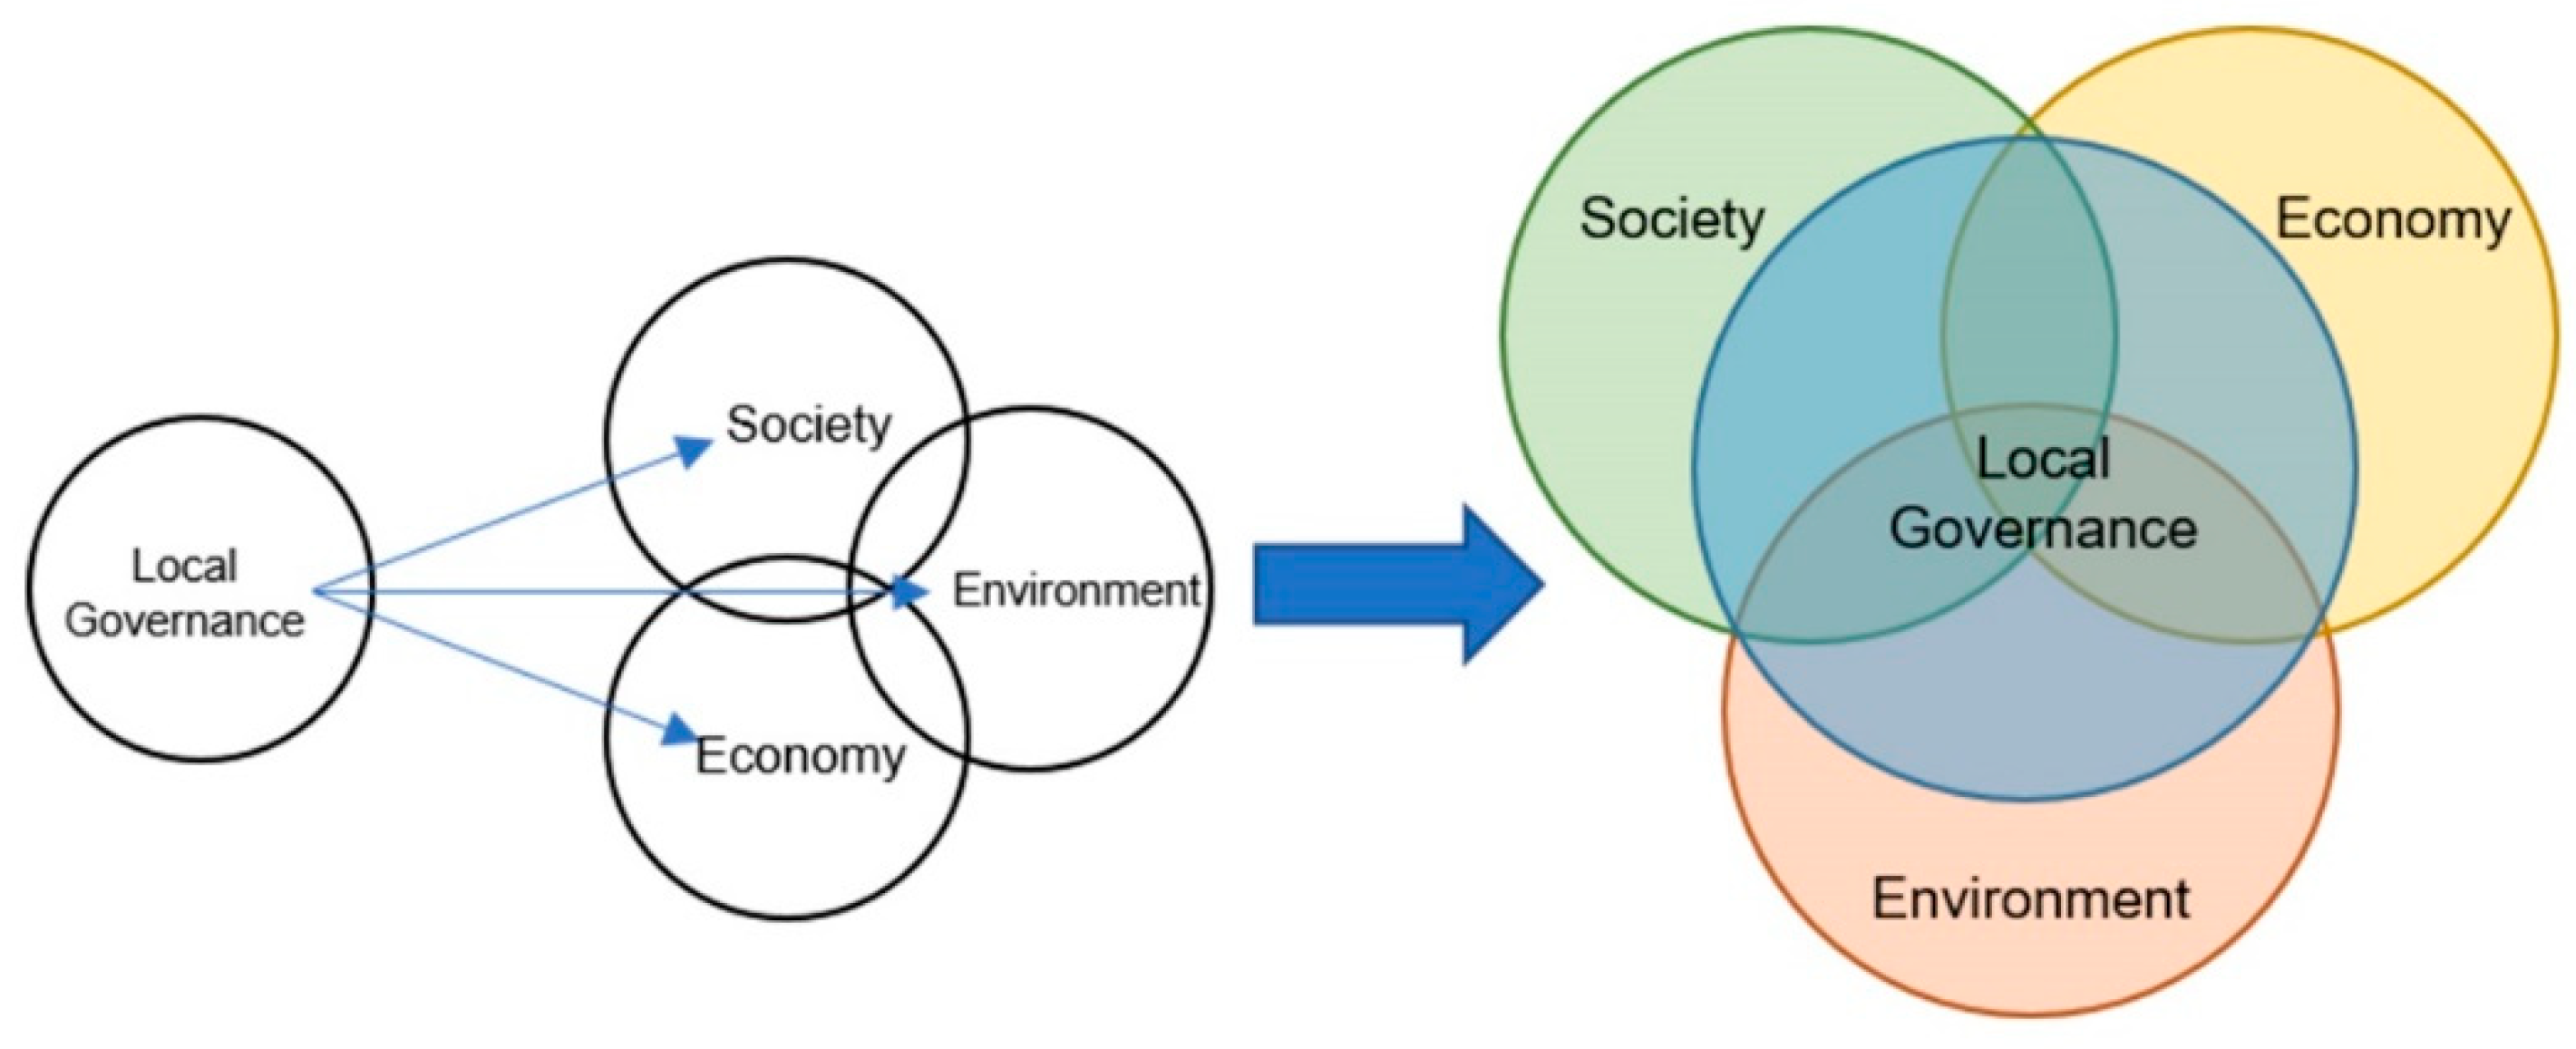
Among these approaches, the three-pillar approach was identified as one of the most explicit sustainability evaluation models in Integrated Environmental and Economic Accounting 2003 [11]. Furthermore, based on this approach, the three-pillar evaluation model has been widely recognized and applied [12]. In further studies, researchers tried to add more evaluation dimensions beyond environment, society, and economy, constituting the developments of this basic evaluation model. Reyes Nieto, Rigueiro, Simões da Silva and Murtinho [13] developed the UISA fEn (Urban Integrated Sustainable Assessment Methodology for Existing Neighborhoods) tool to analyze existing evaluation systems by adding the management dimension, and demonstrated management’s vital function in coordinating the relationship between environment, society, and economy. Alternatively, using the cultural dimension emphasized the trend of social diversification and the protection and utilization of local culture [14]. As the first global city sustainability evaluation system, macro-management, infrastructure, and other dimensions were added to ISO37120: 2018 to establish a more comprehensive sustainable city development evaluation system [15]. However, cities are complex [16]. Sustainable city development involves many aspects, making them have complexity and fuzzification [17]. The interaction of all aspects would affect sustainable development’s practical efficiency and results [18]. Therefore, it is still meaningful to explore the development of the evaluation model and put it into practice, which fully considers cities’ actual situation. Further research makes city governance’s role in sustainable development recognized. When Salmoral, Zegarra, Vázquez-Rowe, González, del Castillo, Saravia, Graves, Rey and Knox [19] analyzed the development problems of Arequipa, Peru, they found that the lack of local governance exposed the city to a severe vulnerability in terms of land and water resources and affected the overall development of the city. According to the research of The European Charter for the Safeguarding of Human Rights in the City, Marsal-Llacuna [20] believed that good local governance played an important role in realizing sustainable city development and coordinating various interest groups.
Since 2010, more than 70 cities have participated in the Low-Carbon Pilot City project. Furthermore, explore pathways to adapt to the sustainable development of different cities. In this process, the pilot city governments began to change cities’ energy mix, promote green buildings and electric cars, and promote infrastructure [21,22,23]. The series of actions formed part of the basis for achieving the goal of supporting China’s carbon neutrality in the future. However, low carbon is not the ultimate goal of sustainable city development. Good city governance can be crucial for China’s cities to achieve sustainable development for more complex problems. In their study of Guiyang, Chung and Xu [24] acknowledged that city governance plays an essential role in balancing the pressure of economic growth and environmental protection for Chinese cities. Deng, Cheshmehzangi, Ma and Peng [25] demonstrated that good city governance could effectively mobilize various stakeholders involved in city development and economic and social resources to participate in sustainable development by studying the latest practices of sustainable city development in China. So, the question concerning how to effectively mobilize the participation of local government and guide and monitor the city’s sustainable development became very important. Rather than simply developing a third-party evaluation tool. Through SD Ind for ZJK, an open and transparent way was explored between local government and experts to express their development demands and opinions in the development process. The goals and paths of sustainable city development can become more explicit, and this is significant to guide and monitor sustainable development.
The three-pillar evaluation model was established based on the three-pillar approach and its development types lay a foundation for the evaluation system of sustainable city development and support the formation of the multi-module evaluation system. These models tend to include several modules (such as building, transportation, water management, energy consumption, air quality, and waste management) [14], and serve one or more of the environmental, social, and economic dimensions. These modules reflect the complex interaction between the various components of the city. The integration of these modules represents the basis for evaluating the sustainability of city development [26,27]. Carbon neutrality leads energy modules to receive more attention due to energy and carbon emissions as a field that attracts widespread concerns globally. Researchers pointed out that energy policy was inextricably linked to sustainable city development and was crucial to achieving development goals [28,29]. Additionally, renewable energy has a significant impact [30,31,32,33]. Senpong and Wiwattanadate [34] explored solar, wind and small-scale hydropower in Krabi Province, Thailand, to improve the status of local sustainability. The data showed that these would bring considerable benefits to the local economy, environmental protection, and energy security. In the Caribbean Islands of Antigua and Barbuda, Karaca, Dincer and Nitefor [35], through simulation, found that rational use of wind and solar energy could effectively solve and improve the region’s energy resilience. Rational energy use is one of the best practices to achieve sustainable city development and carbon neutrality [28,36]. A series of work represented by APEC LCMT (APEC Low-Carbon Model Town) Project has carried out research and practice on city low-carbon sustainable development through energy transformation from energy production, transmission, utilization and storage [37]. Zhen, Huang, Li, Wu and Wang [38] and Zhai, Ma, Gao, Zhang, Hong, Zhang, Yuan and Li [39] analyzed two Chinese cities, Jinan and Tangshan. Through statistical data and simulation analysis, they concluded that renewable energy has positive significance for promoting Chinese cities’ sustainable development. The contributions of the energy transition to urban and rural sustainable development were also made evident [40].
There are still some problems in the development process of the sustainable city development evaluation systems. The developers include different governments, NGOs, industries, and academia, but a transparent and widely consulted development process was not valued [41]. Angelakoglou, Kourtzanidis, Giourka, Apostolopoulos, Nikolopoulos and Kantorovitch [42] attempted to use a comprehensive pool of KPI to build a project-specific indicator list for smart cities energy transition. However, still plagued by subjective factors from experts. Another 41 studies criticized the lack of transparency and stakeholder involvement in developing such evaluation systems [43]. In most cases, the selection of indicators was vague or lack of communication with local government [44,45]. Cities’ demands and strategies were difficult to take seriously [46]. Although relevant experts’ supports are needed, the neglect of cities’ demands and realities leads to inappropriate evaluation systems. Alternatively, evaluation systems are market-oriented and do not respond to local needs and priorities [47]. Another issue is weighting. The addition of weight is an effective way to balance various factors. Nevertheless, weights will make people pay more attention to indicators with higher weights [48]. The cases of LEED-ND (LEED for neighborhood development) showed that indicators that require substantial financial supports (such as affordable housing, energy efficiency, and water efficiency) were often overlooked [49]. On the other hand, weighting is also the most controversial part, since it is challenging to compare and rank different indicators [50]. The influence of experts’ opinions on weighting is often decisive and makes it a challenge to consider the views of city managers or other stakeholder requirements [51], which often leads to severe disagreements [52]. Sharifi and Murayama [45] compared seven evaluation tools for sustainable city development. They pointed out that the evaluation systems with weights often aimed to obtain aggregate sustainable development indexes or had similar goals. However, the evaluation systems such as HQE2R and Ecocity mainly showed the performance of each module, so there was no direct weighting for indicators, thus reducing the influence of subjective factors [45]. In addition, SDG Indicators and ISO37120: 2008, as guiding evaluation systems for global sustainable development, did not have weighting but tended to monitor development performance.
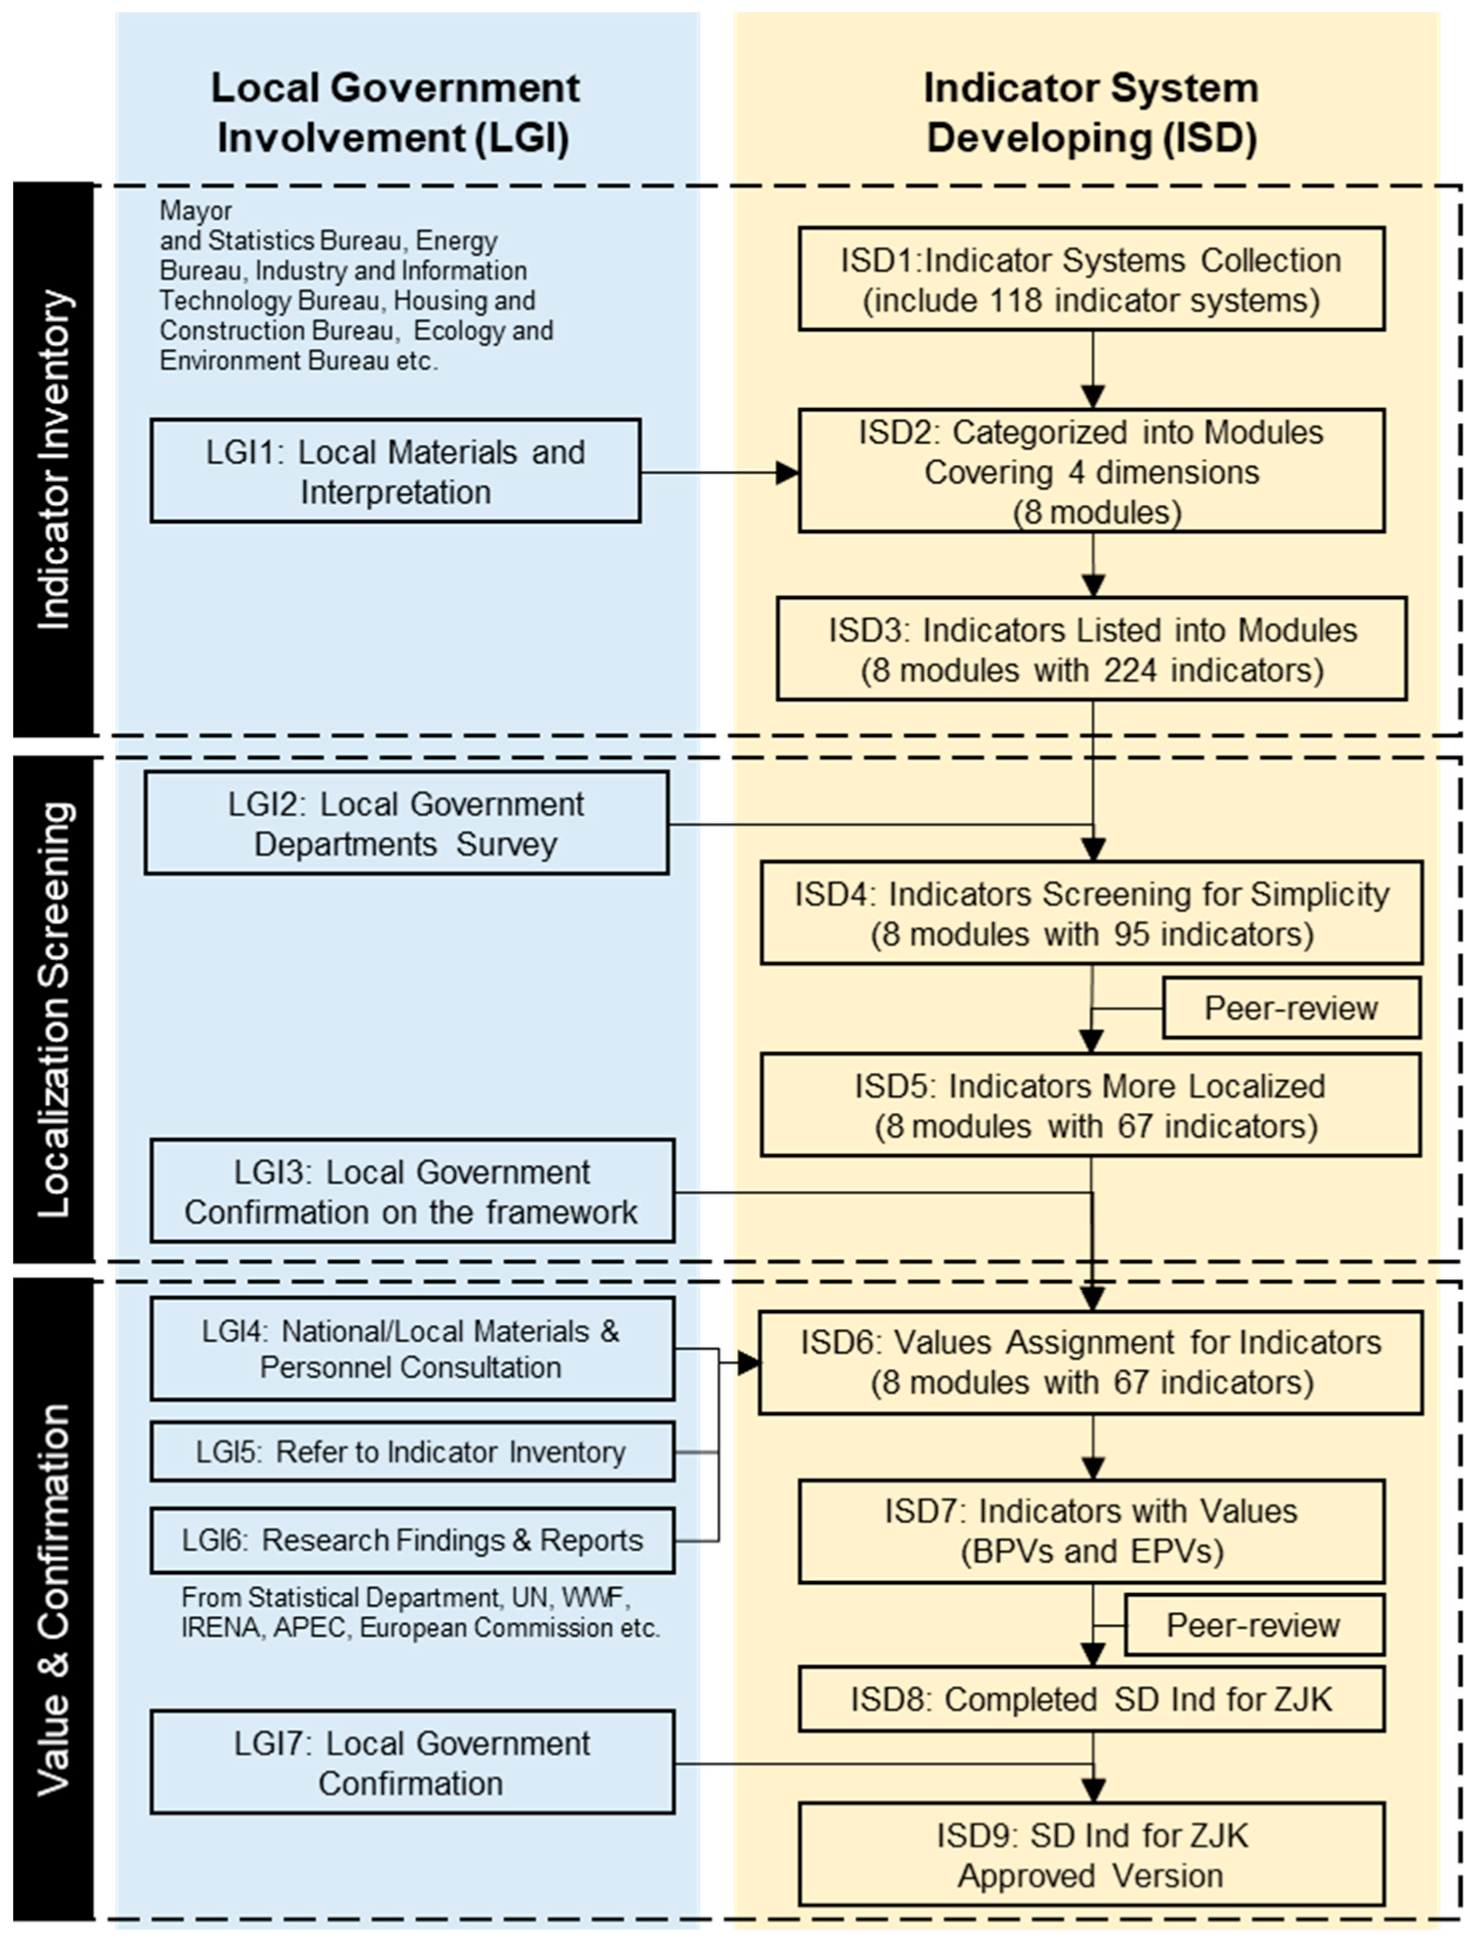
Sustainable Development Indicators for Zhangjiakou (SD Ind for ZJK) attempted to guide and monitor how to realize sustainable city development in the critical period of Zhangjiakou city, especially in the 14th FYP period. Zhangjiakou needs to consider coordinating the construction of the Water-conservation and Ecological-environmental Support Area of Capital (Two Areas) and the National Renewable Energy Demonstration Zone in the post-Winter Olympics era. Other considerable development tasks are consolidating its anti-poverty achievements and enhancing its international influence. We accepted the authorization of the Zhangjiakou Municipal Government. Through in-depth communication with city management departments and experts, we accurately understood Zhangjiakou’s development tasks in the future. Moreover, we reviewed 118 city sustainability evaluation systems, and based on our understanding of these tasks, formed the indicator inventory and our indicators system.
The paper was organized into four sections. The Section 1 introduced the evaluation model of SD Ind for ZJK and the working flow. In the Section 2, based on the local demands of Zhangjiakou, the indicator framework was established. Moreover, the indicator system development process was described. The Section 3 gives the indicators in each module and their value. In the Section 4, discrepancy and resolution were explained, and limitations were discussed. Since cities have common or similar sustainable development goals, this paper can provide a reference.

2. Methodology

2.1. Evaluation Model Integrated Local Governance

The evaluation model that SD Ind for ZJK used is a model that integrated local governance dimensions. The evaluation model was developed based on understanding the existing approaches and evaluation models of sustainable city development. Local governance plays a critical role in improving city sustainability. Especially in China, local governance has a profound impact on policy-making, environmental protection, social management, industrial support, and resource allocation. Therefore, based on Zhangjiakou’s actual situation and development needs, we developed an evaluation model integrating local governance based on the three-pillar evaluation model l (as shown in Figure 1). As the basis of developing SD Ind for ZJK, this new evaluation model aims to fully play the role of local governance in sustainable city development and guide and evaluate urban development comprehensively and reasonably through local governance dimensions. For this reason, the selection of modules, submodules, and indicators for evaluation will take this objective into account.

2.2. Interactive Decision-Making Process

The interactive decision-making process adopted in this paper is iterative and requires the local government’s active involvement and peer-review during the development of the indicator system. The interactive developing process consists of three steps. We worked closely with the Zhangjiakou city government to construct an evaluation system that thoroughly considered local development and integrated global city development goals. The interaction with the Zhangjiakou government enabled us to understand better the development demands and the specific development goals and difficulties. It also made the assignment of indicators more rational and understood by the local government. In addition to the cooperation with local governments, peer-review was introduced to ensure the scientificity of the indicator system. The peer-review invited university professors, researchers, and former government officials to give suggestions and opinions. They have knowledge and decision-making experience in either the public or private sectors and were classified by their professional fields (such as energy, construction, transportation, industry, social management) and divided into external and local experts. Special seminars were used to resolve differences among experts. Experts had opportunities to exchange their views to reach a consensual outcome. Consultation with other relevant experts and data-based judgment were used to resolve unresolved disagreements. This ensured input from all parties and information. Therefore, indicator screening, value assignment, and confirmation were built upon the basis of complete exchanges and relatively broad consensus.
An indicator inventory applied in this paper builds on reviewing an extended variety of evaluation systems and research findings to capitalize on experiences and lessons learned and further improve the selection process’s transparency and objectivity. A total of 118 evaluation systems and research reports from international organizations, initiatives, and strategic plans provided the foundation for indicator inventory establishment. The indicator systems information mainly came from ISO/TR37120:2017 [53], and other systems released after 2017 (such as ISO37120:2018 [15], LEED for Cities and Communities [54]) were collected from official websites. We screened various indicators based on the frequency of indicator occurrence (no less than 10:1) during this process. Before identifying potential indicators that can monitor and guide the development of Zhangjiakou city, the most critical aspects need to be defined. These aspects can help to ensure that relevant modules, which cover four dimensions of the evaluation model integrated local governance (shown in Figure 1 and Figure 2), can be selected. Before this, development proposals and local interpretation were collected from the mayor of Zhangjiakou and the city management departments formed the modules. The indicators we selected in the box ISD1 were assigned to one module (box ISD3 in Figure 2) and formed the indicator inventory.
Localization screening was based on the applicability and accuracy requirements of the evaluation system and aimed to get a more localized indicator list. The local government was involved through a survey (box LGI 2 in Figure 2) and the indicators in each module would be analyzed. The indicators that do not meet the requirements will be removed. The result of localization screening (box ISD4 in Figure 2) needs to be peer-reviewed and confirmed by the local government.
The indicators were assigned values according to information we collected from various channels (box LGI4, LGI5, LGI6 in Figure 2). Assignments were divided into basic performance value (BPV) and excellent performance value (EPV) to distinguish different development goals. BPVs represented the basic development goal and special plans for the 14th Five-Year Plan, which were the fundamental sustainable development goal. EPVs represented the best or ideal sustainable development levels that Zhangjiakou could achieve and considered historical data. After peer-review, SD Ind for ZJK needed to be confirmed by the Zhangjiakou government and finally formed the approved version (box ISD9 in Figure 2).

3. Indicator Framework Based on Local Demands

3.1. Interpretation of Local Demands

Zhangjiakou is a medium-sized city in the northwest of Hebei Province, adjacent to Beijing, and it will co-host the 2022 Winter Olympic Games. Zhangjiakou covers an area of 36,700 square kilometers, with a population of 4.65 million and a GDP of 11.51 million RMB in 2019 [55]. The development foundation of Zhangjiakou is still relatively weak.Although the city’s residents have achieved the goal of poverty alleviation by 2020, the problems of the unreasonable economic development structure and unbalanced development between urban and rural areas still exist.
Zhangjiakou was selected as the only nation-level Renewable Energy Demonstration Zone in China in 2015. Benefiting from abundant renewable energy resources, Zhangjiakou has 30 million kilowatts of solar energy and 40 million kilowatts of wind energy potential [56]. In 2017, renewables accounted for 73% of the total installed capacity in Zhangjiakou and around 45% of the total electricity output [57]. In 2020, renewable energy consumption in Zhangjiakou accounted for 30% of total terminal energy consumption [58]. However, the consumption capacity of local renewable energy power is insufficient. The output of renewable energy and the consumption capacity of local renewable energy are still one of the main bottlenecks affecting the development of renewable energy [59].
The development of Zhangjiakou is influenced mainly by policies and surrounding cities. The effective policies are the Two Area and the Urban System Planning of Hebei Province (2016–2030). The former calls for increasing the proportion of forests and grasslands and restoring or protecting various natural ecosystems [60] to improve Zhangjiakou and Beijing’s ecological environment quality. Moreover, the latter leads to the closure or relocation of many traditional industrial projects [61]. On the other hand, Zhangjiakou is an energy-transfer city. According to a WWF [59] study, Zhangjiakou sent 39% of its energy to other cities.

3.2. Indicator Framework

SD Ind for ZJK was developed to monitor the sustainable city development of Zhangjiakou. The evaluation systems were developed to promote knowledge and experience exchange and cooperation among cities for sustainable development. Therefore, we reviewed different monitoring frameworks proposed by a variety of sources. A total of 118 evaluation systems and research reports from international organizations, for example, ISO37120:2018 [15], ISO37121:2017 [53], WWF [59], IRENA [57], APEC [37], EU [1], USGBC [54], CASBEE [62] and initiatives and strategic plans, for instance, UN’s SDG Indicators [63] provided the foundation of indicator inventory establishment. Many of them were widely used or recognized by international organizations in terms of evaluation systems. Literature documents with duplicated information had been excluded from the final references.
The most critical aspects that could monitor and guide the development of Zhangjiakou city were defended through materials review and interviews. The mayor and city management departments (such as the Statistics Bureau, Energy Bureau, Industry and Information Technology Bureau, Housing and Construction Bureau, Transportation Bureau, Ecology and Environment Bureau) provided the information on city demands and development strategies. On this basis, the critical development tasks of Zhangjiakou city in the 14th FYP period became clear and eight task modules (M) were concluded. They were Energy and Carbon Emission (M1), Resources and Environment (M2), Harmony and Well-being (M3), Economics and Inclusion (M4), Key Industry (M5), Innovation and Smart (M6), Governance and Efficiency (M7) and City Internationalization (M8). These eight modules constituted the framework of the indicator inventory and SD Ind for ZJK and covered the four dimensions of the evaluation module (Figure 1). This initial screening process resulted in an inventory of 8 modules and 224 indicators that can potentially be adopted by SD Ind for ZJK, covering the concluded eight modules and all reviewed indicators included were analyzed and assigned to one of the eight defined modules.
The second step was localization screening and obtaining a concise and localized indicator list. The indicators which (a) were unavailable or unclear defined; (b) had overlapped evaluation scope; (c) cannot be applied at the city level (e.g., employment at a national level); (d) applied to other climate zones or coastal cities; (e) were not applicable to Zhangjiakou current development situation (e.g., poverty incidence); and (f) were technology-specific were excluded. The reason for this action was to facilitate the next step, which included the detailed evaluation of each indicator by the local government to ensure that a filtered indicator list, including only highly relevant indicators, would be chosen in the final indicator system. Moreover, similar indicators (e.g., using utilizing different units of measurement or different terminology) were included only once in the list. This round highly reduced the total number of indicators included in the list. We tended to choose intensity indicators or per capita indicators which, on the one hand, was the need to investigate the quality of development. On the other hand, it was also to minimize the problem that the total indicator value was too large due to Chinese cities’ size and to create a good foundation for comparing development levels between cities.
Then, the rest part of the indicator inventory was made into a questionnaire to consult the Zhangjiakou city management departments (such as the Statistics Bureau, Energy Bureau, Industry and Information Technology Bureau, Housing and Construction Bureau, Transportation Bureau, Ecology and Environment Bureau) (box LGI2 in Figure 2). The process made each indicator in the list receive a score from 0 (minimum score) to 5 (maximum score). In the second round, the indicators with high scores were mainly reviewed. A cut-off rule of a minimum score of 3 points was set for all indicators to be considered for selection. If two indicators served the same object, the one with the highest score was selected. After this, the indicator inventory became an indicator list composed of 95 indicators. A peer-review process was introduced to get more scientific opinions. The indicator list consisting of 67 indicators in 8 modules was obtained and confirmed by the Zhangjiakou government based on the feedback from those departments and peer-review.
SD Ind for ZJK took 2025 as the target year, and the indicators’ values which were the development goals, were assigned according to China’s and local development goals, planning and implementation, especially Zhangjiakou’s development strategy, statistical data, and research papers. In addition to the materials above, we also obtained support from the Zhangjiakou Municipal Government, for example, the expected growth rate of GDP, the proportion of green buildings, and talent policy information. For the goals that could not be predicted directly, for instance, the increase rate of external tourists, we determined the goals by referring to the development of cities of the same type. Most indicators had two assigned values, namely BPV and EPV. The BPVs were given as achievable goals during the 14th FYP, while the EPVs were given towards carbon neutrality or were determined based on the over fulfillment of various planning and the optimal development scenarios. Some indicators that did not have EPV were difficult to have higher or lower values due to natural conditions or had reached the maximum threshold. For example, in Ind12, due to climate reasons and the protection of grassland and forest land, the cultivated land area in Zhangjiakou would not increase significantly, and the current number was hard to be changed, so it did not have EPV.
This value assignment process resulted in an indicator system that had eight modules, 224 indicators with BPVs and EPVs. After peer-review, the Zhangjiakou government confirmed SD Ind for ZJK approved version (the box ISD9 in Figure 2).

4. Explanations on Valued Indicators

Different indicators adopt different bases for assigning values. 2025 was the target year, and various documents and data were used to determine the results of the indicator assignment. The documents included: (a) research reports from international organizations [57,59]; (b) Chinese laws, regulations, standards, and administrative orders [60,64,65,66,67,68]; (c) national or provincial development plans, specific planning, or reports [60,61,69,70,71,72,73,74,75,76]; (d) Zhangjiakou City’s development plan, special planning, and work reports [77,78,79,80,81,82,83,84,85,86]; (e) statistical yearbooks and other statistical data [55,87]. We conducted a reasonable estimate through research and consultation with relevant management departments and experts (f) for the indicators, which could predict directly. Finally, all of the assigned values were peer-reviewed and approved by the Zhangjiakou municipal government. The indicators’ assignment basis types can be seen from Table 1, Table 2, Table 3, Table 4, Table 5, Table 6, Table 7 and Table 8.

4.1. Energy & Carbon Emission (M1)

The Energy and Carbon Emission (M1) consists of four submodules (Energy Supply, Energy Consumption, Clean Energy Promotion, and CO2 Emission) and nine indicators (in Table 1). The values assigned to each indicator of the M1 module referred to the optimization results of energy consumption structure in Zhangjiakou during the 13th Five-Year Plan period and combined with appropriate development plans. For example, Ind2 showed that in 2019, Zhangjiakou would mainly use photovoltaic and wind power as two forms of clean energy, accounting for about 71.3% [55]. According to relevant policy documents and planning documents, the proportion would reach about 83.5% by 2025 [77,78]. Therefore, the BPV and EPV of Ind2 were set at 80% and 85%, respectively, which combined experts’ opinions and local management departments.
The actual development situation of Zhangjiakou was also a key factor affecting the results. For example, in the assignment process of Ind7, we learned that by 2025, the clean heating rate in urban areas and county towns would reach 100% and 70% separately, while that in rural areas would only reach about 40% [78]. We learned from Zhangjiakou Energy Bureau that there were many pastoral areas in Zhangjiakou, and the existing clean heating solutions cost a lot and do not match the production and life style of herders. Therefore, the selected BPV was 40%, while the EPV was only 45%. As a demonstration area of renewable energy, Zhangjiakou’s development potential and performance in the renewable energy field are outstanding. However, local natural conditions and levels of economic development limit the level of renewable energy utilization SD Ind for ZJK took these factors into full consideration in the selection and assignment of indicators.

4.2. Resources and Environment (M2)

As shown in Table 2, the module Resources and Environment (M2) comprises of four submodules: Watershed and Ecology, Environmental Quality, Transportation, and Sustainable Building and Construction and 11 indicators. Since Zhangjiakou city is an integral part of the Two Areas, the selection of indicators in this module remained in the same direction as the construction of the Two Areas, rather than simply setting the evaluation submodules as water, air and soil and assigning values. In the process of indicator confirmation, we accepted the experts’ advice on Ind13. Considering the requirements of protecting the grassland ecology in Zhangjiakou and reasonably improving the forest coverage rate, we reduced the targets of BPV and EPV to 50% and 55%, respectively.
On the other hand, the key indicators of the built environment in built areas were paid attentions, and the transportation and building indicators were introduced to evaluate the impact of human activities on the urban environment. Due to policy changes in China, the green building requirements had become a relatively mandatory design standard. However, the information obtained from the local management departments showed that the policy was still in transition stage. The selection of Ind19 emphasized the implementation of this policy and encouraged construction projects to apply for green building certification, including GBL (Green Building Label) in China and LEED from the United States.

4.3. Harmony and Well-Being (M3)

The module Harmony and Well-being (M3) consists of four submodules and 11 indicators. Relying on e-commerce and characteristic industries is shown in the Table 3. Zhangjiakou has achieved overall poverty alleviation. In the 14th Five-Year stages, city development would consolidate the development achievements and promote the coordinated development of urban and rural areas. But the problem of coordinated urban and rural development still needs attention [55]. Therefore, M3 guides and monitors the flow of city resources through percentage and per capita indicators from the rural areas, health, well-being, and education to support the development of the social sphere and improve people’s lives.

4.4. Economics and Inclusion (M4)

Two submodules and six indicators of module M4 Economics & Inclusion are shown in Table 4. Unlike the module M5 Key Industry, M4 mainly focuses on macro data monitoring. Referring to the development experience of similar cities in China, took GDP in 2020 as the base, 6.5% growth rate was taken as the BPV of GDP, and took 7.6% as the growth rate of the EPV in 2025. Therefore, the BPV and EPV of GDP were 220 billion RMB and 230 billion RMB in 2025. We determined other macro development goals based on experts and city management departments opinions and historical development data of Zhangjiakou and other similar cities.

4.5. Key Industry (M5)

Key Industry (M5) is unique, consisting of seven submodules and 11 indicators (Table 5). The seven industries represented by the submodule were determined by considering Zhangjiakou’s development foundation and advantages and approved by the Zhangjiakou government and experts. For example, thanks to co-hosting the Winter Olympics, Zhangjiakou was likely to expand its industry scale to 60 billion RMB by 2025 by developing ice-snow tourism and sports products [86]. The other six industries also promoted the development of related industries using policy, climate, and cultural advantages, respectively.

4.6. Innovation and Smart (M6)

Innovative and smart cities development are the fields that have attracted attention in recent years, and these two themes are also essential contents to promote sustainable city development, so industry experts and Zhangjiakou Municipal Government have emphasized these two themes. Therefore, the M6 introduced five indicators from the perspectives of innovation promoting economic development and applying smart city technology to improve government services. This module would also help governance make contributions to city management.

4.7. Governance and Efficiency (M7)

Governance plays a vital role in city economic and social development in China. As an essential pillar of SD Ind for ZJK, a module was set up specially. The M7 used four submodules to promote an excellent social environment, through the law enforcement administration and public security, and create a foundation for efficient government governance. By regulating the government’s behavior, government efficiency would be improved and creates a suitable economic and social development environment. Public participation could improve grassroots management ability and governance level by monitoring grid management. At the same time, good governance could also create conditions for enhancing international influence.

4.8. City Internationalization (M8)

Co-hosting the Winter Olympic Games has brought Zhangjiakou many opportunities for international communication and exposure in the international media and enhanced the city’s international influence. It is also the desire of the Zhangjiakou Municipal Government to enhance the city’s international influence. The promotion of international influence is directly related to the city’s management level and economic development. In addition to building an excellent social environment and guiding the city’s exposure rate in the international community to promote the city’s influence through the M7 module and the M8-1 submodule; the M8-2 module helps the government to promote the activities of foreign exchanges through the evaluation of foreign economic and trade data.

5. Discussion

As an indicator system for sustainable city development, the carbon emission indicator is one of the core issues. In the process of formulating the indicator system, experts had more discussions on this point. In the end, however, there were disagreements among the experts. The authors chose per capita carbon dioxide emission, one of the global measures of carbon emissions [88]. According to the WWF research report on Zhangjiakou [59], per capita carbon dioxide emission in Zhangjiakou city should be between 9.4 and 6.5 tons by 2025. Moreover, one should determine the initial BPV and EPV, i.e., 9.4 tons/person and 6.5 tons/person. During expert consultation and charrette, the selection of BPV was considered reasonable. Nevertheless, some experts thought EPV was too radical for Zhangjiakou’s city development level. The EPV should be raised to around eight tones, but some experts opposed it.
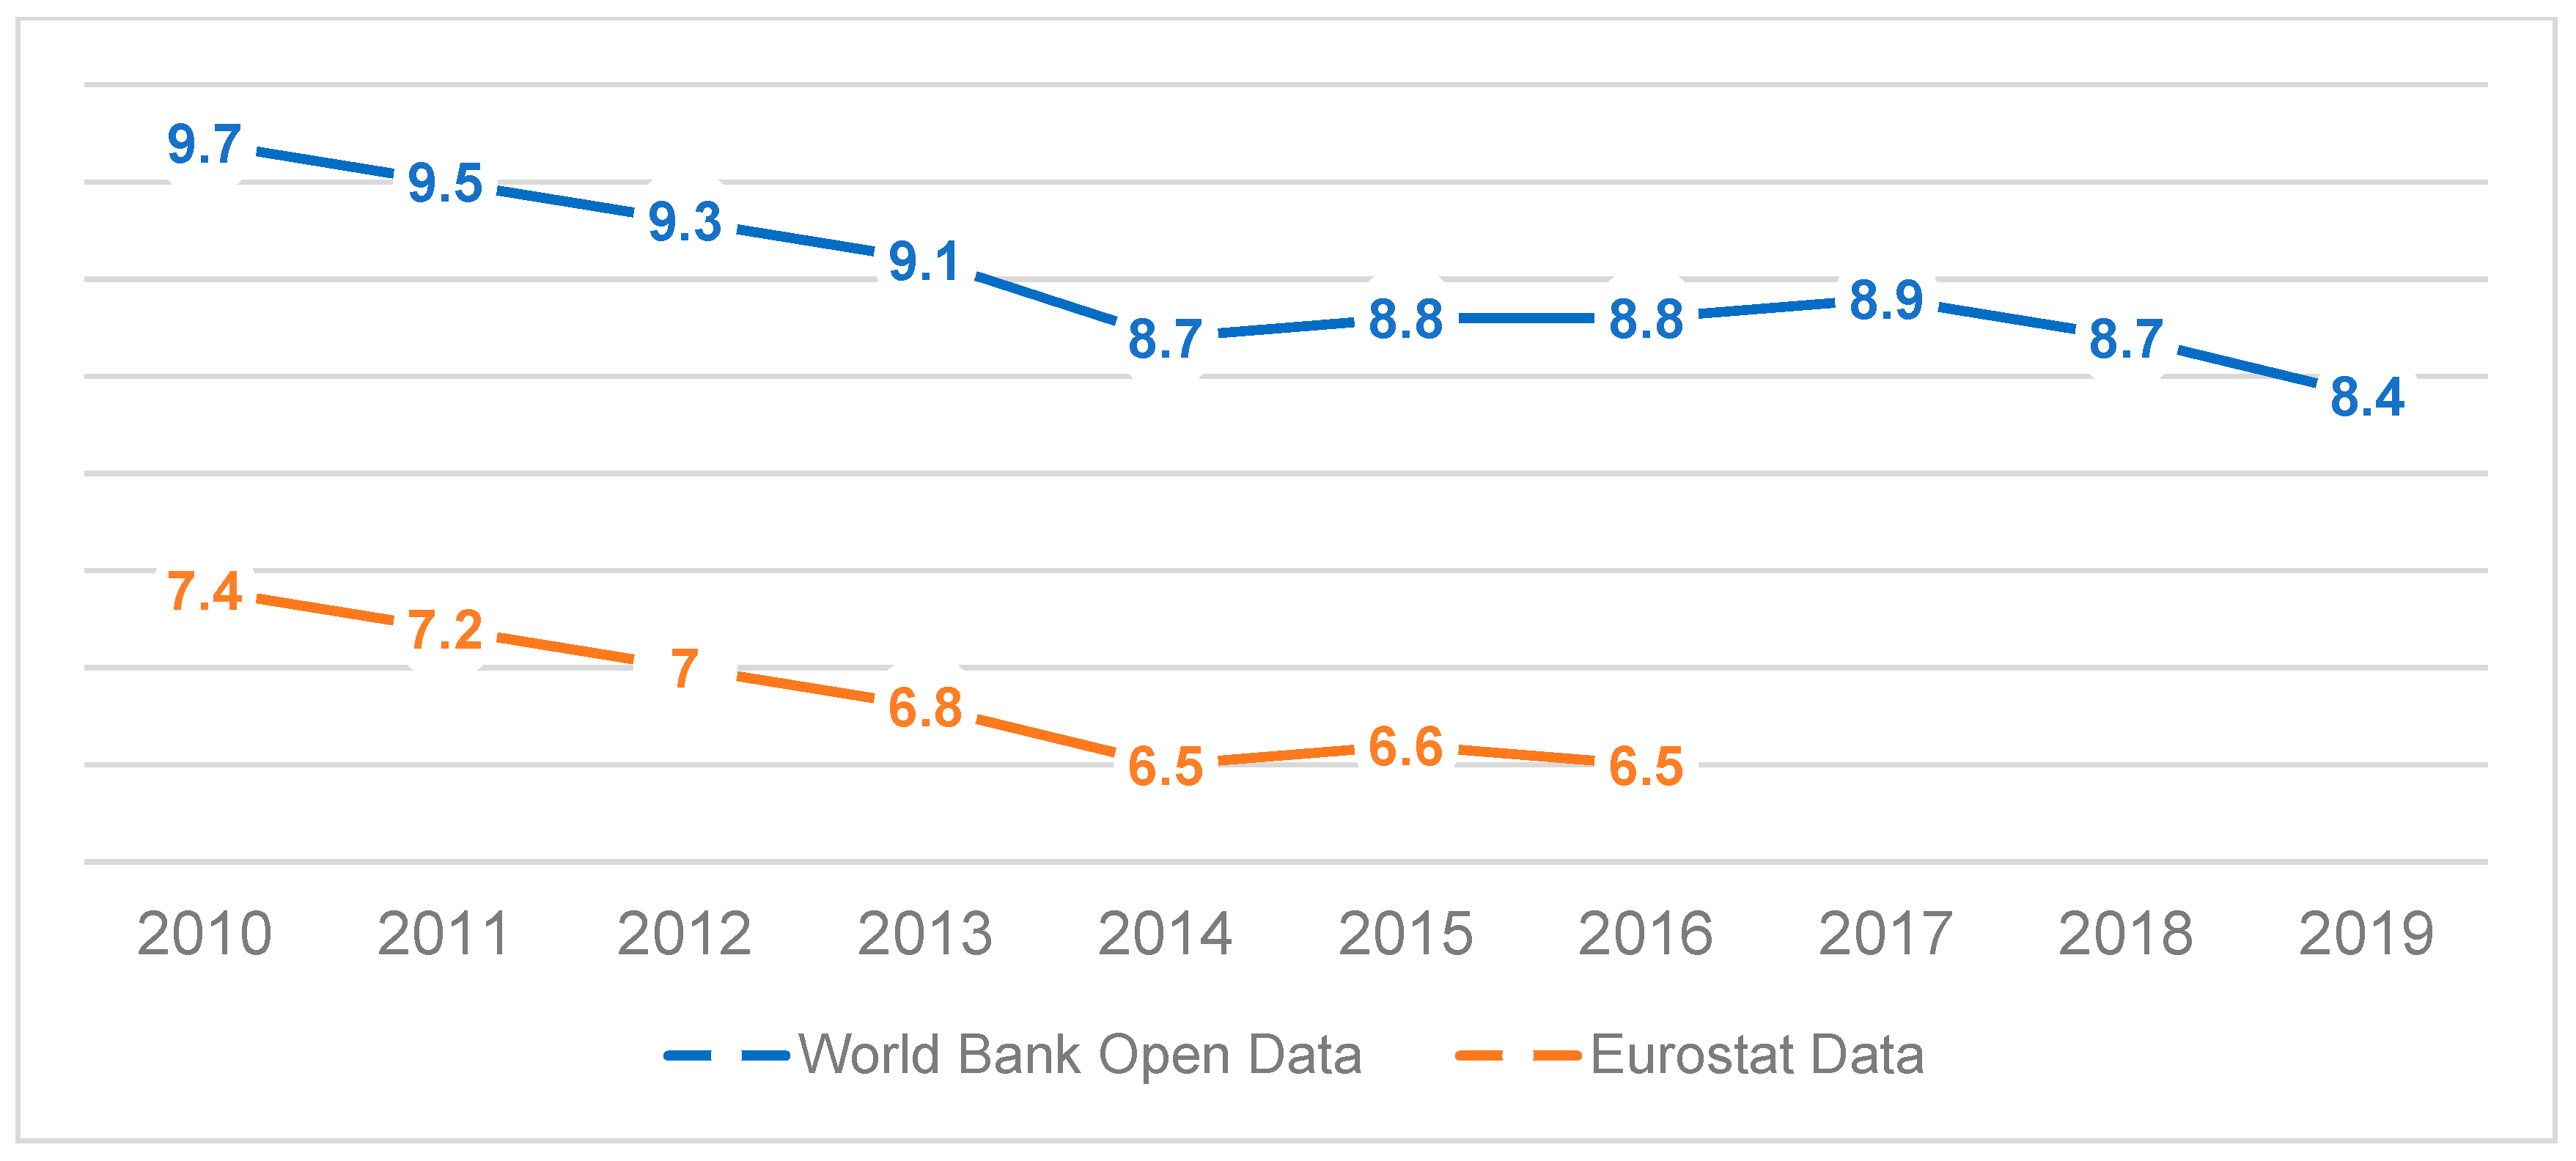
Such disagreement puts the authors in a relatively awkward position. Since the per capita carbon dioxide emission was the key indicator, it needed a reasonable EPV. The authors did a comparative study. According to research by Dadi Zhou [89] and Yongda He [90], per capita emissions of Hebei province should be below 9 tons by 2025, or close to current European Union levels. Public data from the World Bank [91] and Eurostat [92] showed that the current value should be below 8.4 tons (shown in Figure 3). Other researchers believed that China’s per capita carbon dioxide emission in 2025 would be between 7.3 to 8.3 tons [93,94].
Based on the research findings of international and domestic researchers and institutions, we decided that by 2025, the EPV of per capita CO2 emission would be 8.3 tons. The local government approved the result. However, it should be noted that as part of a future-oriented city indicators system, the performance values may need to be updated when more reliable research achievement is available.
Zhangjiakou is an inland city in China. As a result, in SD Ind for ZJK, the indicators only applicable to waterfront cities were not selected. This point should be considered when waterfront cities formulate city sustainability evaluation systems. In addition, as the only nation-level Renewable Energy Demonstration Zone in China, Zhangjiakou’s performance in city renewable energy production and utilization is better than in other cities. Even related industries are better than other cities. Other cities should consider Zhangjiakou’s unique policy environment when selecting indicators to guide and promote renewable energy development. This point also inspires the formulation of appropriate implementation plans based on the indicator system (i.e., policy tools, evaluation indicators, and implementation plans should be consistent).
Through SD Ind for ZJK project, the authors believe that Zhangjiakou has its particularity, but it should not be alone. How to identify and classify similar cities based on indicators of the natural environment and socio-economic development should be part of future work. The classification will make city managers more confident about introducing certain policy tools and development experience. On the other hand, the effective identification of city types will provide some basis for other research and work, such as using relatively objective methods to determine the weight of indicators or establishing a targeted city sustainability database to support more research in the future. On this basis, how to use the research results and findings of sustainable city development will become more evident.

6. Conclusions

Sustainable city development is the result of the positive interaction of many aspects. Energy transition, governance, innovation, coordinated development, environment, and inclusion are all integral parts of a sustainable city (even the most essential parts of some cities). This variety of aspects circulates around the cities’ demands, which causally related to citizens’ needs. Therefore, the success of a sustainable evaluation system needs to be achieved through a specific and customized indicator system. Indicators need to be defined according to the scope of the specific city developing strategies and demands.
One of the core goals of this paper is to provide a method of establishing an indicator system using a scientific procedure that integrates the cities’ demands, local governance, and the evaluation system on sustainable city development to promote applicability. SD Ind for ZJK was developed with international and localized perspectives. The evaluation model integrating local governance based on the three-pillar evaluation model and the interactive decision-making process can form an interactive decision-making mechanism to promote the participation of stakeholders in sustainable city development. As a result, the eight-module indicator framework explored and practiced the method and formed the foundation for subsequent work. On the other hand, in addition to the transparent and inclusive establishment process of the framework, exploring a reasonable indicator localization screening procedure is another core goal that can provide reference and guide to developing sustainable city evaluation systems integrated with city-special demands. The extensive indicator inventory formed after a review of 118 relevant sustainable city evaluation systems and a final indicator list selected based on a reasonable procedure for increasing adaptability of results can provide a reference for the development process of a similar system. Compared to the indicator inventory with 224 indicators, the result of 67 indicators provides a decent balance between monitoring feasibility and convenience and quantity of the critical relevant indicators. Thus, the method helped us get a succinct and comprehensive indicator system for monitoring the impact of sustainable city development policies and improving understanding of city dynamics. Thirdly, exploring a way to consider future development goals and remind of policy or technical obstacles. BPVs and EPVs were given to indicators. Compared with BPVs, EPVs targets consider different scenarios that may occur in the future, such as achieving carbon neutrality, overfulfilling development plans, or more optimistic development outcomes. Setting EPVs can, on the one hand, monitor the status of the impact of sustainable city development. On the other hand, in determining that BPVs and EPVs indicators cannot be set directly, communication with local governments and experts can more accurately identify weaknesses or development bottlenecks in sustainable development, showing the significance and necessity of the interactive decision-making process.
We strive as objectively as possible in the whole process. The results were peer-reviewed and agreed by the local government, nevertheless, there is still a degree of subjectivity involved. Due to the divergent management of indicator scoring and assignment process, subjective factors were inevitably introduced but aimed to respond to Zhangjiakou’s needs. Zhangjiakou is an inland city with a special policy environment. These factors influence the selection of indicators. Geographical factors and policy environment should be considered when ZJK’s SD Ind is used as a reference for developing other indicator systems. This paper does not discuss how to identify cities similar to Zhangjiakou, which should be part of the consequent work. The identification and classification will give city managers more confidence to introduce evaluation indicators, policy tools and development experience. Moreover, provide a certain basis for other research and work.

Author Contributions

Conceptualization, L.Z. and C.W.; methodology, N.H.; supervision, L.Z.; investigation, N.H. and C.W.; writing—original draft, C.W.; writing—review and editing, visualization, C.W. and Z.Y.; project administration, Y.F.; All authors have read and agreed to the published version of the manuscript.

Funding

This paper is completed with financial support from the Zhangjiakou Government (2020GFW-0398); Key research and development project in Tianjin (20YFYSGX00020); Science and technology service network initiative of Chinese academy of sciences (KFJ-STS-QYZD-2021-02-006). We would like to thank all research team members, peer-review experts, and others who worked on this project.

Institutional Review Board Statement

Not applicable.

Informed Consent Statement

The authors declare that they have no known competing financial interests or personal relationships that could have appeared to influence the work reported in this paper.

Data Availability Statement

Not applicable.

Conflicts of Interest

The authors declare no conflict of interest.

Acronyms

BPVBasic Performance Values
EPVExcellent Performance Values
FYPFive-year Plans
HQE2RHQE refers to French guidelines for sustainability in building (Haute Qualité Environnementale), but at the neighbourhood level, Economic and other social factors implicated in Regeneration (hence the acronym HQE2R).
ISDIndicator System Developing
LGILocal Government Involvement
NGONon-Governmental Organization
SD Ind for ZJKSustainable Development Indicators for Zhangjiakou

References

  1. European Commission. How Will Climate Change Affect Cities, and How Can They Take Action? 2019. Available online: https://urban.jrc.ec.europa.eu/thefutureofcities/climate-action#the-chapter (accessed on 8 October 2021).
  2. UNFCC. Urban Climate Action Is Crucial to Bend the Emissions Curve. 2020. Available online: https://unfccc.int/news/urban-climate-action-is-crucial-to-bend-the-emissions-curve (accessed on 8 October 2021).
  3. Papageorgiou, A.; Henrysson, M.; Nuur, C.; Sinha, R.; Sundberg, C.; Vanhuyse, F. Mapping and assessing indicator-based frameworks for monitoring circular economy development at the city-level. Sustain. Cities Soc. 2021, 75, 103378. [Google Scholar] [CrossRef]
  4. Comadon, A.; Daams, M.; Garcia-López, M.; Veneri, P. Divided Cities: Understanding Income Segregation in OECD Metropolitan areas, Divided Cities Understanding Intra-Urban Inequalities; OECD Publishing: Paris, France, 2018. [Google Scholar]
  5. Evans, J.; Jones, P. Rethinking Sustainable Urban Regeneration: Ambiguity, Creativity, and the Shared Territory. Environ. Plan. A Econ. Space 2008, 40, 1416–1434. [Google Scholar] [CrossRef] [Green Version]
  6. Doughty, M.R.; Hammond, G.P. Sustainability and the built environment at and beyond the city scale. Build. Environ. 2004, 39, 1223–1233. [Google Scholar] [CrossRef]
  7. Berardi, U. Sustainability assessment of urban communities through rating systems. Environ. Dev. Sustain. 2013, 15, 1573–1591. [Google Scholar] [CrossRef]
  8. APEC Policy Support Unit. Partnerships for the Sustainable Development of Cities in the APEC Region. 2017. Available online: https://www.apec.org/publications/2017/06/partnerships-for-the-sustainable-development-of-cities-in-the-apec-region (accessed on 6 June 2020).
  9. APEC. 2015 Leaders’ Declaration. 2015. Available online: https://www.apec.org/meeting-papers/leaders-declarations/2015/2015_aelm (accessed on 12 December 2021).
  10. Rainey, D.V.; Robinson, K.L.; Allen, I.; Christy, R.D. Essential Forms of Capital for Achieving Sustainable Community Development. In Achieving Sustainable Communities in a Global Economy: Alternative Private Strategies and Public Policies; World Scientific: Singapore, 2004; pp. 159–178. [Google Scholar]
  11. United Nations; European Commission; International Monetary Fund; Organisation for Economic Co-operation and Development; World Bank. Integrated Environmental and Economic Accounting 2003; United Nations: New York, NY, USA, 2003. [Google Scholar]
  12. Clune, W.H.; Zehnder, A.J.B. The Three Pillars of Sustainability Framework: Approaches for Laws and Governance. J. Environ. Prot. 2018, 09, 211–240. [Google Scholar] [CrossRef] [Green Version]
  13. Nieto, J.E.R.; Rigueiro, C.; Simoesdasilva, L.; Murtinho, V. Urban Integrated Sustainable Assessment Methodology for Existing Neighborhoods (UISA fEN), a New Approach for Promoting Sustainable Development. Sustain. Dev. 2018, 26, 564–587. [Google Scholar] [CrossRef]
  14. Ameen, R.F.M.; Mourshed, M.; Li, H. A critical review of environmental assessment tools for sustainable urban design. Environ. Impact Assess. Rev. 2015, 55, 110–125. [Google Scholar] [CrossRef]
  15. ISO 37120:2018; Sustainable Cities and Communities—Indicators for City Services and Quality of Life; International Standardization Organization: Geneva, Switzerland, 2018.
  16. Innes, J.E.; Booher, D.E. Indicators for Sustainable Communities: A Strategy Building on Complexity Theory and Distributed Intelligence. Plan. Theory Pract. 2000, 1, 173–186. [Google Scholar] [CrossRef]
  17. Bond, A.; Morrison-Saunders, A.N.; Pope, J. Sustainability assessment: The state of the art. Impact Assess. Proj. Apprais. 2012, 30, 53–62. [Google Scholar] [CrossRef]
  18. Shi, Q.; Yu, T.; Zuo, J.; Lai, X. Challenges of developing sustainable neighborhoods in China. J. Clean. Prod. 2016, 135, 972–983. [Google Scholar] [CrossRef]
  19. Salmoral, G.; Zegarra, E.; Vázquez-Rowe, I.; González, F.; del Castillo, L.; Saravia, G.R.; Graves, A.; Rey, D.; Knox, J.W. Water-related challenges in nexus governance for sustainable development: Insights from the city of Arequipa, Peru. Sci. Total Environ. 2020, 747, 141114. [Google Scholar]
  20. Marsal-Llacuna, M.-L. City Indicators on Social Sustainability as Standardization Technologies for Smarter (Citizen-Centered) Governance of Cities. Soc. Indic. Res. 2016, 128, 1193–1216. [Google Scholar] [CrossRef]
  21. Shen, L.; Wu, Y.; Lou, Y.; Zeng, D.; Shuai, C.; Song, X. What drives the carbon emission in the Chinese cities?—A case of pilot low carbon city of Beijing. J. Clean. Prod. 2018, 174, 343–354. [Google Scholar] [CrossRef]
  22. Peng, T.; Deng, H. Research on the sustainable development process of low-carbon pilot cities: The case study of Guiyang, a low-carbon pilot city in south-west China. Environ. Dev. Sustain. 2021, 23, 2382–2403. [Google Scholar] [CrossRef]
  23. Feng, T.; Lin, Z.; Du, H.; Qiu, Y.; Zuo, J. Does low-carbon pilot city program reduce carbon intensity? Evidence from Chinese cities. Res. Int. Bus. Financ. 2021, 58, 101450. [Google Scholar] [CrossRef]
  24. Chung, C.K.L.; Xu, J. Scalar politics of urban sustainability: Governing the Chinese city in the era of ecological civilisation. Trans. Inst. Br. Geogr. 2021, 46, 689–703. [Google Scholar] [CrossRef]
  25. Deng, W.; Cheshmehzangi, A.; Ma, Y.; Peng, Z. Promoting sustainability through governance of eco-city indicators: A multi-spatial perspective. Int. J. Low-Carbon Technol. 2021, 16, 61–72. [Google Scholar] [CrossRef]
  26. Gil, J.; Duarte, J. Tools for evaluating the sustainability of urban design: A review. Proc. Inst. Civ. Eng. Urban Des. Plan. 2013, 166, 311–325. [Google Scholar] [CrossRef]
  27. Sharifi, A.; Murayama, A. Viability of using global standards for neighbourhood sustainability assessment: Insights from a comparative case study. J. Environ. Plan. Manag. 2015, 58, 1–23. [Google Scholar] [CrossRef]
  28. Razmjoo, A.A.; Sumper, A.; Davarpanah, A. Energy sustainability analysis based on SDGs for developing countries. Energy Sources Part A Recover. Util. Environ. Eff. 2020, 42, 1041–1056. [Google Scholar] [CrossRef]
  29. Mccollum, D.L.; Echeverri, L.G.; Busch, S.; Pachauri, S.; Parkinson, S.; Rogelj, J.; Krey, V.; Minx, J.C.; Nilsson, M.; Stevance, A.-S.; et al. Connecting the sustainable development goals by their energy inter-linkages. Environ. Res. Lett. 2018, 13, 033006. [Google Scholar] [CrossRef]
  30. Bluszcz, A. Conditions for Maintaining the Sustainable Development Level of EU Member States. Soc. Indic. Res. 2018, 139, 679–693. [Google Scholar] [CrossRef] [Green Version]
  31. Kılkış, Şiir Sustainable development of energy, water and environment systems index for Southeast European cities. J. Clean. Prod. 2016, 130, 222–234. [CrossRef]
  32. Wang, L.; Long, R.; Chen, H.; Li, W.; Yang, J. A review of studies on urban energy performance evaluation. Environ. Sci. Pollut. Res. 2018, 26, 3243–3261. [Google Scholar] [CrossRef]
  33. Sueyoshi, T.; Mo, F.; Wang, D.D. Sustainable development of countries all over the world and the impact of renewable energy. Renew. Energy 2021, 184, 320–331. [Google Scholar] [CrossRef]
  34. Senpong, C.; Wiwattanadate, D. Challenge of Renewable Energy Transition towards Krabi’s Sustainable Energy City. In Proceedings of the IOP Conference Series: Earth and Environmental Science, Ho Chi Minh City, Vietnam, 24–25 April 2019; IOP Publishing: Bristol, UK, 2019; Volume 385, p. 012060. [Google Scholar]
  35. Karaca, A.E.; Dincer, I.; Nitefor, M. An integrated renewable energy based plant with energy storage for a sustainable community. Sustain. Energy Technol. Assess. 2021, 45, 101217. [Google Scholar] [CrossRef]
  36. Marquez-Ballesteros, M.-J.; Mora-López, L.; Lloret-Gallego, P.; Sumper, A.; Sidrach-De-Cardona, M. Measuring urban energy sustainability and its application to two Spanish cities: Malaga and Barcelona. Sustain. Cities Soc. 2019, 45, 335–347. [Google Scholar] [CrossRef]
  37. APEC-EWG. APEC Low-Carbon Town Indicator (LCT-I) System Guideline. 2016. Available online: https://aperc.or.jp/publications/reports/lcmt/LCT-I_System_Guideline.pdf (accessed on 12 October 2019).
  38. Zhen, J.; Huang, G.; Li, W.; Wu, C.; Wang, S. Electric power system planning with renewable energy accommodation for supporting the sustainable development of Tangshan City, China. J. Clean. Prod. 2016, 139, 1308–1325. [Google Scholar] [CrossRef]
  39. Zhai, Y.; Ma, X.; Gao, F.; Zhang, T.; Hong, J.; Zhang, X.; Yuan, X.; Li, X. Is energy the key to pursuing clean air and water at the city level? A case study of Jinan City, China. Renew. Sustain. Energy Rev. 2020, 134, 110353. [Google Scholar] [CrossRef]
  40. Cheshmehzangi, A. Low carbon transition at the township level: Feasibility study of environmental pollutants and sustainable energy planning. Int. J. Sustain. Energy 2021, 40, 670–696. [Google Scholar] [CrossRef]
  41. Pintér, L.; Hardi, P.; Martinuzzi, A.; Hall, J. Bellagio STAMP: Principles for sustainability assessment and measurement. Ecol. Indic. 2012, 17, 20–28. [Google Scholar] [CrossRef]
  42. Angelakoglou, K.; Kourtzanidis, K.; Giourka, P.; Apostolopoulos, V.; Nikolopoulos, N.; Kantorovitch, J. From a Comprehensive Pool to a Project-Specific List of Key Performance Indicators for Monitoring the Positive Energy Transition of Smart Cities—An Experience-Based Approach. Smart Cities 2020, 3, 705–735. [Google Scholar] [CrossRef]
  43. Sharifi, A.; Dawodu, A.; Cheshmehzangi, A. Limitations in assessment methodologies of neighborhood sustainability assessment tools: A literature review. Sustain. Cities Soc. 2021, 67, 102739. [Google Scholar] [CrossRef]
  44. Säynäjoki, E.; Kyrö, R.; Heinonen, J.; Junnila, S. An assessment of the applicability of three international neighbourhood sustainability rating systems to diverse local conditions, with a focus on Nordic case areas. Int. J. Sustain. Build. Technol. Urban Dev. 2012, 3, 96–104. [Google Scholar] [CrossRef]
  45. Sharifi, A.; Murayama, A. A critical review of seven selected neighborhood sustainability assessment tools. Environ. Impact Assess. Rev. 2013, 38, 73–87. [Google Scholar] [CrossRef]
  46. Wu, P.; Song, Y.; Hu, X.; Wang, X. A Preliminary Investigation of the Transition from Green Building to Green Community: Insights from LEED ND. Sustainability 2018, 10, 1802. [Google Scholar] [CrossRef] [Green Version]
  47. Lin, K.W.; Shih, C.M. The comparative analysis of neighborhood sustainability assessment tool. Environ. Plan. B Urban Anal. City Sci. 2018, 45, 90–105. [Google Scholar]
  48. Sharifi, A.; Murayama, A. Neighborhood sustainability assessment in action: Cross-evaluation of three assessment systems and their cases from the US, the UK, and Japan. Build. Environ. 2014, 72, 243–258. [Google Scholar] [CrossRef]
  49. Dang, X.; Zhang, Y.; Feng, W.; Zhou, N.; Wang, Y.; Meng, C.; Ginsberg, M. Comparative study of city-level sustainability assessment standards in China and the United States. J. Clean. Prod. 2020, 251, 119622. [Google Scholar] [CrossRef]
  50. Retzlaff, R.C. Green buildings and building assessment systems: A new area of interest for planners. J. Plan. Lit. 2009, 24, 3–21. [Google Scholar]
  51. Gargiulo, C.; Sforza, A.; Sterle, C.; Zucaro, F. An Optimization Model Fitting the Neighborhood Sustainability Assessment Tools. Sustainability 2018, 10, 3365. [Google Scholar] [CrossRef] [Green Version]
  52. Kajikawa, Y.; Inoue, T.; Goh, T.N. Analysis of building environment assessment frameworks and their implications for sustainability indicators. Sustain. Sci. 2011, 6, 233–246. [Google Scholar] [CrossRef]
  53. ISO/TR 37121:2017; Sustainable Development in Communities—Inventory of Existing Guidelines and Approaches on Sustainable Development and Resilience in Cities; International Standardization Organization: Geneva, Switzerland, 2017.
  54. USGBC. LEED for Cities and Communities; USGBC: Washington, DC, USA, 2020. [Google Scholar]
  55. Zhangjiakou Statistics Bureau. Zhangjiakou Economic Yearbook 2019; Zhangjiakou Economic Yearbook Committee: Zhangjiakou, China, 2020. [Google Scholar]
  56. NDRC. Development Plan of Zhangjiakou Renewable Energy Demonstration Zone in Hebei Province; National Development and Reform Commission: Beijing, China, 2015. [Google Scholar]
  57. IRENA. Zhangjiakou Energy Transformation Strategy 2050: Pathway to a Low-Carbon Future; International Renewable Energy Agency: Abu Dhabi, United Arab Emirates, 2019. [Google Scholar]
  58. Ma, M.; Sun, J. Renewable Energy Consumption Accounts for 30% of Total Terminal Energy Consumption in Zhangjiakou; Zhangjiakou Evening News: Zhangjiakou, China, 2021. [Google Scholar]
  59. WWF; IBR (Shenzhen Institute of Building Research). Methods and Policy Suggestions of Total Carbon Emission Control in Zhangjiakou City; Shenzhen Institute of Building Research Co., Ltd: Shenzhen, China; WWF Switzerland Beijing Representative Office: Beijing, China, 2020. [Google Scholar]
  60. NDRC. Zhangjiakou Capital Water Conservation Functional Area and Ecological Environment Support Area Construction Plan (2019–2035). 2019. Available online: https://www.ndrc.gov.cn/xxgk/zcfb/ghwb/201908/t20190806_962255.html?code=&state=123 (accessed on 6 September 2021).
  61. Hebei Provincial Department of Housing and Construction. Implementation Plan of Green Building Construction in Hebei Province. 2020. Available online: http://www.gov.cn/xinwen/2020-09/22/content_5545928.htm (accessed on 1 November 2020).
  62. CASBEE. CASBEE for Cities -Pilot Version for Worldwide Use. 2011. Available online: https://www.ibec.or.jp/CASBEE/english/toolsE_city.htm (accessed on 12 October 2019).
  63. United Nations. Global Indicator Framework for the Sustainable Development Goals and Targets of the 2030 Agenda for Sustainable Development. 2021. Available online: https://unstats.un.org/sdgs/indicators/indicators-list/ (accessed on 9 October 2021).
  64. Ministry of Housing and Urban-Rural Development of China. GB/T 50640-2010 Evaluation Standard for Green Construction of Building; Ministry of Housing and Urban-Rural Development of China: Beijing, China, 2011. Available online: http://www.jianbiaoku.com/webarbs/book/10974/693156.shtml (accessed on 5 December 2020).
  65. China State Council. Guiding Opinions of The General Office of the State Council on the Recording System of the Whole Process of Law Enforcement. 2018. Available online: http://www.gov.cn/zhengce/content/2019-01/03/content_5354528.htm?trs=1 (accessed on 5 February 2021).
  66. China State Council. Regulations of the People’s Republic of China on Government Information Disclosure 2019. Available online: http://www.gov.cn/zhengce/content/2019-04/15/content_5382991.htm (accessed on 10 February 2020).
  67. China State Council. Opinions on Strengthening the Public Security Prevention and Control System. 2015. Available online: http://www.gov.cn/xinwen/2015-04/13/content_2846013.htm (accessed on 8 February 2020).
  68. Ministry of Housing and Urban-Rural Development of China. Standards for Construction of Emergency Shelters in Urban Communities. 2017. Available online: http://www.jianbiaoku.com/webarbs/book/91575/2895968.shtml (accessed on 8 March 2020).
  69. Zhangjiakou Municipal Government, Development Plan of Zhangjiakou Renewable Energy Demonstration Zone. 2020. Available online: http://www.zjk.gov.cn/nyj/content.jsp?contentId=44001 (accessed on 10 October 2021).
  70. NDRC. Guidance on Comprehensive Utilization of Bulk Solid Waste during the 14th Five-Year Plan Period; National Development and Reform Commission: Beijing, China, 2021. [Google Scholar]
  71. Ministry of Ecological Environment of China. “Waste Free City” Construction Index System (Trial). 2019. Available online: https://www.mee.gov.cn/xxgk2018/xxgk/xxgk06/201905/t20190513_702598.html (accessed on 18 March 2021).
  72. Ministry of Housing and Urban-Rural Development of China. Road Network Density Monitoring Report of Major Cities in China (2020). 2020. Available online: http://www.chinautc.com/ (accessed on 18 March 2021).
  73. Ministry of Transport of China. Green Travel Action Plan. 2020. Available online: http://www.gov.cn/xinwen/2020-07/27/content_5530310.htm (accessed on 20 March 2021).
  74. Ministry of Agriculture and Rural Affairs of China. Digital Agriculture and Rural Development Plan (2019–2025). 2020. Available online: http://www.gov.cn/zhengce/2020-01/22/content_5471507.htm (accessed on 15 March 2020).
  75. National Health Commission of China. Report of the Sixth National Health Services Survey. 2021. Available online: http://health.china.com.cn/2021-01/26/content_41451668.htm (accessed on 20 July 2021).
  76. Central People’s Government of China. Outline of the 14th Five-Year Plan for National Economic and Social Development of the People’s Republic of China and the Vision for 2035. 2021. Available online: http://www.gov.cn/xinwen/2021-03/13/content_5592681.htm (accessed on 8 May 2021).
  77. Zhangjiakou Energy Bureau. New Energy Industry Planning of Zhangjiakou City (2021–2025); Zhangjiakou Energy Bureau: Zhangjiakou, China, 2021. [Google Scholar]
  78. Zhangjiakou Energy Bureau. Zhangjiakou Energy Bureau “14th Five-year” Energy Development Plan of Zhangjiakou City, Hebei Province (Draft for Soliciting Comments); Zhangjiakou Energy Bureau: Zhangjiakou, China, 2020. [Google Scholar]
  79. Zhangjiakou DRC. Construction Plan of Zhangjiakou Water-Conservation and Ecological-Environmental Support Area of Capital (2019–2035); Development and Reform Commission: Zhangjiakou, China, 2020. [Google Scholar]
  80. Zhangjiakou Municipal Government. Guidelines on Accelerating the Development of the Seven Leading Industries. 2020. Available online: http://hezjk.spb.gov.cn/zcfg_704/202004/t20200405_2077868.html (accessed on 3 February 2021).
  81. Zhangjiakou Municipal Government. Zhangjiakou Digital Economy Development Plan. 2020. Available online: http://www.zjk.gov.cn/content/2020/37587.html (accessed on 5 August 2020).
  82. Zhangjiakou DRC. The Rport on the Implementation of 2020 National Economic and Social Development Plan and 2021 National Economic and Social Development Plan of Zhangjiakou City 2021. Available online: http://www.zjk.gov.cn/content/2021/104136.html (accessed on 5 February 2021).
  83. Zhangjiakou Municipal Government. Provisions of Zhangjiakou Administrative Law Enforcement and Supervision. 2005. Available online: http://www.law-lib.com/law/law_view.asp?id=280806 (accessed on 6 July 2020).
  84. Zhangjiakou Municipal Government. 2021 Zhangjiakou Municipal Government Work Report; Zhangjiakou Municipal Government: Zhangjiakou, China, 2021.
  85. China Industrial Research Institute. Investment Risk Prediction and Analysis Report on the Industry Development Prospect of China Maternal and Child Health Hospital (2021–2026). 2021. Available online: https://www.chinairn.com/report/20210914/092441469.html (accessed on 12 October 2021).
  86. Zhangjiakou Municipal Government. Implementation Plan of Zhangjiakou Snow and Ice Industry Development 2020; Zhangjiakou People’s Government Office, Ed.; Zhangjiakou Municipal Government: Zhangjiakou, China, 2020.
  87. Zhangjiakou Statistics Bureau. Zhangjiakou 2020 Economic and Social Development Statistical Bulletin. 2021. Available online: http://tjj.zjk.gov.cn/content/2021/108932.html (accessed on 2 June 2021).
  88. Stern, N. The Economics of Climate Change. Am. Econ. Rev. 2008, 98, 1–37. [Google Scholar]
  89. Zhou, D.; He, J.; Qi, Y.; Jiang, Y.; Luo, Y.; Pan, J.; Zou, J. Earlest Peaking the Carbon Emission of China; China Economic Publishing House: Beijing, China, 2017. [Google Scholar]
  90. He, Y.; Wen, H.; Sun, C. Total carbon emission and structure prediction in China during the 14th Five-year Plan period: Based on ADL-MIDAS model with mixed frequency data. Econ. Probl. 2021, 4, 31–40. [Google Scholar]
  91. World Bank. CO2 Emission (Metric Tons Per Capita). 2021. Available online: https://data.worldbank.org/indicator/EN.ATM.CO2E.PC (accessed on 26 July 2021).
  92. Eurostat. Greenhouse Gas Emissions per Capita. 2021. Available online: https://ec.europa.eu/eurostat/databrowser/view/t2020_rd300/default/table?lang=en (accessed on 15 July 2021).
  93. Xiao, X. China’s Carbon Peak Is about 10.3 Billion Tons, and the Green Transformation in the 14th Five-Year Plan May Drive Investment of 45 Trillion-Yuan 2021. Available online: http://finance.sina.com.cn/tech/2021-08-26/doc-ikqcfncc5202998.shtml (accessed on 26 August 2021).
  94. CITIC Securities, Carbon Peak Panorama: New Goals, New Structures, New Opportunities. 2021. Available online: https://www.citics.com/newsite/ (accessed on 10 October 2021).
Figure 1. Three-pillar approach based evaluation model integrated local governance.
Sustainability 14 05047 g001
Figure 2. Interactive decision-making process.
Sustainability 14 05047 g002
Figure 3. Per capita carbon emission in the European Union (27 countries). Source: World Bank Open Data, Eurostat. (Unit: ton per capita).
Sustainability 14 05047 g003
Table 1. Submodules and indicators in M1.
SubmoduleIndicatorBPVEPVRef Type
M1-1Energy SupplyInd1Power system guarantee rate (%)9095(b)(f)
Ind2Proportion of clean energy installed (%)8085(b)(d)
M1-2Energy ConsumptionInd3Reduction rate in energy consumption per unit of GDP (%)1922(d)(f)
Ind4Annual per capita energy consumption (tce)3.83.5(d)(f)
M1-3Clean Energy PromotionInd5Share of end consumption of renewable energy (%)4050(a)(d)(f)
Ind6Penetration rate of new energy vehicles (vehicles/10,000 people)130150(d)
Ind7Rural clean heating penetration rate (%)4045(d)(f)
M1-4CO2 EmissionInd8CO2 emission per unit of GDP decreased (%)2024(a)(f)
Ind9Annual CO2 emission per capita (t)9.48.3(a)(f)
Table 2. Submodules and indicators in M2.
SubmoduleIndicatorBPVEPVRef Type
M2-1Watershed & EcologyInd10Water consumption per unit of GDP (m3)4540(b)(d)
Ind11Groundwater Withdrawal (billion m3)5.85.5(b)(d)
Ind12Cultivated land quantity (ha)873100-(b)(d)
Ind13Forest coverage rate (%)5055(d)(f)
M2-2Environmental QualityInd14Section water quality (%)100-(b)(d)
Ind15Blue sky proportion (%)9095(b)
Ind16Comprehensive utilization rate of bulk solid waste (%)6065(c)
M2-3TransportationInd17Urban road network density (km/km2)6.47(c)
Ind18Proportion of urban public transport trips (%)5565(c)(f)
M2-4Sustainable Building & ConstructionInd19Proportion of green buildings in new buildings (%)100-(b)
Ind20Proportion of green construction projects in new buildings (%)50-(b)
Table 3. Submodules and indicators in M3.
SubmoduleIndicatorBPVEPVRef Type
M3-1Harmonious DevelopmentInd21Internet penetration in rural area (%)7075(c)
Ind22The proportion of the rural people employed locally (%)4050(e)(f)
Ind23Annual per capita income increase rate (rural residents) (%)1520(e)
M3-2HealthInd24Density of beds in medical and health institutions (bed/1000 people)6.27-(e)
Ind25Under-5 mortality rate (%) (newborns/babies/children)3/4/62/3.5/5(c)
Ind26Percentage of the people have regular health services (rural residents) (%)95100(c)
M3-3WelfareInd27Participation rate of basic endowment insurance (%)7075(e)(f)
Ind28Per capita spending on social security and employment (fiscal expenditure) (RMB)21002600(e)
M3-4EducationInd29Retention rate of compulsory education (%)100-(e)
Ind30Proportion of highly educated population (people/10,000 people)750860(e)(f)
Ind31Area of public cultural facilities per 10,000 people (m2)250260(e)(f)
Table 4. Submodules and indicators in M4.
SubmoduleIndicatorBPVEPVRef Type
M4-1Basic Economic IndicatorsInd32GDP (100 million RMB)22002300(d)(e)(f)
Ind33GDP per capita (RMB)50,00051,000(e)(f)
Ind34General Public Budget Revenue (100 million RMB)230250(e)(f)
M4-2Industrial Coordination & Economic FlexibilityInd35The proportion of value-added of the service sector (%)6061(d)(e)(f)
Ind36Proportion of employed people in characteristic leading & emerging industries (%)2526(f)
Ind37Number of newly created jobs (10,000 jobs)6.37(e)(f)
Table 5. Submodules and indicators in M5.
SubmoduleIndicatorBPVEPVRef Type
M5-1Ice-snow IndustryInd38Proportion of ice-snow industry added value in service industry added value (%)3035(d)(f)
Ind39Annual participation in ice-snow sports (10,000 person-time)15001650(d)(f)
M5-2New Energy IndustryInd40New energy industry GDP ratio (%)1820(d)(f)
M5-3Digital Economy IndustryInd41Digital economy industry GDP ratio (%)23(d)(f)
M5-4High-end Manufacturing IndustriesInd42Proportion of high-end manufacturing industry added value in manufacturing industry added value (%)2530(d)(f)
M5-5Tourism IndustryInd43Culture-oriented tourism industry GDP ratio (%)1315(d)(f)
Ind44External tourists increase rate (%)2022(d)(f)
M5-6Healthcare IndustryInd45Proportion of healthcare industry added value in service industry added value (%)34(d)(f)
Ind46Quantity of healthcare industry service (person-time)10,00015,000(d)(f)
M5-7Agriculture & HusbandryInd47Proportion of agriculture & husbandry added value in primary industry added value (%)8085(d)(f)
Ind48New jobs of agriculture & husbandry (annual mean) (10,000 jobs)55.5(d)(f)
Table 6. Submodules and indicators in M6.
SubmoduleIndicatorBPVEPVRef Type
M6-1InnovationInd49Growth rate of total R&D Investment (%)1012(d)(f)
Ind50Ownership of high-value invention patents (patent/10,000 people)1.52(c)(d)
Ind51Total value of technology transactions (annual mean) (100 million RMB)4555(e)
M6-2SmartInd52Online processing rate of government services (%)100-(d)
Ind53Coverage scale of comprehensive service platform (Urban and rural) (%)100/30100/50(d)
Table 7. Submodules and indicators in M7.
SubmoduleIndicatorBPVEPVRef Type
M7-1EnforcementInd54Proportion of enforcement process record (%)100-(b)
Ind55Percentage of standardized administrative procedures (%)100-(b)
M7-2SafetyInd56Completeness of emergency handling plan (%)100-(f)
Ind57Coverage of CCTV (urban and rural) (%)
(concentrated/all areas)
100100(b)
Ind58Per capita emergency shelter area (m2)12(b)
M7-3Government EfficiencyInd59Openness of government office information (credit)60100(b)
Ind60Complaint handling rate of enforcement (%)90100(d)
M7-4Public ParticipationInd61Grid management coverage (%)90100(d)(f)
Ind62Number of social volunteer services (Person-times/10,000 people)2000-(e)(f)
Table 8. Submodules and indicators in M8.
SubmoduleIndicatorBPVEPVRef Type
M8-1City influenceInd63Number of international events and conferences (annual mean) (time)612(f)
Ind64Number of positive reports by major foreign media (annual mean) (time)1020(f)
M8-2International communication & tradeInd65International governmental and non-governmental exchanges/visits (annual mean) (number of group)50-(f)
Ind66Total foreign investment (annual mean) ($100 million)5.56(e)(f)
Ind67Proportion of total imports and exports to GDP (%)17.5-(e)(f)
Publisher’s Note: MDPI stays neutral with regard to jurisdictional claims in published maps and institutional affiliations.

