Article

Ecological Risk Evaluation and Source Identification of Heavy Metal Pollution in Urban Village Soil Based on XRF Technique

1
Institute of Land Engineering and Technology, Shaanxi Provincial Land Engineering Construction Group Co., Ltd., Xi’an 710075, China
2
Shaanxi Provincial Land Engineering Construction Group Co., Ltd., Xi’an 710075, China
3
Key Laboratory of Degraded and Unused Land Consolidation Engineering, The Ministry of Natural Resources, Xi’an 710075, China
4
School of Land Engineering, Chang’an University, Xi′an 710054, China
*
Author to whom correspondence should be addressed.
Sustainability 2022, 14(9), 5030; https://doi.org/10.3390/su14095030
Submission received: 9 February 2022 / Revised: 14 April 2022 / Accepted: 19 April 2022 / Published: 22 April 2022
(This article belongs to the Special Issue Soil Management Practices to Promote Soil Health)

Abstract

:
The rapid urbanization in China has resulted in significant differences between urban and rural areas. The emergence of urban villages is inevitable in this context, for which complex problems regarding land use, industrial management and ecological environment have arisen. This study performed a case study on a typical urban village, by assessing heavy metal pollution and ecological risk in soil. It detected a total of 80 basic units through portable X-ray fluorescence (XRF) instrument. A total of 25 high-risk contaminated points were selected, sampled and analyzed in laboratory as confirmation. The results showed the mean concentrations of Pb, Cu, Zn and Ni in soil were significantly higher than background values. Pb, Zn and Ni showed obvious pairwise correlation, and the high-value zones could be attributed to automobile traffic and industrial activities. In addition, the pollution problem is complicated by a combination of agricultural activities, the absence of clear division between different functional zones, as well as a general lack of environmental awareness. All of these lead to increased ecological risk and are a serios threaten to public health.

1. Introduction

Land use change is an essential part of the earth’s environmental change, and the most direct manifestation of the impact of human activities on the earth’s surface system [1,2]. China has experienced an extremely rapid urbanization in the past four decades. From 1981 to 2019, China’s urbanization rate increased from 20.16% to 60.60%, with an average annual increase of 1.06% [3]. During this period, the area of urban construction land in China soared from 6720.0 km2 to 58,307.7 km2, an increase of 767.67% [4]. The rapid growth of construction land mainly comes from non-agricultural transformation of agricultural land [5,6]. One of the most prominent features of urban expansion was a growing number of industrial lands. The rapid growth of industry had promoted China’s modernization and urbanization. However, China’s industrial development had been in an extensive mode in the past, which mainly manifested in low land utilization efficiency and serious environmental pollution [7]. Therefore, it intensified the contradiction between supply and demand of urban land, which seriously destroyed the balance of the man–land interrelationship [8,9,10]. In 2019, China’s industrial and manufacturing land accounted for 19.69% of the total areas of urban construction land, while the proportion in developed countries was often less than 10% [11,12]. At present, China is at an important stage of industrial development and transformation, including industrial structure upgrading, land intensification and green sustainable development. In terms of environmental sustainability, the government has implemented a series of measures, including closing scattered industrial factories in downtown and moving industrial sites to suburban areas, to keep ecological environmentally friendly and urban living environment healthy. In addition, rationally controlling the scale and layout of industrial land is an important way to improve urban eco-efficiency [13,14].
Urban soil contamination mainly comes from industrial production and related activities. The raw materials and compounds of Cd, Cr, Cu, Ni, Pb, Zn, Hg and As are widely utilized in human daily life and production, as well as the most polluted [15,16]. From 2005 to 2013, China carried out the first national soil survey, in which the over-standard rates of pollution points of heavily polluted enterprise land, industrial wasteland and industrial park were 36.3%, 34.9% and 29.4%, respectively [17]. The problem of heavy metal pollution in soil was very prominent. For single heavy metal element, the over-standard rates of Cd, Ni, As and Cu reached 7.0%, 4.8%, 2.7% and 2.1%, respectively, which posed a great threat to human health [18]. Soil is not only the carrier of human activities, but also the final receptor of various pollution emissions [19]. Previous studies showed that industrial manufacturing and fossil fuel combustion would lead to the concentrations of heavy metals in urban soil significantly higher than their natural background values [20,21,22]. Remediation of heavy metal pollution in soil is complicated owning to its persistence, bio-accumulation and low microbial degradability properties. Its migration and transformation are affected by soil types, heavy metal ions and their occurrence forms [23,24]. Soil pollution of heavy metals endangers human health through oral intake, respiratory inhalation and skin contact [25,26].
There have existed obviously regional differences in the process of urbanization in China. In general, the growth rate of urbanization decreases progressively from east to west in turn [27]. With the in-depth development of urbanization, urban expansion and urban renewal have become the two dominant modes of urban land change [28]. It is an important issue in coordinating urban development and environmental sustainability. A study of livable cities in China released by the Chinese Academy of Sciences noted that the average environmental health score of all 40 cities participating in the survey was only 58.24, lower than 60. Environmental health problem has become the main limitation of construction of livable cities in China. Furthermore, this study pointed out that the environmental health problem in Xi’an was serious, which directly affected its livability [29]. Over a long period in the past, Xi’an’s industrial development had the characteristics of high energy consumption, heavy pollution and high emission. With the implementation of green sustainable strategy, people have been focusing on soil health and living environment issues.
Many researchers have conducted qualitative and quantitative studies on heavy metal pollution in soil, analyzing the spatial distribution rule and assessing the pollution degree [30,31,32]. However, the city is quite large in relation to its land area. There are a very limited number of sampling points and their layout lacks exact data support in most studies. Urban village is a transitional zone between urban and rural areas. There have existed huge urban–rural differences in aspects of land use and landscape pattern. Furthermore, there are dense population, poor environment and inadequate infrastructure [33,34]. Many researchers have pointed out that the urban village issue is the key to urban high-quality development [35,36]. However, seldom have researchers focused on soil environment in urban village and the internal relations among land use, industry and heavy metal concentration in soil. Through developing an integrated approach, this research aimed at (1) finding out high concentration zones of Cd, Cr, Cu, Ni, Pb, Zn, Hg and As in research areas based on the XRF technique, (2) assessing the pollution and ecological risk, (3) analyzing its distribution rule and pollution sources, and (4) putting forward some advices based on health and sustainability. This research may provide an efficient and reliable method for large-scale urban soil investigation. Its results may offer a scientific basis for comprehensive environmental management and are of great significance for urban sustainable development.

2. Materials and Methods

2.1. Research Area and Detection Points

As one of the nine national central cities, Xi’an is located in the northwest of China. It is an important industrial base of China, and its main industries include automobile manufacturing, pharmaceutical manufacturing and electronic equipment manufacturing. In addition, Xi’an has been experiencing rapid urban sprawl during the last decade. A large amount of farmland has been transformed into urban construction land. Under the sharp conflict of urban–rural industry, population and land, many urban villages have formed as a result. In total, there were 156 urban villages in Xi’an until 2018, most of which were located in suburban areas [37]. As shown in Figure 1, the industrial land of Xi’an is mainly distributed in suburban areas as well, especially the western suburbs. Therefore, the research area is in the western suburbs of Xi’an, which is of obvious urban–rural dual structure and characteristics. The research area is a typical urban village, locating in Chang’an district at latitude 34°13′09″–34°13′40″ N, longitude 108°48′03″–108°48′40″ E. The total land area is approximately 0.78 km2. It is dominated by industrial land and residential land, with a small amount of open space and farmland. The industries in this urban village mainly involves electronic equipment manufacturing, construction materials and automobile maintenance.
Through the recognition of remote sensing (RS) image, it indicated that the research area was a similar 1000 m × 800 m (L × W) rectangle. According to Technical Guidelines for Investigation on Soil Contamination of Land for Construction (HJ 25.1-2019) and The Technical Specification for Soil Environmental Monitoring (HJ/T 166-2004), the research area was transformed into a 10 × 8 basic grid and each unit was a 100 m × 100 m rectangle [38,39]. The grid was unified with the geographical coordinates by geographic information system (GIS) and global positioning system (GPS) technologies (Figure 1). The geometric center of each rectangle unit was determined as a quick detection point with X-ray fluorescence (XRF) instrument. Consequently, in total there were 80 quick detection points.

2.2. Analytic Methods

At present XRF has been widely used to confirm the type and quantity of elements in substances. Some researchers applied this technology to the detection of heavy metals in soil, showing the characteristics of fast, accurate, portable and no damage to samples [40]. The sources causing heavy metal pollution in urban soil are complex. Theoretically, the more detection points, the more accurate it can reflect the overall soil pollution situation of the site. Traditional soil sampling and laboratory analysis need to consume a lot of manpower and material resources. However, XRF has obvious advantages in this aspect, which can realize large-scale full coverage and efficient investigation of heavy metals in soil.
The sundries on soil surface were cleaned by a plastic shovel (non-metallic). Heavy metal concentrations in topsoil were quantified in situ with field portable XRF instrument (Sci-Aps, 200) set to Geo-Env soil mode. In this soil mode, three beams under different voltage can detect different elements (Table 1). This research focused on the concentrations of Cd, Cr, Cu, Ni, Pb, Zn, Hg and As. Therefore, beam 1 and 3 were selected, while beam 2 was skipped. Each measurement was collected for a total of 30 s, which was very quick and well directed. The calibration verification, determination of instrument precision, accuracy and limit of detection (LOD) fulfills the requirements of United States Environmental Protection Agency (EPA) Method 6200 [41].
Through soil analysis with XRF, the concentrations of Cd, Cr, Cu, Ni, Pb, Zn, Hg and As in soil of each unit were quantified. EPA Method 6200 recommends a minimum 5% of all samples tested by XRF be confirmed by laboratory analysis. Considering the difference of pollution degree of each heavy metal element, 5–10% of quick detection results of different heavy metal were regarded as high-risk contaminated, respectively. Finally, high-risk contaminated points of above eight heavy metals were integrated. These points would be confirmed with soil sampling and laboratory analysis. This research focused on urban topsoil, which is significantly affected by human activities [42]. Three topsoil subsamples, at a depth of 0–20 cm, were collected at each sampling point and mixed into a final soil sample. These soil samples were naturally dried and then filtrated through 100-mesh nylon sieve. Using a total-digestion EPA analytical reference method 3050B [43], soil samples were digested by HNO3-HCl-HF-H2O2 and HNO3-HCl, respectively. The concentrations of Cd, Cr, Cu, Ni, Pb, Zn, As were quantitatively analyzed by ICP-MS (Agilent, 7700e). Concentrations of Hg were quantitatively analyzed by Atomic Fluorescence Spectrometer (JINSUOKUN, SK-2003AZ). This laboratory analysis adopted national standard materials for soil composition analysis (GSS-8) for analytic quality control (QC).

2.3. Comprehensive Pollution Index (CPI) Method

Comprehensive pollution index (CPI) method is a multi-factor environmental quality assessment method highlighting the maximum value. It is one of the important methods to evaluate pollution in soil, water and sediment [44]. Based on single pollution index (SPI), CPI can comprehensively reflect the different effects of various heavy metal pollutants on soil. The CPI is computed as follows:
P i = C i / S i
P c = P i m a x 2 + P i a v e 2 2
where Ci is the measured concentrations of a specific heavy metal, Si is the evaluation criteria of heavy metal pollution. In this research, the criteria mainly use Risk Control Standard for Soil Contamination of Development Land (GB36600-2018) and Risk Control Standard for Soil Contamination of Agricultural Land (GB15618-2018) for reference [45,46]. Pi and Pc represent SPI and CPI, respectively. Pimax is the maximum pollution index of a specific heavy metal and Piave is the average pollution index of all heavy metal factors. Pc is classified into five categories that Pc ≤ 0.7 (Level I and clean), 0.7 < Pc ≤ 1 (Level II and low polluted), 1 < Pc ≤ 2 (Level III and moderately polluted), 2 < Pc ≤ 3 (Level IV and highly polluted), 3 < Pc (Level V and significantly highly polluted).

2.4. Geo-Accumulation Index (Igeo) Method

Geo-accumulation index (Igeo) method is an important quantitative evaluation method of heavy metal pollution. It is widely used in the quantitative evaluation of heavy metal pollution of soil and sediment. This method takes into account the difference of background values caused by natural geological processes and the influence of heavy metal pollution caused by human activities [47]. Igeo is an important parameter, which can evaluate the impact of human activities on soil pollution. The Igeo is computed as follows:
  [ C n 1.5 × B V n ]
where Cn is the measured concentration of a specific heavy metal in soil, and BVn is the geochemical background value of a specific heavy metal in soil. According to the value of Igeo, pollution grades are classified into seven categories: Igeo < 0 (not polluted), 0 ≤ Igeo < 1 (not polluted to moderately polluted), 1 ≤ Igeo < 2 (moderately polluted), 2 ≤ Igeo< 3 (moderately polluted to heavily polluted), 3 ≤ Igeo < 4 (heavily polluted), 4 ≤ Igeo < 5 (heavily polluted to extremely polluted), and 5 ≤ Igeo (extremely polluted).

2.5. Potential Ecological Risk Index (RI) Method

Potential ecological risk index (RI) method was established by Hakanson for evaluating heavy metal pollution and ecological risk based on the principles of sedimentology [48]. This method takes toxic effects of different heavy metals on the environment into consideration, associating heavy metal pollution and its ecological effect. RI can comprehensively reflect the potential ecological risk level of heavy metals on soil environment. The calculation formula is as follows:
R I = i = 1 n E r i = i = 1 n T r i × C s i   C n i
where Csi is the measured concentrations of a specific heavy metal in soil, Cni is the evaluation criteria. This research used soil background values of Shaanxi province for criteria reference [49]. Tri is the specific biological toxic response factor for a heavy metal element. Eri is the potential ecological risk index of single heavy metal. RI is calculated as the sum of potential ecological risk of all researched heavy metals. Cni and Tri are shown in Table 2. With regard to potential ecological risk caused by single heavy metal, Eri is classified into five categories: Eri < 40 (low level), 40 ≤ Eri < 80 (moderate level), 80 ≤ Eri < 160 (considerable level), 160 ≤ Eri < 320 (high level), and 320 ≤ Eri (significantly high level). As for overall potential ecological risk, RI is classified into four categories: RI < 150 (low level), 150 ≤ RI < 300 (moderate level), 300 ≤ RI < 600 (high level), and 600 ≤ RI (significantly high level).

2.6. Methods of Sources Identification

This research analyzed the numerical relation between XRF and corresponding laboratory analysis results, especially in high-risk areas. The XRF results of 80 sampling points were corrected through regression fit lines. Then, principal component analysis (PCA) and K-Means Clustering (KMC) analysis were adopted to conduct pollution sources identification in IBM SPSS Statistics 26. According to previous research [50,51], the principal components (PCs) were selected when initial contribution rate was larger than 80.00%. In addition, the pairwise correlation between different heavy metals were analyzed and the similarity of pollution sources was inferred and identified.

3. Results

3.1. Soil Analyses with XRF

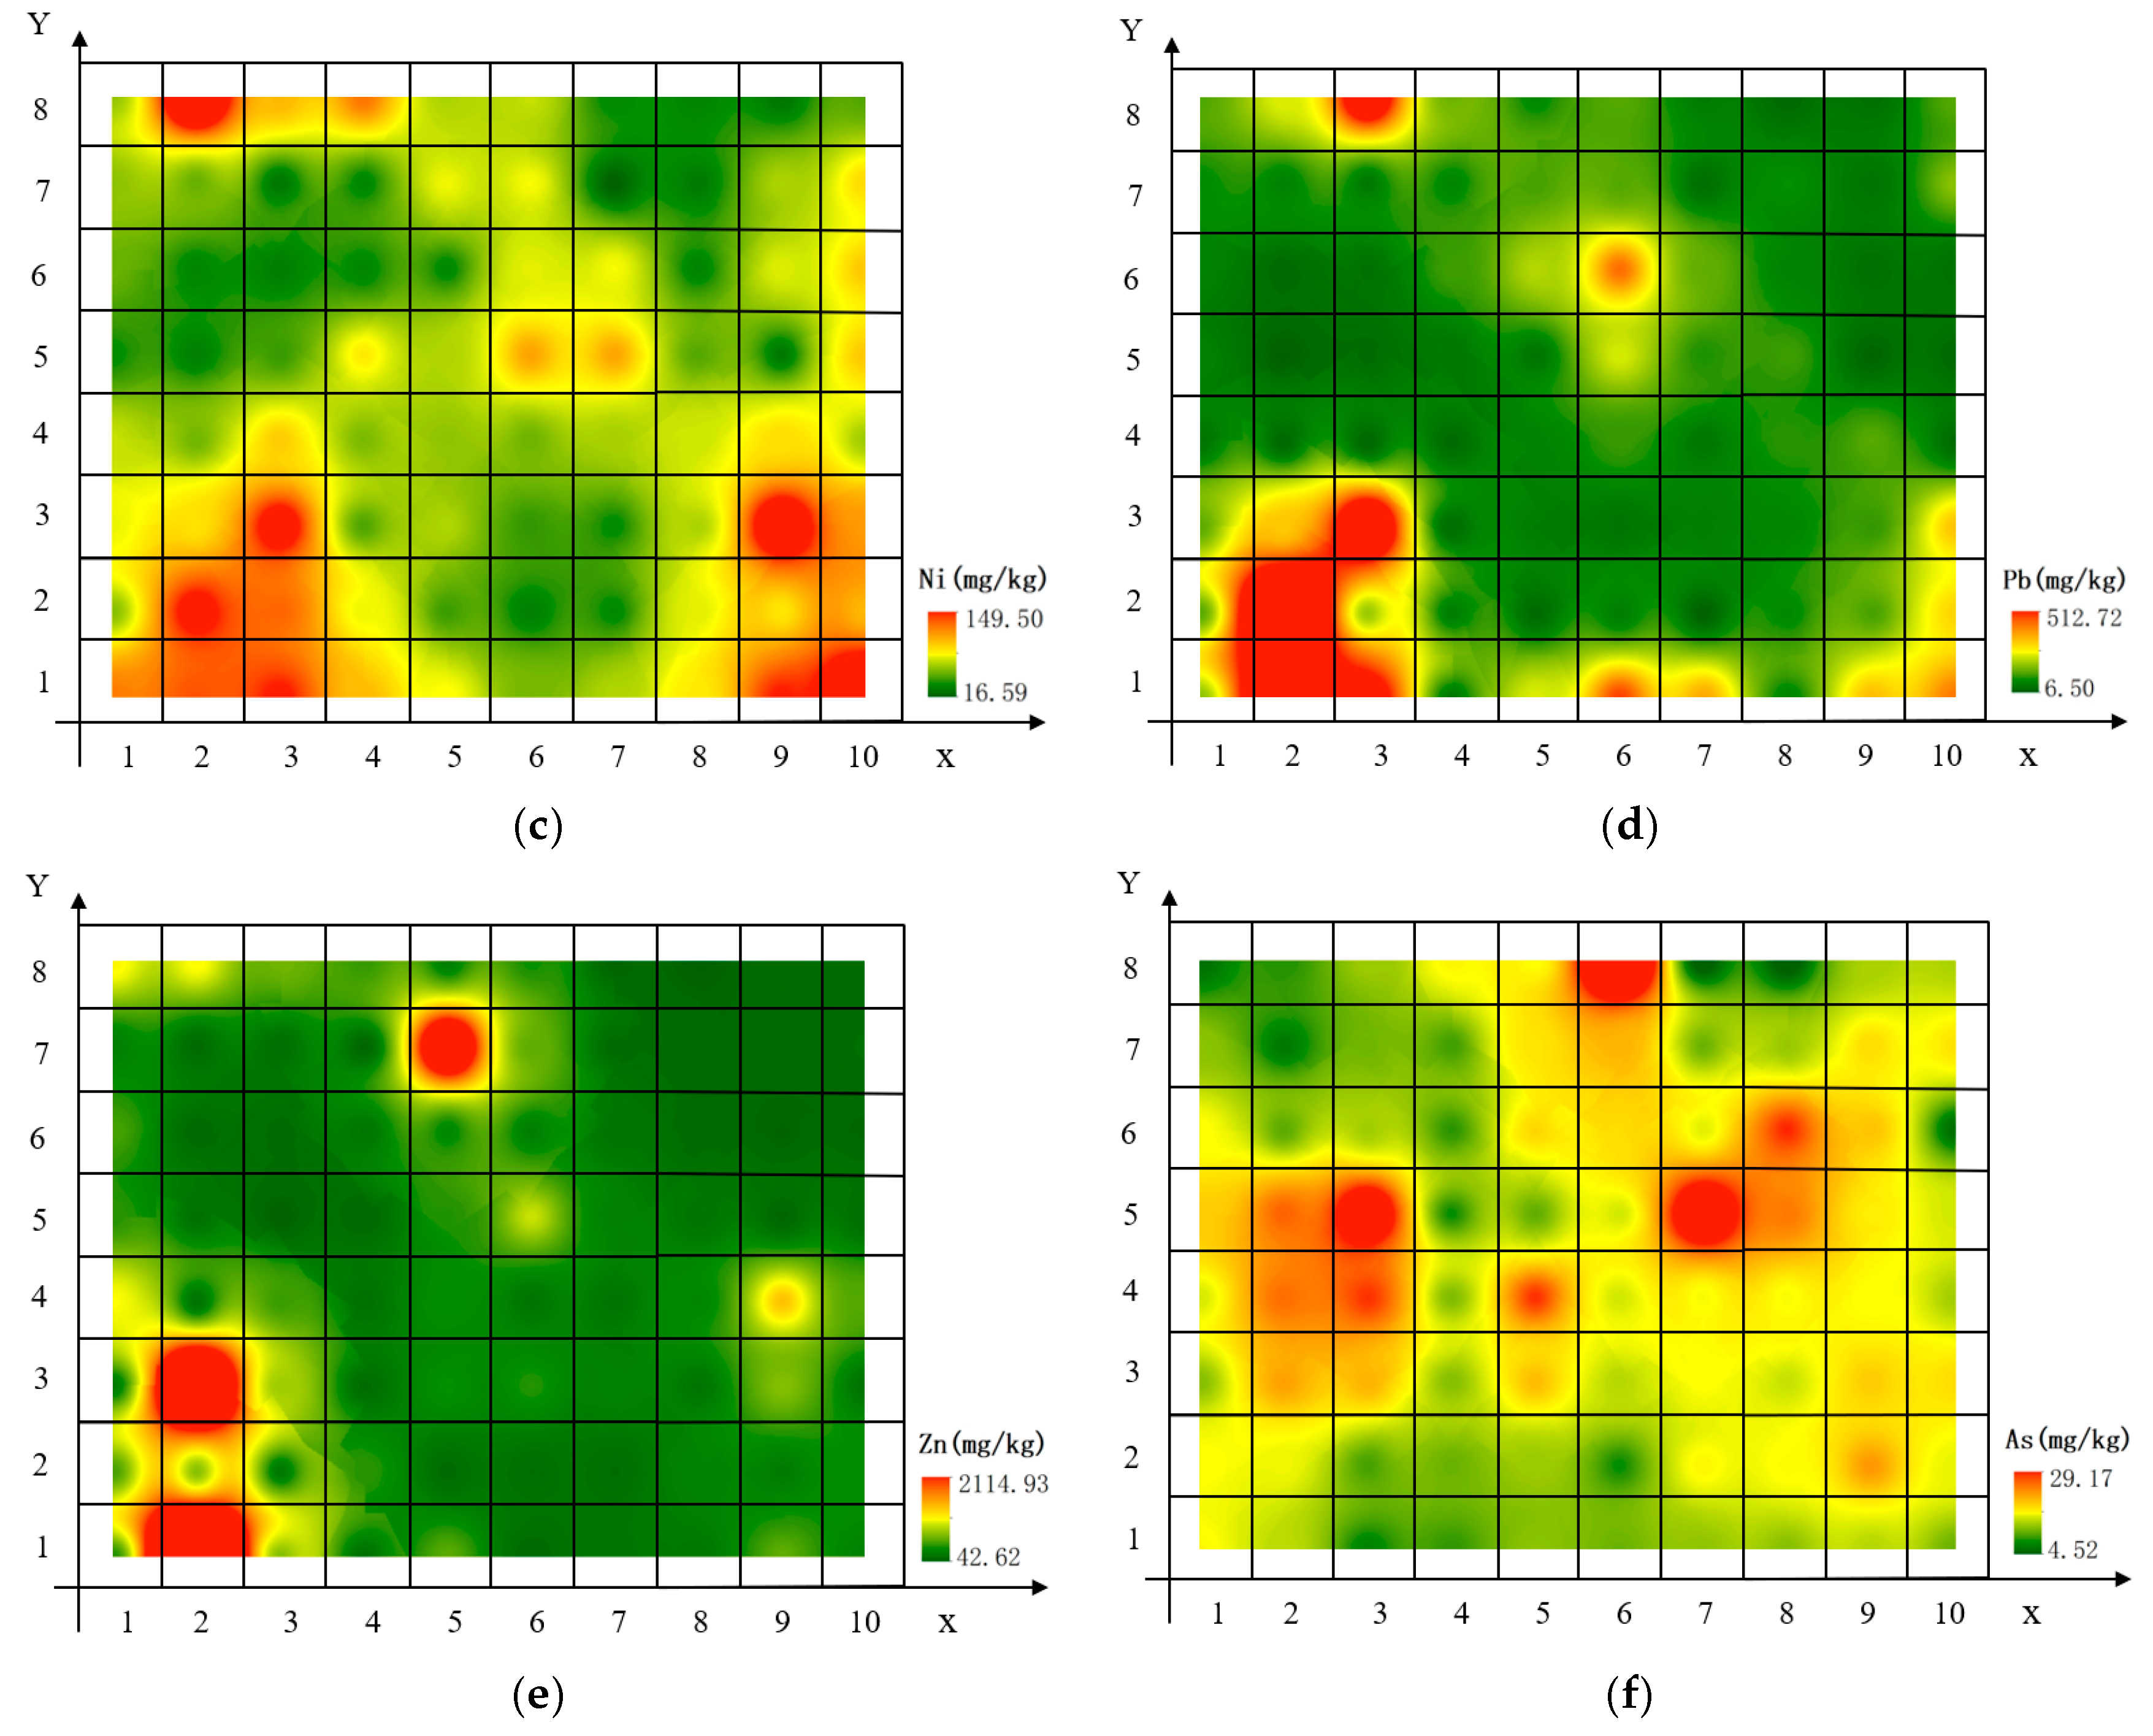
In total, there were 80 quick detection points analyzed by XRF. Cd and Hg were not detected. It indicated that the concentrations of Cd and Hg in soil did not reach LOD of the XRF instrument. This research analyzed and visualized the concentrations of heavy metals by Inverse Distance Weighted (IDW) in Arcgis 10.3 (ESRI). The results intuitively reflected their spatial distribution and the variation trends (Figure 2). The mean concentrations of Cr, Cu, Ni, Pb, Zn and As were 53.37 mg·kg−1, 51.27 mg·kg−1, 53.05 mg·kg−1, 69.43 mg·kg−1, 165.91 mg·kg−1 and 10.94 mg·kg−1, respectively. Pb, Cu, Zn and Ni were 3.24, 2.40, 2.39 and 1.84 times as large, respectively, as the background values in Shaanxi province. The concentrations of Pb at point 2-2 (X-Y) were 512.72 mg·kg−1, exceeding 400 mg·kg−1 (risk screening values for soil contamination of development land in GB36600-2018). There were 13 points whose concentrations of Pb were larger than 120 mg·kg−1 (risk screening values for soil contamination of agricultural land in GB15618-2018), accounting for 16.25%. It was found that large value points were mostly distributed in the south of the research area, close to the traffic road. The maximum values of Zn were 2114.93 mg·kg−1. Moreover, its coefficients of variation (CV) and standard deviation (SD) were the largest, reaching 173.71% and 288.19, respectively. It indicated the spatial distribution of Zn varied greatly and it was probably affected by land use type, industry and human activity. The concentration of Zn in eight detection points was more than 250 mg·kg−1 (evaluation criteria), accounting for 10%.
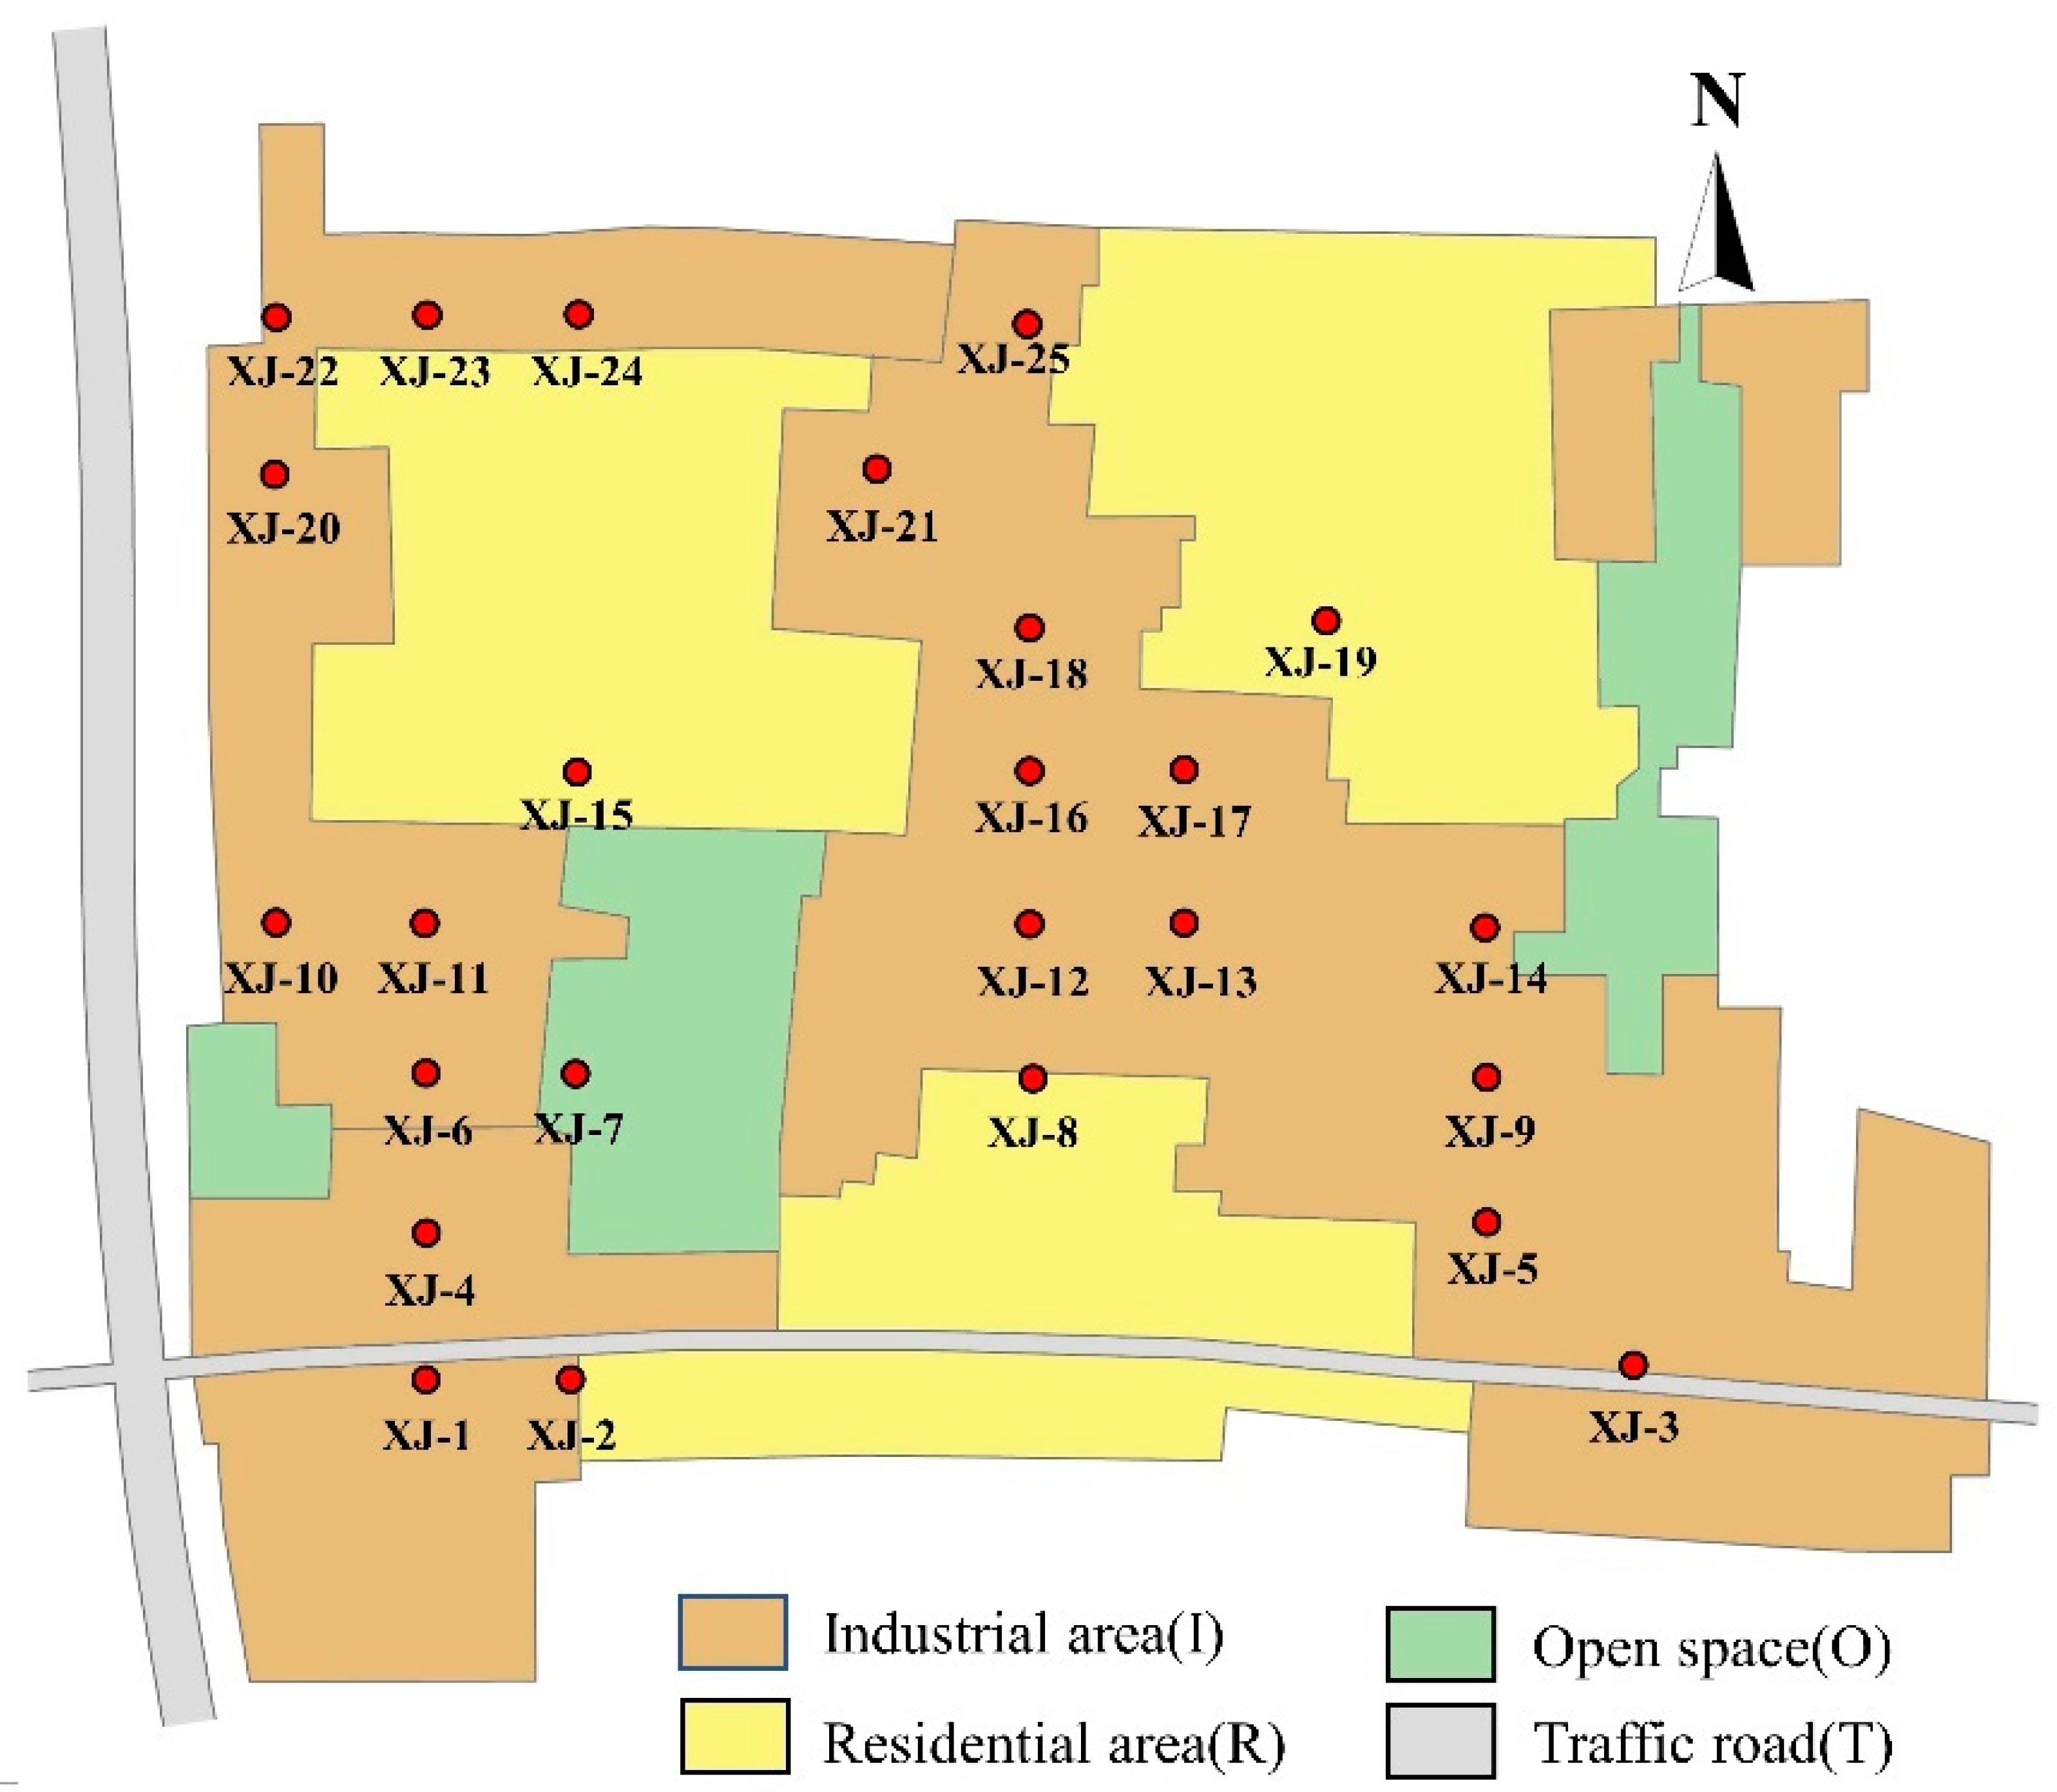
Through the risk screening of quick detection, there were 25 points selected as high-risk contaminated. Based on the identification of RS image and on-site survey, the land use types in this research mainly included residential land, industrial land and open space. Additionally, residential land and open space were divided into three clusters, respectively (Figure 3). A total of 84% of the high-risk contaminated points were located in industrial areas.

3.2. Confirmation Laboratory Analyses

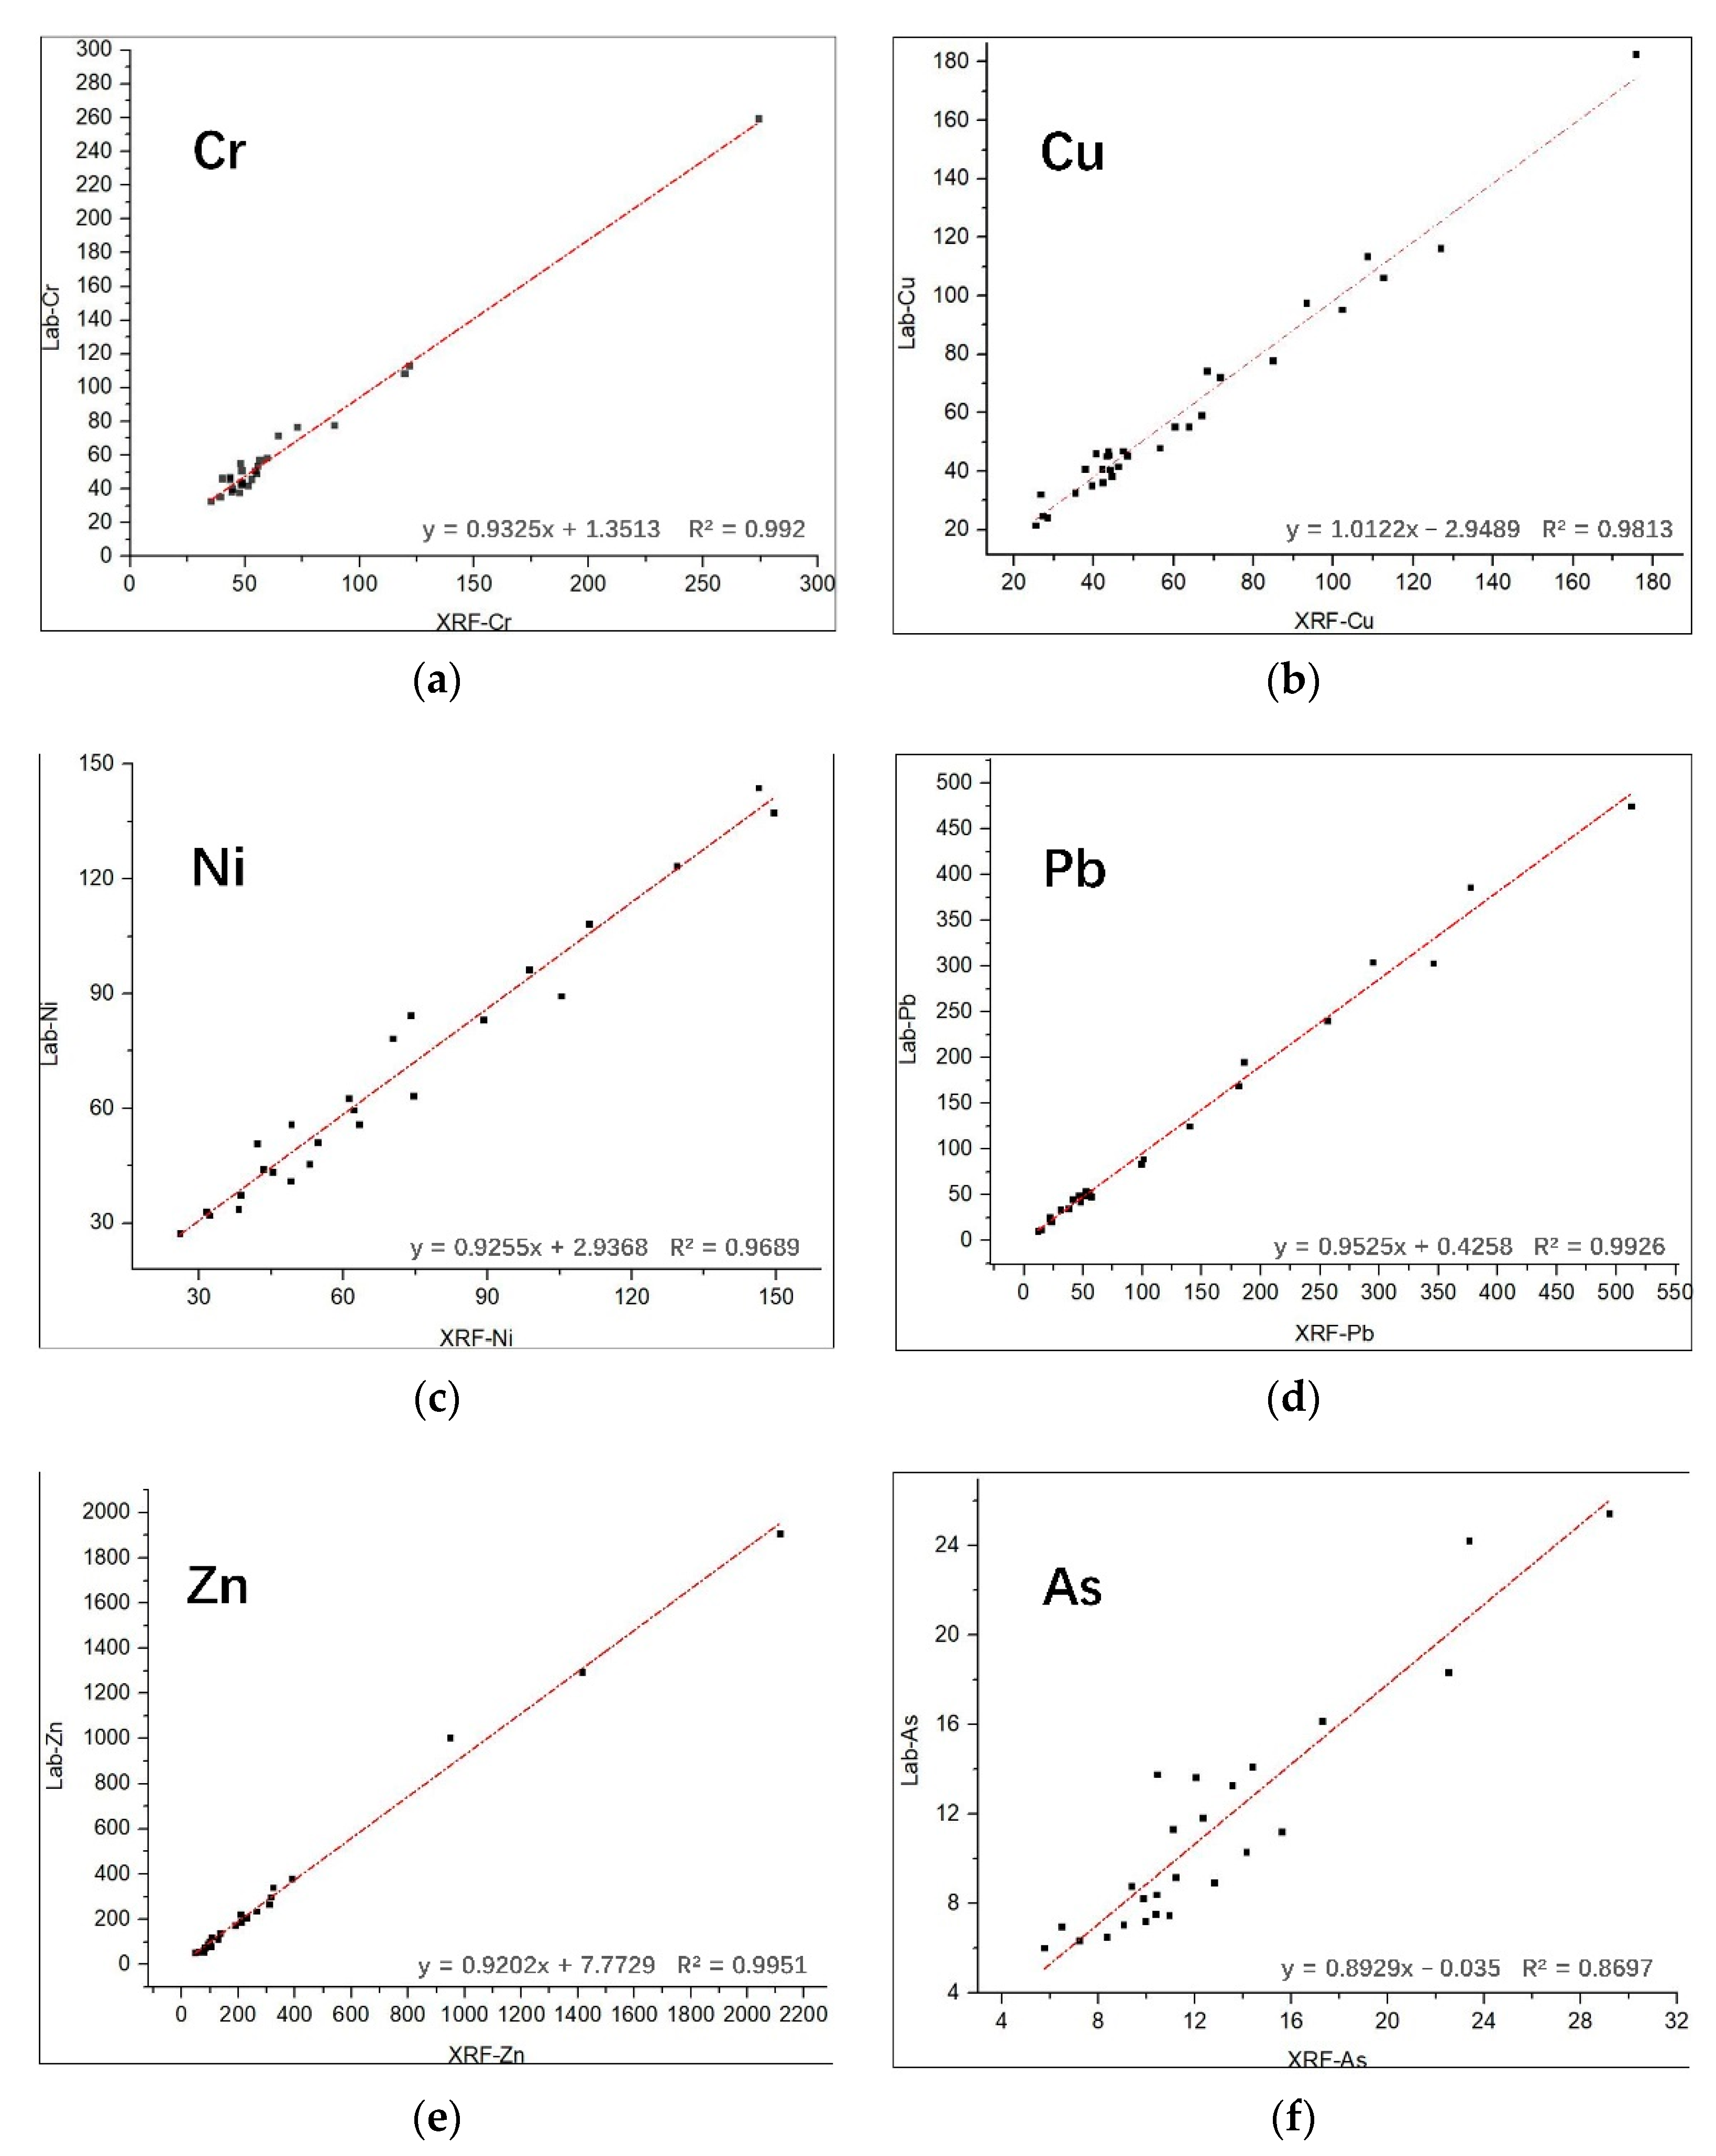
In total, 25 high-risk contaminated points were sampled. The mean absolute percent differences between XRF and laboratory analysis results of Cr, Cu, Ni, Pb, Zn and As were 7.94%, 8.98%, 8.41%, 10.28%, 11.17% and 19.49%, respectively. Generally, the correlation coefficients (Pearson’s r) between these two arrays were all greater than 93.26%. Results from ICP-MS and Atomic Fluorescence Spectrometer corroborated the findings achieved from XRF quick detection. As shown in Figure 4, satisfying correlations (R2 > 0.9) were observed between XRF and laboratory analysis concentrations of Cr, Cu, Ni, Pb, and Zn. Among them, the correlations of Zn and Pb were most significant. In addition, XRF concentrations were slightly higher than the results from laboratory analysis in general. Especially for As, the average concentration of laboratory analysis was 10.99% less than that for XRF. Through linear regression fit, the mathematical relations between the concentrations measured by XRF and laboratory analysis were established.
The statistics of heavy metal concentrations at 25 sampling points are shown in Table 3. The mean concentrations in soil of Cd, Cr, Cu, Ni, Pb, Zn, Hg and As were 0.38 mg·kg−1, 63.90 mg·kg−1, 63.81 mg·kg−1, 67.25 mg·kg−1, 116.95 mg·kg−1, 309.98 mg·kg−1, 0.19 mg·kg−1 and 11.30 mg·kg1, respectively. Except for Cd, the mean concentrations of other seven heavy metals exceeded the background values of Shaanxi province. In particular, the mean concentrations of Pb and Zn were 5.47 and 4.47 times larger, respectively, than background values. It indicated that specific human activities in urban village resulted in the significant increase in concentrations of Pb and Zn. The CV of Pb and Zn were larger than 100%, reaching 109.91% and 142.21%. It reflected the concentrations of Pb and Zn in different sampling points were divergent, and the overall data dispersion was high. By comparison, the CV of As was the lowest, which was 46.30%. It showed the numerical variation of As at different points was relatively small.
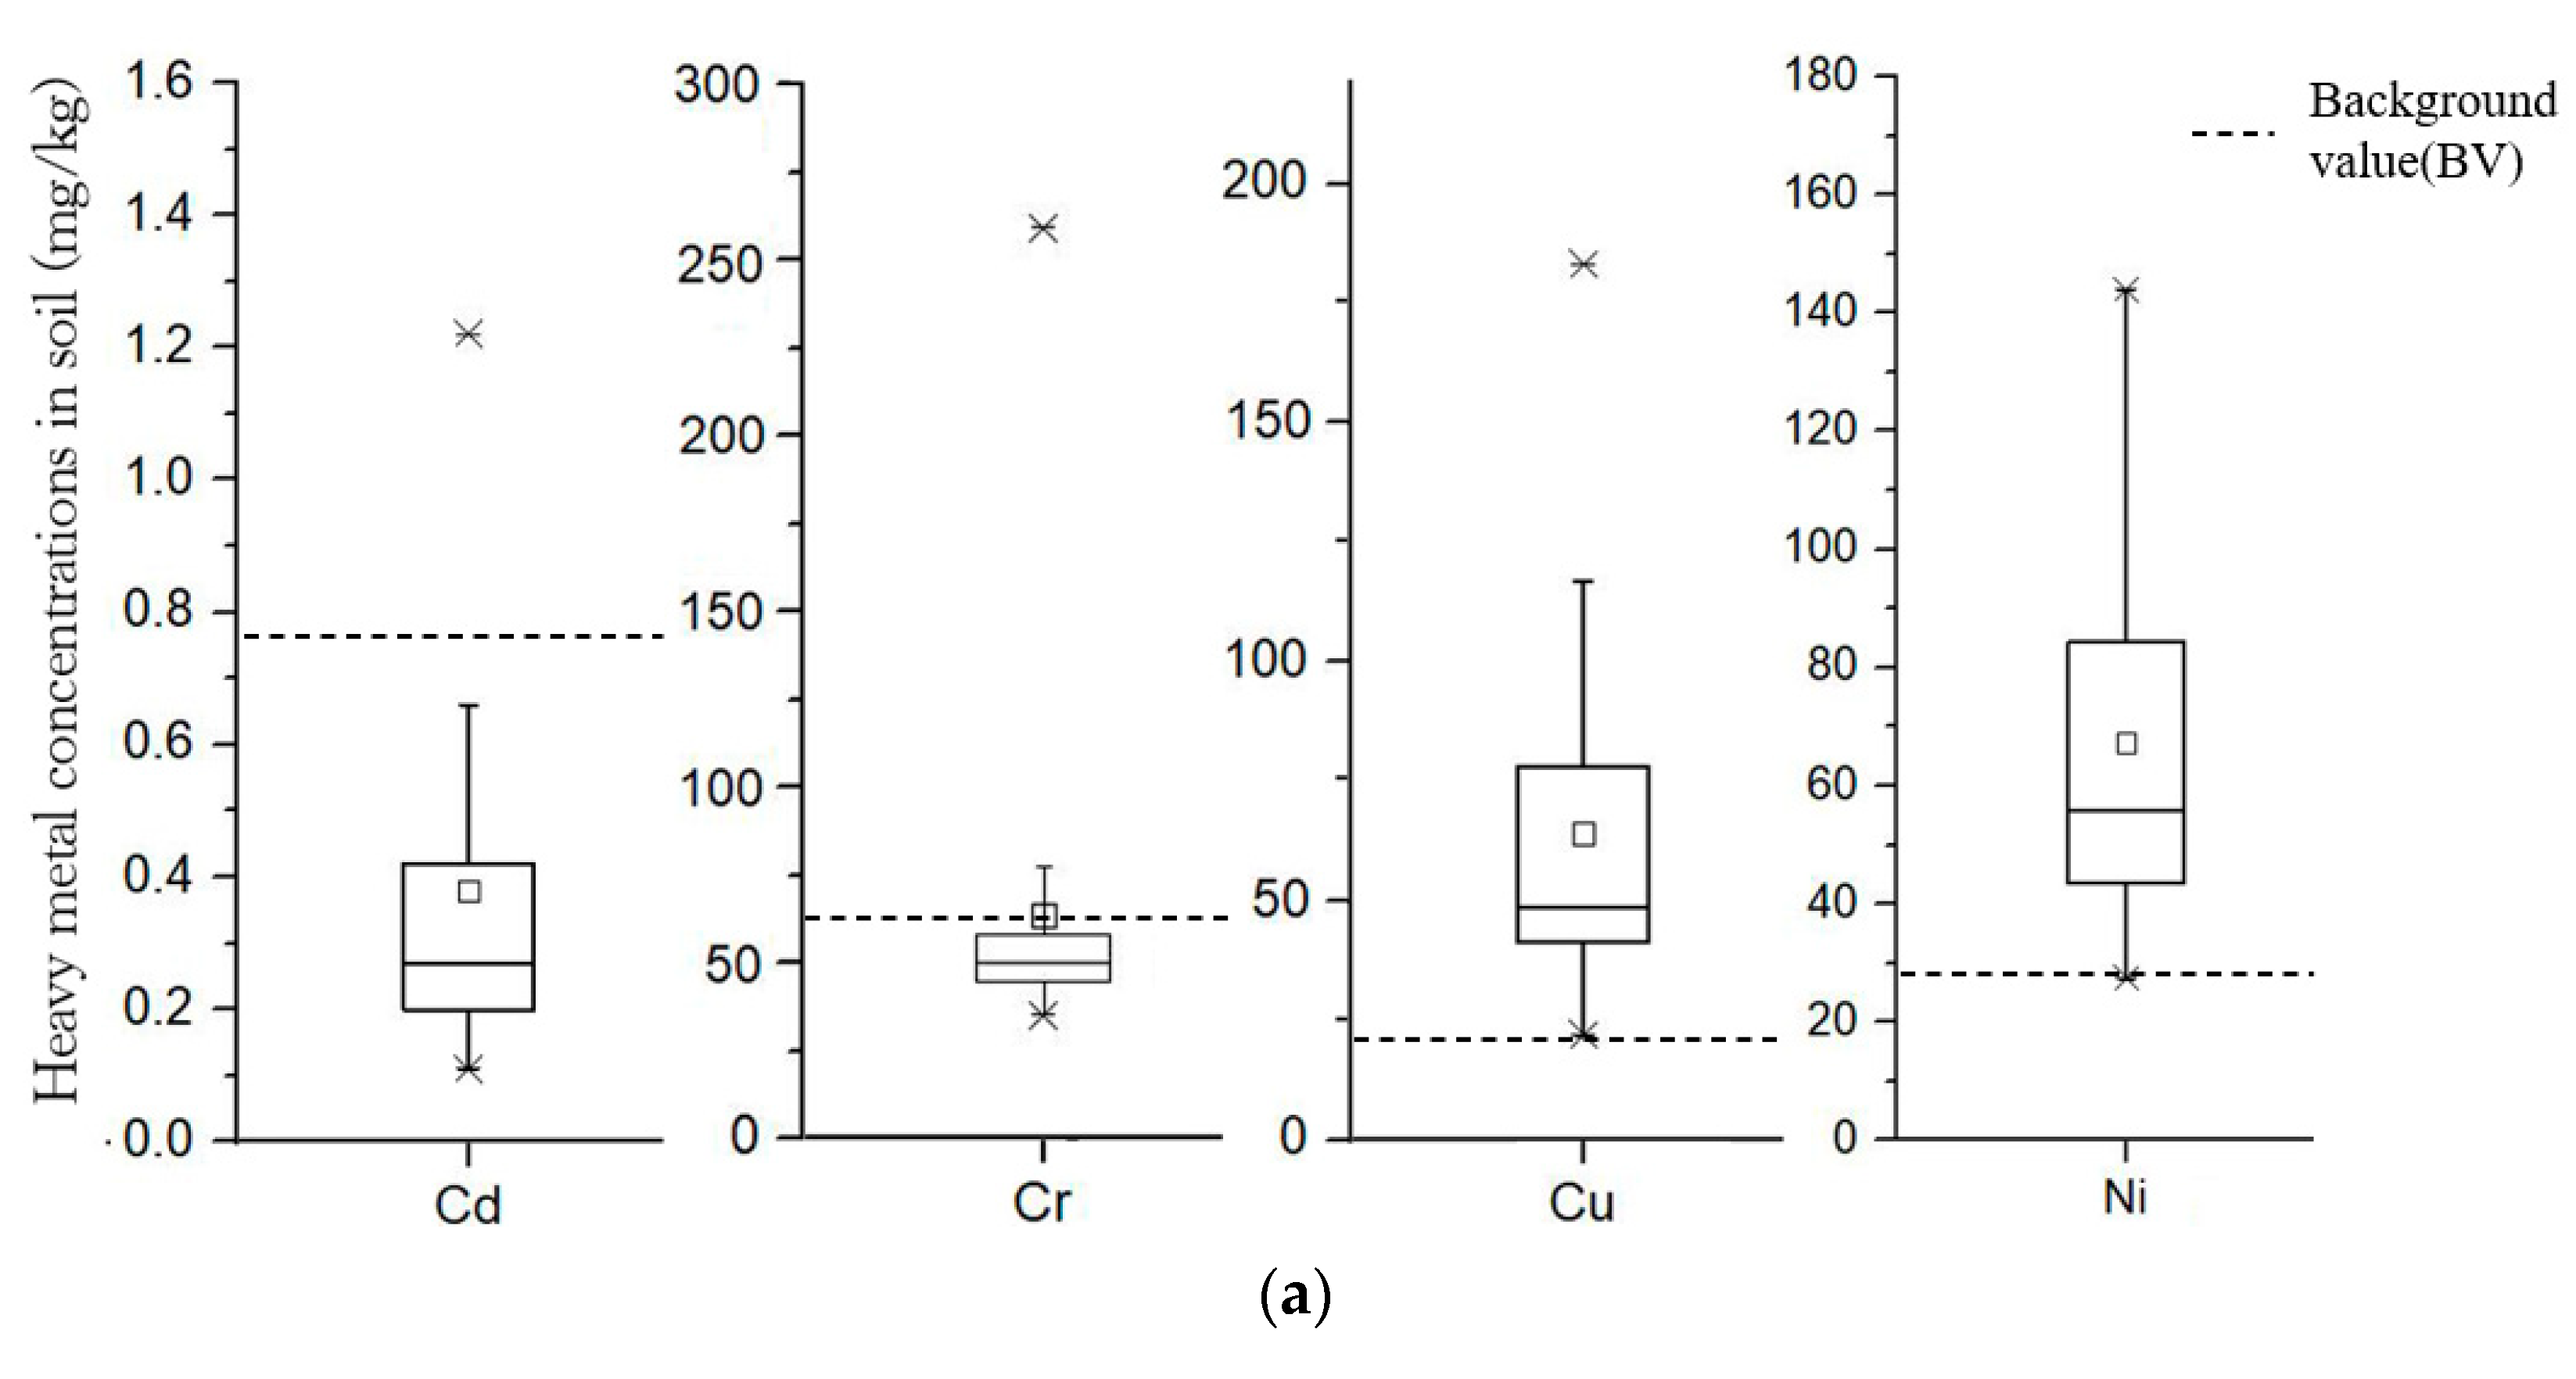
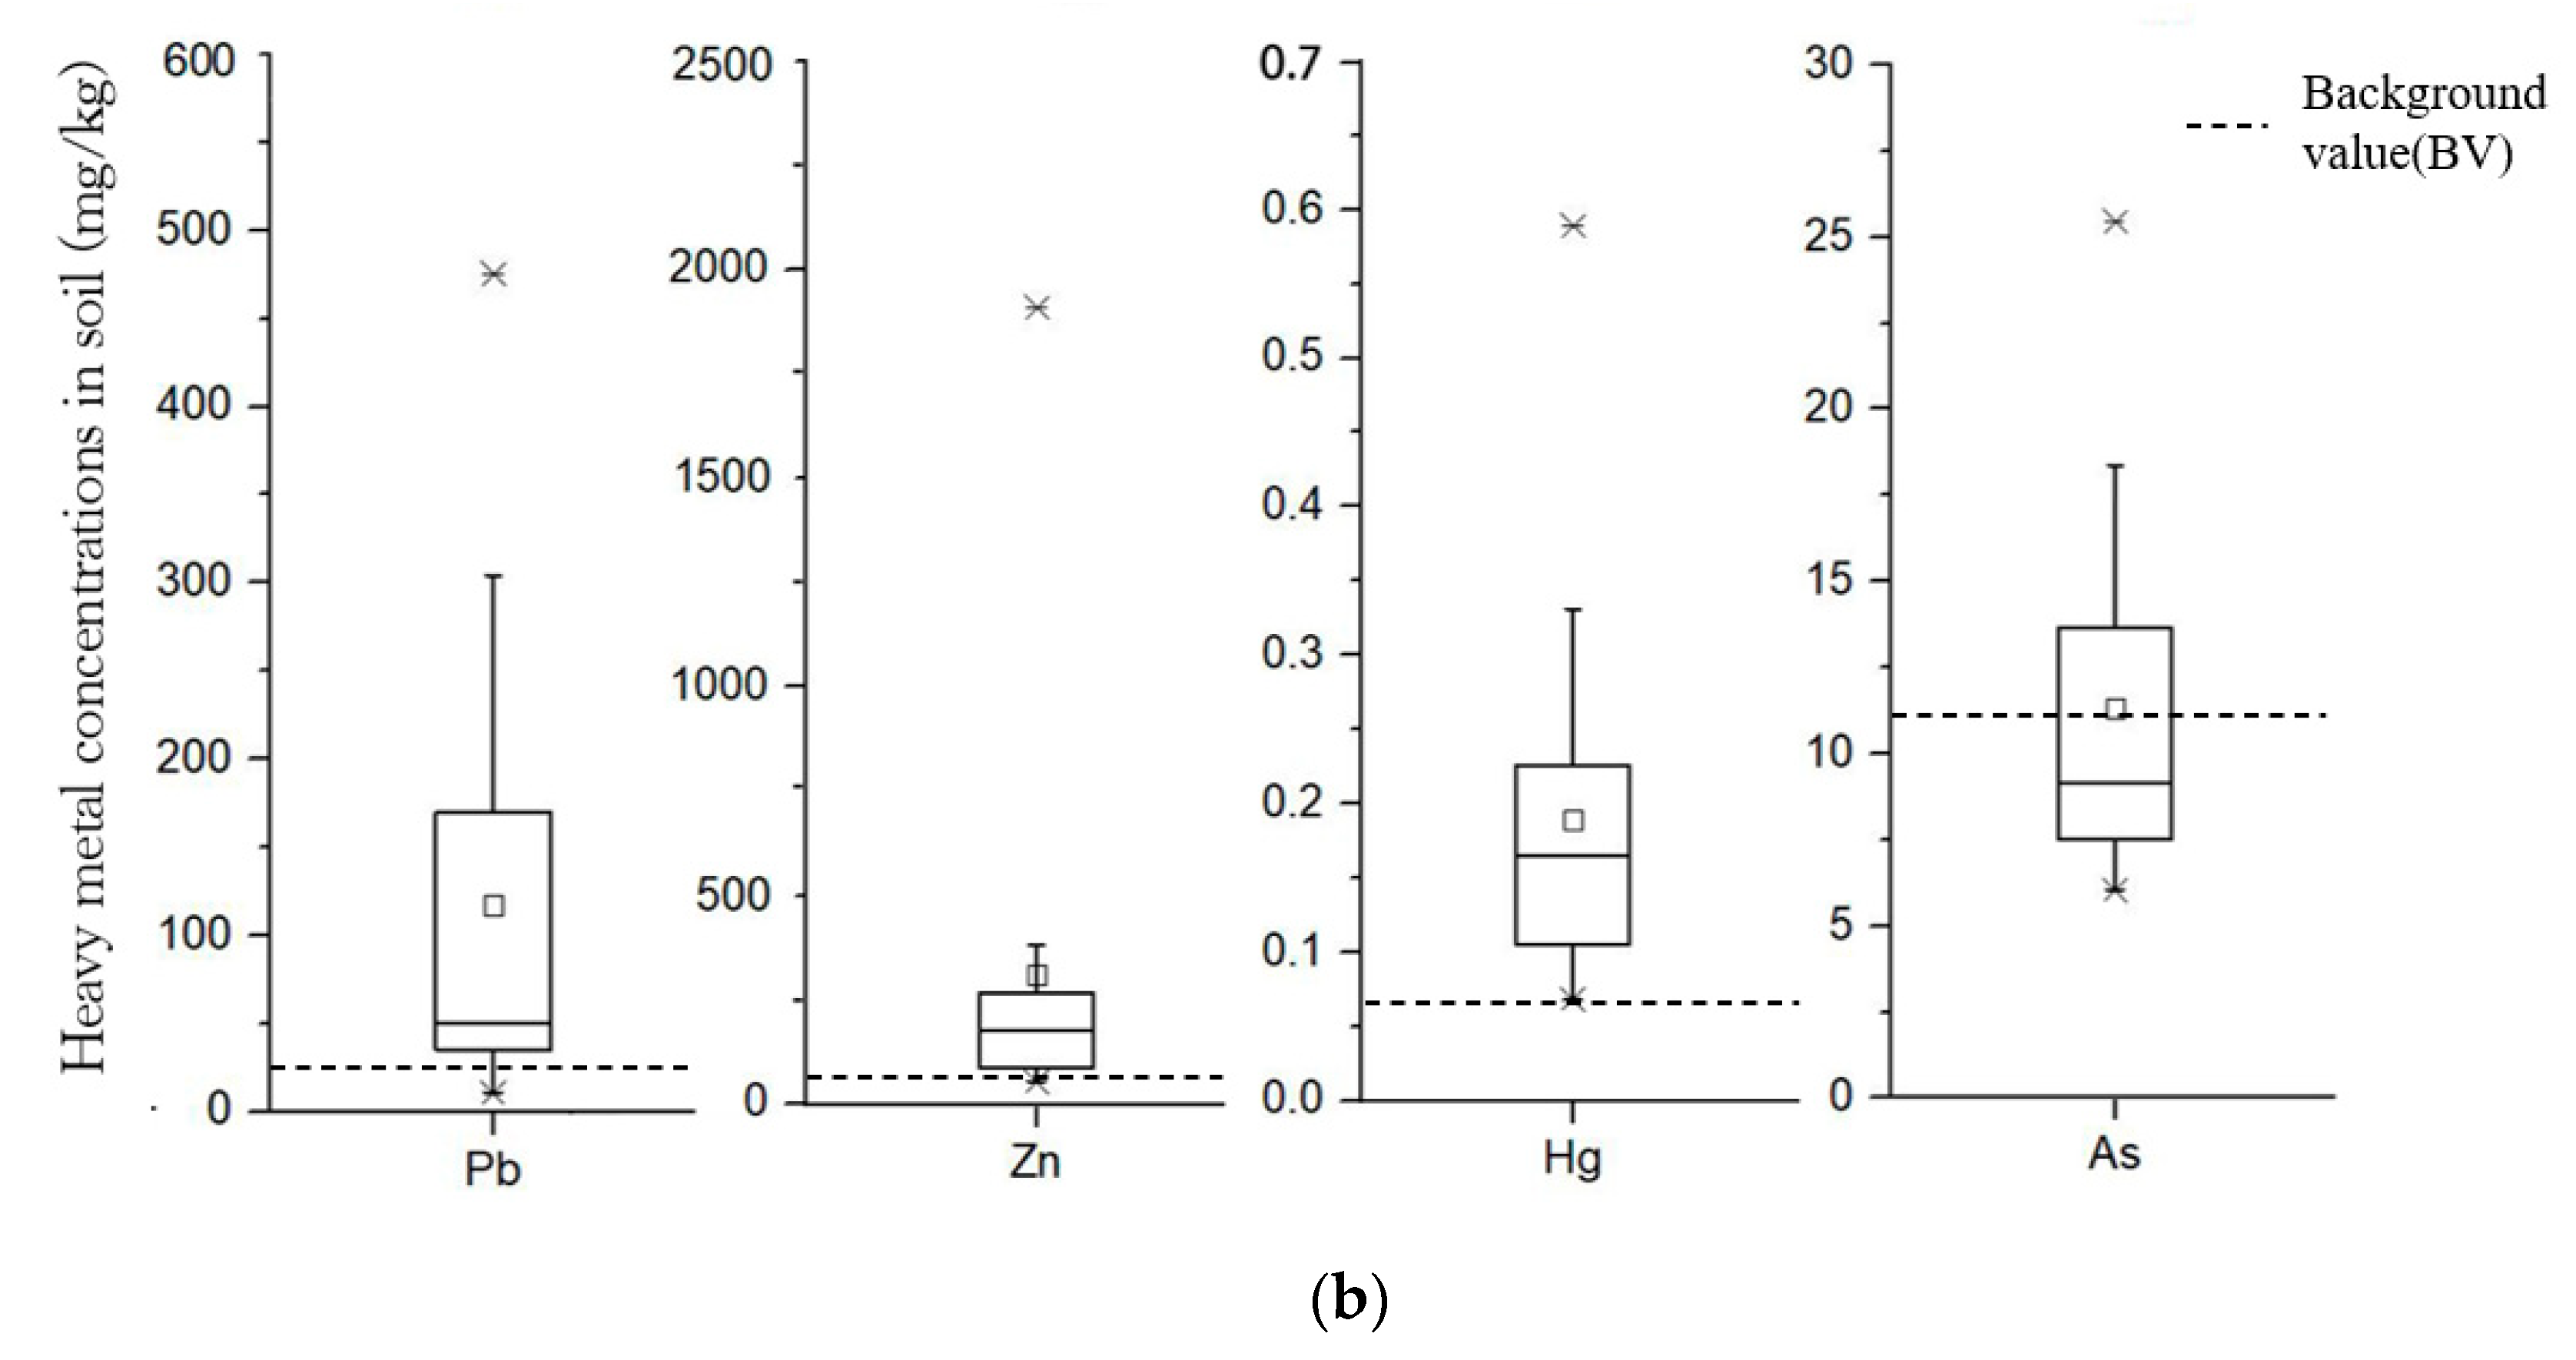
As shown in Figure 5, it was found that all the heavy metal elements analyzed in this research had obvious outlier, except Ni. The background value of Cd was remarkably greater than the upper limit of the box plot. It showed that the overall concentration values of Cd were low, and most values were significantly lower than the background value. The box’s height of Cr was low. The mean concentrations of Cr, approaching to background value, were slightly higher than the upper interquartile of the box plot. It indicated that the numerical distribution was very concentrated, except the outlier, and these values were relatively low. Additionally, the skewness of Cr was 3.70, which was the largest. It indicated the right-skewness distribution of Cr was significant. Meanwhile, only 24% of all sampling points exceeded background value regarding Cr. This situation reflected the dispersion of Cr, especially in relatively high-value zone, was obvious. Similarly, the skewness of Zn was 2.73 (Skew > 0). However, its lower interquartile was greater than background value. It not only showed most of the Zn values exceeded background value, but also the data dispersion was significant. The increased concentrations of specific heavy metal elements in soil were probably affected by regional human activities.
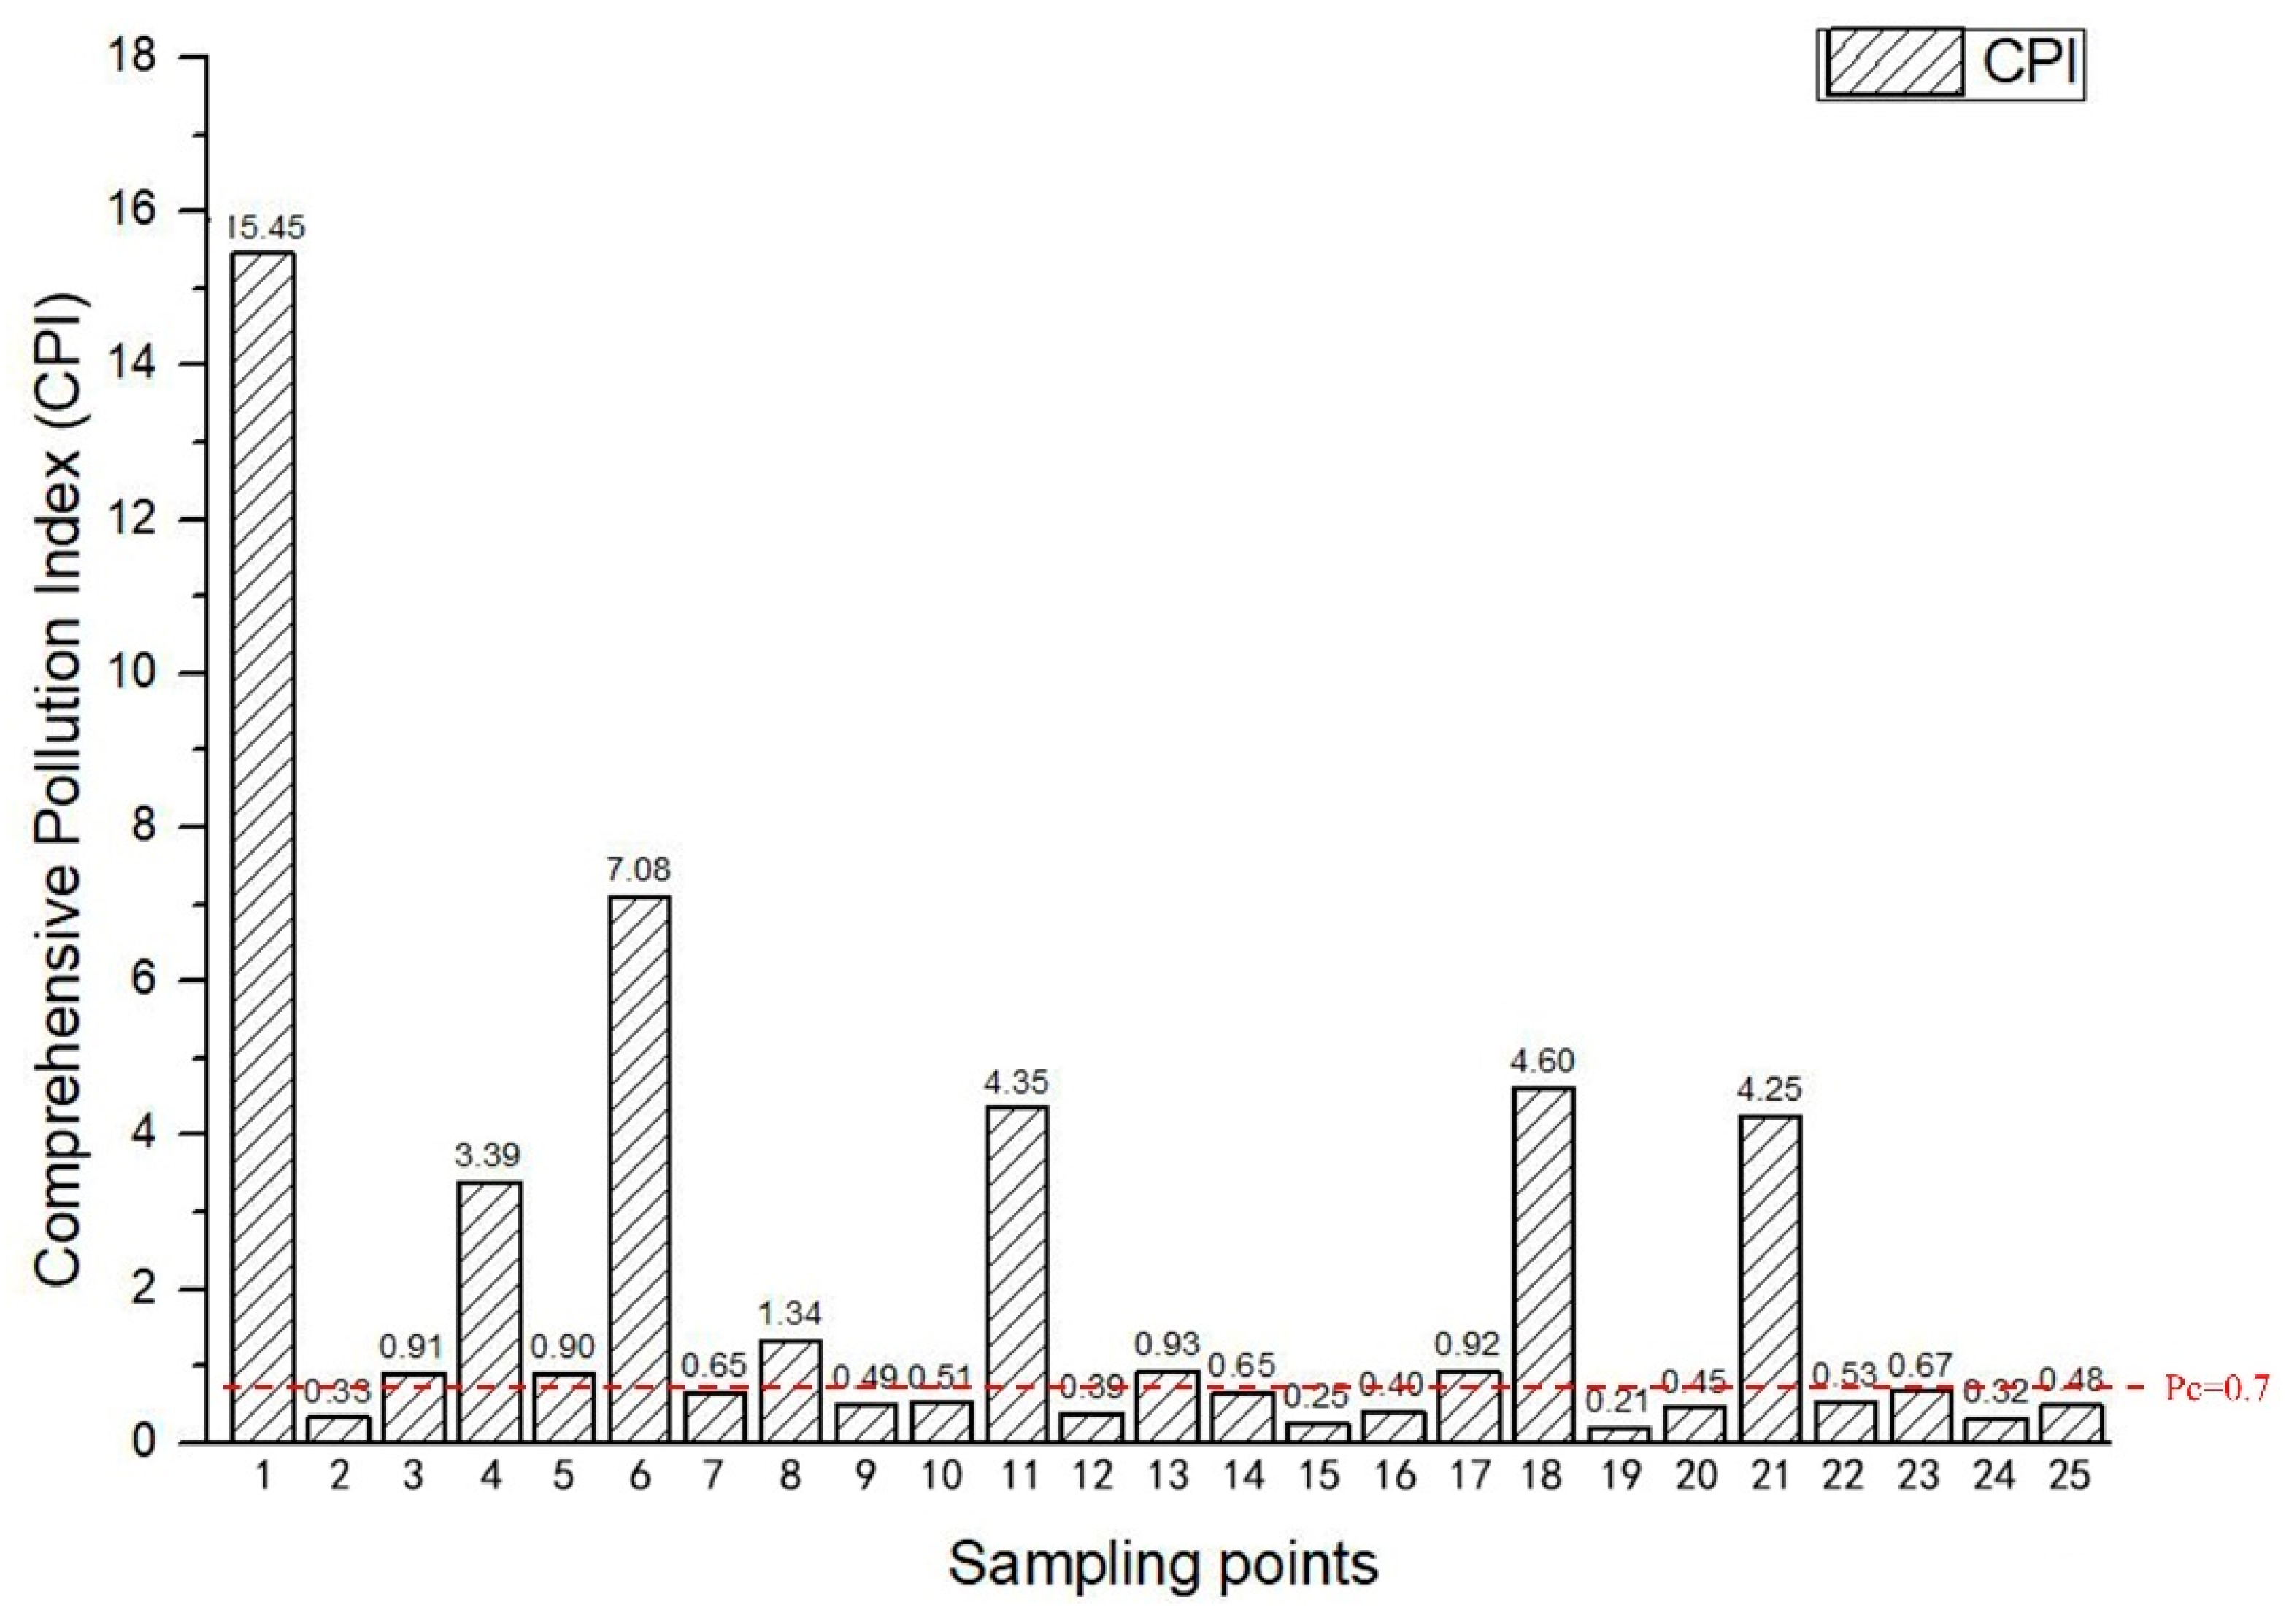
From the calculation results of SPI, the proportions of Cd, Zn and Cr, whose Pi was larger than 1, were 44%, 28% and 24%, respectively. The results of CPI are shown in Figure 6. According to the evaluation criteria in this research, the following results are noted: a total of 14 samples were clean (Level I), accounting for 56% of the total; four samples were low polluted (Level II), accounting for 16% of the total; one sample was moderately polluted (Level III), accounting for 4% of the total; six samples were significantly highly polluted (Level V), accounting for 24% of the total. It manifested that the difference in CPI between points was huge. The maximum was 15.45 at point 1, and the minimum was 0.21 at point 19. All the significantly highly polluted points were located in industrial areas, which showed obvious agglomeration characteristics.
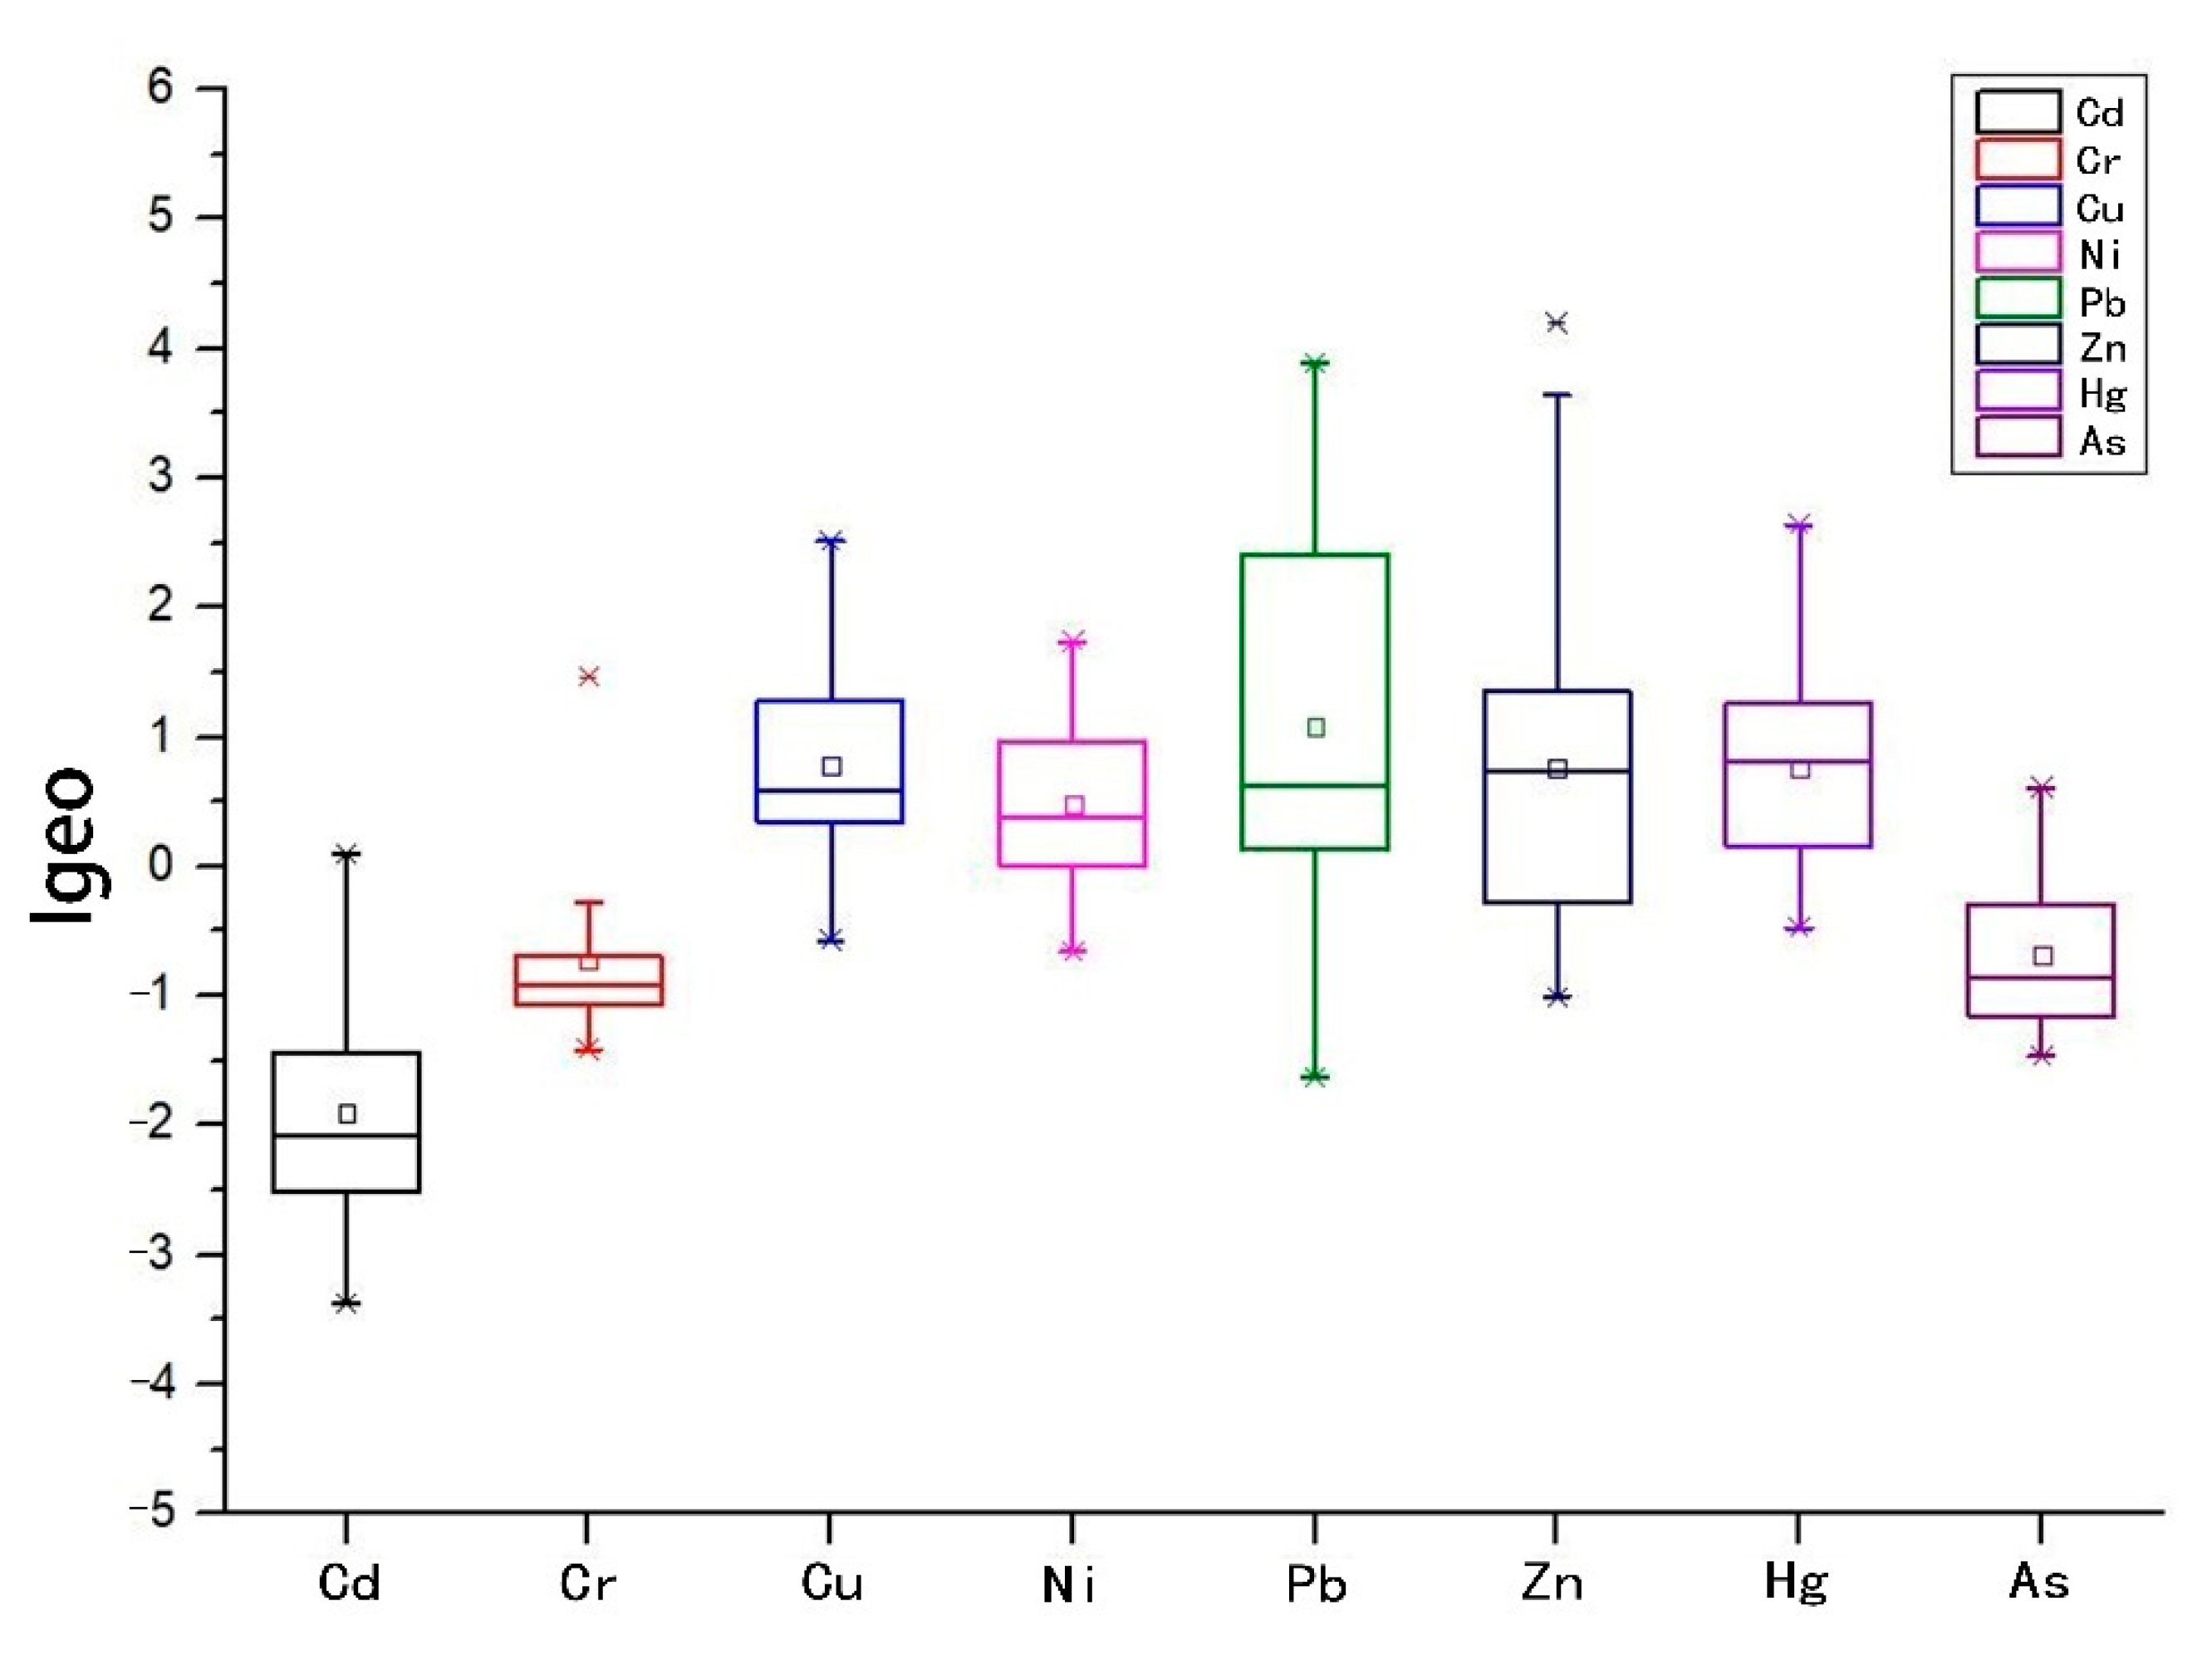
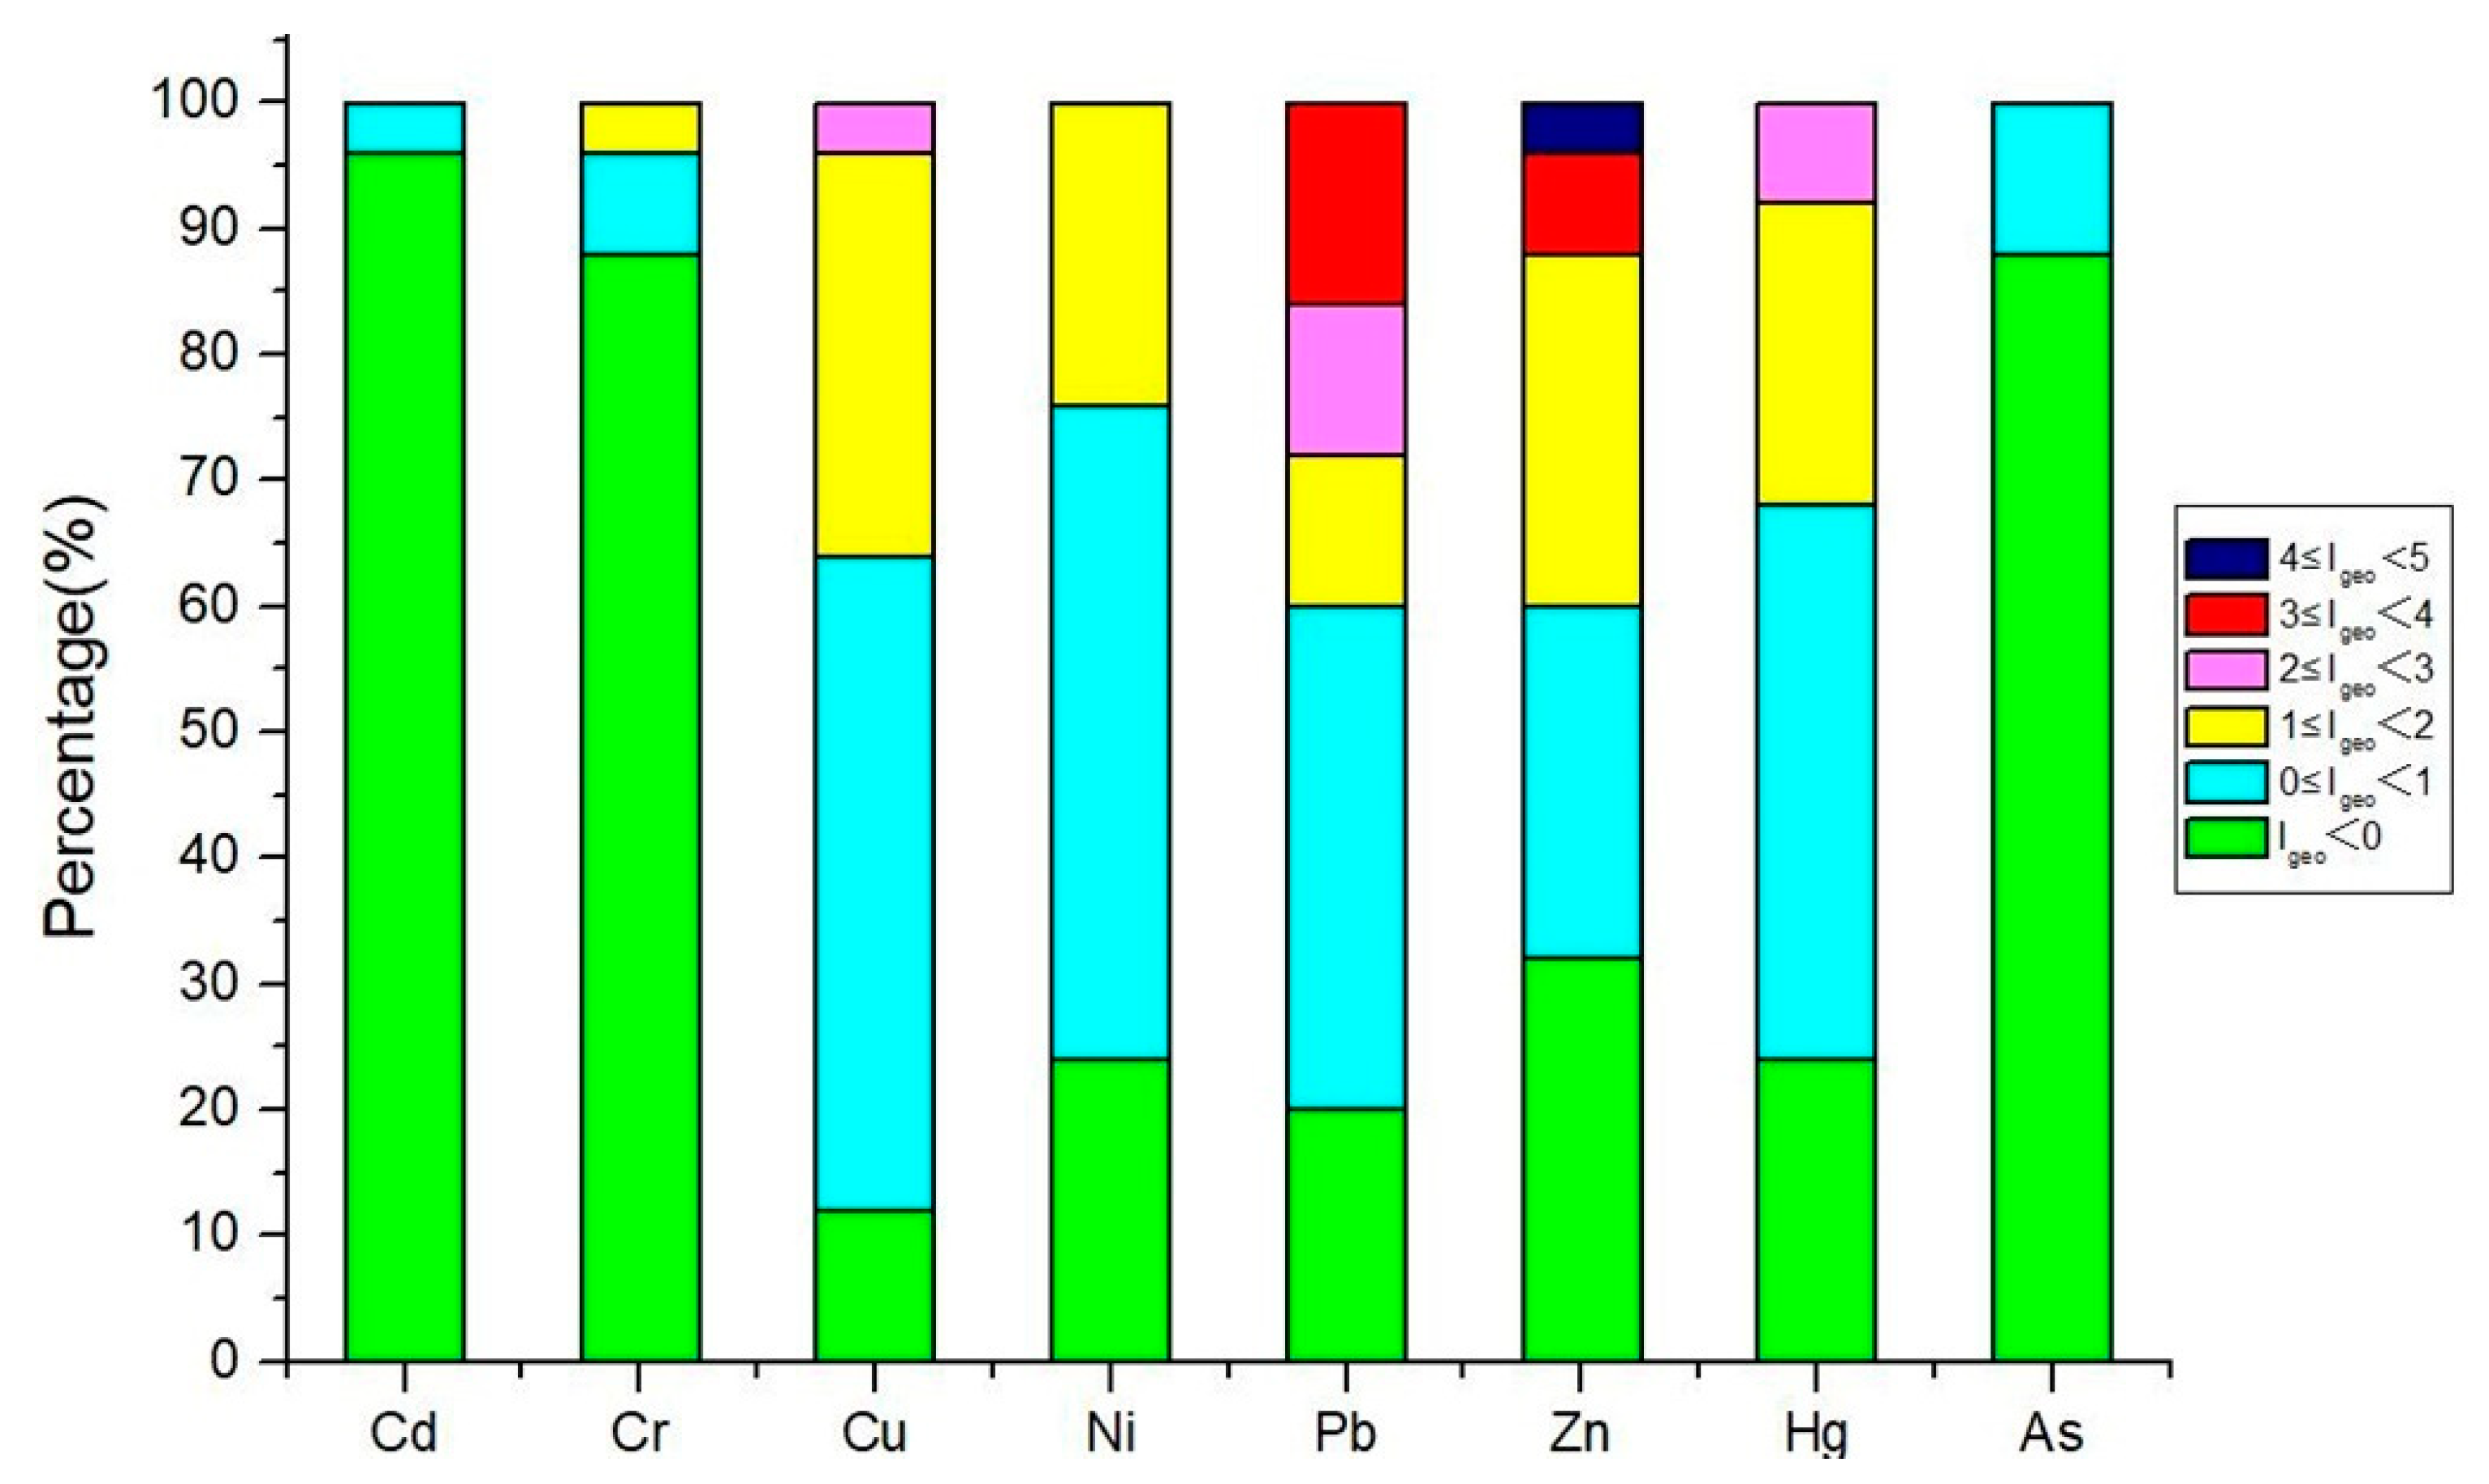
The statistical results of Igeo are shown in Figure 7. The mean Igeo values were arranged in the order of Pb(1.09) > Cu(0.78) > Zn(0.77) > Hg(0.76) > Ni(0.48) > As(−0.68) > Cr(−0.73) > Cd(−1.89). A large majority of Igeo(Cd), Igeo(Cr) and Igeo(As) were not polluted, accounting for 96%, 88% and 88%, respectively (Figure 8). For Igeo(Cd) and Igeo(As) in particular, the values were all lower than 1. These heavy metals concentrations were relatively low, which were close to natural background values. However, Cu, Pb, Zn and Hg exhibited signs of heavy pollution. In total, 28% of all sampling points were above moderate pollution regarding Igeo(Pb). Igeo(Pb) at point 4 reached 3.89 among them. The maximum Igeo(Zn) existed at point 1, which was 4.20 (heavily polluted to extremely polluted). Furthermore, the Igeo values of Pb and Zn fluctuated clearly. It indicated that the concentrations of Pb and Zn were high in general, and several samples were seriously contaminated.
RI values were calculated at all 25 sampling points. The potential ecological risk index of single heavy metal was calculated. From the view of biological toxicity assessment, the results showed the overall potential ecological risks were low except for Hg and Pb. The average values of Er(Hg) were 120.30, which was wholly at considerable level. The maximum values of Er(Hg) were 373.97 at point 1, reaching significantly high level. Although the average values of Er(Pb) were 27.33, less than 40 (low level), 24% of total samples exceeded 40 with its maximum Er(Pb) 111.02 at point 4. It showed that there were considerable ecological risks in the specific region. The results of SPI and Igeo reflected the concentrations of Zn were high. However, since Tr of Zn was 1, the Er(Zn) was only 4.46. It had no potential risks to the ecological environment.
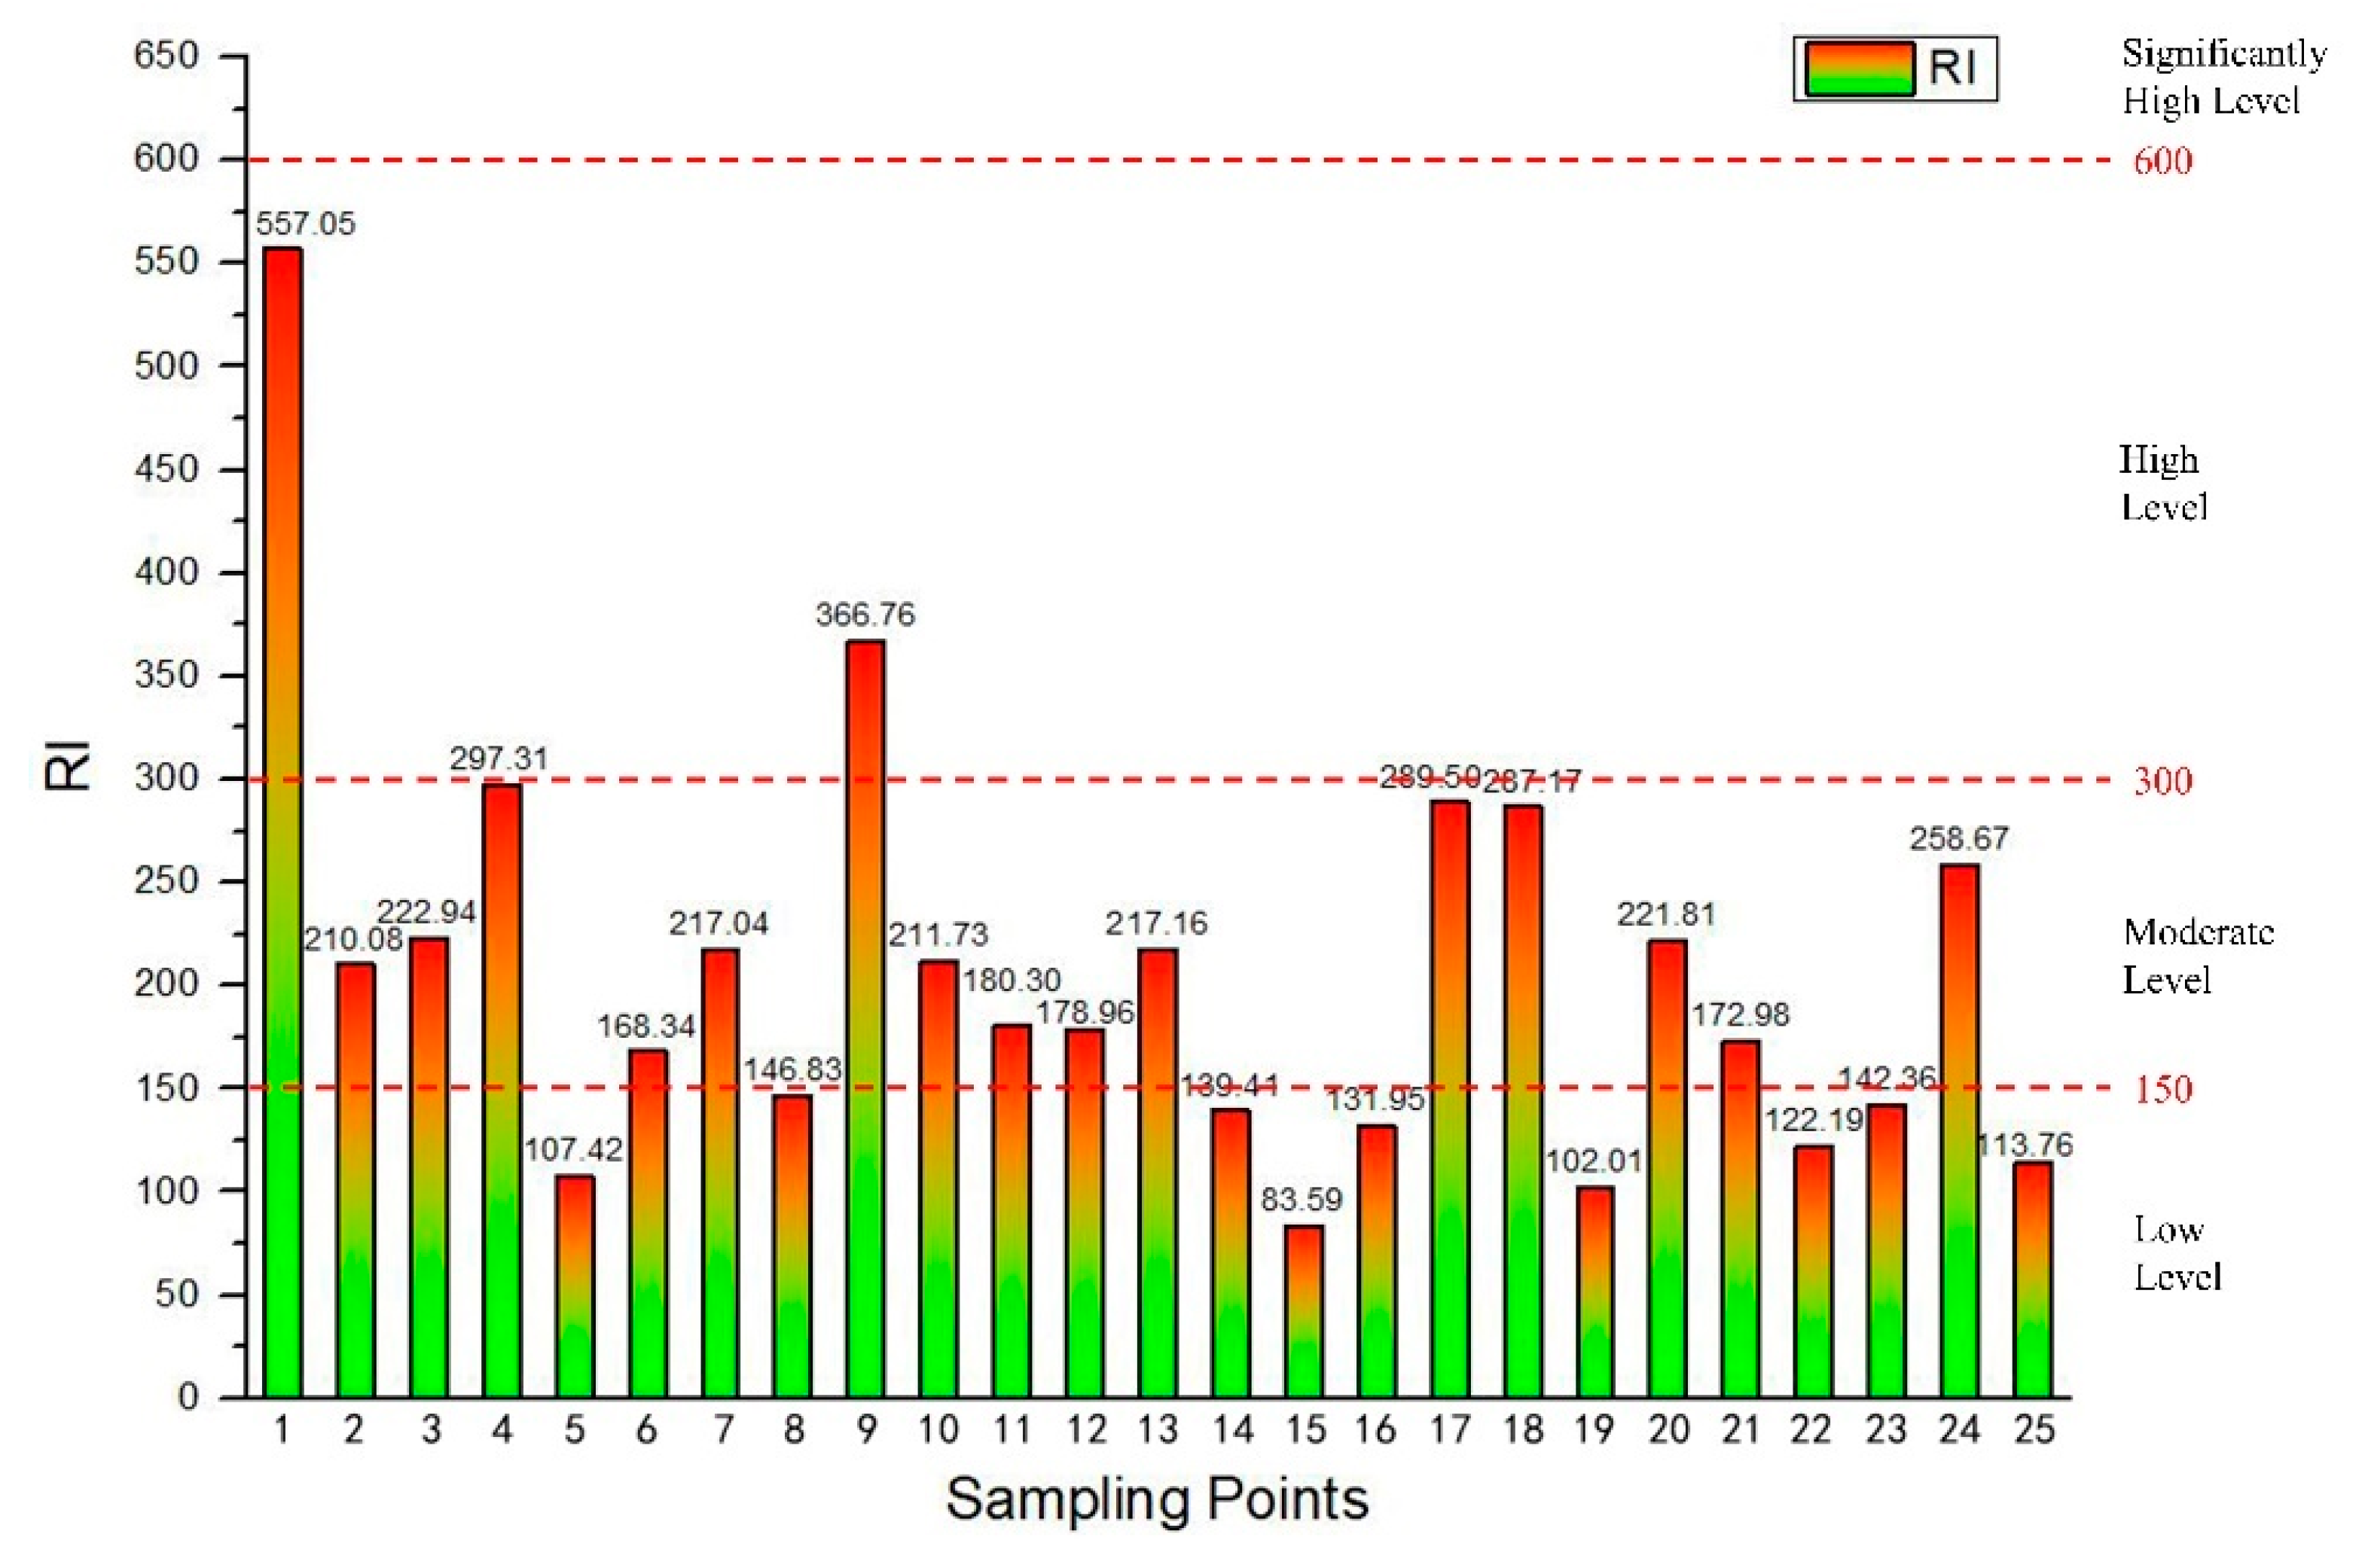
The results of RI were shown in Figure 9. Generally, nine samples were at low risk level, accounting for 36%. In total, 14 samples were at moderate risk level, accounting for 56%. Point 1 and point 9 were at high risk level, which were 557.05 and 366.76, respectively. The large values of Er(Hg) was the main factor causing high ecological risk. From the perspective of spatial distribution and land use, the ecological risk of industrial land was dramatically higher than that of residential land. The RI at point 8, 15 and 19 were located in residential areas, which were 146.83, 83.59 and 102.01, respectively. They were all less than 150 and at low risk level. In addition, point 7 was sampled at open space. Its RI value was 217.04, which was at moderate risk level.

3.3. Source Identification

According to Table 4, Pb-Ni and Pb-Zn showed highly significant positive correlation at p < 0.01 level, the correlation coefficients reaching 0.557 and 0.417, respectively. Ni-Zn showed significant positive correlation at p < 0.05, whose correlation coefficient was 0.254. Therefore, there were notable pairwise correlation among Pb, Zn and Ni, indicating these probably resulted from similar pollution sources. Based on KMC results (Table 5), 80 sampling points were classified into four clusters. Cluster 1 included 73 samples, which was the largest and accounted for 91.25% in total. It showed that the heavy metal concentrations in most research areas were in a stable and normal condition. In general, these samples were all lower than the criteria of risk control. Clusters 2 and 3 indicated the variation of Pb, Zn and Ni were notably similar and accordant. In addition, it was consistent with the results of Pearson correlation analysis.
Based on Pearson correlation analysis, this research conducted PCA and results were shown in Table 6 and Table 7. The Kaiser–Meyer–Olkin (KMO) measure of sampling adequacy was 0.598 (KMO > 0.5), and the significance of Bartlett’s test of sphericity was 0.000 (Sig. < 0.001). This research extracted four PCs, whose initial eigenvalues were larger than 0.8. These four PCs cumulative contribution rates were over 80.00%, reaching 81.67%. The contribution rates of PC1 were 32.29%. PC1 showed high positive loadings in Ni, Pb and Zn, reaching 0.763, 0.838 and 0.640, respectively. Combined with correlation analysis, it was confirmed that Ni, Pb and Zn originated from similar pollution sources. These heavy metal materials are widely used in petroleum, automobile, printing and food processing industries. Therefore, this result was in line with the industrial characteristics of the research areas. The contribution rates of PC2 were 20.80%, and it showed high positive loadings in Cr and As. The research areas were located in the suburbs of the city, and agricultural and industrial activities were particularly active. Pesticides, industrial sewage and dust contain these metallic elements, leading to the accumulation of heavy metal concentrations in soil.

4. Discussion

4.1. Method of Investigation

Previous studies have pointed out the advantages of the XRF technique that is non-destructive, more efficient and low cost, compared with conventional sampling and laboratory-based measurement [52,53]. This research adopted methods combined XRF quick detection with confirmation laboratory analysis. It greatly reduced the amount of sampling points and improved efficiency, while ensuring the accuracy of detection results. It proved the advantages and worth of the XRF technique in soil environment investigation. Additionally, this research proposed to carry out laboratory-based analysis for high-value zones. The regression fit lines were used for numerical correction. This method can increase the accuracy and reliability of results. In this study, the results from XRF and laboratory analysis coincided. The mean absolute percent differences in between were less than 12%, except As, reaching 19.49%. Radu et al. researched the heavy metal concentrations at silver mines and showed an excellent correlation between portable XRF instruments and laboratory-based methods [54]. Moreover, the study found that concentrations measured by laboratory analysis were commonly lower than XRF’s results. Meanwhile, this was consistent with the results of Caporale et al. [55], who pointed out the main cause is the incomplete chemical dissolution in the laboratory. Generally, the XRF technique can be used as a replacement for conventional laboratory-based method when the calibration is adequate [56].

4.2. Multi-Sources of Pollution

In this research, the measured values of Pb, Cu, Zn and Ni were significantly higher than the regional background values. The high-value zones of Pb, Zn and Ni were distributed around the south traffic road. Previous study showed these existed large ecological and health risk in suburb areas, and traffic emission is the main pollution source [57]. Through on-site survey, there were many garages, metal recycling and processing factories on both sides of the road. The traffic flow was large, particularly the trucks (Figure 10). Walraven et al. found that Pb pollution in roadside soils was mainly derived from gasoline, which was generally polluted at 0–15 cm depth [58]. There was a building materials production and logistics base in the southwest of research area. The maximum values of Igeo(Pb) and Igeo(Zn) were found in this area. This was consistent with the results of Jeong et al., which found that non-exhaust traffic emissions, e.g., particles from brake pads and tires, contain heavy metal elements. They were demonstrated to be important pollution sources causing the increase in concentrations of Pb and Zn [59]. Zn is one of the essential elements for human body, animals, and plant growth. However, excessive concentrations of Zn will hinder the growth of animals and plants, reducing biological diversity [60,61]. The result from this research indicated the concentration of Zn were relatively high, and yet Er(Zn) was low. This was principally because the biological toxicity of Zn is low. Tri of Zn is only 1, which is the lowest numerically among above eight heavy metals.
The concentrations of Cd, Cr, Cu, Hg and As in soil had been proved to be related to industrial activities, which was consistent with the results of Wang et al. [62]. Hu et al. showed that industrial activities have significant correlation with heavy metal pollution [63]. In this research, 84% of the high-risk points were located in industrial areas. The sampling points located in residential areas were all at low risk level. The average SPI and Igeo of Hg were only 0.38 and 0.76, respectively; however, the heavy metal element Hg has strong bioaccumulation. It can cause great harm to the whole ecosystem and has great chemical toxicity. Therefore, Er(Hg) was generally the highest among eight heavy metals. A mixed use of farmland and construction land is a significant feature of urban village located in suburban areas (Figure 11). Industrial land will increase heavy metal pollution risk of surrounding agricultural land [64]. The chemical raw materials, chemical reaction equipment, industrial dust and waste gas are potential pollution resources, resulting in the increase in heavy metals concentrations in soil. In general, industrial sources and traffic sources are the main factors leading to the increase in heavy metal concentrations in soil. However, as the opinion of Huang et al., agricultural land pollution and agricultural pollutions source should be brought to the attention at peri-urban area [65].

4.3. Sustainability of Urban Village

In China, small-scale enterprises such as equipment manufacturing, materials processing and printing are common in urban village. The production equipment and technical process are relatively primitive in urban village [66]. It probably causes direct harm to the ecological environment. Urban village basically involved industrial land, residential land and open space in this research. Different land types were mixed and intertwined. Through on-site survey, it was found that the workers’ dormitory was close to the industrial plant, and the restaurant was adjacent to the garage. This chaotic layout posed a great threat to the ecological environment and human health. There were many uses for open space, including stacking sundries, dumping domestic waste and planting crops, which represented potential pollution risk. In China, urban village is the inevitable product of urbanization [67]. However, with the improvement of urban environment and high-quality industrial transformation, the living environment of urban villages have continuously improved. According to the list published by the Xi’an government from 2017 to 2019, many enterprises in urban villages had been urged to rectify or forced to close regarding environmental pollution issue. Therefore, strict zoning system should be implemented in urban village, which can reduce pollution risk to the environment.

5. Conclusions

In this research, the method combining in situ XRF detection and laboratory-based analysis was proposed. It turned out to be reliable and cost efficient. The measured concentrations of Pb and Zn were significantly higher than background values. Industrial land was at high risk for heavy metal pollution. There existed obvious pairwise correlation among Pb, Zn and Ni, and these heavy metal accumulations originated from similar automobile traffic and industries activities. Industrial sources and traffic sources were regarded as main factors causing heavy metal accumulation in soil. In addition, agricultural sources, e.g., chemical fertilizers and pesticides, increased the risk of pollution in urban village. In recent years, soil safety has been paid close attention. This research provided a fast, efficient and accurate method for urban large-scale investigation of the soil environment.
In China, urban village is an important part of the city. This research explored the relation among land, industry and heavy metal pollution. The result was of great significance to environmental governance as well as urban planning.

Author Contributions

Conceptualization, S.L.; methodology, S.L.; software, J.L.; validation, S.L., B.P. and J.L.; formal analysis, S.L.; investigation, J.L.; resources, B.P.; data curation, B.P.; writing—original draft preparation, S.L.; writing—review and editing, B.P.; visualization, J.L.; supervision, B.P.; project administration, S.L.; funding acquisition, S.L. All authors have read and agreed to the published version of the manuscript.

Funding

This research was funded by Shaanxi Provincial Department of Science and Technology through Innovation Capability Support Program (Grant No. 2021KRM079).

Institutional Review Board Statement

Not applicable.

Informed Consent Statement

Not applicable.

Data Availability Statement

The data presented in this study are available on request from the corresponding author.

Conflicts of Interest

The authors declare no conflict of interest.

References

  1. Lawler, J.J.; Lewis, D.J.; Nelson, E.; Plantinga, A.J.; Polasky, S.; Withey, J.C.; Helmers, D.P.; Martinuzzi, S.; Pennington, D.; Radeloff, V.C. Projected land-use change impacts on ecosystem services in the United States. Proc. Natl. Acad. Sci. USA 2014, 111, 7492–7497. [Google Scholar] [CrossRef] [Green Version]
  2. Xie, H.L.; He, Y.F.; Choi, Y.; Chen, Q.R.; Cheng, H. Warning of negative effects of land-use changes on ecological security based on GIS. Sci. Total Environ. 2020, 704, 135427. [Google Scholar] [CrossRef]
  3. National Bureau of Statistics of China. China Statistical Yearbook; China Statistics Press: Beijing, China, 2020; pp. 32–49.
  4. Ministry of Housing and Urban-Rural Development of the People’s Republic of China (MOHURD). China Construction Statistical Yearbook. Beijing. 2020. Available online: http://www.mohurd.gov.cn/xytj/tjzljsxytjgb/jstjnj/index.html (accessed on 8 August 2021).
  5. Ning, J.; Liu, J.Y.; Kuang, W.H.; Xu, X.; Zhang, S.; Yan, C. Spatial-temporal patterns and characteristics of land-use change in China during 2010-2015. J. Geogr. Sci. 2018, 28, 547–562. [Google Scholar] [CrossRef] [Green Version]
  6. Fang, L.; Tian, C.H. Construction land quotas as a tool for managing urban expansion. Landsc. Urban Plan. 2020, 195, 103727. [Google Scholar] [CrossRef]
  7. Li, Q.; Zeng, F.; Liu, S.; Yang, M.; Xu, F. The effects of China’s sustainable development policy for resource-based cities on local industrial transformation. Resour. Policy 2021, 71, 101940. [Google Scholar] [CrossRef]
  8. Hu, Q.; Huang, H.P.; Kung, C.C. Ecological impact assessment of land use in eco-industrial park based on life cycle assessment: A case study of Nanchang High-tech development zone in China. J. Clean. Prod. 2021, 300, 126816. [Google Scholar] [CrossRef]
  9. Zhang, J.F.; Zhang, D.X.; Huang, L.Y.; Wen, H.Z.; Zhao, G.C.; Zhan, D.S. Spatial distribution and influential factors of industrial land productivity in China’s rapid urbanization. J. Clean. Prod. 2019, 234, 1287–1295. [Google Scholar] [CrossRef]
  10. Zhang, Z.F.; Liu, J.; Gu, X.K. Reduction of industrial land beyond Urban Development Boundary in Shanghai: Differences in policy responses and impact on towns and villages. Land Use Policy 2019, 82, 620–630. [Google Scholar] [CrossRef]
  11. Bertaud, A.; Renaud, B. Socialist Cities without Land Markets. J. Urban Econ. 1997, 41, 137–151. [Google Scholar] [CrossRef]
  12. Gao, W.; Ma, K.X.; Liu, H.M. Policy evolution of the economical and intensive utilization of industrial land in China since 1978. China Land Sci. 2013, 27, 37–43. [Google Scholar]
  13. Zhao, X.; Shang, Y.P.; Song, M.L. Industrial structure distortion and urban ecological efficiency from the perspective of green entrepreneurial ecosystems. Soc.-Econ. Plan. Sci. 2020, 72, 100757. [Google Scholar] [CrossRef]
  14. Yin, G.Y.; Lin, Z.L.; Jiang, X.L.; Qiu, M.L.; Sun, J. How do the industrial land use intensity and dominant industries guide the urban land use? Evidences from 19 industrial land categories in ten cities of China. Sustain. Cities Soc. 2020, 53, 101978. [Google Scholar] [CrossRef]
  15. Peng, C.; He, Y.L.; Guo, C.H.; Xiao, X.Y.; Zhang, Y. Characteristics and risk assessment of heavy metals in urban soils of major cities in China. Environ. Sci. 2021, 43, 1–10. [Google Scholar] [CrossRef]
  16. Yuan, X.H.; Xue, N.D.; Han, Z.G. A meta-analysis of heavy metals pollution in farmland and urban soils in China over the past 20 years. J. Environ. Sci. 2021, 101, 217–226. [Google Scholar] [CrossRef]
  17. Sun, L.; Guo, D.K.; Liu, K.; Meng, H.; Zheng, Y.J.; Yuan, F.Q.; Zhu, G.H. Levels, sources, and spatial distribution of heavy metals in soils from a typical coal industrial city of Tangshan, China. CATENA 2019, 175, 101–109. [Google Scholar] [CrossRef]
  18. Ministry of Ecology and Environmental of P. R. China (MEE); Ministry of Natural Resources of P. R. China (MNR). The Communique for Soil Contamination Status Survey in China. Beijing. 2014. Available online: http://www.mee.gov.cn/gkml/sthjbgw/qt/201404/t20140417_270670.htm (accessed on 10 August 2021).
  19. Chen, T.B.; Zheng, Y.M.; Lei, M.; Huang, Z.C.; Wu, H.T.; Chen, H.; Fan, K.K.; Yu, K.; Wu, X.; Tian, Q.Z. Assessment of heavy metal pollution in surface soils of urban parks in Beijing, China. Chemosphere 2005, 60, 542–551. [Google Scholar] [CrossRef]
  20. Guo, G.H.; Wu, F.C.; Xie, F.Z.; Zhang, R.Q. Spatial distribution and pollution assessment of heavy metals in urban soils from southwest China. J. Environ. Sci. 2012, 24, 410–418. [Google Scholar] [CrossRef]
  21. Taati, A.; Salehi, M.H.; Mohammadi, J.; Mohajer, R.; Díezc, S. Pollution assessment and spatial distribution of trace elements in soils of Arak industrial area, Iran: Implications for human health. Environ. Res. 2020, 187, 109577. [Google Scholar] [CrossRef]
  22. Nikolaeva, O.; Tikhonov, V.; Vecherskii, M.; Kostina, N.; Fedoseeva, E.; Astaikina, A. Ecotoxicological effects of traffic-related pollutants in roadside soils of Moscow. Ecotoxicol. Environ. Saf. 2019, 172, 538–546. [Google Scholar] [CrossRef]
  23. Briffa, J.; Sinagra, E.; Blundell, R. Heavy metal pollution in the environment and their toxicological effects on humans. Heliyon 2020, 6, e04691. [Google Scholar] [CrossRef]
  24. Sharma, N.; Sodhi, K.K.; Kumar, M.; Singh, D.K. Heavy metal pollution: Insights into chromium eco-toxicity and recent advancement in its remediation. Environ. Nanotechnol. Monit. Manag. 2021, 15, 100388. [Google Scholar] [CrossRef]
  25. Bo, L.J.; Wang, D.J.; Li, T.L.; Li, Y.; Zhang, G.; Wang, C.; Zhang, S.Q. Accumulation and risk assessment of heavy metals in water, sediments, and aquatic organisms in rural rivers in the Taihu Lake region, China. Environ. Sci. Pollut. Res. 2015, 22, 6721–6731. [Google Scholar] [CrossRef] [PubMed]
  26. Tepanosyan, G.; Maghakyan, N.; Sahakyan, L.; Saghatelyan, A. Heavy metals pollution levels and children health risk assessment of Yerevan kindergartens soils. Ecotoxicol. Environ. Saf. 2017, 142, 257–265. [Google Scholar] [CrossRef] [PubMed]
  27. Zhou, L.; Che, L.; Sun, D.Q. The coupling coordination development between urbanization and economic growth and its influencing factors in China. Econ. Geogr. 2019, 39, 97–107. [Google Scholar]
  28. Pan, W.; Du, J. Towards sustainable urban transition: A critical review of strategies and policies of urban village renewal in Shenzhen, China. Land Use Policy 2021, 111, 105744. [Google Scholar] [CrossRef]
  29. Zhang, W.Z.; Yu, J.H.; Zhang, D.S.; Ma, R.F. A Study of Livable Cities in China; Science Press: Beijing, China, 2016; pp. 3–11. [Google Scholar]
  30. Zhang, H.L.; Walker, T.R.; Davis, E.; Ma, G.F. Ecological risk assessment of metals in small craft harbour sediments in Nova Scotia, Canada. Mar. Pollut. Bull. 2019, 146, 466–475. [Google Scholar] [CrossRef]
  31. He, Y.S. Pollution characteristics and ecological risk assessment of heavy metals in Haikou urban soils. Chin. J. Ecol. 2014, 33, 421–428. [Google Scholar]
  32. Varol, M.; Sünbül, M.R.; Aytop, H.; Yılmaz, C.H. Environmental, ecological and health risks of trace elements, and their sources in soils of Harran Plain, Turkey. Chemosphere 2020, 245, 125592. [Google Scholar] [CrossRef]
  33. Wu, Y.Z.; Sun, X.F.; Sun, L.H.; Choguill, C.L. Optimizing the governance model of urban villages based on integration of inclusiveness and urban service boundary (USB): A Chinese case study. Cities 2020, 96, 102427. [Google Scholar] [CrossRef]
  34. Tan, Y.Z.; He, J.; Han, H.Y.; Zhang, W.W. Evaluating residents’ satisfaction with market-oriented urban village transformation: A case study of Yangji Village in Guangzhou, China. Cities 2019, 95, 102394. [Google Scholar] [CrossRef]
  35. Li, J.; Sun, S.; Li, J. The dawn of vulnerable groups: The inclusive reconstruction mode and strategies for urban villages in China. Habitat Int. 2021, 110, 102347. [Google Scholar] [CrossRef]
  36. Gu, Z.; Zhang, X. Framing social sustainability and justice claims in urban regeneration: A comparative analysis of two cases in Guangzhou. Land Use Policy 2021, 102, 105224. [Google Scholar] [CrossRef]
  37. Yu, X.; Wang, M.Y.; Dong, X.; Chen, X.; Lu, J.X. A study on migration tendency of floating population in urban villages: Taking the city of Xi’an as an example. Mod. Urban Res. 2021, 8, 10–16. [Google Scholar]
  38. Ministry of Ecology and Environmental of P. R. China (MEE). Technical Guidelines for Investigation on Soil Contamination of Land for Construction. 2019. Available online: https://www.mee.gov.cn/xxgk2018/xxgk/xxgk01/201912/t20191209_748070.html (accessed on 24 March 2022).
  39. Ministry of Ecology and Environmental of P. R. China (MEE). The Technical Specification for Soil Environmental Monitoring. 2004. Available online: https://www.mee.gov.cn/ywgz/fgbz/bz/bzwb/jcffbz/200412/t20041209_63367.shtml (accessed on 24 March 2022).
  40. Brent, R.N.; Wines, H.; Luther, J.; Irving, N.; Collins, J.; Drake, B.L. Validation of handheld X-ray fluorescence for in situ measurement of mercury in soils. J. Environ. Chem. Eng. 2017, 5, 768–776. [Google Scholar] [CrossRef]
  41. United States Environmental Protection Agency (U.S. EPA). SW-846 Test Method 6200: Field Portable X-ray Fluorescence Spectrometry for the Determination of Elemental Concentrations in Soil and Sediment. 2007. Available online: https://www.epa.gov/hw-sw846/sw-846-test-method-6200-field-portable-x-ray-fluorescence-spectrometry-determination (accessed on 26 March 2022).
  42. United States Environmental Protection Agency (U.S. EPA). SW-846 Test Method 3050B: Acid Digestion of Sediments, Sludges, and Soils. 1996. Available online: https://www.epa.gov/hw-sw846/sw-846-test-method-3050b-acid-digestion-sediments-sludges-and-soils (accessed on 26 March 2022).
  43. Xu, G.L.; Wen, Y.; Cai, S.Y.; Luo, X.F. Review for the effects of urban topsoil on the ecological health. Geogr. Res. 2019, 38, 2941–2956. [Google Scholar]
  44. Xue, Z.B.; Li, L.; Zhang, S.K.; Dong, J. Comparative study between Nemerow Index method and Compound Index method for the risk assessment of soil heavy metal pollution. Sci. Soil Water Conserv. 2018, 16, 119–125. [Google Scholar]
  45. Ministry of Ecology and Environmental of P. R. China (MEE). Soil Environment Quality Risk Control Standard for Soil Contamination of Development Land. 2018. Available online: https://www.mee.gov.cn/ywgz/fgbz/bz/bzwb/trhj/201807/t20180703_446027.shtml (accessed on 24 March 2022).
  46. Ministry of Ecology and Environmental of P. R. China (MEE). Soil Environment Quality Risk Control Standard for Soil Contamination of Agricultural Land. 2018. Available online: https://www.mee.gov.cn/ywgz/fgbz/bz/bzwb/trhj/201807/t20180703_446029.shtml (accessed on 24 March 2022).
  47. Muller, G. Index of geoaccumulation in sediments of the Rhine River. GeoJournal 1969, 2, 109–118. [Google Scholar]
  48. Hakanson, L. An ecological risk index for aquatic pollution control. A sedimentological approach. Water Res. 1980, 14, 975–1001. [Google Scholar] [CrossRef]
  49. Ministry of Ecology and Environment of the People’s Republic of China; China National Environmental Monitoring Centre. Background Values of Soil Elements in China; China Environmental Science Press: Beijing, China, 1990; pp. 87–90.
  50. Feng, Q.W.; Wang, B.; Ma, X.J.; Jiang, Z.H.; Chen, M. Pollution Characteristics and Source Analysis of Heavy Metal in Soils of Typical Lead-Zinc Mining Areas in Northwest Guizhou, China. Bull. Mineral. Petrol. Geochem. 2020, 39, 863–870. [Google Scholar]
  51. Deng, M.H.; Zhu, Y.W.; Shao, K.; Zhang, Q.; Ye, G.H.; Shen, J. Metals source apportionment in farmland soil and the prediction of metal transfer in the soil-rice-human chain. J. Environ. Manag. 2020, 260, 110092. [Google Scholar] [CrossRef]
  52. Peralta, E.; Pérez, G.; Ojeda, G.; Alcañiz, J.M.; Valiente, M.; López-Mesas, M.; Sánchez-Martín, M.-J. Heavy metal availability assessment using portable X-ray fluorescence and single extraction procedures on former vineyard polluted soils. Sci. Total Environ. 2020, 726, 138670. [Google Scholar] [CrossRef] [PubMed]
  53. Parsons, C.; Margui Grabulosa, E.; Pili, E.; Floor, G.H.; Roman-Ross, G.; Charlet, L. Quantification of trace arsenic in soils by field-portable X-ray fluorescence spectrometry: Considerations for sample preparation and measurement conditions. J. Hazard. Mater. 2013, 262, 1213–1222. [Google Scholar] [CrossRef] [PubMed]
  54. Radu, T.; Diamond, D. Comparison of soil pollution concentrations determined using AAS and portable XRF techniques. J. Hazard. Mater. 2009, 171, 1168–1171. [Google Scholar] [CrossRef] [PubMed]
  55. Caporale, A.G.; Adamo, P.; Capozzi, F.; Langella, G.; Terribile, F.; Vingiani, S. Monitoring metal pollution in soils using portable-XRF and conventional laboratory-based techniques: Evaluation of the performance and limitations according to metal properties and sources. Sci. Total Environ. 2018, 643, 516–526. [Google Scholar] [CrossRef] [PubMed]
  56. Messager, M.L.; Davies, I.P.; Levin, P.S. Development and validation of in-situ and laboratory X-ray fluorescence (XRF) spectroscopy methods for moss biomonitoring of metal pollution. MethodsX 2021, 8, 101319. [Google Scholar] [CrossRef]
  57. Heidari, M.; Darijani, T.; Alipour, V. Heavy metal pollution of road dust in a city and its highly polluted suburb; quantitative source apportionment and source-specific ecological and health risk assessment. Chemosphere 2021, 273, 129656. [Google Scholar] [CrossRef]
  58. Walraven, N.; van Os, B.J.H.; Klaver, G.T.; Middelburg, J.J.; Davies, G.R. The lead (Pb) isotope signature, behaviour and fate of traffic-related lead pollution in roadside soils in The Netherlands. Sci. Total Environ. 2014, 472, 888–900. [Google Scholar] [CrossRef]
  59. Jeong, H.; Ryu, J.S.; Ra, k. Characteristics of potentially toxic elements and multi-isotope signatures (Cu, Zn, Pb) in non-exhaust traffic emission sources. Environ. Pollut. 2022, 292, 118339. [Google Scholar] [CrossRef]
  60. Kang, M.J.; Kwon, Y.K.; Yu, S.Y.; Lee, P.K.; Park, H.S.; Song, N. Assessment of Zn pollution sources and apportionment in agricultural soils impacted by a Zn smelter in South Korea. J. Hazard. Mater. 2019, 364, 475–487. [Google Scholar] [CrossRef]
  61. Shao, Y.Y.; Yan, T.; Wang, K.; Huang, S.M.; Yuan, W.Z.; Qin, F.G.F. Soil heavy metal lead pollution and its stabilization remediation technology. Energy Rep. 2020, 6, 122–127. [Google Scholar] [CrossRef]
  62. Wang, Q.; Hao, D.; Wang, F.; Wang, H.; Huang, X.; Li, F.; Li, C.; Yu, H. Development of a new framework to estimate the environmental risk of heavy metal(loid)s focusing on the spatial heterogeneity of the industrial layout. Environ. Int. 2021, 147, 106315. [Google Scholar] [CrossRef] [PubMed]
  63. Xu, X.; Hu, X.; Wang, T.; Sun, M.; Wang, L.; Zhang, L. Non-inverted U-shaped challenges to regional sustainability: The health risk of soil heavy metals in coastal China. J. Clean. Prod. 2021, 279, 123746. [Google Scholar] [CrossRef]
  64. Ji, W.; Yang, T.; Ma, S.; Ni, W. Heavy Metal Pollution of Soils in the Site of a Retired Paint and Ink Factory. Energy Procedia 2012, 16, 21–26. [Google Scholar] [CrossRef] [Green Version]
  65. Huang, Y.; Chen, Q.; Deng, M.; Japenga, J.; Li, T.; Yang, X.; He, Z. Heavy metal pollution and health risk assessment of agricultural soils in a typical peri-urban area in southeast China. J. Environ. Manag. 2018, 207, 159–168. [Google Scholar] [CrossRef] [PubMed]
  66. Li, Q.; Xu, X.D. Research hotspots and trend of city village renovation. Urban Probl. 2018, 8, 22–30. [Google Scholar]
  67. Lin, X.B.; Ma, X.G.; Li, G.C. Formation and governance of informality in urban village under the rapid urbanization process. Econ. Geogr. 2014, 34, 162–168. [Google Scholar]
Figure 1. Research area and the investigation grid (100 m × 100 m).
Sustainability 14 05030 g001
Figure 2. The concentrations distribution of Cr (a), Cu (b), Ni (c), Pb (d), Zn (e), As (f) by IDW. The concentrations of Cd and Hg were not detected (<LOD).
Sustainability 14 05030 g002aSustainability 14 05030 g002b
Figure 3. Location of sampling points in different functional areas.
Sustainability 14 05030 g003
Figure 4. Regression fit lines between XRF(x) and laboratory analysis (y) of heavy metal concentrations (mg·kg−1) of Cr (a), Cu (b), Ni (c), Pb (d), Zn (e), As (f) in soil samples.
Sustainability 14 05030 g004
Figure 5. Box plots of Cd, Cr, Cu, Ni and the background values (a); Box plots of Pb, Zn, Hg, As and the background values (b).
Sustainability 14 05030 g005aSustainability 14 05030 g005b
Figure 6. The results of CPI at 25 sampling points.
Sustainability 14 05030 g006
Figure 7. Statistics of Igeo with box plot.
Sustainability 14 05030 g007
Figure 8. The percentage of different Igeo levels.
Sustainability 14 05030 g008
Figure 9. RI and comprehensive potential ecological risk level of each point.
Sustainability 14 05030 g009
Figure 10. Auto related industries around the south traffic road image by Google Earth: freight transport and parking (a); automobile maintenance (b).
Sustainability 14 05030 g010
Figure 11. Mixed-use of farmland and construction land image by Google Earth (a,b).
Sustainability 14 05030 g011
Table 1. Detectable elements in Geo-Env Soil Mode of SciAps X-200.
ModeDetectable Elements
(Beam 1)
Detectable Elements
(Beam 2)
Detectable Elements
(Beam 3)
SoilTi, V, Cr, Mn, Fe, Co, Ni, Cu, Zn, As, Se, Sr, Rb, Zr, Mo, W, Tl, Hg, Pb, BiMg, Al, Si, P, SAg, Cd, Sn, Sb, Ba
Table 2. The evaluation criteria (Cni) and toxic response factor (Tri) of heavy metals in soil.
Heavy MetalsCdCrCuNiPbZnHgAs
Cni (mg·kg−1)0.7662.521.428.821.469.40.06311.1
Tri30255514010
Table 3. Descriptive statistics of heavy metal concentrations at 25 sampling points.
Heavy MetalsCdCrCuNiPbZnHgAs
Mean0.3863.9063.8167.25116.95309.980.1911.30
(mg·kg−1)
Median0.2749.8948.0755.9349.72173.840.179.17
(mg·kg−1)
SD0.2945.2037.5333.43128.54442.370.135.23
Min0.1135.2621.6427.3810.3751.890.076.03
(mg·kg−1)
Max1.22259.32182.81143.90475.151908.130.5925.44
(mg·kg−1)
CV75.4570.7458.8249.71109.91142.7167.0146.30
(%)
Table 4. Pearson correlation coefficients among heavy metal concentrations in soil.
Heavy MetalsCrCuNiPbZnAs
Cr1
Cu0.0971
Ni0.1020.1481
Pb0.1600.1320.557 **1
Zn0.0470.1040.254 *0.417 **1
As0.1960.171−0.008−0.0470.0331
** Correlation is highly significant at p < 0.01 (two-tailed); * Correlation is significant at p < 0.05 (two-tailed); number of samples (n = 80).
Table 5. KMC of heavy metal concentrations at 80 sampling points.
Heavy
Metal
Cluster
1234
Cr51.1957.1845.2357.43
Cu47.4943.6767.0068.68
Ni49.2585.4592.0456.97
Pb47.10359.23335.8291.79
Zn108.091953.93200.181095.01
As9.738.858.9611.65
Cluster Quantity73142
Table 6. PCA and total variance explained of heavy metal concentrations.
ComponentInitial EigenvaluesExtracted Sums of Squared Loadings
Total% of VarianceCumulative %Total% of VarianceCumulative %
11.93832.29332.2931.93832.29332.293
21.24820.80153.0941.24820.80153.094
30.90815.12968.2230.90815.12968.223
40.80713.44381.6670.80713.44381.667
50.70111.68893.355
60.3996.645100.000
Table 7. Initial factor loading matrix of heavy metal concentrations. (PCs loadings > 0.5 are shown in bold).
Heavy MetalsComponent
1234
Cr0.3180.554−0.655−0.224
Cu0.3620.4640.673−0.368
Ni0.763−0.184−0.032−0.253
Pb0.838−0.223−0.103−0.046
Zn0.640−0.1590.1100.611
As0.1070.7860.0500.426
Publisher’s Note: MDPI stays neutral with regard to jurisdictional claims in published maps and institutional affiliations.