1. Introduction
With the
Clean Energy for All Europeans Package (CEP) of 2019 [
1] and, more specifically, the
Renewable Energy Directive (RED) [
2] and the
Electricity Market Directive (EMD) [
3], guidelines for energy community (EC) legislation have been established at the level of the European Union (EU). EU member states are obliged to transpose these supranational guidelines into national legislation within two years at maximum [
1]. Despite this obligation, EU member states are at different stages of the transposition process, and only a limited number of countries have managed to legally enable the establishment of renewable energy communities (RECs) and citizen energy communities (CECs). Despite the slow transposition process, it is a fact that the establishment of RECs and CECs will be legally possible in all EU member states in the near future.
As they are of relevance in multiple disciplines, the regulatory, legislative, social, technical, and economic aspects of ECs are being addressed in current scientific studies. In many cases, the technical and economic aspects are closely related, making studies in this direction highly important for both theoretical evaluation and application in practice. Despite the multiple motivations to participate in ECs and the willingness to contribute to slowing down climate change, the financial aspect is most crucial for the majority of the population due to the limited financial means. Whether an EC is able to break even strongly depends on the technology mix, as well as on how the energy is distributed among participants.
Therefore, this study proposes a linear optimisation model—including a peer-to-peer trading algorithm—with the objective of cost minimisation. Moreover, the model includes the possibility to take different technologies into account, such as (i) rooftop photovoltaic (PV) systems, (ii) a community battery storage (CBS), (iii) residential heat pumps (HPs), and (iv) electric vehicles (EVs). These technologies can be considered either individually or in various combinations. Thus, the model provides the possibility to evaluate the economic viability of participating in an EC for individual participants while determining the cost-optimal solution for the whole community in order to put the collective benefit above the benefit of the individual. While the model is set up such that wide applicability is guaranteed, the results are calculated for a typical rural REC of 10 single-family houses. Therefore, current specifics of the Austrian EC legislation, such as a reduction of grid tariffs and the omission of certain levies, are applied.
This study’s contribution beyond the state of the art can be briefly summarised as follows:
Economic evaluation of energy communities under different permutations of the technologies considered;
Consideration of four different technologies—specifically, electric vehicles and community battery storage are rarely considered in the energy-community-related literature;
Combined potential of energy communities with a variety of technologies regarding cost and emission savings.
A detailed and justified evaluation of the contribution with respect to the existing literature is presented in
Section 2.4.
The remainder of this paper is structured as follows:
Section 2 presents a selection of the current literature concerned with the techno-economic aspects of ECs. The optimisation model, use cases, and respective data are introduced in detail in
Section 3. The results concerning the economic viability and corresponding energy flows and emissions of a fictitious REC with different technology combinations are described in
Section 4.
Section 5 concludes and provides suggestions for future research.
2. Literature Review
The field of ECs triggers research questions in multiple scientific areas. Within the discipline of the social sciences, questions about the transition potential of ECs [
4,
5,
6], the motivations to participate [
7,
8,
9], and the willingness to participate [
10,
11,
12] are being answered. In the field of regulation and legislation, studies focus on policy advice for transposing the EU guidelines [
13,
14], give insights into specific national transposition efforts [
15,
16,
17,
18,
19,
20], or elaborate on legal measures to aid the profitability of ECs [
21]. Aside from the social and legislative aspects, the scientific literature is increasingly concerned with the technological and economic aspects or their combination. Since this study focuses on the economic viability of ECs that rely on peer-to-peer (PtP) trading while considering a portfolio of four different technologies and the resulting potential for emission reduction, the remainder of the literature review is focused on studies covering the economic aspects of ECs (
Section 2.1), energy trading in general and PtP trading more specifically (
Section 2.2), and the environmental aspects (
Section 2.3). Based on this thorough literature review, the contribution of this study is then highlighted in
Section 2.4.
2.1. Economic Aspects of Energy Communities
Assessing the economic viability of ECs is an often-studied topic in the scientific literature, as it is crucial for the vast diffusion of this novel concept. Viti et al. [
22] aimed to point out the added value of an EC in comparison to buildings acting individually. In another investigation in this direction, the benefits of jointly acting EC participants were investigated for the case of an individual multi-apartment building [
23], as well as for ECs in different settlement patterns [
24]. The profitability of PV electricity sharing was investigated with respect to the situations in different European countries [
25], as well as in the specific light of the newly implemented legislation in Austria [
26]. The application of different electricity distribution keys in ECs, which have a significant impact on their economic viability, was addressed in [
20,
27]. Focusing on net-zero ECs, Isaac et al. [
28] studied cost optimality while considering different urban scales and densities. In order to evaluate and compare different ECs from a technical and environmental perspective, key performance indicators were presented in [
29].
The profitability of an EC can be significantly enhanced when the community undertakes thorough planning. A mixed-integer linear-programming-based optimal planning approach for renewable energy communities was proposed in [
30]. A framework for selecting the most viable renewable energy technologies based on multiple decision criteria was introduced in [
31], while Bakhtavar et al. [
32] aimed to find the best energy system configurations from a large number of alternatives. A system-level approach for designing sustainable and energy-efficient multi-family housing communities was introduced by Cheng et al. [
33]. Fleischhacker et al. [
34] worked with portfolio optimisation of ECs in order to meet reductions in costs and emissions.
2.2. Energy Trading in Energy Communities
Regarding the operation of ECs, the way of sharing/trading energy is the central aspect. Ye et al. [
35] designed an algorithm to tackle cost-aware energy sharing among residents in a community and a revenue division algorithm based on the Nash bargaining theory. In another study using game theory, an algorithm for the allocation and pricing of distributed energy resources in apartment buildings was proposed by Fleischhacker et al. [
36]. A methodology for enhancing community resilience through optimal renewable resource allocation and load scheduling was proposed in [
37]. Going in this direction, Hupez et al. [
38] developed a framework for power exchanges inside a low-voltage community that exploited flexibilities. Hachem-Vermette et al. [
39] presented a methodology for optimising the mix of energy resources and energy sharing among participants living in traditional and sustainable archetypes of urban developments.
Specifically focusing on PtP trading, Perger et al. [
40] developed a linear program for optimising PtP trading between prosumers of a local EC considering willingness to pay (WtP). The WtP was also taken into account in [
41] by developing a bidding-based PtP energy transaction optimisation model that considered the green energy preferences of participants. A PtP trading mechanism considering a certain kind of fairness and uncertainty was introduced by Oh et al. [
42]. The general integration of PtP trading decisions in the course of EC modelling was discussed in [
43], and decision-making strategies in ECs based on PtP trading were addressed in [
44]. A specific aspect of integrating hydrogen vehicle storage into PtP-based ECs was addressed by Liu et al. [
45].
2.3. Emissions in the Context of Energy Communities
The greenhouse gas emission reduction potentials in eight different countries were investigated for individual households in comparison to an EC [
46]. A community-based bottom-up approach to carbon reduction was proposed by Kellett [
47]. Fleischhacker et al. [
34] performed portfolio optimisation while also considering the objective of reducing emissions in addition to the cost factor. Providing a mixture of an economic and an environmental focus, a multi-objective optimisation model for rationalising the design of integrated energy systems for remote communities was specifically proposed in [
48]. Moreover, topics regarding the environmental impact and emissions were also indirectly addressed through studies that elaborated on the field of the willingness to pay [
40,
41], as introduced previously in
Section 2.2.
2.4. Contribution beyond the State-of-the-Art
In the present study, an optimisation model with the objective of minimising an EC’s total costs is developed. This model enables cost-optimal peer-to-peer trading while considering four different technologies, namely, (i) solar PV, (ii) CBS operating as an individual agent, (iii) HPs, and (iv) EVs. Since CBS, HPs, and EVs are expected to have different impacts on the economic viability of an EC, this study aims to investigate all permutations of said technologies. Using this investigation, different technology combinations can be ranked according to their potential for simultaneously minimising costs and reducing emissions.
When investigating the existing literature, it was found that most studies only focused on PV alone or in combination with battery storage systems. Other technologies were rarely considered, and little attention was paid to electric mobility in the context of ECs. When it comes to storage, individual storage was most often considered, while community storage units acting as individual agents were rare. Only two other studies considered the same four technologies in the context of ECs, but with an entirely different focus: Schram et al. [
46] focussed on a comparison of the emission reduction potentials for a communal and a non-communal approach, thereby applying all four technologies to all considered households. The work proposed in this study investigates the permutations of all considered technologies and puts the focus on cost optimality using a peer-to-peer trading algorithm. Hupez et al. [
38] focussed on the cost-optimal allocation of resources within an EC by using game theory. In general, game-theoretical models are specifically important in theory, while others have increased practical relevance.
Especially with the ever-increasing demand to increase the interconnectedness among individual technologies and to motivate citizens to invest in order to enable an efficient use of renewable generation, this study contributes the calculation of permutations of technologies within the framework of an energy community. The results are, therefore, relevant for citizens’ and ECs’ future investment decisions regarding the objectives of cost and/or emission reduction, as well as for policy decision makers regarding possible incentives to increase people’s willingness to invest in energy-efficient technologies to enhance the degree of self-consumption.
3. Materials and Methods
In
Section 3.1, the linear optimisation model that includes peer-to-peer trading and four different technologies (rooftop PV system, CBS, HPs, and EVs) is presented. For the implementation, the Python optimisation library
pyomo and the IBM solver
cplex were used.
Section 3.2 then introduces a fictitious model EC to which the model is applied, as well as different use cases that are presented in the section on the results.
3.1. Mathematical Formulation
The optimisation model developed here has the objective of minimising the total costs of the energy consumption of an EC. The model is set up in a modular way, such that an arbitrary number of households can be considered. Moreover, the modularity of the setup gives the chance to equip each household individually with different generation and consumption technologies, allowing a wide range of use cases.
The optimisation model is subject to a variety of general and technology-specific constraints. One of the most prominent constraints is that each household needs to cover its electric load while taking into account all electric household appliances and, if implemented, a heatpump (for space heating and domestic hot water) or an EV. The electric load can be covered conventionally by purchasing it from an electricity supplier, through self-consumption if the household owns a PV system, by buying PV electricity from the community, or by discharging the community storage (if one is considered to be implemented). The corresponding constraint is given in Equation (
1) as a function of time
t and customer
c (or customer
k in the case of trading within the EC) (for electricity trade within the community,
k stands for the customer selling PV electricity, whereas
c is the customer buying the electricity). The nomenclature is provided in
Table 1.
The generation of a PV system depends heavily on the orientation of the PV system on a household’s roof. PV systems can be oriented toward the south, east, and west (it is assumed that PV panels are not installed facing north because that provides the least solar irradiation). The generated PV electricity is calculated by a multiplication of the installed PV capacity and the irradiation for each direction (Equation (
2)).
Each EC member owning a PV system can consume the self-generated electricity directly to cover the standard electric load, feed the HP or the EV (if these technologies are considered), sell it to the electricity supplier (conventional grid feed-in), charge the community storage (if one is considered), or sell it within the community (Equation (
3)).
Next, constraints regarding the CBS are provided. The storage’s state of charge at a certain timestep is calculated as the state of charge of the previous timestep by adding the charged electricity and subtracting the discharged electricity of the current timestep. Thereby, stand-by, charging, and discharging losses are accounted for. The state of charge is limited by the storage capacity (Equation (
4)).
Charging and discharging the CBS are further limited by the maximum charging and discharging power of the CBS, as well as the maximum connection power to the electricity grid (Equation (
5)).
For the EVs, additional constraints regarding the state of charge and the charging process have to be defined. First of all, if the vehicle is charging, the state of charge in the current timestep is specified by the state of charge in the prior timestep and the charged electricity (considering losses (note that the electricity losses when charging the EV and the stand-by losses are considered to be the same as when charging the storage; for exact values, see
Table 1)). The parameter
defines a binary variable that expresses whether the EV is at the charging station (Equation (
6)).
For simplicity, it is assumed that the EV only disconnects from the charging process when the state of charge has reached its maximum. Both the state of charge and the charging power are restricted by an upper bound (Equation (
7)).
The last available asset is the HP, which can be chosen as the heating technology for a certain household to provide space heating and a domestic hot water supply. On account of flexibility, the space and water temperatures can vary between a predefined minimum and maximum, respectively. The operation of the HP is based on a building model that depicts the thermal inertia of the individual house.
Furthermore, the thermal power, which can be defined as the product of the coefficient of performance (
) and the power that is needed for operating the HP, is defined for both space heating and hot water supply. The thermal heating power for hot water is bounded by the maximum electrical power for heating. Additionally, the total thermal power is restricted by an upper bound (Equation (
8)).
Finally, the objective function that aims at minimising the total costs of the EC is depicted in Equation (
9) for
, and
(the exact values and compositions of prices can be found in
Appendix A).
3.2. Model Energy Community and Use Cases
The developed model is applied to a fictitious model EC, which is located in a rural area and consists of ten single-family houses (see
Table 2). The default setting is assumed such that all households fully cover their electric demand through their electricity supplier (no PV systems installed, no EC participation) and their heat demand with gas heating. Moreover, all households use a fossil-fuelled car. In order to determine the impacts of different technologies—PV systems, HPs, EVs, CBS, and combinations thereof—on the profitability of EC participation, energy flows, and emissions, different use cases have to be defined. For the different use cases, it is assumed that only a certain number of households are equipped with the use-case-specific technologies in order to be able to distinguish the effects on households with high and low levels of technology installed.
- (i)
If PV systems are considered, households 2, 4, 6, 8, and 10 are equipped with PV systems on their buildings’ rooftops;
- (ii)
If HPs are considered, households 3, 5, 6, 8, and 10 exchange their gas heating with an HP (HP parameters that can be determined individually concern the condition of the building; thus, the corresponding heat losses are calculated due to the building properties, namely, the specific heat capacity and heat storage);
- (iii)
If EVs are considered, households 1, 2, 4, 8, and 9 exchange their diesel-fuelled vehicles with electric cars (for the EV, parameters such as arrival and departure time during the week and on weekends can be specified individually; furthermore, the amount of energy that typically has to be charged and the maximal charging power have to be defined);
- (iv)
If a CBS is considered, it is assumed that all households jointly invest in a CBS and can profit from its operation.
The individual use cases are summarised in
Table 3.
In order to properly model the HPs, a building model is developed that depicts the thermal inertia of the individual houses. Two types of buildings with the potential for load shifting were chosen, namely, newly constructed and refurbished single-family houses. This selection follows the assumption that, due to poor thermal insulation, HPs would rarely be installed in old buildings. The chosen building types differ in their assumed specific heat capacity and specific heat storage. For an old building, the heat load is assumed to be 90 kWh/m2, and newly constructed buildings are accounted for with a heat load of 47 kWh/m2. It was assumed that single-family houses have typical and average sizes (for Austrian standards) ranging between 120 and 150 m2.
Moreover, it is assumed that households that are equipped with different technologies (PV systems, HPs, EVs) would invest in these technologies regardless of their participation in the EC. Therefore, no investment costs are taken into account. This assumption is considered valid for assessments of the near future, with the objective of phasing out oil and gas heating systems in Austria by 2040 at the latest and the objective of no longer allowing new fossil-fuelled cars from 2030. Therefore, citizens will need to exchange their heating systems and vehicles for environmentally friendly alternatives in the near future. For the community storage, on the other hand, investment costs are taken into account, since this technology is directly related to EC participation.
For background information regarding climate and irradiation, it is noted that Austria is situated in Central Europe. Therefore, it has a moderate climate, yielding four seasons with up to 30 to 35 degrees Celsius in summer and, depending on the region, a minimum of −10 to −13 degrees Celsius in winter. PV systems oriented south can have up to 1130 full-load hours per year, while full-load hours in the eastern and western direction can be up to 940–970. Solar irradiation is the worst in the northern direction; therefore, PV systems that face north are usually not implemented.
4. Results
The result section can be split into two different parts. The first part (
Section 4.1) is concerned with giving a general overview of the results achieved—total costs, monetary savings, and CO
2 emissions—for all considered use cases. In the second part (
Section 4.2), the four most interesting use cases in terms of economic viability are presented in more detail.
4.1. General Results—All Use Cases
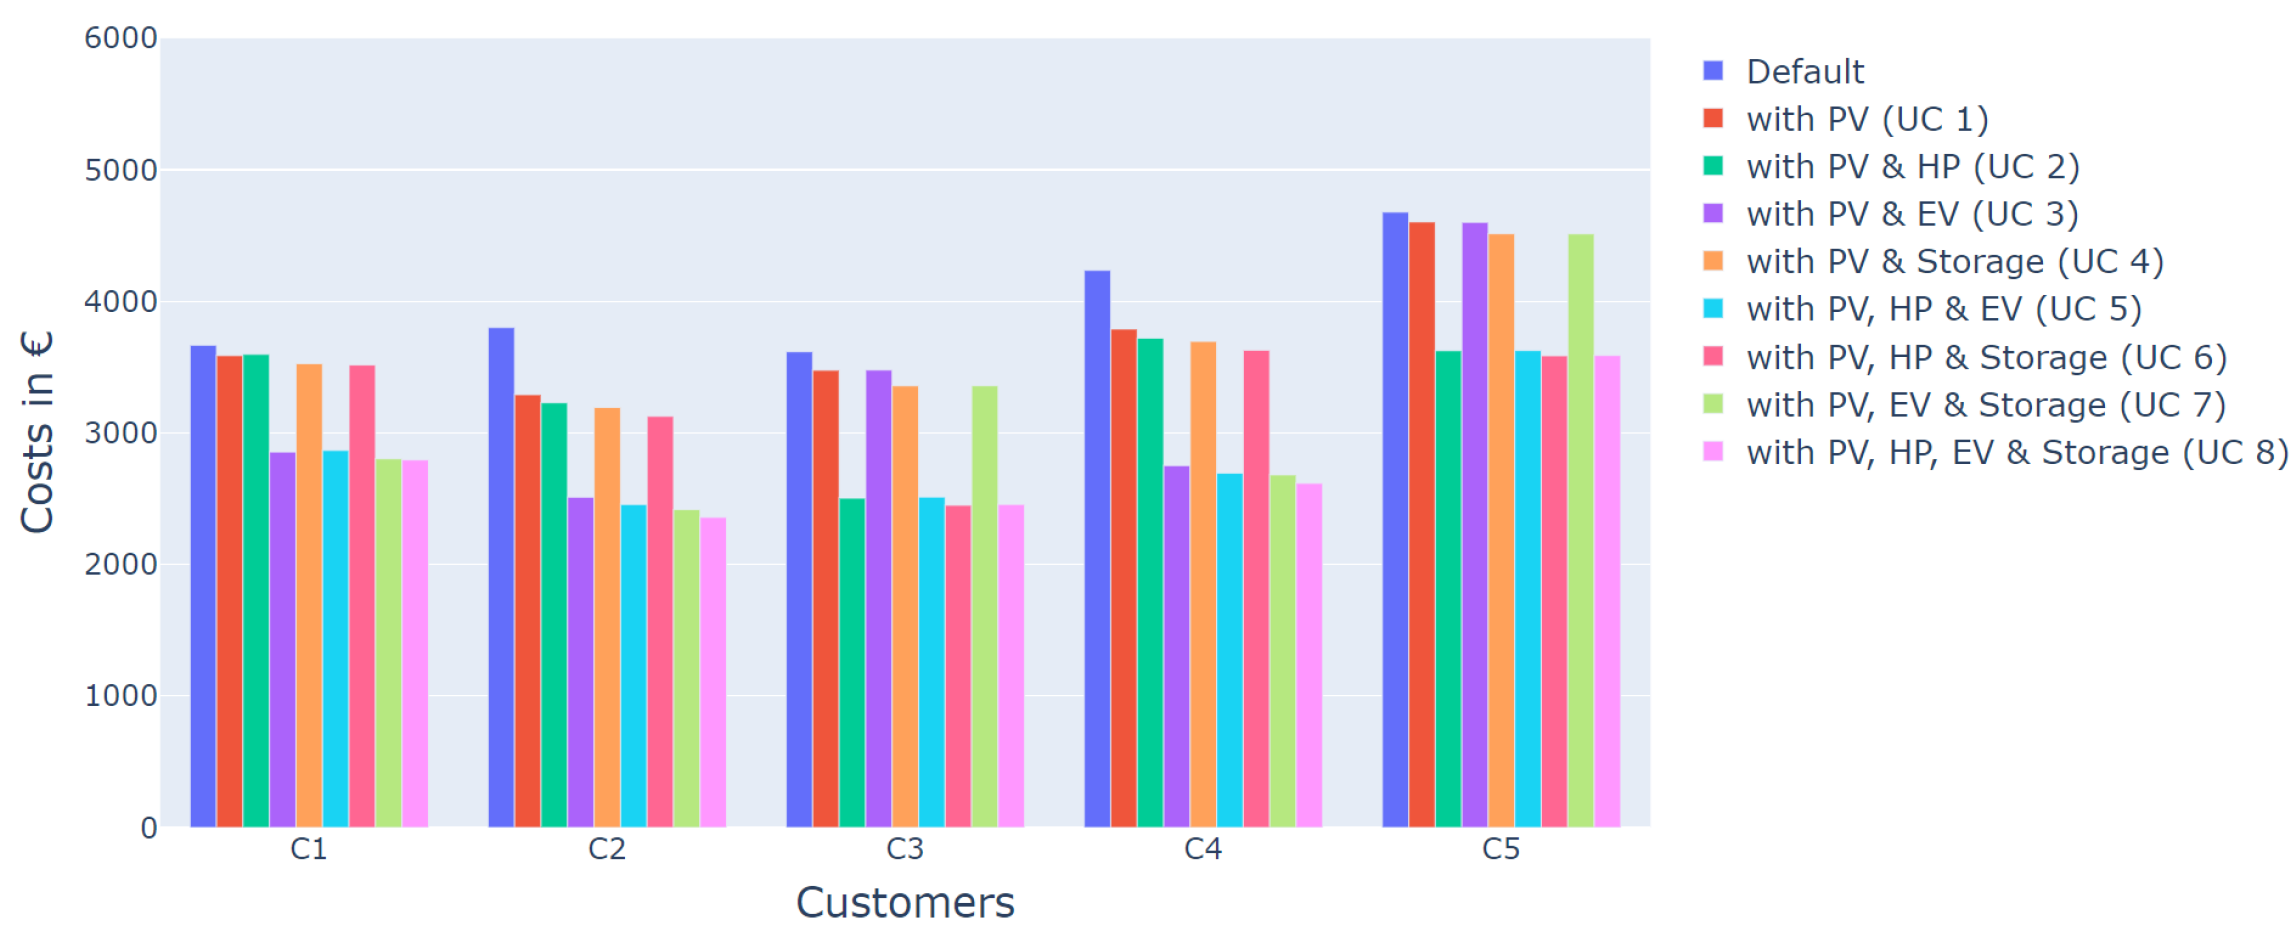
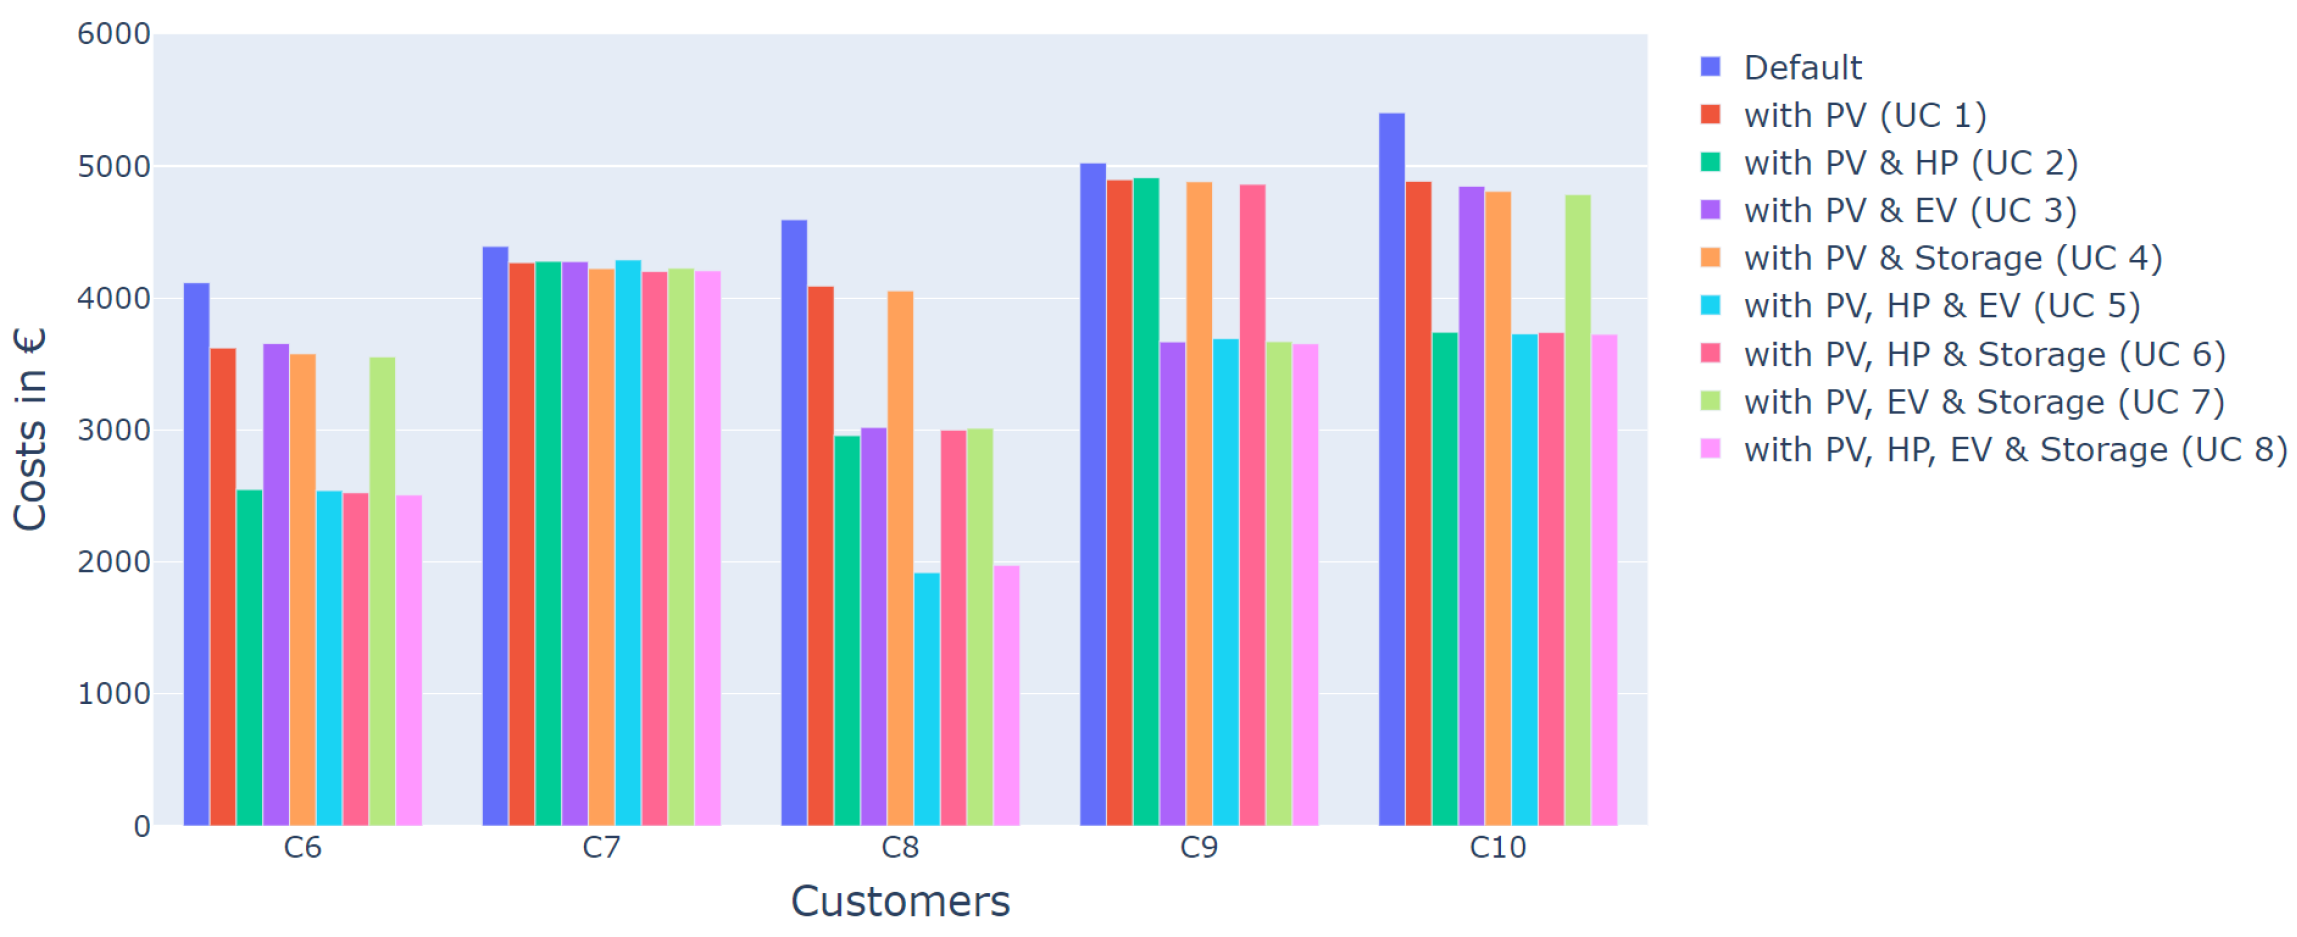
Figure 1 and
Figure 2 show the general costs for all use cases and all participants. It becomes evident that costs decline for all participants in all use cases compared to the default setting (with none of the technologies installed), indicating a positive influence on the participants’ finances. The savings per participant (and, thus, also for the whole community) are comprised of savings due to the usage of novel technologies (PV systems, HPs, EVs) and savings due to participation in the EC.
Figure 2 shows that participant 7 achieves the lowest cost savings in all use cases, as this is the only participant who is never considered to install/use any of the new technologies or combinations thereof. Therefore, the cost savings of participant 7 come exclusively from EC participation. This leads to the conclusion that EC participation, per se, has monetary benefits, yet small ones (note that costs for potential third-party services, such as billing and accounting, EC operation, and others, are not considered). For customer 8, it is assumed that all novel technologies considered are installed in all use cases; therefore, the costs decline significantly compared to those of customer 7.
The absolute numbers of energy costs and cost savings for the whole EC, as well as CO
2 emissions and CO
2 savings, are provided in
Table 4. Therefore, from the common rather than the individual viewpoint, it can be said that, for all use cases considering two technologies (UC2: PV+HP, UC3: PV+EV, UC 4: PV+Storage), UC2 (PV+HP) is the most cost efficient. In addition, in UC2, the CO
2 emission savings are higher compared to those in UC3 and UC4. This leads to the valuable conclusion that the most attractive scenario regarding cost minimisation is also the most efficient when it comes to environmental benefits. If, in the next step, three different technologies are considered per use case (UC5: PV+HP+EV, UC6: PV+HP+Storage, UC7: PV+EV+Storage), UC5 turns out to be the one with the highest savings regarding both costs and emissions. The cost savings are similar for UC6 and UC7, while the CO
2 emissions are significantly lower in UC6. From this, it can be concluded that HPs account for the highest cost and emission savings potential; the influences of EVs and community CBS are significantly lower. This is confirmed by the results from UC8, where all available technologies are taken into account. The cost savings are only insignificantly higher, whereas the emission savings are in the same range compared to UC5, where a combination of PV+HP+EV is considered. While the similar cost savings of UC5 and UC8 can be explained by the consideration of investment costs for the CBS, the similarity in emission savings can be traced back to a comparably small CBS of 10 kWh for the whole community and the fact that the optimisation objective is cost minimisation rather than CO
2 emission reduction.
Table 5 and
Table 6 provide information regarding generation usage and load coverage. Concerning the usage of the generated PV electricity,
Table 5 shows that grid feed-in is highest for UC1, where no other technologies apart from the standard household appliances are installed. In UC5, where gas heating is replaced by HPs for half of the households, the grid feed-in is reduced by over 30 percentage points. Comparing the amounts of grid feed-in with the cost savings in
Table 4, a certain correlation can be detected. Additionally, electricity trading has a higher share than PV self-consumption. In UC8, the lowest amount of PV electricity is fed into the grid due to the direct use of significantly large amounts, as well as within the community.
Regarding load coverage,
Table 6 shows that for UC8, only
% of the load is covered by electricity purchases from community peers. This can be justified as follows: Due to the installation of a diversity of different electricity-based technologies, the electric load is generally the highest. In relation to the high electric load, the part of the load that is covered by purchasing from community peers shrinks. The same reasoning applies for the rather small percentage of load coverage by PV self-consumption (
%) compared to the other use cases.
4.2. Detailed Results for Use Cases 1, 2, 5, and 8
Based on the general findings presented in
Section 4.1, use cases 1, 2, 5, and 8 appear to be the most interesting regarding the different technology combinations and their impacts on costs, energy flows, and CO
2 emissions. Therefore, the results of these specific use cases are provided in more detail.
4.2.1. Use Case 1
In UC1, households 2, 4, 6, 8, and 10 are equipped with rooftop PV systems.
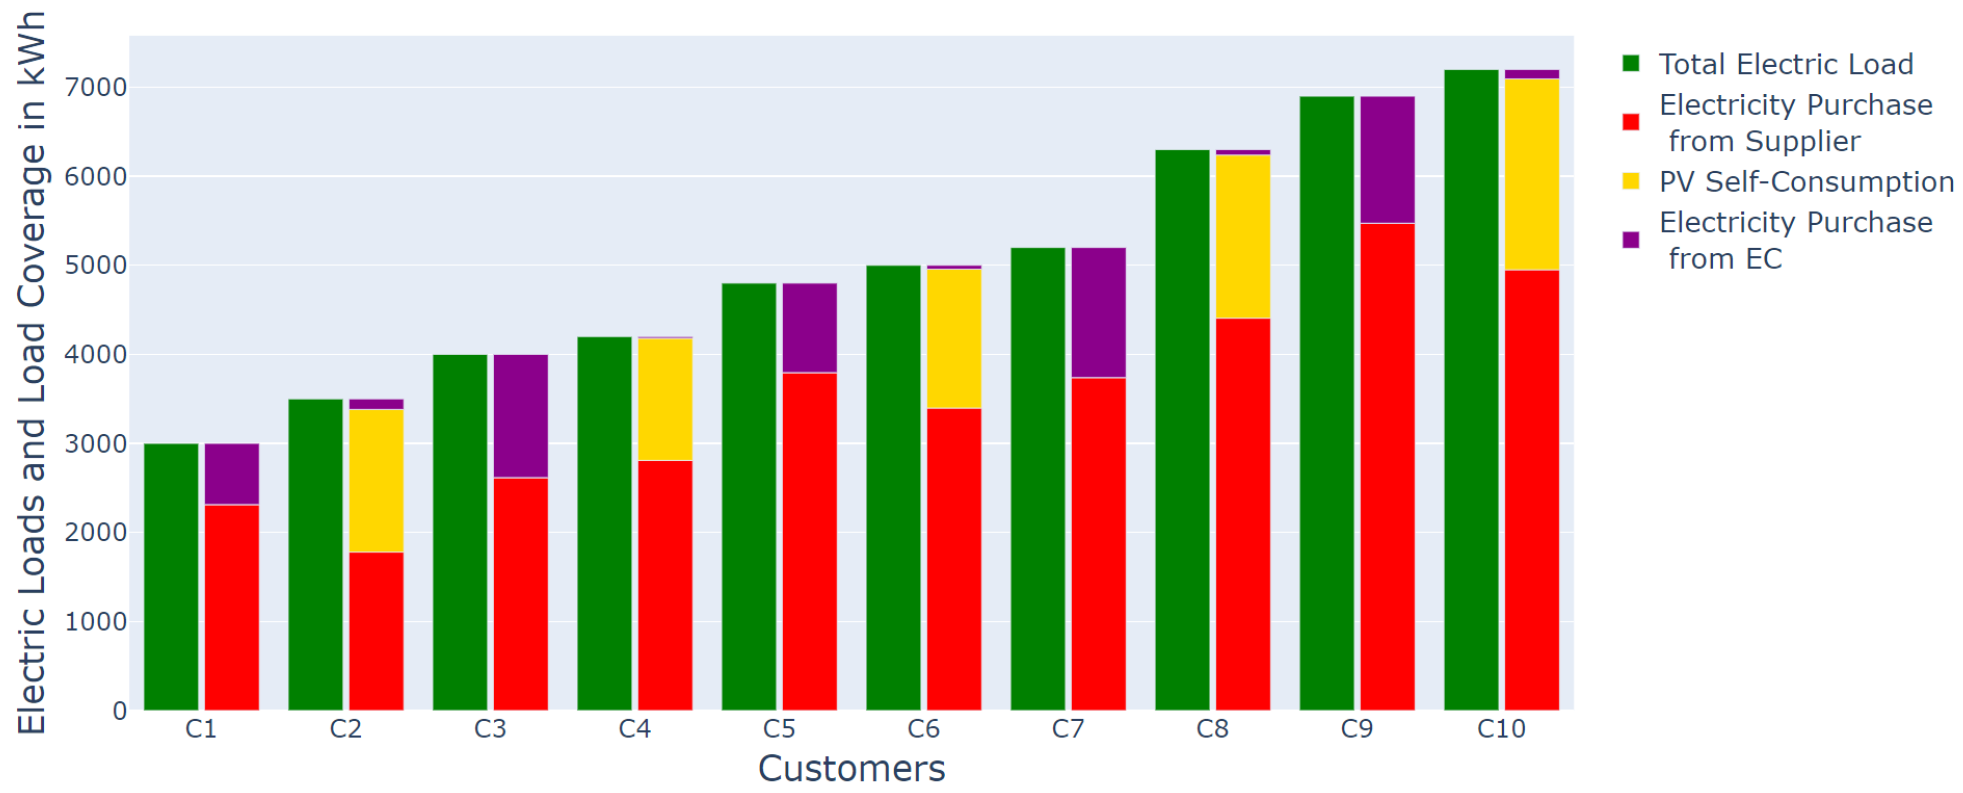
Figure 3 gives detailed insights on how the loads of individual customers are covered. Customers with their own PV systems cover significant parts (about 1/3) of their demand themselves. Due to the generation surplus, customers without a PV system also cover about 1/4 or 1/3 of their load with PV electricity purchases from their peers. By contrast, PV electricity purchases from community peers of customers owning a PV system are insignificant due to the simultaneity of PV generation in the neighbourhood.
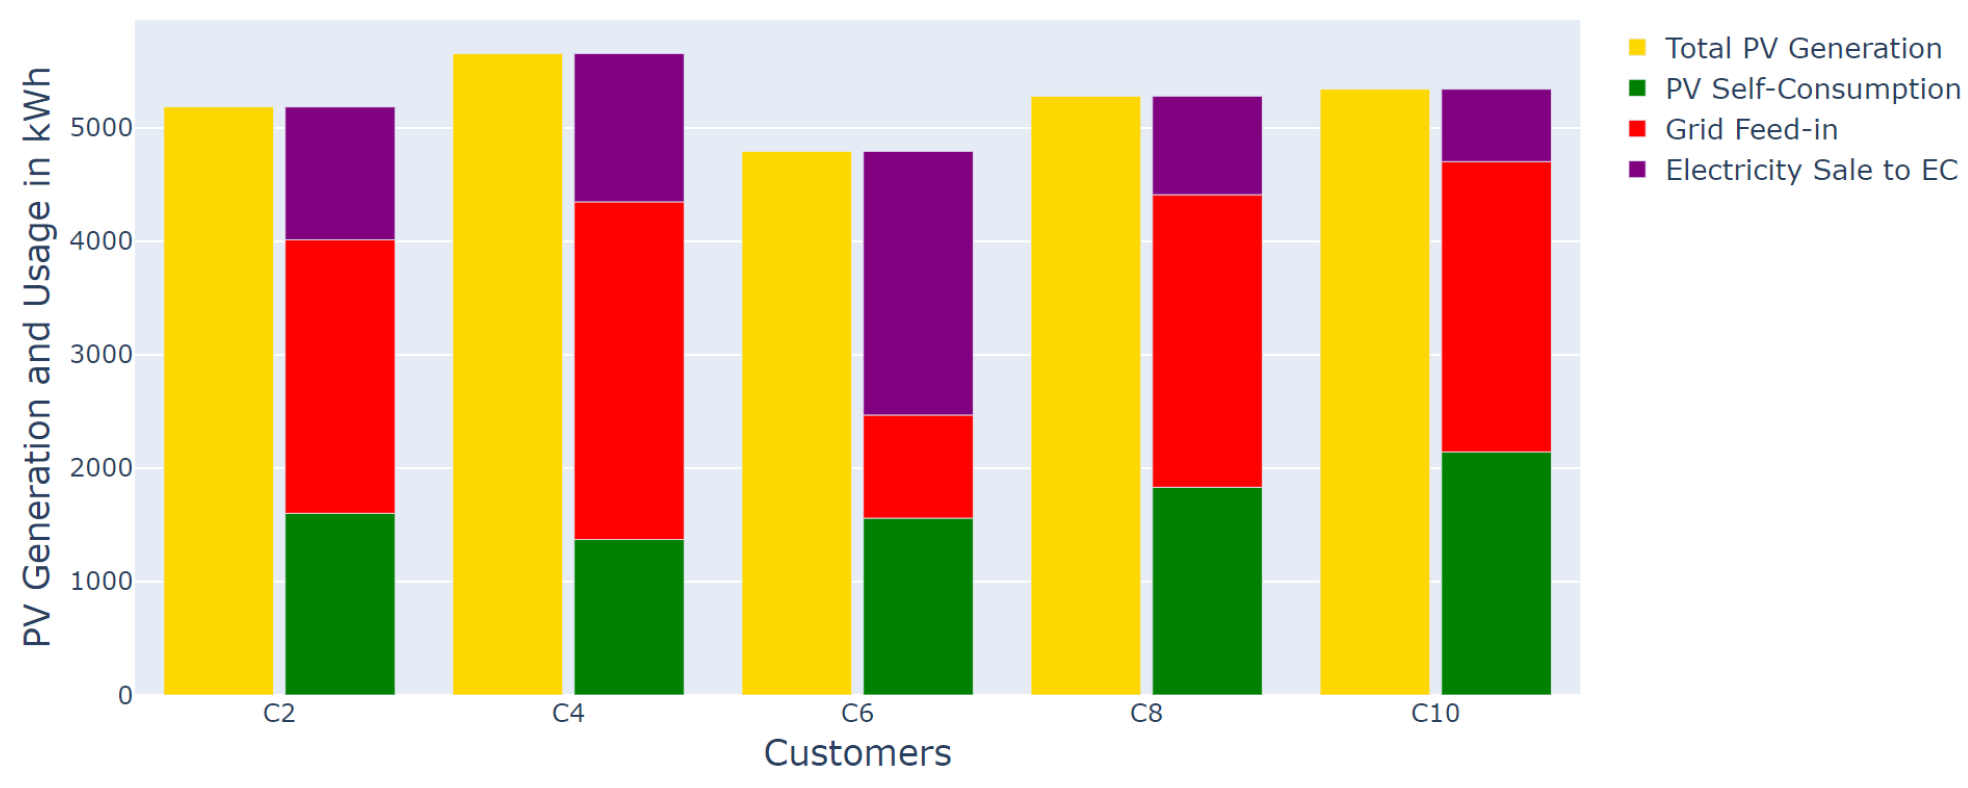
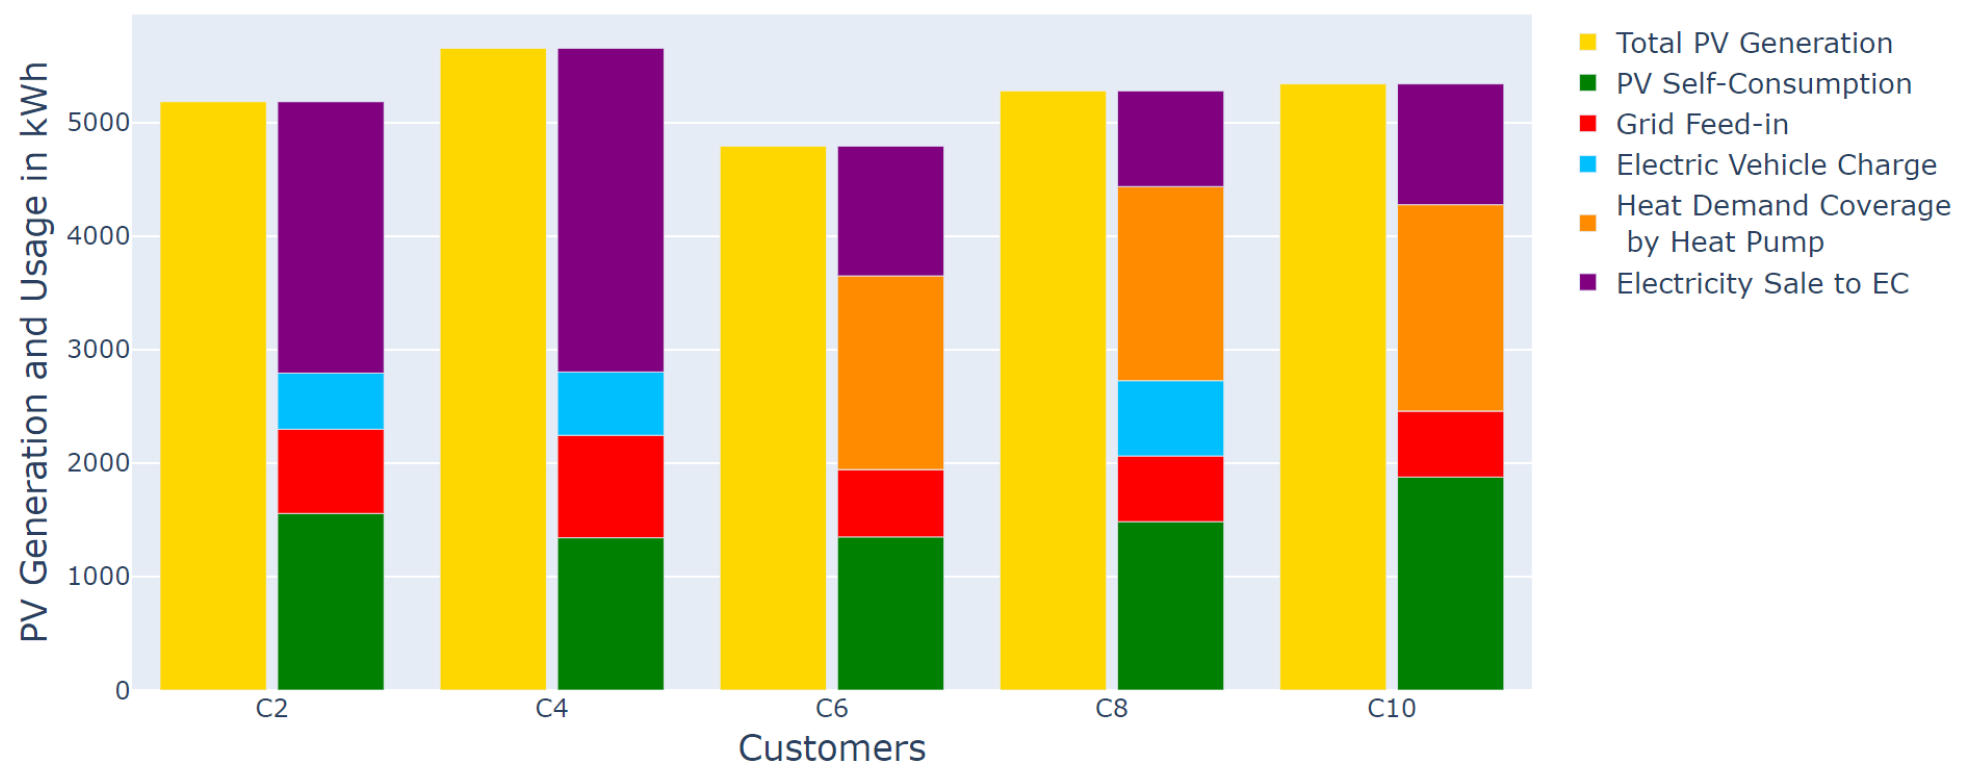
Despite the possibility of self-consuming PV electricity and selling the surplus to community peers, large parts of the total PV generation are still sold to the electricity supplier (conventional grid feed-in), as can be seen in
Figure 4. Grid feed-in is lowest for customer 6, as this was the only one with the PV panels installed in a combination of the eastern and western direction. Since the PV systems of most of the other customers faced south, a combination of east and west orientations seems to be useful.
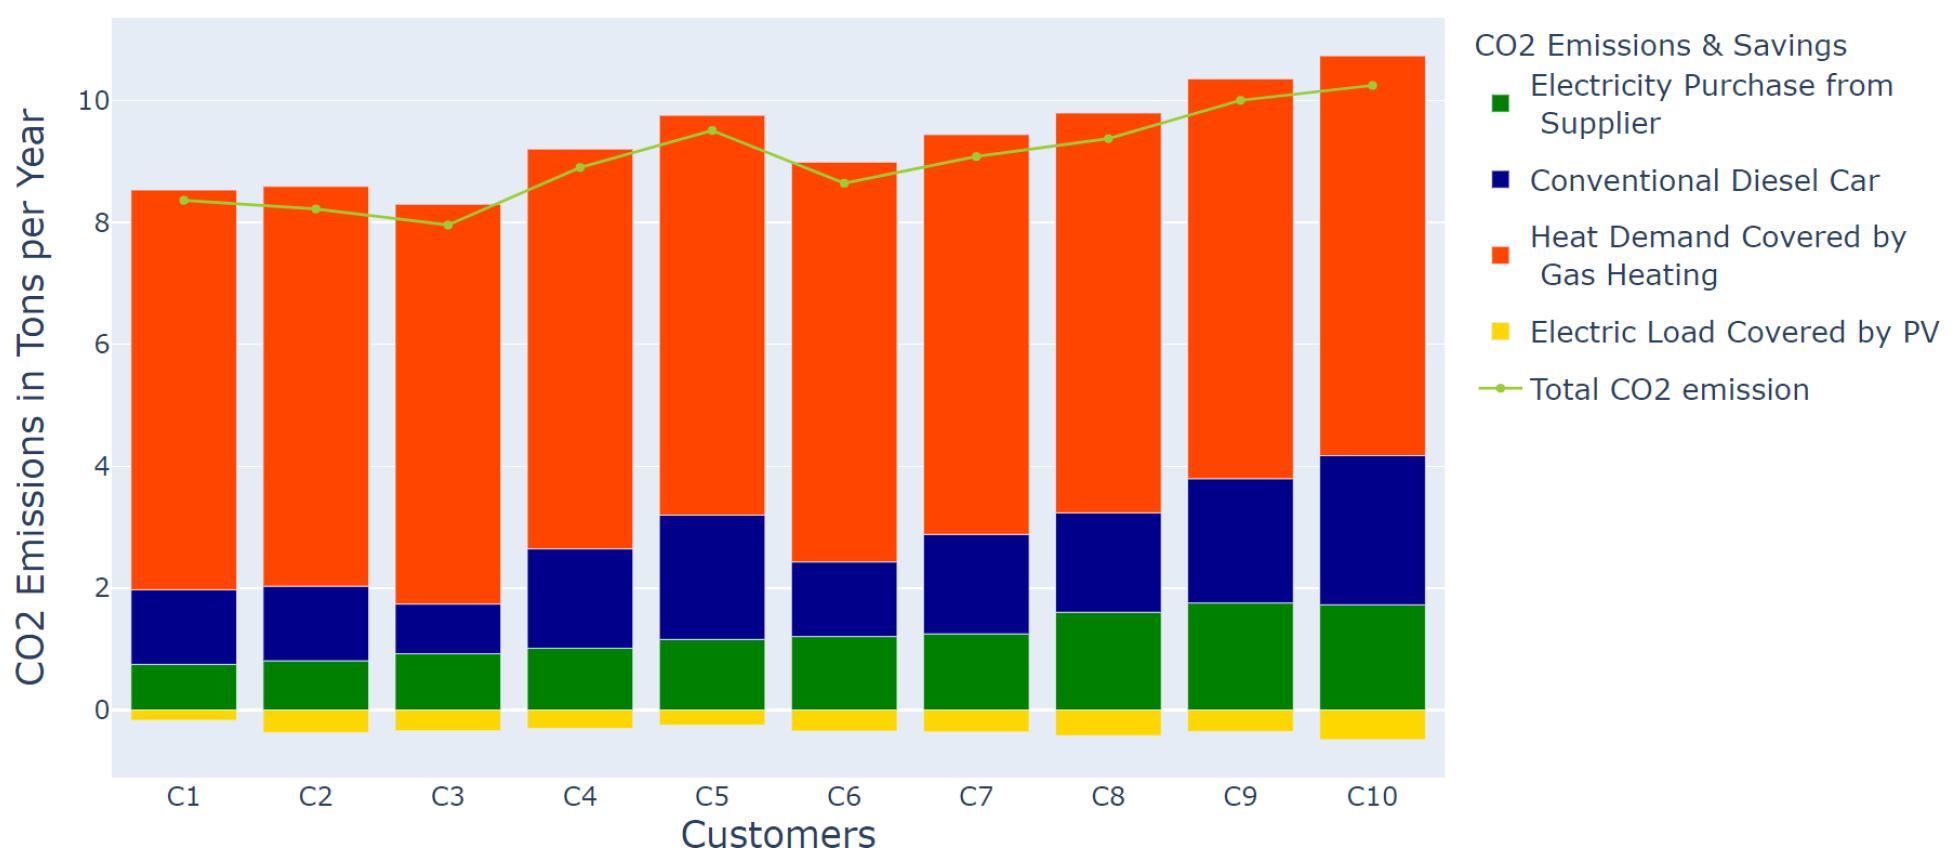
The savings in emissions due to PV electricity consumption are low (
Figure 5). This is due to the small load coverage and the high CO
emissions related to gas heating and fossil-fuelled mobility. Customers 8 and 10 save the most CO
2 emissions, with almost half a ton per year.
4.2.2. Use Case 2
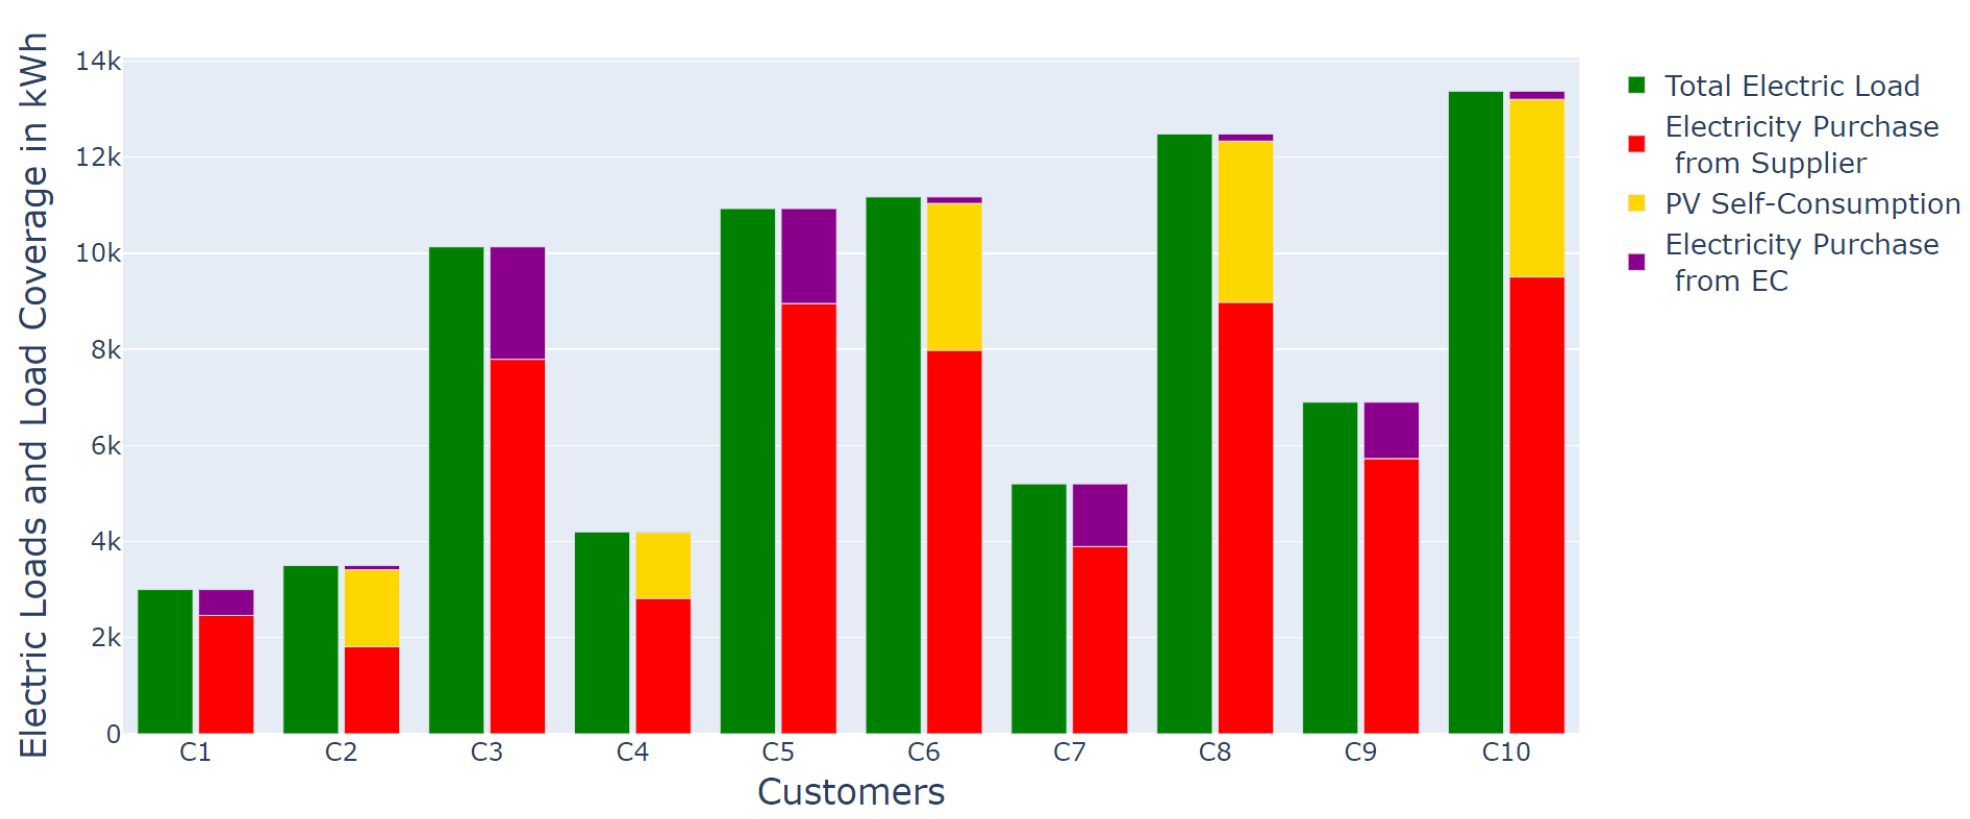
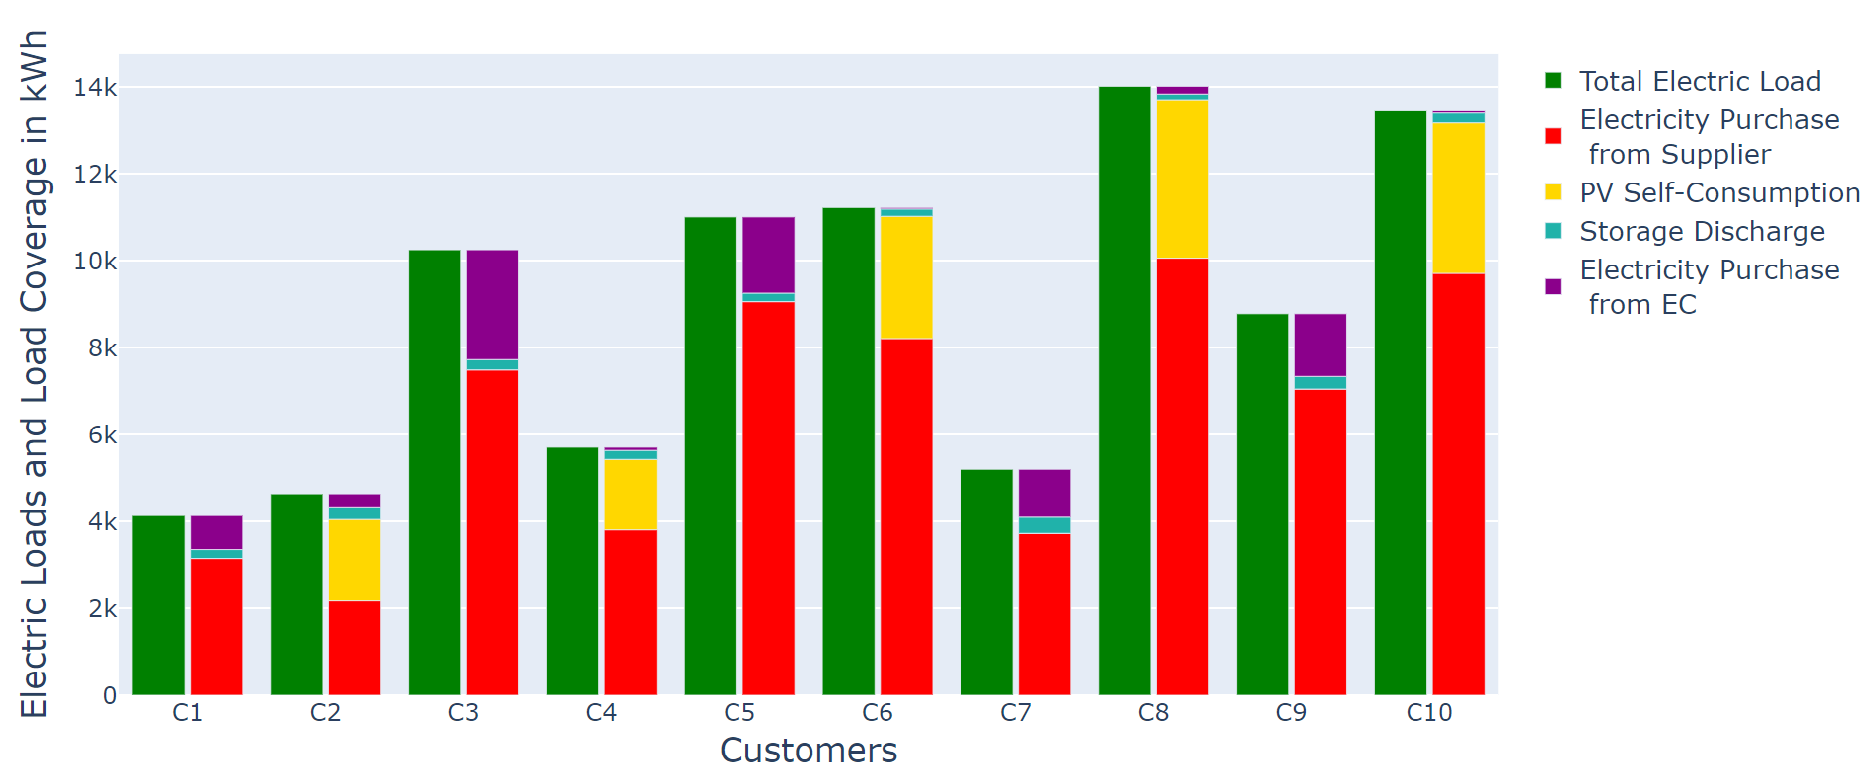
In UC2, households 2, 4, 6, 8, and 10 are equipped with rooftop PV systems, while households 3, 5, 6, 8, and 10 replace their gas heating with HPs. Due to the HP installation, the electric load of the respective customers increases significantly (
Figure 6). This also results in a significant increase in PV self-consumption for customers 6, 8, and 10 (green + orange bars in
Figure 7). Consequently, in comparison to
Figure 4, the amounts of conventional grid feed-in are reduced significantly, while the traded amounts of PV electricity rise equally. Since the objective of the optimisation model is to reduce total costs for the whole community, it is not surprising that, compared to the results of UC1 (
Figure 3), the amounts of electricity purchased from the community peers are reduced for customers 1, 2, 4, 7, and 9 (who are not equipped with HPs). This is because the customers who are equipped with HPs can use the available PV electricity more (cost) efficiently.
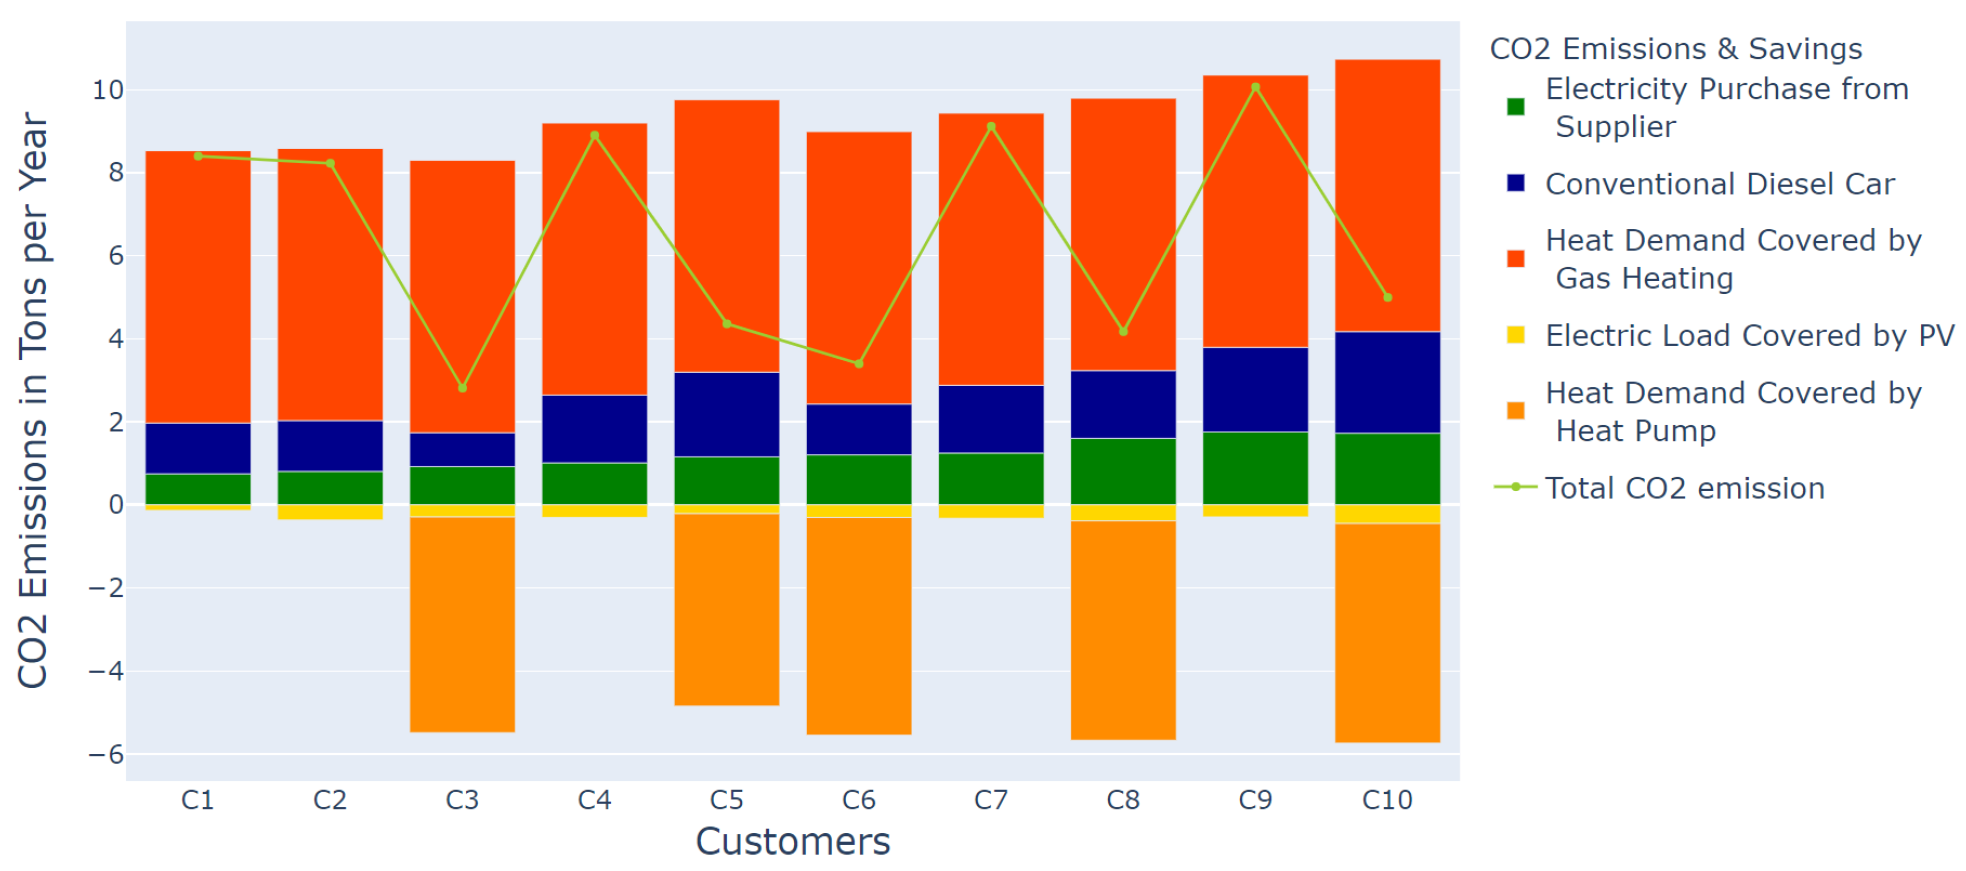
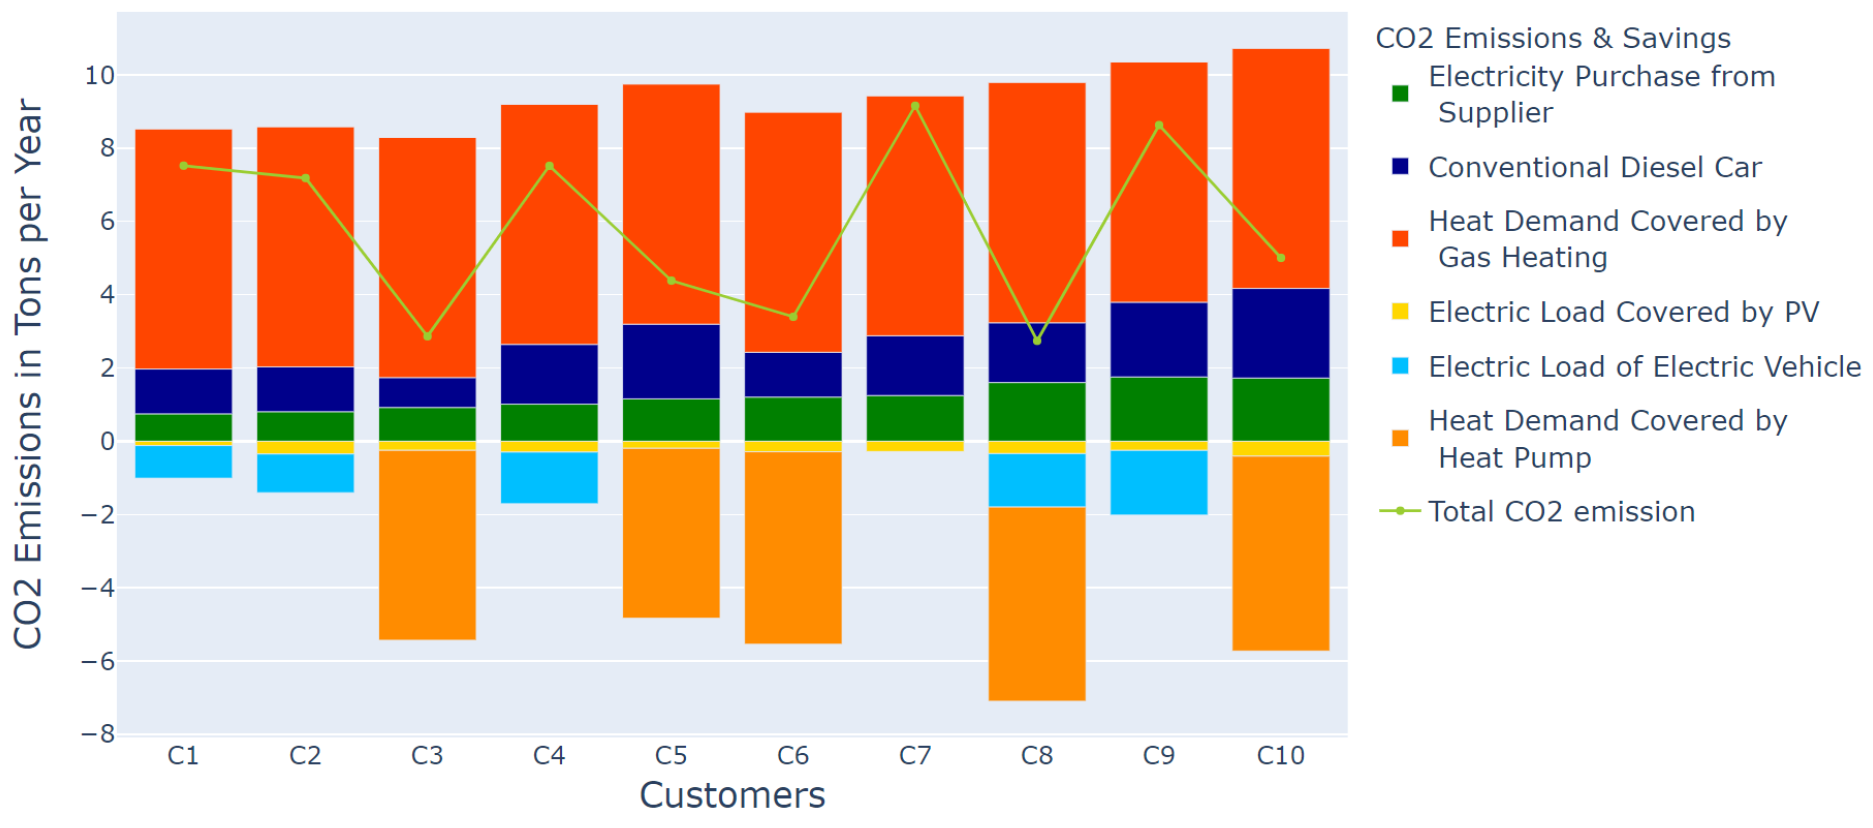
Regarding the CO
2 emissions per year, it can be seen in
Figure 8 that a switch from gas heating to an HP can lead to significant reductions of approximately
t
CO2 per customer and year.
4.2.3. Use Case 5
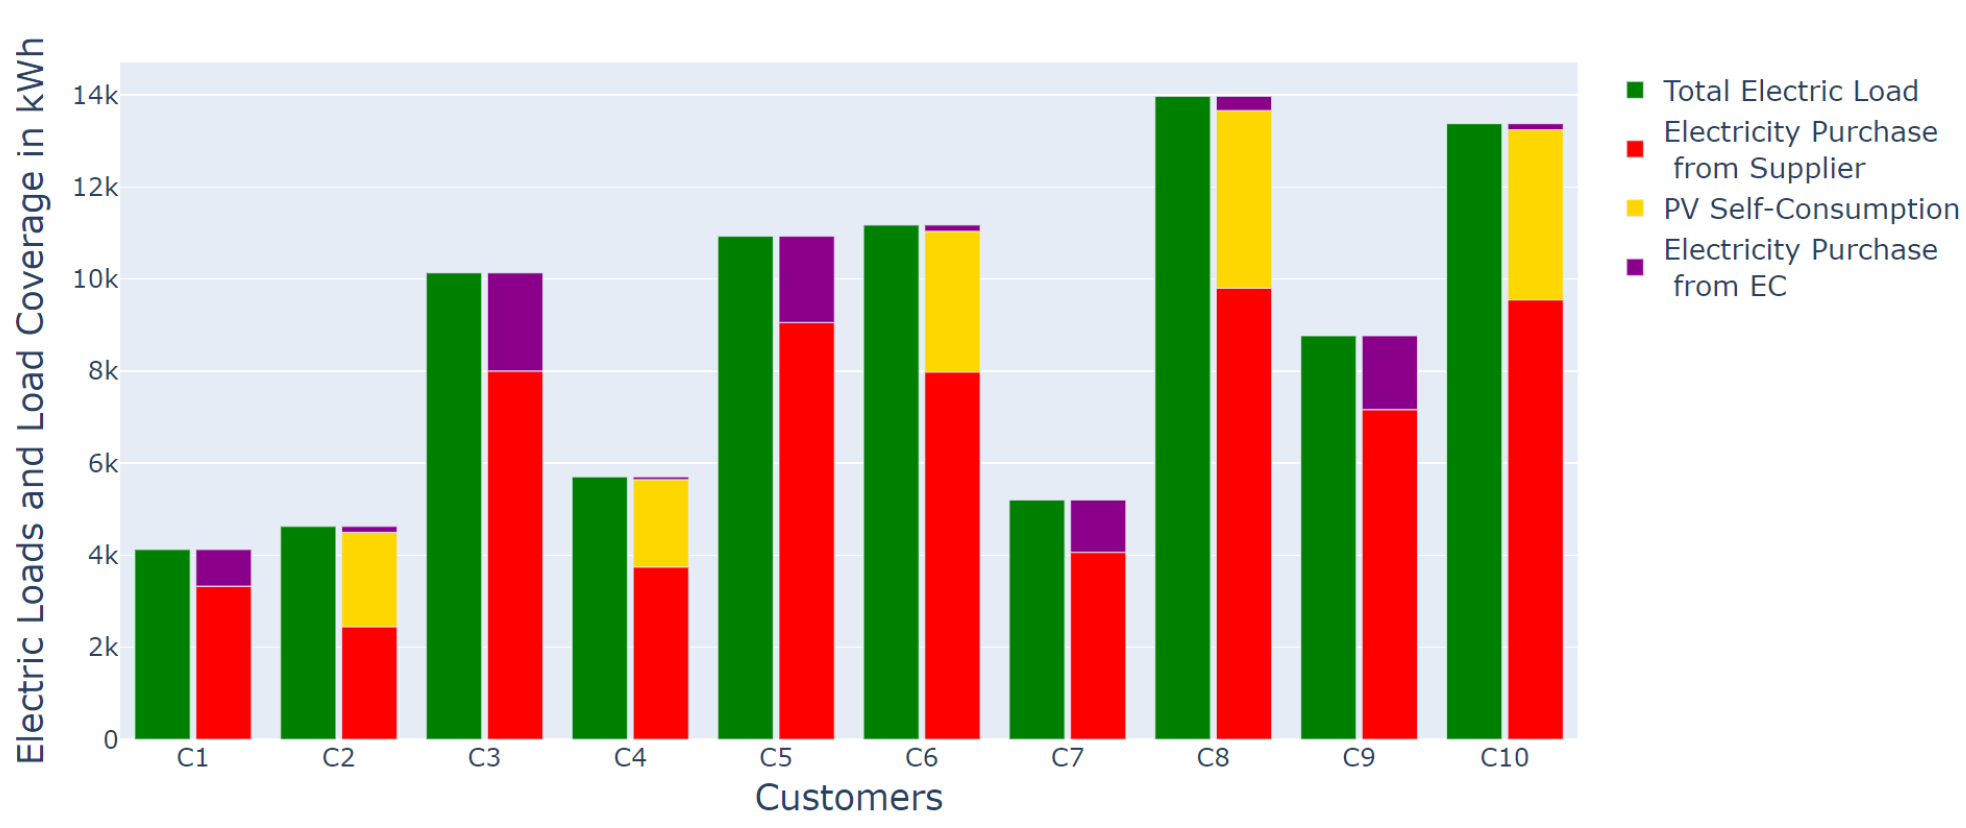
In UC2, households 2, 4, 6, 8, and 10 are equipped with rooftop PV systems, while households 3, 5, 6, 8, and 10 exchange their gas heating for HPs. For UC5, households 1, 2, 4, 8, and 9 additionally replace their fossil-fuelled cars with EVs. With the purchase of an EV, the electricity demand of the respective customers rises further. Looking specifically at the load coverage of households with an EV, it becomes obvious in
Figure 9 that the load coverage by PV self-consumption of customers 2 and 4 rises compared to that in UC2, leaving less PV electricity for community peers. This observation is also confirmed when looking at
Figure 10, where the sums of the green and blue areas of the bars are directly used by customers 2 and 4. Customer 7, who is not equipped with any technology, now receives even less PV electricity from their community peers. This means that the higher the level of electricity consumption technologies in other households is (specifically in the case of HPs with a highly efficient use of electricity), the lower the value of participation for other households will be.
In the example of customer 8, who is equipped with PV, an HP, and an EV, annual emissions can be reduced by approximately 7 t
CO2 per year; therefore, the remaining emissions of this customer lie at approximately
t
CO2 per year (compare to
Figure 11).
4.2.4. Use Case 8
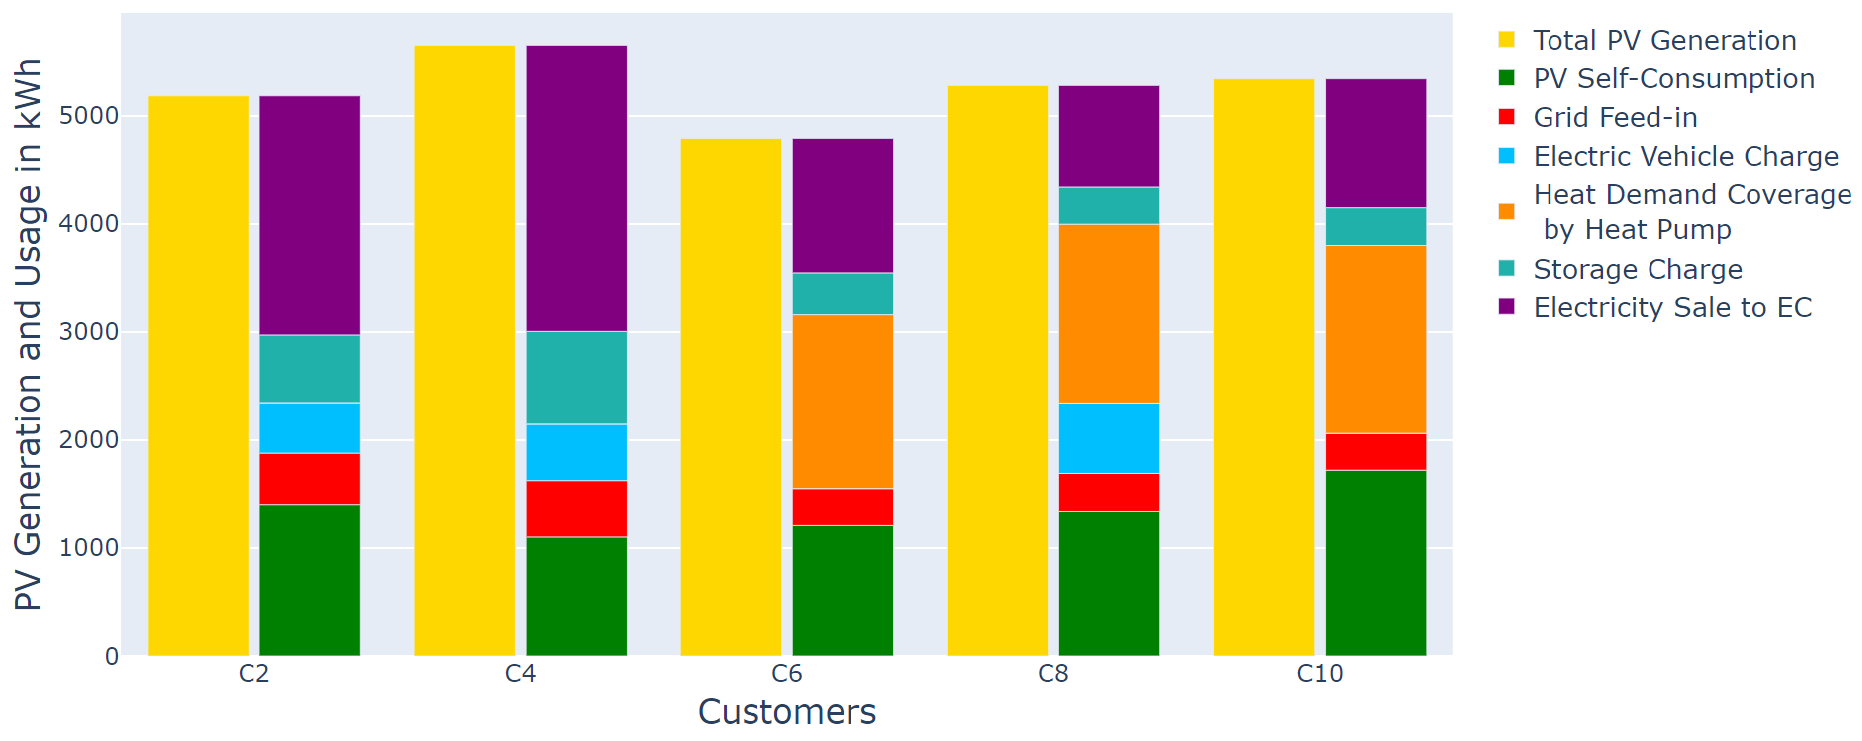
In UC5, households 2, 4, 6, 8, and 10 are equipped with rooftop PV systems, households 3, 5, 6, 8, and 10 replace their gas heating with HPs, and, households 1, 2, 4, 8, and 9 purchase EVs. For UC8, a CBS is additionally installed. Since the storage is dimensioned rather small with 10 kWh, the impact on the results (e.g., load coverage,
Figure 12) is moderate. However, the amount of electricity that needs to be purchased from the conventional electricity supplier is reduced due to the possibility of storing PV electricity, thus enabling a certain ‘shift’ in the available PV generation towards hours of less or no sunshine. With CBS, the situation of customer 7 also improves compared to that in UC5.
Another positive effect of the CBS is that the amounts of PV electricity conventionally fed into the grid are further reduced, and lie—per customer with a PV system—below approximately 500 kWh (equal to or less than 1/10 of the total PV generation) per year (see
Figure 13). The CO
2 emissions per customer in UC8 are almost indistinguishable from the results of UC5 (
Figure 11); therefore, this figure is not shown for UC8.
4.3. Validation of the Model
The model was tested extensively. The validity of the results is proven in
Table 5 and
Table 6, since the individual percentages for load coverage and generation usage add up to 100%. This is also confirmed by the results, showing that the annual load is totally covered (
Figure 3,
Figure 6,
Figure 9 and
Figure 12) and the annual generation is entirely used (
Figure 4,
Figure 7,
Figure 10 and
Figure 13).
5. Discussion and Conclusions
A linear optimisation model that includes peer-to-peer trading between participants and four different generation and consumption technologies (solar PV, CBS, HPs, and EVs) was proven to be suitable for the purpose of determining the economic viability of participating in an EC. The model considered all possible technology permutations in order to be able to examine the technology mixes’ optimality regarding costs and emissions. Since the concept of ECs will gain momentum in the near future, it is of significant importance to assess the possibilities that ECs offer. The positive aspects of EC participation exceed the purely financial aspects, yet, due to limited financial means of a large part of the population, a certain economic viability is important.
Compared to those in other studies, the optimisation model in this work has the advantage of modelling the energy flows within a community in detail (peer-to-peer trading), while still providing a system perspective by considering a variety of different technologies. The optimisation model is not restricted and can be used for any EC worldwide. At most, certain characteristics such as country-specific subsidies for ECs would need to be adapted. In addition, this study’s results—provided for a fictitious EC of 10 single-family houses—have the benefit of being broadly applicable and, thus, can be of value for a broad readership. Not only the private sector, but also policy decision makers, can benefit from this study. With knowledge about the economic viability of ECs in combination with the different technologies involved, decisions concerning regulations and subsidies can be facilitated.
The findings extracted from the results are manifold. In case the objective is to determine the optimal result for the community as a whole (rather than the individual), customers who are equipped with a combination of PV systems, HPs, and EVs achieve better individual profitability results compared to those with lower levels of technology. Especially when HPs are involved, the generated amounts of PV electricity can be used with high efficiency (due to the HPs’ coefficient of performance); therefore, customers equipped with HPs might be preferred in a supply with intra-community PV electricity. The results also show the great potential for PV electricity usage within the borders of a community (and, thus, selling the lowest possible amounts to conventional suppliers) with an increased presence of electricity-based technologies, such as HPs and EVs. The additional implementation of CBS can increase these amounts and, at the same time, contribute to reducing the grid burden through the extensive feed-in of renewables.
A limitation of this work is that the optimisation model is set up for cost-optimal results for the whole community, rather than individuals. This means that individual participants could eventually achieve better results concerning cost savings if their individual objectives would have been considered rather than the common optimum. Thus, it could be of interest for future research to extend this optimisation model with a second optimisation option, namely, that of considering the objectives of individuals. In a comparison of the results, the differences between the community optimum and individuals’ optima could be determined. Moreover, future research could extend the proposed optimisation model by considering an amplification of the technology portfolio. Moreover, it would be of significant interest to include building energy management systems (EMSs) and to compare results for the cases of ECs that do and do not make use of EMSs.
Author Contributions
Conceptualisation, B.F. and C.M.; methodology, B.F., C.M. and M.S.; software, B.F., C.M. and M.S.; validation, B.F., C.M. and M.S.; formal analysis, B.F., C.M. and M.S.; data curation, B.F. and C.M.; writing—original draft preparation, B.F., C.M. and M.S.; writing—review and editing, B.F., C.M. and M.S.; visualisation, C.M. and M.S.; supervision, B.F. and C.M.; project administration, B.F. All authors have read and agreed to the published version of the manuscript.
Funding
This project was funded by the National Foundation for Research, Technology, and Development under grant agreement number 873847. Laura Bassi 4.0 is a research, technology, and innovation funding programme processed by the Austrian Research Promotion Agency, with kind support from the Federal Ministry for Digital and Economic Affairs (BMDW).
Institutional Review Board Statement
Not applicable.
Informed Consent Statement
Not applicable.
Data Availability Statement
Not applicable.
Conflicts of Interest
The authors declare no conflict of interest. The funders had no role in the design of the study; in the collection, analyses, or interpretation of data; in the writing of the manuscript, or in the decision to publish the results.
Abbreviations
The following abbreviations are used in this manuscript:
| CBS | Community Battery Storage |
| CEC | Citizen Energy Community |
| CEP | Clean Energy for All Europeans Package |
| EMD | Electricity Market Directive |
| EV | Electric Vehicle |
| HP | Heat Pump |
| PV | Photovoltaic System |
| REC | Renewable Energy Community |
| RED | Renewable Energy Directive |
| UC | Use Case |
Appendix A. Price Data
As the optimisation aims at minimising an EC’s total costs, the prices for electricity, gas, and diesel have to be fixed. The price parameters used in the mathematical formulation of the optimisation model in
Section 3.1 are based on the prices provided in
Table A1.
Table A1.
Prices, levies, and taxes for energy flows within and outside of the energy community, as well as prices and taxes for gas and diesel (NL = network level).
Table A1.
Prices, levies, and taxes for energy flows within and outside of the energy community, as well as prices and taxes for gas and diesel (NL = network level).
| Price Component | Name | Value for NL 7 |
|---|
| Electricity price for grid electricity | | 0.085 €/kWh |
| Electricity price for electricity traded within the EC | | 0.075 €/kWh |
| Grid tariff (energy component) | | 0.0376 €/kWh |
| Grid tariff (power component) | | 30.00 €/kW |
| Grid tariff reduction factor for electricity traded within the EC | | 50% |
| Electricity levy | | 0.015 €/kWh |
| Biomass levy (energy component) | | 0.0012 €/kWh |
| Biomass levy (power component) | | 1.85 €/kW |
| Green electricity levy (energy component) | | 0.0083 €/kWh |
| Green electricity levy (power component) | | 12.38 €/kW |
| Contribution to green electricity support scheme | | 35.97 €/a |
| Metering charge | | 8.28 €/a |
| Feed-in tariff | | 0.03 €/kWh |
| Value-added tax | | 20% |
| Tariff storage agent | | 0.03 €/kWh |
| Gas price | | 0.034 €/kWh |
| Gas levy | | 0.0058 €/kWh |
| Grid tariff (gas component) | | 0.0129 €/kWh |
| Grid tariff (power component) | | 36 €/a |
| Metering charge (gas) | | 16.2 €/a |
| Value-added tax (gas) | | 20% |
| Diesel price | | 1.25 €/l |
As can be seen in Equation (
A1), the price for electricity purchased from the grid contains various levies, while energy traded within the community is free of those, and the tariff for grid usage is cut to half (this assumption was made before definite numbers of grid tariff reductions were enacted by Austrian legislators). Analogously, when the CBS is charged or discharged, only half of the usual grid tariff cost is considered. For the CBS, an additional price component for remunerating the storage agent is considered. The price for the grid connection power consists of various levies depending on the monthly peak power.
References
- European Commission. Clean Energy for All Europeans Package; European Commission: Brussels, Belguim, 2019. [Google Scholar]
- EUR-Lex. Directive (EU) 2018/2001 of the European Parliament and of the Council of 11 December 2018 on the promotion of the use of energy from renewable sources. Off. J. Eur. Union 2018, 61, 82–209. [Google Scholar]
- EUR-Lex. Directive (EU) 2019/944 of the European Parliament and of the Council of 5 June 2019 on common rules for the internal market for electricity and amending Directive 2012/27/EU. Off. J. Eur. Union 2019, 158, 125–199. [Google Scholar]
- Dóci, G.; Vasileiadou, E.; Petersen, A.C. Exploring the transition potential of renewable energy communities. Futures 2015, 66, 85–95. [Google Scholar] [CrossRef] [Green Version]
- Gui, E.M.; MacGill, I. Typology of future clean energy communities: An exploratory structure, opportunities, and challenges. Energy Res. Soc. Sci. 2018, 35, 94–107. [Google Scholar] [CrossRef]
- Ambole, A.; Koranteng, K.; Njoroge, P.; Luhangala, D.L. A Review of Energy Communities in Sub-Saharan Africa as a Transition Pathway to Energy Democracy. Sustainability 2021, 13, 2128. [Google Scholar] [CrossRef]
- Soeiro, S.; Dias, M.F. Renewable energy community and the European energy market: Main motivations. Heliyon 2020, 6, e04511. [Google Scholar] [CrossRef]
- Soeiro, S.; Dias, M.F. Motivations for Integrating a Renewable Energy Community: Evidence for Spain and Portugal. In Proceedings of the 2020 17th International Conference on the European Energy Market (EEM), Stockholm, Sweden, 16–18 September 2020. [Google Scholar] [CrossRef]
- Bauwens, T. Explaining the diversity of motivations behind community renewable energy. Energy Policy 2016, 93, 278–290. [Google Scholar] [CrossRef]
- Kalkbrenner, B.J.; Roosen, J. Citizens’ willingness to participate in local renewable energy projects: The role of community and trust in Germany. Energy Res. Soc. Sci. 2016, 13, 60–70. [Google Scholar] [CrossRef]
- Woo, J.; Chung, S.; Lee, C.Y.; Huh, S.Y. Willingness to participate in community-based renewable energy projects: A contingent valuation study in South Korea. Renew. Sustain. Energy Rev. 2019, 112, 643–652. [Google Scholar] [CrossRef]
- Piselli, C.; Salvadori, G.; Diciotti, L.; Fantozzi, F.; Pisello, A.L. Assessing users’ willingness-to-engagement towards Net Zero Energy communities in Italy. Renew. Sustain. Energy Rev. 2021, 152, 111627. [Google Scholar] [CrossRef]
- Sokołowski, M.M. Renewable and citizen energy communities in the European Union: How (not) to regulate community energy in national laws and policies. J. Energy Nat. Resour. Law 2020, 38, 289–304. [Google Scholar] [CrossRef]
- Hoicka, C.E.; Lowitzsch, J.; Brisbois, M.C.; Kumar, A.; Camargo, L.R. Implementing a just renewable energy transition: Policy advice for transposing the new European rules for renewable energy communities. Energy Policy 2021, 156, 112435. [Google Scholar] [CrossRef]
- Fina, B.; Fechner, H. Transposition of European Guidelines for Energy Communities into Austrian Law: A Comparison and Discussion of Issues and Positive Aspects. Energies 2021, 14, 3922. [Google Scholar] [CrossRef]
- Palm, J. The Transposition of Energy Communities into Swedish Regulations: Overview and Critique of Emerging Regulations. Energies 2021, 14, 4982. [Google Scholar] [CrossRef]
- Zulianello, M.; Angelucci, V.; Moneta, D. Energy Community and Collective Self Consumption in Italy. In Proceedings of the 2020 55th International Universities Power Engineering Conference (UPEC), Turin, Italy, 1–4 September 2020. [Google Scholar] [CrossRef]
- Frieden, D.; Tuerk, A.; Antunes, A.R.; Athanasios, V.; Chronis, A.G.; d’Herbemont, S.; Kirac, M.; Marouço, R.; Neumann, C.; Catalayud, E.P.; et al. Are We on the Right Track? Collective Self-Consumption and Energy Communities in the European Union. Sustainability 2021, 13, 12494. [Google Scholar] [CrossRef]
- Biresselioglu, M.E.; Limoncuoglu, S.A.; Demir, M.H.; Reichl, J.; Burgstaller, K.; Sciullo, A.; Ferrero, E. Legal Provisions and Market Conditions for Energy Communities in Austria, Germany, Greece, Italy, Spain, and Turkey: A Comparative Assessment. Sustainability 2021, 13, 11212. [Google Scholar] [CrossRef]
- Fina, B.; Monsberger, C.; Auer, H. Simulation or estimation?—Two approaches to calculate financial benefits of energy communities. J. Clean. Prod. 2022, 330, 129733. [Google Scholar] [CrossRef]
- Cejka, S. Legal measures to aid profitability for energy communities and their participants. In Proceedings of the 2020 Zooming Innovation in Consumer Technologies Conference (ZINC), Novi Sad, Serbia, 26–27 May 2020. [Google Scholar] [CrossRef]
- Viti, S.; Lanzini, A.; Minuto, F.D.; Caldera, M.; Borchiellini, R. Techno-economic comparison of buildings acting as Single-Self Consumers or as energy community through multiple economic scenarios. Sustain. Cities Soc. 2020, 61, 102342. [Google Scholar] [CrossRef]
- Fina, B.; Fleischhacker, A.; Auer, H.; Lettner, G. Economic Assessment and Business Models of Rooftop Photovoltaic Systems in Multiapartment Buildings: Case Studies for Austria and Germany. J. Renew. Energy 2018, 2018, 9759680. [Google Scholar] [CrossRef]
- Fina, B.; Auer, H.; Friedl, W. Profitability of PV sharing in energy communities: Use cases for different settlement patterns. Energy 2019, 189, 116148. [Google Scholar] [CrossRef]
- Radl, J.; Fleischhacker, A.; Revheim, F.H.; Lettner, G.; Auer, H. Comparison of Profitability of PV Electricity Sharing in Renewable Energy Communities in Selected European Countries. Energies 2020, 13, 5007. [Google Scholar] [CrossRef]
- Fina, B.; Auer, H. Economic Viability of Renewable Energy Communities under the Framework of the Renewable Energy Directive Transposed to Austrian Law. Energies 2020, 13, 5743. [Google Scholar] [CrossRef]
- De Villena, M.M.; Mathieu, S.; Vermeulen, E.; Ernst, D. Allocation of locally generated electricity in renewable energy communities. arXiv 2020, arXiv:2009.05411. [Google Scholar]
- Isaac, S.; Shubin, S.; Rabinowitz, G. Cost-Optimal Net Zero Energy Communities. Sustainability 2020, 12, 2432. [Google Scholar] [CrossRef] [Green Version]
- Bianco, G.; Bonvini, B.; Bracco, S.; Delfino, F.; Laiolo, P.; Piazza, G. Key Performance Indicators for an Energy Community Based on Sustainable Technologies. Sustainability 2021, 13, 8789. [Google Scholar] [CrossRef]
- Cosic, A.; Stadler, M.; Mansoor, M.; Zellinger, M. Mixed-integer linear programming based optimization strategies for renewable energy communities. Energy 2021, 237, 121559. [Google Scholar] [CrossRef]
- Karunathilake, H.; Hewage, K.; Mérida, W.; Sadiq, R. Renewable energy selection for net-zero energy communities: Life cycle based decision making under uncertainty. Renew. Energy 2019, 130, 558–573. [Google Scholar] [CrossRef]
- Bakhtavar, E.; Prabatha, T.; Karunathilake, H.; Sadiq, R.; Hewage, K. Assessment of renewable energy-based strategies for net-zero energy communities: A planning model using multi-objective goal programming. J. Clean. Prod. 2020, 272, 122886. [Google Scholar] [CrossRef]
- Cheng, L.; Bae, Y.; Horton, W.T. A system-level approach for designing multi-family sustainable and energy-efficient housing communities. Sustain. Cities Soc. 2019, 44, 183–194. [Google Scholar] [CrossRef]
- Fleischhacker, A.; Lettner, G.; Schwabeneder, D.; Auer, H. Portfolio optimization of energy communities to meet reductions in costs and emissions. Energy 2019, 173, 1092–1105. [Google Scholar] [CrossRef]
- Ye, G.; Li, G.; Wu, D.; Chen, X.; Zhou, Y. Towards Cost Minimization With Renewable Energy Sharing in Cooperative Residential Communities. IEEE Access 2017, 5, 11688–11699. [Google Scholar] [CrossRef]
- Fleischhacker, A.; Auer, H.; Lettner, G.; Botterud, A. Sharing Solar PV and Energy Storage in Apartment Buildings: Resource Allocation and Pricing. IEEE Trans. Smart Grid 2019, 10, 3963–3973. [Google Scholar] [CrossRef]
- Wang, J.; Garifi, K.; Baker, K.; Zuo, W.; Zhang, Y.; Huang, S.; Vrabie, D. Optimal Renewable Resource Allocation and Load Scheduling of Resilient Communities. Energies 2020, 13, 5683. [Google Scholar] [CrossRef]
- Hupez, M.; Toubeau, J.F.; Greve, Z.D.; Vallee, F. A New Cooperative Framework for a Fair and Cost-Optimal Allocation of Resources within a Low Voltage Electricity Community. IEEE Trans. Smart Grid 2020, 12, 2201–2211. [Google Scholar] [CrossRef]
- Hachem-Vermette, C.; Singh, K. Energy Systems and Energy Sharing in Traditional and Sustainable Archetypes of Urban Developments. Sustainability 2022, 14, 1356. [Google Scholar] [CrossRef]
- Perger, T.; Wachter, L.; Fleischhacker, A.; Auer, H. PV sharing in local communities: Peer-to-peer trading under consideration of the prosumers’ willingness-to-pay. Sustain. Cities Soc. 2021, 66, 102634. [Google Scholar] [CrossRef]
- Park, D.H.; Park, J.B.; Lee, K.Y.; Son, S.Y.; Roh, J.H. A Bidding-Based Peer-to-Peer Energy Transaction Model Considering the Green Energy Preference in Virtual Energy Community. IEEE Access 2021, 9, 87410–87419. [Google Scholar] [CrossRef]
- Oh, E.; Son, S.Y. Peer-to-Peer Energy Transaction Mechanisms Considering Fairness in Smart Energy Communities. IEEE Access 2020, 8, 216055–216068. [Google Scholar] [CrossRef]
- Pena-Bello, A.; Parra, D.; Herberz, M.; Tiefenbeck, V.; Patel, M.K.; Hahnel, U.J.J. Integration of prosumer peer-to-peer trading decisions into energy community modelling. Nat. Energy 2021, 7, 74–82. [Google Scholar] [CrossRef]
- Hahnel, U.J.; Herberz, M.; Pena-Bello, A.; Parra, D.; Brosch, T. Becoming prosumer: Revealing trading preferences and decision-making strategies in peer-to-peer energy communities. Energy Policy 2020, 137, 111098. [Google Scholar] [CrossRef]
- Liu, J.; Yang, H.; Zhou, Y. Peer-to-peer energy trading of net-zero energy communities with renewable energy systems integrating hydrogen vehicle storage. Appl. Energy 2021, 298, 117206. [Google Scholar] [CrossRef]
- Schram, W.; Louwen, A.; Lampropoulos, I.; van Sark, W. Comparison of the Greenhouse Gas Emission Reduction Potential of Energy Communities. Energies 2019, 12, 4440. [Google Scholar] [CrossRef] [Green Version]
- Kellett, J. Community-based energy policy: A practical approach to carbon reduction. J. Environ. Plan. Manag. 2007, 50, 381–396. [Google Scholar] [CrossRef]
- Pelet, X.; Favrat, D.; Leyland, G. Multiobjective optimisation of integrated energy systems for remote communities considering economics and CO2 emissions. Int. J. Therm. Sci. 2005, 44, 1180–1189. [Google Scholar] [CrossRef]
| Publisher’s Note: MDPI stays neutral with regard to jurisdictional claims in published maps and institutional affiliations. |
© 2022 by the authors. Licensee MDPI, Basel, Switzerland. This article is an open access article distributed under the terms and conditions of the Creative Commons Attribution (CC BY) license (https://creativecommons.org/licenses/by/4.0/).
