1. Introduction
Global trends indicate an increase in the population and motorization rate in urban areas, which result in an increase in transport demand. This very often leads to the current capacities of road networks being unable to provide a balance between transport supply and transport demand. As a result, the required level of service (LOS) [
1] is not met. Spatial constraints in urban areas do not allow physical capacity extension, but transport demand is managed through transport policies that promote alternative modes of transportation and modern information technology solutions for traffic management. Accordingly, it is very important to identify all the potential impacts that could lead to reductions in the street network capacity and an unacceptable LOS. One such impact that could cause the aforementioned consequences is weather conditions.
Global warming and increasing greenhouse gas emissions result in climate changes, which affect weather characteristics. Depending on the geographical location of the area, the changes may be reflected by an increase in the number of rainy days, intensity of precipitation, average temperature during the summer months, and number of days with strong wind. For road users, any deviation from ideal weather conditions causes a change in travel behavior. Ideal weather conditions could be described as follows: no precipitation, dry roadway, visibility greater than 0.4 km, wind speed lower than 16 km/h, and temperatures above 10 °C [
2,
3,
4]. The impact of weather conditions on traffic flow is neglected in most traffic models and procedures for analyzing capacity and LOS. Only in its latest edition, from 2016, did the Highway Capacity Manual (HCM) include the impact of weather conditions when computing free-flow speed and capacity [
1].
When it comes to analyses of different weather conditions’ impacts on traffic flow parameters, rainfall is one of the most frequently analyzed [
1,
5,
6]. Reduced visibility and slippery roads caused by rainfall lead to more careful driving, i.e., a reduction in vehicle speed [
7]. Road users are most sensitive to changes in speed, which is directly related to the LOS [
1]. Drivers, reacting individually to the newly created environment and through an interaction with the other road users in the traffic flow, contribute to the deterioration of traffic flow conditions. This impact is even more evident on traffic segments with high traffic volume, i.e., on segments with a critical volume to capacity ratio. A high volume-to-capacity ratio results in congestion, i.e., an increase in travel time, which brings with it a number of indirect effects, such as increased air pollution, noise, and vehicle operating costs [
8]. In addition, studies have shown that adverse weather conditions significantly affect the probability of accidents [
9].
In terms of city street network characteristics, there are interesting cases in which a high-capacity transit road passes through the city center and, at the same time, represents a part of the city street network. In these cases, in addition to transit traffic, local city traffic makes up a significant proportion of traffic flow. This is especially important in cases when this road represents one of the limited number of alternatives for moving from one part of the city to another. This often results in critical values of the volume-to-capacity ratio, especially during peak hours [
10].
Traffic in urban areas is very sensitive to precipitation, and mitigating the negative consequences of this by applying transport policies and management measures requires the quantification of the rainfall impact.
Since the characteristics of weather type, driver behavior, and driver habits differ with the geographical location, in order to obtain relevant results, it is necessary to conduct research in the local area. In this paper, the rainfall impact on changes in traffic flow characteristics is investigated on one of the most important segments in the Belgrade street network. It is a segment of freeway that passes through the city center and, at the same time, connects the old and the new parts of the city. According to the characteristics of the freeway segment and the fact that it is a multi-lane segment, the authors apply a methodology that focuses on the analysis of the rainfall’s impact on each traffic lane, unlike most previously conducted studies, which only consider the direction. The authors’ basic hypothesis is the following notion: determining the different rainfall impact per traffic lane presents additional opportunities for a better definition of traffic management measures that take into account these differences and achieve more significant results in mitigating negative rainfall impacts.
1.1. Motivation
The results of previous studies have shown that weather conditions, i.e., rainfall, affect changes in traffic flow characteristics. When looking at a road that is a functionally important part of the street network, special attention should be paid to all the influential factors that can lead to congestion and a decrease in the LOS.
The structure of the street network of the city of Belgrade is divided into the old and the new parts, between which passes the Sava River. There is very intensive exchange of trips between these two parts of the city, especially during peak hours. Although there are several bridges that allow one to cross from one part of the city to the other, the Gazelle Bridge represents the most popular and oft-used option. Despite its high capacity, during peak hours (6–8 h per day) it operates in saturated traffic flow conditions. At the same time, the Gazelle Bridge represents a segment of the city freeway, and thus, in addition to local traffic, it also experiences transit traffic. During recent years, annual average daily traffic (AADT) has ranged from 140,000 to 150,000 veh/day on this segment. Bearing in mind the role and importance of Gazelle Bridge in the Belgrade street network, the occurrence of traffic congestion on this section spills over to other parts of the network via shock waves.
The main motivation of this research is to determine and quantify how rainfall impacts speed and capacity on one of the most important segments of the street network in the city of Belgrade, striving to ensure the maximum capacity of the analyzed segment under rainfall impact. For this purpose, the authors propose a highly detailed impact analysis that takes every traffic lane into account, separately. This represents the initial step in the procedure of mitigating the negative effects of treated impacts through a better definition of traffic management measures, e.g., adaptive signaling that can limit the maximum speed in traffic lanes according to the rainfall intensity. In this way, it should be possible to maintain the volume and capacity ratios at the desired level and reduce the number of traffic accidents.
1.2. Contributions
Unlike most previous studies that have analyzed the impact of adverse weather conditions by observing directional traffic flows, this paper presents a new approach that treats each traffic lane separately. The idea behind this research method is to examine whether there are differences in the impact in relation to traffic lanes, which would provide a basis for the application of management measures at the traffic lane level. The main contributions of the paper are as follows:
It is confirmed that rainfall affects the parameters of the traffic flow;
The influence of different rainfall intensities on the capacity per traffic lane is quantified;
The influence of different rainfall intensities on the average speed per traffic lane is quantified;
The negative impacts of rainfall vary depending on rainfall intensity and the observed freeway lane.
1.3. Structure of the Paper by Sections
The first section of the paper provides a general description and emphasizes the importance of weather condition impact analysis for traffic flow.
Section 2 presents the results of relevant previous studies. The research methodology is presented in
Section 3.
Section 4 and
Section 5 are dedicated to the results and discussion, respectively, while in the last section, the main conclusions and directions for further research are presented.
2. Literature Review
In the most important manual of traffic engineering, HCM 2016, the impact of unfavorable weather conditions is included in the analysis of basic freeway segments. The capacity adjustment factor (CAF) and speed adjustment factor (SAF), which quantify impacts on capacity and free-flow speed, are introduced there. HCM identifies 11 classes of adverse weather conditions. Two of them relate to rainfall intensity—medium rain and heavy rain. Medium rain reduces capacity by 6% (CAF = 0.94) and free speed by 4% (SAF = 0.96), while heavy rain decreases capacity by 11% (CAF = 0.89) and free speed by 6% (SAF = 0.94) [
1].
Zhang et al. found a correlation between the congestion index and the intensity of precipitation (rainfall) [
11].
Prokhorchuk et al. examined the impact of weather conditions on traffic flow conditions using high-resolution rainfall radar images of street networks. The results show that the impact of weather conditions depend on the intensity of precipitation (rainfall), time of the day, and day of the week.
Due to the fact that the amount of precipitation, as well as the conditions of the traffic flow, can significantly vary in space and time, the paper determined the speed of the traffic flow at five-minute intervals. The impact of precipitation is more evident on freeway segments than on other parts of the street network. This is a consequence of higher speeds on freeway segments [
12].
Research in Brisbane, Australia, has shown that precipitation affects an increase in traffic demand, especially during working days. Additionally, weather conditions have a greater impact in urban areas compared with suburban areas. For more accurate modeling of the impact of precipitation on traffic infrastructure, it is necessary to consider the spatial and temporal impacts of precipitation on traffic flow [
13].
Saberi and Bertini found that different rainfall intensities cause a reduction in speed of up to 11% and traffic flow of up to 14% during the afternoon peak period in Portland [
14].
A study conducted at the University of Virginia in 2004 classified rainfall intensity into light rain (0.25 to 6.4 mm per hour) and heavy rain (>6.4 mm per hour). The decrease in capacity became more obvious and statistically significant as the intensity of precipitation increased. Light rain reduced the capacity of the freeway by 4% to 10%, while heavy rain reduced the capacity by 20% to 30% [
5].
Ibrahim and Hall also examined speed reduction on a freeway in adverse weather conditions. In free flow traffic conditions under light rainfall, they found a decrease in speed of 1.9 km/h, while under heavy rainfall a decrease of 4.8 to 6.4 km/h can be expected. With a flow of 2400 veh/h under light rainfall, a decrease in speed of 6.4 to 12.9 km/h can be expected, while under heavy rain a decrease in speed of 12.9 to 16.0 km/h can be expected [
15].
Hogema et al. conducted a study of the impact of rainfall on speed on the A16 freeway in the period from 1991 to 1994. The speed limit was 100 km/h, and the freeway has a standard profile with two lanes going in each direction. The amount of rainfall was classified into three levels: up to 1 mm/h represents rainfall of a low intensity, 1–5 mm/h is medium, and over 5 mm/h is heavy. The results of the research show that the average speed of traffic flow in rainy conditions decreases by 11 km/h. There is a greater reduction in the average speed in free flow conditions than in conditions of saturated traffic flow [
16].
In 2011, a study was conducted on the freeways in the urban part of Istanbul examining the effects of different weather conditions (dry, rain, fog, and snow) on the speed, traffic flow rate, and traffic density. The conclusions were that the rainfall, on average, reduces speeds by 8–12% (about 7 km/h) and traffic flow rates by 6–7%. The results obtained are also classified by different percentages of commercial vehicles in traffic flow. The largest reductions in traffic flow parameters occur if the percentage of commercial vehicles in the traffic flow is between 20% and 30% for all weather conditions [
17].
The research conducted on the freeway network in Tokyo, Japan, classified rainfall according to three intensities: 0 mm/h, 0–1 mm/h, and 5–10 mm/h. The speed reduction ranges between 4.5% and 8.2%. The study of the impact of rainfall on capacity reduction concluded that, at the lowest precipitation of 1 mm/h, there is a decrease in capacity of 4–7%, and there is a decrease in capacity of 14% for the most intensive precipitation [
6].
Research from Malaysia has shown that heavy rains up to 50 mm/h can reduce the average speed by up to 14% [
18].
Suwanno et al. created a model of the impact of rain on macroscopic traffic flow parameters based on the data from vehicle detectors placed on the main roads of Bangkok. This model shows that, depending on the intensity of precipitation (light rain from 0.1 to 10.0 mm, moderate rain from 10.1 mm to 35.0 mm, and heavy rain over 35 mm), there is an average speed reduction of 6.7–53.3% and an average traffic flow rate reduction of 1–27.2%, while the increase in the total travel time on the network increases by 4.5–128% [
19].
In their study, Ahmed M. and Ghasemzadeh A. examined the impact of precipitation on driver behavior. The probability that drivers reduce their speed by more than 5 km/h in relation to set speed limits in light rain is 23% higher and in heavy rain is 29% higher [
7].
A study in Melbourne, Australia, conducted on data from 1989 and 1996 showed that there was a statistically significant reduction of 1.35–2.11% in the traffic volume on rainy days. The reduction increased to 2–3% in the case of 2–10 mm of precipitation, while the largest decrease of 3.43% was for 2–5 mm of precipitation in spring [
20]
Based on the traffic flow and precipitation data (the focus was on rainfall intensity) on the Hainan Province Eastern Freeway, Wang and Lou calibrated a two-regime model of interdependence between flow rate and density. The results show that the influence on free speed and maximum flow rate increases with increasing precipitation intensity. The precipitation intensity was observed in the range from 0 to 15 mm/h. In comparison to ideal weather conditions, the maximum flow rate is reduced by 15.7%, 19.1% and 32.5%, and the free-flow speed is reduced by 4.4%, 7.3%, and 10.6%, respectively, in light, moderate, and heavy rain, respectively [
21].
The correlation between the travel speed and rainfall intensity in the central zone of Bangkok was explored using probe vehicle data. The results show that an increase in precipitation by 1 mm leads to a decrease in the average speed by 0.02 km/h [
22].
Zhang et al. compared four basic models of traffic flow theory in order to determine the most suitable for describing the data obtained under adverse weather conditions on a Beijing freeway. The authors showed that the Greenshields model was the best-fitting model. The following results were obtained: a capacity reduction of 7.26%, 10.87%, and 17.09% and free-flow speed reduction of 3.07%, 5.29%, and 6.64% under light rain, medium rain, and heavy rain, respectively. The reductions in speed were similar under saturation flow [
23].
Chen et al. examined the possibility of using a driving simulator and VISSIM as tools to assess driver behavior under the impact of adverse weather conditions. The obtained results are in line with the results of research in real conditions and confirm the thesis that weather conditions affect changes in driver behavior [
24].
Due to adverse weather conditions, the number of traffic accidents is increasing. If the intensity of precipitation increases by 0.5 mm in 24 months, the number of fatal traffic accidents will increase by 4.8% in California and 4.6% in Arizona [
9].
A review of the literature shows significant discrepancies in the results of the impact of rainfall intensities on speed. Obtained results depend on the geographical location and characteristics of drivers, which confirms the importance of conducting a survey at the local level. Most of the studies were conducted in uninterrupted traffic flow conditions on freeway segments considering total traffic by direction. Based on such results, it is difficult to define precise control measures at the level of the traffic lane in order to achieve an adequate volume-to-capacity ratio. In order to fill this research gap, the aim of this paper is to explore the differences between rainfall impacts on different traffic lanes.
3. Rainfall Impact—Problem Definition
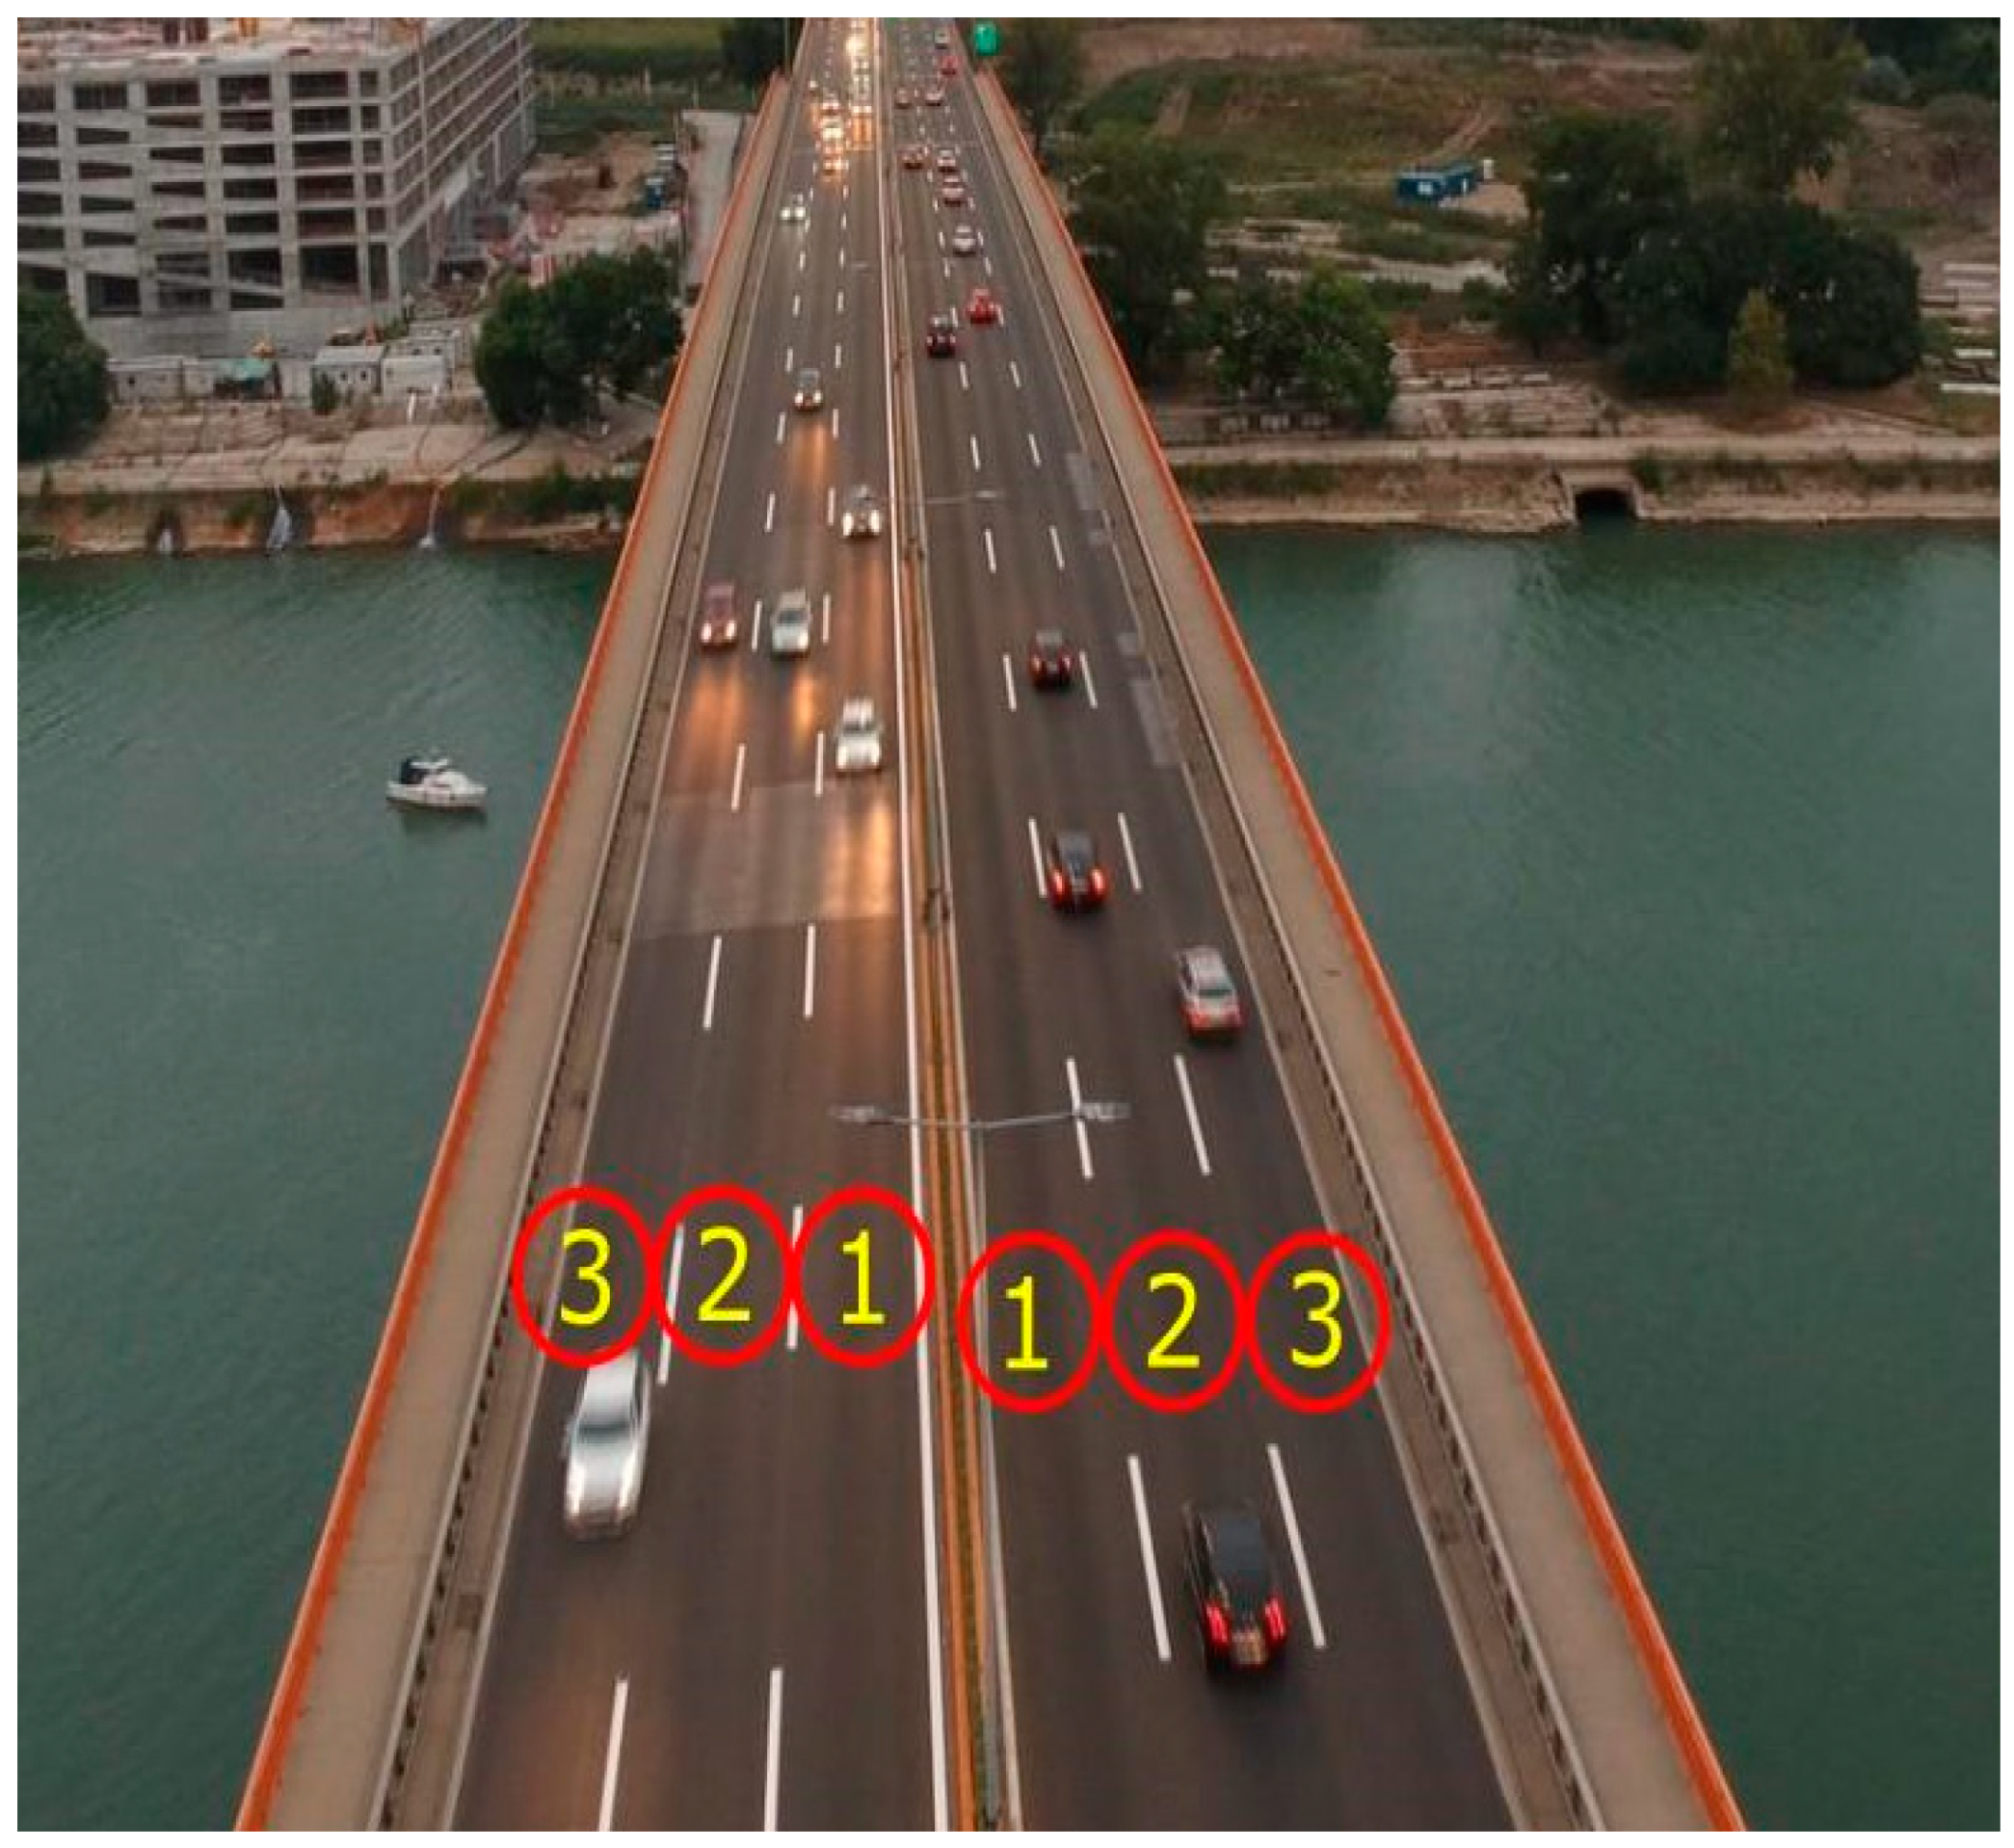
The object of this study was to investigate the impact of rainfall on traffic flow parameters on the Gazelle Bridge, one of the most important road segments in the street network system of the city of Belgrade (
Figure 1). This section is characterized by the participation of local (short-distance) and transit (long-distance) traffic. This is a consequence of the fact that this section belongs to the city street network while, at the same time, it forms part of the important Pan-European Corridor X that connects the north and south of Serbia. Despite the fact that future development plans envisage the completion of a bypass around Belgrade in a full freeway profile, in almost all analyzed scenarios on this segment, a high volume-to-capacity ratio is expected. The current restriction of heavy vehicle traffic on the Gazelle Bridge has additionally contributed to the elimination of flow structure impact on output results.
The percentage of passenger cars being 92.24% [
25], the absence of inflow ramps, and optimum technical characteristics enable isolated observations of rainfall impacts on traffic flow characteristics. Regardless of the considered future development scenarios, it is likely that the highest traffic volume in the street network of Belgrade will remain in this segment. Local daily commuting contributes to the high volume-to-capacity ratio, especially during the morning and afternoon peak hours (see
Figure 1). That is why the focus of this research was on this segment and not on the entire freeway through the city. The figure also shows that there are several alternative routes for crossing the river, but the directness of this link in the road network of Belgrade makes the alternatives less attractive.
Any additional impact on the capacity reduction in this segment would significantly reduce the already critical LOS, especially at certain times of the day. The results of the quantification of rainfall impacts on the main traffic flow parameters are the starting point in defining measures to mitigate these negative impacts. As was previously stated, the main aim of this paper is to explore the potential differences in rainfall impacts on capacity and traffic flow speed per traffic lane, in order to provide the opportunity to consider additional traffic management measures to mitigate negative rainfall impacts.
The fact is that the use of information on different rainfall impacts per traffic lane in traffic management would require more comprehensive research and analysis at the level of the complete street network, but the importance and characteristics of the analyzed segment justify its selection for the initial pilot study.
3.1. Survey Methodology
The applied methodology consists of several steps. The first step was to determine the characteristics of climate and precipitation in order to define the categories of rainfall intensity that would correspond to the survey location.
In the second step, the data on traffic flow (traffic flow rate and average speed) and data on rainfall by day in the selected period were selected (identified days with and without precipitation). Subsequently, database creation and data processing were started, i.e., the value of traffic flow rate and average speed was determined for each time interval with an appropriate category of rainfall intensity and for corresponding intervals without rainfall. The overall procedure is explained in the following sections.
3.1.1. Climate Characteristics and Defining Rainfall Intensity Categories
The city of Belgrade is characterized by a moderate continental climate. According to the Köppen–Geiger climate classification, the research area belongs to the zone of humid continental climate [
26]. The winter is relatively mild, with an average of 21 days with temperatures below 0 degrees. January is the coldest month, with an average temperature of 0.1 °C. The average annual temperature is around 11.7 degrees. Belgrade and its surrounding area receive an average of 669.5 mm of precipitation per year. May and June have the highest amount of precipitation. The average duration of sunshine is 2096 h per year. The average number of days with snowfall is 27, the length of snow cover retention is 30 to 44 days, and the thickness of snow cover is 14 to 25 cm [
27].
Since the idea of the paper is to determine the influence of different rain intensities on traffic flow parameters, in the first step, the categories of rainfall intensity are defined. To determine the categorization of rainfall intensity, the data from a survey conducted in Belgrade during the four years between 2012 and 2015 were used [
2]. The intensity of precipitation was monitored at an automatic meteorological station at one-minute intervals. A total of 2063 h of rainfall intensity was recorded, which is approximately 5.8% of the total number of hours. In accordance with the climatic characteristics of the area, low intensity rainfall accounted for most of the rainfall. Heavy rains were recorded in the summer months and were characterized by short downpour durations. In a specially developed methodology for categorizing rainfall intensity, both the intensity and the frequency of rain of a certain intensity were taken into account. Based on the research findings, three rainfall categories (RC) were defined: RC I = 0–1 mm/h, RC II = 1–5.9 mm/h, and RC III = > 5.9 mm/h. The third category of precipitation is characterized by a very small sample size [
2].
Since the analyzed freeway segment is a bridge, there is a possibility that, in the case of evaporation and low temperatures, ice may appear, but this phenomenon was not taken into account in this research. However, the presented climatic characteristics of the research area also indicate a very low probability of this phenomenon.
3.1.2. Examinations of the Impact of Rain on the Traffic Flow Parameters
We collected data on the characteristics of vehicle passages under the defined categories of rainfall intensity on the observed segment.
Based on these characteristics, traffic flow conditions could be identified through the main parameters and their interdependencies are described in the basic diagram of traffic flow theory. Traffic flow rate and speed are parameters that can be easily investigated empirically, while traffic flow density is a parameter that is difficult to determine in real conditions.
The examination of the correlation between the changes in traffic conditions and the impact of defined categories of rainfall intensity was carried out using data from an automatic traffic counter (ATC) and a meteorological station. The laser ATC was positioned on the part of the segment where inflow and outflow maneuvers on ramps do not affect traffic flow conditions. Data on traffic flow parameters were obtained at one-minute intervals for each traffic lane in both directions.
A road weather information system (RWIS), located in the immediate vicinity of the ATC, was used to record the data for rainfall intensities during the research. RWIS data consist of the following: dewpoint, precipitation type, precipitation intensity, wind speed, wind direction, air temperature, relative humidity, and air pressure. Data from the RWIS station were collected at ten-minute intervals. The analysis included days with precipitation, i.e., rainy days, and days with ideal weather conditions.
The technical and operational characteristics of the analyzed freeway segment are practically ideal: there is no critical longitudinal gradient (% LG = 0.9%), the radius of the horizontal curve is 1500 m, there are three traffic lanes in each direction, and the width of a traffic lane is 3.5 m. The mentioned technical and operational characteristics additionally contributed to the isolated observation of rainfall impact on traffic flow conditions.
Since the data from the counter were collected at one-minute intervals and the data on rainfall intensity at ten-minute intervals, it was necessary to reduce them to the same time interval, which, in this case, was 10 min. Later, the values were expanded to the hourly level in order to assess the impact on the capacity expressed in veh/h via the peak hour factor (PHF). The PHF was calculated based on the values of the maximum ten-minute traffic flow rate and the total hourly flow rate (PHF = 0.99).
After the data collection, an integrated database with analyzed traffic flow parameters for each traffic lane and rainfall intensity was created. Due to the identical technical and operational characteristics in each direction on the Gazelle Bridge, the analysis combined data on appropriate traffic lanes in both directions (
Figure 2).
In order to minimize the impact of temporal traffic volume variations on the analyzed segment, the research was conducted on working days, Tuesdays, Wednesdays, and Thursdays, in the period from January 2020 to May 2021. April and May 2020 were excluded from the analysis due to the strict epidemiological measures that were introduced because of the COVID-19 pandemic and the ban on travel from 5 p.m. to 8 a.m.
The research included several basic steps:
Identification of rainy days;
Determination of rainfall intensity categories in certain periods;
Observation of traffic flow characteristics in those periods and in similar periods without rainfall.
During the research, the characteristics of speed and traffic flow were recorded for a total of 1,910,217 vehicles, of which 884,602 vehicles were under the influence of rainfall and 1,025,615 vehicles were under ideal weather conditions.
4. Results
After processing the data obtained from the ATC and RWIS, the functional dependences of traffic flow rate q (veh/h/lane) and speed V (km/h) under the influence of different weather conditions on traffic lanes were defined by an analytical procedure. This functional dependence provides better insight into traffic conditions for road managers in order to adopt appropriate management measures [
28]. The speed determined from the ATC corresponds to the average time speed. Through additional research and analysis on a representative sample, a negligible deviation between the space mean speed and time mean speed was found; therefore, the authors used the time mean speed (hereafter speed).
With regard to our stated assumption, the functional dependence of speed-flow rate (V-q) by traffic lane was formed (see
Figure 3). In order to clearly represent the different impacts of weather conditions in
Figure 3, individual graphs are grouped based on the traffic lanes (lane 1, 2, and 3). For better perception of each individual graph, the data for dry (no rainfall) conditions are presented with the corresponding data for the individual rainfall category.
Figure 3 shows that the observed segment traffic flow conditions ranged from undersaturated flow through queue discharge flow to oversaturated flow [
1]. The maximum values of speed and traffic flow rate vary by traffic lane, which justifies the methodological approach to the analysis of the impact of rainfall on traffic lanes.
The speed shown in the graphs in free flow conditions are lower than expected on the freeway segment due to the speed limit of 80 km/h. This speed limit is a management measure, which aims to harmonize the traffic flow speed with the speed at capacity in order to maximize the throughput and achieve maximum efficiency. Lane 1 had approximately 20 km/h higher speed values than the other two traffic lanes for conditions without precipitation, while, at the same time, maximum flow rates were higher by 400 veh/h/lane. Traffic lanes have the same technical and operational characteristics, so the data obtained show that the level of utilization by lane is not the same. This is an important finding that road managers can use for defining appropriate management measures in order to optimize the usage of all lanes equally. In terms of the impact of rainfall on the traffic flow parameters, it can be observed that the V and q values are lower in all traffic flow conditions for all lanes. This reduction depends on the rainfall intensity, which is in accordance with the literature. It is interesting to note that for lane 2, in conditions of free flow traffic (up to 100 veh/h/lane), the sample is very small. This can be explained by the fact that, in free flow conditions, the largest percentage of drivers drive in the overpass lane (lane 1), while other drivers use lane 3 predominantly for short distance travel due to favorable traffic conditions. The graphs confirm the need for an analysis of rainfall impact at three different rainfall intensities, where the last category for rainfall of an intensity greater than 5.9 mm has a smaller, but representative, sample.
In order to quantify the impact of rainfall, the speed reduction (%∆V) was analyzed for different rain categories by traffic lane and on different working days. The obtained data were validated in order to exclude the differences that might be a consequence of other disturbances to the traffic flow. The authors decided to exclude the values for the difference in average speed for conditions with and without precipitation from the analysis (for category I greater than ±15 km/h, for category II greater than ±25 km/h, and for category III greater than ±35 km/h), which results in a difference in the size of the samples in different traffic lanes.
Table 1 shows the results of the impact of different classes of rainfall intensity on the speed and traffic flow.
Table 1 shows the number of vehicles (N), the difference in average speed in km/h (∆V), standard speed deviation (SD ∆V), percentage speed reduction (%∆V), and hourly flow deviation (∆q) by traffic lane for the adopted three rainfall categories.
The small deviation values of the flow rate (∆q) show that, when comparing the speed values with and without precipitation, approximately the same traffic flow conditions prevailed. This confirms the credibility of the results obtained from the speed analysis. The reduction in speed is only functionally dependent on the category of rainfall by weekday and by traffic lane.
The reduction in traffic flow speed by rain category and traffic lane is as follows:
Lane 1:
RC I, average speed reduction by 4.50%;
RC II, average speed reduction by 6.44%;
RC III, average speed reduction by 9.58%.
Lane 2:
RC I, average speed reduction by 4.89%;
RC II, average speed reduction by 8.37%;
RC III, average speed reduction by 11.58%.
Lane 3:
RC I, average speed reduction by 5.71%;
RC II, average speed reduction by 9.03%;
RC III, average speed reduction by 9.59%.
After the analysis by traffic lane, the results were synthesized by direction, depending on the category of rainfall in order to compare them with results in the literature.
Table 2 shows the decrease in the average speed by direction, depending on the category of rainfall.
The obtained values show that RC I reduces traffic flow speed by direction by 5.05%, RC II by 8.04%, and RC III by 10.24%. A significant deviation in the sample sizes proves the local climate characteristics of the observed site, which were described earlier in this paper (where it was mentioned that light rain (RC I) accounts for the largest share of rain). RC III is a rare occurrence, and thus the results obtained should be viewed with caution as further research needs to be conducted.
In order to better understand the behavior of drivers and speed reduction under different weather conditions, a detailed analysis of speed distribution was carried out.
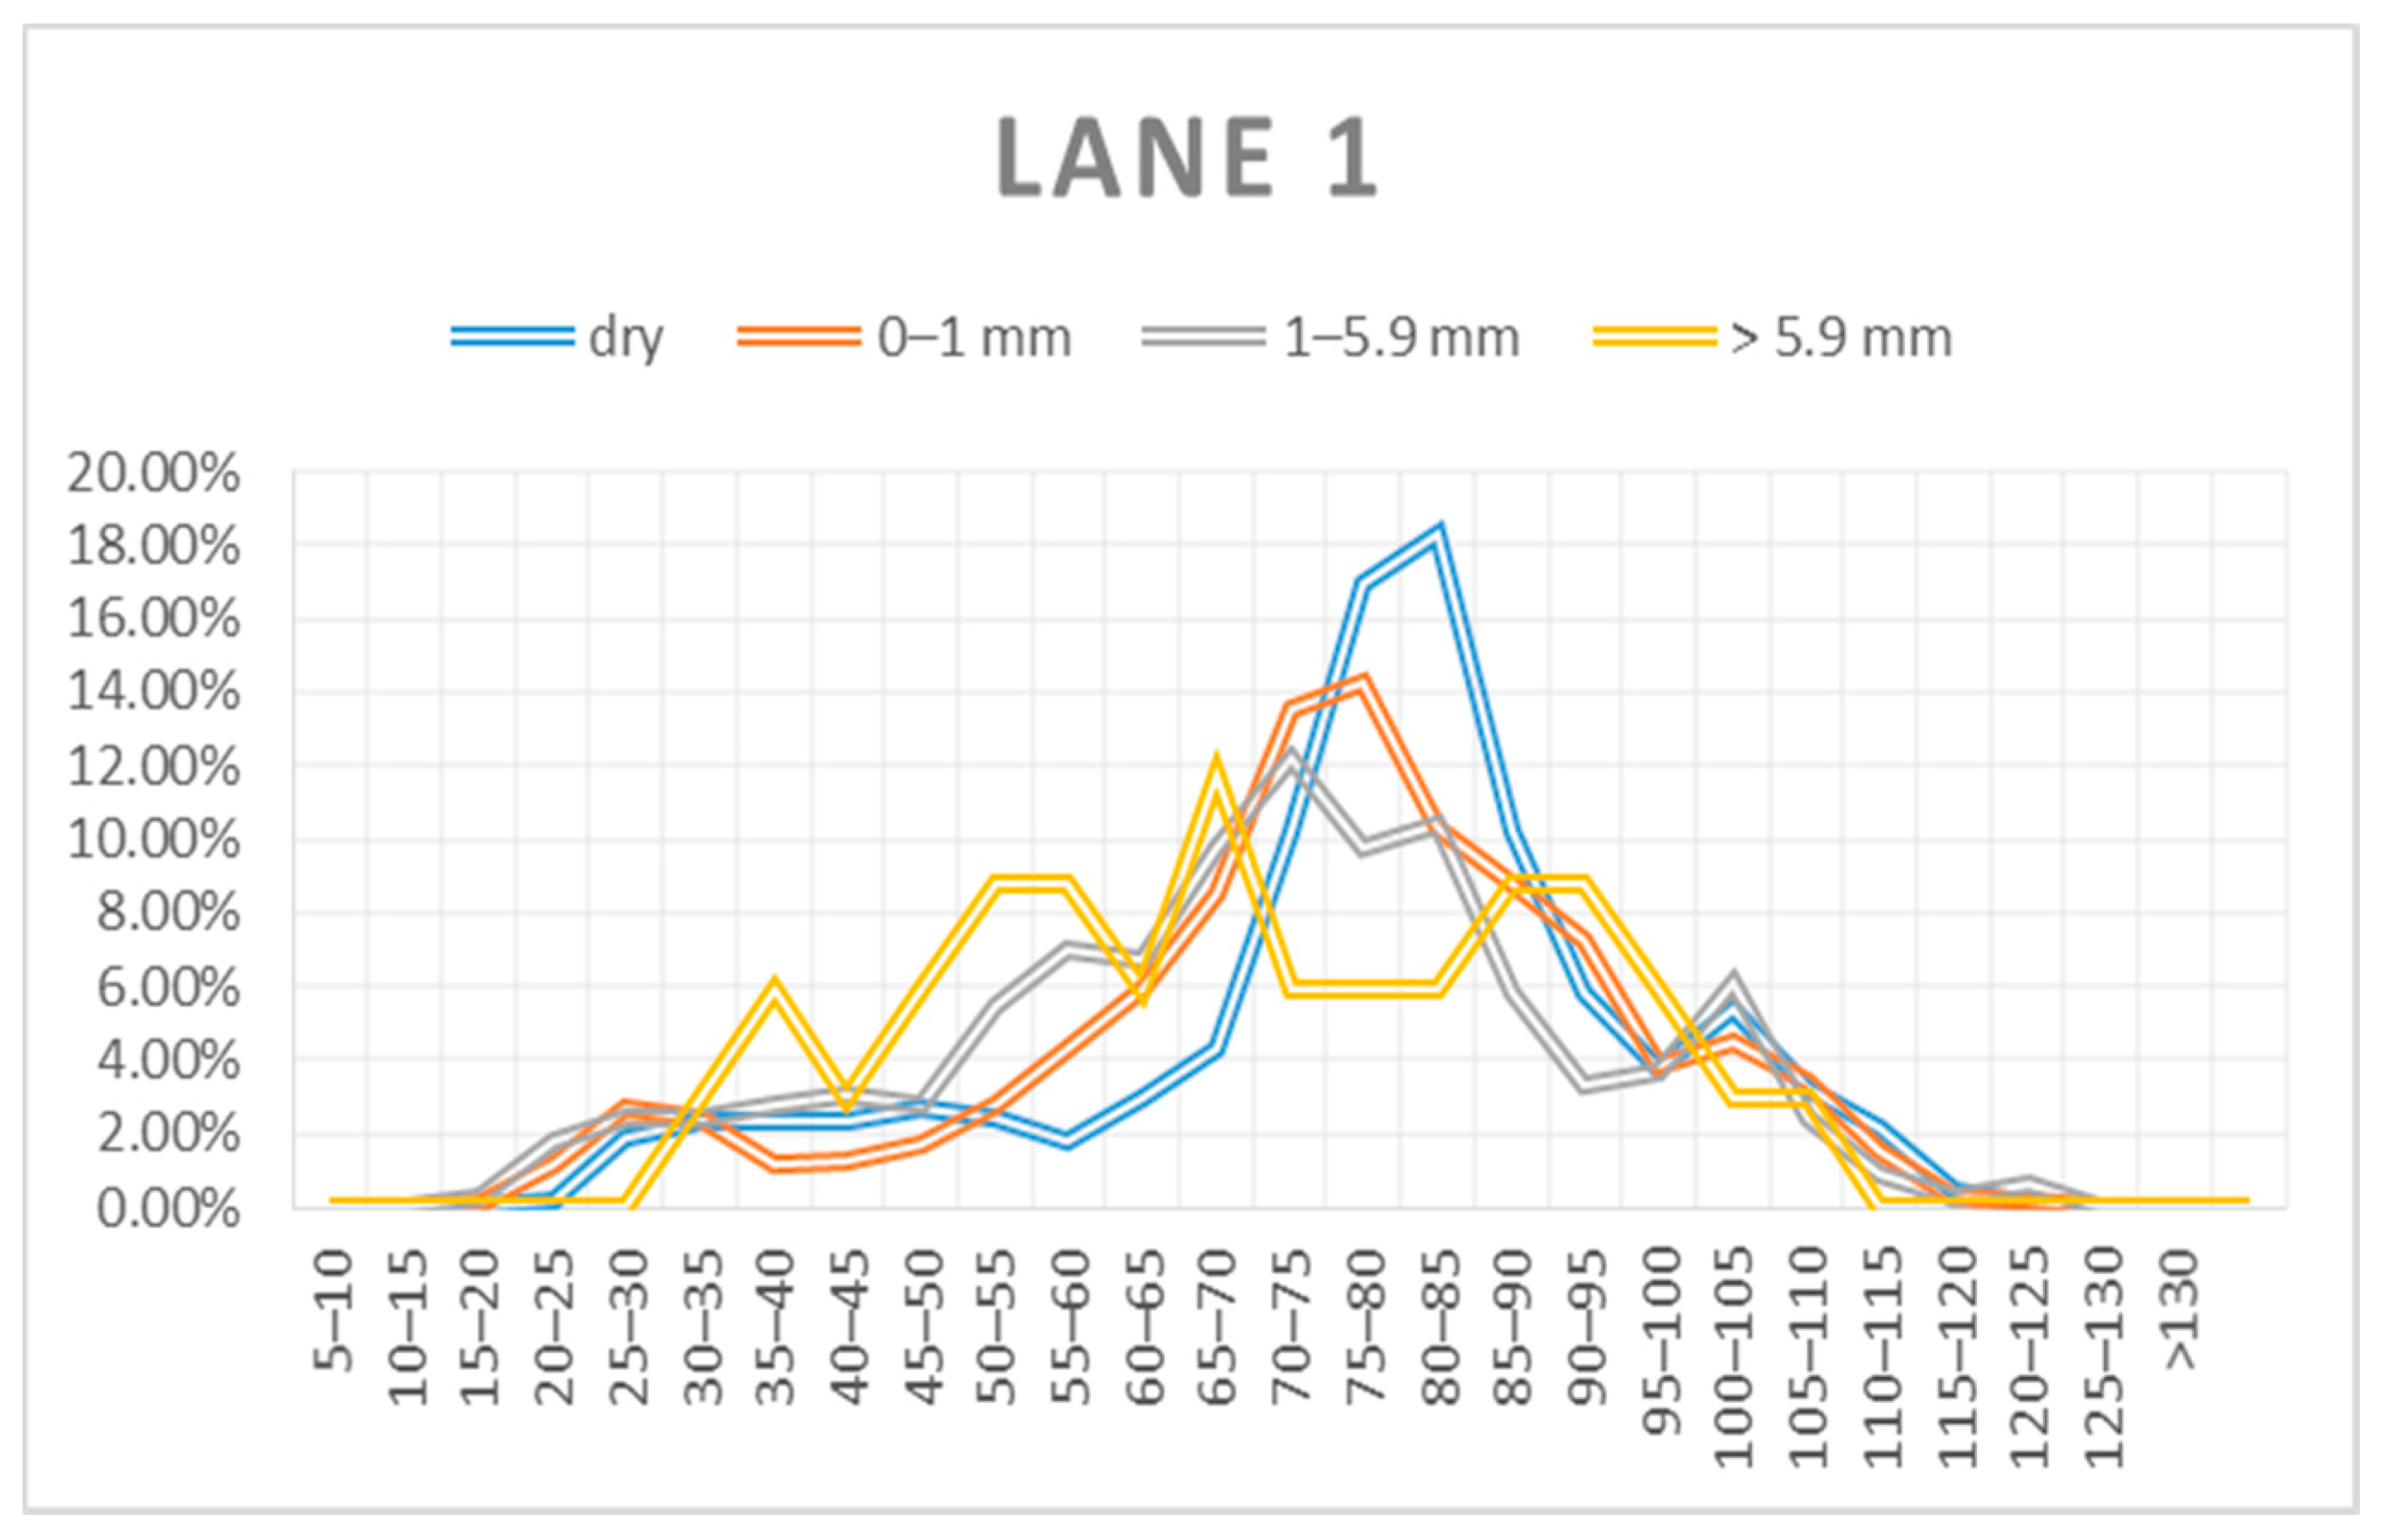
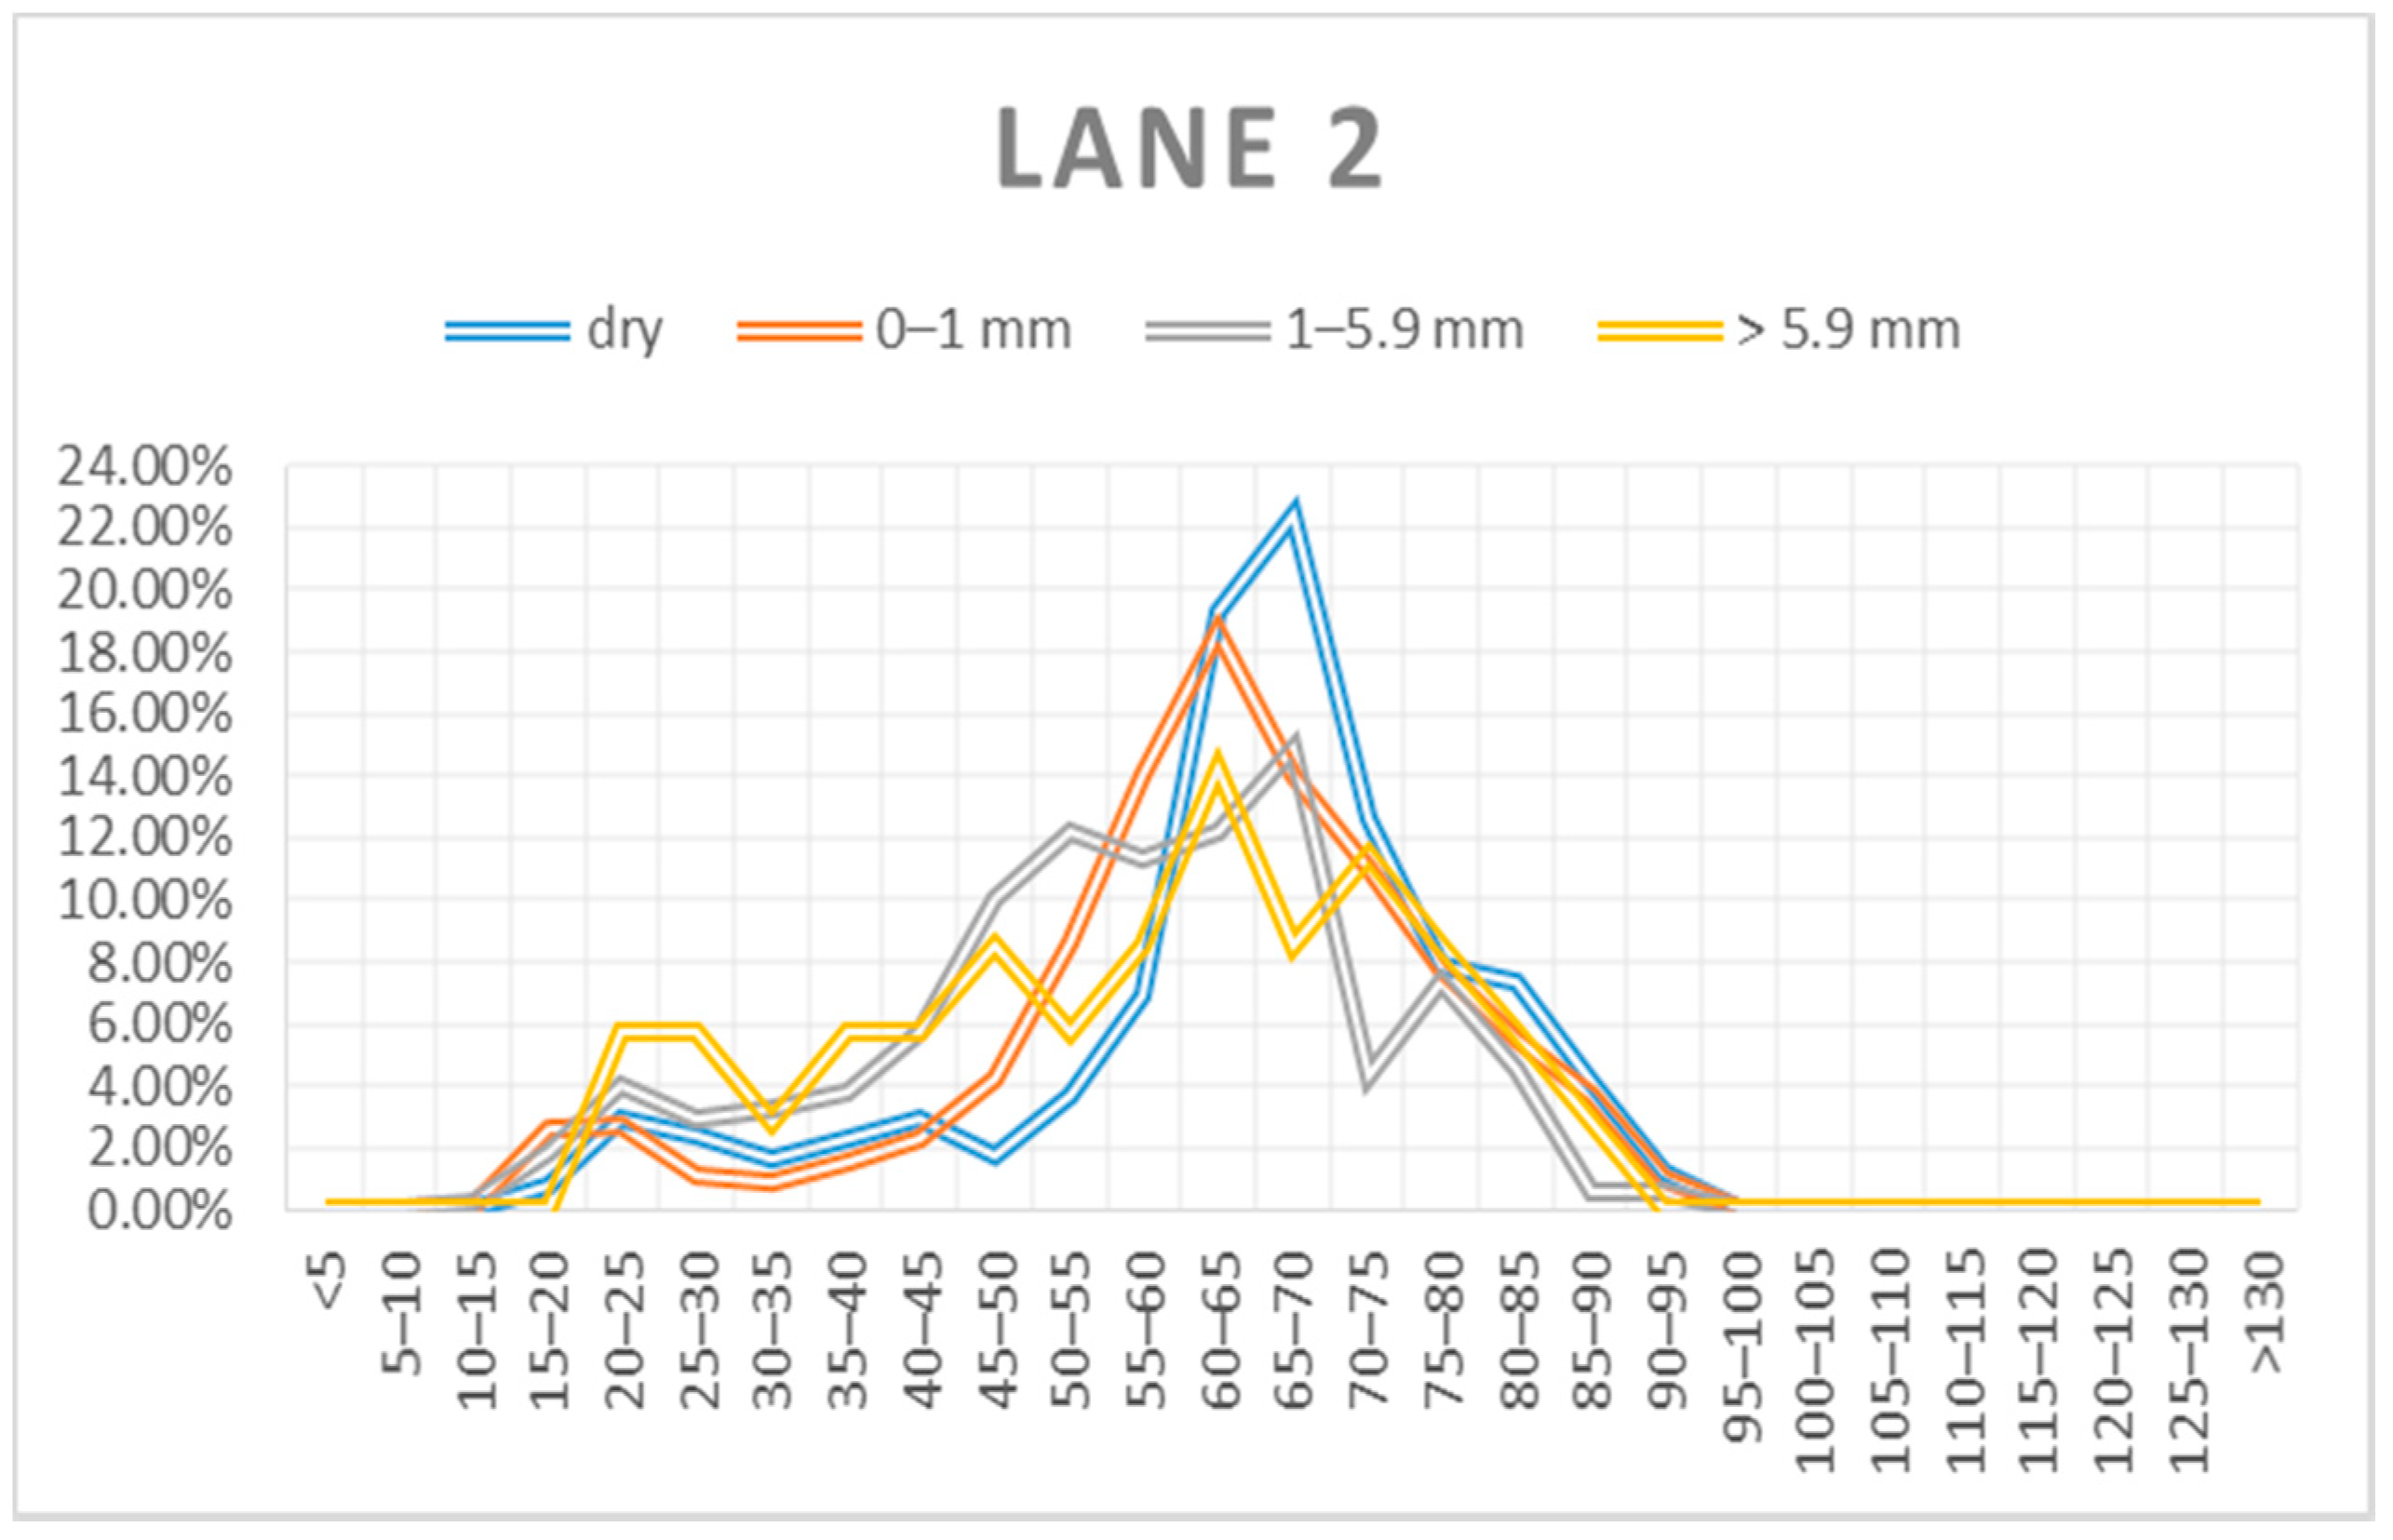
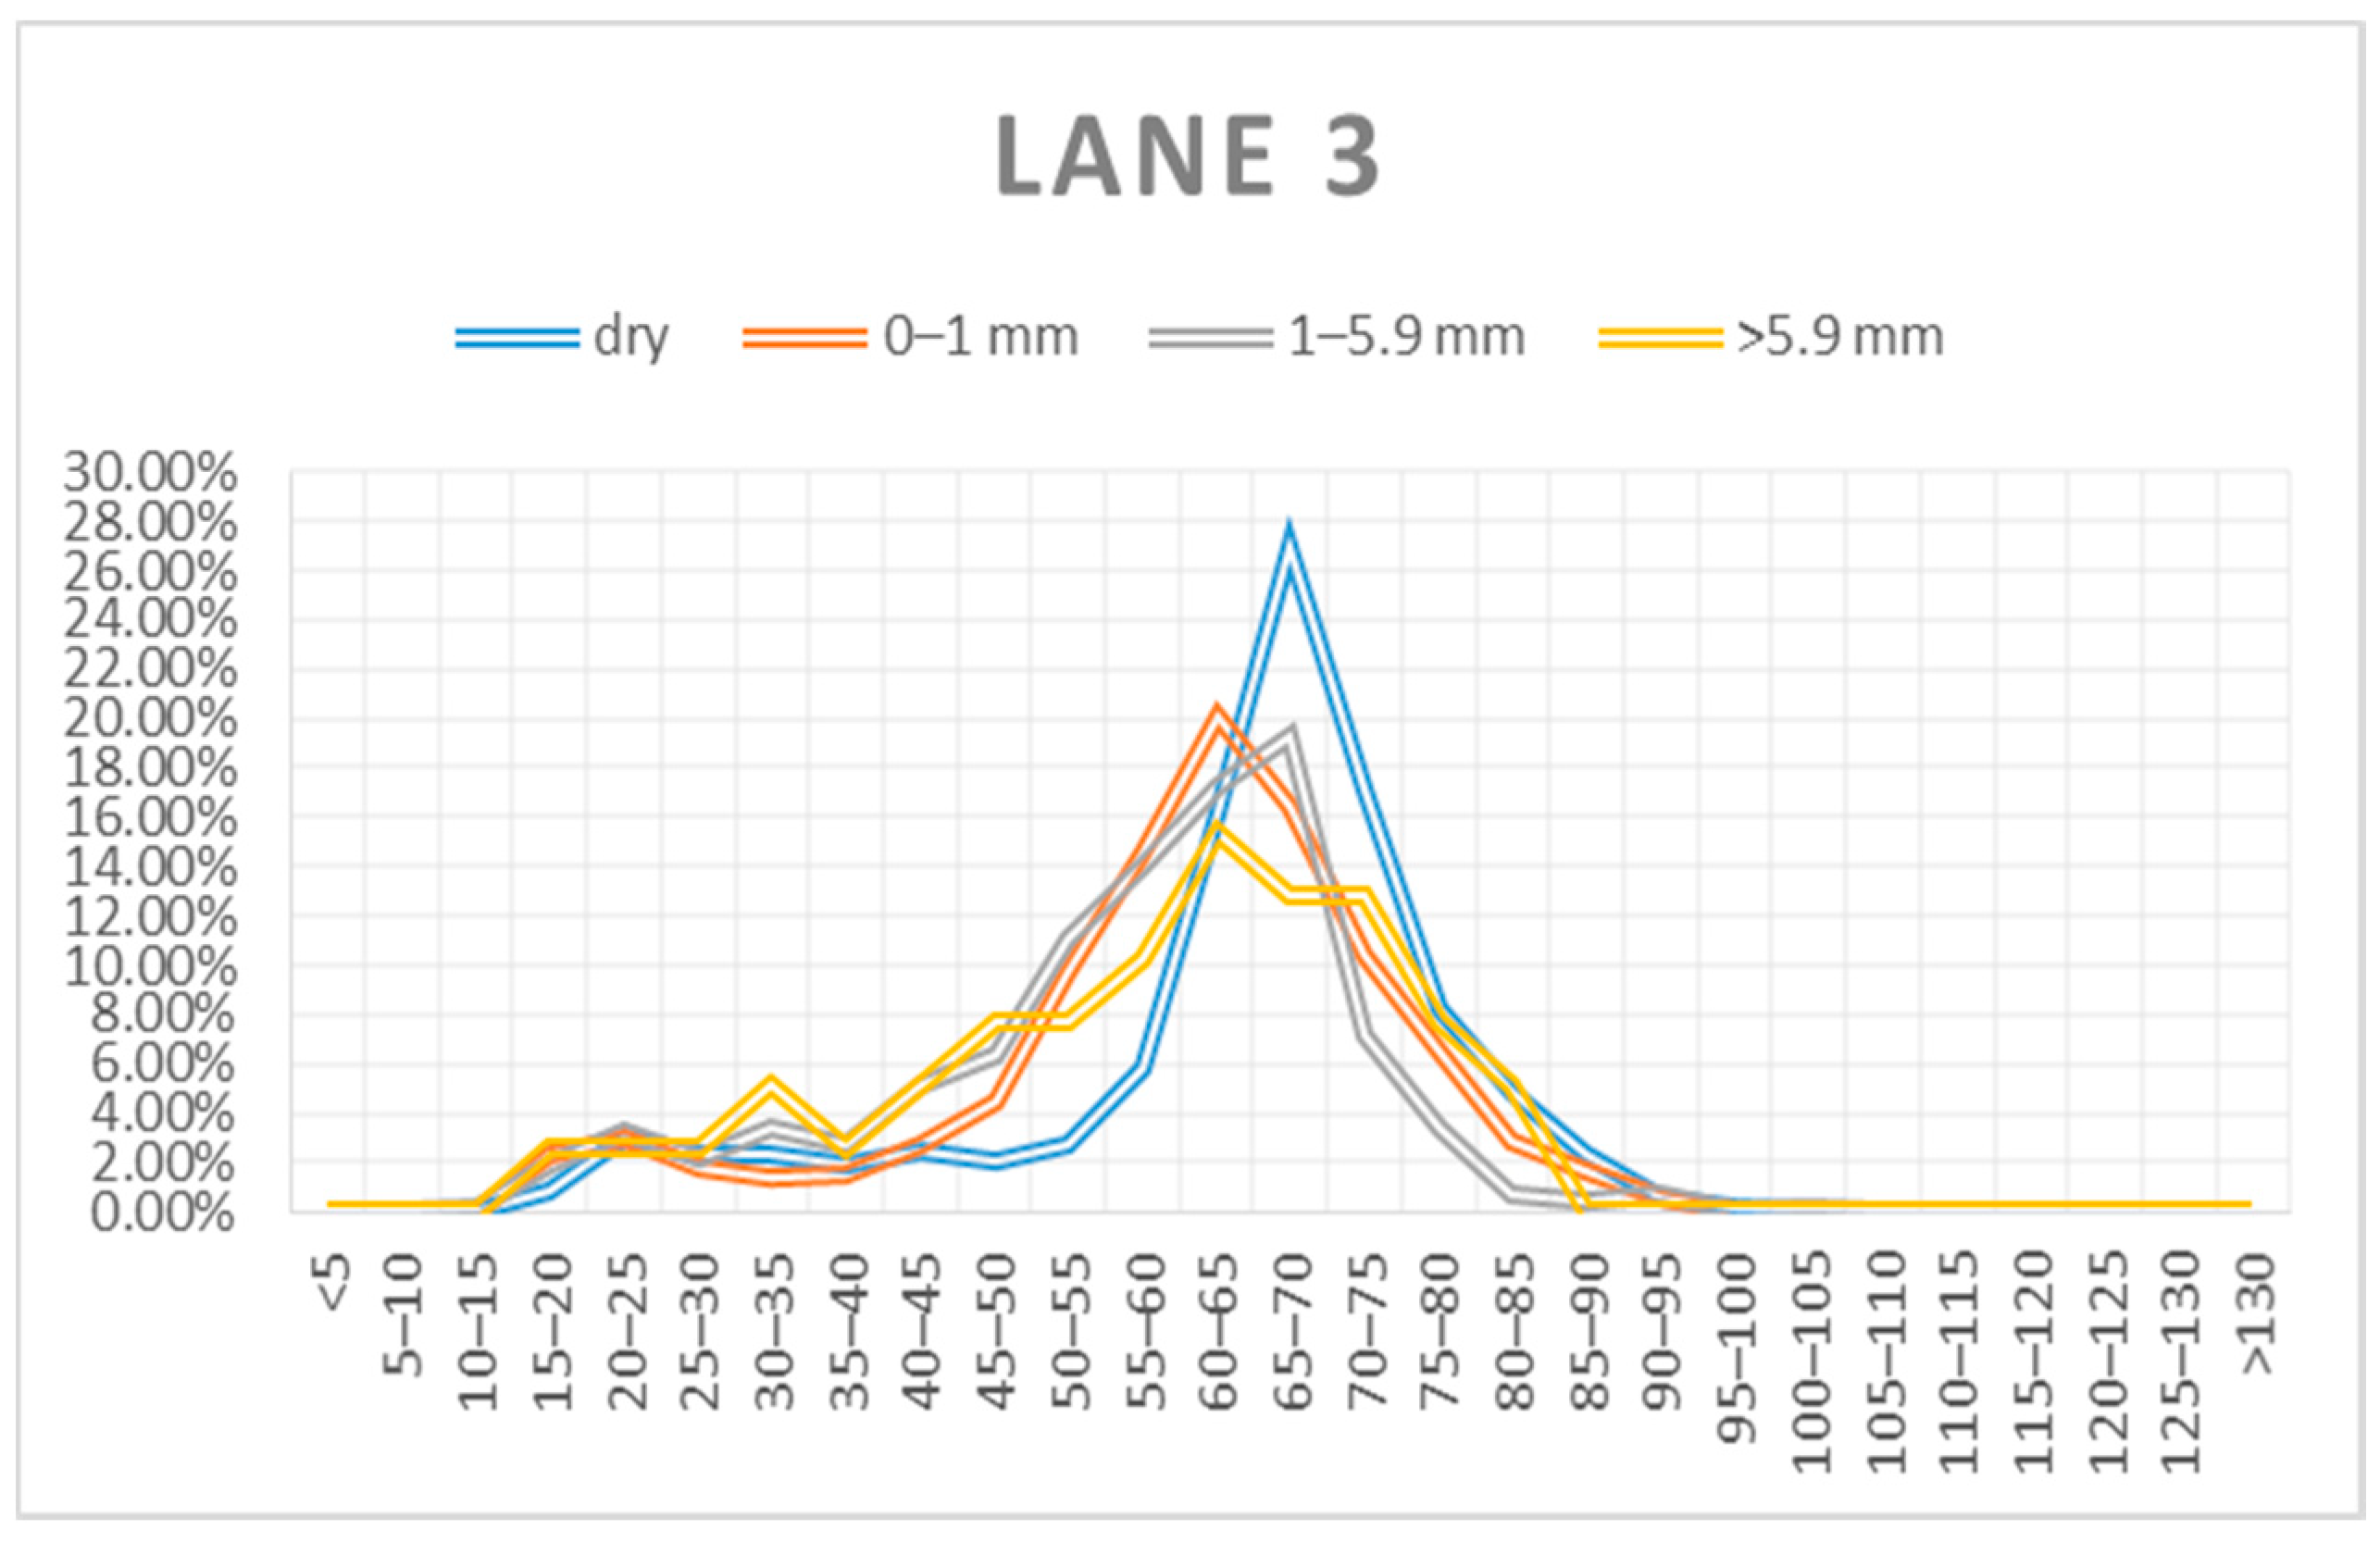
Figure 4,
Figure 5 and
Figure 6 show the distribution of speed at increments of 5 km/h.
From the figures, it can be observed that, with the occurrence of rainfall (all three categories), the dispersion of speeds decreases. There is a more balanced distribution of speeds over the observed rainfall categories than is the case without precipitation.
Figure 4 shows the speed distribution for lane 1. For conditions without precipitation, the most common speed class is 75–80 km/h (18.33%). A total of 31.16% of drivers travel faster than the speed limit. In the case of RC I, the most common speed class is 70–75 km/h (14.27%), while only 10.28% are in the 75–80 km/h speed class. A total of 29.84% of drivers drive above the speed limit in RC 1. For RC II, the most common speed class is 65–70 km/h (12.20%), with 10.37% being in the 75–80 km/h speed class. A total of 23.17% of drivers are above the speed limit in RC II. For RC III, the most common speed class is 60–65 km/h (11.76%), with 5.88% being in the 75–80 km/h speed class. A total of 29.41% of drivers are above the speed limit in RC III.
Figure 5 shows the speed distribution for lane 2. For the conditions without precipitation, the most common speed class is 65–70 km/h (22.37%). A total of 33.29% of drivers in this lane are over the speed limit in conditions without precipitation. In the case of RC I, the most common speed class is 60–65 km/h (18.66%), with 13.98% being in the 65–70 km/h speed class. A total of 20.24% of drivers are above the speed limit in RC 1. For RC II, the dominant speed class is the same as in the case without precipitation (65–70 km/h; 14.91%). A total of 5.69% of drivers are above the speed limit in RC II. For RC III, the most common speed class is 60–65 km/h (14.29%), with 8.57% of drivers being in the 65–70 km/h speed class. A total of 8.57% of drivers are above the speed limit in RC III.
Figure 6 shows the speed distribution for lane 3. For the conditions without precipitation, the most common speed class is 65–70 km/h (26.88%). A total of 7.96% of drivers are above the speed limit under conditions without precipitation. In the case of RC I, the most common speed class is 60–65 km/h (20.04%), with 16.49% being in the 60–65 km/h speed class. A total of 5.14% of drivers are above the speed limit in RC I. For RC II, the most common speed class is the same as in the case without precipitation (65–70 km/h; 19.26%). A total of 2.22% of drivers are above the speed limit in RC II. For RC III, the most common speed class is 60–65 km/h (15.38%), with 12.82% being in the 65–70 km/h speed class. A total of 5.13% of drivers are above the speed limit in RC III.
From the previously analyzed distribution of speeds by classes, it is clear that, with the occurrence of rainfall, there is an additional reduction in traffic flow speed below the speed at capacity (about 80 km/h according to HCM), thus reducing the capacity and leading to a higher probability of congestion.
The next step was to analyze the empirical capacity by traffic lane under different weather conditions. The authors identified hours in which traffic conditions correspond to the saturated traffic flow for every individual traffic lane. The main two criteria were: if the speed was in range from 50 km/h to 70 km/h and the volume was greater than 1600/1500/1400 veh/h/lane for Lane1/Lane2/Lane3, respectively. These two criteria were identified from
Figure 3 and correspond to the local conditions. Based on the formed database, the empirical capacity and confidence interval (CI) 95% were calculated for every traffic lane under different weather conditions. The results are shown in
Table 3.
According to HCM2016, the base capacity of the basic freeway segment for the lowest value of free-flow speed of 88 km/h (55 mph) is 2250 PA/h/lane [
1]. The calculated value of the deterministic capacity for the observed segment using HCM2016 methodology is ≈1600 veh/h/lane. From
Table 3, it can be observed that the value of the empirical capacity is higher than the deterministic value in all lanes under all weather conditions. The greatest difference between the empirical and deterministic capacity of 520 veh/h/lane is for lane 1 in a scenario without rainfall.
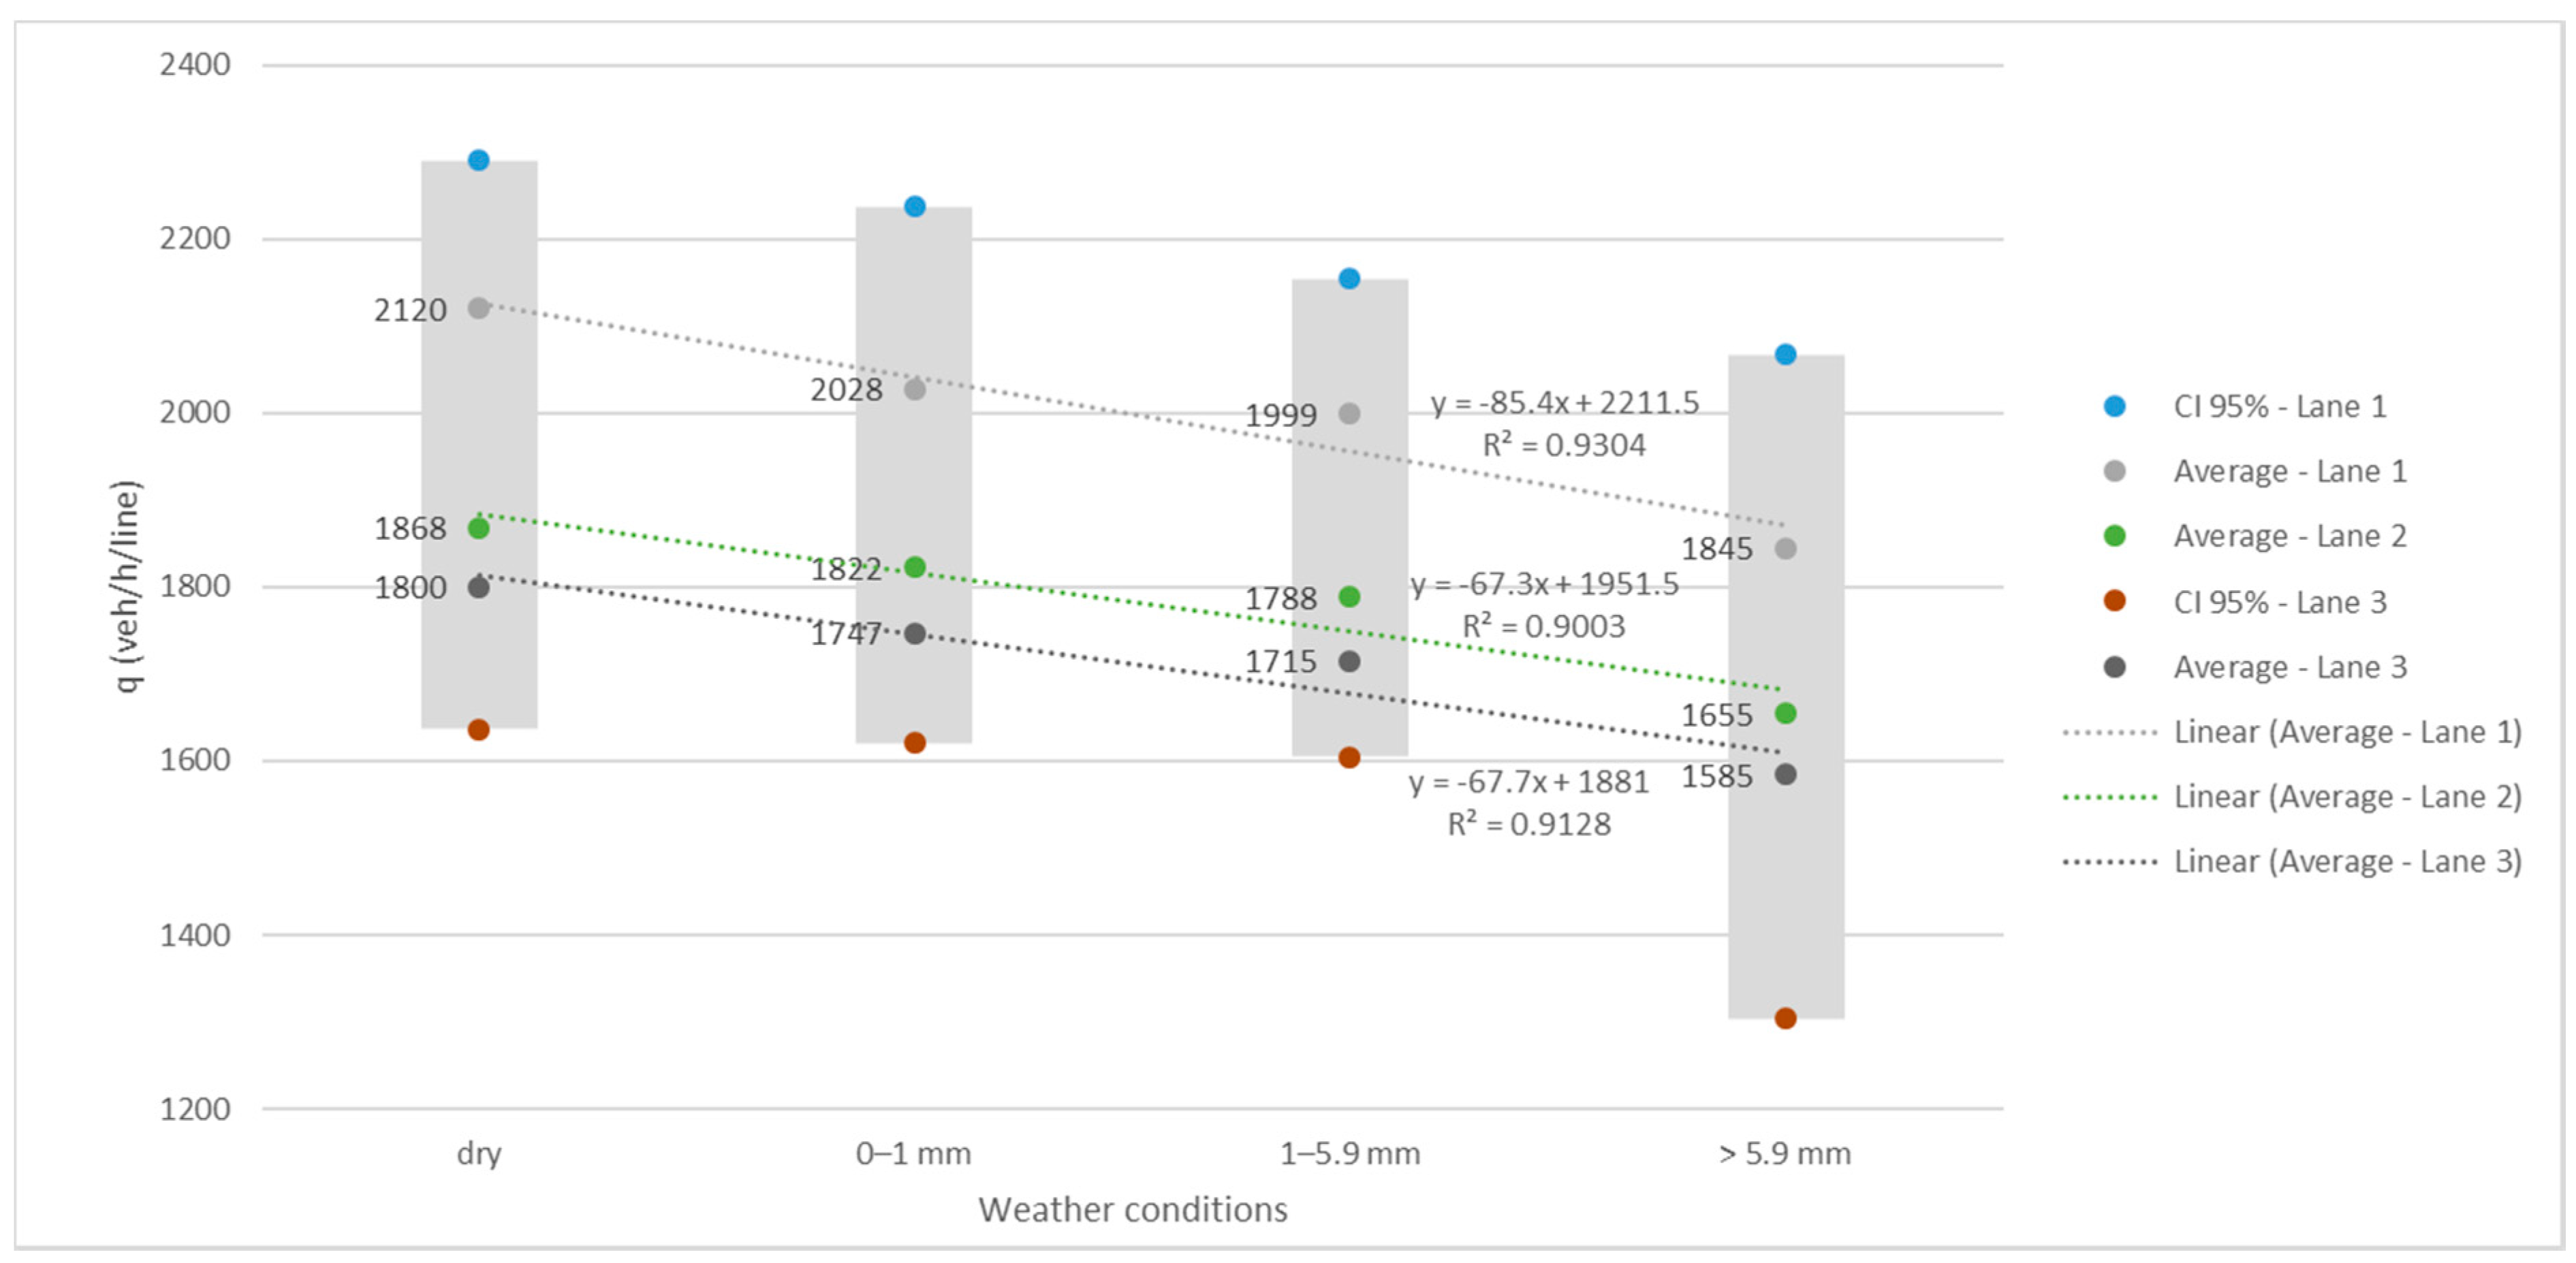
In order to describe the correlation between the lane capacity and rainfall intensity, a simple linear regression was used. Although the number of variables shown as average values of lane capacity is not enough for a complex regression model, it can be clearly shown that, with the increase in rainfall intensity, the lane capacity decreases (
Figure 7).
Table 4 shows the percentage reduction in empirical capacity by traffic lane by rainfall category.
The results presented in
Table 3 and
Table 4 prove the dependence of traffic lane capacity and rainfall intensity. The capacity of lane 1, in comparison to the capacity of the other two lanes, is the most sensitive to precipitation, regardless of the rainfall category. For the RC I precipitation class, the greatest decrease in capacity is for lane 1 (4.34%), while for lanes 2 and 3, the reductions are 2.46% and 2.94%, respectively. For RC II, greater reductions in capacity are detected. Lane 1 has a capacity reduction of 5.71%, lane 2 has a capacity reduction of 4.28%, and lane 3 has a capacity reduction of 4.72%. As expected for RC III, the category with the highest rainfall intensity, the capacity reductions are the greatest (over 11%). Lane 1 has a capacity reduction of 12.97%, which represents the maximum decrease in capacity. Lanes 2 and 3 also have significant reductions in capacity, 11.40% and 11.94%, respectively.
The general conclusion is that, with an increase in rainfall intensity, the capacity reduction increases in every traffic lane. The obtained results are in accordance with the results in the literature, with minor differences being caused by local conditions.
5. Discussion
The results of this research confirm the impact of rainfall on traffic conditions, i.e., a reduction in speed and capacity.
Studies in the literature examine the expected reduction in speed by direction, with the results ranging from 4% to 53.3%. The differences in the obtained values mostly depend on the survey site and the rainfall intensity. The findings of this research for three rainfall intensity categories show that a decrease in the speed by direction of 5.05%, 8.04%, and 10.24%, respectively, can be expected for RC I, RC II, and RC III.
The main aim of this paper was to observe the impact of rainfall on the traffic levels in different lanes. In this regard, it was noticed that for RC I in lanes 1 and 2, the percentage reduction in speed (4.50% and 4.89%) is less than the average value by direction (5.05%). For RC II, the decrease in speed is the lowest in lane 1 (6.44%), i.e., 1.6% less than the average value by direction. For RC III, lane 2 is the most sensitive, with a reduction of 11.58%, while the reductions in lanes 1 and 3 are almost identical (9.58% and 9.59%).
According to the literature, rain reduces the directional capacity by 6–17.9%. The authors found that the reduction in capacity is influenced by rainfall intensity, but also that this value depends on freeway traffic lanes. Lane 1 for all RCs has the largest percentage reduction in capacity (RC I—4.34%, RC II—5.71%, and RC III—12.97%).
Through this research, it has been shown that it is important to analyze rainfall impacts on the traffic lane level. To some extent, different rainfall impacts on freeway traffic lanes are expected, due to the different driving characteristics of their users. Most aggressive drivers who are familiar with the segment are expected to use lane 1, and they expect to move at speeds close to or exceeding the speed limit. Lane 2 is characterized by the mixing of flows from the other two traffic lanes, as well as drivers who are not so familiar with the analyzed freeway segment, so it is not surprising that the lane has the greatest reduction in speed for RC III. Lane 3 is most frequently used by drivers who use this segment as a part of origin–destination trips inside Belgrade city. Drivers in lane 3 make a decision not to change the traffic lane and drive at a lower speed due to conditions in the traffic flow—in peak periods, it is close to saturation. As a result of the mentioned differences, among other factors, the greatest reduction in speed in lane 3 was observed under the impact of RCIII and the greatest reduction in capacity in lane 1 was observed under the impact of RC III. The obtained values of capacity reduction show that, for every rainfall category, lane 1 has the greatest sensitivity. Additionally, reserves were identified in the capacities of lanes 2 and 3. These results indicate that we should consider the application of traffic management measures on the traffic lane level in order to mitigate the negative effects of rainfall. The identified specifications of traffic flow speed and lane capacity can be included in future traffic models to create scenarios that take climate change into account.
6. Conclusions
The aim of transport system management is to establish a balance between transport supply and demand within the appropriate framework of the required LOS. Given the process of urbanization and the trends that accompany it, cities have a limited number of options to provide additional capacity. Engineers are in a constant search for measures that could maximize the capacity of road networks. In this sense, any additional impacts that may reduce available capacities should be taken into account. This paper presents the importance of analyzing the impact of rainfall on the traffic flow parameters of traffic lanes using the example of a specific city segment.
It has been shown that, in the case of multilane roads, it is recommended to analyze the impacts at the traffic lane level and not only per direction. If it is found that the impact is different for each traffic lane, as shown in this paper, in the case of rainfall, additional possibilities can be provided for defining traffic management measures to mitigate this situation. Additionally, this survey confirms the fact that the rainfall impacts on the capacity and speed reductions are not negligible and that they should certainly be included in standard capacity analysis procedures, as well as in the LOS and in traffic management and planning.
The directions for further research are related to expanding the spatial scope of the research, as well as the inclusion of different weather types, such as snow, ice, and wind. In addition to quantification, the methods of implementing the obtained results in traffic management procedures should be considered. Additionally, aside from the impacts of weather conditions on the traffic flow parameters, it would be interesting to examine the correlation between these data and traffic accident data.


