1. Introduction
Livelihood refers to a systematic procedure of making a living on the basis of skills, resources, and feasible activities. With a view to resolving the problem of the sustainability of farmers’ livelihoods, the livelihood safety and quality of farmers in poor areas is considered a primary issue, as well as a key research hotspot for experts and scholars [
1]. As China is a developing country, and according to the consideration of a common poverty phenomenon in rural areas, the government has industrialized medium- and long-term poverty alleviation projects and has articulated a series of poverty alleviation policies, which have accomplished remarkable results in reducing the population living in poverty [
2]. Although China’s poverty alleviation work has accomplished great achievements, in order to fundamentally help rural areas out of poverty and comprehensively promote rural revitalization [
3], the government needs to not only offer policy support from all aspects, but also to fundamentally improve the livelihood ability of farmers themselves, enrich their livelihood strategies, and help them retain a sustainable way of living [
4].
The term “three rural” refers to agriculture, rural areas, and farmers, and the so-called “three rural issues” refers to problems within each of these areas [
5]. China is a large agricultural country, meaning agriculture is the primary industry. The countryside is a place where workers engaged in agricultural production live together, and most farmers are people who have engaged in agricultural production for a long time. The “three rural issues” are also an important concern related to China’s development. The purpose of studying the three rural issues is to increase farmers’ income, agricultural development, and rural stability [
6]. Along with complete success in the fight against poverty [
7], the main focus of “three rural” work is primarily the implementation of rural revitalization tactics to promote the long-term development of rural areas [
8]. Farmers’ desire for a better life is the driving force toward promoting this rural revival. Protecting the ultimate interests of farmers and endorsing their common prosperity are the starting point and footholds of promoting rural revitalization. Living a rich lifestyle means doing everything possible to raise farmers’ income, expand the level of sustainable livelihoods in rural areas, and empower hundreds of millions of farmers to embark on the path of common prosperity [
9]. Hence, improving the livelihood quality of farmers is not only a crucial reason for combining and increasing the attainment of poverty alleviation, but also a crucial link to understanding rural revitalization in the future. The sustainable livelihood status of farmers is critical for improving the operational effectiveness of rural revitalization. Thus, the inclusive results of this research study are beneficial for improving the level of farmers’ sustainable living and the growth of farmers’ livelihood capital. They have significant practical implications for solving the “three rural” problems, thereby supporting rural revitalization and promoting urban alongside rural development.
Compared to the central and eastern regions, the economic development of Western China is relatively slow [
10]. This raises a question regarding how to improve the sustainability of farmers’ livelihoods in the western region and accelerate their freedom from poverty by becoming rich, which has become the main scientific problem to be solved in the sustainable development of the western regions [
11].
2. Literature Review
At present, the existing literature lacks studies on the relationship between farmers’ livelihood capital and their livelihood strategies. Investigating how farmers can achieve sustainable development, specifically starting from the livelihood capital owned by farmers and investigating which livelihood tactics should be adopted, is considered a well-intentioned issue of consideration. What is the current situation of the livelihood capital owned by farmers in Western China? What is the current livelihood strategy? How does livelihood capital affect the different types of livelihood strategies? What are the key factors to promote the transformation of livelihood strategies? Based on these parameters, this research paper’s aims were to explore the influencing factors of livelihood capital on the choice and transformation of livelihood strategies, therefore helping to consolidate the achievements of poverty reduction, enrich the poverty reduction practices, and realize the sustainable development of farmers.
Based on the evaluation of livelihood capital, the choice of livelihood strategy, and the impact of livelihood capital on livelihood strategies, this paper reviewed the relevant literature.
The research on farmers’ livelihood capital primarily emphasizes the following aspects: (1) The construction of a livelihood capital evaluation index system. Research on a livelihood capital evaluation index system is quite well-established. Most scholars principally depend on the sustainable livelihood framework theory established by the UK Department for International Development (DFID) to create a livelihood capital evaluation index system [
12,
13,
14]. (2) The measurement of livelihood capital. The existing literature includes a lot of research on the index quantification and capital measurement of farmers’ livelihood capital. Liu et al. methodically evaluated the procedures for measuring farmers’ livelihood capital, and they compared subjective weighting and principal component weighting [
15]. Erenstein et al. used principal component analysis to evaluate the livelihood capital of poor farmers in India [
16]. Fang et al. used the AHP method to calculate and analyze the current situation of farmers’ livelihood capital [
17]. (3) The empirical study of livelihood capital. Oladele and Ward used the SLA framework to select the corresponding indicator elements of livelihood capital, and by constructing a logistic regression model of livelihood capital and farmers’ life satisfaction, it was concluded that capital stocks in different regions are different [
18]. Johnson empirically analyzed the main and moderating effects of risk expectations and livelihood capital on farmers’ homestead withdrawal intentions and their intergenerational differences [
19]. The research showed that livelihood capital has a positive impact on farmers’ willingness to withdraw from homesteads and plays a moderating role in the relationship between risk expectations and willingness to withdraw from homesteads.
The total amount of farmers’ livelihood capital directly or indirectly regulates their choice of livelihood strategy [
20]. Livelihood strategies are the activities carried out by people to achieve their established livelihood objectives. Production choices and production activities belong to the category of livelihood strategies [
21]. Research on livelihood strategies is also relatively mature. Presently, there are many studies on the classification forms and influencing factors of livelihood strategies [
13,
22,
23]. These research studies are, correspondingly, one of the significant bases to comprehend the sustainable livelihood of farmers. There are various types of livelihood strategies, and there is no unified division standard at present. Some scholars have separated the types of strategies according to their local lifestyles, such as livestock breeding, agricultural planting, going out to work, and doing business [
24]. According to the proportion of agricultural income within the total household income, some scholars have divided livelihood strategies into pure agriculture, part-time agriculture, and non-agriculture types [
25]. Referring to the classification methods of the National Bureau of Statistics and the Chinese Academy of Social Sciences, this paper divided the livelihood strategies of farmers into three types: pure agriculture, part-time agriculture, and non-agriculture, according to the source of economic income. In addition, there is plenty of research on the influencing factors of sustainable livelihood strategies. For example, Alemayehu et al. separately studied the impact of local and non-local work on the choice of livelihood strategy and believed that different forms of work result in farmers choosing different types of livelihood strategies [
26]. Scholars such as Manlosa et al. initially used the accumulation cataloguing methodology to classify livelihood strategies into three types, namely farming and breeding, business and industry, and an assorted category [
27]. This method focuses on the impact of land transfer on these three livelihood strategies, lastly drawing valuable conclusions and making appropriate recommendations.
There are also abundant studies on the impact of livelihood capital on livelihood strategies. Ding et al. believed that livelihood capital has a substantial impact on livelihood strategies and pointed out that through the development of livelihood capital, the variation in livelihood strategies can be improved, so as to expand the sustainable livelihood ability [
28]. Meng et al. took the farmers and herdsmen in Ordos, China, as the research object and analyzed the impact of their livelihood capital on their livelihood strategies [
29]. It was found that natural capital such as pasture area and livestock quantity have a significant impact on the choice of livelihood strategies. Zinda and Zhang used a logistic regression model to analyze the relationship between farmers’ livelihood capital and livelihood strategies based on a sustainable livelihood analysis framework [
30]. The research showed that those farmers with a high human capital index tend to work in other places, and farmers with high physical capital and social capital indexes tend to work locally.
In summary, researchers have achieved rich results on livelihood capital and livelihood strategies, providing useful reference for this article. However, according to the literature review, most scholars have focused primarily on a province, a city, or even a county as the research area, rarely focusing on poor farmers as the research object, and there are very few studies on the poor areas in Southwest China. This paper took farmers in poor areas of Southwest China as the research object. Southwest China is one of the regions with the largest number of poor people and the highest incidence of poverty in China, and it is also the main target area in the period of decisive victory in poverty alleviation [
31]. Therefore, taking the poor areas in Southwest China as the sample area is very representative and typical. In addition, the literature on the relationship between livelihood capital and livelihood strategies lacks in-depth empirical research. Although some scholars have conducted research on the impact of livelihood capital on livelihood strategies, this research is not comprehensive and thorough. Such research has only analyzed the impact of livelihood capital on the choice of livelihood strategies, without further analyzing the key influencing factors of the transformation of farmers’ livelihood strategies [
32]. Thus, this paper intends to make up for this deficiency.
Based on this, this paper used the survey data of 508 households in the case area. First, the entropy method was used to measure and evaluate the livelihood capital level of farmers. Second, the logistic regression model was used to empirically analyze the impact of livelihood capital on the selection and transformation of livelihood strategies, so as to truly reflect the relationship between them in terms of farmers in poor areas. Moreover, we put forward countermeasures and suggestions according to the research conclusions, which have important reference significance for the formulation of poverty alleviation policies and the implementation of rural revitalization strategies in the future.
3. Materials and Methods
This section principally presents the theoretical basis, index system construction, study area, data sources, and research methods for this research article.
3.1. Sustainable Livelihood Theory
The formation of sustainable livelihood theory has a long history. The earliest is the reflection on the national development model in the 1950s and 1960s, including the small-scale peasant production model and the Stalinist socialist model. These models ignore or belittle the interests and needs of farmers and the potential role of improving their livelihoods. After the 1970s, academic circles began reflecting on the above model, arguing that farmers potentially have the ability to maintain their own livelihood, and that there is need for external promotion from the government to invest in farmers; mobilize their enthusiasm; promote them to give full play to the spirit of diligence, responsibility, and wisdom; and finally achieve the purpose of improving agricultural development and their own living standards. Most scholars understand the concept of “sustainable livelihood” from the perspective of “livelihood” and understand livelihood as a way of making a living. This way of making a living is based on the ability, assets, and activities of individuals or families, and indicates that the way of living should be sustainable. Only by withstanding external risks and pressures and recovering can livelihoods be sustainable [
33]. After the 1980s, the United Nations “World Conference on Environment and Development” first clarified the concept of sustainable livelihoods, defined as a collection of relevant assets, abilities, and income-generating activities owned and acquired by individuals or families in order to maintain their own development [
34].
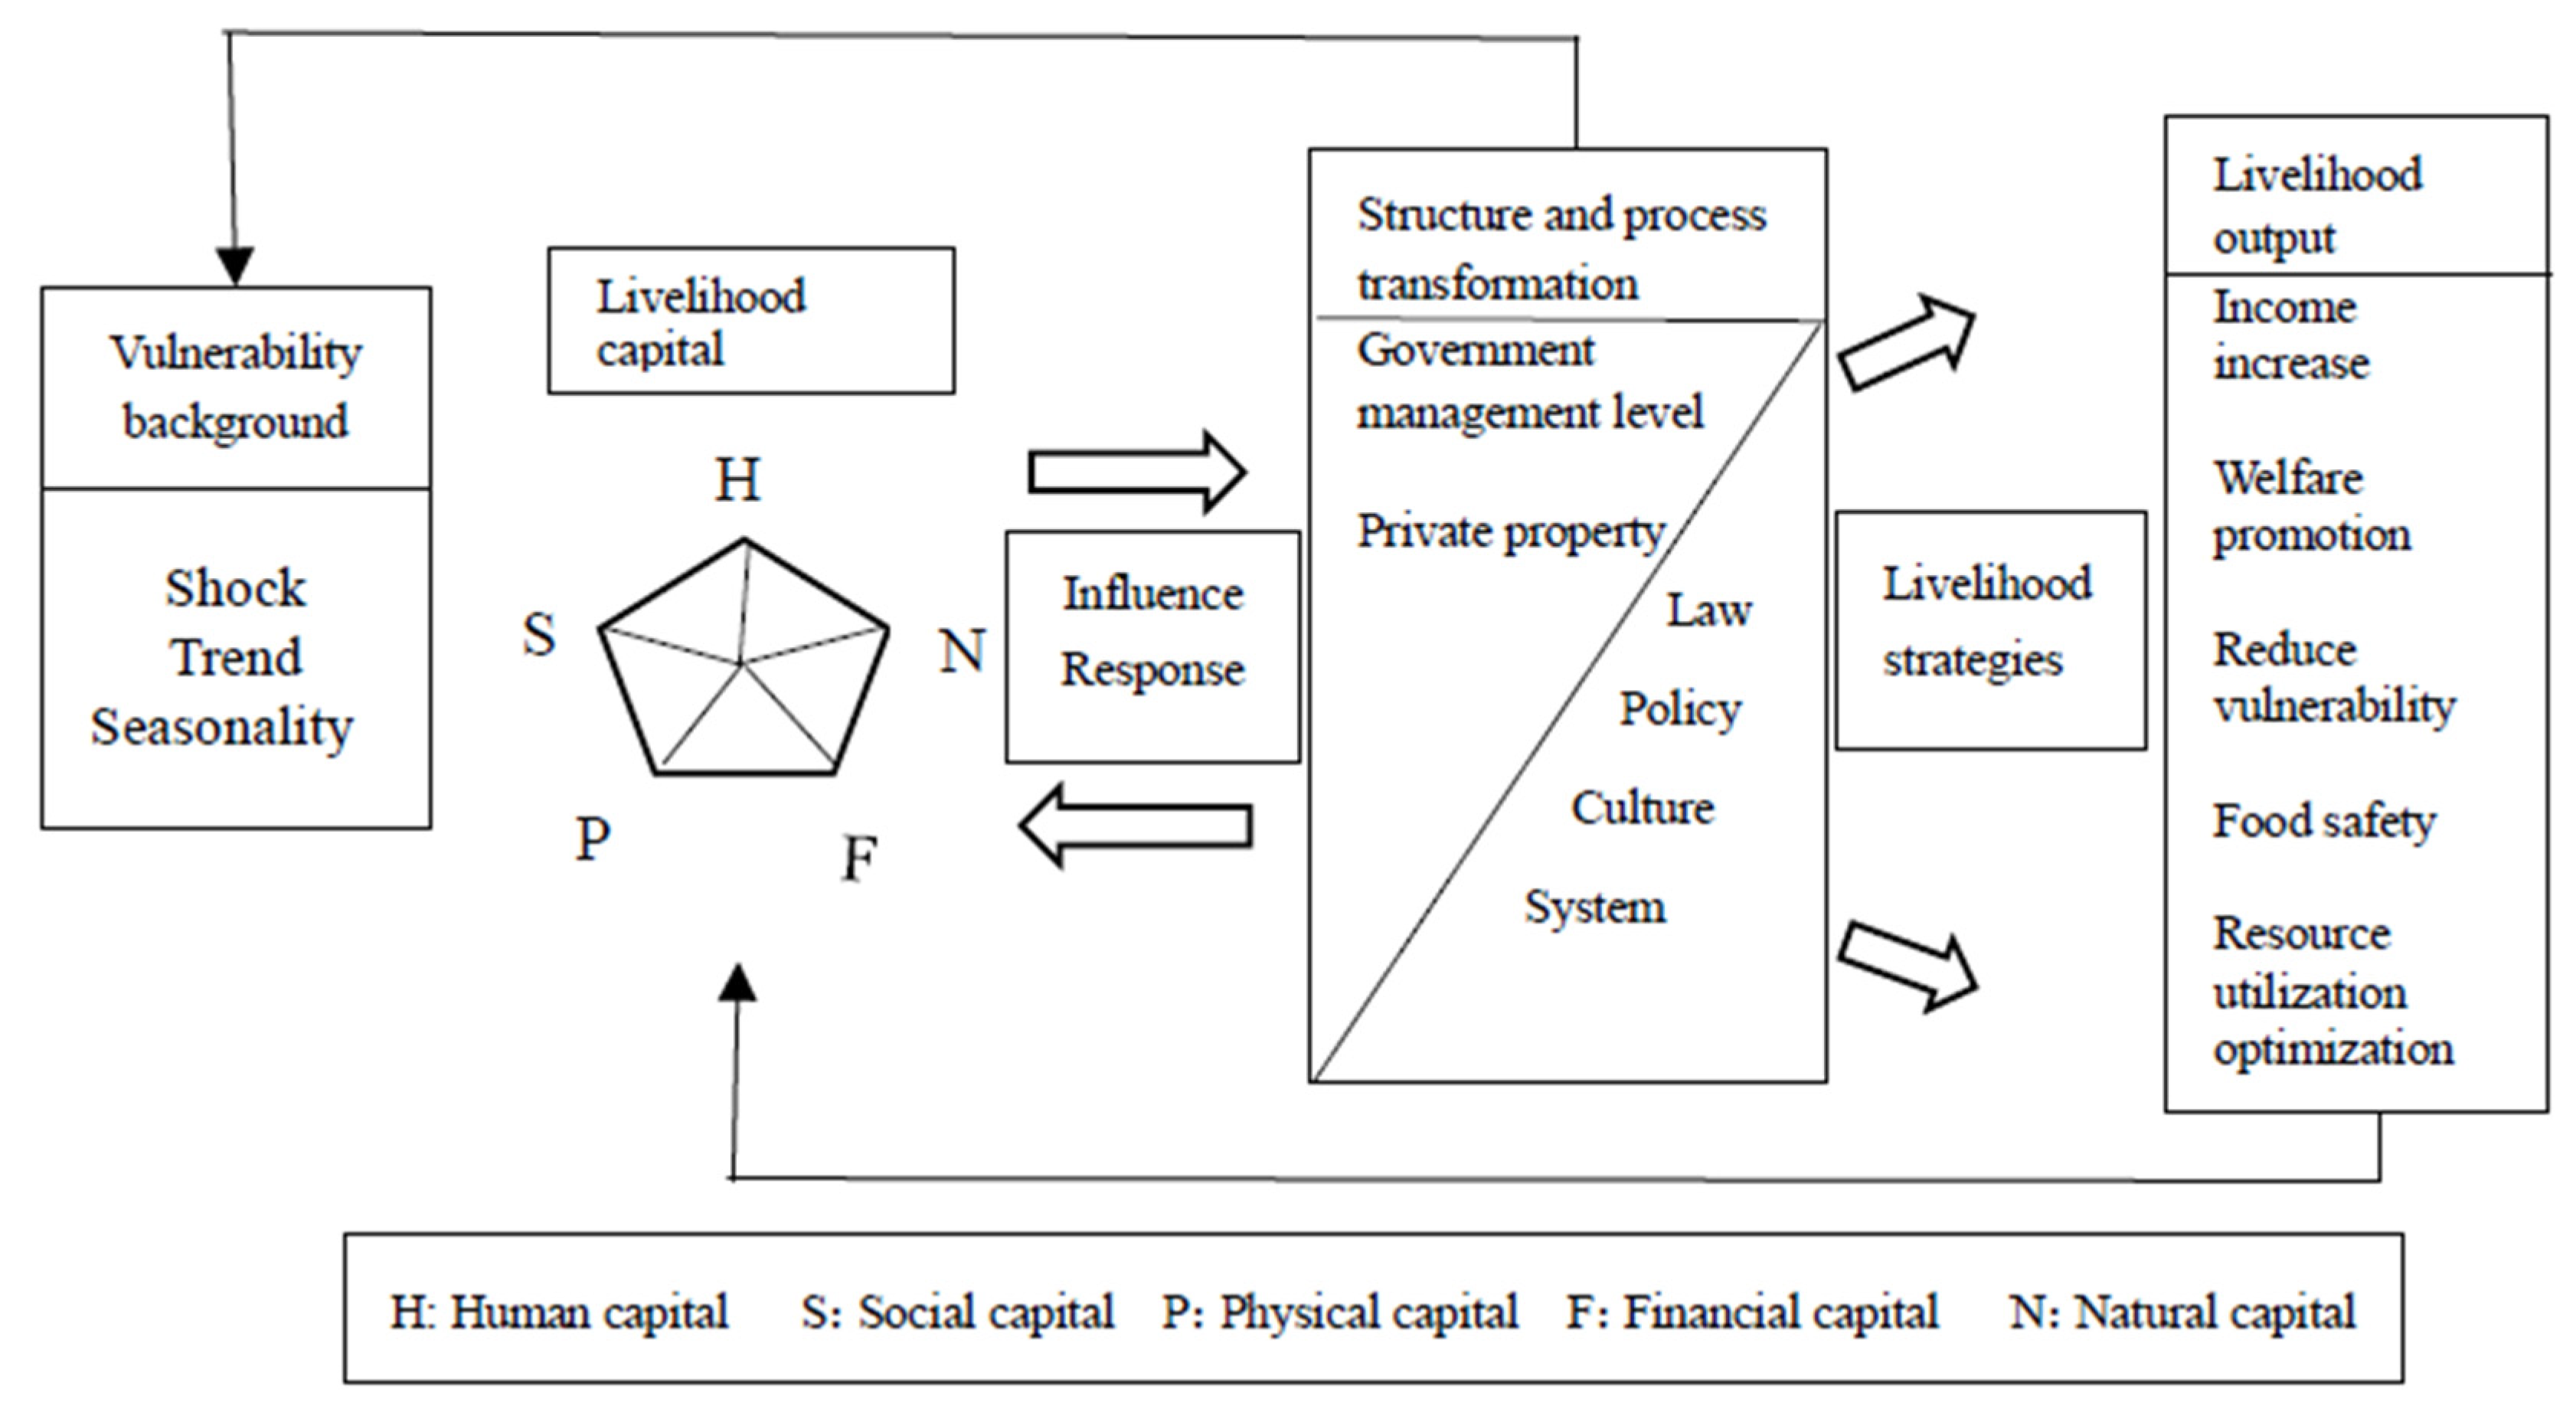
The Department for International Development (DFID) proposed a sustainable livelihood analysis framework [
7,
11,
28], which consists of five parts: vulnerability background, livelihood capital, structure and system, livelihood strategy, and livelihood output, as shown in
Figure 1. The sustainable livelihood of poor farmers can be explained according to the framework as follows: farmers combine their own capital in a fragile environment, realize one or more livelihood strategies under the influence of the structure and system, and finally achieve their livelihood goal. Vulnerability background indicates that human survival and development is impacted and disturbed through the external environment, including natural disasters, economic downturn, and political turmoil. Livelihood capital mainly refers to the natural, social, financial, physical, and human capital needed to maintain living or obtain development. Structure and system refer to the impact of the organizational structure, political system, policies, and measures on livelihood. Livelihood strategies involve the use of livelihood capital and the choice of lifestyle after livelihood capital combination. Livelihood strategies are always fluid, changing alongside internal and external circumstances. Livelihood output is also called livelihood outcome, including multiple outcomes such as increased income, a high level of welfare, good living conditions, and low vulnerability.
3.2. Theoretical Analysis Framework
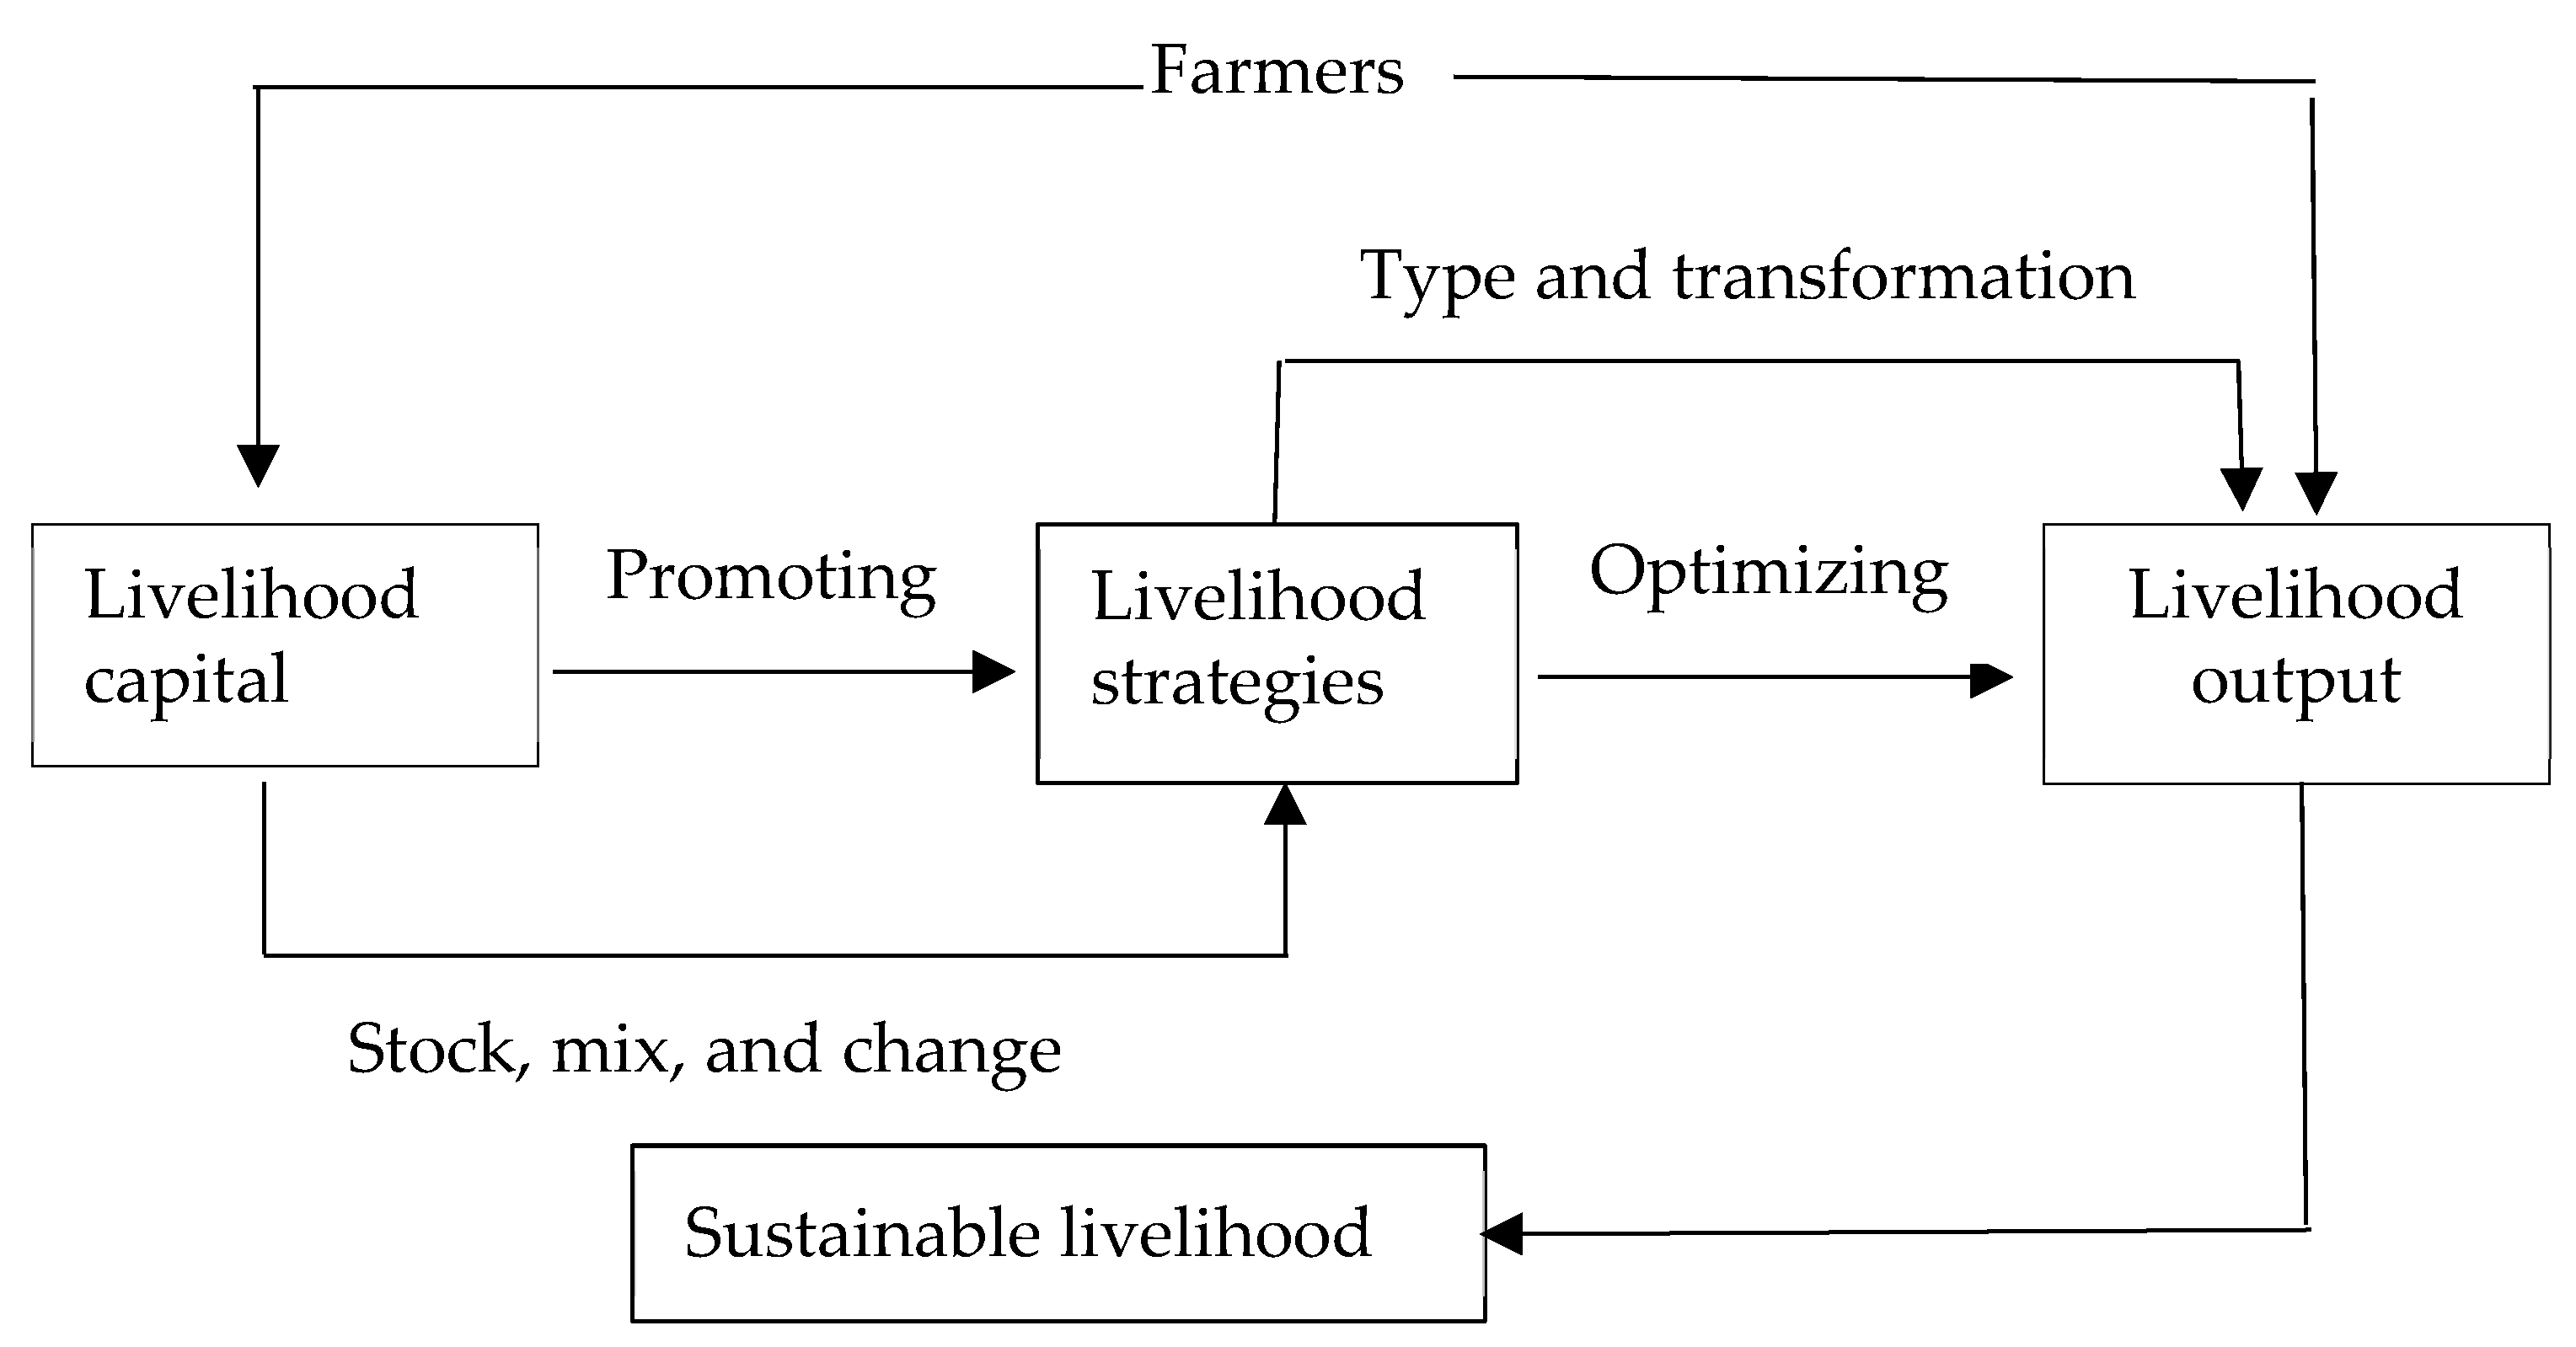
Paying attention to the sustainable development of farmers in poverty-stricken areas and correctly understanding the endogenous development ability of poor farmers is the fundamental strategy to achieve real and permanent poverty alleviation. Livelihood capital is the resources owned by individuals or families for survival and development. Livelihood strategy refers to the scope and combination of individual or family activities and choices. Theoretically, a correct understanding of the impact of livelihood capital on livelihood strategies is the basis and premise of this paper. The analysis of the impact of farmers’ livelihood capital on livelihood strategies is shown in
Figure 2. The stock, composition, and changes of livelihood capital owned by farmers will affect the type and transformation of livelihood strategies. The greater the livelihood capital, the greater the capacity for self-development and the greater the ability to actively choose the type of livelihood strategy and the best way of livelihood and enhance the ability to resist risks. Therefore, the improvement of livelihood capital and the optimization of livelihood strategies are very important for farmers, as they are conducive to improving their sustainable livelihood capacity and achieving permanent poverty alleviation.
3.3. Index System Construction
This research paper followed the principles of methodicalness, systematicness, completeness, and operability when constructing the index system [
35]. On the basis of denoting the current research results [
36,
37,
38], initially, the index set was preselected through the national agricultural modernization standards, DFID’s sustainable livelihood analysis framework, the existing livelihood capital index system research results, and the actual situation of farmers in the sample area. After this, the evaluation indexes were screened by the method of expert scoring, and finally, an evaluation index system of farmers’ livelihood capital was constructed, which included 5 first-level indexes and 16 second-level indexes (as shown in
Table 1). The specific indicators are explained as follows:
(1) Natural capital (N). Natural capital refers to the natural resources that farmers need to engage in livelihood activities [
7,
39]. Natural capital is one of the most important livelihood capitals of farmers in poor areas. Many farmers principally rely on farming for their livelihood. Agricultural planting itself is a kind of livelihood activity dependent on nature. Thus, the quality and stock of natural capital have a great impact on the sustainable development of farmers’ livelihoods and also determine the degree of vulnerability of their livelihoods. Regarding the relevant research and the actual situation of the case study, “the per capita cultivated land area”, “per capita forest land area”, and “geographical location” were carefully selected as indicators to measure the livelihood capital of farmers [
15,
31].
(2) Physical capital (P). Physical capital refers to the means of production and living that farmers need to maintain their livelihoods [
40]. Physical capital is mainly used to improve the production capacity of local farmers. The level of a family’s physical capital can reflect their overall income level, as well as their ability to maintain their livelihood. “Housing structure”, “per capita housing area”, “livestock breeding”, and “household fixed assets” were considered the four main physical capital indicators in this research paper. Amongst them, housing was considered an important indicator that was used to measure physical capital. Livestock breeding, especially large-scale livestock and poultry breeding, can also explain the family living standards of farmers to a certain extent [
28].
(3) Human capital (H). All livelihood activities are attached to people in some way [
17,
29]. It can be perceived that human capital inhabits an important position among the five categories of livelihood capital. Human capital comprises knowledge and skills besides physical fitness and also plays an important role in the sustainable livelihood development of farmers. Combined with the actual local conditions, this research article chose three primary human capital indicators: “the overall labor force of the family”, “the education level of the adult labor force”, and “the health status of the labor force”. The level of education directly affects the level of family income, income sources, and farmers’ livelihood strategy choices. Good physical fitness is the most basic condition for creating wealth, so “the health status of the labor force” is considered a significant indicator for assessing human capital [
39,
41].
(4) Social capital (S). Social capital principally denotes social network resources [
10,
17]. This article selected three main indicators: “relationships with relatives and friends”, “social network support”, and “whether there are village (town and above) cadres” at home. Social network support refers to the contact between a group of individuals. Through these contacts, individuals can maintain their social identity and receive emotional support, material assistance and services, information, and new social contacts. Usually, the better the affiliation with relatives and friends, the more consistent the social network relationship. The level of social capital of farmers with village (town and above) cadres in their families is generally high, which is an important factor affecting their livelihood strategies [
37].
(5) Financial capital (F). Financial capital refers to the aspects associated with household income besides access to credit [
18]. The total amount of financial capital owned by a family, especially the amount of funds, directly determines the quality of life of the family and its ability to deal with risks. This research paper chose three main financial capital indicators: “annual household income”, “access to credit opportunities”, and “diversity of income sources”. Amongst them, “annual household income” is considered a direct indicator to measure family living conditions, which can be directly understood as the income level and individual differences of farmers; “access to credit opportunities” and “diversity of income sources” can be indirectly seen as the level of farmers’ income, which is an important factor for farmers when choosing their livelihood strategy [
11,
18,
41].
3.4. Study Area
China’s poverty-stricken areas are mainly distributed in the western and southwestern regions. Among them, there are 88 poverty-stricken counties in Yunnan Province, ranking first in China. The characteristics of this province include a harsh natural environment; a lack of resources and a weak infrastructure; too low a level of basic social services such as education and health; a low level of fiscal revenue; and a serious shortage of public and basic investment [
10,
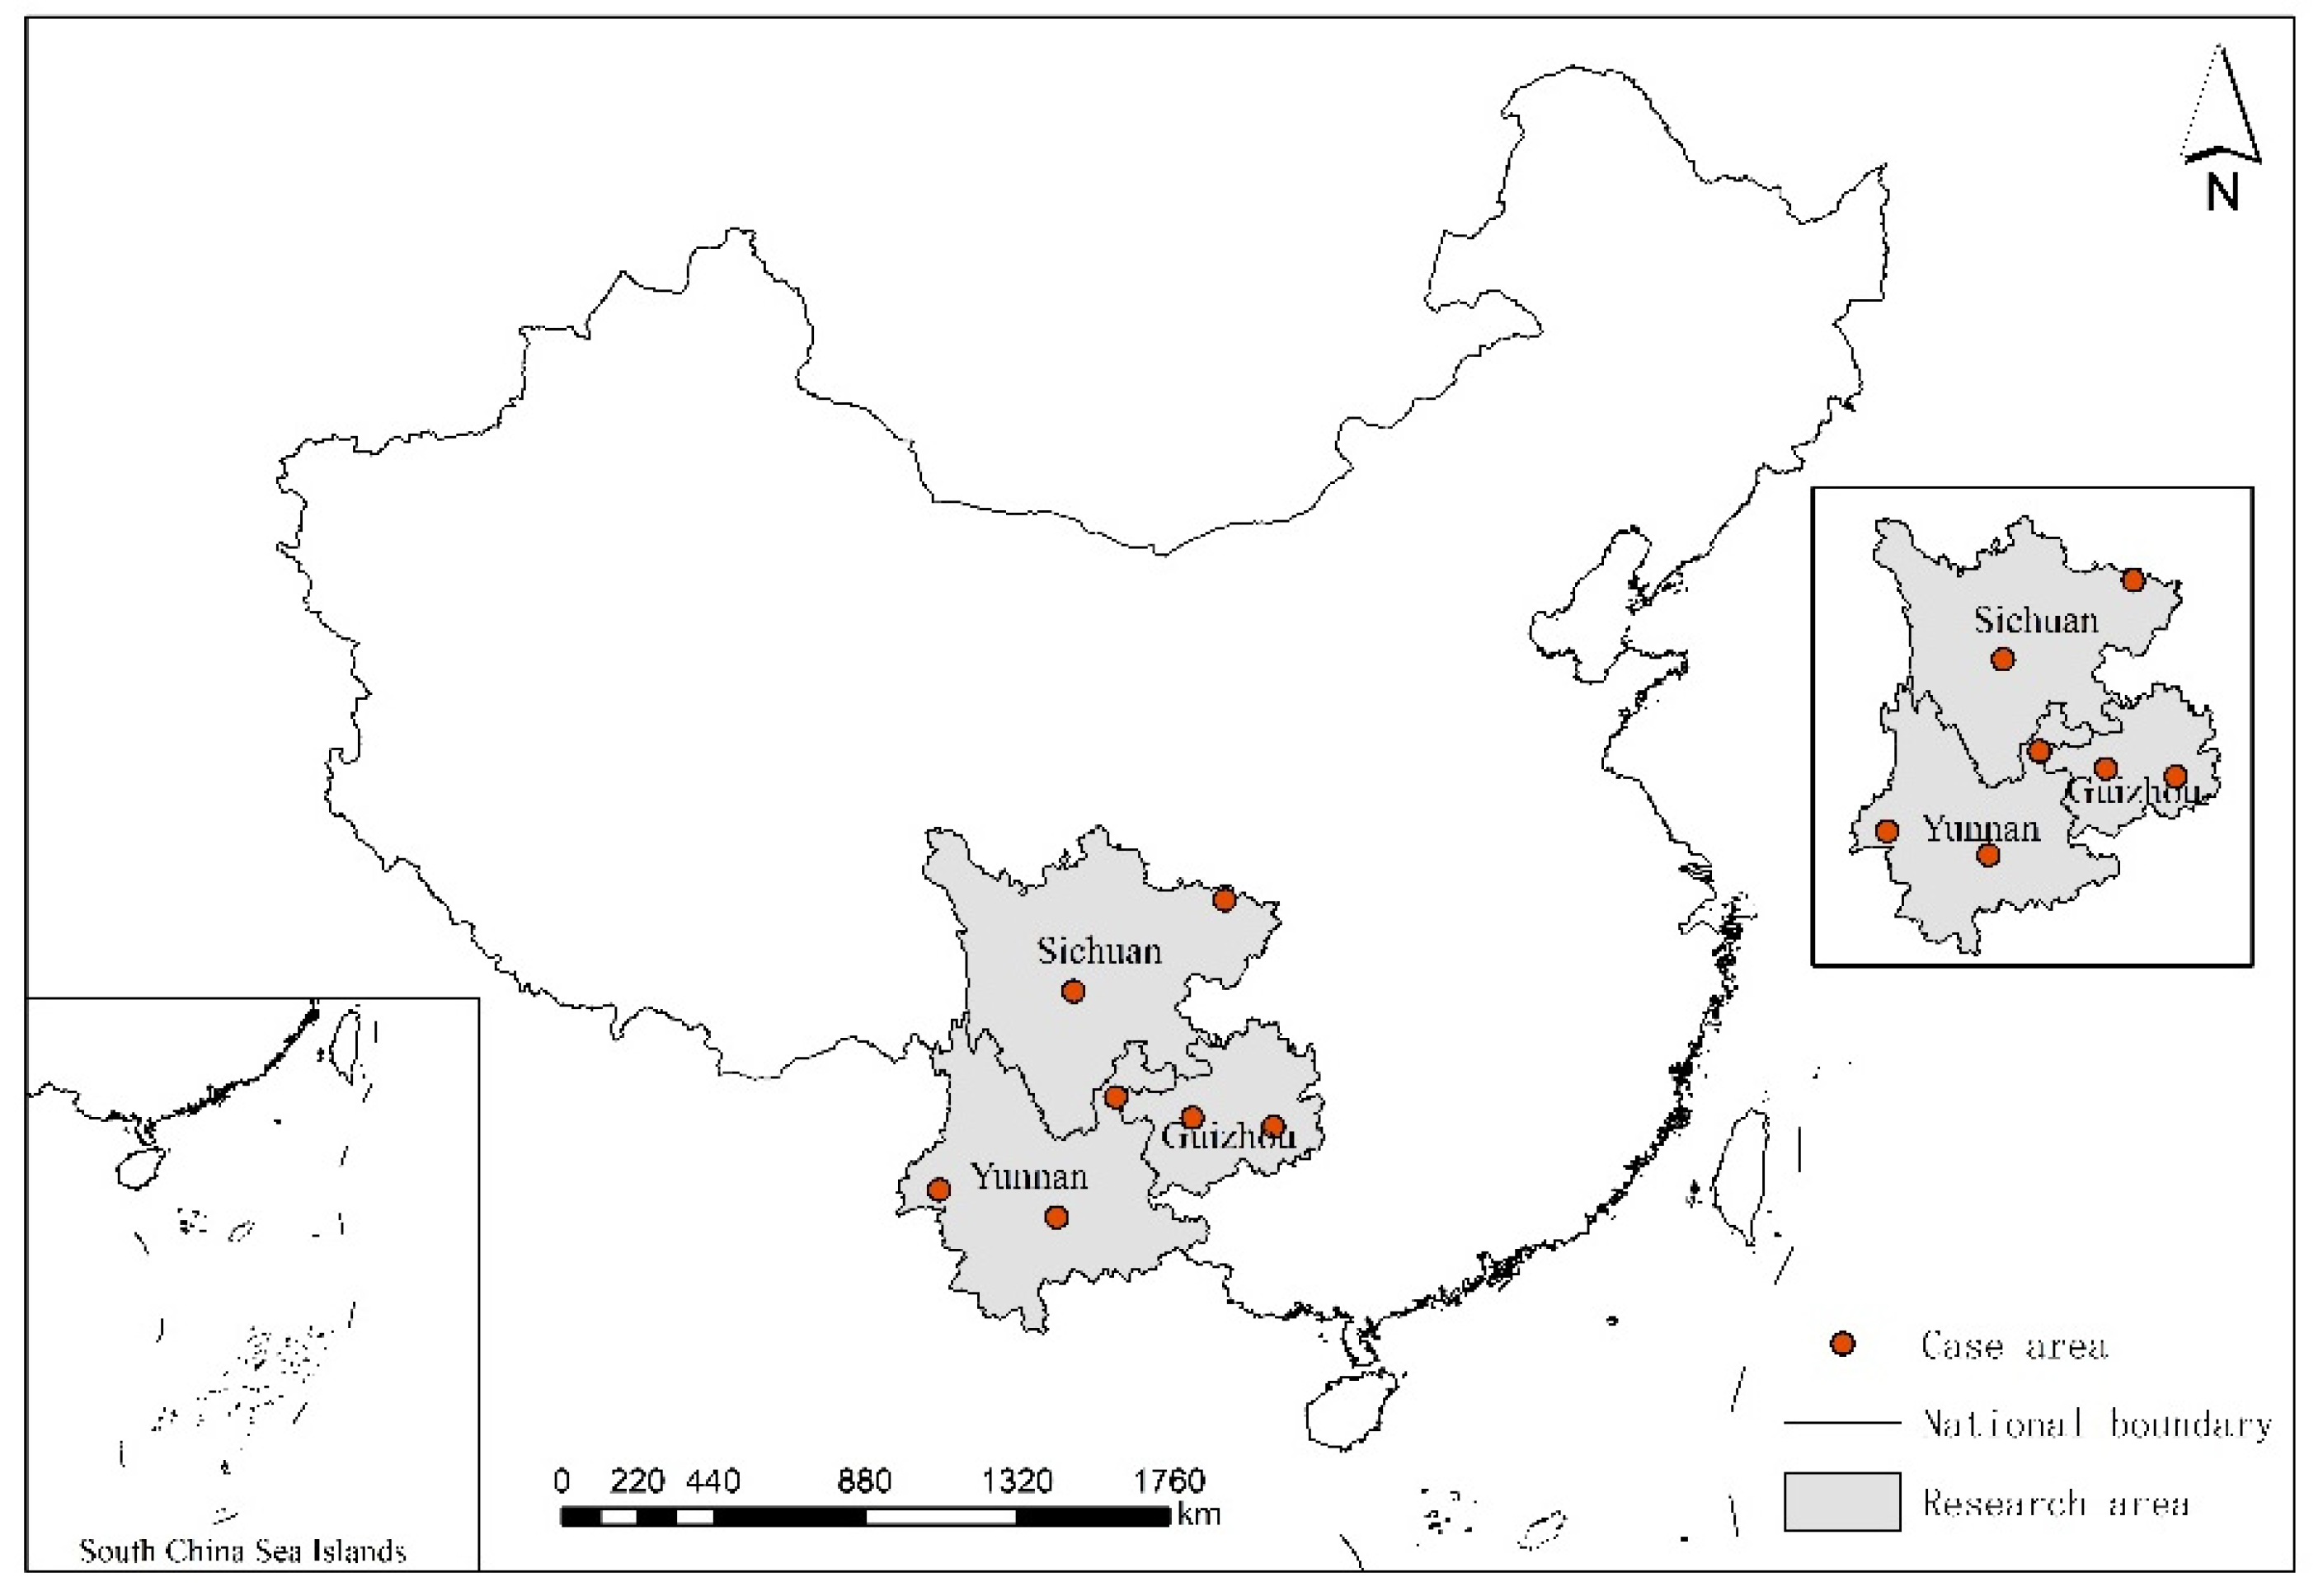
31]. Thus, it is of great theoretical, as well as practical, significance to study the impact of livelihood capital on the livelihood strategy choice of farmers in Southwest China. This research paper chose Yunnan, Guizhou, and Sichuan Provinces as the study areas, which are situated in Southwest China (
Figure 3). Yunnan Province is located on the southwest border of China, with a total area of 390,000 km
2, accounting for 4.11% of the national area, ranking eighth among the provincial administrative regions in China. Moreover, its total population is 45.96 million, accounting for 3.35% of the national population, ranking 12th. Guizhou Province is located in the southeast of Southwest China, with a total area of approximately 176,000 km
2, accounting for 1.8% of the national land area. There are nine prefecture-level administrative divisions and 88 county-level administrative divisions. Guizhou is a multi-ethnic, co-resident province. For thousands of years, all ethnic groups have lived in harmony and have, together, created a colorful Guizhou culture. Sichuan Province covers a total area of 486,000 km
2, accounting for 5.06% of the national area. The permanent resident population is 83.67 million, accounting for 5.92% of the national population. Sichuan has a dense river network and a developed water system, with Minjiang River, Tuojiang River, Yalong River, and Jialing River running through it. Sichuan has a dense population, a pleasant climate, rapid economic development, and dense traffic trunk lines. At present, it is the “Western Comprehensive Transportation Hub” and “Western Economic Development Highland”. This research article chose case sites based on the principles of high stock and quality of farmers’ livelihood capital and diversified livelihood strategies. The selected cases were Longling, Xinping, and Ludian counties in Yunnan Province; Leishan and Zhijin counties in Guizhou Province; and Luding and Nanjiang counties in Sichuan Province.
3.5. Data Sources
The research data in this article came from the field survey of farmers conducted by the research team in Southwest China in the second half of 2020. Both questionnaires and interviews with farmers were employed. In this research study, simple random sampling was used to conduct “one-to-one” sampling surveys on farmers in the survey area. The survey process comprised the following steps:
First, sample counties that were suitable for this study were selected, and the livelihoods of farmers in the poor areas of the sample counties were investigated and analyzed. Afterward, a few sample towns in each individual sample county were chosen, and administrative village sampling was carried out in the sample towns. Lastly, the sample village farmers were interviewed, and questionnaires were issued. The survey involved the livelihood data of farmers in 13 towns situated within seven poor counties. After sorting out and removing the invalid questionnaires, 508 valid questionnaires were finally obtained (see
Table 2). The statistical data of the basic characteristics of the samples are shown in
Table 3.
Moreover, to understand the local characteristics and information regarding farmers’ family members, this survey also focused on investigating and interviewing farmers on their livelihood capital in addition to their livelihood strategies. Furthermore, for better understanding of the livelihood of local farmers, the investigation teams also established dialogue forums at each sample point, and a total of more than 20 in-depth interview records were assembled, providing more comprehensive information for this research study. After each detailed survey, the research group held a positive meeting and had a conversation about the survey, summarizing the problems and difficulties encountered in the survey process and solving them at this time. The combination of questionnaire surveys and field investigations definitely confirmed the authenticity and reliability of the survey data.
3.6. Research Methods
This research paper primarily evaluated the level of farmers’ livelihood capital and empirically investigated the impact of livelihood capital on farmers’ livelihood strategies. When calculating the livelihood capital, the entropy method was used, and SPSSAU software was used for data analysis. When empirically analyzing the impact of livelihood capital on the choice and transformation of sustainable livelihood strategies, the logistic regression model was used, and STATA software was used for data analysis. The livelihood capital measurement method and empirical model settings were as follows.
3.6.1. Livelihood Capital Measurement Method
The weight is an indispensable part of the comprehensive evaluation method, and the application of any method requires the calculation of the weight. In this paper, the entropy method was used to calculate the weight of each index. The entropy method is an objective weighting method. It is a method to determine the index weight according to the impact of the change of evaluation index on the whole system, and the greater the change of the index, the greater the weight. In order to avoid as much as possible the influence of some subjective factors in the process of determining the weight, this paper adopted the entropy method to calculate the weight of each index. Since the dimensions and orders of magnitude of various indicators of livelihood capital were not unified, in order to eliminate the impact of the difference in dimension and order of magnitude, it was necessary to homogenize the heterogeneous indicators and standardize the indicators, so as to solve the problem of the homogenization of the values of various heterogeneous indicators. In this paper, the extreme value method was used to standardize the data, as shown in Formula (1) [
42]:
where
i represents the number of farmers,
j represents the number of indicators,
Xij is the original value of the
jth indicator of the
ith farmer,
Xjmax is the maximum value of the
jth indicator,
Xjmin is the minimum value of the
jth indicator, and
Zij is the standardized value of the
jth indicator of the
ith farmer. The closer the normalized value is to 1, the higher the relative level of the indicator.
Secondly, the entropy method was used to calculate the weight of each index, and the steps were as follows:
The proportion of the ith farmer index value under the jth index was calculated: .
The entropy value of the jth index was calculated: .
The weight of the jth index was calculated: .
The weight values of the various indicators obtained in this paper are shown in
Table 4.
Finally, the livelihood capital LC of the farmers based on the standardized processing data and the weight of each indicator was calculated: .
3.6.2. Variable Selection and Model Setting of the Impact of Livelihood Capital on Livelihood Strategies
Variable Selection
This research article considered Southwest China as an example of the impact of farmers’ livelihood capital on their livelihood strategies, so the farmers’ livelihood strategy was the dependent variable (Y). According to the classification methods of the National Bureau of Statistics and the Chinese Academy of Social Sciences, this paper divided the farmers into three types according to the source of economic income: pure agriculture, part-time agriculture, and non-agriculture [
43]. The pure agricultural type denotes farmers whose total agricultural income accounts for more than 90% of the total household income, while non-agricultural income does not exist in the household income. The non-agricultural type denotes farmers whose non-agricultural income accounts for more than 90% of total household income. Those farmers between the pure agricultural and non-agricultural types are part-time farmers [
44]. Therefore, the dependent variables in this paper were the three livelihood strategies of pure agriculture, part-time agriculture, and non-agriculture.
The livelihood capital of farmers was an independent variable (X), namely natural capital (N), physical capital (P), human capital (H), social capital (S), and financial capital (F). As for the index setting of each livelihood capital, these were clearly determined in a previous paper, and the origin of and reasons for the index settings are not repeated here. The specific indicators of the five types of livelihood capital were shown in
Table 1. This section continues to use the standardized data of each index for empirical analysis.
Model Setting
The impact of livelihood capital on livelihood strategies has received extensive attention in academia, and there are many qualitative studies available on the relationship between them [
45]. Moreover, many scholars have used certain models and methods to conduct empirical research on the relationship between the two from different perspectives [
46,
47,
48]. At present, the logistic regression model is widely used to analyze the relationship between the two [
49]. Therefore, this research paper learned from previous research methods and used the logistic regression model to empirically analyze the impact of livelihood capital on the livelihood strategies of farmers in Southwest China.
First, the logistic regression model was used to analyze the influencing factors of farmers’ different types of livelihood strategies. When analyzing certain types of livelihood strategies, a value of 1 was assigned to the pertinent type of livelihood strategy, while a value of 0 was assigned to the remaining two types of livelihood strategies [
50]. For example, when analyzing the influencing factors of the choice of the pure agriculture livelihood strategy, the pure agriculture livelihood strategy was assigned 1, while the other two livelihood strategies were assigned 0. Based on this method, logistic regression models of the part-time and non-agriculture strategies were constructed, and the details are shown in the Formulas (2)–(4).
In Formula (2), if the type of livelihood strategy was pure agriculture, then = 1; otherwise, it was 0. is the explanatory variable, namely the five major livelihood capitals; ... are the estimated coefficients of the explanatory variables. In Formula (3), if the type of livelihood strategy was part-time agriculture, then = 1; otherwise, it was 0. is the explanatory variable, namely the five major livelihood capitals; ... are the estimated coefficients of the explanatory variables. In Formula (4), if the type of livelihood strategy was non-agriculture, then = 1; otherwise, it was 0. is the explanatory variable, namely the five major livelihood capitals; … are the estimated coefficients of the explanatory variables. The influencing factors and degree of farmers’ livelihood capital on different types of livelihood strategies were studied by logistic regression model.
Meanwhile, in order to reveal the law of transformation of farmers’ livelihood strategies from pure agriculture to part-time and non-agriculture, this paper assigned the livelihood strategies of pure agriculture, part-time agriculture, and non-agriculture to 1, 2, and 3, respectively, and took the livelihood strategy of pure agriculture as a reference to analyze the changes in livelihood capital in the process of transformation from pure agriculture to part-time and non-agriculture. Therefore, this research paper constructed a polynomial logistic regression model, as shown in Formulas (5) and (6).
If the type of livelihood strategy was pure agriculture, then = 1; if the type of livelihood strategy was part-time agriculture, then = 1; if the type of livelihood strategy was non-agriculture, then = 1; ... and ... are the estimation coefficients.
5. Discussion
The research on livelihood capital and livelihood strategies is constantly evolving, both at home and abroad [
10,
28]. Based on the characteristics of farmers’ sustainable livelihoods in Southwest China, this paper constructed a model of farmers’ livelihood capital and livelihood strategies and conducted data analysis. However, due to differences in research areas and research methods, the results of the research are slightly different from other researchers’ findings in terms of farmers’ livelihoods.
Regarding the evaluation methods of livelihood capital, in recent years, new methods have been established and gradually implemented by the majority of scholars, such as regression analysis, the analytic hierarchy process, artificial neural networks, and fuzzy evaluation [
60,
61,
62,
63]. Each evaluation method has its advantages and disadvantages. Based on the real circumstances of the study area, this paper carefully chose the entropy methodology as the evaluation method of the livelihood capital of farmers in southwest poverty-stricken areas. The reason was that the entropy technique can imitate in depth the utility value of the index information entropy value and thus determine the weight. In addition, the entropy method is an objective weighting method, so the weights of the indicators derived from it are more considered, with moderately high reliability and accuracy [
63]. Research by Kuang et al. showed that among the five types of livelihood capital, farmers’ natural capital value is the highest and their social capital value is the lowest [
7]. The research results of this paper showed that the value of physical capital is the highest, while the value of financial capital is the lowest. The reason for the higher physical capital is that the means of living and production owned by farmers have increased, and the types of fixed assets owned by households have also increased significantly. Most farmers have a number of fixed assets such as televisions, washing machines, and electric vehicles. In addition, with the implementation of poverty alleviation policies, the government has renovated the houses of many farmers, and housing conditions have been improved [
64]. Meanwhile, the low financial capital was mainly caused by the low family income, limited access to credit, fewer income sources, and other factors. This paper evaluated farmers’ livelihood capital using a more objective method, and the evaluation results are basically consistent with other investigations in the field.
In this paper, the logistic regression model was used to conduct an empirical investigation of the relationship between livelihood capital and livelihood strategies. The results showed that different livelihood capital conditions determine the choice of livelihood strategy for a farmer. The results of this research are consistent with the research conclusions of other scholars in the academic field. For example, Meng et al. conducted a quantitative analysis on the livelihood capital and livelihood strategies of farmers and herdsmen in Ordos city [
29]. The results showed that farmers with more human and financial capital take non-agricultural activities as their main livelihood strategy, while farmers with more natural capital take agricultural production as their main livelihood strategy. The difference in this study is that the livelihood strategies of farmers were divided into three types, namely pure agriculture, part-time agriculture, and non-agriculture, and the impact of different livelihood capital types on the three livelihood strategies was calculated. The research results are consistent with the other survey results in this field. In addition, most scholars have only studied the impact of livelihood capital on livelihood strategies and have not further studied the key influencing factors of the transformation of farmers’ livelihood strategies [
11,
28]. With changes in livelihood capital, the type of livelihood strategy will also change to a certain extent. This paper individually analyzed the influencing factors of the transformation from pure agriculture to part-time and non-agriculture livelihood strategies. The results showed that the transformation of farmers’ livelihood strategies is affected by many key factors. This study can help farmers quickly identify the influencing factors of different livelihood strategies so as to realize the optimization of their strategy, in order to better solve the sustainable livelihood problems of farmers in poor areas.
The possible innovations of this paper are as follows: ① Regarding the selection of research objects, most scholars mainly take a province, a city, or even a county as the research area. Furthermore, the research object has seldom been targeted at poor farmers. This paper mainly took farmers in poverty-stricken areas in Southwest China as the research object. Southwest China is a region with a large number of poor people and a high incidence of poverty in China, and it is also the main area for poverty alleviation. Therefore, it was very representative and typical to take the poverty-stricken areas in Southwest China as the sample area. ② This paper mainly adopted the more objective entropy method to quantitatively calculate the livelihood capital. The evaluation methods often used by scholars include the analytic hierarchy process and principal component analysis. The analytic hierarchy process has some subjectivity, and the results are not scientific and effective. The principal component analysis method can only reflect part of the original data, and cannot cover all the data, and the analysis results are not comprehensive enough. The entropy method makes up for the shortcomings of the above methods. ③ This paper focused on empirical research on the impact of livelihood capital on livelihood strategies and conducted a detailed analysis of the key influencing factors of livelihood strategy transformation. Most of the studies on livelihood strategies were from the perspective of sociology, mainly focusing on the current situation of livelihood, types of livelihood strategies, etc., and lacked in-depth empirical research. Although some scholars have made some research progress on the impact of livelihood capital on livelihood strategies, the research is not comprehensive. They only analyzed the impact of livelihood capital on the choice of livelihood strategies and did not further analyze the impact of livelihood capital on the transformation of livelihood strategies. This article has made up for this deficiency.
However, this study has certain limitations. The availability of data was one limitation, as this paper only discussed the livelihood of farmers in southwest poverty-stricken areas at a single point in time. However, the livelihood capital of farmers will change with time, and the choice of livelihood strategy also needs dynamic analysis. In future research, we will try to establish a dynamic monitoring system for farmers to compare the changes in their livelihood capital and livelihood strategies at different time points, and we will analyze the livelihood issues of farmers in different periods.
6. Conclusions and Suggestions
6.1. Conclusions
On the basis of the relevant research results pertaining to livelihood capital and livelihood strategy, this research paper adopted poor areas in Southwest China as an example, constructed an evaluation index system of livelihood capital, evaluated the livelihood status of farmers with the help of field survey data, and then empirically studied the impact of farmers’ livelihood capital on their choice of livelihood strategy. Based on previous theoretical analysis and empirical research, this research paper draws the following conclusions:
(1) From the perspective of livelihood capital, the five categories of livelihood capital were generally not high. Among them, the asset value of physical capital was the highest, at 0.4279; the financial capital value was the lowest, at 0.2018; the natural, human, and social capital values were between the two, at 0.4038, 0.3364, and 0.2139, respectively. This research showed that in the poor areas of Southwest China, a large number of farmers still lack livelihood resources, and there are still some constraints on their sustainable livelihoods. Whether the sustainable livelihood capacity of farmers can be improved is related to whether a rural revitalization strategy can be effectively implemented. However, the current low level of farmers’ livelihood capital is not conducive to their stability and prosperity and the harmony and stability of the countryside.
(2) From the perspective of the influencing factors of livelihood strategy selection, the types of livelihood capital that had a positive impact on the pure agriculture livelihood strategy were mainly physical and natural capital. On the contrary, the kinds of livelihood capital that had a negative impact on the pure agriculture livelihood strategy were human, social, and financial capital. For the part-time agriculture livelihood strategy, except for financial capital, the other four types of livelihood capital were positively related to the strategy, and the contribution of these four positive factors to livelihood strategies was not much different. In addition, human, social, and financial capital were positively correlated with the non-agriculture livelihood strategy, while physical and natural capital were negatively correlated with the non-agriculture livelihood strategy. This research showed that the type of livelihood strategy that farmers choose depends on the type and stock of livelihood capital that they have.
(3) From the perspective of the key factors that affect the transformation of livelihood strategies, the key factors that promote the transformation of livelihood strategy from pure agriculture to part-time agriculture mainly include geographical location, household fixed assets, the overall labor force of the family, the education level of labor force, social network support, and annual household income. The key factors that promote the transformation of livelihood strategies from pure agriculture to non-agriculture are mainly the education level of the labor force, relationships with relatives and friends, social network support, and access to credit opportunities. This research showed that the types of livelihood strategies adopted by farmers are not invariable and will change with a change in livelihood capital. Therefore, farmers should choose the most suitable livelihood strategy according to their actual livelihood capital, so as to enhance their livelihood ability.
6.2. Suggestions
Combined with the abovementioned conclusions, the following suggestions are put forward from the perspectives of livelihood capital and livelihood strategies:
(1) Increase livelihood capital and expand livelihood capital stock. For natural capital, it is necessary to reasonably adjust the structure of agriculture and forestry, improve the quality of cultivated and forest land, and improve farmland irrigation facilities and road traffic. Moreover, the government should perfect the system of land distribution and circulation to improve the utilization efficiency of natural capital. For physical capital, the quality of livestock should be improved, large-scale breeding and characteristic breeding should be carried out according to market demand, agricultural production materials and fixed assets should be increased, and labor productivity should be improved. At the same time, the government should strengthen infrastructure construction; improve conditions such as sanitation, diet, and housing structure; increase the per capita housing area; and solve the housing problems of farmers. For human capital, the cultural and physical qualities of farmers need to be improved. It is also suggested to improve the salary level of rural teachers and implement effective incentive policies. Strengthening the training of young people, helping them to master their skills, and cultivating their concept of self-reliance should also be achieved. At the same time, the physical examination rate of farmers should be increased, and free physical examinations should be implemented for farmers with poor health and poor family conditions to reduce the incidence of diseases or infectious diseases. For social capital, a good social communication network system should be constructed to promote the sharing of feelings and exchanges between farmers and their relatives and friends. Encouraging farmers to participate in some cooperatives, associations, and other related organizations should help to strengthen the contact between farmers and individuals with outside information. Meanwhile, the government should also provide some financial and material support. For financial capital, financial credit policies should be standardized, especially for low-income farmers in poor areas. Improving the micro-credit system, ensuring that every village has its own network, facilitating farmers’ loans, and fundamentally solving the problem of farmers’ fund shortage are key ways to achieve this.
(2) Optimize livelihood strategies and improve sustainable livelihood capacity. When choosing a livelihood strategy, farmers should comprehensively observe the surrounding environment and resources. In particular, they should choose the most suitable livelihood strategy according to the actual situation of their own livelihood capital, so as to employ the maximum utility of livelihood capital. For example, when the natural and physical capital of farmers are high, they can transfer onto a pure agriculture livelihood strategy and strive to become large farmers of agricultural planting and breeding. They can join some professional cooperatives and take advantage of market opportunities to seek business opportunities. When human, financial, and social capital are abundant, farmers can choose a part-time or non-agriculture livelihood strategy to transfer part of their labor force and expand their livelihood activities. Making full use of their own cultural level, credit funds, and social network relations are some options to actively seek ways to increase income and become rich, as well as increase employment opportunities for farmers. In addition, once a livelihood strategy has been selected, it is not fixed. With changes in local characteristics and household livelihood capital, the livelihood strategy should also be adjusted in time to achieve the sustainable livelihood strategy goals of farmers. For example, when the quality of farmers’ cultivated land is poor but the local tourism resources are rich, farmers can change their single pure agriculture livelihood strategy, choose the integrated development strategy of agriculture and tourism, and enhance their livelihood ability.


