Article

Assessing the Spatial Mapping of Heat Vulnerability under Urban Heat Island (UHI) Effect in the Dhaka Metropolitan Area

1
Department of Urban and Regional Planning, Khulna University of Engineering & Technology (KUET), Khulna 9203, Bangladesh
2
Department of Geography, Faculty of Natural Science, Jamia Millia Islamia, New Delhi 110025, India
3
Department of Disaster Management, Begum Rokeya University, Rangpur 5400, Bangladesh
4
John von Neumann Faculty of Informatics, Obuda University, 1034 Budapest, Hungary
5
Institute of Information Engineering, Automation and Mathematics, Slovak University of Technology in Bratislava, 812 37 Bratislava, Slovakia
*
Author to whom correspondence should be addressed.
Sustainability 2022, 14(9), 4945; https://doi.org/10.3390/su14094945
Submission received: 10 March 2022 / Revised: 8 April 2022 / Accepted: 12 April 2022 / Published: 20 April 2022
(This article belongs to the Section Hazards and Sustainability)

Abstract

:
The urban heat island (UHI) phenomenon gets intensified in the process of urbanization, which increases the vulnerability of urban dwellers to heatwaves. The UHI-induced vulnerability to heatwaves has increased in Bangladesh during past decades. Thus, this study aims to examine the UHI and vulnerability to heatwaves in the city of Dhaka using a heat vulnerability index (HVI). The HVI is constructed using various demographic, socioeconomic, and environmental risk variables at thana level. Principal component analysis (PCA) was applied to the 26 normalized variables for each of the 41 thanas of Dhaka to prepare the HVI. Result shows that more than 60% of the city is under built-up areas, while vegetation cover and water bodies are in low proportion. Analysis of HVI shows that the very high- and high-risk zones comprise 6 and 11 thanas, while low- and very low-risk zones comprise only 5 and 8 thanas. The correlation of HVI with variables such as exposure (0.62) and sensitivity (0.80) was found to be highly positive, while adaptive capacity had a negative correlation (−0.26) with the HVI. Findings of this study can be utilized in the mitigation of UHI phenomenon and maintaining the thermal comfort of Dhaka.

1. Introduction

During urbanization, pervious lands have been transformed into impermeable surfaces, producing several environmental hazards in large metropolitan areas [1]. Among the several negative repercussions of urbanization, the most widely recorded occurrence in cities is the urban heat island (UHI), which develops because of growing heat-absorbing pavement materials in cities [2,3,4]. UHIs have been linked to regional land-use changes [5,6,7], exacerbated by absorbed heat from greenhouse gas emissions [8]. Furthermore, the UHI phenomenon is caused by increased building heights in cities, which block breezes and significantly restrict ventilation [9,10]. According to studies, the average daily summer temperature in urban areas greater than 500 square kilometers increased by 4.7 degrees Celsius across three annual cycles from 2003 to 2005 [11,12]. Air temperatures in the United States’ urban and rural areas have risen by 0.24 and 0.16 degrees Celsius per decade [13]. Similarly, the temperature of cities in south and east Asian countries, such as China, India, Bangladesh, and Pakistan, has risen by 0.23–0.57 degrees Celsius every decade in recent decades [7,14,15]. The increasing temperature in urban areas and the development of the UHI phenomenon increase vulnerability to heatwaves and the death rate in urban regions [13,16,17].
The rising temperature in cities, combined with the development of the UHI phenomenon, generates a thermal imbalance in the cities, affecting urban thermal comfort [6,9,10]. One of the most critical concerns of rising temperatures and the UHI phenomenon in cities is diminishing urban thermal comfort [4,18]. The loss in thermal comfort affects the economy’s health and wellbeing by affecting labor, capital, and services [19]. Furthermore, it increases energy consumption because of the increased energy demand for cooling in urban areas [20,21]. However, in a nation such as Bangladesh, where more than half of urban people live in informal housing [22], and there are few facilities to maintain thermal comfort, weather-related sickness and mortality are very high [23]. Heatwaves produce heat stress, heat exhaustion, heatstroke, heat rash, heat cramps, and many diseases, all of which contribute to various physical problems [24]. Human health is progressively worsening because of heat stress’s social and physical environments [25]. Heatwave susceptibility increases because of climate change, and high heat events are becoming more frequent [26,27].
Because of its high population density, low-lying soil, congested infrastructure, and frequent natural disasters, Bangladesh has become the world’s most susceptible country to climate change [28,29]. Bangladesh has endured massive heatwaves in recent years, and Dhaka, the country’s metropolis, has unavoidably experienced a significant increase in UHI severity [14,30,31,32,33]. Using an artificial neural network and thermal indices, the researchers described land cover dynamics and consequences on UHI in the Dhaka metropolitan region (DMP) [34]. According to dewan et al. [14], Dhaka’s temperature has risen by 0.57 degrees Celsius in the recent decade. On 25 April 2021, the city recorded its hottest temperature (41.2 degrees Celsius) in the last decade. Dhaka has long focused on researchers studying the several significant rising challenges in Bangladesh. Researchers had investigated the thermal atmospheric state and heat-related death rate when urban heat islands intensified [35]. Prediction of heatwaves and analysis of the microclimatic environment by building a heat early warning system have also been researched to reduce heat events in the near future [31]. Another study focuses on the impact of heatwaves on a specific subset of people in Bangladesh, particularly men and women over the age of 65 [36]. However, thermal studies have not yet been extended to clarify the characterization of various indicator approaches at the micro and preliminary levels of Bangladesh’s Dhaka metropolitan region.
Because of growing worries about the health of present and future populations, researchers and policymakers have been compelled to investigate heat-related hazards and devise appropriate mitigation and adaptation techniques [37,38]. Previous research on urban vulnerability mapping has developed a heat-related study approach [39,40], explored the link between UHI and mortality [41], identified vulnerable subgroups [42], and mapped susceptibility to heatwaves [3]. Different scientific organizations employ various notions to associate a negative consequence with a danger [43]. A heat vulnerability index (HVI) is a simple tool that can combine several heat vulnerability indicators into a single frame to identify an area with high heat hazards [15,44]. Previous HVI research could be divided into two groups based on the methodologies used to aggregate heat vulnerability. In the first group, the weights of indicators are assigned subjectively (e.g., they are equal) [45], but in the second group, the weights of indicators are assigned objectively using statistical approaches [46]. However, the authors cannot tell whether the strategy is better suited because of a lack of comparative validation data. Principal component analysis (PCA) is the most prevalent and widely used approach in comparative research [47]. Most of these studies have focused on big cities in industrialized countries, such as the United States [13], the United Kingdom [48], Germany [49], and Canada [50]. Meanwhile, the distribution of heat-related health concerns in developing countries is rarely studied [3].
The authors classified UHI research in Bangladesh and Southeast Asia nations into three groups based on a thorough literature review. In the first category, the research focused on a detailed examination of UHI intensity and spatiotemporal pattern of UHI, finding that the urban center has the highest UHI intensity while the suburb region appears to have the lowest [51,52]. Cross-sectional research in the second category has aimed to study the relationship between UHI and land cover patterns [6,7], land-use type [53], and urban structure [54]. Simulation models, such as weather research and forecasting (WRF) and ENVI-met, have been employed in the third category to predict and minimize future UHI intensity. However, no research on the impact of UHI on human health has been undertaken in the Dhaka Metropolitan Area, although UHI has been associated with poor human health in other Asian cities [55]. Thus, this study aims to use a heat vulnerability index to investigate the vulnerability to heatwaves in the Dhaka urban heat island using principal component analysis (PCA). Although UHI and HVI studies aim to examine the impact of heatwaves and rising temperatures on humans, most of these studies lack socioeconomic and environmental variables. The HVI was calculated in this study using multiple normalized socioeconomic, demographic, and environmental variables. It is believed that by combining the UHI with socioeconomic, demographic, and environmental aspects, more accurate results will be achieved, providing a clearer picture of the sensitivity to heatwaves. The outcome of this study will aid in reducing the vulnerability to heatwaves and sustaining urban thermal comfort.

2. Materials and Methods

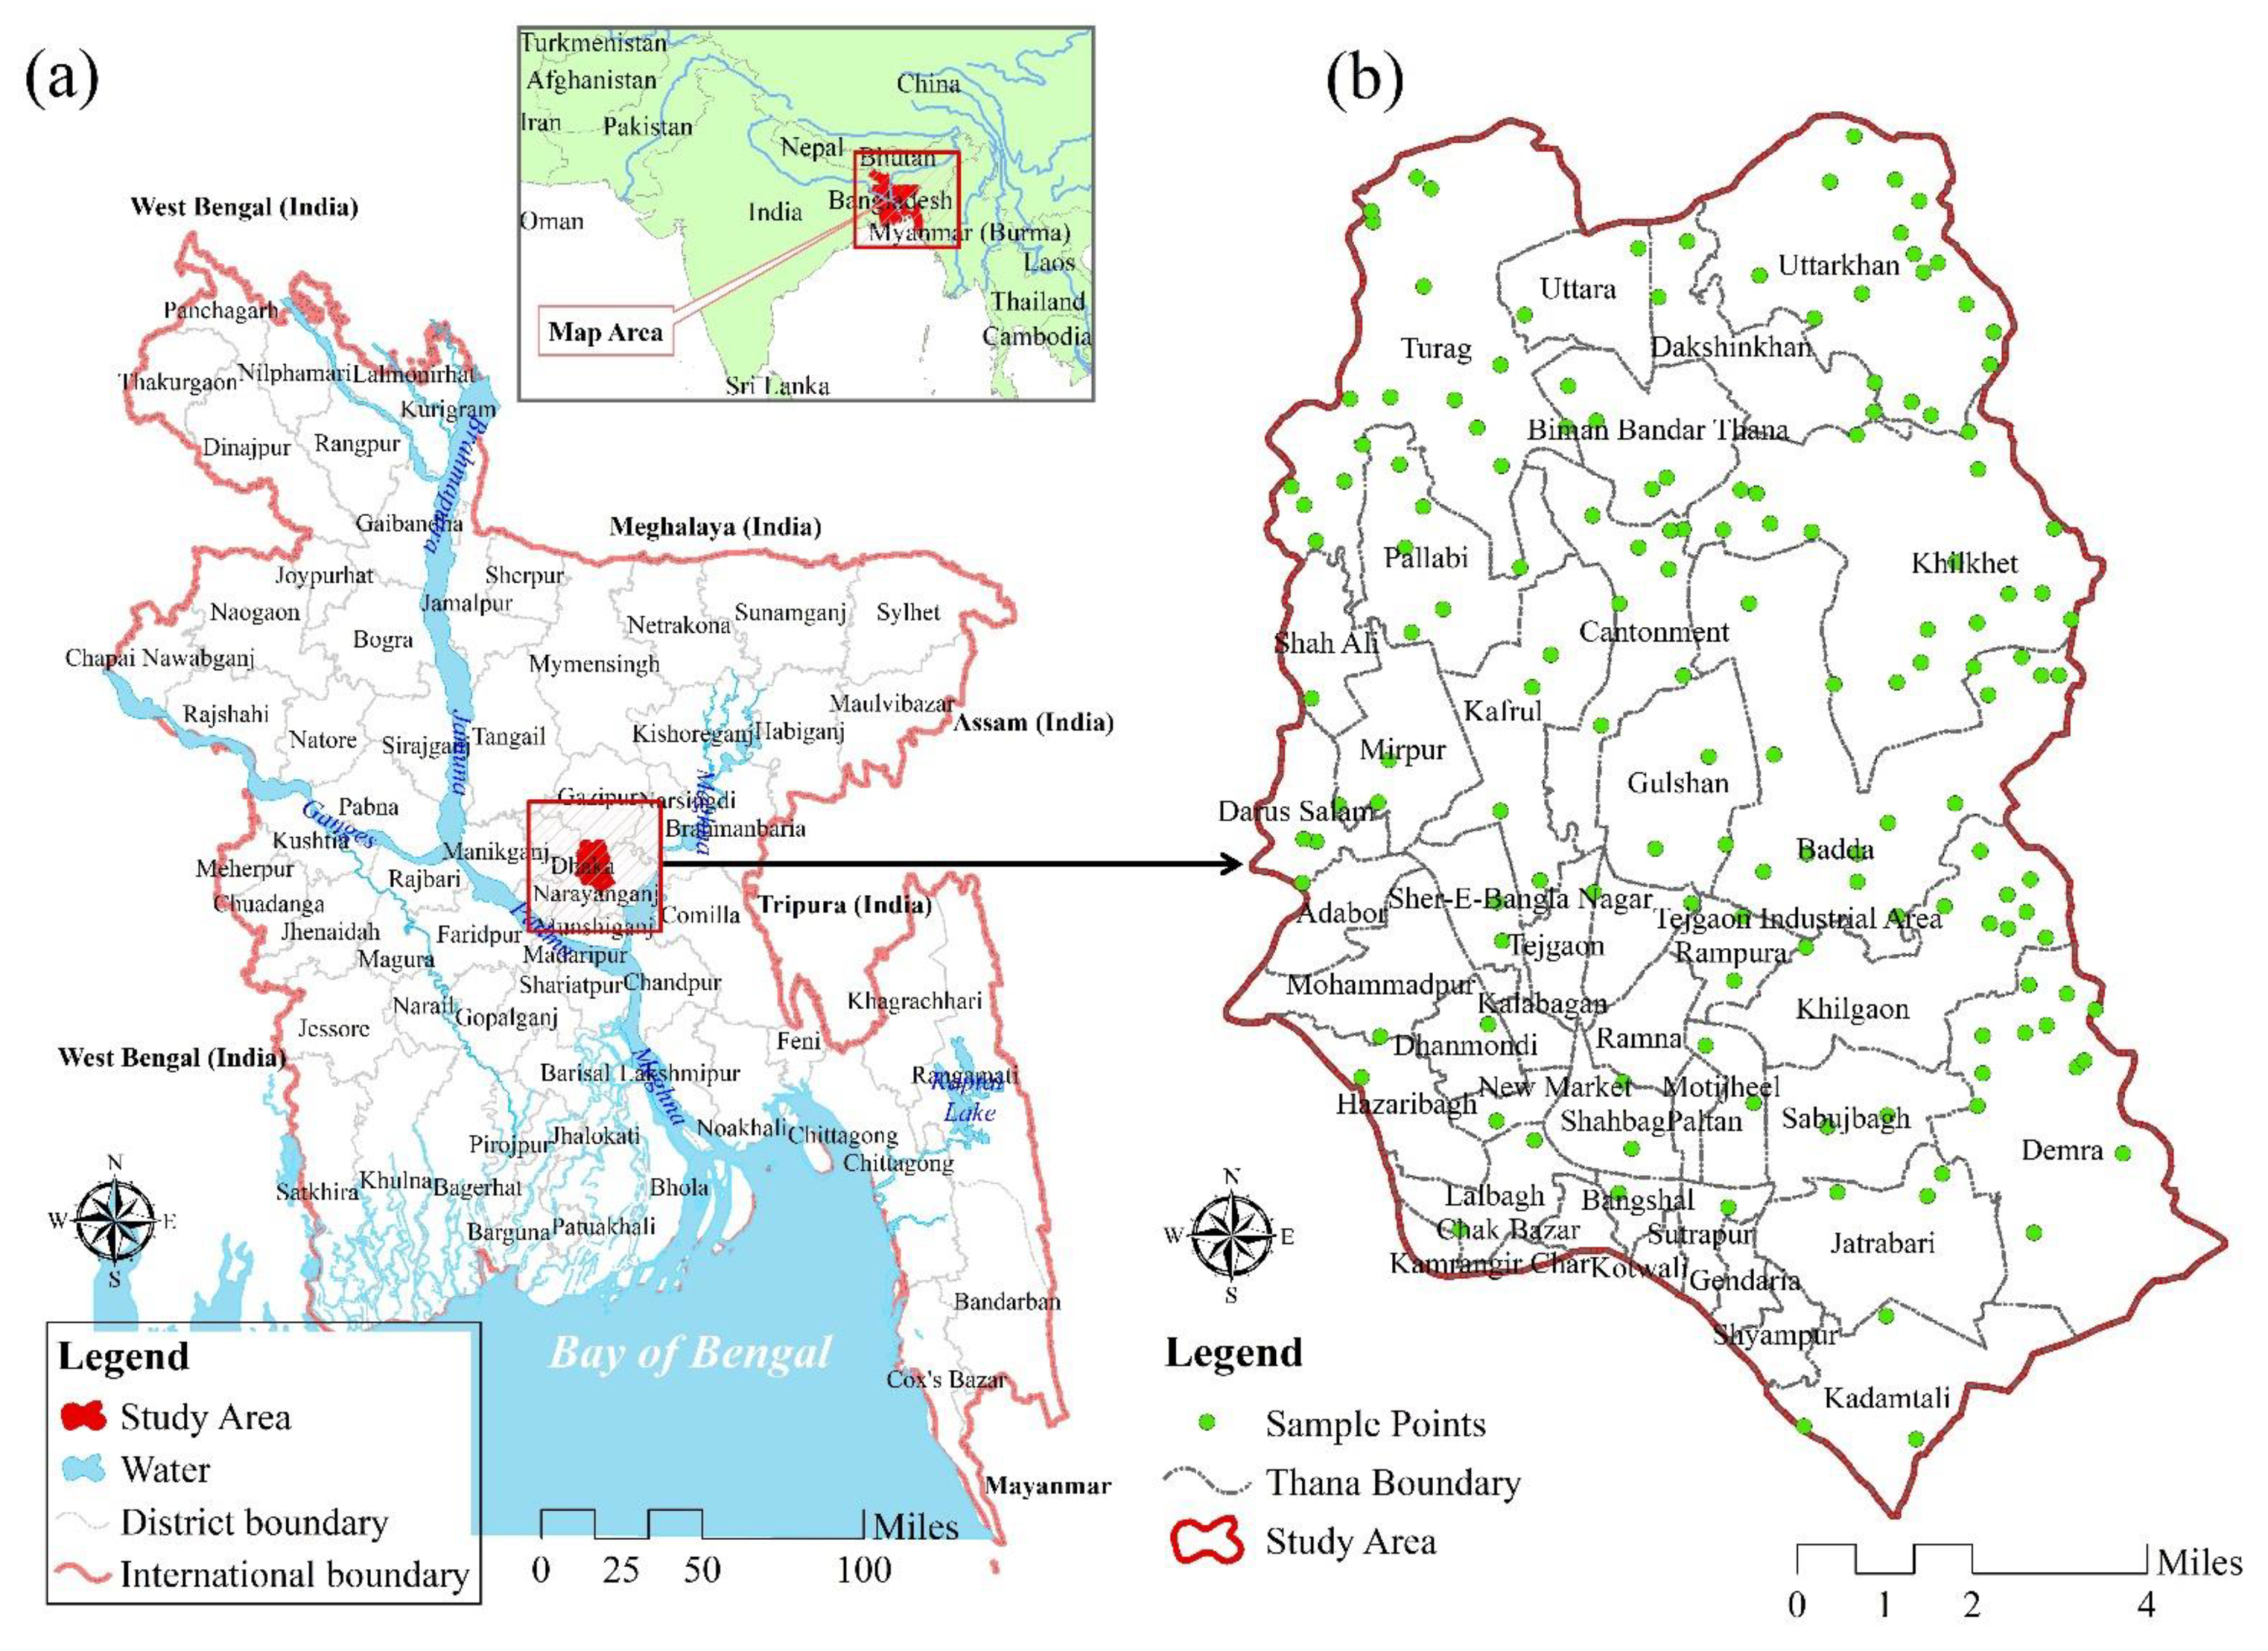
2.1. Description of the Study Area

The Dhaka Metropolitan Area (DMA) was selected as the study area for research (Figure 1). DMA, which is situated on the eastern bank of the Buriganga River, is, at present, projected to have a population of 21,741,000 and an area of 2161.17 sq. km [56]. The geographical location of DMA is at 23°43′0″ North latitude and 90°24′0″ East longitude. The DMA area is covered by a total of 41 thana and the study has been built up with the local level variation of urban heat islands, which is also an ideal example for showing the variations of urban heat vulnerability. Dhaka has been experiencing heatwaves for recent years and this study has been conducted to analyze vulnerability on a macro scale. Urban areas have increased by 20.52% in the DMA from 2000 to 2020 [57]. On the other hand, Land Surface Temperature (LST) increased by 2° from 1990 to 2011 [58].

2.2. Materials

In the present study, to develop a HVI model, various data was used. The authors used a Landsat 8 (OLI) image (date: 18 April 2021) from the United States Geological Survey (USGS) website to identify Land Use/Land Cover (LULC) and calculate LST and other indices (Spatial resolution: 30 m). The Bangladesh Bureau of Statistics (BBS) provides demographic and socioeconomic statistics. The Bangladesh Metrological Department provided metrological statistics (BMD). The authors used the National Geographical Data Center (NGDC) data on nighttime lights (NTL).

2.3. Preparation of Parameters for HVI Modeling and Their Rationale

In the present study, based on previous literature review, the authors selected twenty-six parameters in terms of physical, land use, land surface temperature, and socio-economic related parameters from different sources. Except for satellite-derived parameters, the authors obtained all parameters directly from different sources in vector format. Then, the authors used the ‘vector to raster’ tool of ArcGIS software to convert the vector format to a raster format. The authors made all parameters in uniform resolution. The satellite-derived indices (spatial resolution: 30 m) have been used as a baseline for resampling. Through resampling technique, the authors did uniform spatial resolution for all parameters (30 m). The rationale for choosing the parameters is provided in Table 1. The authors followed several steps to extract satellite-derived parameters.

2.3.1. Satellite Image Processing and Extraction of Parameters

The satellite image was found to have 14.47% cloud cover and 14.36% scene cover during the pre-processing stage. The pre-processing stages include removing cloud cover using ENVI 5.3, radiometric calibration, and atmospheric adjustment.
LST was evaluated from the following perspective: retrieval of Landsat 8 reflectance (OLI) [82]. Following the extraction of Landsat 8, the NDBI (Normalized Difference Built-up Index) was computed [83]. The NDVI (Normalized Difference Vegetation Index) and NDWI (Normalized Difference Water Index) were developed using the technique of [84]. Finally, the analysis of nighttime light data was performed using the technique of [85].

2.3.2. Method for LULC Classification and Validation

The LULC classification was performed using the unsupervised classification technique in ERDAS Imagine software. In the first step, the classification was performed in 75 classes with no extensive prior knowledge [86]. In the next step, the 75 classes were shortened to only 5 classes (i.e., waterbody, vegetation, agriculture, bare land, build-up area) by using the recode tool in ERDAS Imagine and getting the information from Google Earth images as well as the ground. Post processing of the satellite image for LULC was performed using a majority function from the statistical filtering tool for the enhancement of the image [87]. Finally, the kappa coefficient was applied for the accuracy assessment using 150 sample points taken from the classified images as well as Google Earth imagery for the similar locations.

2.4. Heat Vulnerability Index Modeling

Extreme urban temperatures are dangerous to people’s health. Heatstroke, heat fatigue, heat syncope, heat cramps, and even mortality may occur when exposed to extreme temperatures [88,89]. According to one study, heat-related mortality in the New York area might rise by 95% by 2050 if effective risk mitigation measures are not taken [90].
The vulnerability of a population to environmental risks is a function of its exposure, sensitivity, and adaptation capability (Equation (1)). Exposure refers to the intensity and geographical distribution of increased temperatures in the event of heat-related mortality. Extreme heat exposure may vary in time and space because of a changing climate and the urban heat island effect, where some parts of a city are much warmer than others. How effectively a population can deal with increased exposure or the amount to which greater exposure may harm them physically is referred to as sensitivity. For example, people with pre-existing heat-sensitive illnesses, such as diabetes, will be more sensitive to heat than those who do not have a pre-existing medical condition [91]. The climate of a city affects local sensitivity because of acclimatization. For instance, a southern city will be less susceptible to heat than a northern city since these places are more often exposed to greater temperatures because of their close location to the equator [92]. Finally, adaptive capacity refers to a population’s ability to actively reduce or deal with increasing individual exposure [93]. Those having access to mechanical air conditioning, for example, have a more adaptive ability than those without, regardless of heat sensitivity. This trio of components of vulnerability has been shown to affect heat-related morbidity and death, and they may forecast heat risk.
U r b a n   h e a t   i s l a n d   v u l n e r a b i l i t y   i n d e x   f r a m e w o r k = E + S A
where, E is the exposure level, S is the sensitivity level and A is the adaptive capacity level in the equation. These variables contain different socioeconomic and index components that quantify the vulnerabilities in broader sense [93].

Modeling Process

The additive relationship of the indicator was discovered by a principal component analysis to obtain the HVI for the DMA (PCA). Various studies [94,95] adopted this strategy at municipal and national levels. The PCA approach was then used to decrease the dimensionality of these variables. Because all of our variables needed to be on the same scale in order to run PCA, the authors used min-max normalization to standardize them all. All the variables reflect the same direction, implying that as the value increased, so did the susceptibility. The Kaiser–Meyer–Olkin test performed PCA (KMO). To reduce the dispersion of loadings and enhance the understanding of principal components (PCs), the varimax (orthogonal) rotation was performed. The Jolliffe [96] criteria were used to decide how many principal components should be preserved, and PCs with eigenvalues larger than 1.0 were chosen. PC scores were created for the retained components. The scores were normalized to give them a value between the standard deviation below and above the mean of 0. Because no data existed to prove the nonlinearity of the variable and vulnerability, it was presumed that they both had equal influence in determining the DMA heat vulnerability index.

2.5. Spatial Analysis Using the Statistical Method

The study added another dimension by incorporating two powerful statistical techniques. Cluster and outlier (Anselin Local Moran’s I) analysis, as well as a hotspot (Getis-Ord Gi*) analysis, were generated using spatial autocorrelation (Global Moran’s I). In the Dhaka Metropolitan Area, the spatial distribution of the urban heat island vulnerability index is boosted using spatial analysis methods.
Spatial autocorrelation determines whether the expressed pattern is clustered, dispersed, or random [97]. It computes the Moran’s I Index value, as well as a z-score and p-value, to assess the index’s significance. The correlation coefficient limits p-values, which are statistical representations of the area under the curve for the distribution. In this study, z-value > +2.58, p-value < 0.01 was observed using a confidence level of 99%, and a positive Moran’s I index was found. The result showed a visualization of clustered patterns in the heat island Dhaka Metropolitan Area.
Cluster and outlier analysis (Anselin Local Moran’s I) has been used in this study to locate the clusters in our study area [98]. One significant cluster feature with a positive Moran’s I indicates a similar neighboring feature with a high or low attribute value. However, a negative value of Moran’s I indicate dissimilarities with a neighboring feature referred to as an outlier.
Hotspot analysis of the study area has been calculated using Getis-Ord Gi* statistics, which provide a z-score and p-score to identify cluster variation [99]. A high z-score > 1.65 with a low p-value < 0.1 shows the hotspot area. However, the reverse scenario explains an area to be a cold spot.

3. Results

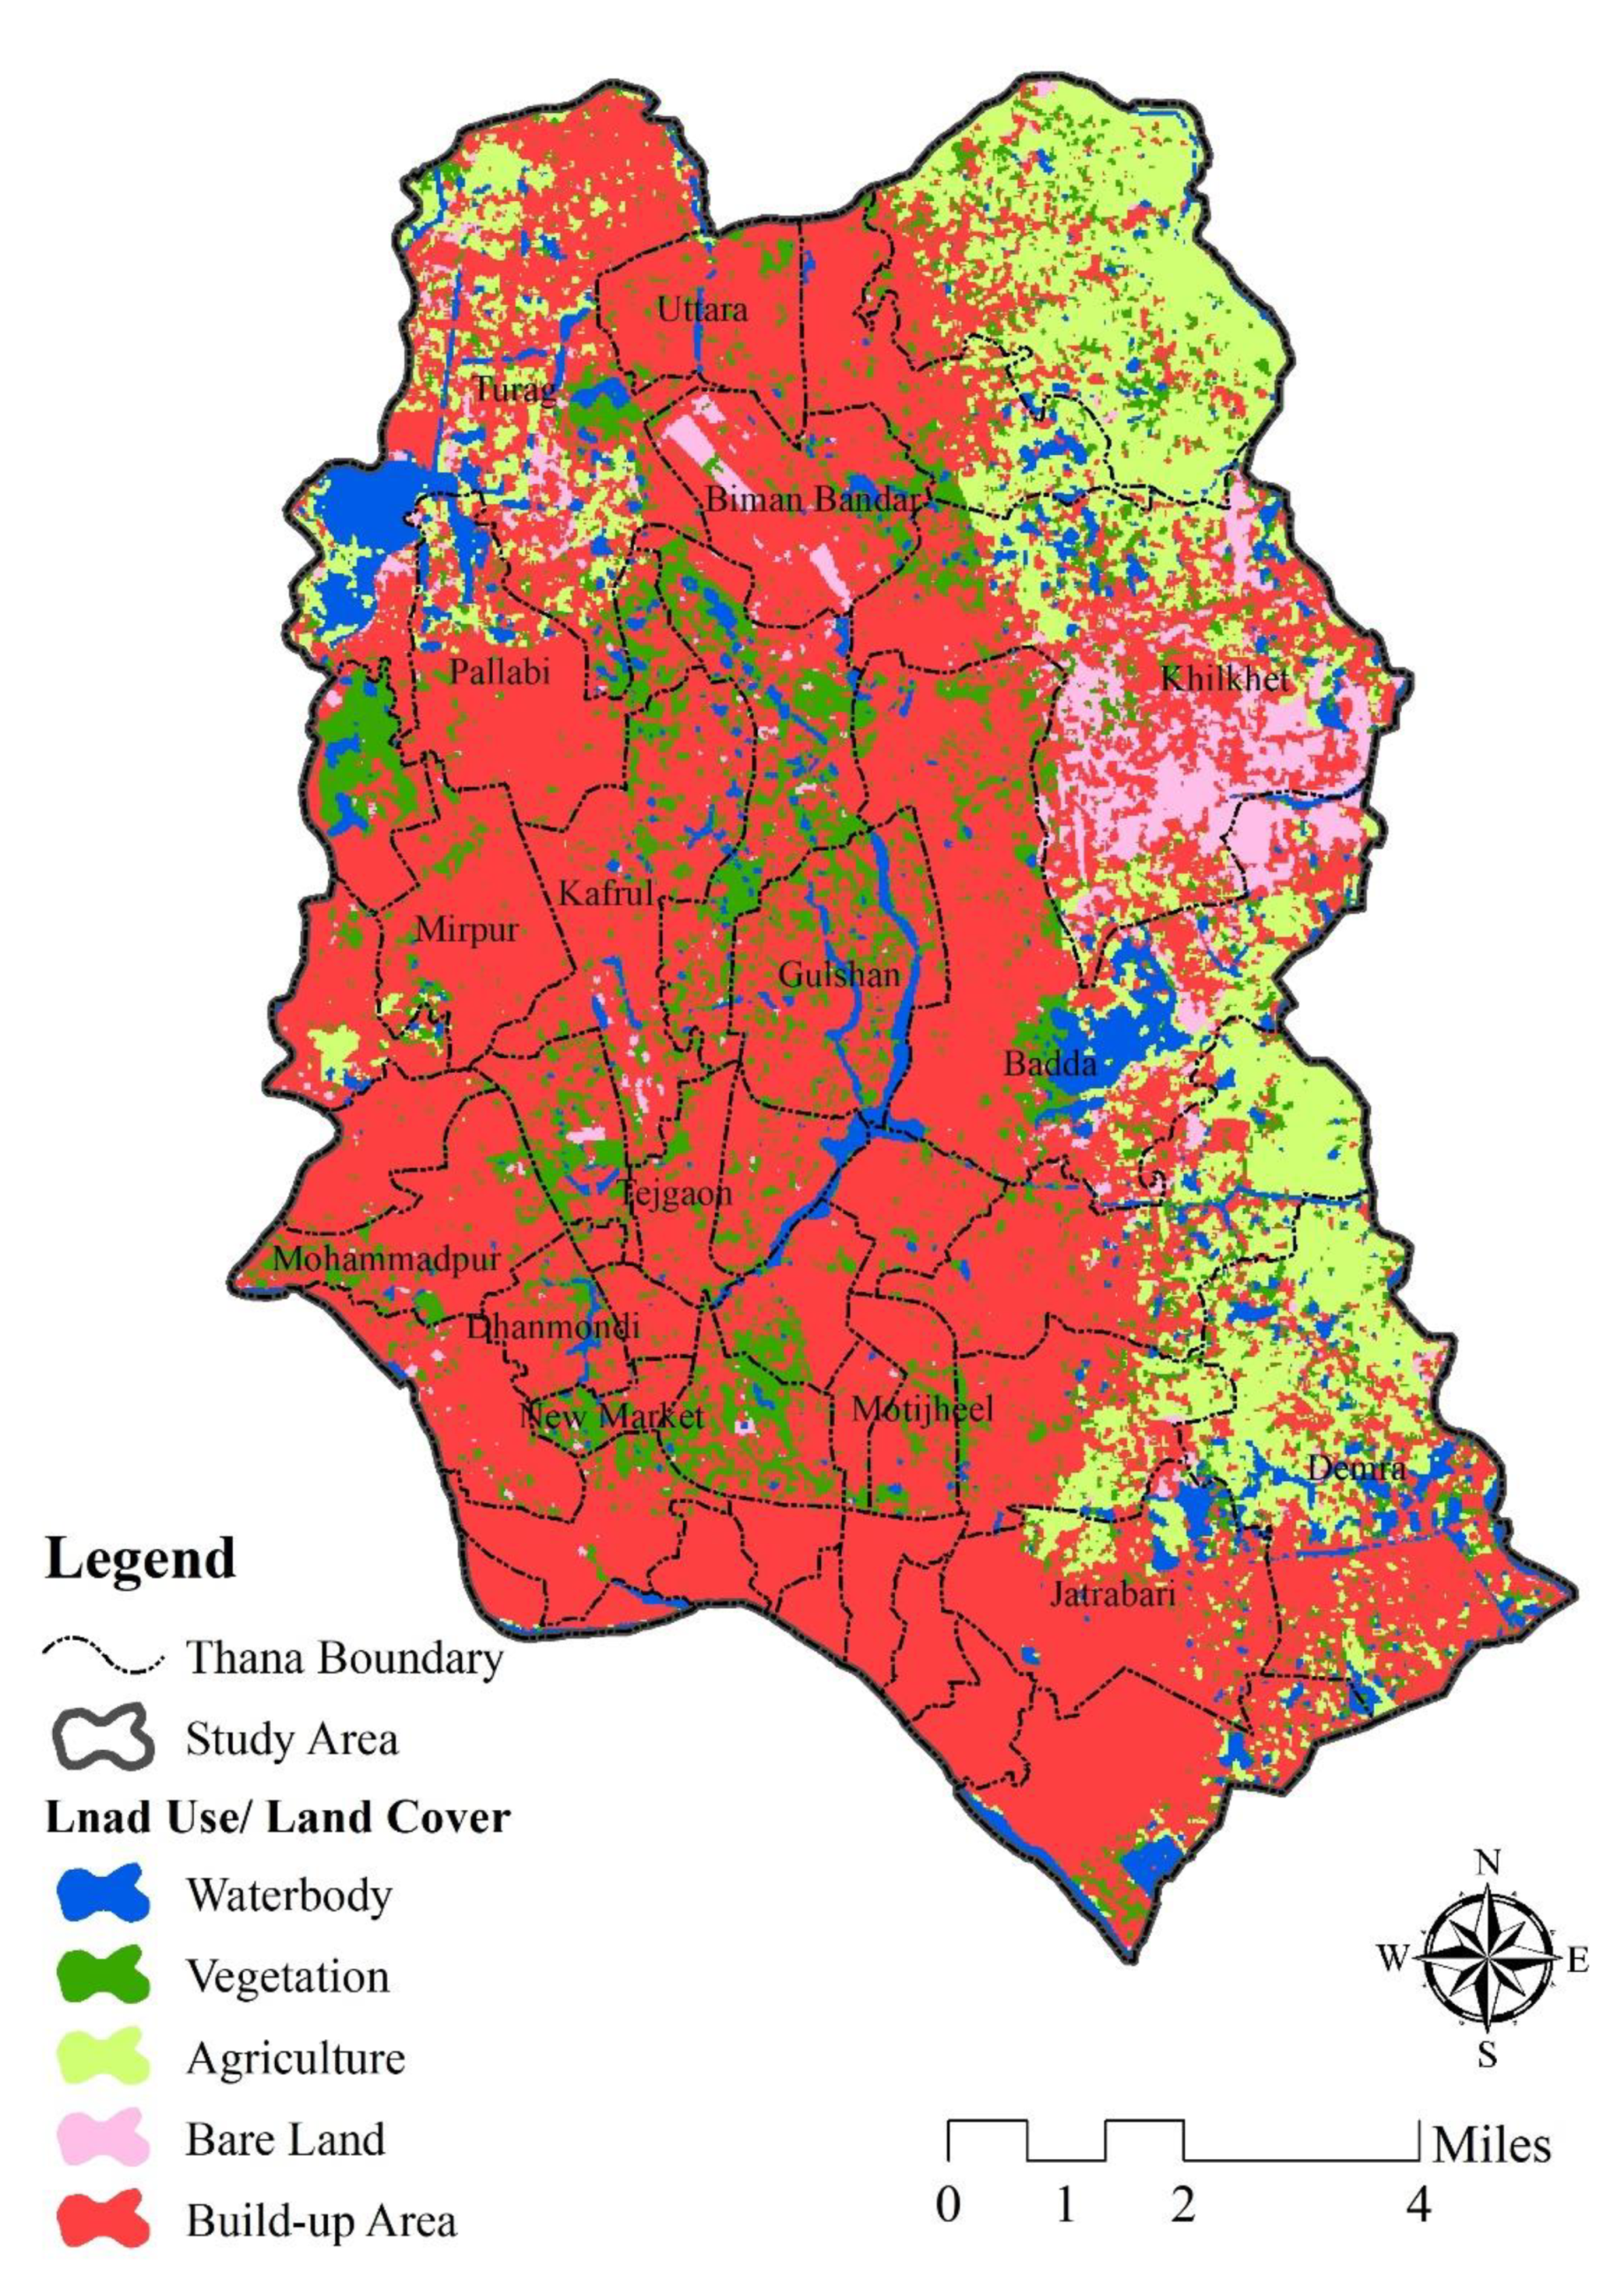
3.1. Analysis of LULC Classification and Accuracy Assessment

Table 2 shows the distribution of LULC in the study area in 2021. As found by the result, the build-up area was the dominating LULC type with 188.77 km2 (i.e., 63.07%) in the study area. 15.11% and 10.80% of the areas were found for agriculture and vegetation, respectively. At the same time, 21.01 km2 and 11.97 km2 areas were found for water bodies and bare land, respectively. Figure 2 illustrates the spatial distribution of LULC types in the study area. Agriculture and bare land were in the western part of the study area.
The accuracy assessment using kappa coefficient showed that the accuracy of the classified LULC map is satisfactory in this study. The accuracy assessment has been done to evaluate the performance of the classification technique as well as to examine whether the LULC classification has been done correctly or not. Studies have pointed out that an accuracy of greater than 80% is satisfactory in the LULC classification [33,40]. The user’s and producer’s accuracy of the classified LULC map were 90.01% and 87.36%, respectively, while the overall accuracy was 88.17% with the corresponding kappa coefficient of 0.851.

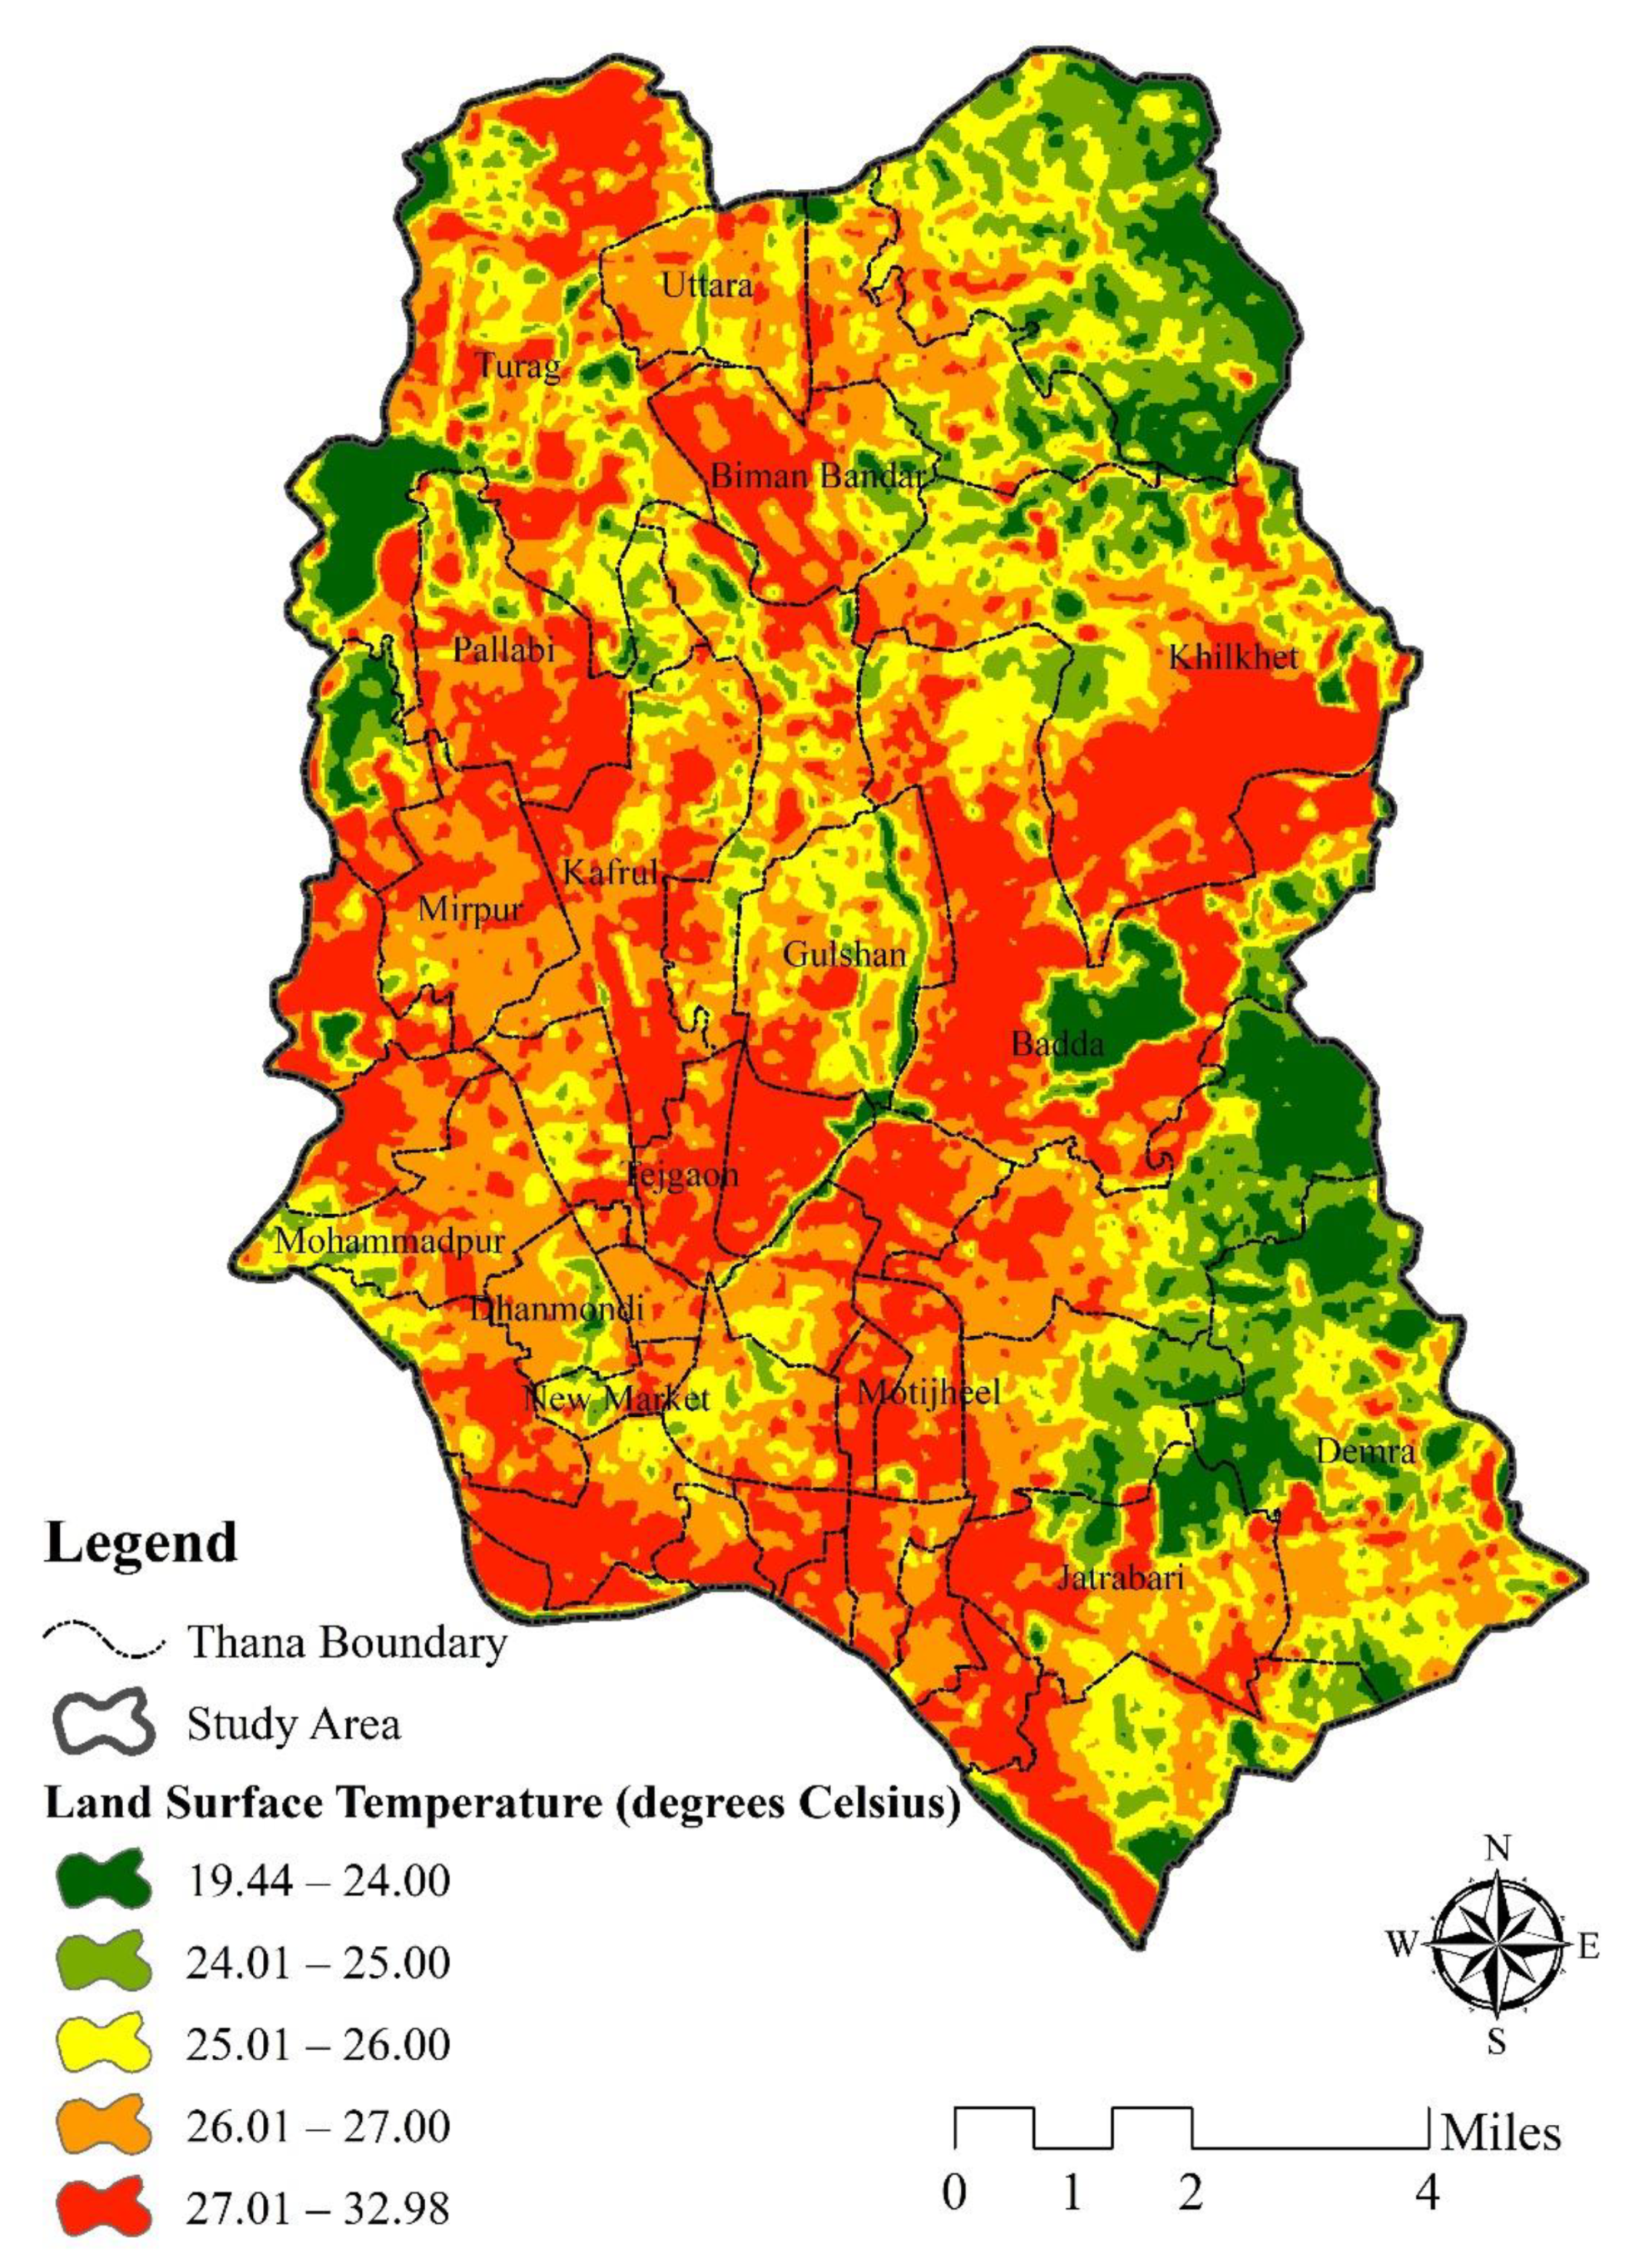
3.2. Modeling the Urban Heat Island

The spatial distribution pattern identifies the LST variability in all the thanas of the Dhaka Metropolitan Area (Figure 3). To balance the compatibility of the weather temperature of the heat island, temperatures > 27 °C were distributed as a higher range of temperature, and temperatures of 26 °C were distributed as a lower range of temperature. Analyzing the thana temperatures, the mean LST was identified as 26.53 °C with a standard deviation of 0.67. The maximum and minimum temperatures were observed at 27.62 °C and 24.74 °C, respectively. The Tejgaon Industrial Area of Thana was identified as having the highest temperature of 27.62 °C. The Tejgaon industrial area was observed close to the core of the Dhaka Metropolitan Area, and the lands are mainly used for industrial and commercial purposes with a high range of built-up areas. However, paltan and syampur thana also had similar temperature patterns of 27.51 °C and 27.47 °C, respectively. On the contrary, the lowest temperature was observed in Uttar Khan Thana, with a value of 24.74.

3.3. Principle Component Analysis

3.3.1. Statistical Analysis of Variables of Exposure

Exposure variables were observed using the extraction method of principal component analysis (PCA) and the varimax rotation method with Kaiser Normalization. The rotation converged, followed by three iterations, and from the KMO and Bartlett’s test, the Kaiser–Meyer–Olkin index was found to be 0.64. Only two principal components were chosen to be significant in the analysis (Table 3). Principal component 1 has an initial eigenvalue of 1.59, explaining 52.85% of the total variance. However, principal component 2 has an initial eigenvalue of 1.04, explaining 34.63% of the total variance. The cumulative (%) of the rotation sum of all the components is 87.48% of the total variance in the data. A higher score observed in the dominating variables of the principal component 1 included: population concentration (0.892) and LST (0.889). In principal component 2, only one dominant variable was found (Table 4).

3.3.2. Statistical Analysis of Variables of Sensitivity

For the sensitivity variables, two methods are combined, identified as the extraction method and the varimax rotation method, to complete the analysis. The KMO index was identified with a value of 0.848. The final result of the rotation has been found with two factors where the eigenvalue > 1. The first principal component was observed with a higher eigenvalue of 9.199, explaining 70.76% of the total variance. Significant, dominant, and relevant variables in the first component included: household (0.986); accessibility to water (0.985); female (0.981); very young population (0.967); employed (0.967); elderly population (0.939); and disabled people (0.937). The second principal component has an eigenvalue of 1.486, explaining 11.43% of the total variance. Only two dominant and relevant variables were found and extracted from the second component: floating people (0.753) and kaccha structure (0.731). Finally, the cumulative (%) of the rotation sum of all the components was 82.19% of the total data.

3.3.3. Statistical Analysis of Variables of Adaptive Capacity

The KMO index showed that the value was found to be 0.701. The value has reached statistical significance (p-value = 0.001), indicating the suitability of the factor analysis process. The result of the rotation analysis revealed three factors with eigenvalues over 1, and it took the analysis five iterations to complete the rotation. Following the varimax rotation with Kaiser Normalization, the first principal component was found with a higher initial eigenvalue of 5.20, which explains 51.92% of the total variance. The second and third principal components had a comparable value of 1.81 and 1.03, explaining 18.07% and 10.36% of the total variance. Finally, the cumulative (%) of the rotation sum of all the components was 80.35% of the total data. The principal component showed a very straightforward and clear structure. The relevant as well as dominating variables in the principal component, along with higher scores, included literate (0.932), a household with electricity (0.926), NDVI (−0.911), and pucca structure (0.790). However, only two dominating variables were found in principal component 2: relative humidity (−0.798) and vegetation (0.766). Health institution (0.937) was the only relevant score found in principal component 3. The authors calculated all the principal component factor scores using the Anderson–Rubin method.

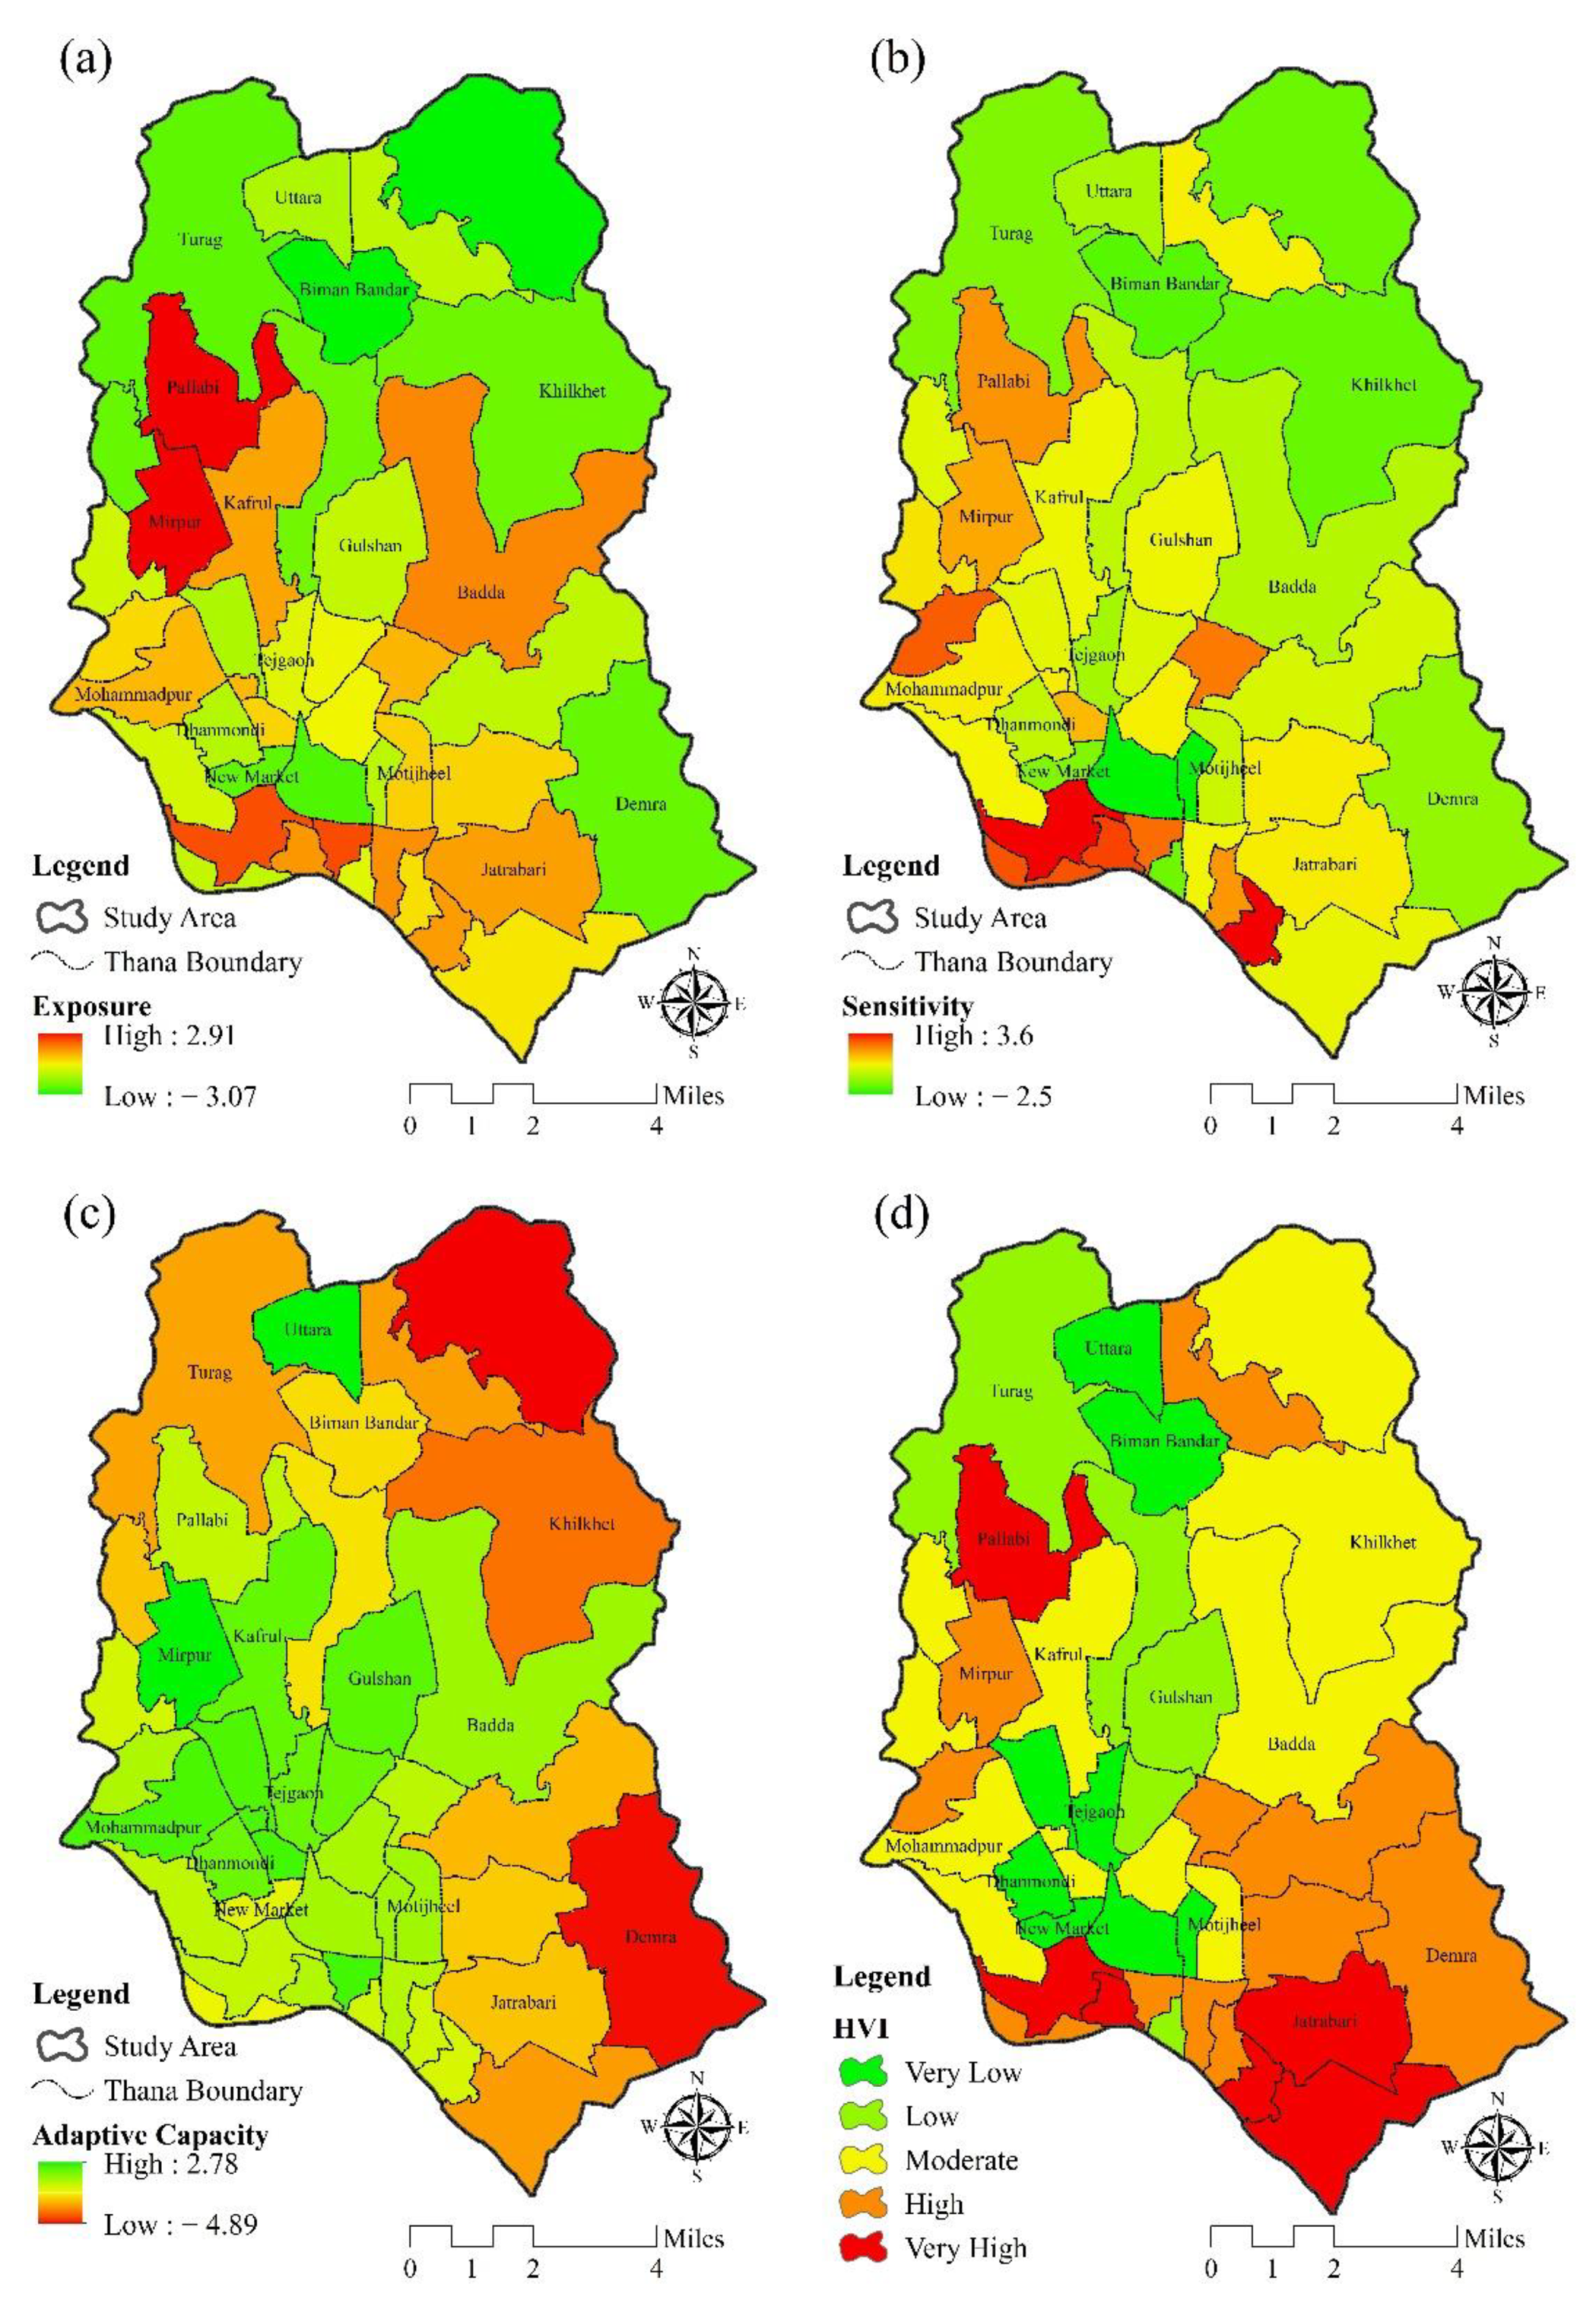
3.4. Modeling Spatial Distribution Pattern of HVI in Dhaka Metropolitan Area

The HVI index was visualized to show the spatial distribution pattern of the heat island. The authors interpreted it using three variables: exposure, sensitivity, and adaptive capacity (Figure 4a–c). The authors obtained a positive correlation between exposure and HVI and sensitivity to HVI. Exposure and sensitivity have coefficient values of 0.62 and 0.80, respectively (Figure 4a,b). However, adaptive capacity had a negative correlation with HVI with a coefficient value of −0.26. According to the index, thana in the Dhaka Metropolitan Area has been categorized into five classes: very low, low, moderate, high, and very high (Figure 4d). The authors observed Lalbagh thana with the highest HVI index value of 1. Shympur, Pallabi, Chak Bazar, Jatrabari, and Kadamtoli thana have also been identified within the very high HVI range (0.70–1.00) with high vulnerability. However, thana, which comprises very low HVI index values, are demarcated within (0.00–0.23). The Lalbagh thana was found to have a very low adaptive capacity because of population concentration, build-up area, number of households, and value of LST (Figure 4d). Again, the Gulshan area has a very high adaptive capacity and is indexed as low HVI because the area has many health institutions, a high number of literate people, adequate electricity, good roads and highways, and pucca structures. A total of 11 thanas among 41 were observed to have a moderate HVI value, allowing a stable environment for some more years.

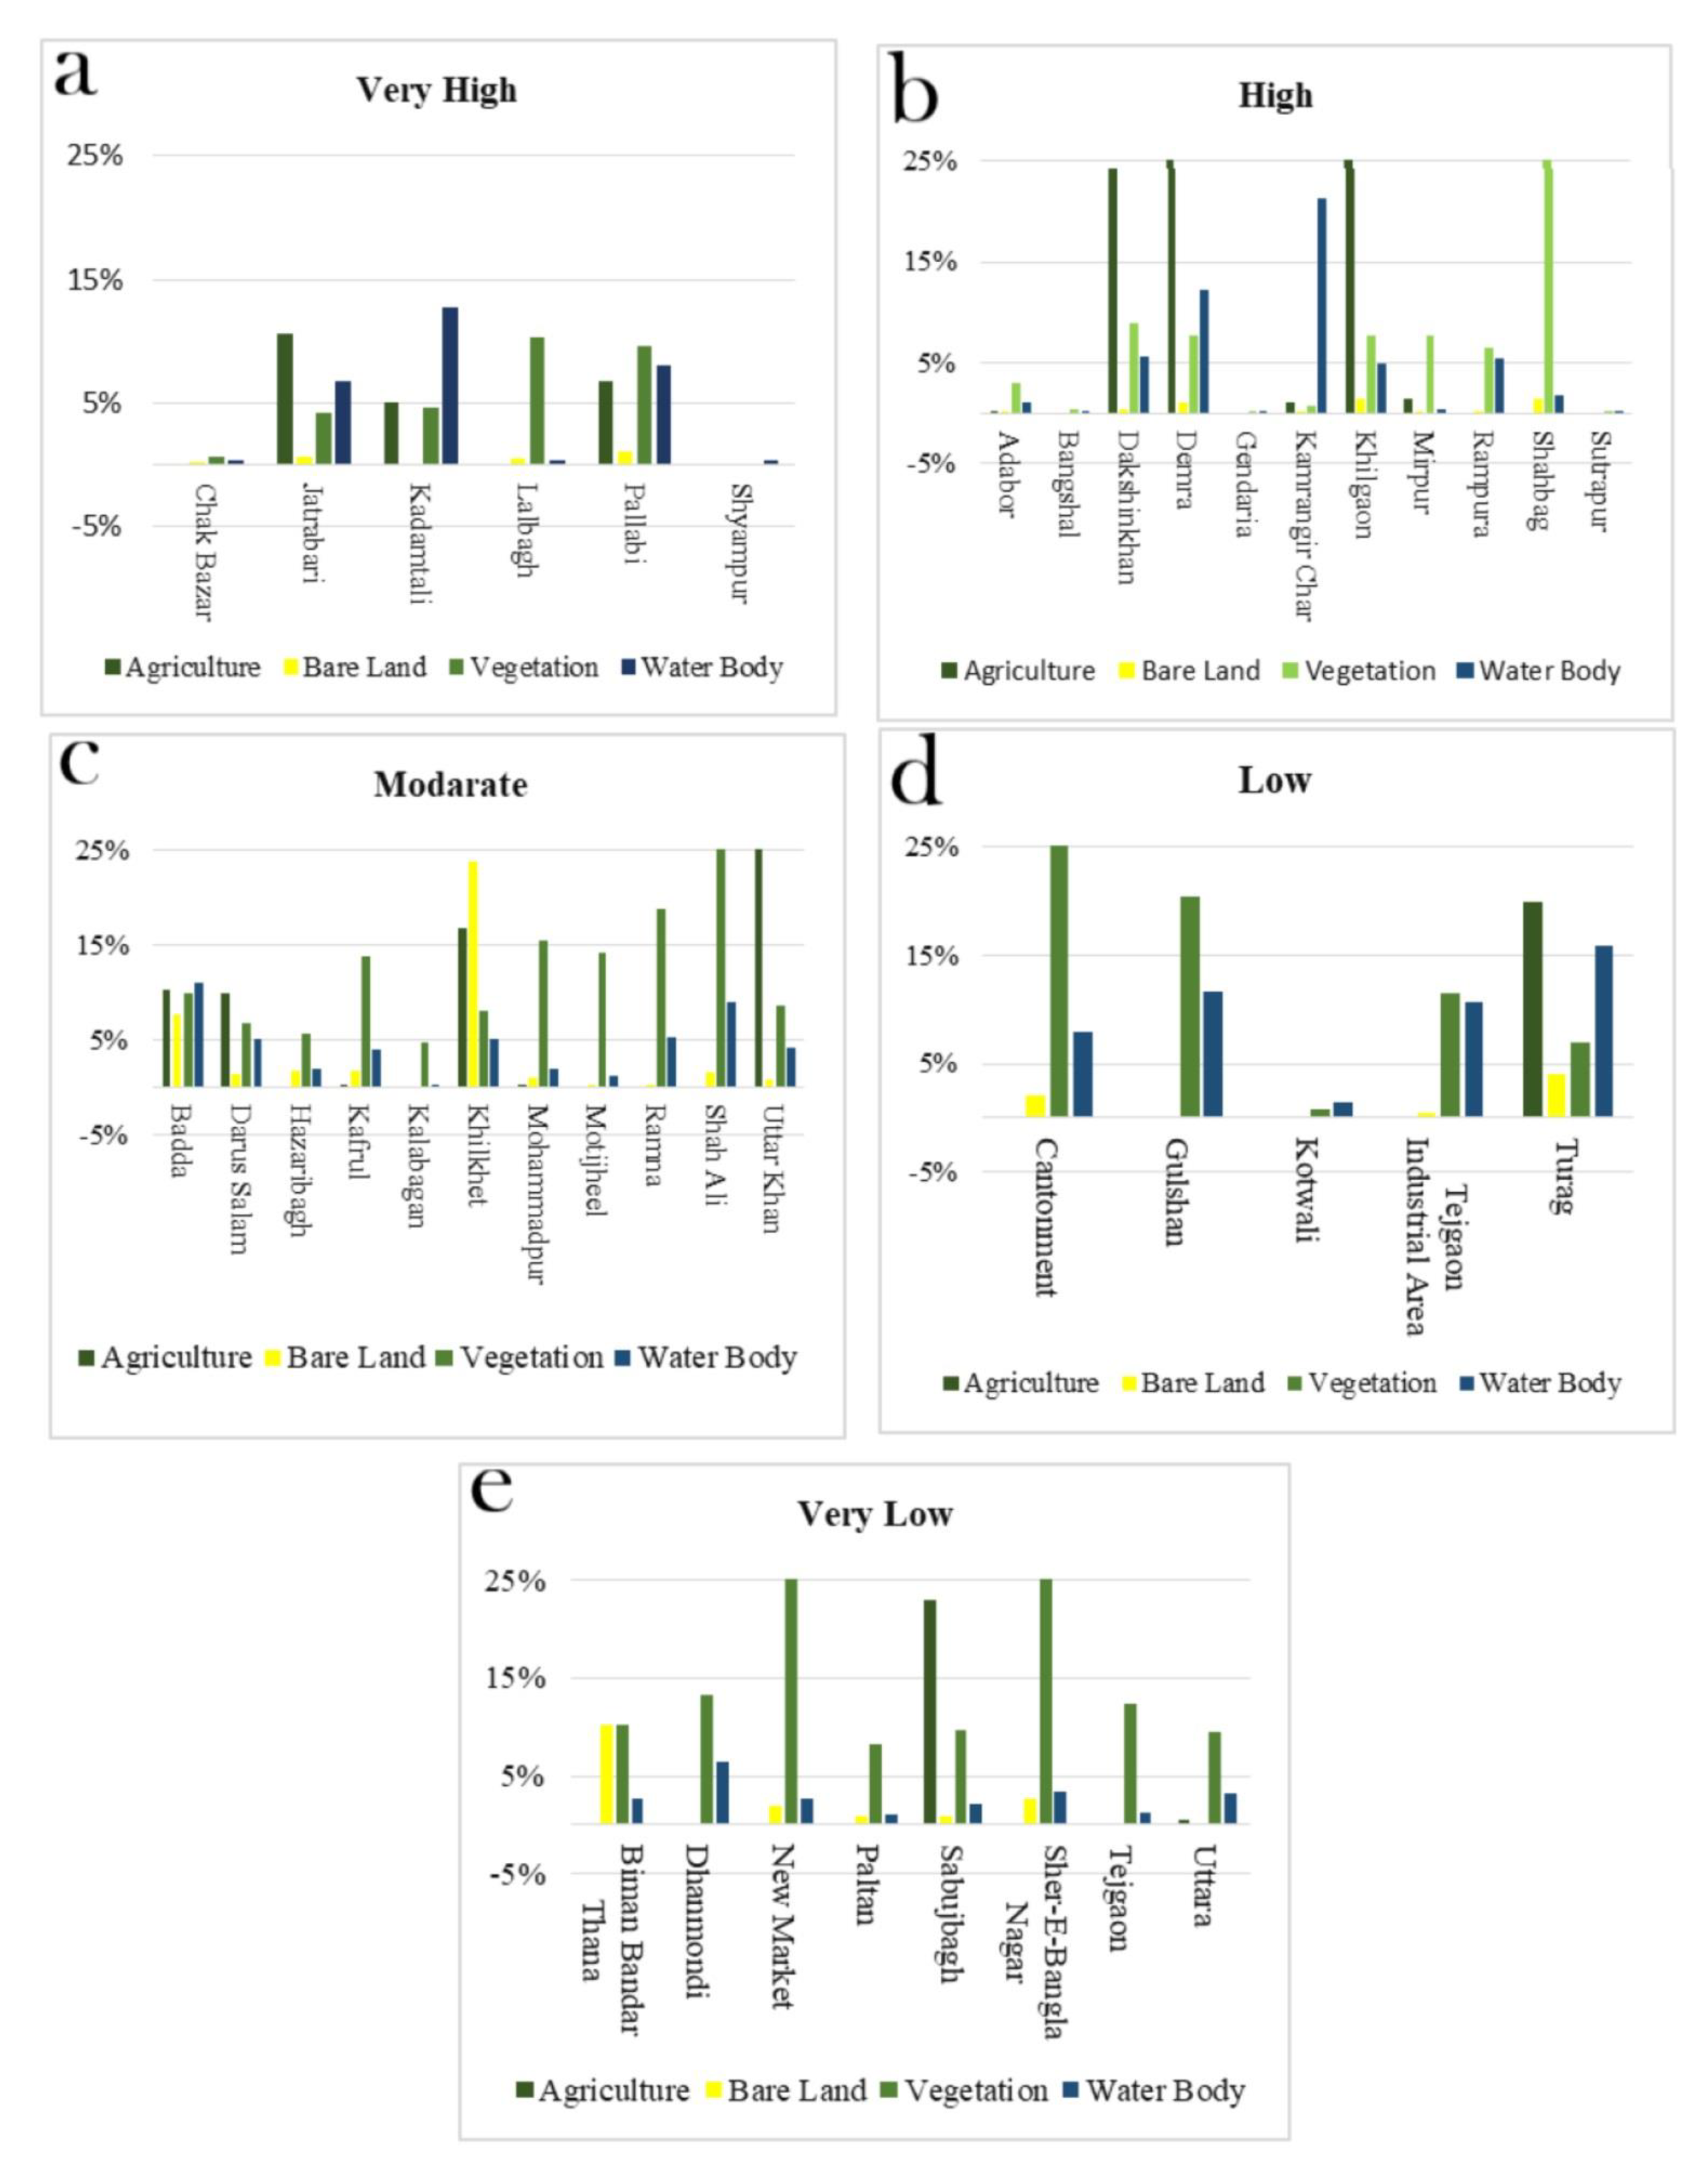
3.5. Thana-Based Land Use Land Cover Variation of Urban Heat Island Vulnerability Index in Dhaka Metropolitan Area

The LULC of Dhaka metropolitan has been detected with extreme built-up areas compared to other land classes (i.e., water-body, bare land, agriculture, and vegetation). The water-body has decreased to 25%, and built-up areas were removed from the chart below. The urban heat island vulnerability index is categorized into five classes: very high, high, moderate, low, and very low. Thus, the LULC classes were calculated according to the thana area for each category. From Figure 5a, the very high range of HVI shows only 0.60% vegetation and 0.41% of waterbodies in Chakbazar, which is highly vulnerable to heatwaves. Chakbazar, Shyampur, Jatrabari, and Kadamtali have a very low value of agriculture area. From Figure 5b, high values of HVI are concentrated in 11 thana areas of the Dhaka Metropolitan Area. The Shahbag thana area was found to have a very high level of vegetation (40.26%), and the Bangshal, Gendaria, Kamrangir char, and Shutrapur areas have the lowest vegetation recorded, facilitating the high score of HVI in these areas. In Figure 5c, the highest vegetation value was recorded in Shah Ali Thana with a 41.52% score. In this category, the land classes of each thana have comparatively similar values. Darus salam, Khilkhet, Ramna, Uttarkhan are calculated with many water bodies. Figure 5d,e show the low and very low categories of HVI where Dhanmondi and Gulshan have been identified with a very high range of vegetation. Thana areas with the highest HVI are vulnerable because they have a very low amount of agriculture and vegetation. Moreover, the very low value of bare land also indicates that the future prediction of increasing buildup areas is on a streak in the Dhaka Metropolitan Area.

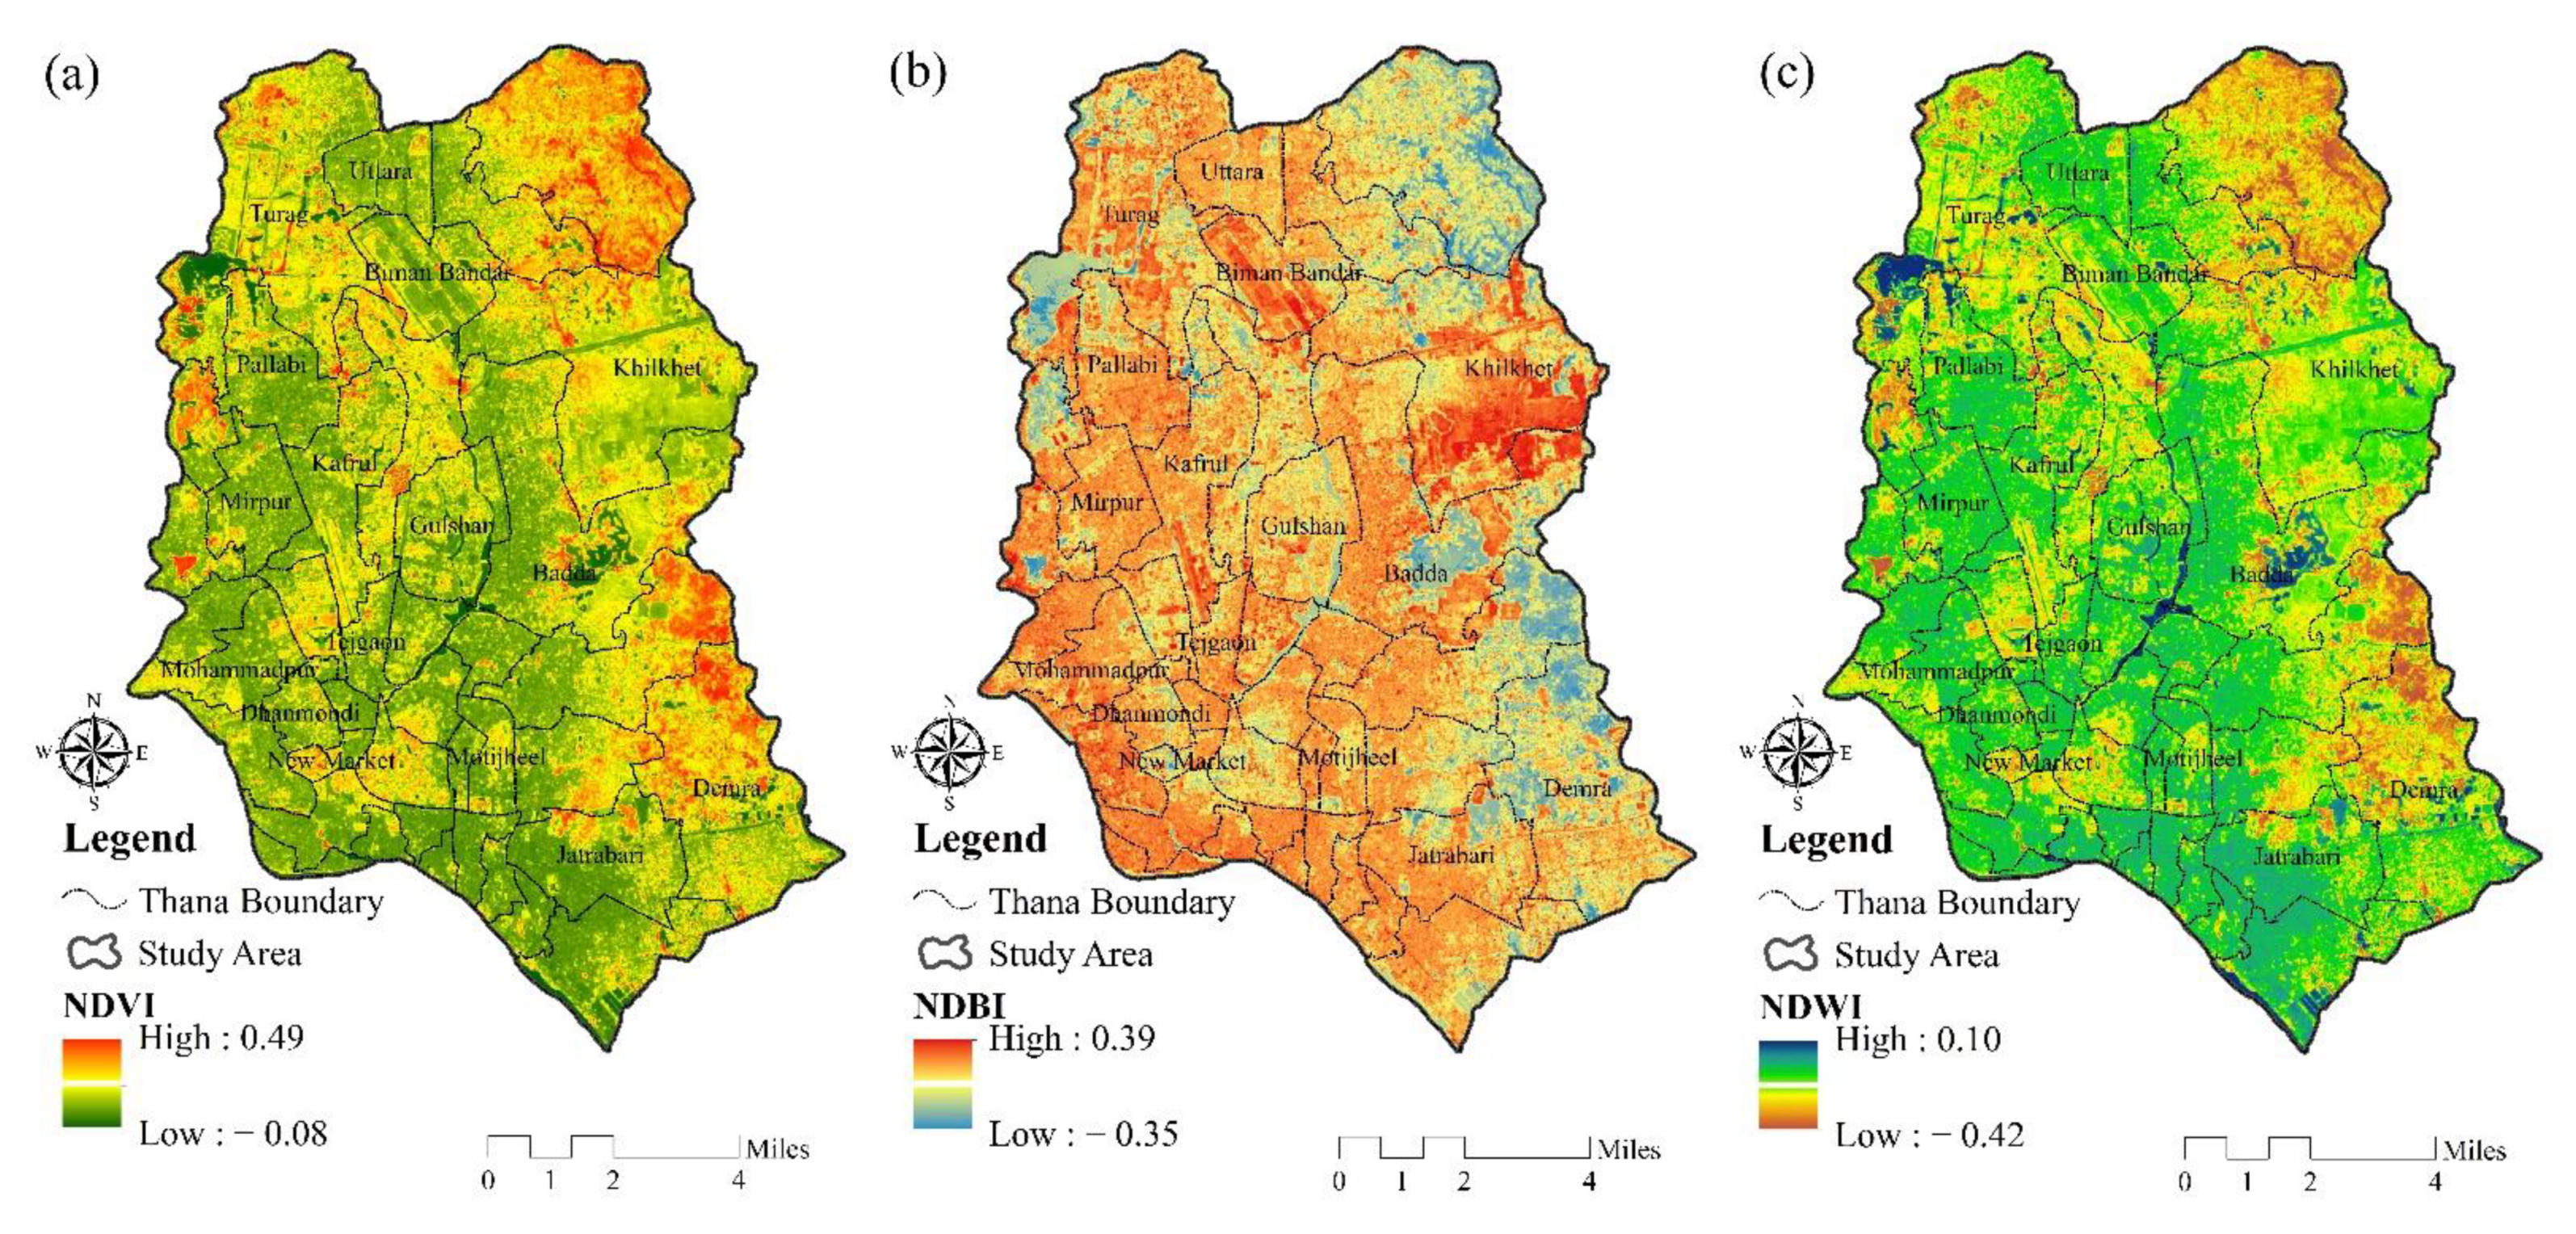
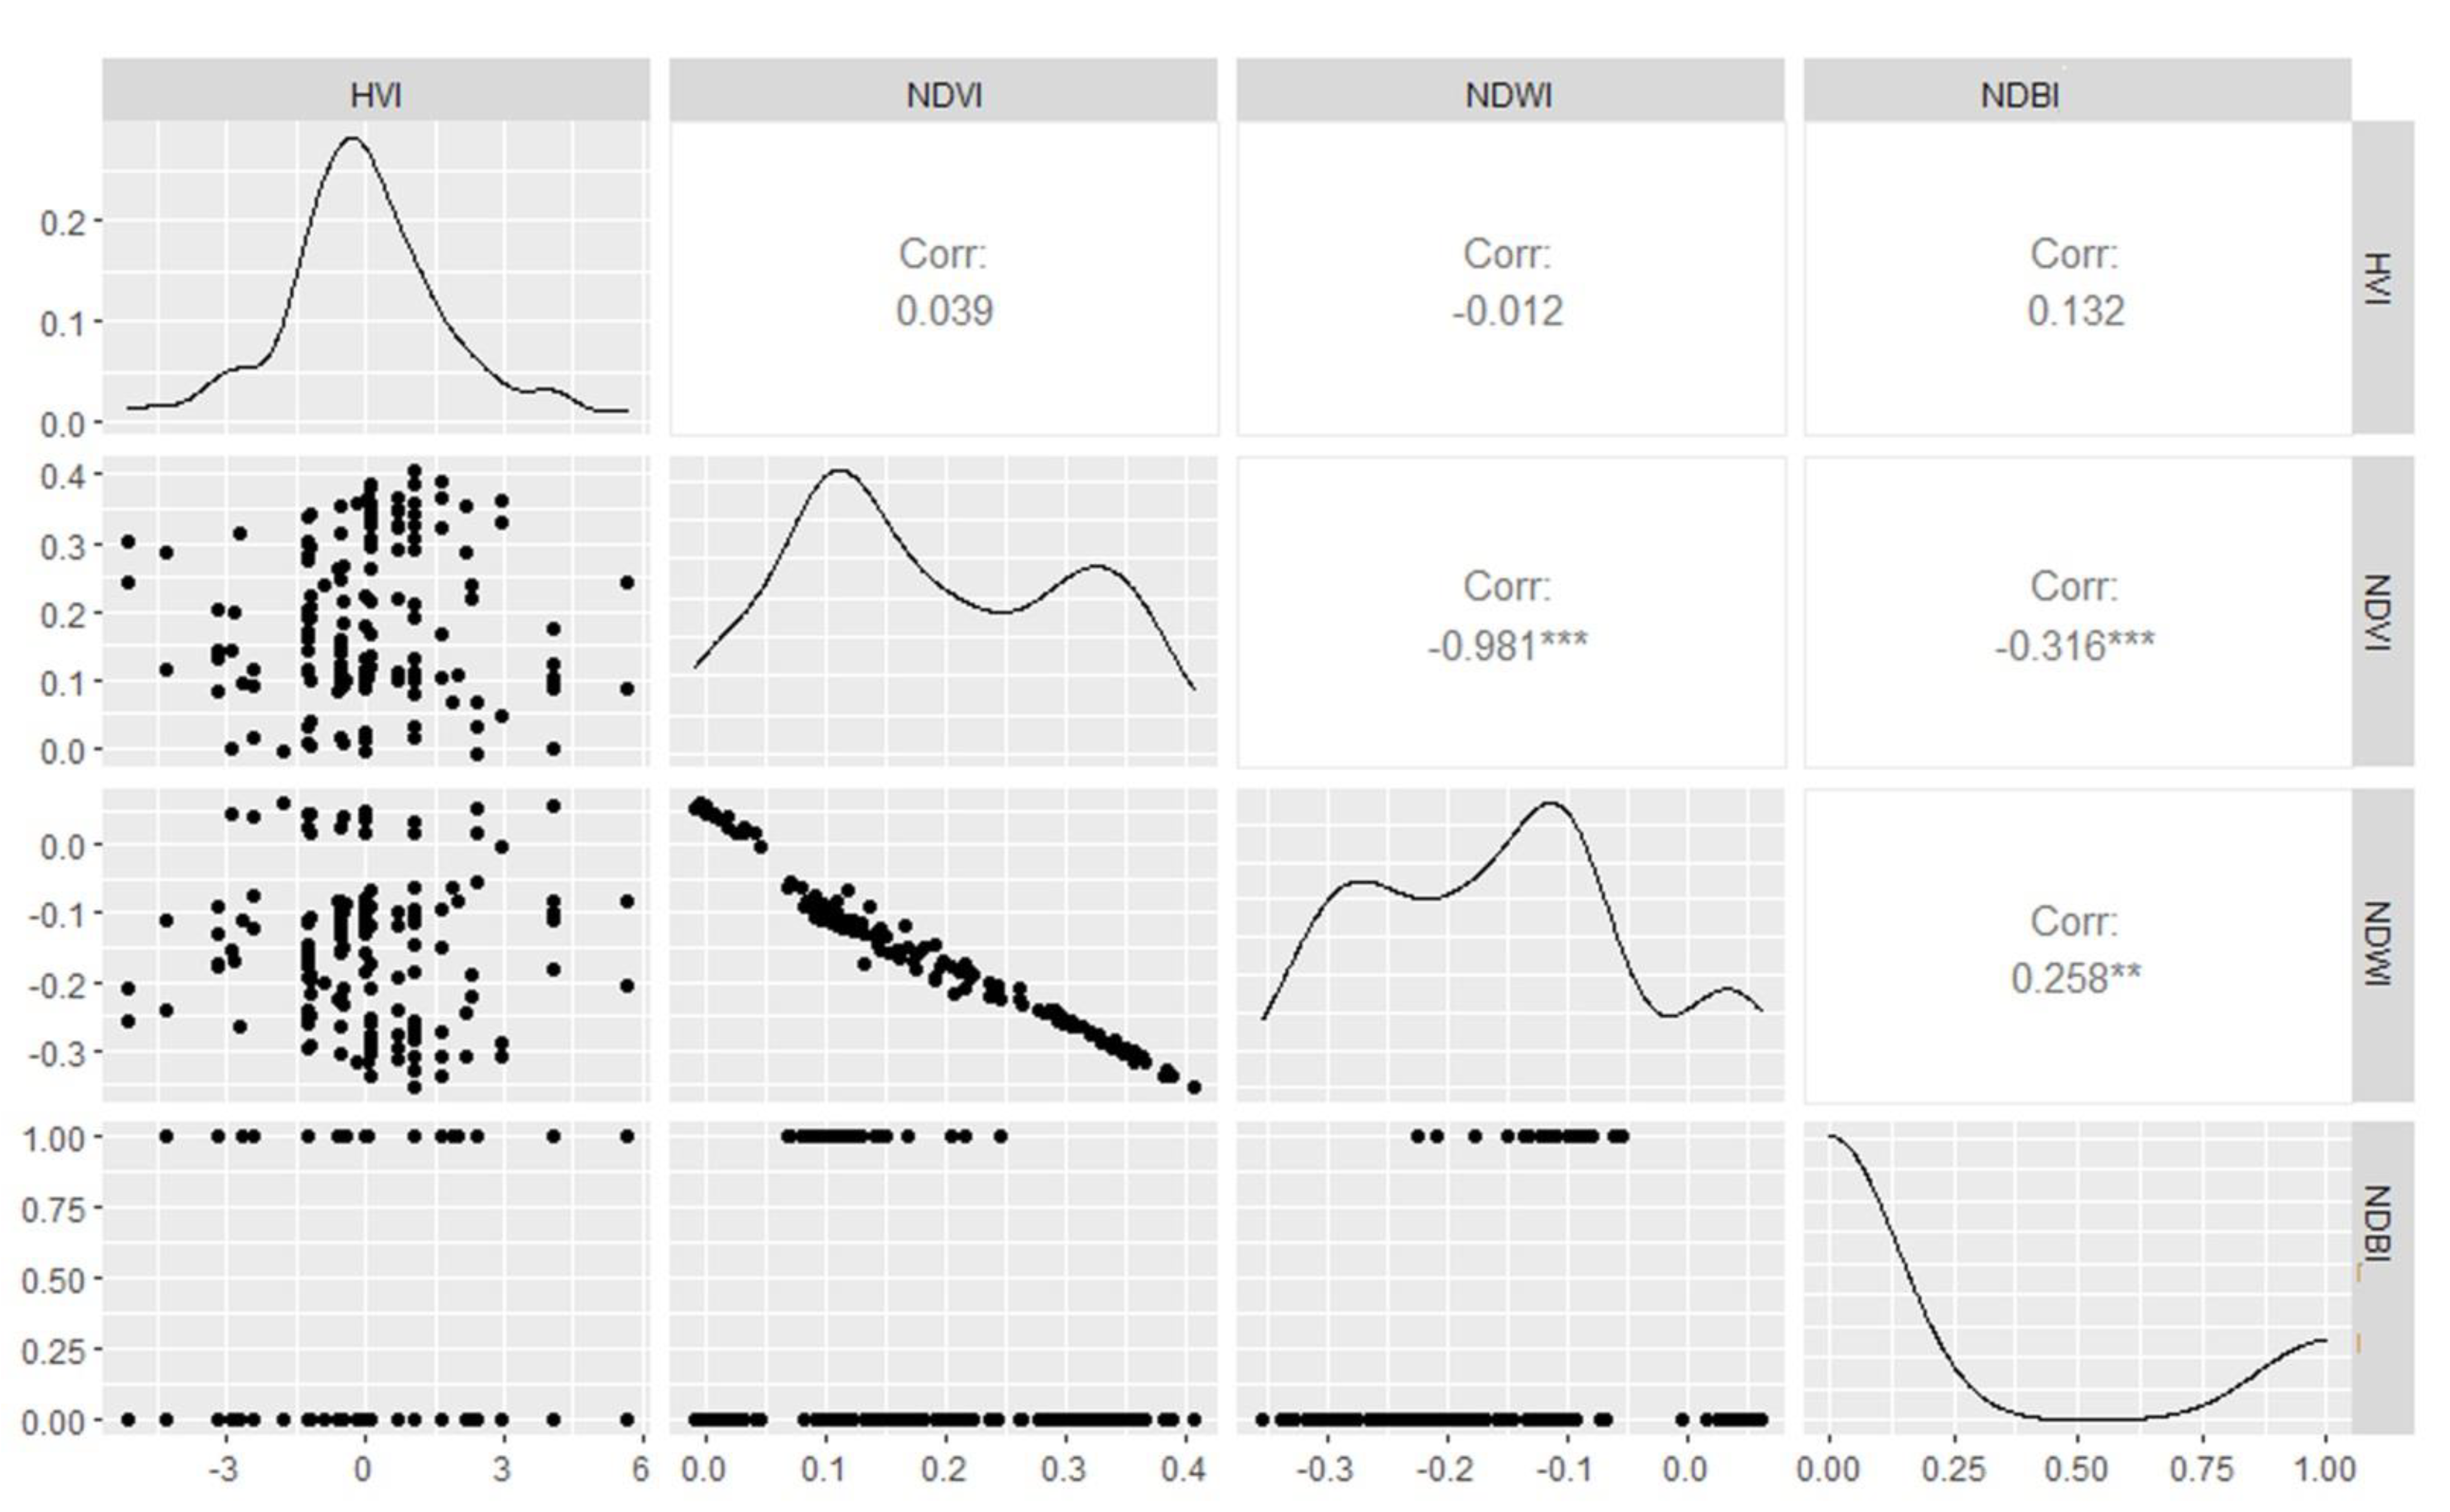
3.6. Identifying Correlation of NDVI, NDBI, and NDWI with Urban Heat Island Vulnerability Index in Dhaka Metropolitan Area

NDVI, NDBI, and NDWI are three biophysical parameters that were used in this research study (Figure 6). NDWI shows a negative correlation with HVI, having a score of −0.012, which means HVI has a positive shift if NDWI decreases (Figure 7). However, both NDVI and NDBI have a positive correlation with the heatwave index, having scores of +0.039 and +0.132, respectively (Figure 7). The NDVI range was identified with a scale of 0.07–0.28, and this vegetation index decreases the land surface temperature, which eventually turns the score of the HVI index to low in the Dhaka Metropolitan Area (Figure 6a). NDBI ranges from −0.150–0, and due to increased demand for build-up areas, the Dhaka Metropolitan Area has been congested with structures that raise the HVI score to high levels, leaving the city extremely vulnerable to heatwaves (Figure 6b). Most of the water bodies in the Dhaka Metropolitan Area are congested in specific areas. Figure 6c depicts the high values of waterbodies in the Jatrabari and Shyampur areas, which creates a positive relationship with HVI and accelerates the vulnerability rate. In general, the highly built-up regions with high LST should have a high heat vulnerability index, but the increase of adaptive capacity can reduce the magnitude of heat vulnerability. Therefore, in the present, the places with high buildup and LST also have low HVI because of the presence of high adaptive capacity. For this reason, the present study shows that the NDBI and NDVI had low correlation with HVI. Also, the spatial factors can affect the relationship. If the authors use bivariate local Moran’s I, then the authors can get the actual scenarios.

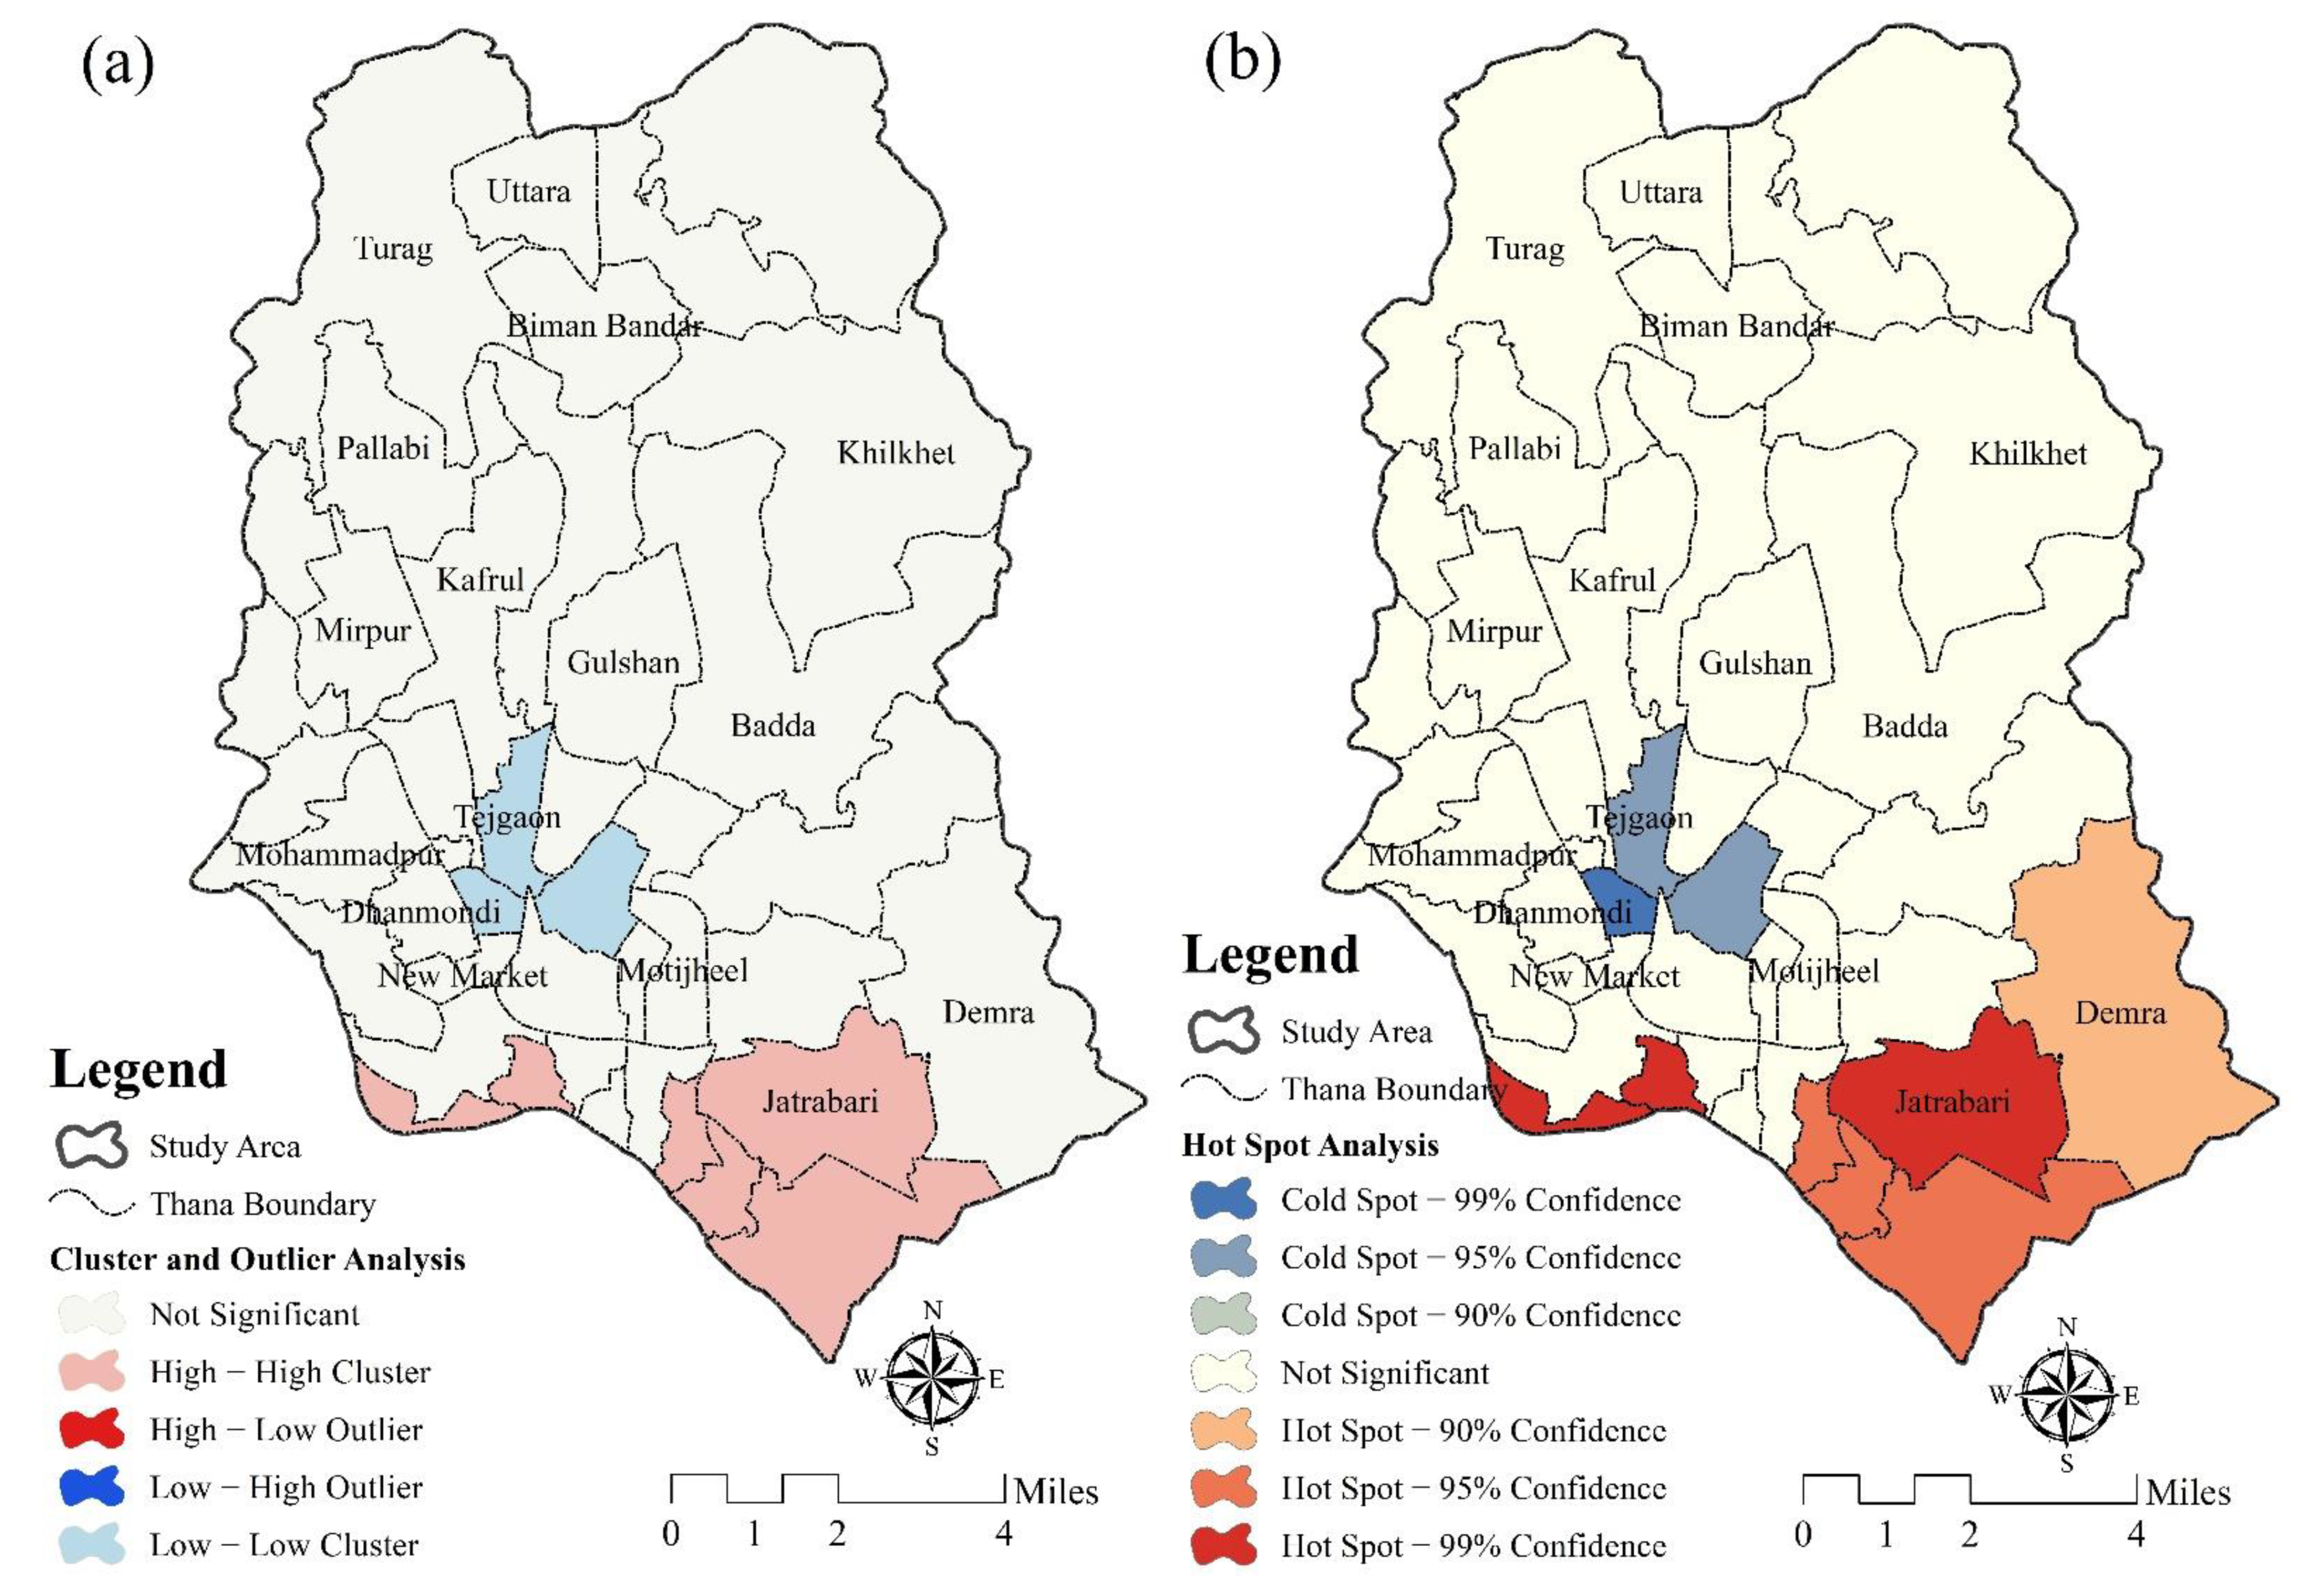
3.7. Identifying Spatial Distribution Pattern of Cluster-Outlier Analysis and Hotspot Analysis in Dhaka Metropolitan Area

In this study, Moran’s I index was found to have a positive value of 0.250 with a z-score of 2.901 and a p-value of 0.003, which indicates the clusters of the urban heat island to be in clustered patterns. For identification of the clustered locations and patterns where the urban heat island vulnerability has undergone a considerable change, spatial autocorrelation (Global Moran’s I), cluster and outlier analysis (Anselin Local Moran’s I), and hotspot analysis (Getis-Ord-G*) were introduced (Figure 8). Cluster and outlier analysis has been divided into four patterns: HH (high-high cluster), HL (high-low outlier), LH (low-high outlier), and LL (low-low) clusters. The Dhaka Metropolitan Area was illustrated with only two cluster patterns: the HH cluster and the LL cluster. HH indicates that the thana of Dhaka has higher median values that are significantly higher than their neighboring values, and LL shows vice versa. Chalk bazar, Demra, Genderia, Jatrabari, Kadamtali, Kamramgir Char, and Shyampur are seven thanas that have been identified with a higher cluster value. However, Kalabagan, Ramna, and Tejgaon have been identified as having lower values of clusters. Chalk Bazar, Jatrabari, Kadamtali, and Shyamapur thana had the highest HVI values, which justifies the higher cluster values. Jatrabari (2.634), Chalk Bazar (2.763), and Kamrangir Char (2.683) thana uncovered with the highest z-score values (of Getis-Ord-G* hotspot explaining 99% confidence level and Tejgaon (−2.413) has scored the lowest z-score value. Tejgaon thana has been detected with 95% of the cold spot value, which justifies the lowest HVI value in our study area.

4. Discussion

Previous research [100,101] has highlighted the importance of heat vulnerability studies, particularly in developing nations. Early detection of high heat susceptibility may aid in healthcare and distribution of essential requirements during and after the occurrence. This study’s severe heat sensitivity analysis was based on 26 characteristics that might make people more vulnerable to intense heat. The thana-level severe heat sensitivity index that results and the identification of driving elements may help researchers better understand population susceptibility during extreme heat occurrences. Rapid urbanization is happening in the Dhaka metropolitan region. The widespread growth in economic sectors fueled the development of urban areas, such as industry and agriculture. The core parts, southwestern sections, and heavily inhabited areas are the locations with the highest LST values. Due to urban heat island effects, metropolitan regions have greater land surface temperatures than rural areas [102,103]. The land use and land cover of the locations control LST distribution, wherein urban areas with less vegetation have higher land surface temperatures than rural and forest areas with lower land surface temperatures [104,105]. People living in locations with high LST have more significant, unfavorable health consequences than populations living in areas with low LST [103,104,105,106], hence the land surface temperature has been utilized as an extreme heat susceptibility indicator.
Defining high heat vulnerability, social sensitivity, and adaptive capability is crucial. The population density in urban areas is often high. Without good planning, squatters may increase, resulting in inconvenient housing and a lack of necessary services [107]. Since 2000, an increase in squatter households has become a significant concern in Dhaka’s metropolitan neighborhoods [108]. If the bulk of the vulnerable population lives in specific locations, the situation worsens. Rural locations, in certain situations, are more sensitive than urban areas owing to the large senior population. The senior population in Dhaka is most extensive in the southern and western parts since they have dwelt in the suburban area after working in metropolitan areas for an extended period. The growing cost of living diminishes purchasing power, harming low-income households who struggle to meet basic needs and have reduced access to healthcare services [109].
Critical prerequisites to overcome vulnerability determine an area’s adaptation capability [110]. Most of the districts with solid adaptation capability in this research were in the state capital, which houses most governmental agencies’ headquarters. The greater one’s adaptive capability, the smaller one’s vulnerability, and the faster one recover [111]. Considerable vulnerability is expected if the projected exposure and sensitivity are more than the adaptive capability. That explains why locations with great adaptive capacity have a high severe heat risk index.
The authors developed the “heat vulnerability index” and “vulnerability hot spots” in DMA, suggesting that metropolitan areas are more vulnerable to heat than other regions. One of the critical factors that increase a population’s susceptibility is urbanization. This situation is quite similar to what has been seen in other regions of the globe [112,113] and in nations with comparable latitudes, such as Lahore, which is seeing a rise in temperature exposure [114]. The highest HVI index value of 1 was found in Lalbagh thana. Within the extremely high HVI range (0.70–1.00), Shympur, Pallabi, Chak Bazar, Jatrabari, and Kadamtoli thana have also been highly vulnerable.
On the other hand, thana is a region with extremely low HVI index values (0.00–0.23). Because of its population density, buildup area, number of homes, and LST value, the Lalbagh thana has a relatively poor adaptation potential. Because the area has many health institutions, a high number of literate people, adequate electricity, good roads and highways, and pucca structures, the Gulshan area has a very high adaptive capacity and is indexed with a low HVI. A total of 11 thanas out of 41 were found to have a moderate HVI value, showing that the environment will remain stable for a few more years.
After the generation of the HVI model with exposure, sensitivity and adaptive capacity, it needs to be identifying the most sensitive parameters for HVI occurrences. Therefore, the correlation has been performed between HVI and HVI conditioning factors. The authors found that the elderly population (r: 0.61), very young or children (r: 0.607), illiterate people (r: 0.585), females (r: 0.57), LST (0.564), working age people (r: 0.539), and poverty (r: 0.51) are variables that are very sensitive to heat vulnerability. It is evident that LST can create an urban heat island effect, which, in turn, causes higher vulnerability to heat. On the other hand, because of chronic medical conditions and health issues, elderly people over the age of 65 are particularly vulnerable to urban heat sensitivity. Young individuals under the age of nine are more sensitive to heatwaves than older adults because of their lower sweating rate and body mass ratio. Women are more sensitive to heatwaves than males due to their greater body fat percentage (BF%) and physical strength. Illiterate people are particularly vulnerable to heatwave vulnerability because they are unaware of the potential dangers of a heatwave. Employed people make up a large portion of the population in a city, and their responses to heatwave sensitivity are varied, and they are mostly exposed due to their work requirements. People living in poverty have poor nutrition, poor housing conditions, and an obstructive socioeconomic situation, all of which contribute to heatwave sensitivity. In addition, kaccha structure (r: 0.217), disabled population (r: 0.34), floating population (r: 0.37), and population density (r: 0.44) are considered as moderately sensitive to heat vulnerability. Huong et al. [71] reported that disabled persons are more vulnerable to heat exposure due to their reliance on others, as well as their physical health and fragility. Furthermore, floating people are susceptible to heatwave sensitivity due to their homelessness, lack of access to water, severe sickness, and lack of access to power, as well as their terrible living conditions [71]. It can be said that the sensitivity of a household’s Kacha structure may be determined by assessing its susceptibility to heatwaves. The Kacha constructions are not fully sturdy, and the heat from the tin roof has a negative impact on the residents. In contrast, the authors found that road length (0.11), NDVI (0.06), health institution (−0.046), household with electricity (−0.012), packa structure (0.015) have inverse or very low relationship with HVI, because larger and broader roads can reduce traffic and land congestion. Therefore, this feature is adaptable. On the other hand, increasing the number of health institutions helps treat and prevent heatwave disasters. Pucca buildings include adequate flooring, ceiling, and structural ornamentation, as well as socioeconomic variables that adapt to heatwaves. Electricity facilitates the use of fans, air conditioners, refrigerators, and other cooling devices during a heatwave. Increasing vegetation minimizes urban heat island effects and preserves the environment in an eco-friendly manner. When compared to the average temperature of green space and residential areas, differences in solar radiation heating in urban areas are a primary factor contributing to the increase in air temperature and surface temperature in urban areas, particularly around roads, commercial and industrial areas, and especially around residential areas. Therefore, presence of vegetation can reduce the heat vulnerability effect.
Similar to the outcomes of other worldwide research [91], our index highlighted demographic, socioeconomic, environmental, and healthcare system variables. However, there are significant variations in selecting initial factors that make this index applicable to Bangladesh and developing nation contexts. The HVI thanas with the high and very high values were in the southern region. These thanas, which have a more significant migrant population from rural areas, have been at the bottom of many health, education, economic, and population growth metrics. At the same time, air conditioning has been shown to have the most considerable effect on decreasing heatwave mortality in the United States [115]. It is unlikely to be a viable solution for Bangladesh, particularly for Dhaka, due to the vast numbers of migrants who are designated as highly low-paid employees and do not have the financial means to acquire an air conditioning system.
As a result, appropriate local adaptation measures must be explored. Some of them have been explored in the literature, such as public messaging (radio, television), mobile phone-based text messages, automated phone calls, and amber alerts; other examples include the traditional adaption behaviors of sheltering indoors, adopting comfortable clothes, and diets. These are frequently clear in house design and materials used in building. Shaded windows and underground water storage tanks are simple architectural features that may be beneficial. Similarly, the use of insulator housing materials could be a useful preventative measure. It may be critical to access drinking water and indoor toilets within the housing complex. The authors picked several home amenities as a substitute for income and because of their protective function.

5. Conclusions

The present study explains the hazardous heat vulnerability of urban heat islands and the spatial distribution of the heat index at the thana level. HVI allows us to introduce the other three most important variables that played a vital role in the analysis, including exposure, sensitivity, and adaptive capacity. Because of the development in built-up regions, reduction in water bodies and vegetation, and other socioeconomic variables, the Dhaka Metropolitan Area represents most incidents of heat events. Six thanas in the Dhaka metropolitan region were discovered to have a very high HVI index, while 11 were discovered to have a high HVI rating. Alarmingly, around 87% of the overall Dhaka Metropolitan Area has been affected by heat events and is recognized as an urban heat island. The spatial distribution of adaptive ability is asymmetric. Mirpur thana has the most significant adaptive capacity value, but it also has the highest exposure value. The highest HVI values were found in Jatrabari, Kadamtali, and Shyampur. Land surface temperature increases and heat events occur because of excessive built-up regions and structural setups. A recent study has linked the rising temperature in the Dhaka City Corporation region to the Matuail dump near Jatrabari. The landfill contributes significantly to methane emissions, a key component of rising land surface temperatures. However, apart from lightening up the issue of increasing vulnerability to heatwaves, the study also has limitations. The satellite images used were taken in the afternoon, which does not explain the night temperature of the urban heat island. Furthermore, the heatwaves were not analyzed in this study using meteorological temperature data and solar radiation which are another limitation of this study. An integrated analysis of meteorological temperature and satellite temperature may provide more accurate results in the analysis of HVI. Thus, it is suggested to integrate the meteorological temperature with the satellite temperature and solar radiation for the analysis of vulnerability to heatwaves in the future studies. Despite the limitations described above, this work has a lot of positive aspects. This is the first study of heat vulnerability in the Dhaka metropolitan region. It is a preliminary screening tool for identifying where to concentrate heat-health and climate adaptation actions. This method might be used in future vulnerability assessments. Moreover, the findings of this study may provide an excellent platform for the UHI mitigation and maintaining the urban thermal comfort in Dhaka.

Author Contributions

R.A.: fata curation, formal analysis, software, visualization, writing original—draft. S.K.S.: conceptualization, methodology, software, writing—original draft. K.T.N.: data curation, investigation, writing—original draft. S.T.: investigation, methodology, writing—review and editing. S.: writing—review and editing. A.R.: writing—review and editing, supervision. A.R.M.T.I.: writing—review and editing. A.M.: writing—review and editing, supervision. All authors have read and agreed to the published version of the manuscript.

Funding

This research received no external funding.

Institutional Review Board Statement

Not applicable.

Informed Consent Statement

Not applicable.

Data Availability Statement

The datasets used in the study are available from the corresponding author upon reasonable request.

Conflicts of Interest

The authors declare no conflict of interest.

References

  1. Kohler, M.; Tannier, C.; Blond, N.; Aguejdad, R.; Clappier, A. Impacts of several urban-sprawl countermeasures on building (space heating) energy demands and urban heat island intensities. A case study. Urban Clim. 2017, 19, 92–121. [Google Scholar] [CrossRef]
  2. Karimi, M.; Nazari, R.; Dutova, D.; Khanbilvardi, R.; Ghandehari, M. A conceptual framework for environmental risk and social vulnerability assessment in complex urban settings. Urban Clim. 2018, 26, 161–173. [Google Scholar] [CrossRef]
  3. Liu, X.; Yue, W.; Yang, X.; Hu, K.; Zhang, W.; Huang, M. Mapping Urban Heat Vulnerability of Extreme Heat in Hangzhou via Comparing Two Approaches. Complexity 2020, 2020, 9717658. [Google Scholar] [CrossRef]
  4. Shahfahad; Talukdar, S.; Rihan, M.; Hang, H.T.; Bhaskaran, S.; Rahman, A. Modelling Urban Heat Island (UHI) and Thermal Field and Their Relationship with Land Use Indices over Delhi and Mumbai Metro Cities. Environ. Dev. Sustain. 2021, 24, 3762–3790. [Google Scholar] [CrossRef]
  5. Seto, K.C.; Shepherd, J.M. Global urban land-use trends and climate impacts. Curr. Opin. Environ. Sustain. 2009, 1, 89–95. [Google Scholar] [CrossRef]
  6. Shahfahad; Naikoo, M.W.; Islam, A.R.M.T.; Mallick, J.; Rahman, A. Land use/land cover change and its impact on surface urban heat island and urban thermal comfort in a metropolitan city. Urban Clim. 2022, 41, 101052. [Google Scholar] [CrossRef]
  7. Shahfahad; Rihan, M.; Naikoo, M.W.; Ali, M.A.; Usmani, T.M.; Rahman, A. Urban Heat Island Dynamics in Response to Land-Use/Land-Cover Change in the Coastal City of Mumbai. J. Indian Soc. Remote Sens. 2021, 49, 2227–2247. [Google Scholar] [CrossRef]
  8. Kong, J.; Zhao, Y.; Carmeliet, J.; Lei, C. Urban Heat Island and Its Interaction with Heatwaves: A Review of Studies on Mesoscale. Sustainability 2021, 13, 10923. [Google Scholar] [CrossRef]
  9. Li, Y.; Schubert, S.; Kropp, J.P.; Rybski, D. On the influence of density and morphology on the Urban Heat Island intensity. Nat. Commun. 2020, 11, 2647. [Google Scholar] [CrossRef]
  10. He, B.-J.; Ding, L.; Prasad, D. Relationships among local-scale urban morphology, urban ventilation, urban heat island and outdoor thermal comfort under sea breeze influence. Sustain. Cities Soc. 2020, 60, 102289. [Google Scholar] [CrossRef]
  11. Stone, B.; Vargo, J.; Habeeb, D. Managing climate change in cities: Will climate action plans work? Landsc. Urban Plan. 2012, 107, 263–271. [Google Scholar] [CrossRef]
  12. Carter, J.G.; Cavan, G.; Connelly, A.; Guy, S.; Handley, J.; Kazmierczak, A. Climate change and the city: Building capacity for urban adaptation. Prog. Plan. 2015, 95, 1–66. [Google Scholar] [CrossRef]
  13. Limaye, V.S.; Vargo, J.; Harkey, M.; Holloway, T.; Patz, J.A. Climate Change and Heat-Related Excess Mortality in the Eastern USA. Ecohealth 2018, 15, 485–496. [Google Scholar] [CrossRef] [PubMed]
  14. Dewan, A.; Kiselev, G.; Botje, D.; Mahmud, G.I.; Bhuian, M.H.; Hassan, Q.K. Surface urban heat island intensity in five major cities of Bangladesh: Patterns, drivers and trends. Sustain. Cities Soc. 2021, 71, 102926. [Google Scholar] [CrossRef]
  15. Xiang, Z.; Qin, H.; He, B.J.; Han, G.; Chen, M. Heat vulnerability caused by physical and social conditions in a mountainous megacity of Chongqing, China. Sustain. Cities Soc. 2022, 80, 103792. [Google Scholar] [CrossRef]
  16. Brooke Anderson, G.; Bell, M.L. Heat waves in the United States: Mortality risk during heat waves and effect modification by heat wave characteristics in 43 U.S. communities. Environ. Health Perspect. 2011, 119, 210–218. [Google Scholar] [CrossRef] [Green Version]
  17. Montero, J.C.; Mirón, I.J.; Criado-Álvarez, J.J.; Linares, C.; Díaz, J. Influence of local factors in the relationship between mortality and heat waves: Castile-La Mancha (1975–2003). Sci. Total Environ. 2012, 414, 73–80. [Google Scholar] [CrossRef]
  18. Leal Filho, W.; Wolf, F.; Castro-Díaz, R.; Li, C.; Ojeh, V.N.; Gutiérrez, N.; Nagy, G.J.; Savić, S.; Natenzon, C.E.; Quasem Al-Amin, A.; et al. Addressing the Urban Heat Islands Effect: A Cross-Country Assessment of the Role of Green Infrastructure. Sustainability 2021, 13, 753. [Google Scholar] [CrossRef]
  19. He, B.J.; Wang, J.; Zhu, J.; Qi, J. Beating the urban heat: Situation, background, impacts and the way forward in China. Renew. Sustain. Energy Reviews 2022, 161, 112350. [Google Scholar] [CrossRef]
  20. Li, X.; Zhou, Y.; Yu, S.; Jia, G.; Li, H.; Li, W. Urban heat island impacts on building energy consumption: A review of approaches and findings. Energy 2019, 174, 407–419. [Google Scholar] [CrossRef]
  21. Su, M.A.; Ngarambe, J.; Santamouris, M.; Yun, G.Y. Empirical evidence on the impact of urbanoverheating on building cooling and heatingenergy consumption. Iscience 2021, 24, 10249. [Google Scholar] [CrossRef] [PubMed]
  22. Uddin, N. Assessing Urban Sustainability of Slum Settlements in Bangladesh: Evidence from Chittagong City. J. Urban Manag. 2018, 7, 32–42. [Google Scholar] [CrossRef]
  23. Ahmed, S.; Hasan, M.Z.; Pongsiri, M.J.; Ahmed, M.W.; Szabo, S. Effect of extreme weather events on injury, disability, and death in Bangladesh. Clim. Dev. 2021, 13, 306–317. [Google Scholar] [CrossRef]
  24. Telesca, V.; Lay-Ekuakille, A.; Ragosta, M.; Giorgio, G.A.; Lumpungu, B. Effects on Public Health of Heat Waves to Improve the Urban Quality of Life. Sustainability 2018, 10, 1082. [Google Scholar] [CrossRef] [Green Version]
  25. Roos, N.; Kovats, S.; Hajat, S.; Filippi, V.; Chersich, M.; Luchters, S.; Scorgie, F.; Nakstad, B.; Stephansson, O.; Hess, J.; et al. Maternal and newborn health risks of climate change: A call for awareness and global action. Acta Obstet. Gynecol. Scand. 2021, 100, 566–570. [Google Scholar] [CrossRef]
  26. Tuholske, C.; Caylor, K.; Funk, C.; Verdin, A.; Sweeney, S.; Grace, K.; Peterson, P.; Evans, T. Global urban population exposure to extreme heat. Proc. Natl. Acad. Sci. USA 2021, 118, e2024792118. [Google Scholar] [CrossRef]
  27. Cianconi, P.; Betrò, S.; Janiri, L. The impact of climate change on mental health: A systematic descriptive review. Front. Psychiatry 2020, 11, 74. [Google Scholar] [CrossRef]
  28. Sarkar, S.K.; Rahman, M.A.; Esraz-Ul-Zannat, M.; Islam, M.F. Simulation-based modeling of urban waterlogging in Khulna City. J. Water Clim. Chang. 2020, 12, 1–14. [Google Scholar] [CrossRef]
  29. Rahman, S.; Rahman, M.A. Climate extremes and challenges to infrastructure development in coastal cities in Bangladesh. Weather. Clim. Extrem. 2015, 7, 96–108. [Google Scholar] [CrossRef] [Green Version]
  30. Uddin, A.S.M.; Khan, N.; Islam, A.R.M.; Kamruzzaman, M.; Shahid, S. Changes in urbanization and urban heat island effect in Dhaka city. Theor. Appl. Climatol. 2022, 147, 891–907. [Google Scholar] [CrossRef]
  31. Nissan, H.; Burkart, K.; De Perez, E.C.; Van Aalst, M.; Mason, S.J. Defining and Predicting Heat Waves in Bangladesh. J. Appl. Meteorol. Clim. 2017, 56, 2653–2670. [Google Scholar] [CrossRef]
  32. Nissan, H.; Munoz, A.G.; Mason, S.J. Targeted model evaluations for climate services: A case study on heat waves in Bangladesh. Clim. Risk Manag. 2020, 28, 100213. [Google Scholar] [CrossRef]
  33. Dewan, A.; Kiselev, G.; Botje, D. Diurnal and seasonal trends and associated determinants of surface urban heat islands in large Bangladesh cities. Appl. Geogr. 2021, 135, 102533. [Google Scholar] [CrossRef]
  34. Ahmed, B.; Kamruzzaman, M.D.; Zhu, X.; Shahinoor Rahman, M.D.; Choi, K. Simulating land cover changes and their impacts on land surface temperature in Dhaka, Bangladesh. Remote Sens. 2013, 5, 5969–5998. [Google Scholar] [CrossRef] [Green Version]
  35. Burkart, K.; Schneider, A.; Breitner, S.; Khan, M.H.; Krämer, A.; Endlicher, W. The effect of atmospheric thermal conditions and urban thermal pollution on all-cause and cardiovascular mortality in Bangladesh. Environ. Pollut. 2011, 159, 2035–2043. [Google Scholar] [CrossRef] [PubMed] [Green Version]
  36. Burkart, K.; Breitner, S.; Schneider, A.; Khan, M.M.H.; Krämer, A.; Endlicher, W. An analysis of heat effects in different subpopulations of Bangladesh. Int. J. Biometeorol. 2014, 58, 227–237. [Google Scholar] [CrossRef]
  37. Kubilay, A.; Allegrini, J.; Strebel, D.; Zhao, Y.; Derome, D.; Carmeliet, J. Advancement in Urban Climate Modelling at Local Scale: Urban Heat Island Mitigation and Building Cooling Demand. Atmosphere 2020, 11, 1313. [Google Scholar] [CrossRef]
  38. Vanos, J.K.; Baldwin, J.W.; Jay, O.; Ebi, K.L. Simplicity lacks robustness when projecting heat-health outcomes in a changing climate. Nat. Commun. 2020, 11, 1–5. [Google Scholar] [CrossRef]
  39. Conlon, K.C.; Mallen, E.; Gronlund, C.J.; Berrocal, V.J.; Larsen, L.; O’neill, M.S. Mapping human vulnerability to extreme heat: A critical assessment of heat vulnerability indices created using principal components analysis. Environ. Health Perspect. 2020, 128, 1–14. [Google Scholar] [CrossRef]
  40. Qi, J.; Ding, L.; Lim, S. Toward cool cities and communities: A sensitivity analysis method to identify the key planning and design variables for urban heat mitigation techniques. Sustain. Cities Soc. 2021, 75, 103377. [Google Scholar] [CrossRef]
  41. Morais, L.; Lopes, A.; Nogueira, P. Human health outcomes at the neighbourhood scale implications: Elderly’s heat-related cardiorespiratory mortality and its influencing factors. Sci. Total Environ. 2021, 760, 144036. [Google Scholar] [CrossRef] [PubMed]
  42. Pioppi, B.; Pigliautile, I.; Pisello, A.L. Human-centric microclimate analysis of Urban Heat Island: Wearable sensing and data-driven techniques for identifying mitigation strategies in New York City. Urban Clim. 2020, 34, 100716. [Google Scholar] [CrossRef]
  43. Wang, C.; Chang, H.T. Hotspots, Heat Vulnerability and Urban Heat Islands: An Interdisciplinary Review of Research Methodologies. Can. J. Remote Sens. 2020, 46, 532–551. [Google Scholar] [CrossRef]
  44. Niu, Y.; Li, Z.; Gao, Y.; Liu, X.; Xu, L.; Vardoulakis, S.; Yue, Y.; Wang, J.; Liu, Q. A Systematic Review of the Development and Validation of the Heat Vulnerability Index: Major Factors, Methods, and Spatial Units. Curr. Clim. Change Rep. 2021, 7, 87–97. [Google Scholar] [CrossRef] [PubMed]
  45. Cheng, W.; Li, D.; Liu, Z.; Brown, R.D. Approaches for identifying heat-vulnerable populations and locations: A systematic review. Sci. Total Environ. 2021, 799, 149417. [Google Scholar] [CrossRef]
  46. Buo, I.; Sagris, V.; Burdun, I.; Uuemaa, E. Estimating the expansion of urban areas and urban heat islands (UHI) in Ghana: A case study. Nat. Hazards 2021, 105, 1299–1321. [Google Scholar] [CrossRef]
  47. Jolliffe, I.T.; Cadima, J. Principal component analysis: A review and recent developments. Philos. Trans. R. Soc. A 2016, 374, 20150202. [Google Scholar] [CrossRef]
  48. Arbuthnott, K.G.; Hajat, S. The health effects of hotter summers and heat waves in the population of the United Kingdom: A review of the evidence. Environ. Health Glob. Access Sci. Source 2017, 16, 1–13. [Google Scholar] [CrossRef] [Green Version]
  49. Zacharias, S.; Koppe, C.; Mücke, H.-G. Climate Change Effects on Heat Waves and Future Heat Wave-Associated IHD Mortality in Germany. Climate 2015, 3, 100–117. [Google Scholar] [CrossRef] [Green Version]
  50. Jandaghian, Z.; Akbari, H. The effects of increasing surface reflectivity on heat-related mortality in Greater Montreal Area, Canada. Urban Clim. 2018, 25, 135–151. [Google Scholar] [CrossRef]
  51. Maharjan, M.; Aryal, A.; Man Shakya, B.; Talchabhadel, R.; Thapa, B.R.; Kumar, S. Evaluation of Urban Heat Island (UHI) Using Satellite Images in Densely Populated Cities of South Asia. Earth 2021, 2, 86–110. [Google Scholar] [CrossRef]
  52. Mohammad, P.; Goswami, A. Spatial variation of surface urban heat island magnitude along the urban-rural gradient of four rapidly growing Indian cities. Geocarto Int. 2021, 1–23. [Google Scholar] [CrossRef]
  53. Roy, S.; Pandit, S.; Eva, E.A.; Bagmar, M.S.H.; Papia, M.; Banik, L.; Dube, T.; Rahman, F.; Razi, M.A. Examining the nexus between land surface temperature and urban growth in Chattogram Metropolitan Area of Bangladesh using long term Landsat series data. Urban Clim. 2020, 32, 100593. [Google Scholar] [CrossRef]
  54. Khare, V.R.; Vajpai, A.; Gupta, D. A big picture of urban heat island mitigation strategies and recommendation for India. Urban Clim. 2021, 37, 100845. [Google Scholar] [CrossRef]
  55. Arifwidodo, S.D.; Chandrasiri, O. Urban heat stress and human health in Bangkok, Thailand. Environ. Res. 2020, 185, 109398. [Google Scholar] [CrossRef] [PubMed]
  56. Bangladesh Bureau of Statistics (BBS). Population and Housing Census 2011. Community Report; BBS: Dhaka, Bangladesh, 2011.
  57. Faisal, A.-A.; Kafy, A.-A.; Al Rakib, A.; Akter, K.S.; Jahir, D.M.A.; Sikdar, M.S.; Ashrafi, T.J.; Mallik, S.; Rahman, M.M. Assessing and predicting land use/land cover, land surface temperature and urban thermal field variance index using Landsat imagery for Dhaka Metropolitan area. Environ. Challenges 2021, 4, 100192. [Google Scholar] [CrossRef]
  58. Trotter, L.; Dewan, A.; Robinson, T. Effects of rapid urbanisation on the urban thermal environment between 1990 and 2011 in Dhaka Megacity, Bangladesh. AIMS Environ. Sci. 2017, 4, 145–167. [Google Scholar] [CrossRef]
  59. Dousset, B.; Gourmelon, F.; Laaidi, K.; Zeghnoun, A.; Giraudet, E.; Bretin, P.; Mauri, E.; Vandentorren, S. Satellite monitoring of summer heat waves in the Paris metropolitan area. Int. J. Climatol. 2011, 31, 313–323. [Google Scholar] [CrossRef]
  60. Groce, N.; Bellamy, R.; Wolff, J. Managing the health effects of climate change: Lancet and University College London Institute for Global Health Commission. Lancet. 2009, 373, 1693–1733. [Google Scholar]
  61. Wheeler, B.W.; Lovell, R.; Higgins, S.L.; White, M.P.; Alcock, I.; Osborne, N.J.; Husk, K.; Sabel, C.E.; Depledge, M.H. Beyond greenspace: An ecological study of population general health and indicators of natural environment type and quality. Int. J. Health Geogr. 2015, 14, 1–17. [Google Scholar] [CrossRef] [Green Version]
  62. McGeehin, M.A.; Mirabelli, M. The potential impacts of climate variability and change on temperature-related morbidity and mortality in the United States. Environ. Health Perspect. 2001, 109, 185–189. [Google Scholar] [CrossRef] [PubMed] [Green Version]
  63. Chen, K.; Bi, J.; Chen, J.; Chen, X.; Huang, L.; Zhou, L. Influence of heat wave definitions to the added effect of heat waves on daily mortality in Nanjing, China. Sci. Total Environ. 2015, 506–507, 18–25. [Google Scholar] [CrossRef] [PubMed]
  64. Yang, J.; Yin, P.; Sun, J.; Wang, B.; Zhou, M.; Li, M.; Tong, S.; Meng, B.; Guo, Y.; Liu, Q. Heatwave and mortality in 31 major Chinese cities: Definition, vulnerability and implications. Sci. Total Environ. 2019, 649, 695–702. [Google Scholar] [CrossRef] [PubMed]
  65. Holstein, J.; Canouï-Poitrine, F.; Neumann, A.; Lepage, E.; Spira, A. Were less disabled patients the most affected by 2003 heat wave in nursing homes in Paris, France? J. Public Health 2005, 27, 359–365. [Google Scholar] [CrossRef] [PubMed] [Green Version]
  66. Opiyo, F.E.O.; Wasonga, O.V.; Nyangito, M.M. Measuring household vulnerability to climate-induced stresses in pastoral rangelands of Kenya: Implications for resilience programming. Pastoralism 2014, 4, 1–15. [Google Scholar] [CrossRef] [Green Version]
  67. Madrigano, J.; Ito, K.; Johnson, S.; Kinney, P.L.; Matte, T. A case-only study of vulnerability to heat wave–related mortality in New York City (2000–2011). Environ. Health Perspect. 2015, 123, 672–678. [Google Scholar] [CrossRef] [PubMed]
  68. Uddin, M.N.; Saiful Islam, A.K.M.; Bala, S.K.; Islam, G.M.T.; Adhikary, S.; Saha, D.; Haque, S.; Fahad, M.G.R.; Akter, R. Mapping of climate vulnerability of the coastal region of Bangladesh using principal component analysis. Appl. Geogr. 2019, 102, 47–57. [Google Scholar] [CrossRef]
  69. Inostroza, L.; Palme, M.; De La Barrera, F. A heat vulnerability index: Spatial patterns of exposure, sensitivity and adaptive capacity for Santiago de Chile. PLoS ONE 2016, 11, e0162464. [Google Scholar] [CrossRef] [Green Version]
  70. Jiang, L. Living Conditions of the Floating Population in Urban China. Hous. Stud. 2007, 21, 719–744. [Google Scholar] [CrossRef]
  71. Huong, N.T.L.; Yao, S.; Fahad, S. Assessing household livelihood vulnerability to climate change: The case of Northwest Vietnam. Hum. Ecol. Risk Assess. 2019, 25, 1157–1175. [Google Scholar] [CrossRef]
  72. Mushore, T.D.; Mutanga, O.; Odindi, J.; Dube, T. Determining extreme heat vulnerability of Harare Metropolitan City using multispectral remote sensing and socio-economic data. J. Spat. Sci. 2018, 63, 173–191. [Google Scholar] [CrossRef]
  73. Gabriel, K.M.A.; Endlicher, W.R. Urban and rural mortality rates during heat waves in Berlin and Brandenburg, Germany. Environ. Pollut. 2011, 159, 2044–2050. [Google Scholar] [CrossRef]
  74. Brooks, N.; Adger, W.N.; Kelly, P.M. The determinants of vulnerability and adaptive capacity at the national level and the implications for adaptation. Glob. Environ. Chang. 2005, 15, 151–163. [Google Scholar] [CrossRef]
  75. Hess, J.J.; McDowell, J.Z.; Luber, G. Integrating climate change adaptation into public health practice: Using adaptive management to increase adaptive capacity and build resilience. Environ. Health Perspect. 2012, 120, 171–179. [Google Scholar] [CrossRef] [PubMed] [Green Version]
  76. Patankar, A.; Patwardhan, A. Estimating the uninsured losses due to extreme weather events and implications for informal sector vulnerability: A case study of Mumbai, India. Nat. Hazards 2016, 80, 285–310. [Google Scholar] [CrossRef]
  77. Coffel, E.D.; Horton, R.M.; De Sherbinin, A. Temperature and humidity based projections of a rapid rise in global heat stress exposure during the 21st century. Environ. Res. Lett. 2018, 13, 014001. [Google Scholar] [CrossRef] [PubMed]
  78. Oleson, K.W.; Monaghan, A.; Wilhelmi, O.; Barlage, M.; Brunsell, N.; Feddema, J.; Hu, L.; Steinhoff, D.F. Interactions between urbanization, heat stress, and climate change. Clim. Change 2015, 129, 525–541. [Google Scholar] [CrossRef]
  79. Chow, W.T.L.; Chuang, W.-C.; Gober, P. Vulnerability to Extreme Heat in Metropolitan Phoenix: Spatial, Temporal, and Demographic Dimensions. Prof. Geogr. 2012, 64, 286–302. [Google Scholar] [CrossRef]
  80. Talukdar, S.; Pal, S. Impact of dam on inundation regime of flood plain wetland of punarbhaba river basin of barind tract of Indo-Bangladesh. Int. Soil Water Conserv. Res. 2017, 5, 109–121. [Google Scholar] [CrossRef]
  81. Li, X.; Zhou, Y.; Zhao, M.; Zhao, X. A harmonized global nighttime light dataset 1992–2018. Sci. Data 2020, 7, 1–9. [Google Scholar] [CrossRef]
  82. Mallick, J.; Singh, V.P.; Almesfer, M.K.; Talukdar, S.; Alsubhi, M.; Ahmed, M.; Khan, R.A. Spatio-temporal analysis and simulation of land cover changes and their impacts on land surface temperature in urban agglomeration of Bisha Watershed, Saudi Arabia. Geocarto Int. 2021, 1–27. [Google Scholar] [CrossRef]
  83. Talukdar, S.; Singha, P.; Mahato, S.; Pal, S.; Liou, Y.A.; Rahman, A. Land-use land-cover classification by machine learning classifiers for satellite observations—A review. Remote Sens. 2020, 12, 1135. [Google Scholar] [CrossRef] [Green Version]
  84. Bindajam, A.A.; Mallick, J.; Talukdar, S.; Islam, A.R.M.; Alqadhi, S. Integration of artificial intelligence–based LULC mapping and prediction for estimating ecosystem services for urban sustainability: Past to future perspective. Arab. J. Geosci. 2021, 14, 1–23. [Google Scholar] [CrossRef]
  85. Bhatti, S.S.; Tripathi, N.K. Built-up area extraction using Landsat 8 OLI imagery. GIScience Remote Sens. 2014, 51, 445–467. [Google Scholar] [CrossRef] [Green Version]
  86. AlQadhi, S.; Mallick, J.; Talukdar, S.; Bindajam, A.A.; Shohan, A.A.A.; Shahfahad. Quantification of Urban Sprawl for Past-To-Future in Abha City, Saudi Arabia. Cmes-Comput. Modeling Eng. Sci. 2021, 129, 755–786. [Google Scholar] [CrossRef]
  87. Mallick, J.; AlQadhi, S.; Talukdar, S.; Pradhan, B.; Bindajam, A.A.; Islam, A.R.M.; Dajam, A.S. A Novel Technique for Modeling Ecosystem Health Condition: A Case Study in Saudi Arabia. Remote Sens. 2021, 13, 2632. [Google Scholar] [CrossRef]
  88. Kovats, R.; Hajat, S. Heat stress and public health: A critical review. Annu. Rev. Public Health 2008, 29, 41–55. [Google Scholar] [CrossRef]
  89. Luber, G.; McGeehin, M. Climate change and extreme heat events. Am. J. Prev. Med. 2008, 35, 429–435. [Google Scholar] [CrossRef]
  90. Knowlton, K.; Lynn, B.; Goldberg, R.A.; Rosenzweig, C.; Hogrefe, C.; Rosenthal, J.K.; Kinney, P.L. Projecting heat-related mortality impacts under a changing climate in the New York City region. Am. J. Public Health 2007, 97, 2028–2034. [Google Scholar] [CrossRef]
  91. Reid, C.E.; O’neill, M.S.; Gronlund, C.J.; Brines, S.J.; Brown, D.G.; Diez-Roux, A.V.; Schwartz, J. Mapping community determinants of heat vulnerability. Environ. Health Perspect. 2009, 117, 1730–1736. [Google Scholar] [CrossRef]
  92. Curriero, F.C.; Heiner, K.S.; Samet, J.M.; Zeger, S.L.; Strug, L.; Patz, J.A. Temperature and mortality in 11 cities of the eastern United States. Am. J. Epidemiol. 2002, 155, 80–87. [Google Scholar] [CrossRef] [PubMed]
  93. Cutter, S.L.; Boruff, B.J.; Shirly, W.L. Social Science Quarterly. Soc. Vulnerability Environ. Hazards 2003, 84, 242–261. [Google Scholar]
  94. Tate, E.; Cutter, S.L.; Berry, M. Integrated multihazard mapping. Environ. Plan. B: Plan. Des. 2010, 37, 646–663. [Google Scholar] [CrossRef] [Green Version]
  95. Wolf, T.; McGregor, G. The development of a heat wave vulnerability index for London, United Kingdom. Weather. Clim. Extrem. 2013, 1, 59–68. [Google Scholar] [CrossRef] [Green Version]
  96. Jolliffe, I.T. Principal Component Analysis for Special Types of Data; Springer: New York, NY, USA, 2002; pp. 338–372. [Google Scholar]
  97. Chen, Y. New Approaches for Calculating Moran’s Index of Spatial Autocorrelation. PLoS ONE 2013, 8, e68336. [Google Scholar] [CrossRef] [PubMed] [Green Version]
  98. Duan, L.; Xu, L.; Liu, Y.; Lee, J. Cluster-based outlier detection. Ann. Oper. Res. 2009, 168, 151–168. [Google Scholar] [CrossRef]
  99. Lepczyk, C.A.; Hammer, R.B.; Stewart, S.I.; Radeloff, V.C. Spatiotemporal dynamics of housing growth hotspots in the North Central, U.S. from 1940 to 2000. Landsc. Ecol. 2007, 22, 939–952. [Google Scholar] [CrossRef]
  100. Dong, W.; Liu, Z.L.; Liao, H.L.; Tang, Q.; Li, X.E. New climate and socio-economic scenarios for assessing global human health challenges due to heat risk. Clim. Change 2015, 130, 505–518. [Google Scholar] [CrossRef] [Green Version]
  101. Chen, T.L.; Lin, H.; Chiu, Y.H. Heat vulnerability and extreme heat risk at the metropolitan scale: A case study of Taipei metropolitan area, Taiwan. Urban Climate. 2020, 41, 101054. [Google Scholar] [CrossRef]
  102. Lemonsu, A.; Viguie, V.; Daniel, M.; Masson, V. Vulnerability to heat waves: Impact of urban expansion scenarios on urban heat island and heat stress in Paris (France). Urban Clim. 2015, 14, 586–605. [Google Scholar] [CrossRef]
  103. Salata, F.; Golasi, I.; Petitti, D.; De Lieto Vollaro, E.; Coppi, M.; De Lieto Vollaro, A. Relating microclimate, human thermal comfort and health during heat waves: An analysis of heat island mitigation strategies through a case study in an urban outdoor environment. Sustain. Cities Soc. 2017, 30, 79–96. [Google Scholar] [CrossRef]
  104. Chaudhuri, G.; Mishra, N.B. Spatio-temporal dynamics of land cover and land surface temperature in Ganges-Brahmaputra delta: A comparative analysis between India and Bangladesh. Appl. Geogr. 2016, 68, 68–83. [Google Scholar] [CrossRef]
  105. Ibitoye, M.O.; Aderibigbe, O.G.; Adegboyega, S.A.; Adebola, A.O. Spatio-temporal analysis of land surface temperature variations in the rapidly developing Akure and its environs, southwestern Nigeria using Landsat data. Ethiop. J. Environ. Stud. Manag. 2017, 10, 389–403. [Google Scholar] [CrossRef] [Green Version]
  106. Wilson, B.; Chakraborty, A. Mapping vulnerability to extreme heat events: Lessons from metropolitan Chicago. J. Environ. Plan. Manag. 2019, 62, 1065–1088. [Google Scholar] [CrossRef]
  107. Zander, K.K.; Cadag, J.R.; Escarcha, J.; Garnett, S.T. Perceived heat stress increases with population density in urban Philippines. Environ. Res. Lett. 2018, 13, 084009. [Google Scholar] [CrossRef]
  108. Mohit, M.A. Bastee settlements of Dhaka City, Bangladesh: A review of policy approaches and challenges ahead. Procedia-Soc. Behav. Sci. 2012, 36, 611–622. [Google Scholar] [CrossRef] [Green Version]
  109. Hossain, S. Rapid urban growth and poverty in Dhaka city. Bangladesh E-J. Sociol. 2008, 5, 1–24. [Google Scholar]
  110. Awal, M.A.; Rashid, M.; Islam, A.; Imam, M.; Sarkar, M. Measuring climate change vulnerability and its adaptive capacity: Policies and planning for Bangladesh. Br. J. Environ. Clim. Change 2016, 6, 279–298. [Google Scholar] [CrossRef]
  111. Mortreux, C.; Barnett, J. Adaptive capacity: Exploring the research frontier. Wiley Interdiscip. Rev. Clim. Change 2017, 8, e467. [Google Scholar] [CrossRef]
  112. Revich, B.; Shaposhnikov, D. Temperature-induced excess mortality in Moscow, Russia. Int. J. Biometeorol. 2008, 52, 367–374. [Google Scholar] [CrossRef]
  113. Buzási, A. Comparative assessment of heatwave vulnerability factors for the districts of Budapest, Hungary. Urban Clim. 2022, 42, 101127. [Google Scholar] [CrossRef]
  114. Zuhra, S.S.; Tabinda, A.B.; Yasar, A. Appraisal of the heat vulnerability index in Punjab: A case study of spatial pattern for exposure, sensitivity, and adaptive capacity in megacity Lahore, Pakistan. Int. J. Biometeorol. 2019, 63, 1669–1682. [Google Scholar] [CrossRef] [PubMed]
  115. Barreca, A.; Clay, K.; Deschenes, O.; Greenstone, M.; Shapiro, J.S. Adapting to Climate Change: The Remarkable Decline in the US Temperature-Mortality Relationship over the Twentieth Century. J. Political Econ. 2016, 124, 105–159. [Google Scholar] [CrossRef] [Green Version]
Figure 1. (a) Location and (b) administrative (Thana) set up of the study area.
Sustainability 14 04945 g001
Figure 2. Land use land cover map for the year of 2021 of the Dhaka Metropolitan Area (DMA).
Sustainability 14 04945 g002
Figure 3. Land surface temperature map of Dhaka Metropolitan Area (DMA).
Sustainability 14 04945 g003
Figure 4. Spatial pattern of (a) exposure, (b) sensitivity, (c) adaptive capacity, and (d) HVI in Dhaka Metropolitan Area (DMA).
Sustainability 14 04945 g004
Figure 5. Thana wise LULC variation under different HVI zones, such as (a) very high, (b) high, (c) moderate, (d) low, and (e) very low HVI zones in urban heat island of Dhaka Metropolitan Area.
Sustainability 14 04945 g005
Figure 6. Spatial pattern of biophysical parameters, such as (a) NDVI, (b) NDBI, and (c) NDBI of Dhaka Metropolitan Area (DMA).
Sustainability 14 04945 g006
Figure 7. Correlation coefficient analysis between HVI and NDVI, NDWI, and NDBI for Dhaka metropolitan area. (N.B. Black circle indicates the data distribution patterns of HVI, NDVI, NDWI, and NDBI, while black line denotes the histogram of mentioned four variables; ‘**’ indicates the significance level at p < 0.05, and ‘***’ indicates the significance level at p < 0.001).
Sustainability 14 04945 g007
Figure 8. (a) Cluster and outlier analysis and (b) hotspot analysis of Dhaka Metropolitan Area (DMA).
Sustainability 14 04945 g008
Table 1. Description of indicators used for Urban Heat Island vulnerability assessment.
IndicatorsRationaleUnit/Resolution/Data FormatSource
ExposureLSTLand Surface Temperature indicates the intensity of heatwaves in Iceland that are exposed by the situation [59].°C, 30 m, and RasterUSGS, 2021
PopulationIncreasing population causes urbanization, water shortage, climate change, etc., and gets exposed to natural disaster [60].Number, VectorBBS, 2011
Population concentrationPopulation concentration causes congestion, poverty, and a low standard of living, which contributes to vulnerability, as in exposure [61].People/km2, Vector
SensitivityElderly populationElderly people aged >65 are extremely vulnerable to urban heat sensitivity because of chronic medical condition and health issue [62].
Very young populationYoung people <9 years are even more vulnerable to heatwaves than old people, caused by their lower sweating rate and body mass ratio [63].
FemaleWomen’s responses to heat wave sensitivity differs from men due to their higher percentage of body fat (BF%) and physical strength [64].
Illiterate peopleBeing unaware of the potential danger of heatwaves, illiterate people are highly sensitive to heat wave vulnerability [65].
Disabled personDisabled people are sensitive to heat exposure due to their dependency on others as well as physical health and fragility [66].
Working age populationEmployed people are a huge population working altogether in a city and respond to heat wave sensitivity; they are mostly exposed due to their criteria of work [67].
HouseholdBecause of congested and increased population, the number of households are also increasing to a great extent and are exposed to heat wave sensitivity [68].Household/km2, Vector
PovertyPeople below the poverty line lead a miserable life with poor nutrition, poor housing conditions, and obstructive socioeconomic situations that leads to heat wave sensitivity exposure [69].People/km2, Vector
Water accessibility Usage of water for different purposes, especially for the tempering process, as well as treatment, refers to heat wave sensitivity [70].
Floating peopleFloating people are vulnerable to heat wave sensitivity because they are homeless, they lack water access, acute illness, and electricity access; their very poor living conditions make them sensitive to heatwaves [71].
Kaccha StructureAssessing Kacha structure of a household can indicate the sensitivity when exposed to heatwaves. Kacha structures are not properly stable, and because of the tin roof, heat affects the people miserably [72].Number/km2, Vector
NDBINormalized Difference Buildup Index is an important indicator for heat wave sensitivity because the increasing build-up area, spatial growth of the buildings, and congested urban lands are simultaneously exposed to sensitivity [73].Zonal Pixel ratio, 30 m, RasterUSGS, 2021
Built-up AreaBuilt-up area contributes to urban heat sensitivity because of its characterization of the overcrowding nature of buildings, apartments, settlements, and so on [74].km2, 30 m, Raster
Adaptive CapacityLiterateLiterate people are aware of the facts and knowledge regarding heatwaves, and they prepare themselves to adapt to the situation smartly [75].People/km2, VectorBBS, 2011
Household with electricityAccess to electricity accelerates the capacity to resist heatwave disasters by using fans, air conditioners, refrigerators, and other necessary elements [76].Number/km2, Vector
Pucca structurePucca structure contains proper flooring, ceiling, and structural embellishment along with socioeconomic factors, which are expressed as adaptions exposed to heatwaves [77].
Road Larger and wider roads tend to decrease congestion from roads and land. Thus, this feature proves to be in adaptive capacity [70].km ratio, Vector
Health InstitutionIncreasing the number of health institutions helps to cure people affected by heatwaves and also prevents heatwave disasters in a greater sense [76]. Number, Vector
Relative HumidityTemperature and humidity are both related to each other, and humidity decreases when temperature increases [78].Percent, VectorBMD, 2017
Vegetation Vegetation leaves moisture in the environment and the exchange of liberal amount of oxygen helps to adapt the heatwave situation [79].km2 ratio, VectorUSGS, 2021
NDWINormalized Difference Water index is used for the analysis of water bodies and waterbody reduces the heat as well as adapts the heat capacity [73].Zonal Pixel ratio, 30 m, Raster
NDVINormalized Difference Vegetation Index refers to the detailed analysis of vegetation, and increasing vegetation reduces the heat and keeps the environment ecofriendly [80].
NTL data NTL data contributes to measuring the city lights at night and helps generate the functions of urban sprawl, which later on indicates the adaption of climate change synopsis [81].Zonal DN value, 30 m, RasterNGDC, 2021
Table 2. Computation of the area coverage of different LULC classes of the study area.
LULC TypeArea (km2)Area (Percent)
Agriculture45.2315.11
Bare Land11.974.00
Build-Up Area188.7763.07
Vegetation32.3110.80
Water Body21.017.02
Grand Total299.28100.00
Table 3. Result of component extraction of factor analysis.
VariableComponentsStandard Deviation% of VarianceCumulative %
Exposure10.9952.8552.85
20.9934.6387.48
Sensitivity11.0070.7670.76
21.0011.4382.19
Adaptive Capacity11.0051.9251.92
21.0018.0769.99
31.0010.3680.35
Table 4. Factor loading of the input variable.
VariablesComponents
HypotheticalMeasured123
ExposurePopulation concentration0.892−0.160N/A
LST0.8890.190N/A
Population−0.0260.989N/A
SensitivityHousehold0.9770.148N/A
Water accessibility0.9760.145N/A
Female0.9740.125N/A
Working age population0.972−0.03N/A
Elderly population0.952−0.123N/A
Very young population0.9480.272N/A
Disabled person0.9360.046N/A
Built-up Area0.872−0.129N/A
Illiterate0.817−0.068N/A
NDBI0.758−0.098N/A
Poverty0.730.508N/A
Kaccha Structure0.1990.749N/A
Floating people0.302−0.731N/A
Adaptive CapacityLiterate0.9330.099−0.071
Household with electricity0.926−0.046−0.025
NDVI−0.9110.029−0.197
NDWI0.911−0.0430.172
Pucca structure0.790.172−0.224
Road0.7880.2480.056
Relative humidity−0.134−0.798−0.259
Vegetation−0.5250.766−0.138
NTL data0.4660.6720.019
Health institution0.0070.1350.937
Publisher’s Note: MDPI stays neutral with regard to jurisdictional claims in published maps and institutional affiliations.

