Article

Calcium-Rich Pigeonpea Seed Coat: A Potential Byproduct for Food and Pharmaceutical Industries

by
Dhanapal Susmitha
1,2,
Thiyagarajan Kalaimagal
2,
Ramachandran Senthil
1,
Mani Vetriventhan
1,
Seetha Anitha
3,
Swaminathan Manonmani
2,
Prabhakaran Jeyakumar
4,
Surender Reddymalla
1,
Ovais Peerzada
1,
Venkata Narayana Arveti
1,
Vania C. R. Azevedo
5 and
Kuldeep Singh
1,*
1
Genebank, International Crops Research Institute for the Semi-Arid Tropics (ICRISAT), Patancheru 502324, India
2
Centre for Plant Breeding and Genetics, Tamil Nadu Agricultural University (TNAU), Coimbatore 641003, India
3
Nutrition Cluster, International Crops Research Institute for the Semi-Arid Tropics (ICRISAT), Patancheru 502324, India
4
Office of the Registrar, Tamil Nadu Agricultural University (TNAU), Coimbatore 641003, India
5
International Potato Center (CIP), Lima 1558, Peru
*
Author to whom correspondence should be addressed.
Sustainability 2022, 14(9), 4918; https://doi.org/10.3390/su14094918
Submission received: 1 March 2022 / Revised: 30 March 2022 / Accepted: 30 March 2022 / Published: 20 April 2022

Abstract

:
Pigeonpea is a protein-rich legume which is consumed worldwide in a variety of forms (whole seed, dhal, and as a green vegetable). In India, pigeonpea is milled to yield dhal (cotyledon) and this process generates 25–35% waste byproducts. The hull (seed coat) which accounts for 10% of the byproduct is disposed of either as waste or low-cost cattle feed. To recycle the waste byproducts into the food value chain, this study was conducted with the objectives: (i) to estimate nutrient accumulation in the major seed fractions (cotyledon and seed coat), (ii) to estimate the percentage of nutrient contribution by major seed fractions, (iii) to assess the percentage of nutrient loss due to dehulling, and (iv) to determine the scope of seed coat in nutritional value addition. For this, a subset of 60 diverse pigeonpea accessions selected from 600 pigeonpea accessions raised during the 2019 and 2020 rainy seasons at ICRISAT, Patancheru, India, was subjected to a cotyledon and seed coat nutrient analysis. The three-way analysis of variance revealed the significant influence of cropping years, seed fractions, genotypes, and their interactions on nutrient accumulation. The nutrients, namely protein (32.28 ± 2.29%), P (476.51 ± 39.05 mg/100 g), K (1557.73 ± 66.82 mg/100 g), Fe (4.42 ± 0.41 mg/100 g), Zn (2.25 ± 0.21 mg/100 g), and Cu (0.95 ± 0.07 mg/100 g) were enriched in cotyledon. Mn was equally enriched in both the cotyledon and seed coat (1.02 ± 0.12 mg/100 g and 0.97 ± 0.34 mg/100 g, respectively). The seed coat had a high concentration of Ca (652.02 ± 114.82 mg/100 g), and Mg (249.19 ± 34.12 mg/100 g) with wide variability for Fe (2.74–5.61 mg/100 g), Zn (0.88–3.95 mg/100 g), Cu (0.38–1.44 mg/100 g), and Mn (0.58–2.18 mg/100 g). It is noteworthy that the protein and P contents in the cotyledon were 7 and 18 times higher than that in the seed coat, respectively, and the Ca content in the seed coat was 12 times higher than that in the cotyledon. A correlation study revealed that for overall nutrient improvement in dhal, selection for a small seed size was desirable. On an average, the percentage of nutrient contribution by major seed fractions revealed that the cotyledon portion contributed around 95% protein and P; 90% K and Zn; 85% Fe, Cu, and Mn; and 75% Mg, while the seed coat portion contributed nearly 65% Ca to the whole grain. The findings of high Fe and protein concentrations in the cotyledon and high Ca accumulation in the seed coat can serve as a new guide for improved technological fractionation of these components to serve as a novel functional food ingredient and as a dietary supplement that can address malnutrition.

1. Introduction

Pigeonpea is a pulse crop grown mostly in the semi-arid tropics, which serves as an affordable main or alternate protein source for the major populations in Asia and Africa. India is the major consumer, and accounted for 82% and 77% of global pigeonpea cultivation and production for the year 2020 [1]. In addition to protein, pigeonpea has an appreciable amount of Ca, Mn, crude fiber, fat, and trace elements [2]. Pigeonpea is consumed in a variety of forms such as dhal (dehulled grain), whole grain, and green vegetable. In combination with cereal as a fermented food, it is consumed as tempeh, dhokla, dhal patties, adai, and kadaba [3].
Consumption of pigeonpea is reported either with the seed coat (whole grain) or without the seed coat (dhal). In Africa, pigeonpea is mostly consumed with the seed coat due to a lack of local processing facilities in rural areas [4]. Hence, understanding the nutritional composition of various seed parts is important. The anatomical parts of pulse seeds vary in chemical composition and the whole seed remains inhomogeneous as that in cereals. Singh et al. (1968) [5] studied the nutritional composition in different seed components of seven major cultivated pulses of India including pigeonpea and reported the enrichment of ash, protein, ether extract, nitrogen-free extract, and phosphorus in the cotyledon and high density of Ca and Fe in the seed coat. Adding to this, Moraghan et al. (2006) [6] reported the differential accumulation of Ca and Mg in soybean and common bean seed coats. Another study conducted on common bean reported a high concentration of Ca, Fe, Zn, and Cu in the seed coat with narrow variation for potassium between the seed coat and embryo [7]. Blair et al. (2013) [8] reported that most of the micronutrients (B, Cu, Fe, K, Mn, P, and S) were concentrated in the cotyledon, and very few nutrients such as Ca and Mg were predominant in the seed coat, with Zn being equally enriched in both the fractions in common bean.
Pulses, in general, are processed to reduce the anti-nutritional factors, improve consumer acceptability, and increase nutrient bioavailability [9]. Milling of pigeonpea yields 65–75% dhal and 25–35% byproducts [10]. The major byproducts of pigeonpea processing are pigeonpea brokens (3–8%), powder (15%), and hull (10%) [11]. However, some work has been conducted to add value to these byproducts. Silky et al. (2014) [12] used broken flour to prepare high protein-rich biscuits. The proteinaceous powder fraction produced by denuding the outer layer of cotyledon has been found to be a novel nutraceutical protein [13]. Pulse seed coat remains to be an under-utilized human food despite high fiber, substantial nutrient content, and phytochemicals [9]. However, very few pulses, namely pea and lupin, find their seed coat flour application as a commercial dietary fiber ingredient. Dalgetty and Baik (2006) [14] fortified wheat bread with high fiber from peas, chickpea, and lentil seed coat flour (up to 7%). The chickpea hull flour (5%) was found to improve the quality of low-fat chicken nuggets [15]. Replacement of wheat flour, up to 21%, with broad bean seed coat flour has been shown to create no impact on the texture and volume of the bread [16]. Despite high fiber content, the mineral content in the seed coat was appreciable. The use of lentil, pea, and faba bean seed coats in noodle production amplified the crude ash, dietary fiber, Ca, and Mg content [17].
The production of waste byproducts from the processing industry is inevitable and identified as a potential source of proteins, lipids, starch, micronutrients, bioactive compounds, and dietary fibers [18]. In fact, these compounds were better enriched in the byproducts than in the final processed product [19]. However, effective and efficient use of agro-industrial waste in generating functional foods and dietary supplements (secondary agriculture) can address malnutrition, promote health standards, reduce the impact of waste on the environment, and generate economic gains [18]. The high demand for nutraceuticals from consumers and food producers has also created a huge market [20]. Byproducts’ recycling in cereals, vegetables, and fruits has been performed extensively, whereas pulses remain underutilized. Exploring the bioactive compounds in pulse milling byproducts could find its application in the field of nutraceuticals.
Pigeonpea is the second most cultivated legume crop in India, which generates approximately 0.39 million tons of hull (calculated as 10% of grain) by processing 3.89 million tons of grain (production for the year, 2020) [1]. Processing in pigeonpea is inevitable and necessitates proper waste byproduct management. The pigeonpea whole grain (154.12 ± 24.23 mg Ca/100 g, unpublished data) [21] contain approximately 40% of the calcium content found in popularly known staple coarse grain for calcium such as finger millet (364 ± 58 mg/100 g) [22]. Further, few pulses have been reported to have higher Ca accumulation in the seed coat than in the whole grain and/or cotyledon [5,8]. In cereals, the bran portion has been found to be rich in Fe and Zn [23,24] and few legumes had similar enrichment in the seed coat. However, with the basic information available on whole grain calcium content, it will be interesting to study the variation available for calcium content and other nutrients in major seed fractions. Calcium is an important mineral for bone formation and strengthening especially in critical growth stages of children, therefore, it would be interesting for researchers, pharmaceutical, and food industries to see how this calcium and other nutrients that are usually lost during the dehulling process can be brought back to the food value chain. This further requires adequate evidence on calcium and other nutrient content of the hull extracted from various pigeonpea cultivars.
With this background, this study was conducted with the objectives: (i) to estimate the nutrient contents in major seed fractions (cotyledon including embryo, and seed coat), (ii) to estimate the percentage of the nutrient contribution by the cotyledon (dhal) and the seed coat (hull) to the whole grain, (iii) to assess the nutrient loss due to dehulling and (iv) to determine the scope of the seed coat in terms of nutritional value addition.

2. Materials and Methods

This study was designed to estimate the nutrient contents in the cotyledon and seed coat fractions of 60 pigeonpea accessions (Table S1). The 60 diverse pigeonpea accessions were selected from 600 pigeonpea accessions evaluated during the 2019 rainy and 2020 rainy seasons. The genetic resources used were the germplasms conserved at the Rajendra Singh Paroda Genebank, ICRISAT, Patancheru, India.

2.1. Field Layout and Soil Properties

The 600 pigeonpea accessions along with two controls were planted in an augmented design during the rainy seasons of 2019 and 2020. The field trial for both the cropping years was conducted in Alfisols at ICRISAT, Patancheru, India (located at 17.51° N latitude, 78.27° E longitude, and 545 m above mean sea level). As per the USDA soil taxonomy, the soil belongs to the fine loamy mixed isohyperthermic family of Udic Rhodustalf. The top 30 cm of soil in the experimental field had 7.22 pH, 0.07 dS/m EC, 0.42% organic matter, 7.5 mg/kg P, 67 mg/kg K, 1116 mg/kg exchangeable Ca, 368 mg/kg of exchangeable Mg, 6.1 mg/kg Fe, 1.39 mg/kg Zn, 1.34 mg/kg Cu, and 18.53 mg/kg Mn in the 2019 rainy season and 6.97 pH, 0.08 dS/m EC, 0.45% organic matter, 18.67 mg/kg P, 79 mg/kg K, 1057 mg/kg exchangeable Ca, 340 mg/kg of exchangeable Mg, 8.93 mg/kg Fe, 4.24 mg/kg Zn, 1.25 mg/kg Cu, and 17.54 mg/kg Mn in the 2020 rainy season.

2.2. Agronomic Practices

For each cropping season, the agronomic practices started with the basal application of DAP (diammonium phosphate) at a rate of 100 kg/hectare. The sowing was performed in the last week of July in both the cropping seasons. Each accession was sown in a 4 m row with an inter-row spacing of 75 cm. Seedlings were thinned 21 days after sowing to maintain optimum plant density with a plant-to-plant spacing of 25 cm. Optimum field conditions were maintained throughout the cropping season following an approved package of practices. After harvesting, the yield from every single plant of accession was bulked and 100-seed weight was taken from 100 random seeds from the bulk. Clean, dust-free seeds weighing 15 g, from the bulk of each accession, were forwarded for whole grain nutrient analysis.

2.3. Whole Grain Nutrient Analysis of the Entire Set

The whole grain samples of 600 pigeonpea accessions, each from the 2019 rainy and 2020 rainy seasons, were submitted to the Charles Renard Analytical Laboratory, ICRISAT to estimate Ca, protein, P, K, Mg, Fe, Zn, Cu, and Mn. For protein estimation, the sulfuric acid-selenium digestion method was followed, and the digests were analyzed in a continuous flow autoanalyzer to obtain the total N value, from which protein (%) was calculated by multiplying the total N with a 6.25 conversion factor [25]. Estimations of Ca, P, K, Cu, Mg, Mn, Fe, and Zn were achieved by digesting the samples using the nitric acid-hydrogen peroxide digestion method and analyzing the digests in a Microwave Plasma Atomic Emission Spectrometry (MP-AES) [26].

2.4. Selection Criteria for the Formation of Subset

The 100-seed weight and whole grain Ca content of 600 pigeonpea accessions evaluated during the 2019 rainy and 2020 rainy seasons were used as selection criteria for the formation of the subset. The sample size of 60 accessions for the present study was fixed to represent 10% of the original set (600 accessions). The selection criteria involve two steps. First step: Categorizing the accessions based on the 100-seed weight in both the cropping years (2019 rainy and 2020 rainy) and selecting the accessions with consistent 100-seed weight in both the cropping years. The 100-seed weight was assigned as a primary factor for shortlisting the accessions owing to its high heritability [27,28]. Second step: The selected accessions were further screened for consistent Ca content in both cropping years and covering the entire Ca range. The number of accessions from each 100-seed weight category was fixed proportionately based on the contribution of the original set of accessions to each 100-seed weight category as presented in Table 1. The subset did not represent accessions with ≤5.00 g 100-seed weight category, as the accessions were wild species with insufficient seed quantity.

2.5. Cotyledon and Seed Coat Nutrient Analysis in the Subset

The whole grain samples (two sets, 2019 rainy and 2020 rainy season) of 60 diverse pigeonpea accessions (subset) were derived from the bulk yield of 600 pigeonpea accessions evaluated during the 2019 rainy and 2020 rainy seasons, respectively. An accession was represented by two samples, one from the 2019 rainy and another from the 2020 rainy crop. Within the cropping year, the samples from each accession were not replicated. The whole grain samples, each weighing 15 g, were oven-dried at 120 °C for six minutes [29] to facilitate the loosening of the seed coat for dehulling. The oven-dried samples were dehulled using a stone pestle and mortar and sieved to separate the cotyledon (whole and splits) and seed coat (hull). In total, 120 cotyledon and 120 seed coat samples of 60 diverse pigeonpea accessions from the two cropping years were submitted to the Charles Renard Analytical Laboratory, ICRISAT to estimate Ca, protein, P, K, Mg, Fe, Zn, Cu, and Mn. The nutrients estimation were done following the same methodology mentioned in Section 2.3.

2.6. Calculation of Whole Grain Nutrient Content and Percentage of Seed Fractions Nutrients in Whole Grain

Whole grain nutrient content of the subset was calculated by summing up the cotyledonary nutrient per 86 g and seed coat nutrient per 14 g. The values, i.e., 86 g (86%) and 14 g (14%), refer to the fraction of cotyledon (includes embryo) and seed coat dry matter contained in 100 g of dry seed [30]. This calculated whole grain nutrient was used for all downstream analysis.
The percentage of nutrient in cotyledon and seed coat can be estimated as follows:
P e r   c e n t   o f   c o t y l e d o n a r y   n u t r i e n t   i n   g r a i n = N u t r i e n t   p e r   86   g   o f   c o t y l e d o n   C a l c u l a t e d   g r a i n   n u t r i e n t   p e r   100   g × 100
P e r   c e n t   o f   s e e d   c o a t   n u t r i e n t   i n   g r a i n = N u t r i e n t   p e r   14   g   o f   s e e d   c o a t   C a l c u l a t e d   g r a i n   n u t r i e n t   p e r   100   g × 100

2.7. Statistical Analysis

The analysis of nutrient contents in cotyledon and seed coat fractions of 60 pigeonpea accessions (subset) was performed according to a factorial design with three factors, namely cropping year (2019 rainy and 2020 rainy crop), seed fractions (cotyledon and seed coat), and genotypes (60 diverse pigeonpea accessions). The analysis of variance (ANOVA) without replication divided the sources of variation into main effects (cropping year, seed fraction, and genotype) and interaction effects (cropping year × seed fraction, cropping year × genotype, and seed fraction × genotype). The three-way ANOVA was performed using R software R.4.0.2 [31] with R base function “aov()”. Factors with significant interaction were subjected to Tukey’s test [32] to test the significant mean difference at 5% probability using the R-CRAN package “agricolae” [33] and visualized using the R base function “boxplot()” and the R-CRAN package “multcompView” [34]. Association of grain nutrients with 100-seed weight in cotyledon and seed coat fractions was performed using the R-CRAN package “correlation” [35].

3. Results

The grain nutrient content in the subset reflected the original set for Ca content alone (Table 2). For the other nutrients, the range values were slightly narrowed down from the original set. Variations for protein content in the subset were from 22.69 to 30.63%. Fe and Zn, (the nutrients of global interest) exhibited a variation of 2.93–4.23 mg/100 g and 2.46–3.74 mg/100 g, respectively, in the subset. The three-way analysis of variance revealed that the grain nutrient content varied significantly (p ≤ 0.01) with cropping years (except for Ca), seed fractions, and the genotypes (Table 3). The interaction factors, namely cropping year × seed fraction and seed fraction × genotype, varied significantly (p ≤ 0.05) for all the nutrients studied, whereas the cropping year × genotype interaction varied significantly (p ≤ 0.05) only for Zn, Cu, and Mn.

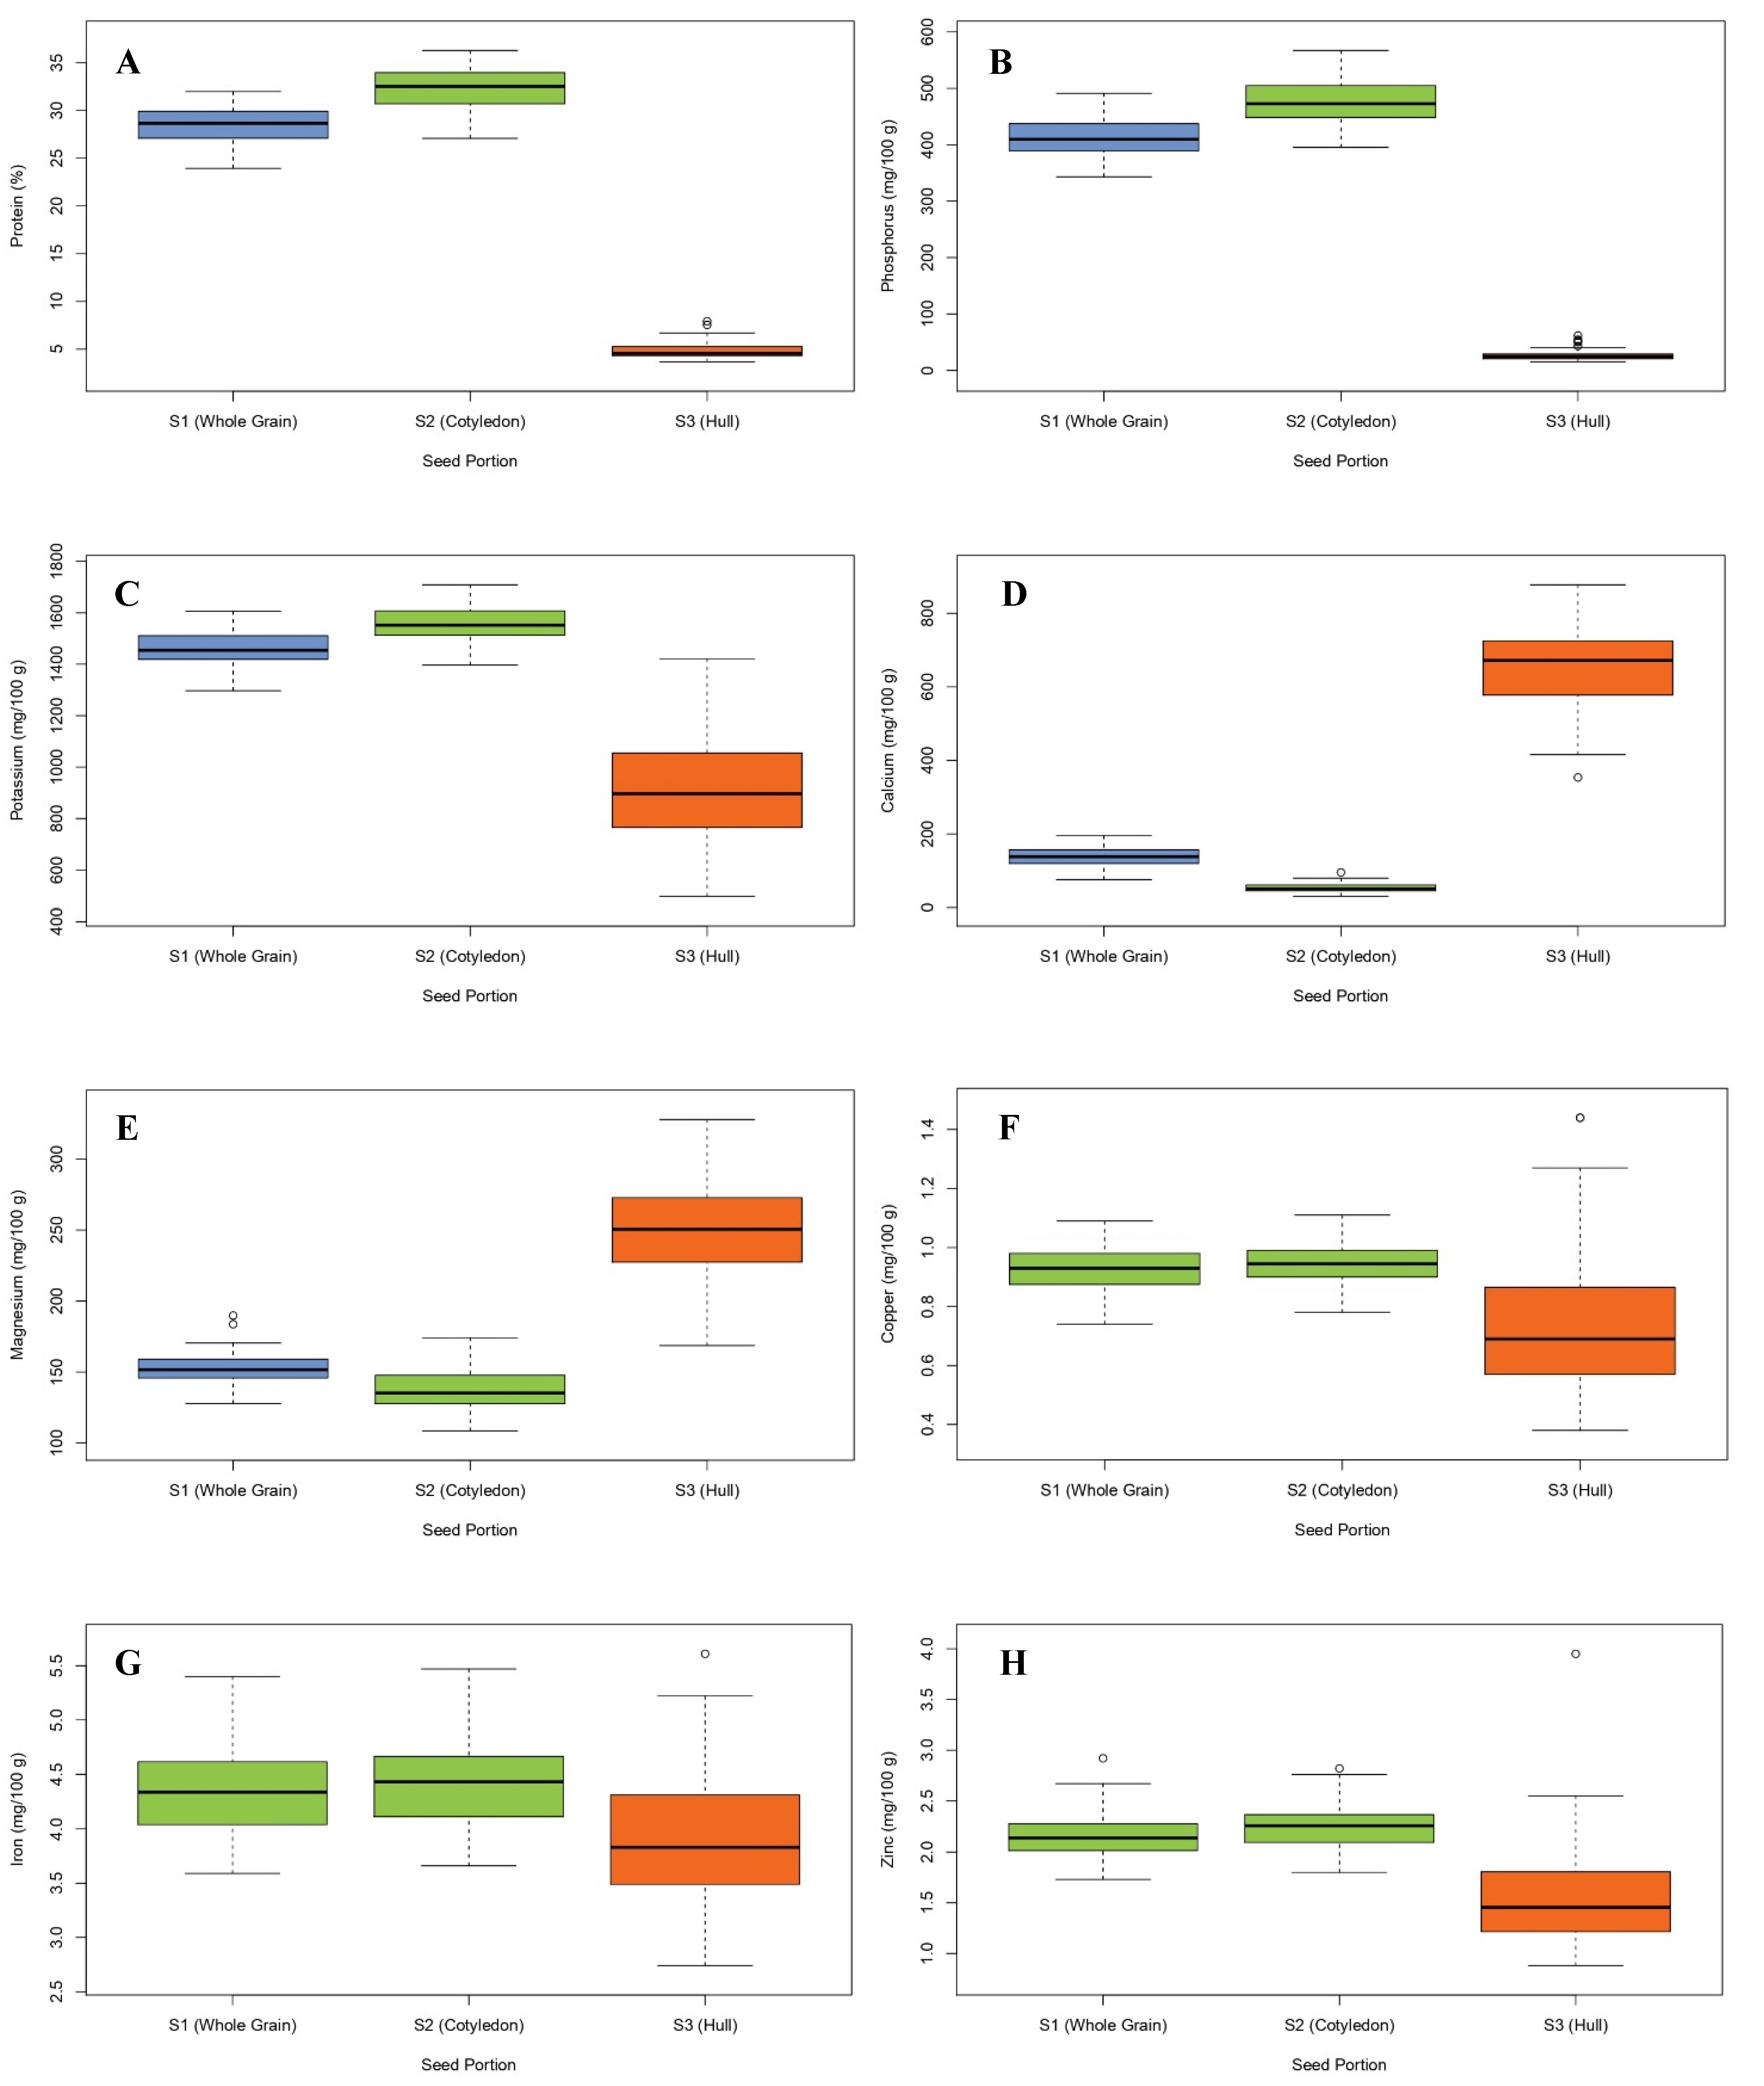
3.1. Distribution of Nutrients in Cotyledon and Seed Coat

The mean comparison based on Tukey’s test between cropping years (2019 rainy and 2020 rainy) for the nine-grain nutrients is presented in Table 4. The results revealed that the Ca accumulation in whole grain (calculated), cotyledon, and seed coat was not significantly influenced by the cropping years (2019 rainy and 2020 rainy). The whole grain (calculated) from the 2019 rainy season crop had significantly higher protein, K, Fe, Zn, and Cu (p ≤ 0.05) than the 2020 rainy crop but the opposite existed for P and Mn accumulation. Magnesium in whole grain (calculated) remained unaffected in both the cropping years (2019 rainy and 2020 rainy). Concerning cotyledon, the 2019 rainy season crop had significantly higher protein, K, Fe, and Mn (p ≤ 0.05) than the 2020 rainy season crop, except for Mg and Zn with no significant difference, and P and Cu which were significantly higher in the 2020 rainy season crop. For seed coat, protein, Zn, and K showed no significant differences between cropping years (2019 rainy and 2020 rainy), whereas P, Mg, Fe, and Mn (p ≤ 0.05) were significantly higher in the 2019 rainy season crop, and this was reversed for Cu. However, the trend of nutrient accumulation in cotyledon (high in protein, P, K, Fe, Zn, Cu and Mn compared to seed coat), and seed coat (high in Ca and Mg compared to cotyledon) of the 2019 rainy season crop was reflected in the 2020 rainy season crop as well.
The comparison of mean nutrient accumulation in the whole grain (calculated), cotyledon, and seed coat based on Tukey’s test revealed a significant difference (p ≤ 0.05) for all nutrients, except Mn (Table 5 and Figure 1). Whole grain (calculated) and cotyledon exhibited no significant difference for Fe, Zn, Mn, and Cu accumulation, however, for other nutrients, namely protein, P, K, Ca, and Mg, the nutrient content in whole grain (calculated) varied significantly (p ≤ 0.05) from cotyledon and seed coat with intermediate nutrient content. The mean protein and P accumulations in the cotyledon (32.28 ± 2.29%, and 476.51 ± 39.05 mg/100 g, respectively) were significantly (p ≤ 0.05) higher than their accumulations in the seed coat (protein, 4.91 ± 0.88%, and P, 27.20 ± 10.03 mg/100 g). In contrast, the accumulation of Ca (652.02 ± 114.82 mg/100 g) in the seed coat was significantly (p ≤ 0.05) higher as compared with an average of 53.25 ± 13.02 mg/100 g in the cotyledon. The other nutrients, namely K, Fe, Zn, and Cu were significantly (p ≤ 0.05) higher in the cotyledon, while Mg was significantly higher in the seed coat.
The accessions were diverse for nutrient accumulation in cotyledon and seed coat (Table 5, Tables S2 and S3). Among the genotypes, the protein content in cotyledon (27.09–36.30%) showed a considerable variation as compared with that in the seed coat (3.67–7.93%). Dense accumulation accompanied by wide variability was observed for Ca and Mg (353.71–877.66 mg/100 g and 168.63–327.95 mg/100 g, respectively) in the seed coat. Despite high mean concentrations, the variabilities observed for Fe (3.66–5.47 mg/100 g), Zn (1.80–2.82 mg/100 g), Cu (0.78–1.11 mg/100 g) and Mn (0.78–1.32 mg/100 g) in cotyledon were narrower than in the seed coat (2.74–5.61 mg/100 g, 0.88–3.95 mg/100 g, 0.38–1.44 mg/100 g, and 0.58–2.18 mg/100 g for Fe, Zn, Cu and Mn, respectively). Close observation of the range values revealed that the nutrient contents in the seed coats of a few accessions were surpassing their corresponding cotyledonary nutrient contents (Table 5, Table S3). The numbers of accessions with this deviation were 10, 4, 8, and 21 for Fe, Zn, Cu, and Mn, respectively. Accessions outperforming the trial mean of whole grain (calculated), cotyledon, and seed coat nutrients were 13 for protein, 10 for P, 14 for K, 25 for Ca, 9 for Mg, 18 for Fe, 13 for Zn, 15 for Cu, and 9 for Mn (Table 6).

3.2. Correlations between Nutrient Content Per 100 g in Cotyledon and Seed Coat with 100-Seed Weight

The results of the Pearson correlation co-efficient confirmed that the interaction of nutrients among themselves and with 100-seed weight in different biological tissues of the seed were not parallel (Table 7 and Table 8). In cotyledon, the 100-seed weight had a negative and highly significant correlation with protein, Fe, Zn, Mg, and Mn (p ≤ 0.01) (Table 7). Protein content had positive correlation with all the nutrients while it was significant (p < 0.01 or p ≤ 0.001) only for P, K, Mg, Fe, Zn and Mn. Highly significant positive associations (p ≤ 0.001) of P with Cu and Zn, and Ca with Mg and Mn were observed. Positive significant correlations were observed for K with P and Zn (p ≤ 0.01), and between Fe and Cu (p ≤ 0.05). The correlation between Fe and Zn was positive and highly significant (p ≤ 0.001) and there was a similar correlation between Cu and Zn.
In seed coat, 100-seed weight observed significant positive correlations with Cu (p ≤ 0.001), Mn and K (p ≤ 0.01), and protein (p ≤ 0.05). Protein content showed a positive significant correlation with P, K, Mn (p ≤ 0.001), and Cu (p ≤ 0.01). Ca content in the seed coat was significantly positively correlated with Cu and Mn (p ≤ 0.01), while it showed a significant negative correlation with Mg and Zn (p ≤ 0.01), and was non-significant with protein, P, K, and Fe. Fe content was significantly positively correlated with Zn, P and, K (p ≤ 0.05), while it was positive and non-significantly associated with other nutrients and 100-seed weight as well (Table 8).

3.3. Nutrient Contribution by Cotyledon and Seed Coat to Whole Grain

Cotyledon occupying the major portion of the pigeonpea grain contributed a high proportion of grain nutrients, except Ca (Table 9). On average, cotyledon holds a major share of protein (97.58 ± 0.45%), P (99.08 ± 0.33%), K (91.48 ± 1.61%), Mg (77.11 ± 3.50%), Fe (87.40 ± 1.61%), Zn (90.05 ± 2.49%), Cu (88.68 ± 3.09%), and Mn (86.59 ± 4.17%) whereas for Ca, seed coat holds the highest (66.78 ± 3.33%). The percentage of cotyledon or seed coat nutrient contribution to the grain varied greatly with the genotypes (Table 9 and Table S4). The variation was quite narrower for P (1.35%) and protein (2.40%). Contrary to this, the variation for Mn was wide (20.43%). While all other nutrients varied from 6.92% (Fe) to 16.28% (Mg).

3.4. Nutrient Loss due to Dehulling

The nutrient loss due to dehulling refers to the fraction of nutrients that are lost while removing the seed coat (Table 9). Dehulling drastically reduced the Ca and Mg content on average by 66.78 ± 3.33% and 22.89 ± 3.50%, respectively. Among the accessions, this loss reached a maximum of 72.21% for Ca and 30.54% for Mg. The nutrients with minimum loss were P and protein with 0.92 ± 0.33% and 2.42 ± 0.45%, respectively. The loss of protein reached a maximum of 4.1%, whereas for P it was just 1.8%. However other nutrients were also prone to loss but to a lesser extent (8.52 ± 1.61% for K to 13.41 ± 4.17% for Mn). The loss of nutrients in some of the major nutrients of global interest ranged from 9.53–16.45% for Fe and 5.95–18.91% for Zn. For other nutrients, the minimum and maximum losses were 5.34–12.39% for K, 6.43–20.15% for Cu, and 7.12–27.55% for Mn. The numbers of accessions with minimum losses of nutrients as compared with the overall means were: 40 for protein, 35 for P, 30 for K, 33 for Ca, 29 for Mg, 34 for Fe, 36 for Zn, 36 for Cu, and 37 for Mn.

4. Discussion

The deficiency of vital micronutrients causes malnutrition. Malnutrition indicators for the year 2020 disclosed that 149.2 million children under 5 years of age were stunted, 45.4 million were wasted, 38.9 million were overweight, and regretfully, 45% of children’s deaths were linked to undernutrition [36]. Fortification, supplementation, and dietary diversification were identified as a three-pronged approach to reduce malnutrition [37]. Meenakshi et al. (2010) [38] emphasized that biofortification of the staple food crops that make up the diet of the resource-poor farmers and the undernourished population can certainly address this, since their production and consumption stay on-farm or locally. Developing countries generate a huge amount of waste in the course of food production and processing. Torres-León et al. (2018) [18] specified that the management of waste byproducts can certainly minimize malnutrition and hunger in terms of functional food and dietary supplement production. Pigeonpea, a legume crop of developing countries that feeds the resource-poor farmers and the malnourished population can serve this purpose.
The three-way analysis of variance among 60 pigeonpea accessions revealed the existence of genetic variability and the sensitivity of nutrient accumulation in the cotyledon and seed coat (Table 3) to the cropping years. This suggests the need for an evaluation of genotypes in multiple environments to understand the effect of genotypes, environments, and soil types on nutrient accumulation in pigeonpea grain and seed fractions. Several studies have enumerated the influence of extraneous factors, namely soil, climate, genotype, and fertilizer treatment in grain nutrient accumulation [39,40]. Further, in common bean for nutrients, namely Ca, K, Fe and Cu, the significant influence of crop cycle, cultivar, and seed fractions have been reported [7].

4.1. Nutrient Contents in Major Seed Fractions

As an individual fraction of seed, the cotyledon was proteinaceous and enriched with P, K, Fe, Zn, and Cu, while the seed coat was rich in Ca and Mg. Irrespective of the pulse, protein remained enriched in the cotyledon [5,41,42], and Ca remained enriched in the seed coat [5,7,8]; however, the enrichment of other minerals fluctuated. Concerning Fe and Zn accumulation, it is quite interesting. In cereals, the bran which encompasses the seed coat portion was found to be rich in Fe and Zn [43,44] but in legumes, the seed coat was found to be Fe enriched [5] and cotyledon was found to be Zn enriched [7,8]. However, in pigeonpea, both Fe and Zn were enriched in the cotyledon. This is contradictory to the high Fe accumulation in the seed coat of a single pigeonpea accession examined by Singh et al. (1968) [5]. Mg accumulation in soybean cotyledon is parallel to Fe accumulation in pigeonpea cotyledon. In general, legumes have high Mg in the seed coat, but the contrary is found in soybean genotypes with high Mg in cotyledon [6]. Fe accumulation in cotyledon is of immense importance, as this portion remains unaffected during processing and any enrichment in the cotyledonary region will directly reach the target (undernourished population) that can fight against anemia. In the future, much focus should be given to understand the underlying molecular mechanism that governs cotyledonary Fe enrichment, and to identify the genes linked and their cloning.
Nutrient accumulation in cotyledon and seed coat varied widely among the genotypes. The variability was wider in the seed coat than in the cotyledon. The variability for Fe, Zn, Cu, and Mn were more pronounced in the seed coat as compared with the cotyledon and few accessions were found to have these nutrients comparatively higher in the seed coat (Table S3). Analogous to this, in common bean, Cvitanich et al. (2010) [45] observed wide variations for seed coat Fe and added that Fe accumulation in seed coat was found to be genotype-dependent. Balanced nutrient accumulation in whole grain, cotyledon, and the seed coat is essential as whole grain and dhal are used for direct human consumption and the seed coat portion can find its place in functional foods as in the case of other pulses [14,15,16,17]. Accessions superior to the trial mean of whole grain (calculated), dhal, and seed coat can serve this purpose. The nutritionally dense accessions identified for each nutrient were 13 for high protein, 10 for P, 14 for K, 25 for Ca, 9 for Mg, 18 for Fe, 13 for Zn, 15 for Cu, and 9 for Mn which could be used for overall whole grain, dhal, and seed coat biofortification, as there is no separate breeding for pigeonpea whole grain and dhal rather than vegetable pigeonpea.
The correlation study revealed that protein improvement in cotyledon necessitates selection for small seed size which simultaneously improves P, K, Mg, Fe, Zn, and Mn. Therefore, for overall nutrient improvement in cotyledon, selection should be conducted against 100-seed weight. Reichert and Ehiwe (1987) [46] reported a significant negative association of 1000-seed weight with dehulling efficiency in pigeonpea. This report adds the value of improving dehulling efficiency along with nutritional improvement. The association of protein content with 100-seed weight remained the same as that of pigeonpea whole grain [47,48]. The unique association of Fe with P in pigeonpea seed coat was also reported in common bean by Blair et al. (2013) [8], who reported that the association of Fe with P might be influenced by the binding of P with tannins and other seed coat substances which also binds Fe.

4.2. Nutrient Contribution by Cotyledon and Seed Coat to Whole Grain

The percentage of nutrient contribution to the whole grain was predominantly from the cotyledonary portion for most of the nutrients other than Ca (Table 7). Despite, higher Mg concentration in the seed coat, the contribution of this nutrient to the whole grain was much lower. The reason is the proportion of seed coat that makes up the seed (14%). For a nutrient in the seed coat to have its contribution superior than the cotyledonary nutrient to the whole grain, it is not sufficient to just have nutrient content higher than the cotyledonary nutrient but it demands multiple fold enrichment of that nutrient in the seed coat. Singh et al. (1968) [5] drew the same conclusion that the cotyledon occupying the major seed portion accounted for the entire grain nutritional value, and milling made no apparent difference between the whole grain and the cotyledon, except for Ca.

4.3. Nutrient Loss due to Dehulling

Calcium (66.78 ± 3.33%) and Mg (22.89 ± 3.50%) were the major nutrients lost during dehulling. To avoid this nutrient loss, the consumption of whole grains needs to be encouraged. However, dhal (cotyledon) is the major consumption form, and therefore, this loss needs to be minimized. Wide variability for nutrient loss provides an opportunity for selecting accessions with minimum nutrient loss. Two accessions, ICP 8354 and ICP 8392 (57.93%) showed a minimum loss of Ca. Similarly, ICP 8354 (14.26%) for Mg, ICP 6834 (9.53%) for Fe, ICP 11465 (5.95%) for Zn, ICP 4370 (6.43%) for Cu, and ICP 844 (7.12%) for Mn showed a minimum loss after dehulling. Incorporating these accessions in the breeding program can reduce nutrient loss after dehulling. However, more than 50% of the accessions have incurred nutrient loss less than the overall mean for all nutrients.

4.4. Scope of Seed Coat in Value Addition

The seed coat of pigeonpea is rich in calcium. Calcium is crucial for bone formation and metabolism and is essential across all life stages. Any imbalance leads to rickets (infants and children), osteomalacia (adults), and osteoporosis (with aging) [49]. Calcium in the Indian diet reports a drastic decline and supplementing Ca through the dietary or elementary source is a must [50]. The seed coat Ca content (652.02 ±114.82 mg/100 g) reported in this study made a huge difference with rice bran [24], wheat bran [23], and oat bran [51]. Comparing the data with Moraghan et al. (2006) [6], the Ca enrichment in the seed coat among legumes was in the order of common bean > pigeonpea > soybean. However, only 12 genotypes were used in that study as compared with 60 accessions in our study, which too were selected from a diverse set of 600 accessions. The Ca in the pigeonpea seed coat (652.02 ± 114.82 mg/100 g) was found to be 79% higher than the Ca dense finger millet (364 ± 58 mg/100 g) [22]. This seed coat fraction (10%) generated by the processing industry is disposed of either as waste or cattle feed [11]. For instance, the production of pigeonpea in India for the year 2020 was 3.89 million tons of grain, which produced 0.39 million tons of hull after milling (calculated as 10% of byproduct). These 0.39 million tons can hold 2542.80 tons of calcium which can supplement 6.9 million people for a year with a recommended daily allowance of 1000 mg [52]. The use of seafood waste as a source of calcium supplement was reported by Yan and Chen (2015) [53] and Singh et al. (2021) [54]. Further, Kaya et al. (2018) [17] reported the use of legume hulls in noodle preparation which enhanced the Ca and Mg content. Food waste contains anti-nutritional factors which limit their use in the food industry as they interfere with palatability, the bioavailability of nutrients, and digestion [18]. Pigeonpea grain also contains some anti-nutritional factors, namely, trypsin inhibitor, amylase inhibitor, total phenols, tannins, and phytic acid; however, their significant reduction while processing needs to be quoted. Soaking the pigeonpea grain in distilled water or salt solutions reduced the total phenol, tannin, and phytates significantly [55]. A combination of soaking (12 h) and boiling (80 min) detoxified trypsin inhibitor (98%), hemagglutinin (100%), hydrogen cyanide (100%), alkaloids (39%), and tannin (100%) in pigeonpea [56]. Further, Torres-León et al. (2018) [18] mentioned fermentation as the most efficient method of reducing the anti-nutritional factors and enhancing protein digestibility.

5. Future Prospects and Conclusions

The key findings of this study are the striking differences made by protein, P, and Ca accumulations in the cotyledon and seed coat portion, respectively. Mostly, cotyledon contained high nutrients as compared with the seed coat, except for Ca and Mg. Therefore, dehulling does not significantly affect the nutrient contents in the dhal, except for Ca and Mg. The predominant accumulation of Fe in the cotyledon makes this legume distinct from other legumes and cereals. This unique property also needs in-depth study on its genetics, as any enrichment in this portion is not lost during processing. This can address anemia in developing countries and the results may stay appreciable. Since pigeonpea seed coat is rich in Ca and Mg, the utilization of seed coat as a functional food needs a detailed study on the optimization of the level of usage of seed coat in food to minimize the interference of anti-nutritional factors such as phytates and to meet the quality standards of safe food. An effective waste management strategy and the demand for nutraceuticals provide a new opportunity to use the seed coat as a raw material for the preparation of dietary supplements. Plant-based micronutrient capsules have better absorption than synthetics. This creates a new field of research in pigeonpea for maximum utilization of the available nutrients, rather than hoping for the unavailable nutrients. Therefore, extensive research on the extraction of these biomolecules and their bioavailability in vivo and in vitro can support developing pigeonpea seed coat-based biomolecule-rich dietary supplements that can minimize micronutrient malnutrition.

Supplementary Materials

The following supporting information can be downloaded at https://www.mdpi.com/article/10.3390/su14094918/s1, Table S1: Passport details of the 60 pigeonpea accessions analyzed for cotyledon and seed coat nutrient contents, Tables S2 and S3: Nutrients available per 100 g of whole grain (calculated), cotyledon, and seed coat in 60 diverse pigeonpea accessions, Table S4: Percentage of nutrient contribution by cotyledon and seed coat to the whole grain in 60 diverse pigeonpea accessions.

Author Contributions

K.S. to the conception and design of the study (this work is part of D.S’s PhD thesis research); T.K., V.C.R.A. and K.S. supported student research as supervisors; O.P. provided seed material and laboratory support; S.R. supported data collection and V.N.A. data documentation; D.S., R.S., M.V., T.K. and K.S. curated the data and performed the formal data analysis; S.M., P.J., D.S., M.V. and S.A. supported data validation and visualization; D.S., M.V. and K.S. were involved in writing the original draft, reviewing, and editing. All authors have read and agreed to the published version of the manuscript.

Funding

This study was undertaken as part of the CGIAR Genebank platform coordinated by Crop Trust, and the CGIAR Research Program on Grain Legumes and Dryland Cereals.

Institutional Review Board Statement

Not applicable.

Informed Consent Statement

Not applicable.

Data Availability Statement

Data supporting the research is contained within the article and in the supplementary material (https://www.mdpi.com/article/10.3390/su14094918/s1).

Acknowledgments

The authors are thankful to the scientific officers Ganesh Pawar and Raja Srinivas, and the research technicians, Ravi, Judson Babu, Jyothi, Rajashree, Ranganath, and Shivaraj working at Genebank, ICRISAT for their technical support in the field and laboratory; also duly acknowledge Charles Renard Analytical Laboratory, ICRISAT, Hyderabad for their support in the nutrient analysis, and Farm & Engineering Services, ICRISAT for sharing the soil properties of the experimental fields. The research scholar is grateful to ICRISAT for providing a stipend for the entire study program at ICRISAT and duly acknowledges Learning Systems Unit, ICRISAT for facilitation.

Conflicts of Interest

The authors declare no conflict of interest.

References

  1. FAOSTAT. Available online: https://www.fao.org/faostat/en/#data/QCL (accessed on 15 January 2022).
  2. Saxena, K.B.; Kumar, R.V.; Sultana, R. Quality Nutrition through Pigeonpea—A Review. Health 2010, 2, 1335–1344. [Google Scholar] [CrossRef] [Green Version]
  3. Salunkhe, D.K.; Chavan, J.K.; Kadam, S.S. Pigeonpea as an Important Food Source. CRC Crit. Rev. Food Sci. Nutr. 1986, 23, 103–145. [Google Scholar] [CrossRef] [PubMed]
  4. Wangari, C.; Mwema, C.; Siambi, M.; Silim, S.; Ubwe, R.; Malesi, K.; Anitha, S.; Kane-Potaka, J. Changing Perception through a Participatory Approach by Involving Adolescent School Children in Evaluating Smart Food Dishes in School Feeding Programs–Real-Time Experience from Central and Northern Tanzania. Ecol. Food Nutr. 2020, 59, 472–485. [Google Scholar] [CrossRef] [PubMed] [Green Version]
  5. Singh, S.; Singh, H.D.; Sikka, K.C. Distribution of Nutrients in the Anatomical Parts of Common Indian Pulses. Cereal Chem. 1968, 45, 13–18. [Google Scholar]
  6. Moraghan, J.T.; Etchevers, J.D.; Padilla, J. Contrasting Accumulations of Calcium and Magnesium in Seed Coats and Embryos of Common Bean and Soybean. Food Chem. 2006, 95, 554–561. [Google Scholar] [CrossRef]
  7. Ribeiro, N.D.; Maziero, S.M.; Prigol, M.; Nogueira, C.W.; Rosa, D.P.; Possobom, M.T.D.F. Mineral Concentrations in the Embryo and Seed Coat of Common Bean Cultivars. J. Food Compos. Anal. 2012, 26, 89–95. [Google Scholar] [CrossRef] [Green Version]
  8. Blair, M.W.; Izquierdo, P.; Astudillo, C.; Grusak, M.A. A Legume Biofortification Quandary: Variability and Genetic Control of Seed Coat Micronutrient Accumulation in Common Beans. Front. Plant Sci. 2013, 4, 275. [Google Scholar] [CrossRef] [Green Version]
  9. Zhong, L.; Fang, Z.; Wahlqvist, M.L.; Wu, G.; Hodgson, J.M.; Johnson, S.K. Seed Coats of Pulses as a Food Ingredient: Characterization, Processing, and Applications. Trends Food Sci. Technol. 2018, 80, 35–42. [Google Scholar] [CrossRef] [Green Version]
  10. Singh, F.; Diwakar, B. Nutritive Value and Uses of Pigeonpea and Groundnut; ICRISAT Human Resource Development Program: Hyderabad, India, 1993; pp. 1–52. [Google Scholar]
  11. Kurien, P.P.; Parpia, H.A.B. Pulse Milling in India—I—Processing and Milling of Tur, Arhar (Cajanus cajan Linn.). J. Food Sci. Technol. 1968, 5, 203–207. [Google Scholar]
  12. Silky; Gupta, M.P.; Tiwari, A. Development of High Protein Biscuits Using Pigeon Pea Brokens Flour. Int. J. Eng. Innov. Technol. 2014, 4, 84–89. [Google Scholar]
  13. Tapal, A.; Vegarud, G.E.; Sreedhara, A.; Kaul Tiku, P. Nutraceutical Protein Isolate from Pigeon Pea (Cajanus cajan) Milling Waste by-Product: Functional Aspects and Digestibility. Food Funct. 2019, 10, 2710–2719. [Google Scholar] [CrossRef] [PubMed]
  14. Dalgetty, D.D.; Baik, B.K. Fortification of Bread with Hulls and Cotyledon Fibers Isolated from Peas, Lentils, and Chickpeas. Cereal Chem. 2006, 83, 269–274. [Google Scholar] [CrossRef]
  15. Verma, A.K.; Banerjee, R.; Sharma, B.D. Quality of Low Fat Chicken Nuggets: Effect of Sodium Chloride Replacement and Added Chickpea (Cicer arietinum L.) Hull Flour. Asian-Australas. J. Anim. Sci. 2012, 25, 291–298. [Google Scholar] [CrossRef] [PubMed] [Green Version]
  16. Ni, Q.; Ranawana, V.; Hayes, H.E.; Hayward, N.J.; Stead, D.; Raikos, V. Addition of Broad Bean Hull to Wheat Flour for the Development of High-Fiber Bread: Effects on Physical and Nutritional Properties. Foods 2020, 9, 1192. [Google Scholar] [CrossRef]
  17. Kaya, E.; Yılmaz Tuncel, N.; Tuncel, N.B. Utilization of Lentil, Pea, and Faba Bean Hulls in Turkish Noodle Production. J. Food Sci. Technol. 2018, 55, 1734–1745. [Google Scholar] [CrossRef]
  18. Torres-León, C.; Ramírez-Guzman, N.; Londoño-Hernandez, L.; Martinez-Medina, G.A.; Díaz-Herrera, R.; Navarro-Macias, V.; Alvarez-Pérez, O.B.; Picazo, B.; Villarreal-Vázquez, M.; Ascacio-Valdes, J.; et al. Food Waste and Byproducts: An Opportunity to Minimize Malnutrition and Hunger in Developing Countries. Front. Sustain. Food Syst. 2018, 2, 1–17. [Google Scholar] [CrossRef]
  19. Ayala-Zavala, J.F.; Vega-Vega, V.; Rosas-Domínguez, C.; Palafox-Carlos, H.; Villa-Rodriguez, J.A.; Siddiqui, M.W.; Dávila-Aviña, J.E.; González-Aguilar, G.A. Agro-Industrial Potential of Exotic Fruit Byproducts as a Source of Food Additives. Food Res. Int. 2011, 44, 1866–1874. [Google Scholar] [CrossRef]
  20. Sawicka, B.H.; Ziarati, P.; Krochmal-Marczak, B.; Skiba, D. Nutraceuticals in Food and Pharmacy. A Review. Agron. Sci. 2020, 74, 7–31. [Google Scholar] [CrossRef]
  21. Susmitha, D.; Kalaimagal, T.; Senthil, R.; Vetriventhan, M.; Reddymalla, S.; Ovais, P.; Kuldeep, S. Genetic Variability Assessment in Pigeonpea Landraces for Grain Nutrients Improvement, Patancheru, India, 2022; Manuscript in preparation.
  22. Longvah, T.; Ananthan, R.; Bhaskarachary, K.; Venkaiah, K. Indian Food Composition Tables; National Institute of Nutrition: Hyderabad, India, 2017; pp. 1–505. [Google Scholar]
  23. Aivaz, M.; Mosharraf, L. Influence of Different Treatments and Particle Size of Wheat Bran on Its Mineral and Physicochemical Characteristics. Int. Acad. J. Int. J. Agric. Sci. 2013, 3, 608–619. [Google Scholar]
  24. Bhosale, S.; Vijayalakshmi, D. Processing and Nutritional Composition of Rice Bran. Curr. Res. Nutr. Food Sci. 2015, 3, 74–80. [Google Scholar] [CrossRef]
  25. Sahrawat, K.L.; Kumar, G.R.; Murthy, K.V.S. Sulfuric Acid-Selenium Digestion for Multi-Element Analysis in a Single Plant Digest. Commun. Soil Sci. Plant Anal. 2002, 33, 3757–3765. [Google Scholar] [CrossRef] [Green Version]
  26. Wheal, M.S.; Fowles, T.O.; Palmer, L.T. A Cost-Effective Acid Digestion Method Using Closed Polypropylene Tubes for Inductively Coupled Plasma Optical Emission Spectrometry (ICP-OES) Analysis of Plant Essential Elements. Anal. Meth. 2011, 3, 2854–2863. [Google Scholar] [CrossRef]
  27. Shruthi, H.B.; Hingane, A.J.; Sekhar, M.R.; Kumar, C.V.S.; Srivarsha, J. Genetic Variability for Yield, Physiological and Quality Traits in Novel Super-Early Pigeonpea (Cajanus cajan (L.) Millsp.). India J. Pure Appl. Biosci. 2019, 7, 378–385. [Google Scholar] [CrossRef]
  28. Rao, V.T.; Rao, P.J.M. Studies on Genetic Variability and Character Association in Pigeonpea (Cajanus cajan (L.) Mill Sp.). Int. J. Chem. Stud. 2020, 8, 1051–1053. [Google Scholar] [CrossRef]
  29. Opoku, A.; Tabil, L.; Sundaram, J.; Crerar, W.J.; Park, S.J. Conditioning and Dehulling of Pigeon Peas and Mung Beans. Can. Soc. Eng. Agric. Food Biol. Syst. 2003, 3, 1–19. [Google Scholar]
  30. Saxena, K.B.; Kumar, R.V.; Rao, P.V. Pigeonpea Nutrition and Its Improvement. J. Crop Prod. 2002, 5, 227–260. [Google Scholar] [CrossRef] [Green Version]
  31. R Core Team. A Language and Environment for Statistical Computing; R Foundation for Statistical Computing: Vienna, Austria, 2021; Available online: https://www.R-project.org/ (accessed on 9 January 2022).
  32. Tukey, J.W. Exploratory Data Analysis; Mosteller, F., Ed.; Addison-Wesley Publishing Company: Boston, MA, USA, 1977; pp. 1–677. [Google Scholar]
  33. de Mendiburu, F. Agricolae: Statistical Procedures for Agricultural Research. R Package Version 1.3–5. 2021. Available online: https://cran.r-project.org/package=agricolae (accessed on 9 January 2022).
  34. Hothorn, T.; Bretz, F.; Westfall, P. Simultaneous Inference in General Parametric Models. Biom. J. 2008, 50, 346–363. Available online: https://CRAN.R-project.org/package=multcompView (accessed on 18 March 2022). [CrossRef] [Green Version]
  35. Makowski, D.; Ben-Shachar, M.; Patil, I.; Lüdecke, D. Methods and Algorithms for Correlation Analysis in R. J. Open Source Softw. 2020, 5, 2306. [Google Scholar] [CrossRef]
  36. JME. The UNICEF/WHO/WB Joint Child Malnutrition Estimates (JME) Group Released New Data for 2021. Available online: https://www.who.int/news-room/fact-sheets/detail/malnutrition (accessed on 9 January 2022).
  37. BMZ. Supplementation, Food Fortification and Dietary Diversification a Three-Pronged Approach to Reducing Hidden Hunger; Federal Ministry for Economic Cooperation and Development (BMZ), Division for Public Relations, Information and Education BMZ, Directorate for Rural Development and Global Food Security: Bonn, Germany, 2012; Available online: https://www.bmz.be (accessed on 15 January 2022).
  38. Meenakshi, J.V.; Johnson, N.L.; Manyong, V.M.; De Groote, H.; Javelosa, J.; Yanggen, D.R.; Naher, F.; Gonzalez, C.; García, J.; Meng, E. How Cost-Effective Is Biofortification in Combating Micronutrient Malnutrition? An Ex Ante Assessment. World Dev. 2010, 38, 64–75. [Google Scholar] [CrossRef] [Green Version]
  39. Hanumanthappa, D.; Maruthi, S.N.; Shakuntala, J.B. Enrichment of Iron and Zinc Content in Pigeonpea Genotypes through Agronomic Biofortification to Mitigate Malnutrition. Int. J. Curr. Microbiol. Appl. Sci. 2018, 7, 4334–4342. [Google Scholar]
  40. Behera, S.K.; Shukla, A.K.; Tiwari, P.K.; Tripathi, A.; Singh, P.; Trivedi, V.; Patra, A.K.; Das, S. Classification of Pigeonpea (Cajanus cajan (l.) Millsp.) Genotypes for Zinc Efficiency. Plants 2020, 9, 952. [Google Scholar] [CrossRef] [PubMed]
  41. Sreerama, Y.N.; Neelam, D.A.; Sashikala, V.B.; Pratape, V.M. Distribution of Nutrients and Antinutrients in Milled Fractions of Chickpea and Horse Gram: Seed Coat Phenolics and Their Distinct Modes of Enzyme Inhibition. J. Agric. Food Chem. 2010, 58, 4322–4330. [Google Scholar] [CrossRef] [PubMed]
  42. Wood, J.A.; Knights, E.J.; Campbell, G.M.; Choct, M. Differences between Easy- and Difficult-to-Mill Chickpea (Cicer arietinum L.) Genotypes. Part I: Broad Chemical Composition. J. Sci. Food Agric. 2014, 94, 1437–1445. [Google Scholar] [CrossRef]
  43. Kumar, U.; Mathpal, P.; Malik, S.; Kumar, N.; Kumar, S.; Chugh, V.; Sheikh, I.; Sharma, P.; Singh, T.; Dhaliwal, H.S.; et al. Evaluation of Iron and Zinc in Grain and Grain Fractions of Hexaploid Wheat and Its Related Species for Possible Utilization in Wheat Biofortification. Plant Genet. Resour. Charact. Util. 2016, 14, 101–111. [Google Scholar] [CrossRef]
  44. Ziarati, P.; Azizi, N. Chemical Characteristics and Mineral Contents in Whole Rice Grains, Hulls, Brown Rice, Bran, and Polished Ali Kazemi Rice in Gilan Province—North of Iran. Int. J. Farming Allied Sci. 2013, 2, 1203–1209. [Google Scholar]
  45. Cvitanich, C.; Przybyłowicz, W.J.; Urbanski, D.F.; Jurkiewicz, A.M.; Mesjasz-Przybyłowicz, J.; Blair, M.W.; Astudillo, C.; Jensen, E.T.; Stougaard, J. Iron and Ferritin Accumulate in Separate Cellular Locations in Phaseolus Seeds. BMC Plant Biol. 2010, 10, 26. [Google Scholar] [CrossRef] [Green Version]
  46. Reichert, A.O.F.; Ehiwe, R.D. Variability in Dehulling Quality of Cowpea, Pigeonpea, Mung Bean Cultivars Determined with the Tangential Abrasive Dehulling Device. Cereal Chem. 1987, 2, 86–90. [Google Scholar]
  47. Saxena, K.B.; Faris, D.G.; Singh, U.; Kumar, R.V. Relationship between Seed Size and Protein Content in Newly Developed High Protein Lines of Pigeonpea. Qual. Plant. Plant Foods Hum. Nutr. 1987, 36, 335–340. [Google Scholar] [CrossRef]
  48. Obala, J.; Saxena, R.K.; Singh, V.K.; Vechalapu, S.; Das, R.; Sameer-Kumar, C.V.; Saxena, K.; Tongoona, P.; Sibiya, J.; Rajeev, K. Genetic Variation and Relationships of Total Seed Protein Content with Some Agronomic Traits in Pigeonpea (Cajanus cajan (L.) Millsp.). Aust. J. Crop Sci. 2018, 12, 1859–1865. [Google Scholar] [CrossRef]
  49. IOM (Institute of Medicine). Dietary Reference Intakes for Calcium and Vitamin D; The National Academic Press: Washington, DC, USA, 2011. [Google Scholar]
  50. Harinarayan, C.V.; Akhila, H.; Shanthisree, E. Modern India and Dietary Calcium Deficiency—Half a Century Nutrition Data—Retrospect–Introspect and the Road Ahead. Front. Endocrinol. 2021, 12, 583654. [Google Scholar] [CrossRef]
  51. USDA. Food Data Central. Available online: https://fdc.nal.usda.gov/fdc-app.html#/food-details/168872/nutrients (accessed on 15 January 2022).
  52. ICMR-NIN. Nutrient Requirements for Indians—ICMR-NIN. 2020. Available online: https://www.metabolichealthdigest.com/nutrient-requirements-for-indians-icmr-nin-2020/ (accessed on 15 January 2022).
  53. Yan, N.; Chen, X. Sustainability: Don’t Waste Seafood Waste. Nature 2015, 524, 155–157. [Google Scholar] [CrossRef] [PubMed]
  54. Singh, A.; Kelkar, N.; Natarajan, K.; Selvaraj, S. Review on the Extraction of Calcium Supplements from Eggshells to Combat Waste Generation and Chronic Calcium Deficiency. Environ. Sci. Pollut. Res. 2021, 28, 46985–46998. [Google Scholar] [CrossRef] [PubMed]
  55. Devi, R.; Chaudhary, C.; Jain, V.; Chawla, S.; Saxena, A.K. Effect of Soaking on Anti-Nutritional Factors in the Sun-Dried Seeds of Hybrid Pigeon Pea to Enhance Their Nutrients Bioavailability. J. Pharmacogn. Phytochem. 2018, 7, 675–680. [Google Scholar]
  56. Onwuka, G.I. Soaking, Boiling and Antinutritional Factors in Pigeon Peas (Cajanus cajan) and Cowpeas (Vigna unguiculata). J. Food Process. Preserv. 2006, 30, 616–630. [Google Scholar] [CrossRef]
Figure 1. Boxplot depicting the mean comparison of the nutrient available per 100 g in whole grain (calculated), cotyledon, and seed coat (AI) of 60 diverse pigeonpea accessions pooled over cropping years. Note: Boxes with the same color for a nutrient represents an insignificant difference in mean at p ≤ 0.05, whereas boxes with a different color represent a significant difference in mean at p ≤ 0.05.
Sustainability 14 04918 g001aSustainability 14 04918 g001b
Table 1. Number of accessions and Ca range of the original set and subset of pigeonpea accessions in each 100-seed weight category.
S. No.100-Seed Weight
(g)
Number of AccessionsRange of Calcium (mg/kg)
Original SetSubsetOriginal SetSubset
1≤5.002-1968.03–2045.30-
25.01–10.00349311020.04–2304.691023.26–2304.69
310.01–15.0020418913.53–2043.89963.33–2043.89
415.01–20.00419840.16–2304.05840.16–1848.74
5≥20.01421171.77–1714.111303.55–1714.11
Total60060840.16–2304.05840.16–2304.70
Table 2. Range of nutrients in the original set and subset of pigeonpea accessions.
TraitOriginal Set
(600 Accessions)
Subset
(60 Accessions)
Protein (%)19.24–32.4322.69–30.63
P (mg/100 g)268.10–637.64319.20–577.91
K (mg/100 g)1237.62–1911.441309.46–1691.09
Ca (mg/100 g)84.02–230.4784.02–230.47
Mg (mg/100 g)120.42–200.06131.05–200.06
Fe (mg/100 g)2.46–4.832.93–4.23
Zn (mg/100 g)2.18–3.802.46–3.74
Cu (mg/100 g)0.70–1.520.95–1.44
Mn (mg/100 g)0.78–1.600.78–1.33
100-seed weight (g)1.59–22.586.35–20.74
P, phosphorus; K, potassium; Ca, calcium; Mg, magnesium; Fe, iron; Zn, zinc; Cu, copper; Mn, manganese.
Table 3. Analysis of variance of nutrients estimated in the cotyledon and seed coat fractions of the subset (60 diverse pigeonpea accessions) obtained from two cropping years.
Source of
Variation
dfMean Sum of Squares (MSS)
ProteinPKCaMgFeZnCuMn
A178 **6304 **2,529,448 **22619877 **35.7 **0.933 **0.941 **0.6448 **
B145,205 **12,112,858 **26,695,154 **21,511,986 **747,261 **15.37 **30.062 **0.134 **2.3721 **
C596 **1678 **44,947 **15,535 **994 **0.76 **0.373 **0.121 **0.0677 **
A × B148 **14,565 **1,172,575 **5783 *8180 **5.29 **0.081 *0.252 **0.0889 **
A × C592435959815102250.280.106 **0.021 *0.0245 **
B × C596 **1572 **35,407 **11,173 **1741 **0.33 *0.219 **0.133 **0.0569 **
Within592413856511931930.20.0490.01240.0109
A, cropping year; B, seed fraction; C, genotype; df, degrees of freedom; P, phosphorus; K, potassium; Ca, calcium; Mg, magnesium; Fe, iron; Zn, zinc; Cu, copper; Mn, manganese. * and ** significant at 0.05 and 0.01 probability levels, respectively.
Table 4. Mean and range of the nutrients available per 100 g of whole grain (calculated), cotyledon, and seed coat of 60 diverse pigeonpea accessions from 2019 and 2020 rainy seasons.
NutrientsWhole Grain (Calculated)CotyledonSeed Coat
Mean ± SDRangeMean ± SDRangeMean ± SDRange
201920202019202020192020201920202019202020192020
Protein
(%)
29.41
± 2.45 a
27.62
± 2.25 b
24.49–
36.44
21.55–
32.65
33.38
± 2.87 a
31.33
± 2.58 b
27.47–
41.52
24.40–
37.03
5.03
± 0.87 a
4.78
± 1.14 a
3.58–
8.01
3.48–
8.41
P
(mg/100 g)
402.87
± 40.01 b
424.34
± 35.30 a
325.08–
496.55
343.46–
502.3
463.59
± 46.71 b
489.42
± 40.49 a
374.29–
574.13
397.37–
571.45
29.86
± 9.66 a
24.53
± 13.55 b
17.66–
66.85
7.34–
77.50
K
(mg/100 g)
1621.36
± 103.78 a
1315.39
± 81.40 b
1428.46–
1849.82
1083.78–
1530.17
1734.32
± 109.85 a
1389.20
± 87.43 b
1532.87–
1977.21
1172.90–
1686.13
927.50
± 197.61 a
861.97
± 199.39 a
563.81–
1412.91
430.66–
1430.59
Ca
(mg/100 g)
137.54
± 28.39 a
136.61
± 24.58 a
69.57–
208.43
81.66–
181.98
55.08
± 14.28 a
51.41
± 13.10 a
29.34–
105.25
30.64–
85.74
644.04
± 127.40 a
660.00
± 113.15 a
316.68–
900.43
390.74–
893.38
Mg
(mg/100 g)
155.43
± 11.05 a
151.01
± 14.00 a
133.29–
192.97
122.21–
186.49
138.17
± 13.66 a
137.02
± 17.00 a
110.58–
169.92
102.18–
182.32
261.45
± 38.46 a
236.94
± 34.62 b
156.02–
349.93
169.73–
307.2
Fe
(mg/100 g)
4.63
± 0.47 a
4.07
± 0.43 b
3.75–
5.76
3.12–
5.14
4.66
± 0.50 a
4.18
± 0.44 b
3.69–
5.86
3.23–
5.25
4.45
± 0.80 a
3.38
± 0.70 b
2.69–
6.31
2.28–
5.04
Zn
(mg/100 g)
2.20
± 0.29 a
2.10
± 0.21 b
1.55–
3.27
1.58–
2.57
2.29
± 0.28 a
2.20
± 0.21 a
1.64–
3.17
1.65–
2.61
1.62
± 0.61 a
1.46
± 0.50 a
0.83–
4.53
0.59–
3.36
Cu
(mg/100 g)
1.05
± 0.14 a
0.97
± 0.11 b
0.78–
1.35
0.77–
1.34
0.92
± 0.15 b
0.98
± 0.12 a
0.66–
1.14
0.82–
1.23
0.68
± 0.24 b
0.82
± 0.29 a
0.34–
1.42
0.41–
1.7
Mn
(mg/100 g)
0.88
± 0.10 b
0.96
± 0.09 a
0.62–
1.11
0.78–
1.21
1.05
± 0.10 a
0.99
± 0.08 b
0.74–
1.38
0.81–
1.4
1.07
± 0.35 a
0.88
± 0.36 b
0.57–
2.23
0.49–
2.14
P, phosphorus; K, potassium; Ca, calcium; Mg, magnesium; Fe, iron; Zn, zinc; Cu, copper; Mn, manganese. Mean ± SD followed by the same letter in superscript (across columns) represents an insignificant difference at p ≤ 0.05 and mean ± SD followed by a different letter (across columns) in superscript represents a significant difference at p ≤ 0.05 following Tukey’s test.
Table 5. Mean and range of the nutrients available per 100 g in whole grain (calculated), cotyledon, and seed coat of 60 diverse pigeonpea accessions pooled over cropping years.
NutrientMean ± SDRange
Whole Grain
(Calculated)
CotyledonSeed CoatWhole Grain
(Calculated)
CotyledonSeed Coat
Protein (%)28.45 ± 1.97 b32.28 ± 2.29 a4.91 ± 0.88 c23.94–31.9927.09–36.303.67–7.93
P (mg/100 g)413.60 ± 33.70 b476.51 ± 39.05 a27.20 ± 10.03 c343.28–491.28395.29–567.1915.12–61.89
K (mg/100 g)1464.91 ± 68.14 b1557.73 ± 66.82 a894.73 ± 18.80 c1296.95–1606.251396.86–1709.04497.23–1421.75
Ca (mg/100 g)137.07 ± 25.42 b53.25 ± 13.02 c652.02 ± 114.82 a75.62–195.2130.34–95.50353.71–877.66
Mg (mg/100 g)153.22 ± 11.33 b137.60 ± 14.26 c249.19 ± 34.12 a127.75–189.73108.48–174.21168.63–327.95
Fe (mg/100 g)4.35 ± 0.39 a4.42 ± 0.41 a3.91 ± 0.62 b3.59–5.403.66–5.472.74–5.61
Zn (mg/100 g)2.15 ± 0.22 a2.25 ± 0.21 a1.54 ± 0.50 b1.73–2.921.80–2.820.88–3.95
Cu (mg/100 g)0.92 ± 0.08 a0.95 ± 0.07 a0.75 ± 0.24 b0.74–1.090.78–1.110.38–1.44
Mn (mg/100 g)1.01 ± 0.11 a1.02 ± 0.12 a0.97 ± 0.34 a0.79–1.260.78–1.320.58–2.18
P, phosphorus; K, potassium; Ca, calcium; Mg, magnesium; Fe, iron; Zn, zinc; Cu, copper; Mn, manganese. Mean ± SD followed by the same letter (across columns) in superscript represents an insignificant difference at p ≤ 0.05 and mean ± SD followed by a different letter (across columns) in superscript represents a significant difference at p ≤ 0.05 following Tukey’s test.
Table 6. Accessions with superior nutrient content in whole grain (calculated), cotyledon, and seed coat compared to the trial mean.
NutrientNo. of
Accessions
AccessionsWhole Grain
(Calculated)
CotyledonSeed Coat
Protein
(%)
13ICP# 4370, 4729, 5925, 7903, 8194, 8392, 10876, 11465, 11487, 12043, 15245, 16844, 1185028.88–
31.99
32.72–
36.30
4.94–
6.70
P
(mg/100 g)
10ICP# 9137, 9146, 11487, 7903, 11465, 11472, 10876, 15099, 8392, 8354 416.62–
480.98
479.47–
549.20
27.65–
61.89
K
(mg/100 g)
14ICP# 4370, 4729, 5925, 7903, 9132, 9139, 9146, 10176, 11350, 11465, 11487, 13828, 13857, 141671511.10–
1606.25
1581.53–
1709.04
925.32–
1421.75
Ca
(mg/100 g)
25ICP# 844, 1514, 3451, 6834, 7869, 7870, 7982, 8178, 8354, 8392, 8407, 9137, 9146, 9152, 9317, 10876, 11472, 11850, 12023, 12043, 14598, 14866, 15242, 15597, 7221139.22–
195.21
54.00–
95.50
654.36–
877.66
Mg
(mg/100 g)
9ICP# 7869, 11348, 12043, 12048, 15242, 4400, 15597, 7870, 8863156.54–
189.73
140.20–
170.39
254.01–
308.57
Fe
(mg/100 g)
18ICP# 844, 3451, 4729, 6834, 7870, 8194, 8392, 8407, 10176, 10876, 11487, 12041, 13828, 15242, 15245, 16844, 4400, 88634.41–
5.40
4.43–
5.47
3.94–
5.61
Zn
(mg/100 g)
13ICP# 4729, 5925, 11350, 11485, 11487, 12041, 13828,13857, 14598, 15245, 15489, 16844, 88632.21–
2.92
2.27–
2.82
1.68–
3.95
Cu
(mg/100 g)
15ICP# 7407, 9146, 10876, 11350, 11485, 11487, 12041,13542, 13828, 13857, 14378, 14598, 9152, 16844, 155970.95–
1.09
0.95–
1.11
0.78–
1.44
Mn
(mg/100 g)
9ICP# 7870, 7982, 8178, 8392, 10876, 11472, 12023, 12043, 138281.04–
1.26
1.03–
1.24
0.98–
1.43
P, phosphorus; K, potassium; Ca, calcium; Mg, magnesium; Fe, iron; Zn, zinc; Cu, copper; Mn, manganese.
Table 7. Correlations between nutrients available per 100 g of cotyledon with 100-seed weight.
PKCaMgFeZnCuMnSW
Protein0.448 ***0.400 **0.1230.381 **0.573 ***0.709 ***0.0830.374 **−0.680 ***
P 0.374 **−0.1680.0670.2300.607 ***0.415 ***−0.075−0.161
K −0.0260.1110.1030.368 **0.1810.061−0.122
Ca 0.742 ***0.0520.073−0.0890.821 ***−0.166
Mg 0.2330.223−0.0580.782 ***−0.394 **
Fe 0.630 ***0.315 *0.227−0.547 ***
Zn 0.463 ***0.183−0.453 ***
Cu −0.1020.073
Mn −0.386 ***
P, phosphorus; K, potassium; Ca, calcium; Mg, magnesium; Fe, iron; Zn, zinc; Cu, copper; Mn, manganese; SW, 100-seed weight. *** Significant at p ≤ 0.001, ** significant at p ≤ 0.01, and * significant at p ≤ 0.05.
Table 8. Correlations between nutrients available per 100 g of seed coat with 100-seed weight.
PKCaMgFeZnCuMnSW
Protein0.816 ***0.534 ***0.192−0.0650.400−0.0380.339 **0.661 ***0.273 *
P 0.341 **0.179−0.2340.319 *−0.0460.2260.404 **−0.013
K 0.0000.273 *0.273 *0.1590.357 **0.609 ***0.470 **
Ca −0.382 **0.025−0.402 **0.342 **0.404 **0.143
Mg 0.1540.386 **0.0380.0330.242
Fe 0.254 *0.2120.1830.065
Zn 0.285 *−0.187−0.079
Cu 0.544 ***0.441 ***
Mn 0.653**
P, phosphorus; K, potassium; Ca, calcium; Mg, magnesium; Fe, iron; Zn, zinc; Cu, copper; Mn, manganese; SW, 100-seed weight. *** Significant at p ≤ 0.001, ** significant at p ≤ 0.01, * significant at p ≤ 0.05.
Table 9. Mean and range of percentage of nutrient contribution by cotyledon and seed coat fractions to the whole grain.
NutrientCotyledon
(%)
Seed Coat (%) or
Dehulling Nutrient Loss (%)
Range of Nutrient Loss and/or Contribution (%) *No. of Accessions with Dehulling Nutrient Loss Lesser than the Trial Mean
Mean ± SDMinMaxMean ± SDMinMax
Protein 97.58 ± 0.4595.9098.302.42 ± 0.451.704.102.4040
P 99.08 ± 0.3398.2099.550.92 ± 0.330.451.801.3535
K91.48 ± 1.6187.6194.668.52 ± 1.615.3412.397.0530
Ca 33.22 ± 3.3327.7942.0766.78 ± 3.3357.9372.2114.2833
Mg 77.11 ± 3.5069.4685.7422.89 ± 3.5014.2630.5416.2829
Fe 87.40 ± 1.6183.5590.4712.60 ± 1.619.5316.456.9234
Zn 90.05 ± 2.4981.0994.059.95 ± 2.495.9518.9112.9636
Cu 88.68 ± 3.0979.8593.5711.32 ± 3.096.4320.1513.7236
Mn 86.59 ± 4.1772.4592.8813.41 ± 4.177.1227.5520.4337
P, phosphorus; K, potassium; Ca, calcium; Mg, magnesium; Fe, iron; Zn, zinc; Cu, copper; Mn, manganese; Min, minimum; Max, maximum. * Range calculated as a maximum minus minimum.
Publisher’s Note: MDPI stays neutral with regard to jurisdictional claims in published maps and institutional affiliations.

