
Baseline Marine Litter Surveys along Vietnam Coasts Using Citizen Science Approach


 ,
,  ,
,
Abstract
1. Introduction
2. Materials and Methods
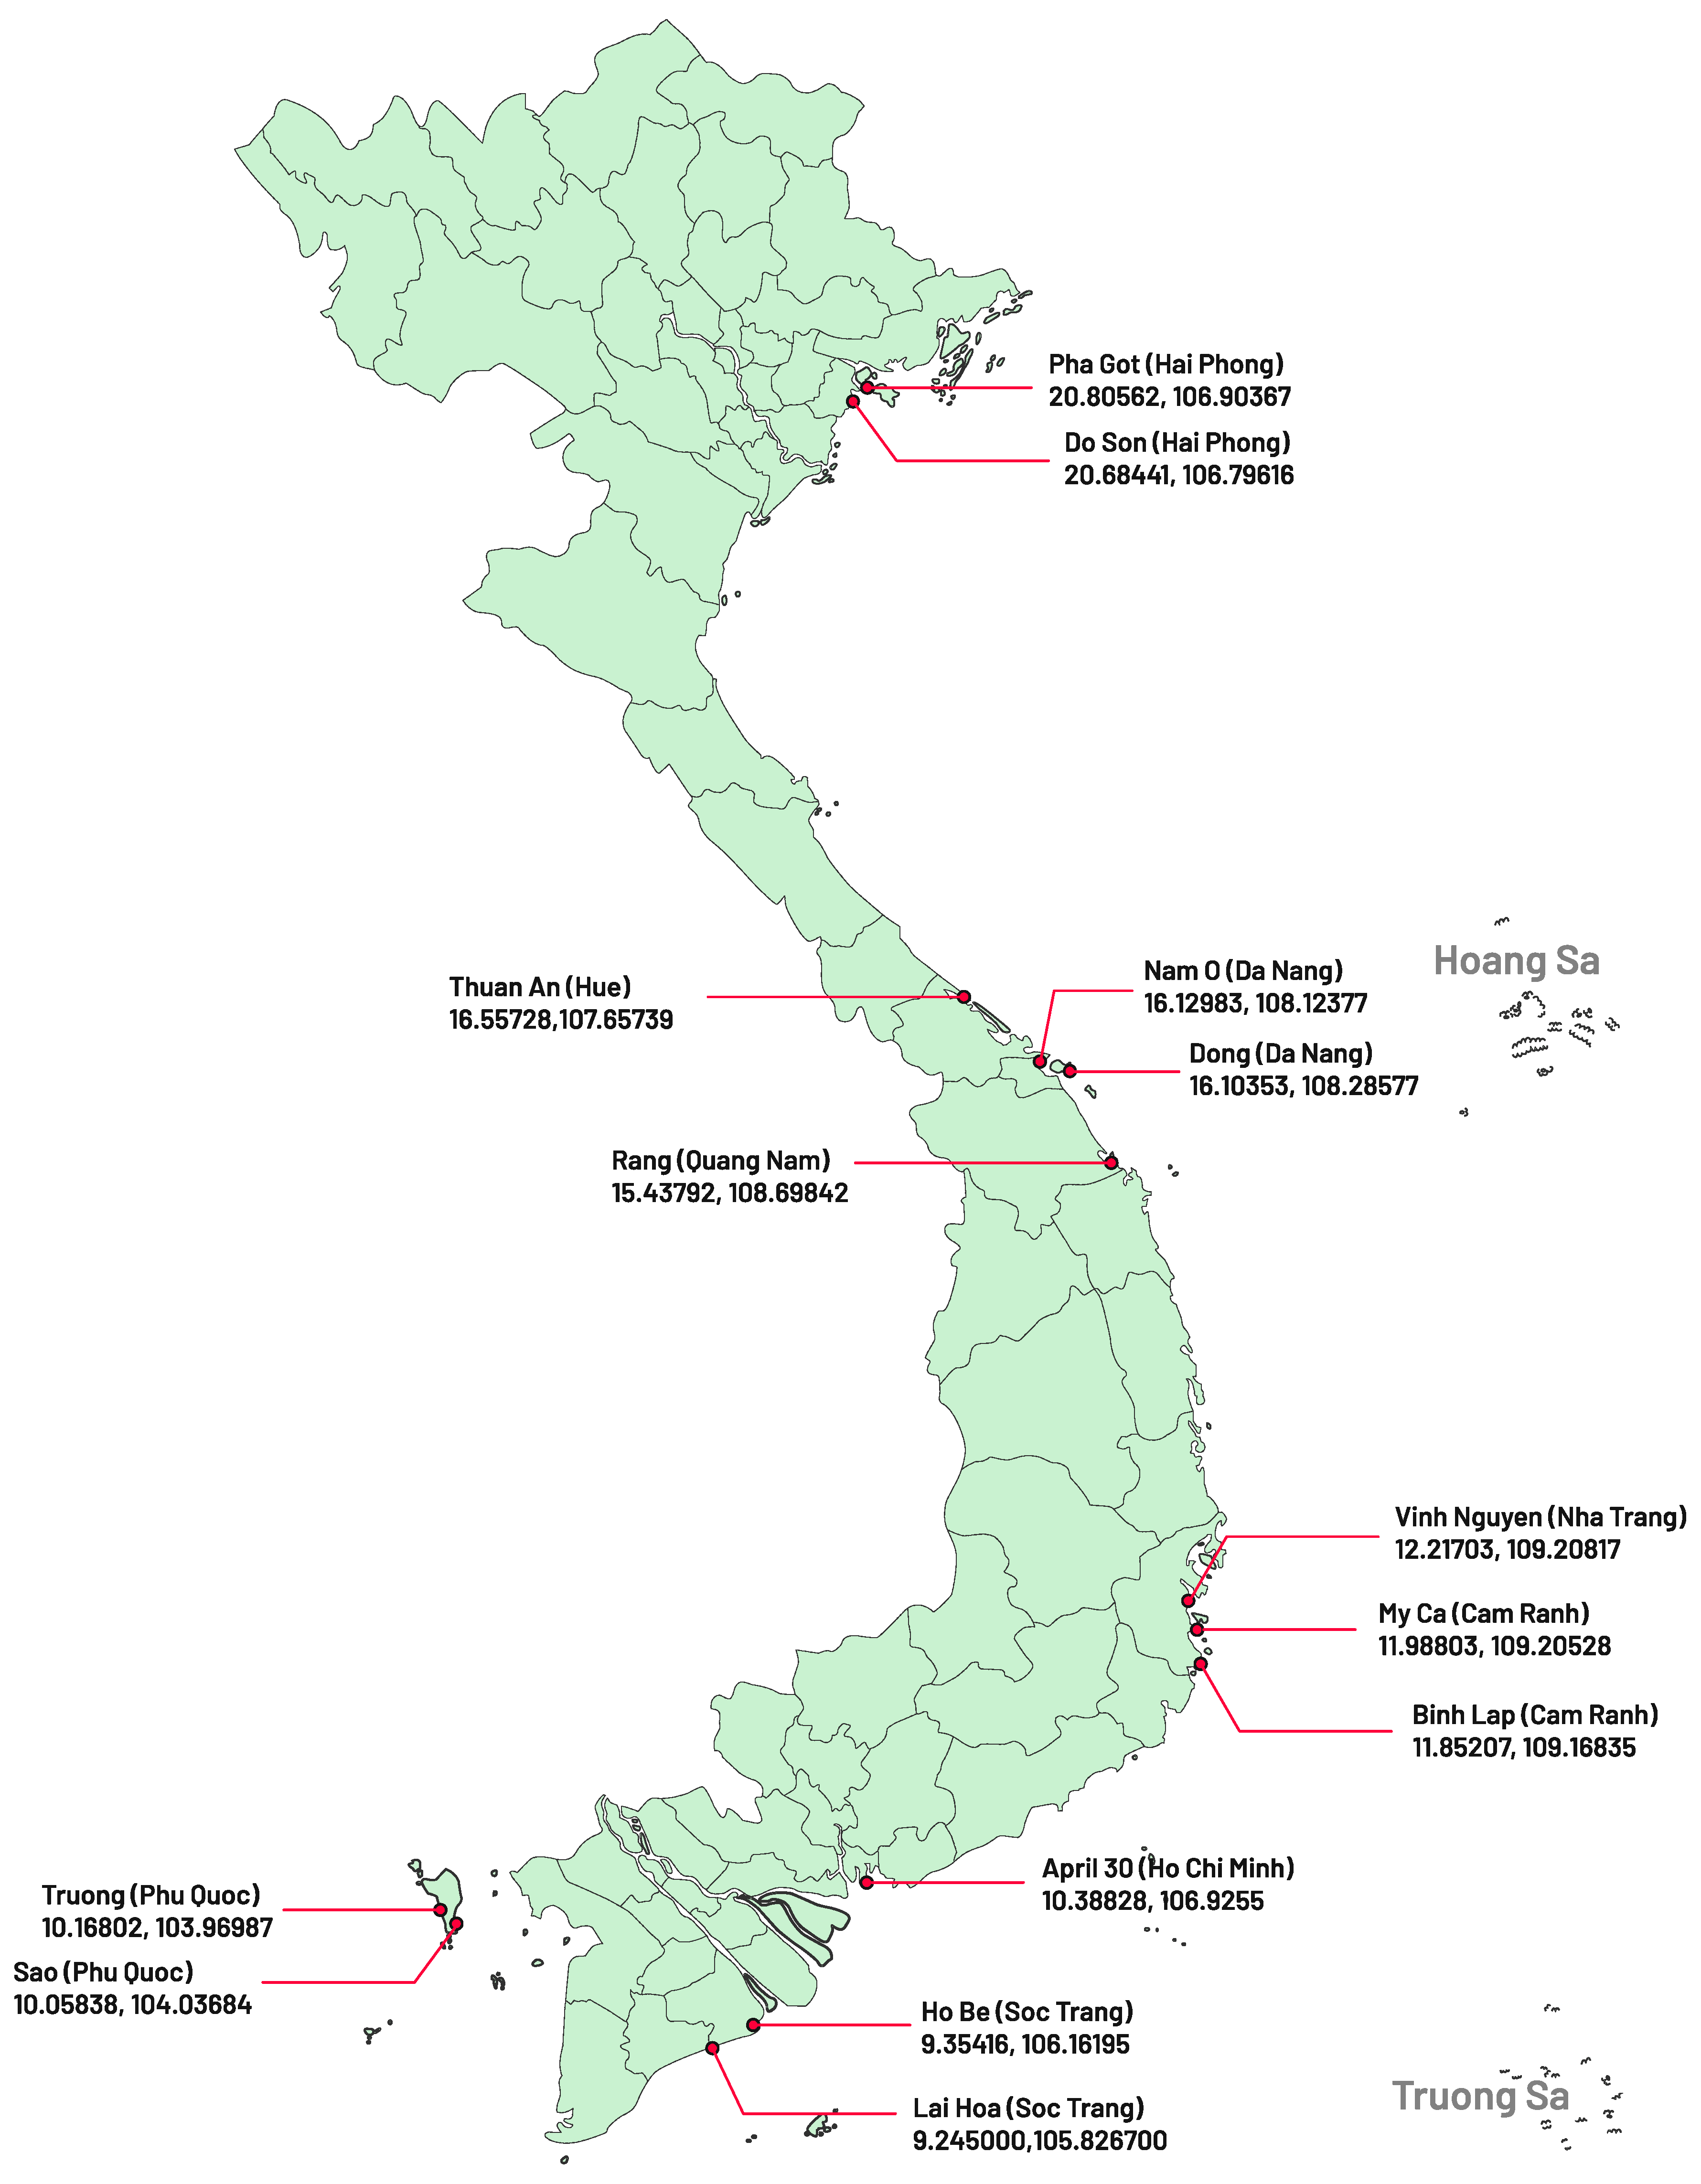
2.1. Study Area
- (1)
- Sandy beach or pebble shoreline;
- (2)
- Clear, direct, year-round access;
- (3)
- No breakwaters or jetties;
- (4)
- At least 100 m in length parallel to the water;
- (5)
- Minimum length of 100 m parallel to the water (i.e., measured along the water’s edge);
- (6)
- If a survey is conducted at 2 coastal sites in a location, we select a beach with no regular clean-up activities (or cleaning at least three months prior to the survey time) and a beach with regular clean-ups. If the survey is at only one coastal site in a location, we choose either.
2.2. Sampling Methods
2.3. Data Analysis
3. Results
3.1. Marine Litter Abundance and Composition
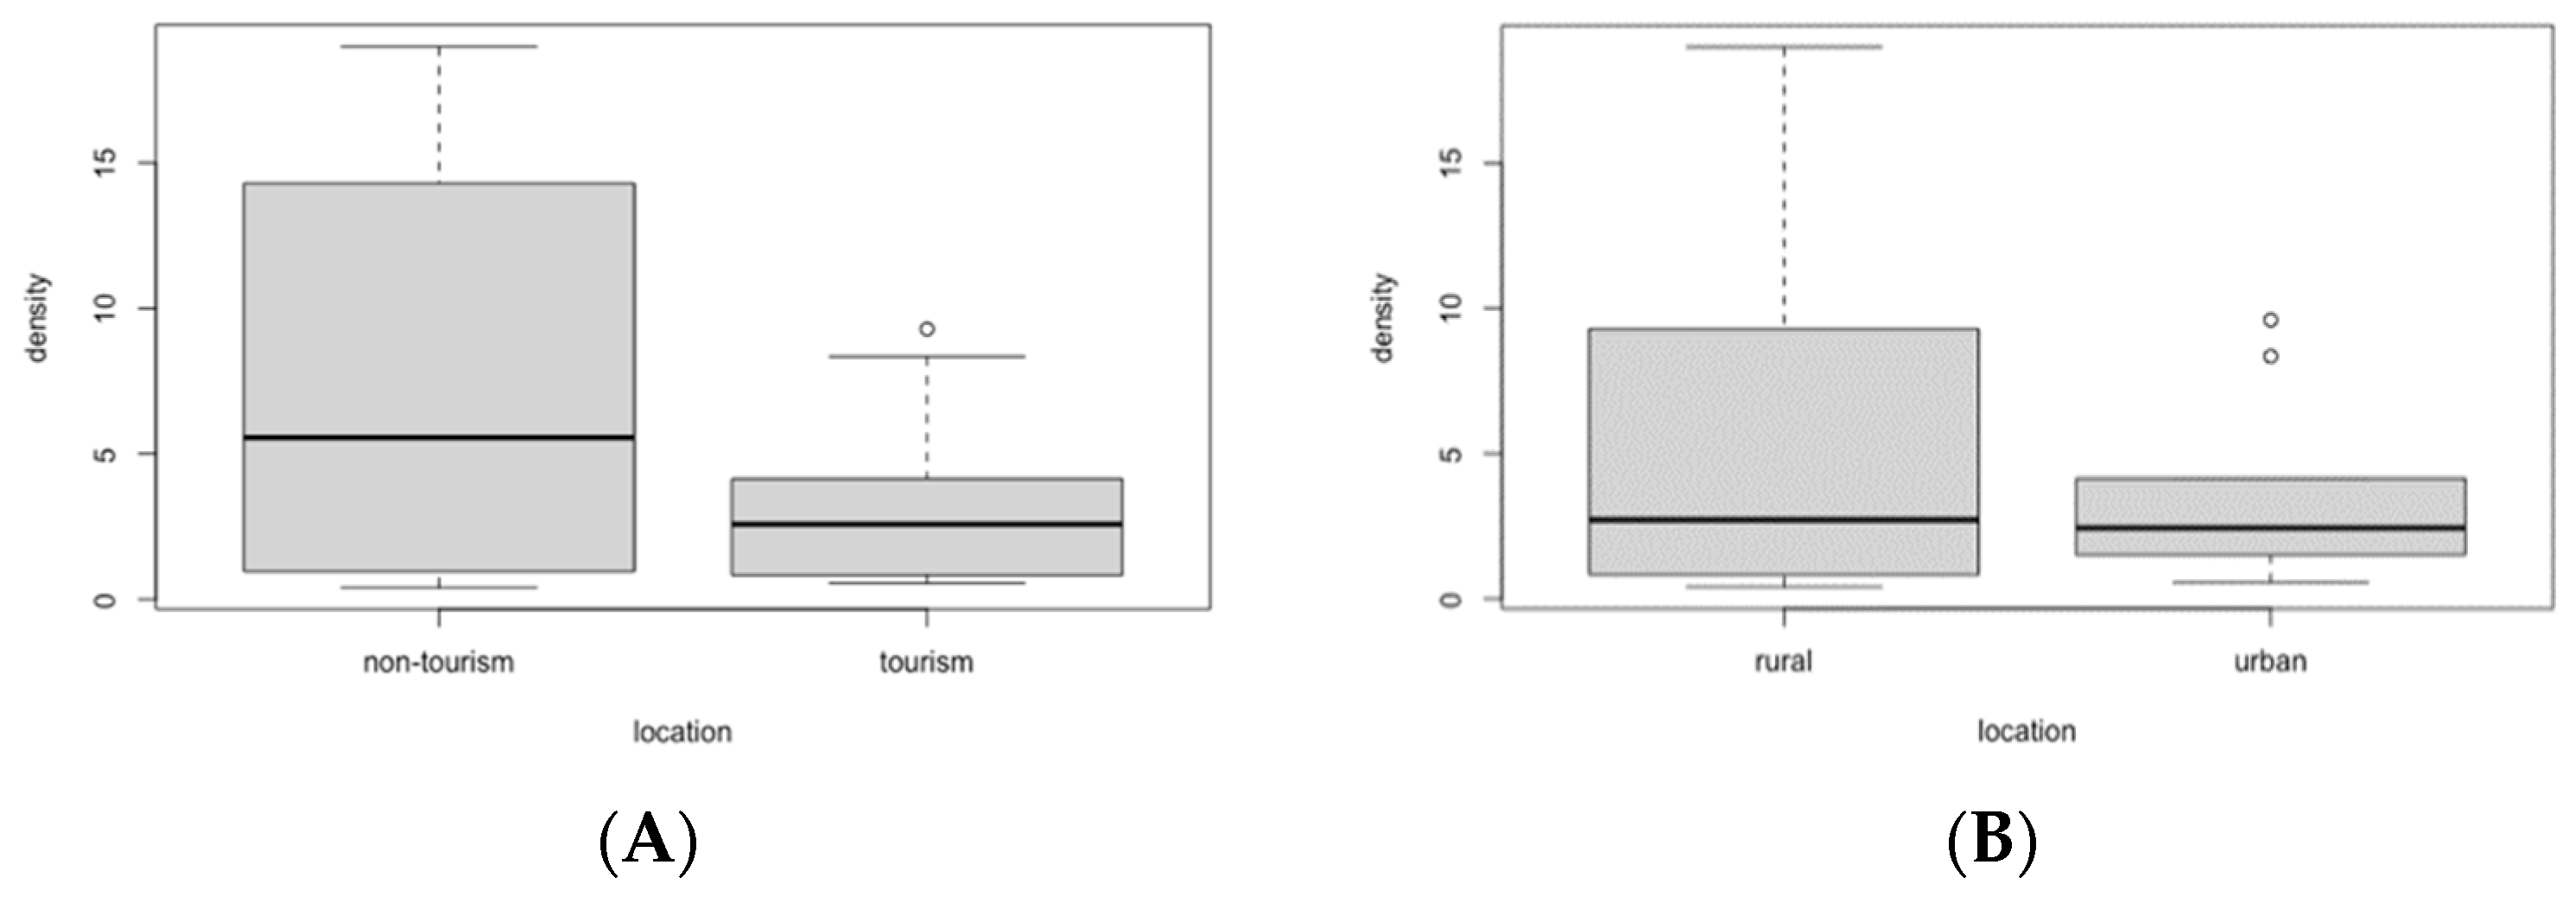
3.2. Comparisons of Marine Litter Compositions, Quantities and Distribution among Locations
3.3. Top Ten Marine Litter Items
3.4. Comparisons of Marine Litter Results at Vietnamese Beaches with Previous Studies
4. Discussion
4.1. Assessment of Marine Litter Composition and Abundance
4.2. Benefits and Disadvantages of Citizen Science
4.3. Preventive Measure Implications
5. Conclusions
Supplementary Materials
Author Contributions
Funding
Data Availability Statement
Acknowledgments
Conflicts of Interest
References
- UNEP. Marine Litter: A Global Challenge; UNEP: Nairobi, Kenya, 2009; p. 232. [Google Scholar]
- Bergmann, M.; Sandhop, N.; Schewe, I.; D’Hert, D. Observations of floating anthropogenic litter in the Barents Sea and Fram Strait, Arctic. Polar Biol. 2016, 39, 553–560. [Google Scholar] [CrossRef]
- Bergmann, M.; Lutz, B.; Tekman, M.B.; Gutow, L. Citizen scientists reveal: Marine litter pollutes Arctic beaches and affects wild life. Mar. Pollut. Bull. 2017, 125, 535–540. [Google Scholar] [CrossRef]
- Chiba, S.; Saito, H.; Fletcher, R.; Yogi, T.; Kayo, M.; Miyagi, S.; Ogido, M.; Fujikura, K. Human footprint in the abyss: 30 year records of deep-sea plastic debris. Mar. Policy 2018, 96, 204–212. [Google Scholar] [CrossRef]
- Galgani, F.; Hanke, G.; Maes, T. Global Distribution, Composition and Abundance of Marine Litter. In Marine Anthropogenic Litter; Bergmann, M., Gutow, L., Klages, M., Eds.; Springer International Publishing: Cham, Switzerland, 2015; pp. 29–56. [Google Scholar] [CrossRef]
- Watts, A.J.R.; Porter, A.; Hembrow, N.; Sharpe, J.; Galloway, T.S.; Lewis, C. Through the sands of time: Beach litter trends from nine cleaned north cornish beaches. Environ. Pollut. 2017, 228, 416–424. [Google Scholar] [CrossRef]
- Ostle, C.; Thompson, R.C.; Broughton, D.; Gregory, L.; Wootton, M.; Johns, D.G. The rise in ocean plastics evidenced from a 60-year time series. Nat. Commun. 2019, 10, 1622. [Google Scholar] [CrossRef]
- Derraik, J.G.B. The pollution of the marine environment by plastic debris: A review. Mar. Pollut. Bull. 2002, 44, 842–852. [Google Scholar] [CrossRef]
- Barnes, D.K.A.; Galgani, F.; Thompson, R.C.; Barlaz, M. Accumulation and fragmentation of plastic debris in global environments. Philos. Trans. R. Soc. B Biol. Sci. 2009, 364, 1985–1998. [Google Scholar] [CrossRef]
- Sheavly, S.B.; Register, K.M. Marine Debris & Plastics: Environmental Concerns, Sources, Impacts and Solutions. J. Polym. Environ. 2007, 15, 301–305. [Google Scholar] [CrossRef]
- Kühn, S.; Bravo Rebolledo, E.L.; van Franeker, J.A. Deleterious Effects of Litter on Marine Life. In Marine Anthropogenic Litter; Bergmann, M., Gutow, L., Klages, M., Eds.; Springer International Publishing: Cham, Switzerland, 2015; pp. 75–116. [Google Scholar] [CrossRef]
- Carson, H.S. The incidence of plastic ingestion by fishes: From the prey’s perspective. Mar. Pollut. Bull. 2013, 74, 170–174. [Google Scholar] [CrossRef]
- Tomás, J.; Guitart, R.; Mateo, R.; Raga, J.A. Marine debris ingestion in loggerhead sea turtles, Caretta caretta, from the Western Mediterranean. Mar. Pollut. Bull. 2002, 44, 211–216. [Google Scholar] [CrossRef]
- Hwang, J.; Choi, D.; Han, S.; Jung, S.Y.; Choi, J.; Hong, J. Potential toxicity of polystyrene microplastic particles. Sci. Rep. 2020, 10, 7391. [Google Scholar] [CrossRef]
- Gallo, F.; Fossi, C.; Weber, R.; Santillo, D.; Sousa, J.; Ingram, I.; Nadal, A.; Romano, D. Marine litter plastics and microplastics and their toxic chemicals components: The need for urgent preventive measures. Environ. Sci. Eur. 2018, 30, 13. [Google Scholar] [CrossRef]
- Rech, S.; Borrell, Y.; García-Vazquez, E. Marine litter as a vector for non-native species: What we need to know. Mar. Pollut. Bull. 2016, 113, 40–43. [Google Scholar] [CrossRef]
- García-Gómez, J.C.; Garrigós, M.; Garrigós, J. Plastic as a Vector of Dispersion for Marine Species With Invasive Potential. A Review. Front. Ecol. Evol. 2021, 9, 208. [Google Scholar] [CrossRef]
- Hartley, B.L.; Pahl, S.; Holland, M.; Alampei, I.; Veiga, J.M.; Thompson, R.C. Turning the tide on trash: Empowering European educators and school students to tackle marine litter. Mar. Policy 2018, 96, 227–234. [Google Scholar] [CrossRef]
- Hartley, B.L.; Thompson, R.C.; Pahl, S. Marine litter education boosts children’s understanding and self-reported actions. Mar. Pollut. Bull. 2015, 90, 209–217. [Google Scholar] [CrossRef]
- Schneider, P.; Anh, L.H.; Wagner, J.; Reichenbach, J.; Hebner, A. Solid Waste Management in Ho Chi Minh City, Vietnam: Moving towards a Circular Economy? Sustainability 2017, 9, 286. [Google Scholar] [CrossRef]
- Tsai, F.M.; Bui, T.-D.; Tseng, M.-L.; Lim, M.K.; Tan, R.R. Sustainable solid-waste management in coastal and marine tourism cities in Vietnam: A hierarchical-level approach. Resour. Conserv. Recycl. 2021, 168, 105266. [Google Scholar] [CrossRef]
- MONRE. National Action Plan for Management of Marine Plastic Litter by 2030. 2020. Available online: https://www.vn.undp.org/content/dam/vietnam/docs/Publications/Quyet%20dinh%20rac%20thai%20nhua.pdf (accessed on 2 October 2021).
- IUCN-EA-QUANTIS. National Guidance for Plastic Pollution Hotspotting and Shaping Action, COUNTRY Report Vietnam. 2020. Available online: https://www.iucn.org/sites/dev/files/content/documents/vietnam_final-report_2020-compressed_.pdf (accessed on 2 October 2021).
- Qu, S.; Guo, Y.; Ma, Z.; Chen, W.-Q.; Liu, J.; Liu, G.; Wang, Y.; Xu, M. Implications of China’s foreign waste ban on the global circular economy. Resour. Conserv. Recycl. 2019, 144, 252–255. [Google Scholar] [CrossRef]
- Ebner, N.; Iacovidou, E. The challenges of Covid-19 pandemic on improving plastic waste recycling rates. Sustain. Prod. Consum. 2021, 28, 726–735. [Google Scholar] [CrossRef]
- Leal Filho, W.; Salvia, A.L.; Minhas, A.; Paço, A.; Dias-Ferreira, C. The COVID-19 pandemic and single-use plastic waste in households: A preliminary study. Sci. Total Environ. 2021, 793, 148571. [Google Scholar] [CrossRef]
- NPAP. Radically Reducing Plastic Leakage in Vietnam: Action Roadmap. National Plastic Action Partnership (Vietnam). 2020. Available online: http://npap.monrenews.gov.vn/uploads/slides/VN_Tam%20Nguyen%20WEF.pdf (accessed on 3 October 2021).
- Salhofer, S.; Jandric, A.; Soudachanh, S.; Le Xuan, T.; Tran, T.D. Plastic Recycling Practices in Vietnam and Related Hazards for Health and the Environment. Int. J. Environ. Res. Public Health 2021, 18, 4203. [Google Scholar] [CrossRef]
- Le, D.T. Overview of Marine Plastic Debris in Vietnam in Relation to International Context. In Proceedings of the FIG Working Week 2019 Geospatial Information for a Smarter Life and Environmental Resilience, Hanoi, Vietnam, 22–26 April 2019. [Google Scholar]
- Chu, T.C.; Bui, T.T.H.; Nguyen, T.T.T.; Nguyen, M.Q. Monitoring and Assessment Programme on Plastic Litter in Viet Nam Shoreline—Report 2020. 2021. Available online: https://www.iucn.org/sites/dev/files/content/documents/2021/beach_debris_mornitoring_2020_report_english-_1_july_2021.pdf (accessed on 3 October 2021).
- Menéndez, P.; Losada, I.J.; Torres-Ortega, S.; Narayan, S.; Beck, M.W. The Global Flood Protection Benefits of Mangroves. Sci. Rep. 2020, 10, 4404. [Google Scholar] [CrossRef]
- Bonney, R.; Ballard, H.; Jordan, R.; McCallie, E.; Phillips, T.; Shirk, J.; Wilderman, C.C. Public Participation in Scientific Research: Defining the Field and Assessing its Potential for Informal Science Education. A CAISE Inquiry Group Report. 2009. Available online: https://files.eric.ed.gov/fulltext/ED519688.pdf (accessed on 3 October 2021).
- Silvertown, J. A new dawn for citizen science. Trends Ecol. Evol. 2009, 29, 467–471. [Google Scholar] [CrossRef]
- Danielsen, F.; Burgess, N.D.; Jensen, P.M.; Pirhofer-Walzl, K. Environmental monitoring: The scale and speed of implementation varies according to the degree of peoples involvement. J. Appl. Ecol. 2010, 47, 1166–1168. [Google Scholar] [CrossRef]
- Dickinson, J.L.; Shirk, J.; Bonter, D.; Bonney, R.; Crain, R.L.; Martin, J.; Phillips, T.; Purcell, K. The current state of citizen science as a tool for ecological research and public engagement. Front. Ecol. Environ. 2012, 10, 291–297. [Google Scholar] [CrossRef]
- Theobald, E.J.; Ettinger, A.K.; Burgess, H.K.; DeBey, L.B.; Schmidt, N.R.; Froehlich, H.E.; Wagner, C.; HilleRisLambers, J.; Tewksbury, J.; Harsch, M.A.; et al. Global change and local solutions: Tapping the unrealized potential of citizen science for biodiversity research. Biol. Conserv. 2015, 181, 236–244. [Google Scholar] [CrossRef]
- Kobori, H.; Dickinson, J.L.; Washitani, I.; Sakurai, R.; Amano, T.; Komatsu, N.; Kitamura, W.; Takagawa, S.; Koyama, K.; Ogawara, T.; et al. Citizen science: A new approach to advance ecology, education, and conservation. Ecol. Res. 2016, 31, 1–19. [Google Scholar] [CrossRef]
- Garcia-Soto, C.; van der Meeren, G.I.; Busch, J.A.; Delany, J.; Domegan, C.; Dubsky, K.; Fauville, G.; von Gorsky, G.; Juterzenka, K.; Malfatti, F.; et al. Advancing Citizen Science for Coastal and Ocean Research; European Marine Board IVZW: Ostend, Belgium, 2017; p. 112. [Google Scholar]
- Mannino, A.M.; Balistreri, P. Citizen science: A successful tool for monitoring invasive alien species (IAS) in Marine Protected Areas. The case study of the Egadi Islands MPA (Tyrrhenian Sea, Italy). Biodiversity 2018, 19, 42–48. [Google Scholar] [CrossRef]
- Zettler, E.R.; Takada, H.; Monteleone, B.; Mallos, N.; Eriksen, M.; Amaral-Zettler, L.A. Incorporating citizen science to study plastics in the environment. Anal. Methods 2017, 9, 1392–1403. [Google Scholar] [CrossRef]
- Chen, H.; Wang, S.; Guo, H.; Lin, H.; Zhang, Y. A nationwide assessment of litter on China’s beaches using citizen science data. Environ. Pollut. 2020, 258, 113756. [Google Scholar] [CrossRef]
- Harris, L.; Liboiron, M.; Charron, L.; Mather, C. Using citizen science to evaluate extended producer responsibility policy to reduce marine plastic debris shows no reduction in pollution levels. Mar. Policy 2021, 123, 104319. [Google Scholar] [CrossRef]
- Syberg, K.; Palmqvist, A.; Khan, F.R.; Strand, J.; Vollertsen, J.; Clausen, L.P.W.; Feld, L.; Hartmann, N.B.; Oturai, N.; Møller, S.; et al. A nationwide assessment of plastic pollution in the Danish realm using citizen science. Sci. Rep. 2020, 10, 17773. [Google Scholar] [CrossRef]
- Ambrose, K.K.; Box, C.; Boxall, J.; Brooks, A.; Eriksen, M.; Fabres, J.; Fylakis, G.; Walker, T.R. Spatial trends and drivers of marine debris accumulation on shorelines in South Eleuthera, The Bahamas using citizen science. Mar. Pollut. Bull. 2019, 142, 145–154. [Google Scholar] [CrossRef]
- IUCN Viet Nam; Greenhub. Monitoring and Assessment Programme on Plastic Litter in Viet Nam Shoreline—Report 2019; IUCN, Vietnam Country Office: Hanoi, Vietnam, 2021; p. 13. [Google Scholar]
- GESAMP. Guidelines or the Monitoring and Assessment of Plastic Litter and Microplastics in the Ocean; United Nations Office Nairobi (UNON) Publishing Services Section: Nairobi, Kenya, 2019; p. 130. [Google Scholar]
- Alkalay, R.; Pasternak, G.; Zask, A. Clean-coast index—A new approach for beach cleanliness assessment. Ocean Coast. Manag. 2007, 50, 352–362. [Google Scholar] [CrossRef]
- Qaisrani, Z.; Shams, S.; Guo, Z.R.; Mamun, A.A. Qualitative Analysis of Plastic Debris on Beaches of Brunei Darussalam. Pollution 2020, 6, 569–580. [Google Scholar] [CrossRef]
- Syakti, A.D.; Bouhroum, R.; Hidayati, N.V.; Koenawan, C.J.; Boulkamh, A.; Sulistyo, I.; Lebarillier, S.; Akhlus, S.; Doumenq, P.; Wong-Wah-Chung, P. Beach macro-litter monitoring and floating microplastic in a coastal area of Indonesia. Mar. Pollut. Bull. 2017, 122, 217–225. [Google Scholar] [CrossRef]
- Fauziah, S.H.; Liyana, I.A.; Agamuthu, P. Plastic debris in the coastal environment: The invincible threat? Abundance of buried plastic debris on Malaysian beaches. Waste Manag. Res. 2015, 33, 812–821. [Google Scholar] [CrossRef]
- Kalnasa, M.L.; Lantaca, S.M.O.; Boter, L.C.; Flores, G.J.T.; Galarpe, V.R.K.R. Occurrence of surface sand microplastic and litter in Macajalar Bay, Philippines. Mar. Pollut. Bull. 2019, 149, 110521. [Google Scholar] [CrossRef]
- Binetti, U.; Silburn, B.; Russell, J.; van Hoytema, N.; Meakins, B.; Kohler, P.; Desender, M.; Preston-Whyte, F.; Fa’abasu, E.; Maniel, M.; et al. First marine litter survey on beaches in Solomon Islands and Vanuatu, South Pacific: Using OSPAR protocol to inform the development of national action plans to tackle land-based solid waste pollution. Mar. Pollut. Bull. 2020, 161, 111827. [Google Scholar] [CrossRef]
- Jang, Y.C.; Lee, J.; Hong, S.; Lee, J.S.; Shim, W.J.; Song, Y.K. Sources of plastic marine debris on beaches of Korea: More from the ocean than the land. Ocean Sci. J. 2014, 49, 151–162. [Google Scholar] [CrossRef]
- Hanke, G.; Galgani, F.; Werner, S.; Osterbaan, L.; Nilsson, P.; Fleet, D.; Kinsey, S.; Thompson, R.; Palatinus, A.; Van Franerker, J.A.; et al. Guidance on Monitoring of Marine Litter in European Seas. EUR 26113; Publications Office of the European Union: Luxembourg, 2013.
- Hengstmann, E.; Gräwe, D.; Tamminga, M.; Fischer, E.K. Marine litter abundance and distribution on beaches on the Isle of Rügen considering the influence of exposition, morphology and recreational activities. Mar. Pollut. Bull. 2017, 115, 297–306. [Google Scholar] [CrossRef]
- Terzi, Y.; Seyhan, K. Seasonal and spatial variations of marine litter on the south-eastern Black Sea coast. Mar. Pollut. Bull. 2017, 120, 154–158. [Google Scholar] [CrossRef]
- Peraš, I.; Divanović, M.; Pešić, A.; Joksimović, A.; Marković, O.; Đurović, M.; Mandić, M. Composition and abundance of beach litter in Montenegro (South Adriatic Sea). Studia Mar. 2017, 30, 17–27. [Google Scholar]
- Pasternak, G.; Zviely, D.; Ribic, C.; Ariel, A.; Spanier, E. Sources, composition and spatial distribution of marine debris along the Mediterranean coast of Israel. Mar. Pollut. Bull. 2017, 114, 1036–1045. [Google Scholar] [CrossRef]
- Topçu, E.N.; Tonay, A.M.; Dede, A.; Öztürk, A.A.; Öztürk, B. Origin and abundance of marine litter along sandy beaches of the Turkish Western Black Sea Coast. Mar. Environ. Res. 2013, 85, 21–28. [Google Scholar] [CrossRef]
- Steer, M.; Thompson, R.C. Plastics and Microplastics: Impacts in the Marine Environment. In Mare Plasticum—The Plastic Sea: Combatting Plastic Pollution Through Science and Art; Streit-Bianchi, M., Cimadevila, M., Trettnak, W., Eds.; Springer International Publishing: Cham, Switzerland, 2020; pp. 49–72. [Google Scholar] [CrossRef]
- Hermabessiere, L.; Dehaut, A.; Paul-Pont, I.; Lacroix, C.; Jezequel, R.; Soudant, P.; Duflos, G. Occurrence and effects of plastic additives on marine environments and organisms: A review. Chemosphere 2017, 182, 781–793. [Google Scholar] [CrossRef]
- Hahladakis, J.N.; Velis, C.A.; Weber, R.; Iacovidou, E.; Purnell, P. An overview of chemical additives present in plastics: Migration, release, fate and environmental impact during their use, disposal and recycling. J. Hazard. Mater. 2018, 344, 179–199. [Google Scholar] [CrossRef]
- Li, J.-H.; Ko, Y.-C. Plasticizer incident and its health effects in Taiwan. Kaohsiung J. Med. Sci. 2012, 28, S17–S21. [Google Scholar] [CrossRef]
- Engler, R.E. The Complex Interaction between Marine Debris and Toxic Chemicals in the Ocean. Environ. Sci. Technol. 2012, 46, 12302–12315. [Google Scholar] [CrossRef]
- Galgani, L.; Beiras, R.; Galgani, F.; Panti, C.; Borja, A. Editorial: Impacts of Marine Litter. Front. Mar. Sci. 2019, 6, 208. [Google Scholar] [CrossRef]
- Luong, N.D.; Giang, H.M.; Thanh, B.X.; Hung, N.T. Challenges for municipal solid waste management practices in Vietnam. Waste Technol. 2013, 1, 17–21. [Google Scholar] [CrossRef][Green Version]
- GESAMP. The State of Marine Environment; GESAMP Publishing: London, UK, 1991. [Google Scholar]
- Sheavly, S.B. Marine debris—An overview of a critical issue for our oceans. In Proceedings of the Sixth Meeting of the UN Open-ended Informal Consultative Processes on Oceans & the Law of the Sea, New York, NY, USA, 6–10 April 2015. [Google Scholar]
- Smith, S.D.A.; Banister, K.; Fraser, N.; Edgar, R.J. Tracing the source of marine debris on the beaches of northern New South Wales, Australia: The Bottles on Beaches program. Mar. Pollut. Bull. 2018, 126, 304–307. [Google Scholar] [CrossRef]
- Ryan, P.G.; Dilley, B.J.; Ronconi, R.A.; Connan, M. Rapid increase in Asian bottles in the South Atlantic Ocean indicates major debris inputs from ships. Proc. Natl. Acad. Sci. USA 2019, 116, 20892. [Google Scholar] [CrossRef]
- Ryan, P.G. Land or sea? What bottles tell us about the origins of beach litter in Kenya. Waste Manag. 2020, 116, 49–57. [Google Scholar] [CrossRef]
- Jambeck, J.R.; Geyer, R.; Wilcox, C.; Siegler, T.R.; Perryman, M.; Andrady, A.; Narayan, R.; Law, K.L. Plastic waste inputs from land into the ocean. Science 2015, 347, 768. [Google Scholar] [CrossRef]
- Unger, A.; Harrison, N. Fisheries as a source of marine debris on beaches in the United Kingdom. Mar. Pollut. Bull. 2016, 107, 52–58. [Google Scholar] [CrossRef]
- Bergmann, M.; Tekman, M.B.; Gutow, L. Sea change for plastic pollution. Nature 2017, 544, 297. [Google Scholar] [CrossRef]
- Lebreton, L.; Slat, B.; Ferrari, F.; Sainte-Rose, B.; Aitken, J.; Marthouse, R.; Hajbane, S.; Cunsolo, S.; Schwarz, A.; Levivier, A.; et al. Evidence that the Great Pacific Garbage Patch is rapidly accumulating plastic. Sci. Rep. 2018, 8, 4666. [Google Scholar] [CrossRef]
- Portz, L.; Manzolli, R.P.; Herrera, G.V.; Garcia, L.L.; Villate, D.A.; Ivar do Sul, J.A. Marine litter arrived: Distribution and potential sources on an unpopulated atoll in the Seaflower Biosphere Reserve, Caribbean Sea. Mar. Pollut. Bull. 2020, 157, 111323. [Google Scholar] [CrossRef]
- van Hoytema, N.; Bullimore, R.D.; Al Adhoobi, A.S.; Al-Khanbashi, M.H.; Whomersley, P.; Le Quesne, W.J.F. Fishing gear dominates marine litter in the Wetlands Reserve in Al Wusta Governorate, Oman. Mar. Pollut. Bull. 2020, 159, 111503. [Google Scholar] [CrossRef]
- Consoli, P.; Romeo, T.; Angiolillo, M.; Canese, S.; Esposito, V.; Salvati, E.; Scotti, G.; Andaloro, F.; Tunesi, L. Marine litter from fishery activities in the Western Mediterranean sea: The impact of entanglement on marine animal forests. Environ. Pollut. 2019, 249, 472–481. [Google Scholar] [CrossRef]
- Edyvane, K.S.; Dalgetty, A.; Hone, P.W.; Higham, J.S.; Wace, N.M. Long-term marine litter monitoring in the remote Great Australian Bight, South Australia. Mar. Pollut. Bull. 2004, 48, 1060–1075. [Google Scholar] [CrossRef]
- Simeonova, A.; Chuturkova, R. Macroplastic distribution (Single-use plastics and some Fishing gear) from the northern to the southern Bulgarian Black Sea coast. Reg. Stud. Mar. Sci. 2020, 37, 101329. [Google Scholar] [CrossRef]
- Nelms, S.E.; Coombes, C.; Foster, L.C.; Galloway, T.S.; Godley, B.J.; Lindeque, P.K.; Witt, M.J. Marine anthropogenic litter on British beaches: A 10-year nationwide assessment using citizen science data. Sci. Total Environ. 2017, 579, 1399–1409. [Google Scholar] [CrossRef]
- Hidalgo-Ruz, V.; Thiel, M. The Contribution of Citizen Scientists to the Monitoring of Marine Litter. In Marine Anthropogenic Litter; Bergmann, M., Gutow, L., Klages, M., Eds.; Springer International Publishing: Cham, Switzerland, 2015; pp. 429–447. [Google Scholar] [CrossRef]
- Chiu, C.-C.; Liao, C.-P.; Kuo, T.-C.; Huang, H.-W. Using citizen science to investigate the spatial-temporal distribution of floating marine litter in the waters around Taiwan. Mar. Pollut. Bull. 2020, 157, 111301. [Google Scholar] [CrossRef]
- Hong, S.; Lee, J.; Kang, D.; Choi, H.-W.; Ko, S.-H. Quantities, composition, and sources of beach debris in Korea from the results of nationwide monitoring. Mar. Pollut. Bull. 2014, 84, 27–34. [Google Scholar] [CrossRef]
- ANEMONE Deliverable 4.2. Marine litter status on Black Sea shore through Citizen Science; Gheorghe, A.-M., Ed.; CD PRESS: Bucharest, Romania, 2021; p. 37. [Google Scholar]
- Campbell, J.; Bowser, A.; Fraisl, D.; Meloche, M. Citizen Science and Data Integration for Understanding Marine Litter. In Proceedings of the Data for Good Exchange, New York, NY, USA, 15 September 2019. [Google Scholar]
- OSPAR. Guideline for Monitoring Marine Liter on the Beaches in the OSPAR Maritime Area; OSPAR Commission Publishing: London, UK, 2010. [Google Scholar]
- Jambeck, J.R.; Johnsen, K. Citizen-Based Litter and Marine Debris Data Collection and Mapping. Comput. Sci. Eng. 2015, 17, 20–26. [Google Scholar] [CrossRef]
- Sandahl, A.; Tøttrup, A.P. Marine Citizen Science: Recent Developments and Future Recommendations. Citiz. Sci. Theory Pract. 2020, 5, 24. [Google Scholar] [CrossRef]
- Yang, Y.; Cowen, L.L.E.; Costa, M. Is Ocean Reflectance Acquired by Citizen Scientists Robust for Science Applications? Remote Sens. 2018, 10, 835. [Google Scholar] [CrossRef]
- Jahnke, A.; Arp, H.P.H.; Escher, B.I.; Gewert, B.; Gorokhova, E.; Kühnel, D.; Ogonowski, M.; Potthoff, A.; Rummel, C.; Schmitt-Jansen, M.; et al. Reducing Uncertainty and Confronting Ignorance about the Possible Impacts of Weathering Plastic in the Marine Environment. Environ. Sci. Technol. Lett. 2017, 4, 85–90. [Google Scholar] [CrossRef]
- Chubarenko, I.; Efimova, I.; Bagaeva, M.; Bagaev, A.; Isachenko, I. On mechanical fragmentation of single-use plastics in the sea swash zone with different types of bottom sediments: Insights from laboratory experiments. Mar. Pollut. Bull. 2020, 150, 110726. [Google Scholar] [CrossRef]
- FAO. Code of Conduct for Responsible Fisheries; FAO Publishing: Rome, Italy, 1995; p. 49. [Google Scholar]


| No. | Survey Locations | Name of Survey Sites | Coded Site | Survey Date | Surved Area (m2) | Urban/Rural | Tourism | Clean-Up | Awareness |
|---|---|---|---|---|---|---|---|---|---|
| 1 | Hai Phong | Do Son | HP_C1 | September 2020 | 288 | Urban | Yes | Yes | Yes |
| 2 | Cat Hai | HP_C2 | 844 | Urban | Yes | No | Yes | ||
| 3 | Thua Thien Hue | Thuan An | H_C1 | November 2020 | 800 | Urban | Yes | No | |
| 4 | Da Nang | Dong | DN_C1 | November 2020 | 367 | Urban | Yes | No | |
| 5 | Nam O | DN_C2 | 370 | Urban | Yes | Yes | |||
| 6 | Quang Nam | Rang | QN_C1 | November 2020 | 1000 | Rural | Yes | No | No |
| 7 | Khanh Hoa | Vinh Nguyen | NT_C1_n1 | January 2021 | 200 | Urban | Yes | Yes | No |
| 8 | My Ca | CR_C1 | January 2021 | 212 | Urban | No | No | ||
| 9 | Binh Lap | CR_C2 | January 2021 | 88 | Rural | No | No | No | |
| 10 | Ho Chi Minh city | April 30 | HCM_C1 | October 2020 | 3430 | Rural | Yes | No | No |
| 11 | Soc Trang | Lai Hoa | ST_C1 | October 2020 | 605 | Rural | No | No | No |
| 12 | Ho Be | ST_C2 | 335 | Rural | Yes | Yes | No | ||
| 13 | Kien Giang (Phu Quoc island) | Sao | PQ_C1 | October 2020 | 237.5 | Urban | Yes | Yes | Yes |
| 14 | Truong | PQ_C2 | 614.5 | Urban | No | No | Yes |
| CCI | Very Clean No Litter is Seen | Clean No Litter Is Seen over a Large Area | Moderate A Few Pieces of Litter Can Be Detected | Dirty A Lot of Litter on Shore/Sites | Extremely Dirty Most of the Beach/Site Is Covered with Litter |
|---|---|---|---|---|---|
| Numeric index | 0–2 | 2–5 | 5–10 | 10–20 | 20+ |
| HP_C1 | HP_C2 | H_C1 | DN_C1 | DN_C2 | QN_C1 | NT_C1_n1 | CR_C1 | CR_C2 | HCM_C1 | ST_C1 | ST_C2 | PQ_C1 | PQ_C2 | Mean | SD | |
|---|---|---|---|---|---|---|---|---|---|---|---|---|---|---|---|---|
| Abundance (number of items per site) | ||||||||||||||||
| Plastics | 1057 | 392 | 2822 | 880 | 235 | 2673 | 331 | 2036 | 1671 | 2716 | 236 | 2964 | 1944 | 787 | 1481.86 | 1042.73 |
| Metal | 53 | 21 | 6 | 1 | 2 | 3 | 0 | 14 | 6 | 6 | 1 | 8 | 15 | 14 | 9.29 | 14.18 |
| Glass | 2 | 10 | 16 | 1 | 0 | 33 | 0 | 71 | 7 | 8 | 4 | 5 | 21 | 7 | 7.64 | 9.72 |
| Rubber | 17 | 4 | 2 | 1 | 2 | 1 | 7 | 20 | 6 | 20 | 2 | 5 | 2 | 42 | 7.50 | 11.68 |
| Paper/wood | 3 | 1 | 0 | 0 | 4 | 0 | 0 | 13 | 0 | 19 | 0 | 0 | 0 | 42 | 4.93 | 11.80 |
| Textile | 24 | 2 | 0 | 2 | 4 | 7 | 0 | 53 | 14 | 28 | 4 | 124 | 1 | 14 | 15.00 | 32.67 |
| Other litter | 35 | 40 | 3 | 7 | 2 | 5 | 3 | 8 | 19 | 35 | 1 | 5 | 0 | 22 | 11.29 | 14.87 |
| Location | Urban | Tourism | Items/m2 | g/m2 | %SUP | %FR | CCI |
|---|---|---|---|---|---|---|---|
| HP_C1 | Yes | Yes | 4.14 | 53.71 | 48.25 | 39.17 | 73.40 |
| HP_C2 | Yes | Yes | 0.56 | 6.16 | 33.42 | 38.78 | 9.29 |
| H_C1 | Yes | Yes | 3.56 | 10.51 | 48.16 | 29.55 | 70.55 |
| DN_C1 | Yes | Yes | 2.44 | 8.03 | 39.89 | 54.32 | 47.57 |
| DN_C2 | Yes | Yes | 0.67 | 4.84 | 63.83 | 14.47 | 12.70 |
| QN_C1 | No | Yes | 2.72 | 18.33 | 53.31 | 30.64 | 53.46 |
| NT_C1_n1 | Yes | Yes | 1.71 | 2.71 | 65.86 | 16.92 | 33.10 |
| CR_C1 | Yes | No | 9.60 | 84.84 | 50.05 | 44.40 | 192.08 |
| CR_C2 | No | No | 18.99 | 226.56 | 78.10 | 10.35 | 379.77 |
| HCM_C1 | No | Yes | 0.83 | 2.97 | 44.22 | 42.12 | 15.84 |
| ST_C1 | No | No | 0.41 | 6.73 | 47.88 | 41.53 | 7.80 |
| ST_C2 | No | Yes | 9.29 | 59.44 | 66.46 | 21.29 | 176.96 |
| PQ_C1 | Yes | Yes | 8.35 | 30.76 | 51.44 | 43.00 | 163.71 |
| PQ_C2 | Yes | No | 1.51 | 7.70 | 57.05 | 22.36 | 25.61 |
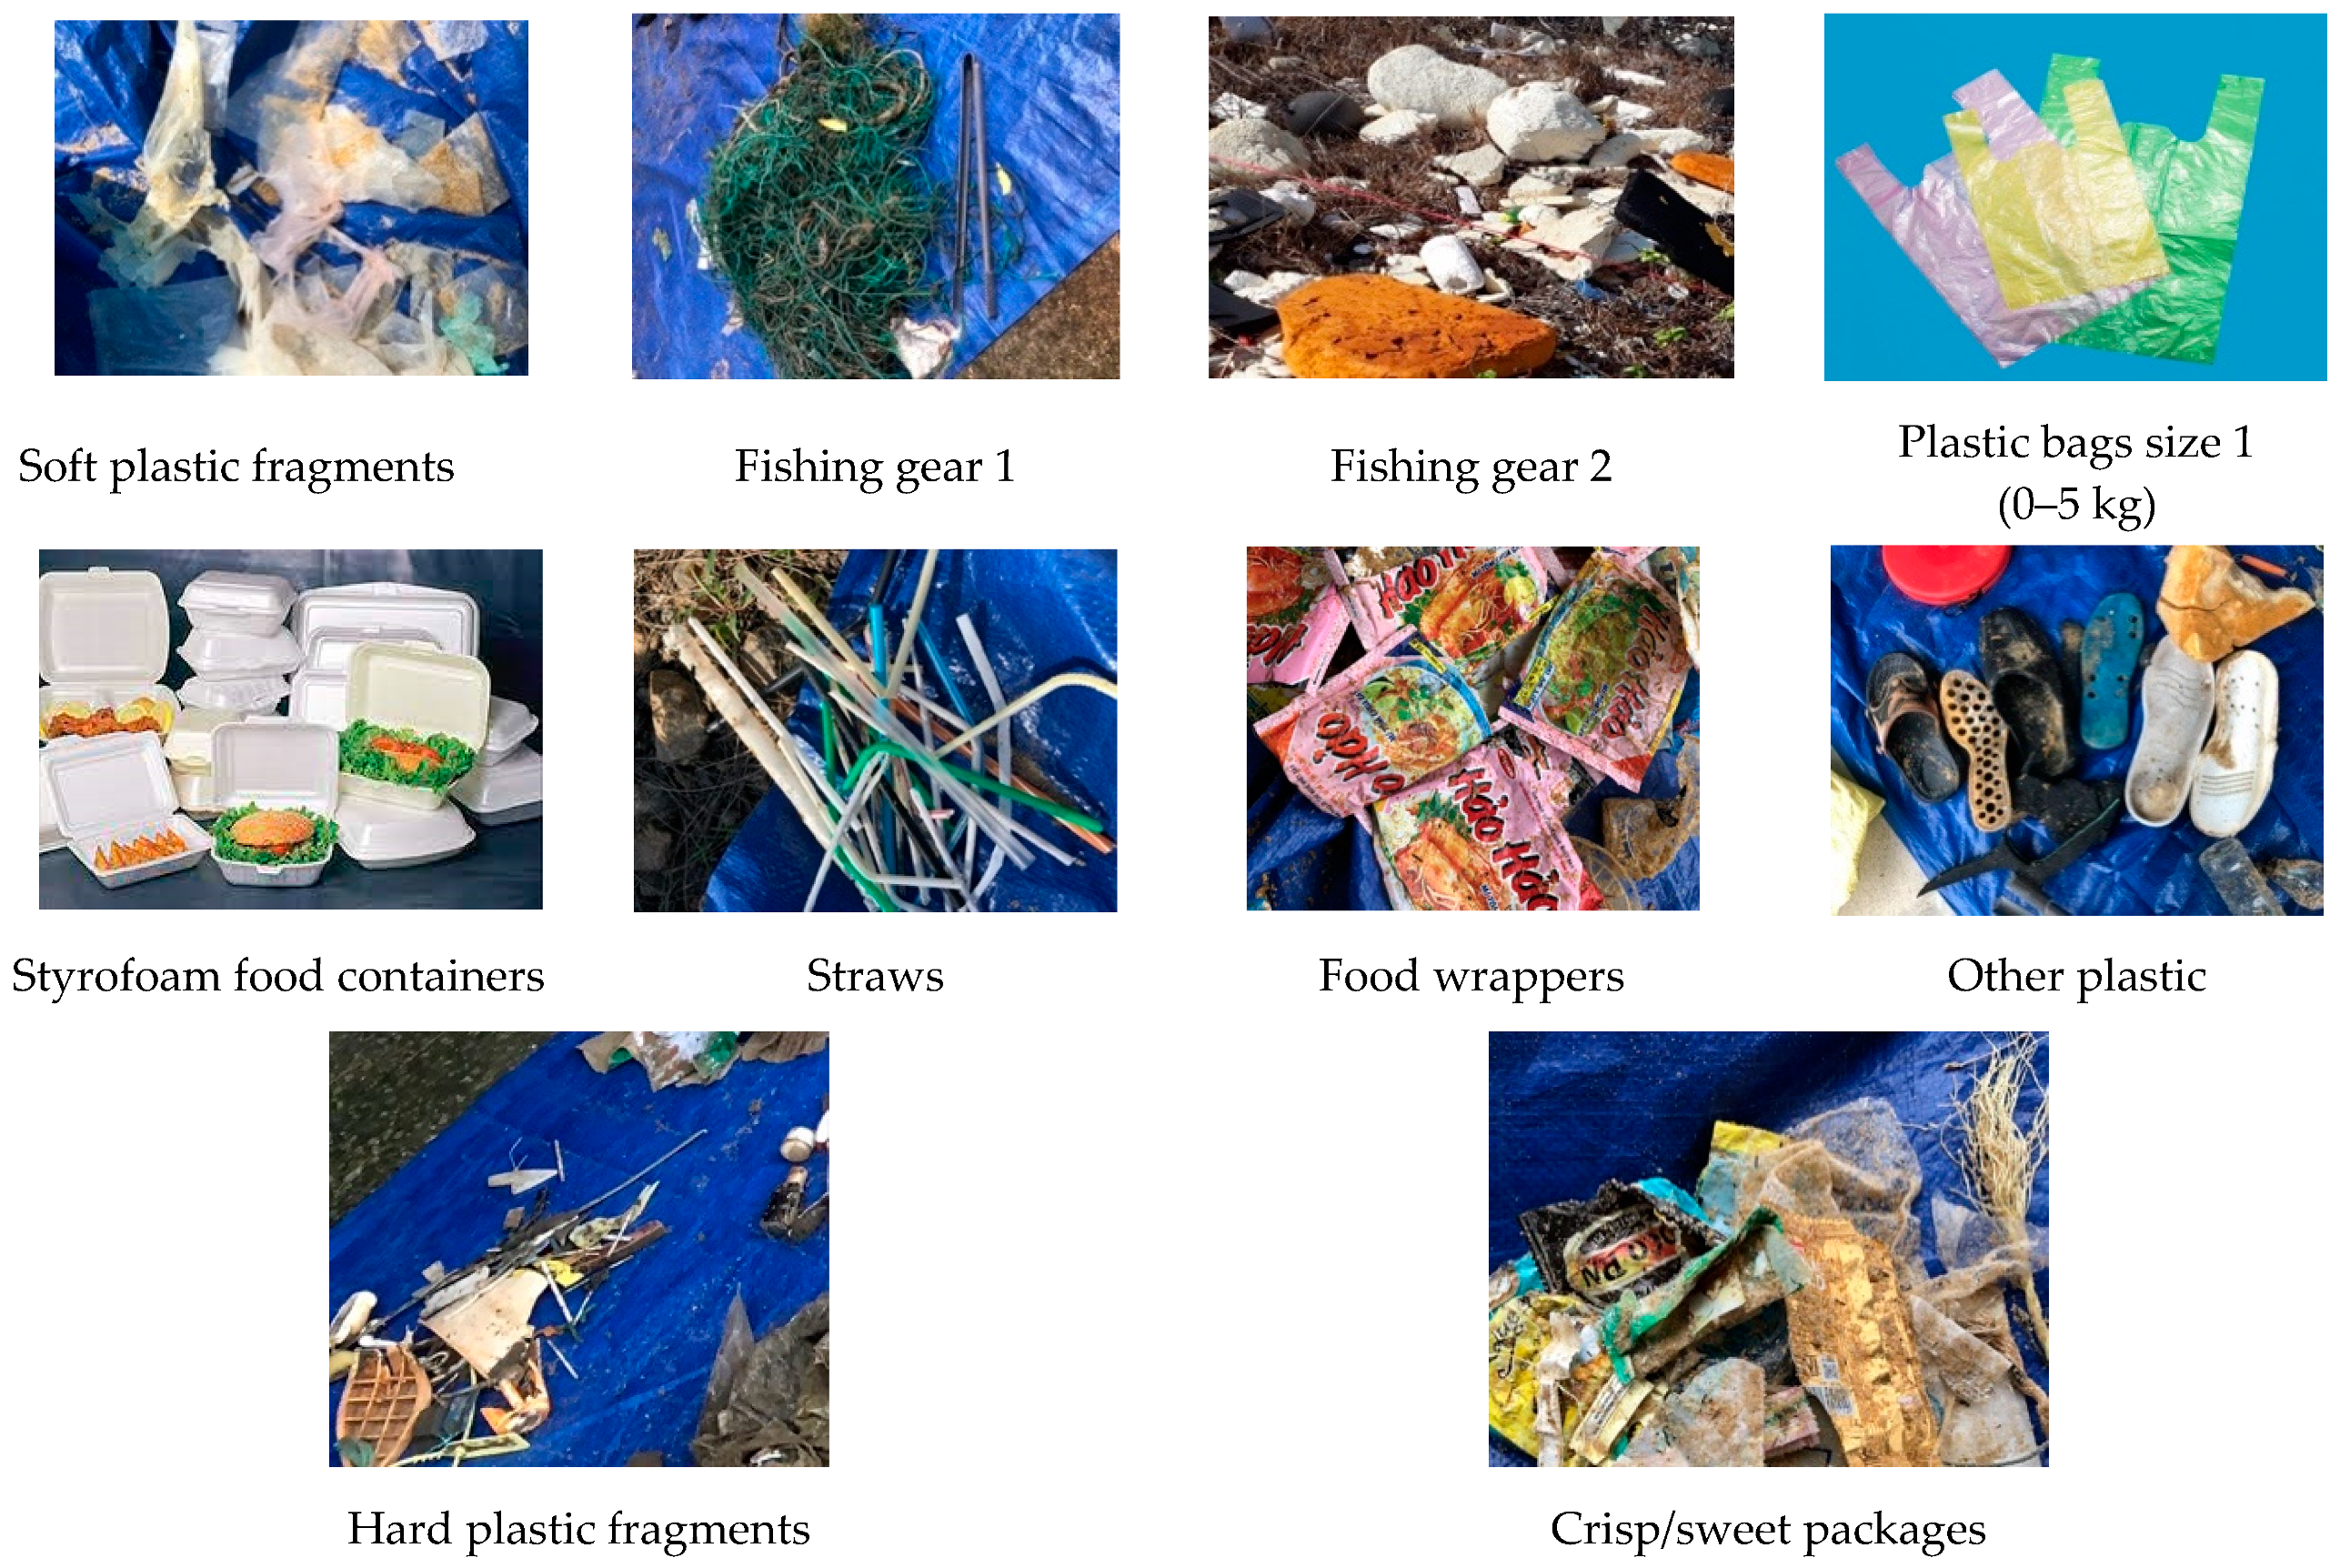
| Rank | Item | Percentage |
|---|---|---|
| 1 | Fishing gear 1: Fishing plastic rope, net pieces, fishing lures and lines, hard plastic floats | 17.65 |
| 2 | Soft plastic fragments (mostly from plastic bag fragments) | 17.24 |
| 3 | Fishing gear 2: Polystyrenes—EPS, buoys and floats | 13.37 |
| 4 | Plastic bags size 1 (0–5 kg) | 6.80 |
| 5 | Styrofoam food containers | 6.50 |
| 6 | Hard plastic fragments (from plastic toy, kitchenware, unidentified objects) | 6.07 |
| 7 | Straws | 4.69 |
| 8 | Other plastics (slippers, sanitary products, diaper, etc.) | 2.69 |
| 9 | Crisp/Sweet packages | 2.68 |
| 10 | Food wrappers | 2.44 |
| Total percentage | 80.14 | |
| Area | Items/m2 | CCI | CCI Rank | Study |
|---|---|---|---|---|
| Vietnam | 4.63 | 92.6 | extremely dirty | This study |
| Muara beach (Brunei Darussalam) | 74.43 | 1488.6 | extremely dirty | [48] |
| Indonesia | 41.6 | 832 | extremely dirty | [49] |
| Seberang Takir Beach (Malaysia) | 780 | 15,600 | extremely dirty | [50] |
| Macajalar Bay (Philippines) | 0.12 | 2.4 | clean | [51] |
| Guadalcanal Island (Solomon Islands) | 2.5 | 50 | extremely dirty | [52] |
| Efate Island (Vanuatu) | 1.25 | 25 | extremely dirty | [52] |
| Korean beaches | 1.5 | 30 | extremely dirty | [53] |
Publisher’s Note: MDPI stays neutral with regard to jurisdictional claims in published maps and institutional affiliations. |
© 2022 by the authors. Licensee MDPI, Basel, Switzerland. This article is an open access article distributed under the terms and conditions of the Creative Commons Attribution (CC BY) license (https://creativecommons.org/licenses/by/4.0/).
Share and Cite
Nguyen, T.-T.T.; Ha, N.-H.; Bui, T.-K.L.; Nguyen, K.L.P.; Tran, D.-P.T.; Nguyen, H.Q.; El-Arini, A.; Schuyler, Q.; Nguyen, T.T.L. Baseline Marine Litter Surveys along Vietnam Coasts Using Citizen Science Approach. Sustainability 2022, 14, 4919. https://doi.org/10.3390/su14094919
Nguyen T-TT, Ha N-H, Bui T-KL, Nguyen KLP, Tran D-PT, Nguyen HQ, El-Arini A, Schuyler Q, Nguyen TTL. Baseline Marine Litter Surveys along Vietnam Coasts Using Citizen Science Approach. Sustainability. 2022; 14(9):4919. https://doi.org/10.3390/su14094919
Chicago/Turabian StyleNguyen, Thu-Trang T., Ngan-Ha Ha, Thanh-Khiet L. Bui, Kieu Lan Phuong Nguyen, Diem-Phuc T. Tran, Hong Quan Nguyen, Ashraf El-Arini, Qamar Schuyler, and Thu Thi Le Nguyen. 2022. "Baseline Marine Litter Surveys along Vietnam Coasts Using Citizen Science Approach" Sustainability 14, no. 9: 4919. https://doi.org/10.3390/su14094919
APA StyleNguyen, T.-T. T., Ha, N.-H., Bui, T.-K. L., Nguyen, K. L. P., Tran, D.-P. T., Nguyen, H. Q., El-Arini, A., Schuyler, Q., & Nguyen, T. T. L. (2022). Baseline Marine Litter Surveys along Vietnam Coasts Using Citizen Science Approach. Sustainability, 14(9), 4919. https://doi.org/10.3390/su14094919