
Effects of Functional Diversity on Soil Respiration in an Arid Desert Area


Abstract
:1. Introduction
2. Methods and Materials
2.1. Overview of Study Area
2.2. Sampling
2.3. Rs Rate Monitoring
2.4. Plant Community Survey
2.5. Determination of Soil Physical and Chemical Properties
2.6. Diversity Index and Average Calculation of Community Character Weight
2.7. Multiple Collinearity Test
2.8. Construction of Linear Regression Model
2.9. Structural Equation Modeling
2.10. Statistical Analysis
3. Results and Analysis
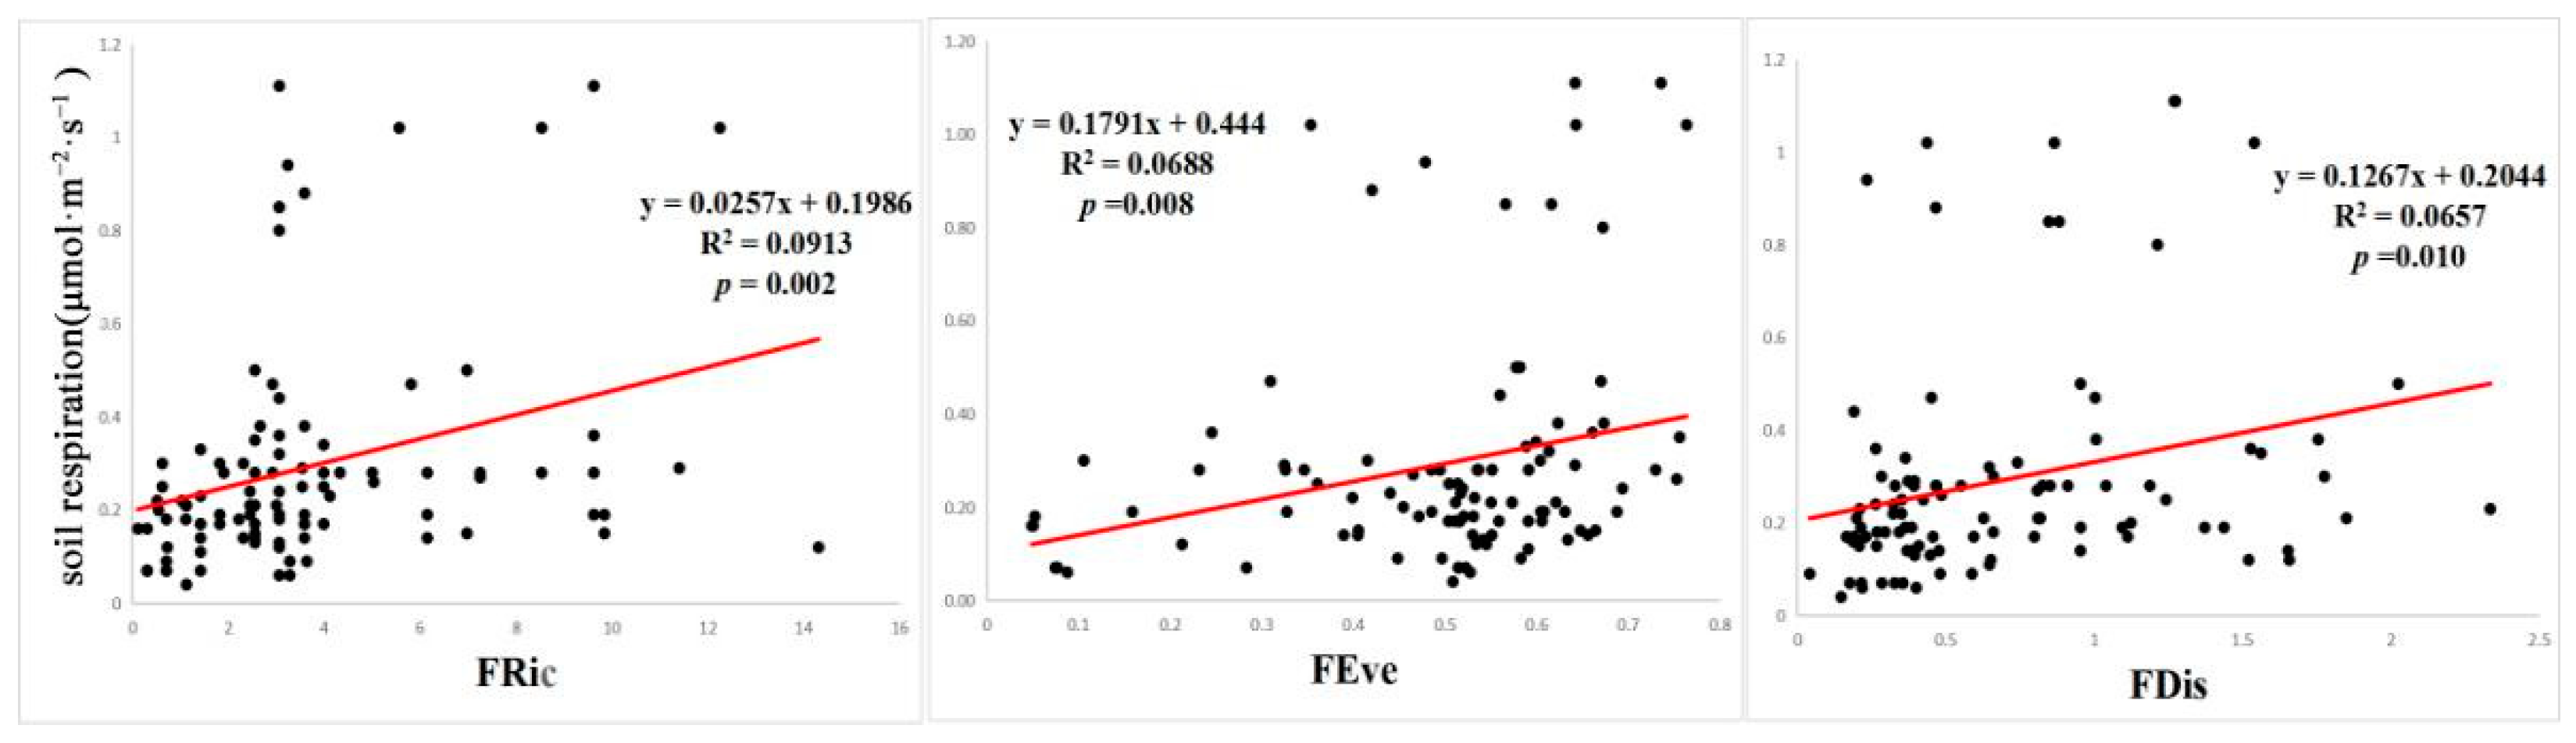
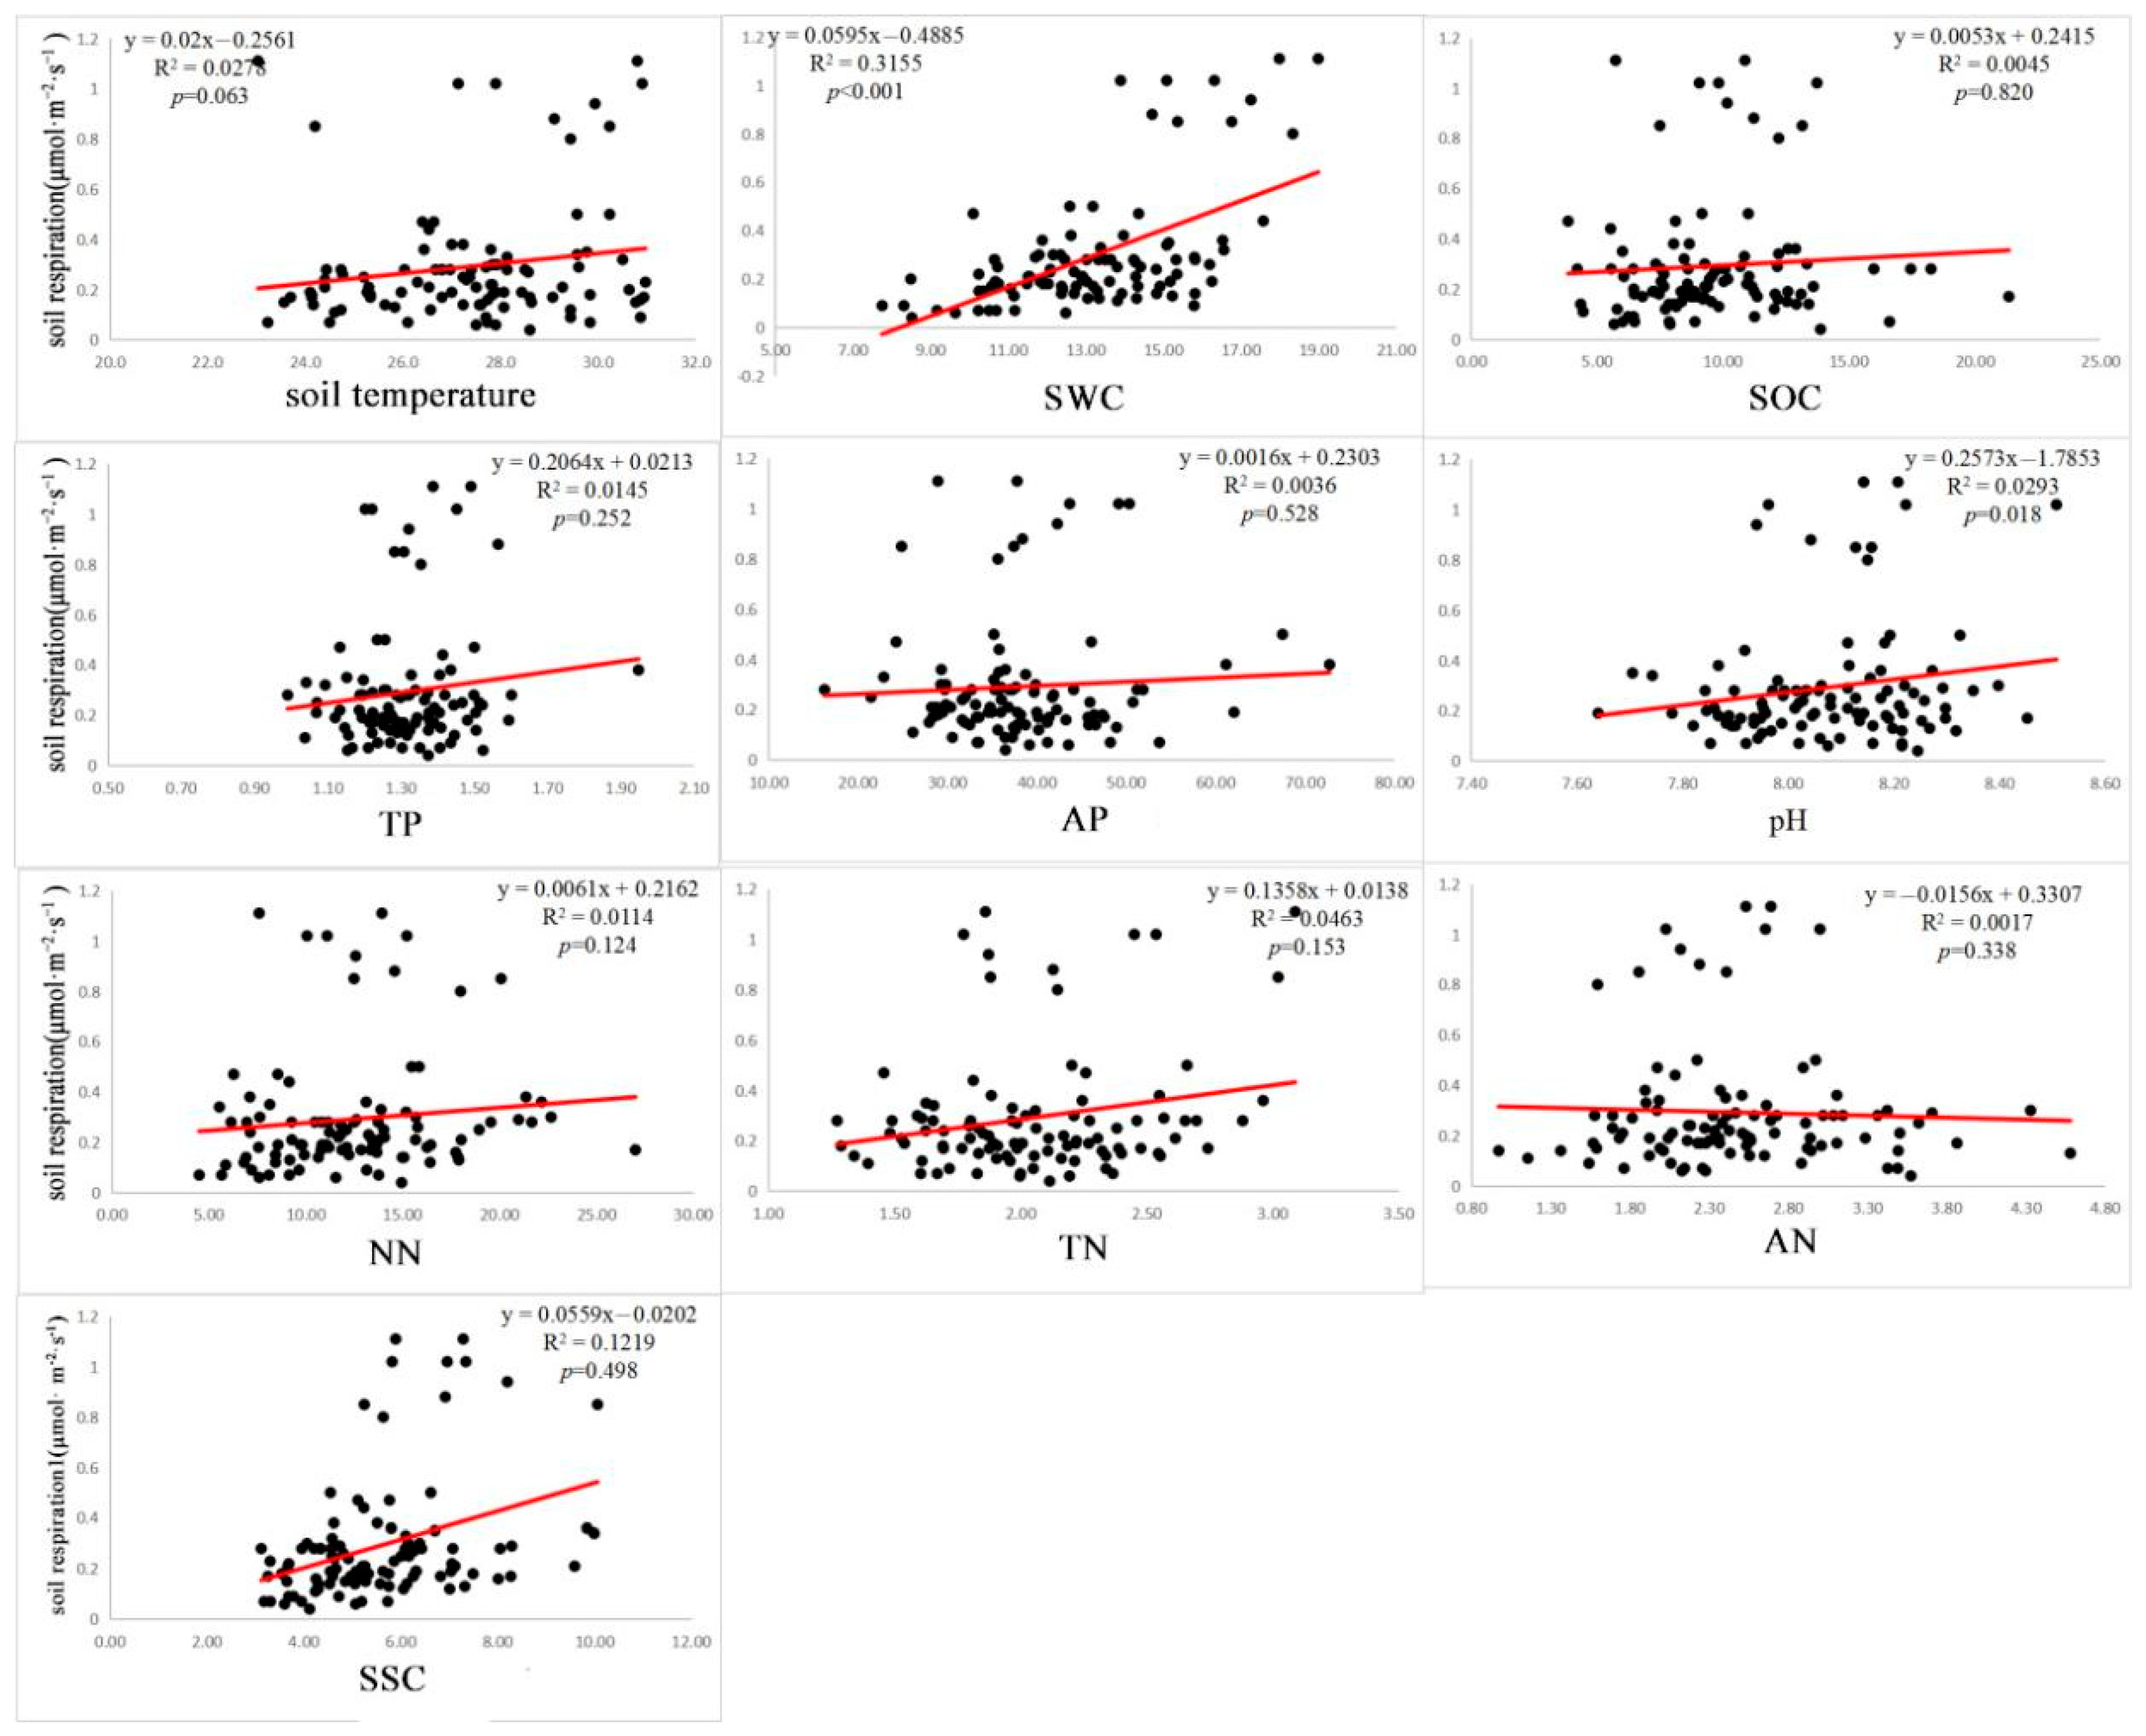
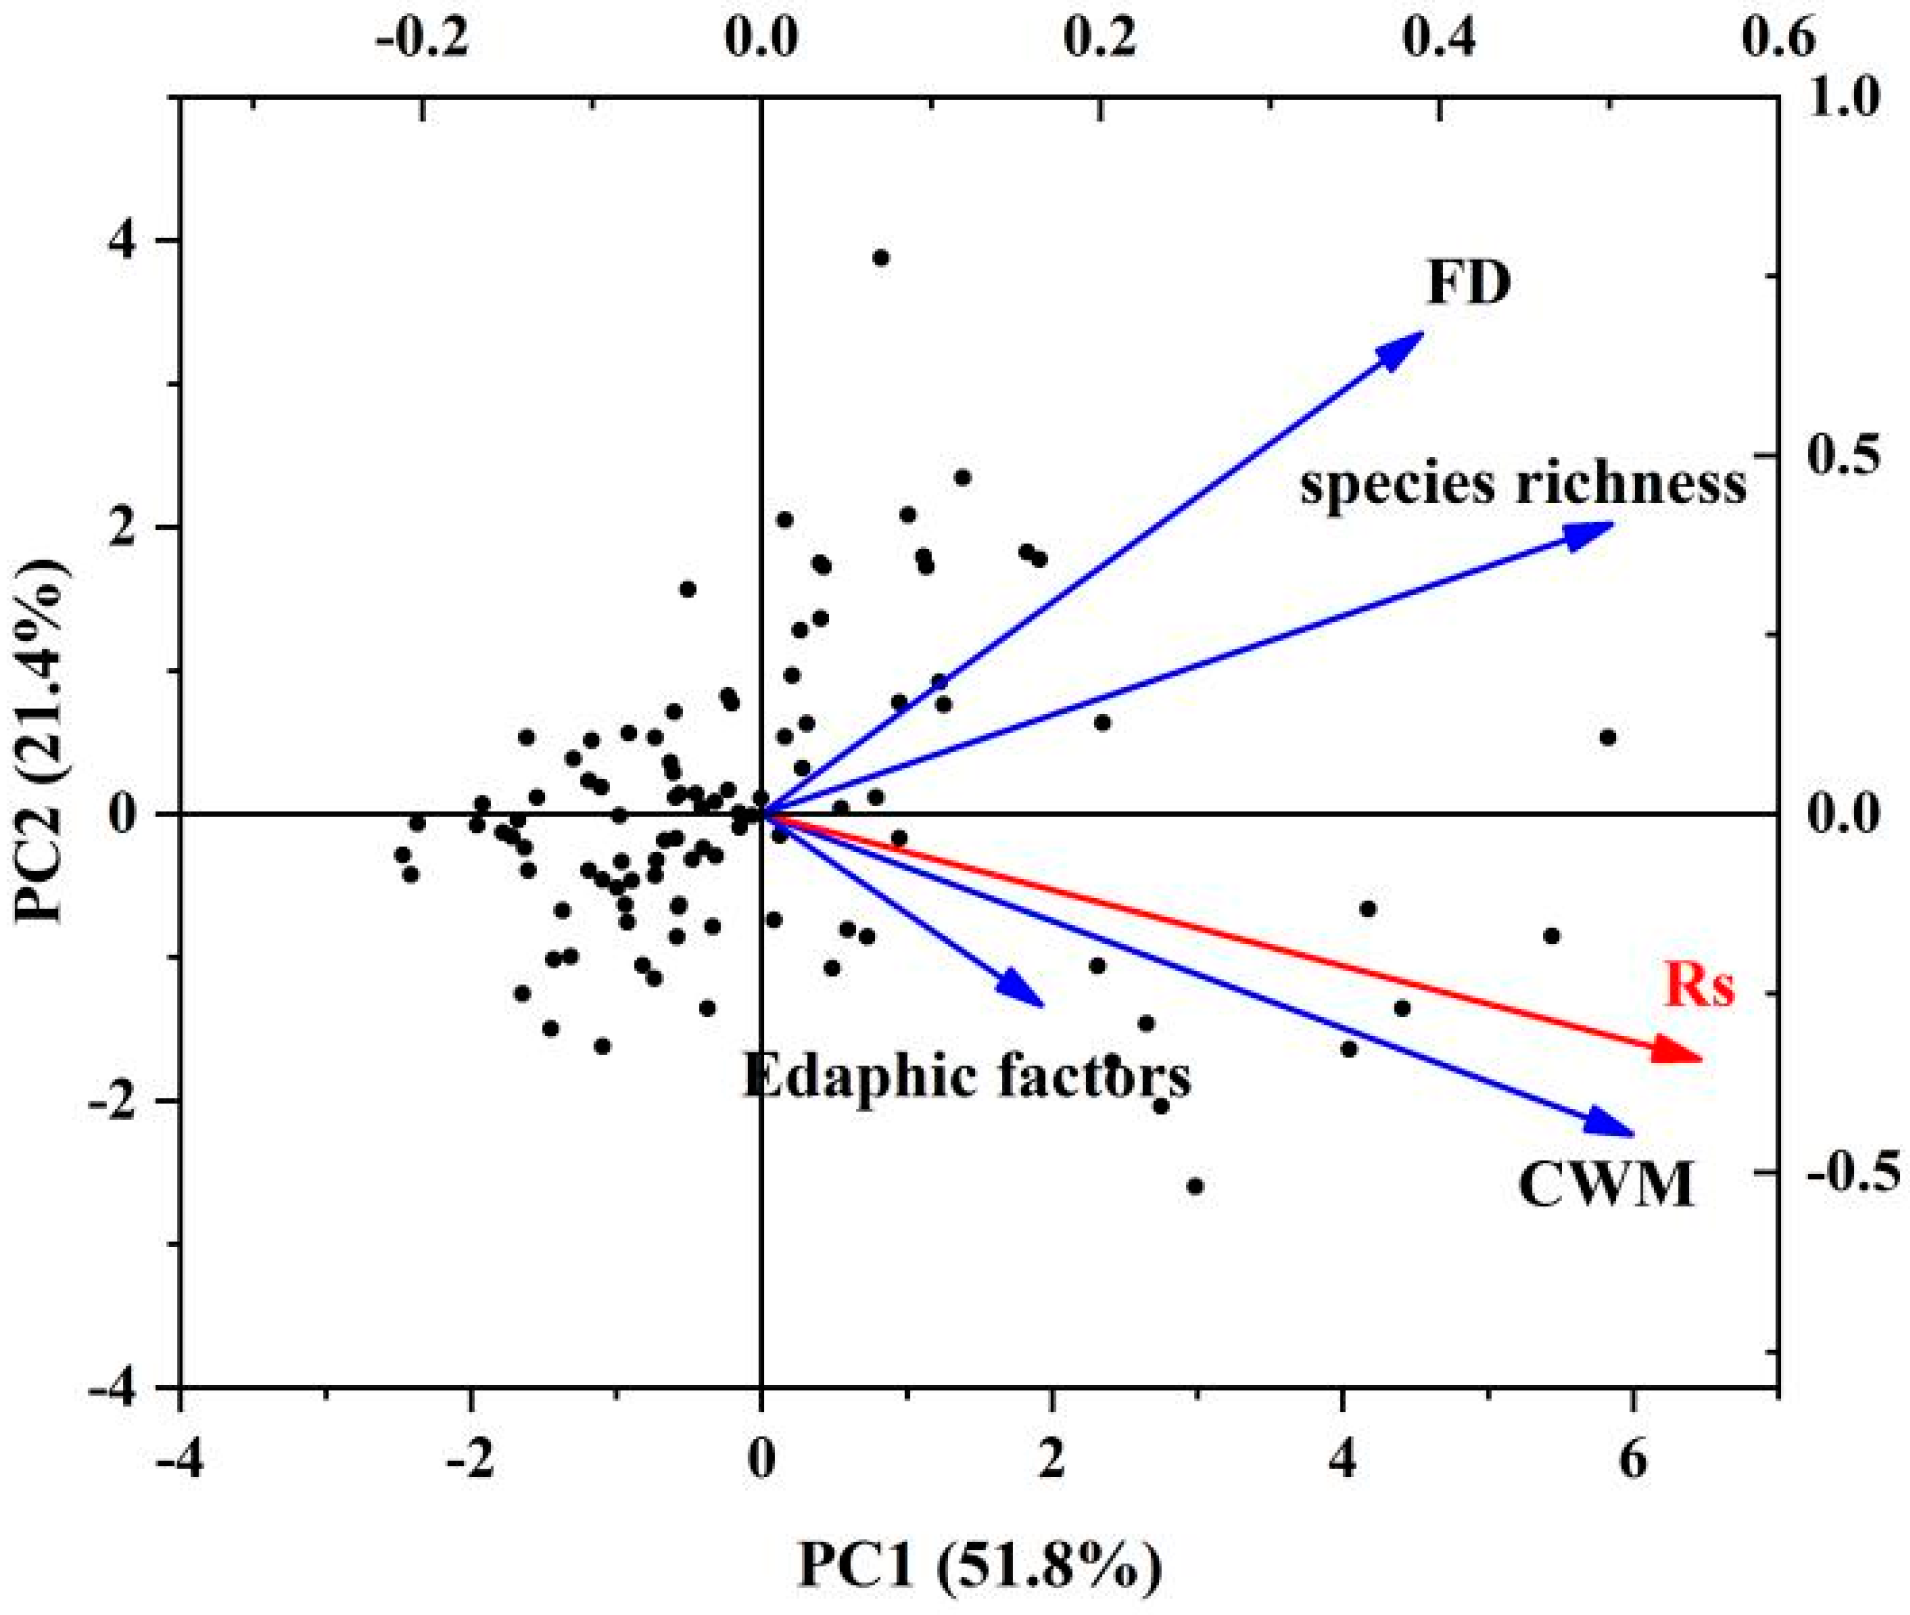
3.1. Correlations between Rs, FD, and Environmental Factors
3.2. Screening Optimal Variables for Rs Interpretation through a Linear Model
3.3. Effects of Each Factor on Rs
4. Discussion
4.1. Average Weight of Community Traits Can Better Explain the Change of Rs
4.2. Biomass Ratio Effect Was More Suitable for Explaining the Changes of Rs in the Arid Desert Area than the Niche Complementarity Effect
4.3. Impacts of Environmental Factors on the Relationship between Biodiversity and Rs
5. Conclusions
Author Contributions
Funding
Institutional Review Board Statement
Informed Consent Statement
Data Availability Statement
Acknowledgments
Conflicts of Interest
References
- Schlesinger, W.H.; Andrews, J.A. Soil respiration and the global carbon cycle. Biogeochemistry 2000, 48, 7–20. [Google Scholar] [CrossRef]
- Liu, S.H.; Fang J, Y. Effect factors of soil respiration and the temperature’s effects on soil respiration in the global scale. Acta Ecol. Sin. 1997, 17, 19–26. [Google Scholar]
- Kuzyakov, Y.V.; Larionova, A.A. Contribution of rhizomicro- bial and root respiration to the CO2 emission from soil (A review). Eurasian Soil Sci. 2006, 39, 753–764. [Google Scholar] [CrossRef]
- Yang, K.; Yang, Y.; Xu, Z.; Wu, Q. Soil respiration in a subtropical forest of southwestern China: Components, patterns and controls. PLoS ONE 2018, 13, e0204341. [Google Scholar] [CrossRef] [PubMed]
- Yu, J.; Fang, L.; Bian, Z.F.; Wang, Q.; Yu, Y.C. A review of the composition of soil carbon pool. Acta Ecol. Sin. 2014, 34, 4829–4838. [Google Scholar]
- Hibbard, K.A.; Law, B.E.; Reichstein, M.; Sulzman, J. An analysis of soil respiration across northern hemisphere temperate ecosystems. Biogeochemistry 2005, 73, 29–70. [Google Scholar] [CrossRef]
- Han, G.X.; Zhou, G.S.; Xu, Z.Z. Reearch and prospects for soil respiration of farmland ecosystems China. Acta Phytoecol. Sin. 2008, 32, 719–733. [Google Scholar]
- Liu, Y.R.; Delgado-Baquerizo, M.; Wang, J.T.; Hu, H.W.; Yang, Z.; He, J.Z. New insights into the role of microbial community composition in driving soil respiration rates. Soil Biol. Biochem. 2018, 118, 35–41. [Google Scholar] [CrossRef] [Green Version]
- Laliberté, E.; Legendre, P. A distance-based framework for measuring functional diversity from multiple traits. Ecology 2010, 91, 299–305. [Google Scholar] [CrossRef]
- Liira, J.; Schmidt, T.; Aavik, T.; Arens, P.; Augenstein, I.; Bailey, D.; Billeter, R.; Bukáček, R.; Burel, F.; De Blust, G.; et al. Plant functional group composition and large-scale species richness in European agricultural landscapes. J. Veg. Sci. 2008, 19, 3–14. [Google Scholar] [CrossRef]
- Lavorel, S.; Grigulis, K.; McIntyre, S.; Williams, N.S.; Garden, D.; Dorrough, J.; Berman, S.; Quétier, F.; Thébault, A.; Bonis, A. Assessing functional diversity in the field—Methodology matters! Funct. Ecol. 2008, 22, 134–147. [Google Scholar] [CrossRef]
- Díaz, S.; Cabido, M. Vive la difference: Plant functional diversity matters to ecosystem processes. Trends Ecol. Evol. 2001, 16, 646–655. [Google Scholar] [CrossRef]
- Díaz, S.; Lavorel, S.; de Bello, F.; Quétier, F.; Grigulis, K.; Robson, T.M. Incorporating plant functional diversity effects in ecosystem service assessments. Proc. Natl. Acad. Sci. USA 2007, 104, 20684–20689. [Google Scholar] [CrossRef] [Green Version]
- Bernhardt-Römermann, M.; Römermann, C.; Sperlich, S.; Schmidt, W. Explaining grassland biomass—The contribution of climate, species and functional diversity depends on fertilization and mowing frequency. J. Appl. Ecol. 2011, 48, 1088–1907. [Google Scholar] [CrossRef] [Green Version]
- Roscher, C.; Schumacher, J.; Gubsch, M.; Lipowsky, A.; Weigelt, A.; Buchmann, N.; Schmid, B.; Schulze, E.D. plant functional traits to explain diversity–productivity relationships. PLoS ONE 2012, 7, e36760. [Google Scholar] [CrossRef]
- Huang, X.; Su, J.; Li, S.; Liu, W.; Lang, X. Functional diversity drives ecosystem multifunctionality in a Pinus yunnanensis natural secondary forest. Sci. Rep. 2019, 9, 6979. [Google Scholar] [CrossRef] [Green Version]
- Jin, H.J.; Yu, Q.H.; Wang, S.L.; Lü, L. Changes in permafrost environments along the Qinghai–Tibet engineering corridor induced by anthropogenic activities and climate warming. Cold Reg. Sci. Technol. 2008, 53, 317–333. [Google Scholar] [CrossRef]
- Tilman, D. Distinguishing between the effects of species diversity and species composition. Oikos 1997, 80, 185. [Google Scholar] [CrossRef]
- Grime, J.P. Benefits of plant diversity to ecosystems: Immediate, filter and founder effects. J. Ecol. 1998, 86, 902–910. [Google Scholar] [CrossRef]
- Tobner, C.M.; Paquette, A.; Gravel, D.; Reich, P.B.; Williams, L.J.; Messier, C. Functional identity is the main driver of diversity effects in young tree communities. Ecol. Lett. 2016, 19, 638–647. [Google Scholar] [CrossRef]
- Ali, A.; Yan, E.R.; Chang, S.X.; Cheng, J.Y.; Liu, X.Y. Community-weighted mean of leaf traits and divergence of wood traits predict aboveground biomass in secondary subtropical forests. Sci. Total Environ. 2017, 574, 654–662. [Google Scholar] [CrossRef] [PubMed]
- He, X.; Lv, G.; Qin, L.; He, J.; Xu, M. Preliminary study of contrast integration of photosynthesis and soil respiration properties of gossypium and phragmites australis community in Ebinur Lake area. Xinjiang Agric. Sci. 2012, 49, 1509–1518. [Google Scholar]
- Wang, J.; Teng, D.; He, X.; Qin, L.; Yang, X.; Lv, G. Spatial non-stationarity effects of driving factors on soil respiration in an arid desert region. Catena 2021, 207, 105617. [Google Scholar] [CrossRef]
- Zhang, X.N.; Lü, G.H.; Yang, X.D.; Gong, L.; Qin, L.; He, X.M.; Liu, H.Q. Responses of desert plant diversity, community and interspecific association to soil salinity gradient. Acta Ecol. Sin. 2013, 33, 5714–5722. [Google Scholar] [CrossRef]
- Zhong, Y.; Wang, W.; Wang, J.; Wang, Y.; Li, J.; Yuan, D.; Fan, Y.; Wei, X. Leaf functional traits of oasis plants in extremely arid areas and its response to soil water and salt factors. J. Beijing For. Univ. 2019, 41, 1000–1522. [Google Scholar]
- Jiang, Y.; Zhang, B.; Wang, W.; Li, B.; Wu, Z.; Chu, C. Topography and plant community structure contribute to spatial heterogeneity of soil respiration in a subtropical forest. Sci. Total Environ. 2020, 733, 139287. [Google Scholar] [CrossRef]
- Yang, X.D.; Ali, A.; Xu, Y.L.; Jiang, L.M.; Lv, G.H. Soil moisture and salinity as main drivers of soil respiration across natural xeromorphic vegetation and agricultural lands in an arid desert region. Catena 2019, 177, 126–133. [Google Scholar] [CrossRef]
- Zhang, Z.S.; Dong, X.J.; Xu, B.X.; Chen, Y.L.; Zhao, Y.; Gao, Y.H.; Hu, Y.G.; Huang, L. Soil respiration sensitivities to water and temperature in a revegetated desert. J. Geophys. Res. Biogeosci. 2015, 120, 773–787. [Google Scholar] [CrossRef]
- Bao, S.D. Soil and Agricultural Chemistry Analysis; China Agriculture Press: Beijing, China, 2000. [Google Scholar]
- Norman, R.J.; Edberg, J.C.; Stucki, J.W. Determination of Nitrate in Soil Extracts by Dual-wavelength Ultraviolet Spectrophotometry 1. Soil Sci. Soc. Am. J. 1985, 49, 1182–1185. [Google Scholar] [CrossRef]
- Li, Q.; Song, X.; Chang, S.X.; Peng, C.; Xiao, W.; Zhang, J.; Xiang, W.; Li, Y.; Wang, W. Nitrogen depositions increase soil respiration and decrease temperature sensitivity in a Moso bamboo forest. Agric. For. Meteorol. 2019, 268, 48–54. [Google Scholar] [CrossRef]
- Fox, J.; Monette, G. Generalized Collinearity Diagnostics. Publ. Am. Stat. Assoc. 1992, 87, 178–183. [Google Scholar] [CrossRef]
- Fox, J. Applied Regression Analysis and Generalized Linear Models, 2nd ed.; Sage Publications: Thousand Oaks, FL, USA, 2008. [Google Scholar]
- Hoyle, R.H. Handbook of structural equation modeling. Struct. Equ. Modeling 2012, 20, 354–360. [Google Scholar]
- Edwards, J.R.; Lambert, L.S. Methods for integrating moderation and mediation: A general analytical framework using moderated path analysis. Psychol. Methods 2007, 12, 1–22. [Google Scholar] [CrossRef] [PubMed] [Green Version]
- Finegan, B.; Peña-Claros, M.; de Oliveira, A.; Ascarrunz, N.; Bret-Harte, M.S.; Carreño-Rocabado, G.; Casanoves, F.; Díaz, S.; Eguiguren Velepucha, P.; Fernandez, F. Does functional trait diversity predict above-ground biomass and productivity of tropical forests? Testing three alternative hypotheses. J. Ecol. 2015, 103, 191–201. [Google Scholar] [CrossRef] [Green Version]
- Kunstler, G.; Falster, D.; Coomes, D.A.; Hui, F.; Kooyman, R.M.; Laughlin, D.C.; Poorter, L.; Vanderwel, M.; Vieilledent, G.; Wright, S.J.; et al. Plant functional traits have globally consistent effects on competition. Nature 2016, 529, 204–207. [Google Scholar] [CrossRef] [Green Version]
- Prado-Junior, J.A.; Schiavini, I.; Vale, V.S.; Arantes, C.S.; van der Sande, M.T.; Lohbeck, M.; Poorter, L. Conservative species drive biomass productivity in tropical dry forests. J. Ecol. 2016, 104, 817–827. [Google Scholar] [CrossRef] [Green Version]
- Xu, Z.; Li, M.H.; Zimmermann, N.E.; Li, S.P.; Li, H.; Ren, H.; Sun, H.; Han, X.; Jiang, Y.; Jiang, L. Plant functional diversity modulates global environmental change effects on grassland productivity. J. Ecol. 2018, 106, 1941–1951. [Google Scholar] [CrossRef]
- Orwin, K.H.; Buckland, S.M.; Johnson, D.; Turner, B.L.; Smart, S.; Oakley, S.; Bardgett, R.D. Linkages of plant traits to soil properties and the functioning of temperate grassland. J. Ecol. 2010, 98, 1074–1083. [Google Scholar] [CrossRef] [Green Version]
- Laughlin D, C. Applying trait-based models to achieve functional targets for theory-driven ecological restoration. Ecol. Lett. 2014, 17, 771–784. [Google Scholar] [CrossRef] [Green Version]
- Tolonen, K.E.; Leinonen, K.; Marttila, H.; Erkinaro, J.; Heino, J. Environmental predictability of taxonomic and functional community composition in high-latitude streams. Freshw. Biol. 2017, 62, 1–16. [Google Scholar] [CrossRef]
- Göthe, E.; Baattrup-Pedersen, A.; Wiberg-Larsen, P.; Graeber, D.; Kristensen, E.A.; Friberg, N. Environmental and spatial controls of taxonomic versus trait composition of stream biota. Freshw. Biol. 2017, 62, 397–413. [Google Scholar] [CrossRef]
- Dănescu, A.; Albrecht, A.T.; Bauhus, J. Structural diversity promotes productivity of mixed, uneven-aged forests in southwestern Germany. Oecologia 2016, 182, 319–333. [Google Scholar] [CrossRef] [PubMed]
- Eisenhauer, N.; Schielzeth, H.; Barnes, A.D.; Barry, K.E.; Bonn, A.; Brose, U.; Bruelheide, H.; Buchmann, N.; Buscot, F.; Ebeling, A.; et al. A multitrophic perspective on biodiversity-ecosystem functioning research. Adv. Ecol. Res. 2019, 61, 1–54. [Google Scholar] [PubMed]
- Maureaud, A.; Andersen, K.H.; Zhang, L.; Lindegren, M. Trait-based food web model reveals the underlying mechanisms of biodiversity–ecosystem functioning relationships. J. Anim. Ecol. 2020, 89, 1497–1510. [Google Scholar] [CrossRef]
- Singh, J.S.; Gupta, S.R. Plant decomposition and soil respiration in terrestrial ecosystems. Bot. Rev. 1977, 43, 449–528. [Google Scholar] [CrossRef]
- Dias, A.; Ruijven, J.; Berendse, F. Plant species richness regulates soil respiration through changes in productivity. Oecologia 2010, 163, 805–813. [Google Scholar] [CrossRef] [Green Version]
- Lohbeck, M.; Poorter, L.; Martínez-Ramos, M.; Bongers, F. Biomass is the main driver of changes in ecosystem process rates during tropical forest succession. Ecology 2015, 96, 1242–1252. [Google Scholar] [CrossRef]
- Zhao, Q.; Liu, S.; Chen, Y.F.; Wu, C.Z.; Fan, H.; Lin, Y.; Li, J. Soil respiration characteristics and influencing factors of Castanopsis eyrei forest in different forest ages in Wuyi Mountain. Acta Ecol. Sin. 2021, 41, 2326–2338. [Google Scholar]
- Atkin, O.K.; Edwards, E.J.; Loveys, B.R. Response of root respiration to change in temperature and its relevance to global warming. New Phytol. 2000, 147, 141–154. [Google Scholar] [CrossRef]


| Model Parameters | Diversity–Soil Respiration Models | ||
|---|---|---|---|
| I | II | III | |
| R2 | 0.300 | 0.841 | 0.841 |
| AIC | 27.916 | 26.789 | 38.789 |
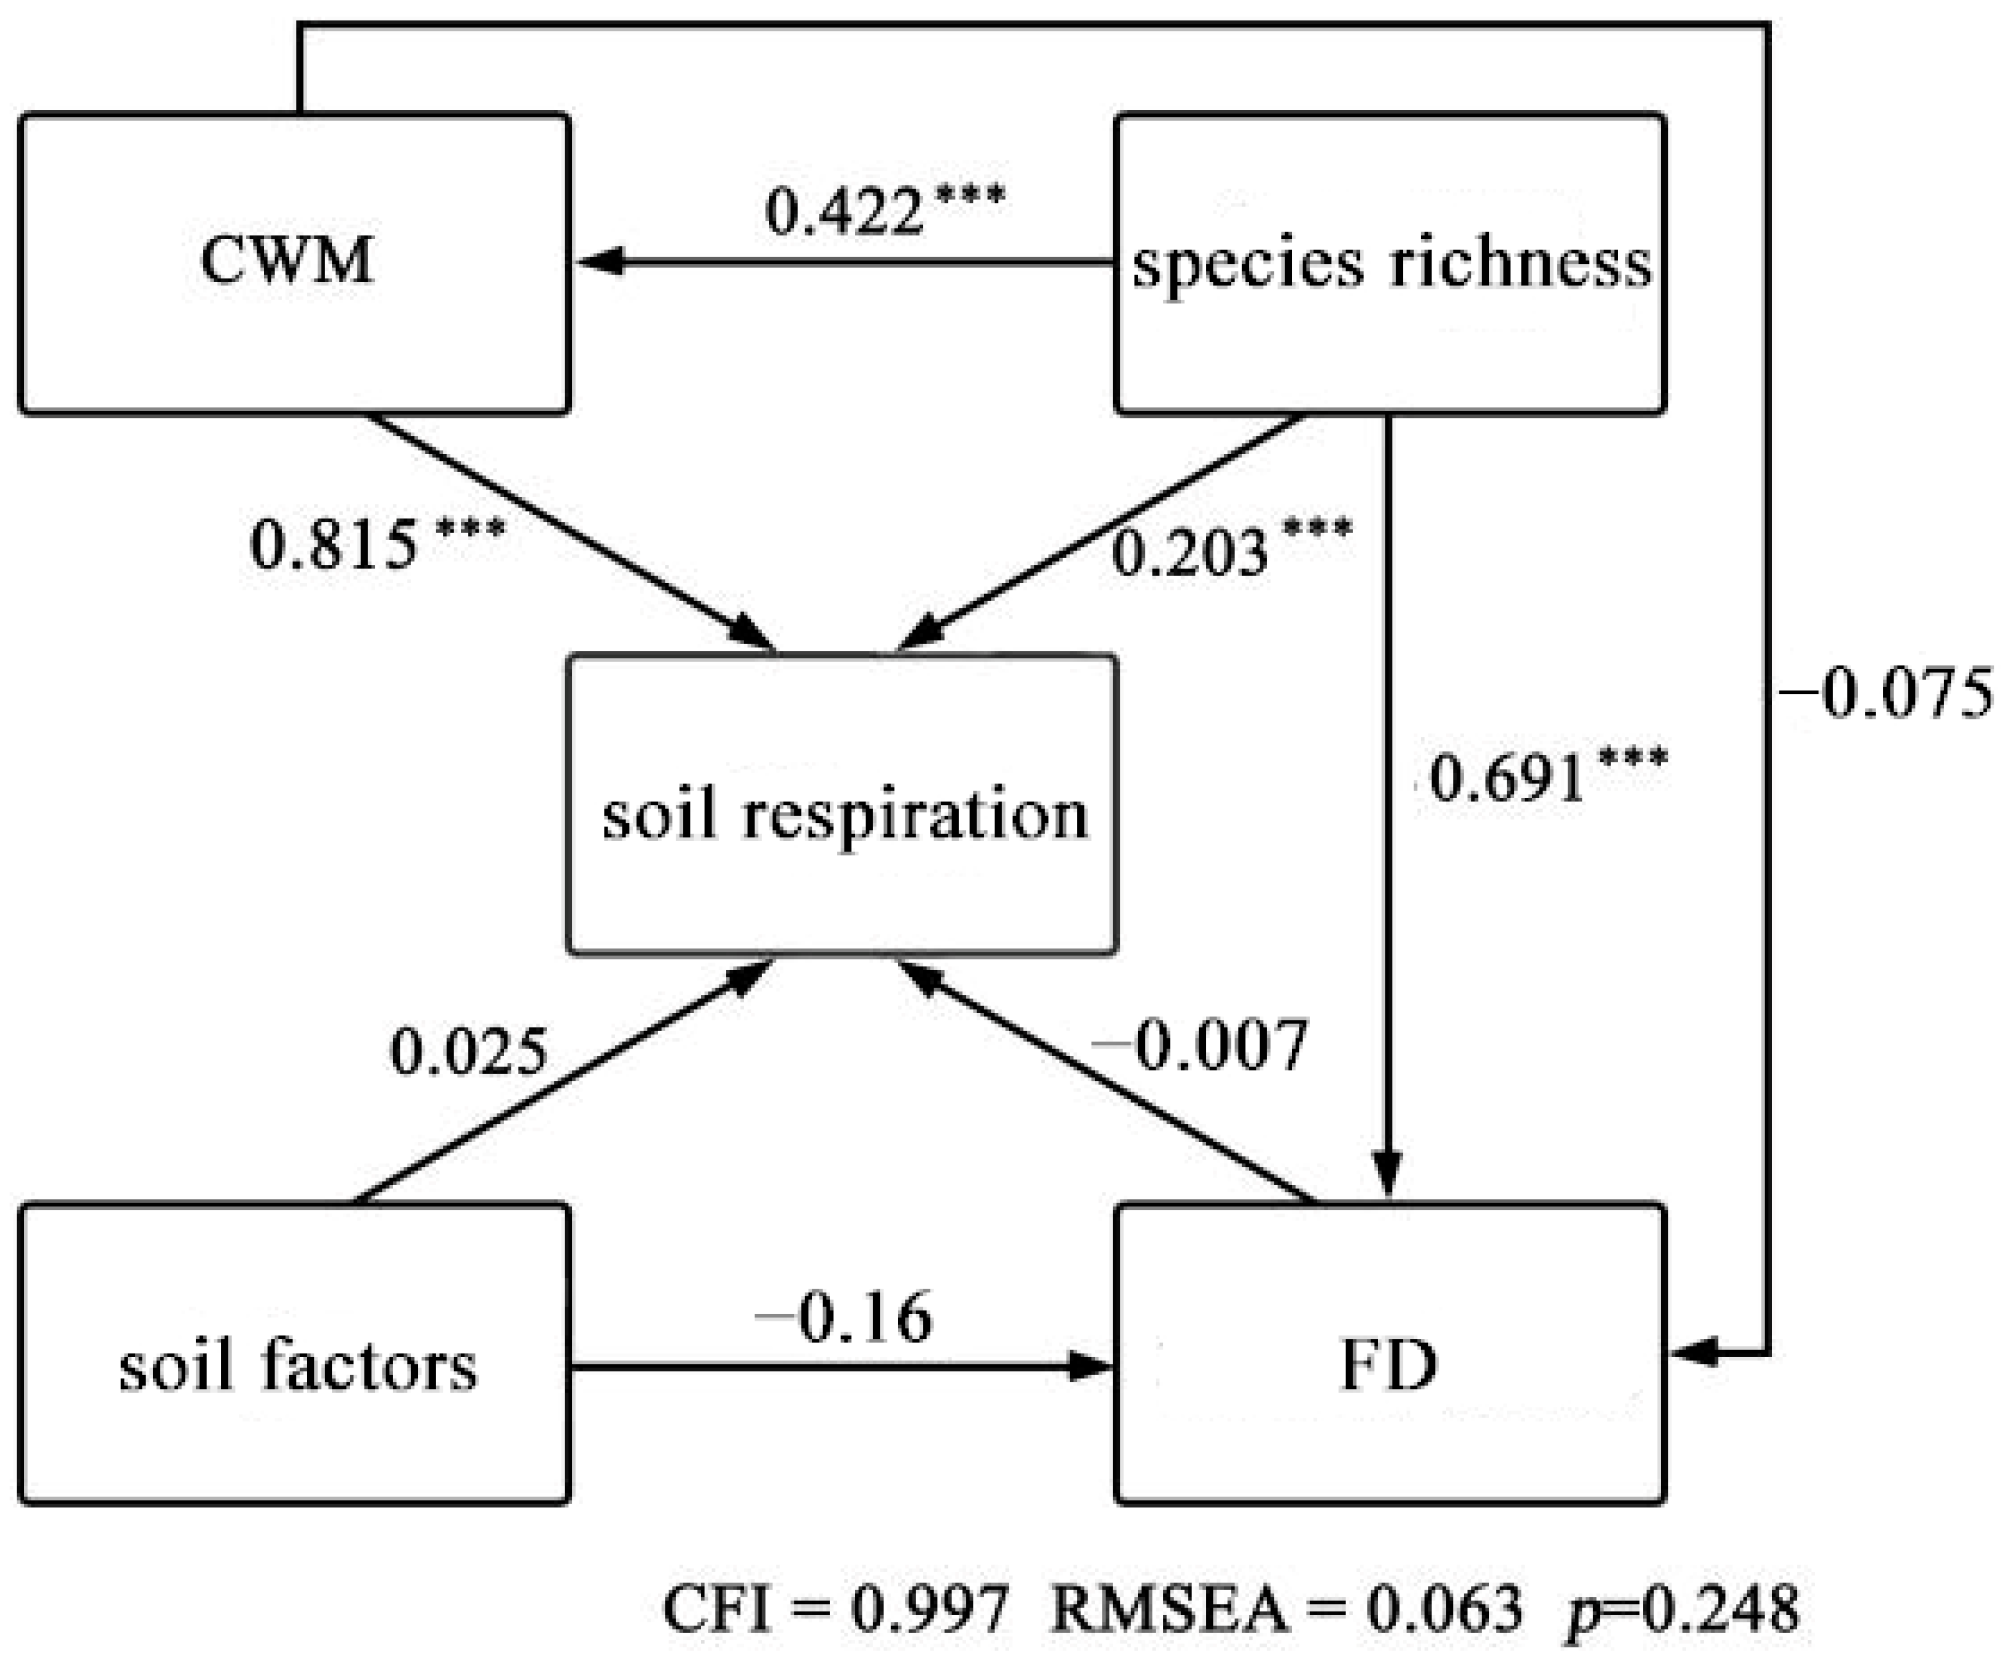
| Explanatory Variable | Action Pathway of Soil Respiration Pathway to Soil Respiration | Structural Equation Model |
|---|---|---|
| Influence Effect | ||
| Soil factors | Direct effect | 0.025 |
| Indirect effect | 0.000 | |
| Total effect | 0.025 | |
| Functional diversity | Direct effect | −0.007 |
| Indirect effect | 0.000 | |
| Total effect | −0.007 | |
| Community-weighted mean functional traits (CWM) | Direct effect | 0.815 |
| Indirect effect | 0.000 | |
| Total effect | 0.815 | |
| Species richness | Direct effect | 0.203 |
| Indirect effect | 0.339 | |
| Total effect | 0.543 |
Publisher’s Note: MDPI stays neutral with regard to jurisdictional claims in published maps and institutional affiliations. |
© 2022 by the authors. Licensee MDPI, Basel, Switzerland. This article is an open access article distributed under the terms and conditions of the Creative Commons Attribution (CC BY) license (https://creativecommons.org/licenses/by/4.0/).
Share and Cite
Liu, F.; Wang, J.; Shu, Y.; Lv, G. Effects of Functional Diversity on Soil Respiration in an Arid Desert Area. Sustainability 2022, 14, 4821. https://doi.org/10.3390/su14084821
Liu F, Wang J, Shu Y, Lv G. Effects of Functional Diversity on Soil Respiration in an Arid Desert Area. Sustainability. 2022; 14(8):4821. https://doi.org/10.3390/su14084821
Chicago/Turabian StyleLiu, Feiyi, Jinlong Wang, Yulin Shu, and Guanghui Lv. 2022. "Effects of Functional Diversity on Soil Respiration in an Arid Desert Area" Sustainability 14, no. 8: 4821. https://doi.org/10.3390/su14084821
APA StyleLiu, F., Wang, J., Shu, Y., & Lv, G. (2022). Effects of Functional Diversity on Soil Respiration in an Arid Desert Area. Sustainability, 14(8), 4821. https://doi.org/10.3390/su14084821