Article

The Impact of Sustainable Bond Issuances in the Economic Growth of the Latin American and Caribbean Countries

1
Facultad de Ciencias Económicas, Administrativas y Empresariales, Universidad Católica de Santiago de Guayaquil, Av. Carlos Julio Arosemena, km 1.5, Guayaquil 090615, Ecuador
2
Departamento de Economía y Empresa, Universidad de Almería, La Cañada de San Urbano, s/n, 04120 Almería, Spain
3
Departamento de Economía de la Empresa, Universidad Rey Juan Carlos, Vicálvaro, 28032 Madrid, Spain
*
Author to whom correspondence should be addressed.
Sustainability 2022, 14(8), 4693; https://doi.org/10.3390/su14084693
Submission received: 17 January 2022 / Revised: 25 March 2022 / Accepted: 10 April 2022 / Published: 14 April 2022
(This article belongs to the Special Issue Emerging Markets’ Competitive Advantages in Sustainable Management)

Abstract

:
There is beyond any doubt that Latin America is one of the most important emerging markets in the world, which has increased its importance in the last decades. In effect, the issues of green, social, and sustainability (GSS) bonds are gaining more and more importance in the Latin American and the Caribbean (LAC) financial markets. They are specifically focused on raising funding for public expenditure programs that contribute to achieving several objectives, such as climate and environmental projects, energy efficiency, pollution prevention, sustainable agriculture, fishery and forestry, etc. The main objective of this paper is to provide a literature revision of the evolution of the issuance of GSS bonds in the LAC region and to analyze the economic growth of the countries which issue this type of bond. We will apply multiple linear regression to relate the economic growth of some countries of the LAC region with the variables proposed by the IFC Emerging Market Green Bonds Report (2019). It has been shown that the economic growth of the countries in the LAC region that are issuing GSS bonds is significantly related to the Sovereign Green Issuance (Total Planned), the ratio of Private Credit/GDP, and the Rule of Law Index. However, this research has had the limitation of the scarcity of available data in the LAC markets.

1. Introduction

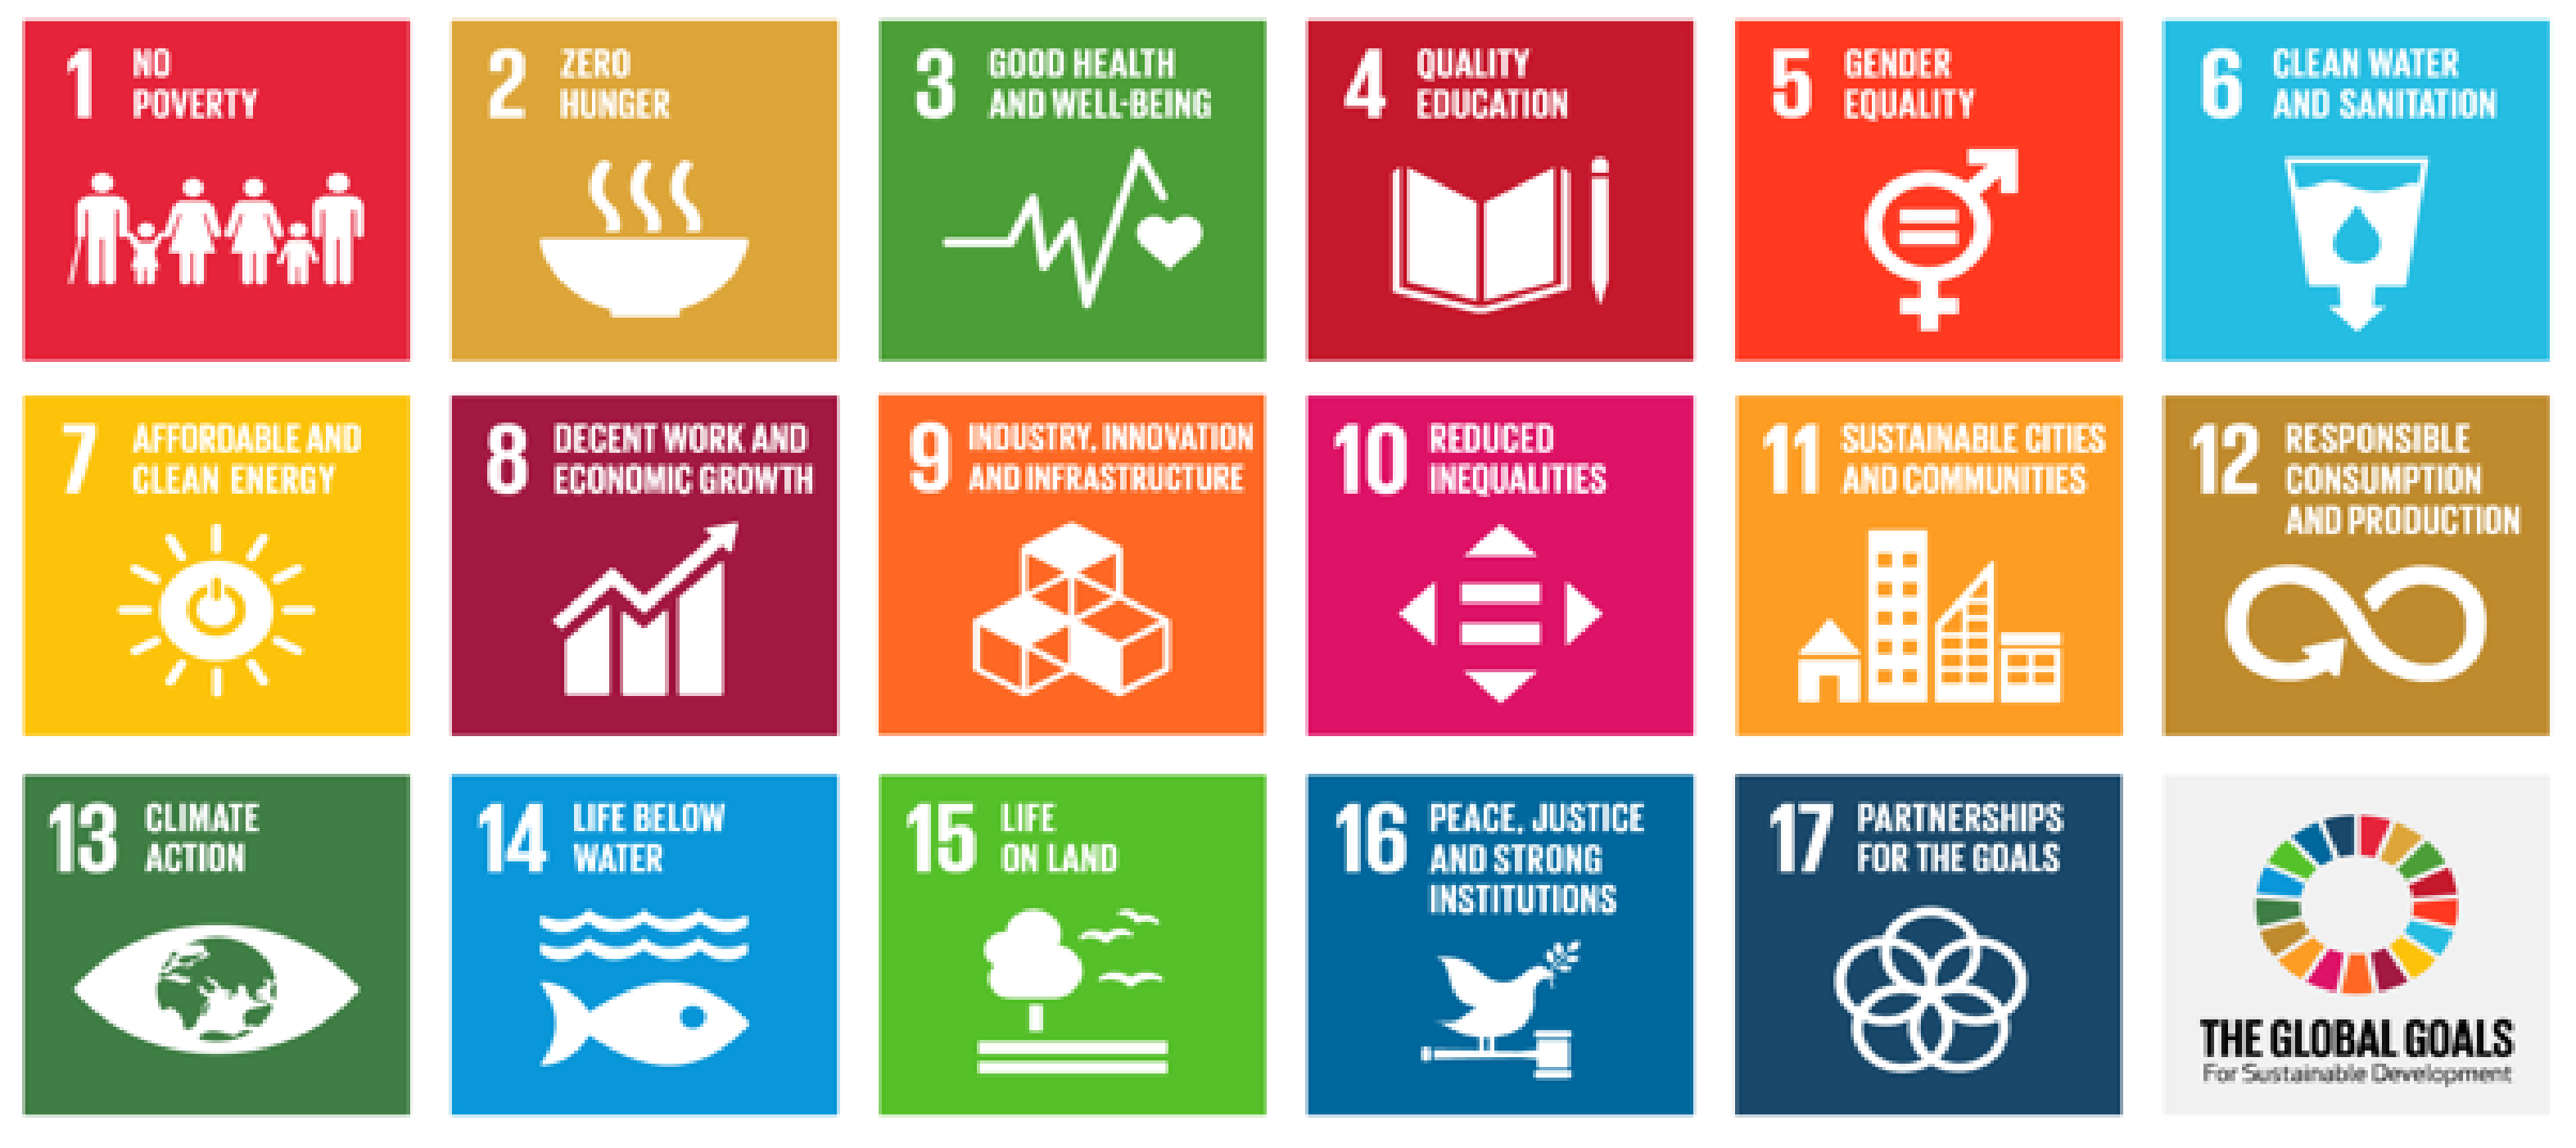
In the conceptual framework of sustainability, the United Nations (UN) launched the so-called seventeen Sustainable Development Goals (SDGs) which projected, in 2015, a horizon until 2030 in order to urge the member states to take actions addressed to reduce poverty, the protection of the planet, and the prosperity of people around the world [1,2].
Although certain advances in the fulfillment of those goals (see Figure 1) have been evidenced, during the first decade, there is still a long way to go, as an urgent need to increase the speed of action to reach this milestone in 2030 is required.
International finance has coined the term “sustainable finance” which, according to the Spanish stock market supervisory, the National Securities Market Commission [3], aims the economic growth of nations toward more human and balanced development, by satisfying current needs and envisioning a better future for new generations. Therefore, sustainable finance, in addition to strictly financial criteria such as profitability, risk, and liquidity, is mainly based on satisfying environmental, social, and governance needs.
In the same sense, the International Finance Corporation (IFC) [4] defines green finance as the action of financing investments that offer environmental benefits. This initiative is mainly aimed at financing renewable energy projects which contribute to climate change, the latter being one of the many components that are known as “green philosophy” or “inclusive sustainability” which, in current times, contribute to environmental changes [5].
In contrast with the aforementioned reference, we can highlight another study on green finance, developed by Yoshino et al. [6], which analyzes the reduction of global investments in renewable energy and energy efficiency, becoming a threat to the much-desired expansion of investments in green finance which contribute to guaranteeing energy security, allowing compliance with the objectives of climate change and greenhouse gas emissions. These scholars [6] explain that financial institutions generally pay more attention to fossil fuel projects than green projects, mainly due to risks that prevail among green technologies, in addition to providing a relatively lower rate of return. In summary, the rise of green finance and climate finance are directly and indirectly related to some sustainable developments.
The capital market world, in its eagerness to innovate, has tried to harmonize financial markets and sustainable economic projects. This is how the so-called green bonds were born. Those bonds arose from the need of a group of Swedish pension funds whose desire was to invest in projects aimed at caring for and conserving the climate, thus deciding to contact the World Bank in 2007. Thus, after one year, they issue the first green bond, thus establishing a bridge between climate projects and investor financing [7].
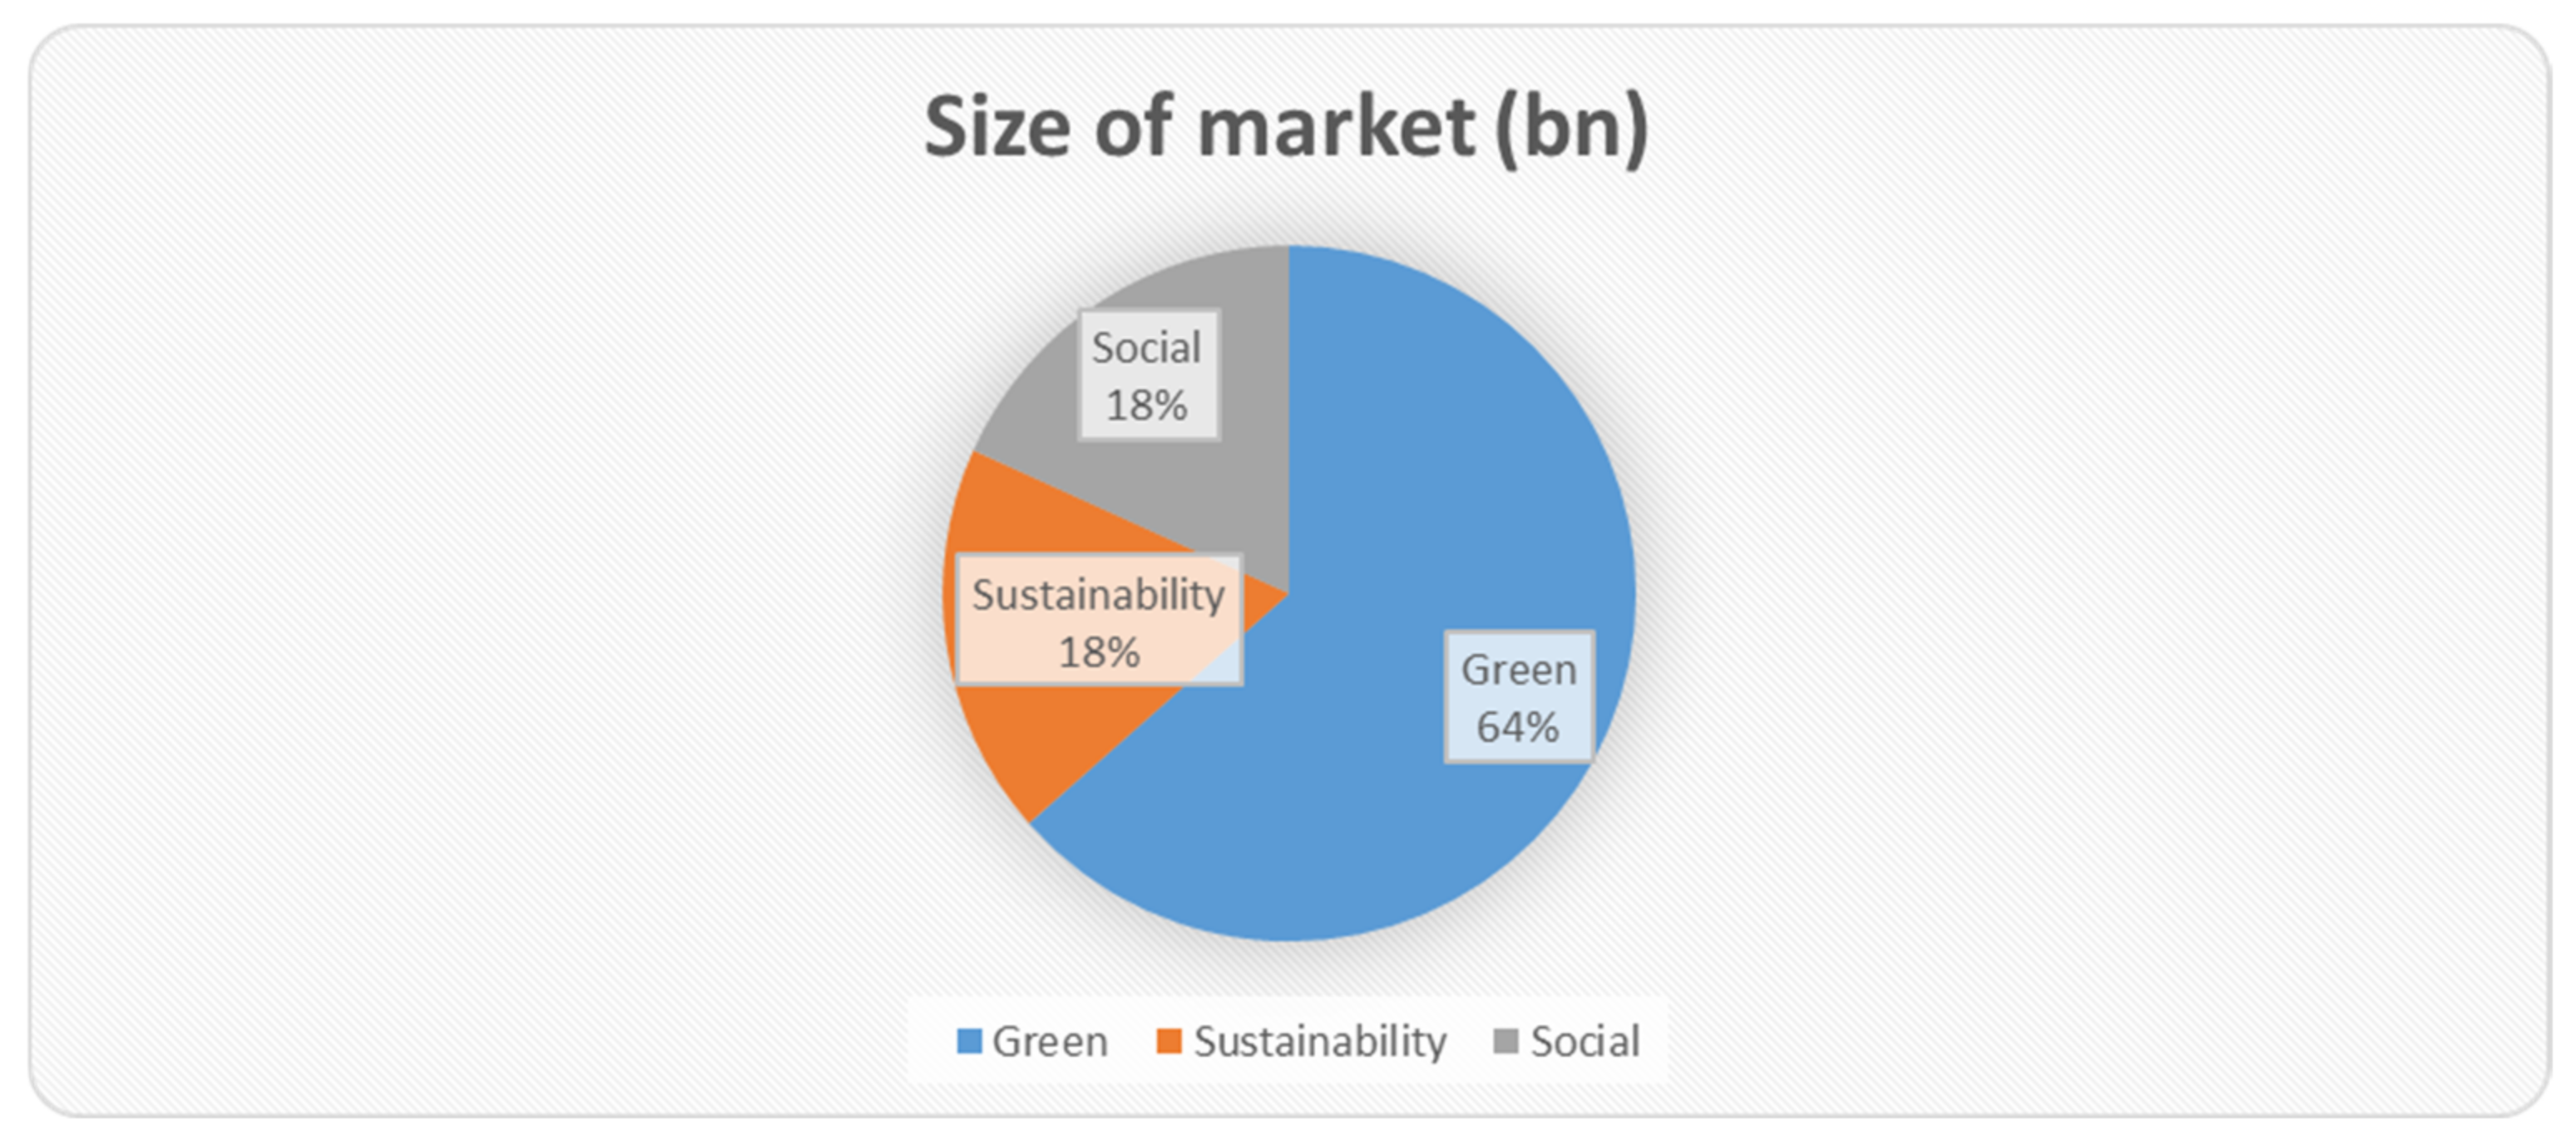
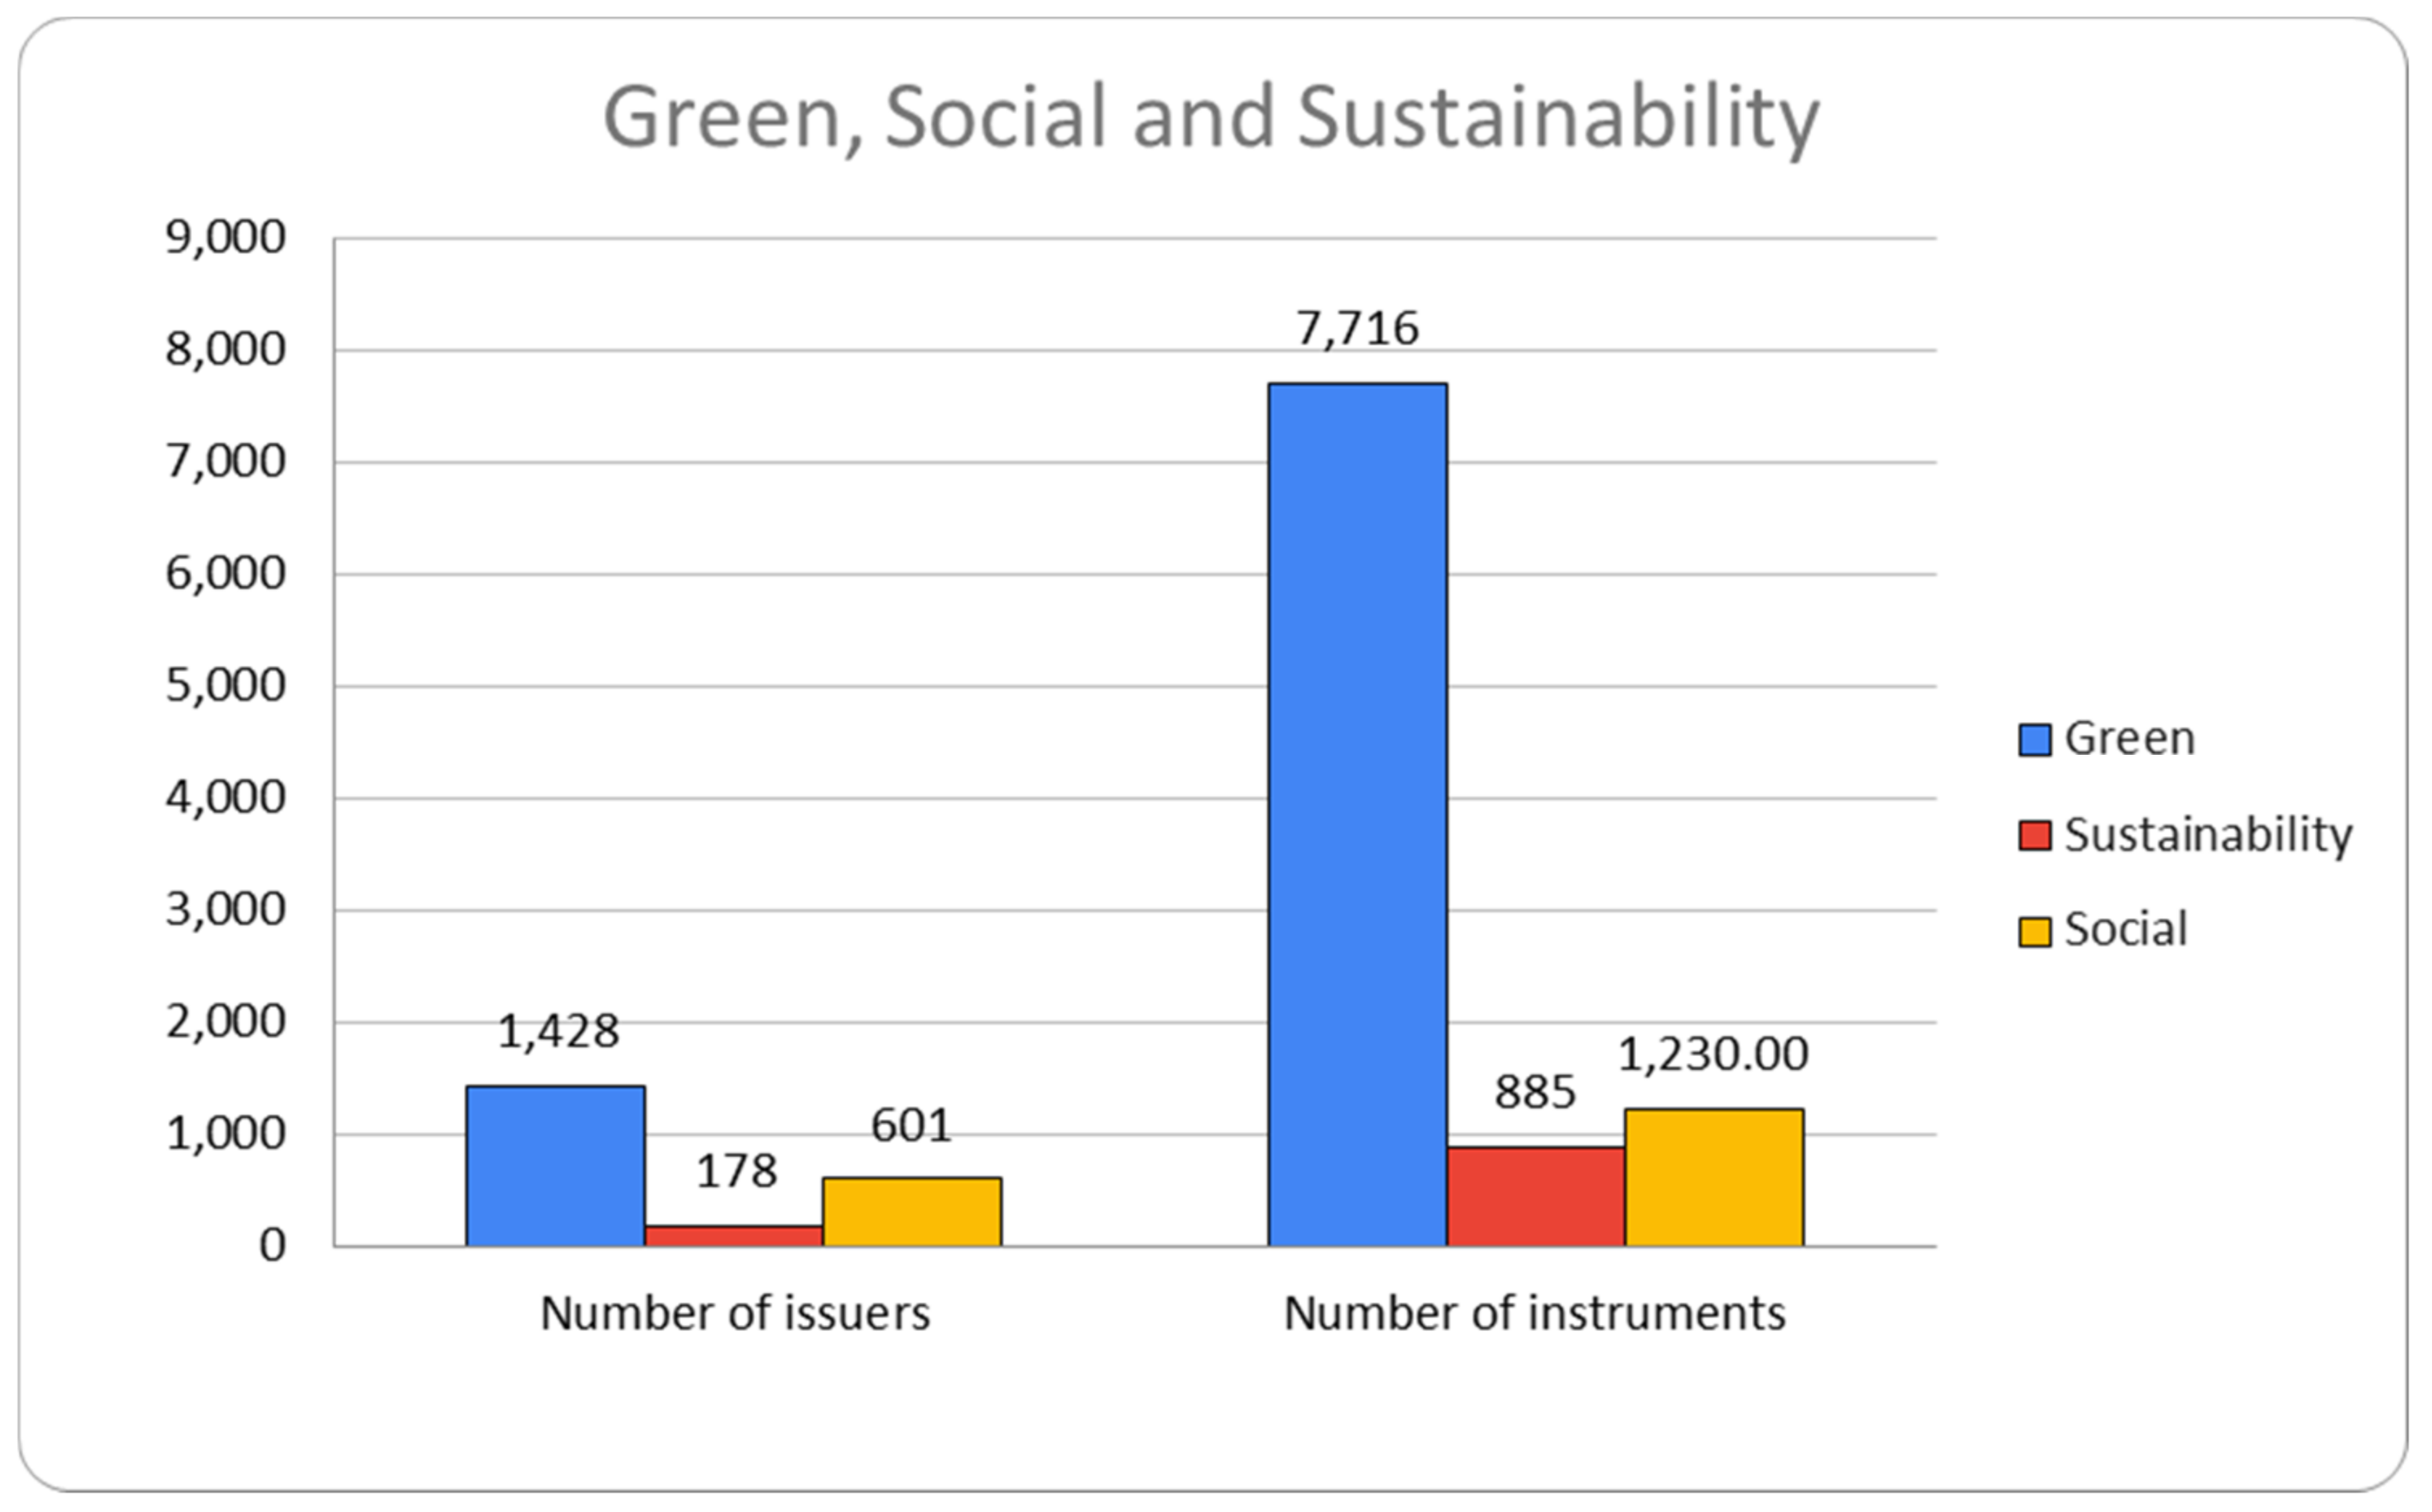
Green bonds, also called climate bonds or sustainable bonds, are supposed the beginning of the paradigm shift, by including in the financial market the investment in liquid fixed income assets with, moreover, the characteristic of attracting investors with a social awareness, who wish to bet on green projects. Consequently, according to the Climate Bonds Initiative [8], whose reports repeatedly show the figures of the behavior of these bonds around the world, these bonds have been classified into three categories: green, social, and sustainability, denoted by the acronym GSS in English.
However, this paper focuses on Latin American and the Caribbean (hereinafter, LAC) countries and it is intended to analyze the participation of the fourteen countries which, until 2020 framed in the program implemented by the UN and with the objectives of sustainability, have decided to participate in the capital market with the issuance of GSS bonds. In this context, the evolution of issuances since their inception and the impact on growth in their economies will be reviewed, as well as the limitations that this region exhibits and the possible differences between sustainable and unsustainable bonds.
This paper is structured as follows: after the Introduction, Section 2 presents a review of the presence of GSS bonds worldwide and in the LAC region, by conducting, in Section 3, the literature review of the research on the relation between the issuances of GSS bonds and the economic growth of issuers. On the other hand, Section 4 sets out the methodology, the data, and the variables which are necessary to analyze this topic from an empirical point of view. As a consequence, Section 5 presents the results of the multiple linear regression applied in the former section. Finally, the discussion and conclusions are presented in Section 6 with the proposal of a future research agenda.

2. Green, Social, and Sustainability Bonds

2.1. Global GSS Bond Issuances

The issuance of sustainable bonds was a response to the existence of polluting nations, thus giving rise for more than a decade to the commitment to ecological projects through the acquisition of sustainable bonds. Specifically, the global green bond market had its beginnings in 2007 when multilateral development banks raised funds for projects aimed to safeguard the climate. The first to enter this market, creating specific lists of green bonds, were the Scandinavian Stock Exchange and the London Stock Exchange, whilst the first green-type operation took place in Luxembourg with the European Investment Bank (EIB) [9].
The World Bank set down the foundations of green bonds in a work coordinated by the International Association of Capital Markets (ICMA) [10], also highlighting the social value of such bonds and their transparency. With all this, the World Bank issued the first green bond in 2008, linking the need for financing by investors with those projects seeking to protect the climate [7].
Since 2008, bond issuances have increased rapidly in size and coverage. The total amount of this market reached more than USD 550 billion in 2019. Figure 2 [11] shows the cumulative amounts of issuances in Europe and the LAC region. According to the Climate Bonds Initiative [12], until 2020 the issue of GSS bonds is supposed to be USD 700,000 million, almost twice as much as in 2019 (USD 358,000 million). Likewise, according to the Climate Bonds Initiative [12,13], the sustainable bond market, at the end of 2020, reached USD 1.7 trillion, and almost 10,000 instruments were issued under the denomination GSS bonds since 2007. Figure 3 shows the size of the market according to the type of bonds and Figure 4 shows the numbers of issuers and instruments during 2020.

2.2. GSS Bond Issuances in the LAC Region

In the LAC region, GSS bonds are a financial instrument with great potential given the increasing need for financing for the management of forests and hydrographic basins, and for infrastructures. This allows facing the damages caused by the climate change, by also increasing its transparency to attract investors [15,16].
In 2014, the first GSS bond issue was launched by Peru and, by 2020, there were twelve countries in this region issuing those bonds: Barbados, Mexico, Colombia, Ecuador, Peru, Chile, Argentina, Brazil, Panamá, Guatemala, Uruguay, and Costa Rica. Table 1 shows the cumulative amounts issued by these countries until December 2020.
Chile is the dominant country in the LAC region, representing 31.86% of total regional issuances, followed by Brazil with 28.37% and México with 16.69%. In the subsequent positions, we can find Peru, Argentina, Costa Rica, Colombia, and Uruguay, with participation between 2.76% and 0.90%. The other three countries have a share of less than 1% (Figure 5). According to the number of issued bonds, the distribution is more fragmented; however, Brazil (37%), Chile (10%), and México (12%) keep the first places in the rank of the LAC countries.
Figure 6 shows the use of the funds coming from GSS bonds, by type of project, highlighting the relevance of renewable energies (44%), followed by those projects destined for the use of land and transportation. Renewable energies, as well as sustainable construction and transport projects, are the ones that make the most use of the resources obtained by the bonds at an international level.
Sustainable bonds in the LAC region have increased by 60% until June 2021. In spite of the impact of the COVID-19 pandemic, the LAC sustainable debt market continued to soar throughout 2020 and 2021. Thus, the total GSS issuance amounted to 16.3 bn in 2020. Table 2 shows the amount of GSS debt issued (in USD bn), number of issuers, and number of instruments.
As formerly indicated, in the LAC area there are some countries that have made significant progress in relation to others such as Chile, Brazil, and Mexico, which have carried out projects aiming at sustainable development programs and its outlined objectives. However, there are other countries presenting certain drawbacks, called barriers. We can highlight (a) lack of knowledge and capacity development, (b) difficulties in identifying and creating green portfolios, and (c) lack of standardized monitoring mechanisms. Table 3 shows the barriers and progress made in the issuance of GSS bonds in the LAC countries.
As a solution to the expansion of the GSS bonds market in the LAC region, the management of development banks is required, through the structuring and evaluation of the projects to which the resources obtained by GSS bonds are going to be assigned, with the respective certifications, impact evaluations, and other types of internal and external reports [18,19,20]. Figure 7 shows the progress percentages of green financing with the management of development banks in the countries of the LAC region. It should be noted that, since 2016, the IDB group has given its support, strengthening the green capital market in the region and supporting more than 30% of issuances in terms of volume. Among some countries, we can cite Chile, México, and Ecuador.

3. Literature Review

This section is devoted to the review of existing academic articles and reports in the study of the green bonus premium for investing in these types of securities, known as “greenium”, taking different approaches and perspectives. Moreover, we will analyze the presence of a premium in the issuance of green bonds in Latin America as an alternative to meet the UN objectives for the year 2030.

3.1. Premium on Issuance of Green Bonds vs. Traditional Bonds

Sixteen academic articles have been selected related to the presence of a premium in the issuance of green bonds as an incentive for investors supporting the expansion of the green bond market. Thirteen works correspond to developed countries and three to green capital markets in Latin America: the first case for Chile; the second study for Chile, Mexico, Colombia, and Brazil; the third study is focused on Ecuador. The summary is shown in Table 4.
From the literature selected for the analysis of the capital market’s reaction to the issuance of sustainable bonds, responses more positive than pessimistic could be obtained. This is due to the expectations and awareness of investors to place their resources, preferentially, in environmental projects vs. unsustainable bonds. These studies have focused on the green and traditional capital markets in different regions of the world.
Among the global studies, we can highlight the paper by Wang et al. [21] on the Chinese green bond market, showing favorable returns on green bond issues. However, Lebelle et al. [22] in their study of a sample of 475 green bonds issued by 145 companies in the US, Europe, and Asia, determined, among their conclusions, that in developed markets the reaction is more negative to the issuance of green bonds.
Gianfrate and Peri [23], for the European region, focus their study on determining whether green bonds represent one of the key instruments to mobilize financial resources and, by analyzing 121 green bonds issued in this region, state that green bonds are more convenient from a financial point of view than traditional bonds. Fatin [24] identifies the countries that have contributed to the ranking of USD 200 billion of green bonds in the world and the use of funds, obtaining that energy represents 33%; followed by the drop in coal in construction 29%; low-carbon transport 20%, water 9%; waste and land use, 3% each.
In the case of the US, there are also studies comparing green with traditional bonds in terms of their yields and rates. In this sense, we can highlight the work carried out by Baker et al. [25] for the US corporate and municipal green bond markets, by selecting 2083 green municipal bonds issued between 2010 and 2016, and 19 US green corporate bonds issued between 2014 and 2016, obtaining as a result that green bonds are, in fact, issued at a premium, underperforming by several basis points. This work is complemented by Karpf and Mandel [26] where the yield curves, the solvency of the issuer, and the rates of the green and traditional US Treasury bonds are compared in the municipal bond market of the US, by concluding that traditional bond yields are higher on average and that green bonds trade at lower prices and higher yields in the markets.
Banga [27] takes a sample of ten developed countries that use green bonds as innovative financial instruments, confirming that they provide an opportunity to direct private finance towards low-carbon investments. In general, throughout the literature review, it can be pointed out that this new asset class also offers attractive risk-return profiles compared to conventional (non-green) bonds [28].
On the other hand, when examining the price difference between green bonds and conventional bonds in capital markets around the world, Nanayakkara et al. [29] select a sample of 82 green bonds and 43 corporate bonds, obtaining a result that the market can trade a green bond with a premium as it provides a lower-risk investment opportunity for investors. Furthermore, it was found that green bonds trade at a premium on the global capital market. This indicates the attractiveness of these bonds to investors.
Tolliver et al. [30] suggest a small negative premium as the yield of a green bond is lower than that of a traditional bond, by concluding that, on average, the premium is −2 basis points for the entire analyzed sample. In relation to this, MacAskill et al. [31] analyze the possible existence of the green premium in the primary and secondary markets by conducting a literature review of works published between 2007 and 2019, selecting 16 out of a total of 96, and inferring that some investors are willing to pay a higher price for green bonds and, therefore, to accept a lower return.
Zerbib [32] seeks to estimate the differential yield between a green bond and a hypothetical conventional bond, from July 2013 to December 2017, by choosing 1065 green bonds complying with the Green Bond principles indexed by Bloomberg on 31 December 2017. The results suggest a small negative premium: The yield of a green bond is lower than that of a conventional bond. This complements the result by Gianfrate and Peri [23] who analyzed whether green bonds have a significant impact on bond prices and whether the negative premiums of green bonds issued by corporations are or are not more convenient, ceteris paribus, than conventional bonds. In this way, they found that green bonds are more financially desirable than non-green ones. The advantage is greatest for corporate issuers and persists in the secondary market.
Additionally, Zerbib [32] compared the yield spreads between 1065 green and conventional bonds by concluding the low impact of investors’ environmental preferences on bond prices, which is not, at this stage, a disincentive for investors to support the expansion of the green bond market. Therefore, the answer to whether there is positive evidence of green premium can be corroborated by the study of Cheong and Choi [33] which provides a review of articles about the market prices of green bonds, the economic and environmental effects of financing green bonds, and the legal and institutional problems in the green bond market, being able to conclude that more studies report positive evidence for the so-called greenium.
Finally, Dan and Tiron-Tudor [34] examine the determinants of the green bonds issuances in the context of the European Union countries. To do this, they explore the impact of some environmental, social, governance, and macroeconomic indicators on the level of green bond issues in the period 2014–2019. More specifically, rating, ESG index, fiscal balance, inflation rate, and population significantly affect the volume of green bond issuances.

3.2. Premium on Issuance of GSS Bonds in the LAC Region

Relating to the analysis of the financial profitability of green bonds compared to ordinary bonds in Latin America, Uribe [35] selected 4448 green and ordinary bonds issued in Brazil, Colombia, Chile, and Mexico between 2014 and 2019, finding a negative premium derived from the high demand in a market with limited supply. In addition, the lack of tax incentives and high issuance and certification costs were evidenced. In the same context, Durán and Morales [36] analyzed the offered rate of corporate, green, social, and traditional bonds in Chile, and evaluated whether there are differences between the explanatory variables for each type of bond, taking the sixteen corporate bonds issued by this country, of which eight correspond to green bonds and eight correspond to conventional bonds with similar characteristics, by obtaining that the Chilean market values the profitability requirement in a different way according to the type of bond, green or conventional.
Regarding the Ecuadorian green bond market, there is a study carried out by Torres [37] whose objective was to analyze the interest of a financing alternative for private companies in Quito, based on the topic of green bonds as the new stock product of the Quito Stock Exchange, which began in 2018. In the study, the companies indicated that 98.7% required financing and that 63.2% entered the stock market. In addition, 83.6% traded fixed income securities such as bonds, capital debentures, negotiable commercial invoices, commercial paper, among others, and 16.4% in equity participation securities. This study also shows that 88.2% of companies were interested in learning more about green bonds as an option for financing and that 60.5% were interested in establishing, among their strategic plans, the development of a sustainable project for the environment. Another point reported is that the coupon rate offered by Ecuadorian companies when issuing green bonds is located in the range of 6.1% to 8% as long as there are tax incentives. In this way, for the same period, the weighted average rate in debt securities was 8.65% [38,39,40].

4. Materials and Methods

4.1. Methodology and Data

Recall that the main objective of this paper is to find a relationship between the economic growth of the countries included in the LAC region and their corresponding volumes of sustainable bond issuances. The main problem for this analysis is the scarcity of available data because all issuances take place during the period from 2014 to 2020. Table 5 shows the amounts issued in USD (millions) per country and per year. Observe that the first issuance was made in 2014 by Peru. Some comments on these data follow. Until 2020, Chile, Brazil, and Mexico continue ranking the first, second, and third place, respectively. Moreover, a growth of 414% is performed in 2015 compared to 2014, and a decrease is detected in 2017 and 2018 with respect to their previous years.
Figure 8 shows the growth of bond issuances with respect to the previous year.
On the other hand, Table 6 shows the average economic growth of the countries which issue sustainable bonds, and the amount in USD (millions) for each year for the period 2014–2020. A first approach to the regression between economic growth and the amounts of issued sustainable bonds gives a coefficient of determination (R2) equal to 0.6026, which means that 60.3% of the variability of economic growth is explained by the number of sustainable bond issuances. Additionally, the coefficient of correlation (r) equals −0.7763, which indicated a strong inverse relationship between both variables for the period 2014–2019. Observe that 2020, despite registering the highest number of issues in the LAC region, has not been considered in the regression because it was an atypical year with an economic slowdown due to the pandemic.
Data on green bond issues were obtained from the reports issued by ECLAC Washington Office, Climate Bonds Initiative and Latin Finance, CEPAL, World Bank, central banks of the countries under review, and stock exchanges. These data were used as an approximation of the total capitalization of the sustainable bond market in the region. It is necessary to emphasize that, technically, there is no universal definition of what constitutes a green bond. For this reason, many of the unlabeled but environmentally oriented green bonds are issued without strict adherence to the green bond principles or CBI certification standard. Therefore, this analysis, after having reviewed the reports and the sources aforementioned, has considered the compilation of all the bonds that meet the objective of sustainability and care for the environment issued in the eleven countries. In general, the data source for the elaboration of this table is the World Bank, the World Federation of Stock Exchanges, Bloomberg, and the stock exchanges of each country [44,45,46].
Thus, in order to provide a richer econometric analysis, we are going to be based on the Sustainable Banking Network (SBN) and the 2019 report of the International Finance Corporation (IFC) which claim that the main determinants for the growth potential of the green bond market in issuing countries of LAC are: (a) development of green bonds, (b) development of the capital market, and (c) development of corporate governance. Likewise, it establishes that the degree of maturity with respect to the potential of each determinant is measured on a scale from 0 to 5 for each country, with 5 being the highest value in relative terms (Table 7).

4.2. Variables

In our analysis, we hypothesize that the economic growth of the countries in the LAC region is related to the volume of issuances of green bonds. To test this hypothesis, we are going to apply multiple linear regression. Therefore, we have to test the following contrast:
H 0 : Y = β 0 H 1 : Y = k = 1 n β k X k + ε
where ε is the error term, by considering the following variables:
  • X1: “Green Bond Issuance/Total Bond Issuance”, defined as the percentage of issuance of green bonds with respect to the total issuance during the period 2016–2019;
  • X2: “Sovereign Green Issuance: Total Planned”;
  • X3: “Private Credit/GDP”, defined as the ratio of financial resources provided to the private sector by financial institutions;
  • X4: “Market Capitalization” (in USD billion);
  • X5: “Political Risk Rating”;
  • X6: “Regulatory Quality”;
  • X7: “Rule of Law Index”, which is a quantitative assessment of the extent to which countries are adhered to the rule of law and can be interpreted as the degree of compliance of a legal system;
  • Y: “Economic Growth”.
A summary of the just-defined variables, divided into explanatory and explained, can be seen in Table 8.
The values of Y have been deduced from the figures of the GDP corresponding to the years 2018 and 2019 (see Table 9).

5. Results

The symmetric matrix in Table 10 shows the correlations between the explained and explaining variables used in our model.
The correlation matrix shows some multicollinearity problems (e.g., X1 and X6 are highly correlated with X7). So, after five iterations where non-significant coefficients have been removed, the results of the regression are shown in Table 11.
The coefficient of determination R2 equals 0.6148 which means that the predictors (Xk) explain 61.5% of the variance of Y. On the other hand, the adjusted R2 equals 0.4993. Finally, the coefficient of multiple correlation equals 0.7841. It means that there is a strong direct relationship between the predicted data ( Y ^ ) and the observed data (Y). With respect to the goodness of fit, F(3,10) = 5.3205 and p-value = 0.0189. Since p-value < 0.05, we reject the null hypothesis. So, the linear regression model Y = k = 1 n β k X k provides a better fit than the model without the independent variables (Y = β0).
Concerning the validation of this model, linear regression assumes normality for residual errors. The Shapiro–Wilk p-value equals 0.3076 whereby the data is normally distributed. On the other hand, the White test p-value equals 0.2609 (F = 1.5218) and so the variance is homogeneous. Finally, there is no multicollinearity concern as all the VIF values are smaller than 2.5.

6. Discussion and Conclusions

The objective of this paper has been to analyze the influence of the issuances of GSS bonds on the economic growth of countries belonging to the so-called LAC region. To do this, we have used two variables: the ratio “Green Bond Issuance/Total Bond Issuance” and the “Sovereign Green Issuance: Total Planned”. Moreover, in order to enrich the statistical treatment of data (through the techniques of multiple linear regression), we have considered two additional variables related to the status of the involved capital markets (the ratio “Private Credit/GDP” and the “Market Capitalization”) and other three variables concerning the governance of these countries (“Political Risk Rating”, “Regulatory Quality”, and “Rule of Law Index”).
The results of the regression exhibit that three variables (one of each group of the chosen variables) significantly affect the economic growth of the LAC region (measured by the percent variation of the GDP). The first variable (Sovereign Green Issuance: Total Planned) is positively correlated with the explained variable which is logical taking into account that the issuance of GSS bonds shows a greater level of maturity of the corresponding economies. As expected, the second variable (Private Credit/GDP) also is positively correlated with economic growth since it is well known that private credits have a multiplier effect on GDP evolution. Finally, the third significant variable (Rule of Law Index) is negatively correlated with the economic growth as the fulfillment of legal rules increases the equity against the economic efficiency.
Data have been extracted from the Sustainable Banking Network (SBN) and the 2019 report of the International Finance Corporation (IFC) which provides the determinants of the potential growth of GSS bond markets in all countries (specifically in the LAC region) and their corresponding scores. Moreover, we have chosen the year 2019 in order to analyze the economic growth in the period 2018–2019, because the GDP in 2020 was completely anomalous due to the COVID-19 pandemic.
Analogously, Chuch et al. [49] studied the green bond market in Vietnam which is improving risk-return profiles in order to expand GSS bond policies in emerging nations. Additionally, Tolliver et al. [30] and Ning et al. [50] provided a richer econometric analysis of the relationship between sustainable green financing, energy efficiency investment, and economic growth. The presence of an efficient monetary policy and a controlled inflation rate is necessary for sustainable expansion of the GSS market in LAC and LAC’s political stability is the most important political factor. Societal concern for the environment is not an important factor compared with financial and infrastructural criteria to expand the green bond market in LAC. Regarding policy, improving financial issues related to the green bond market is recommended.
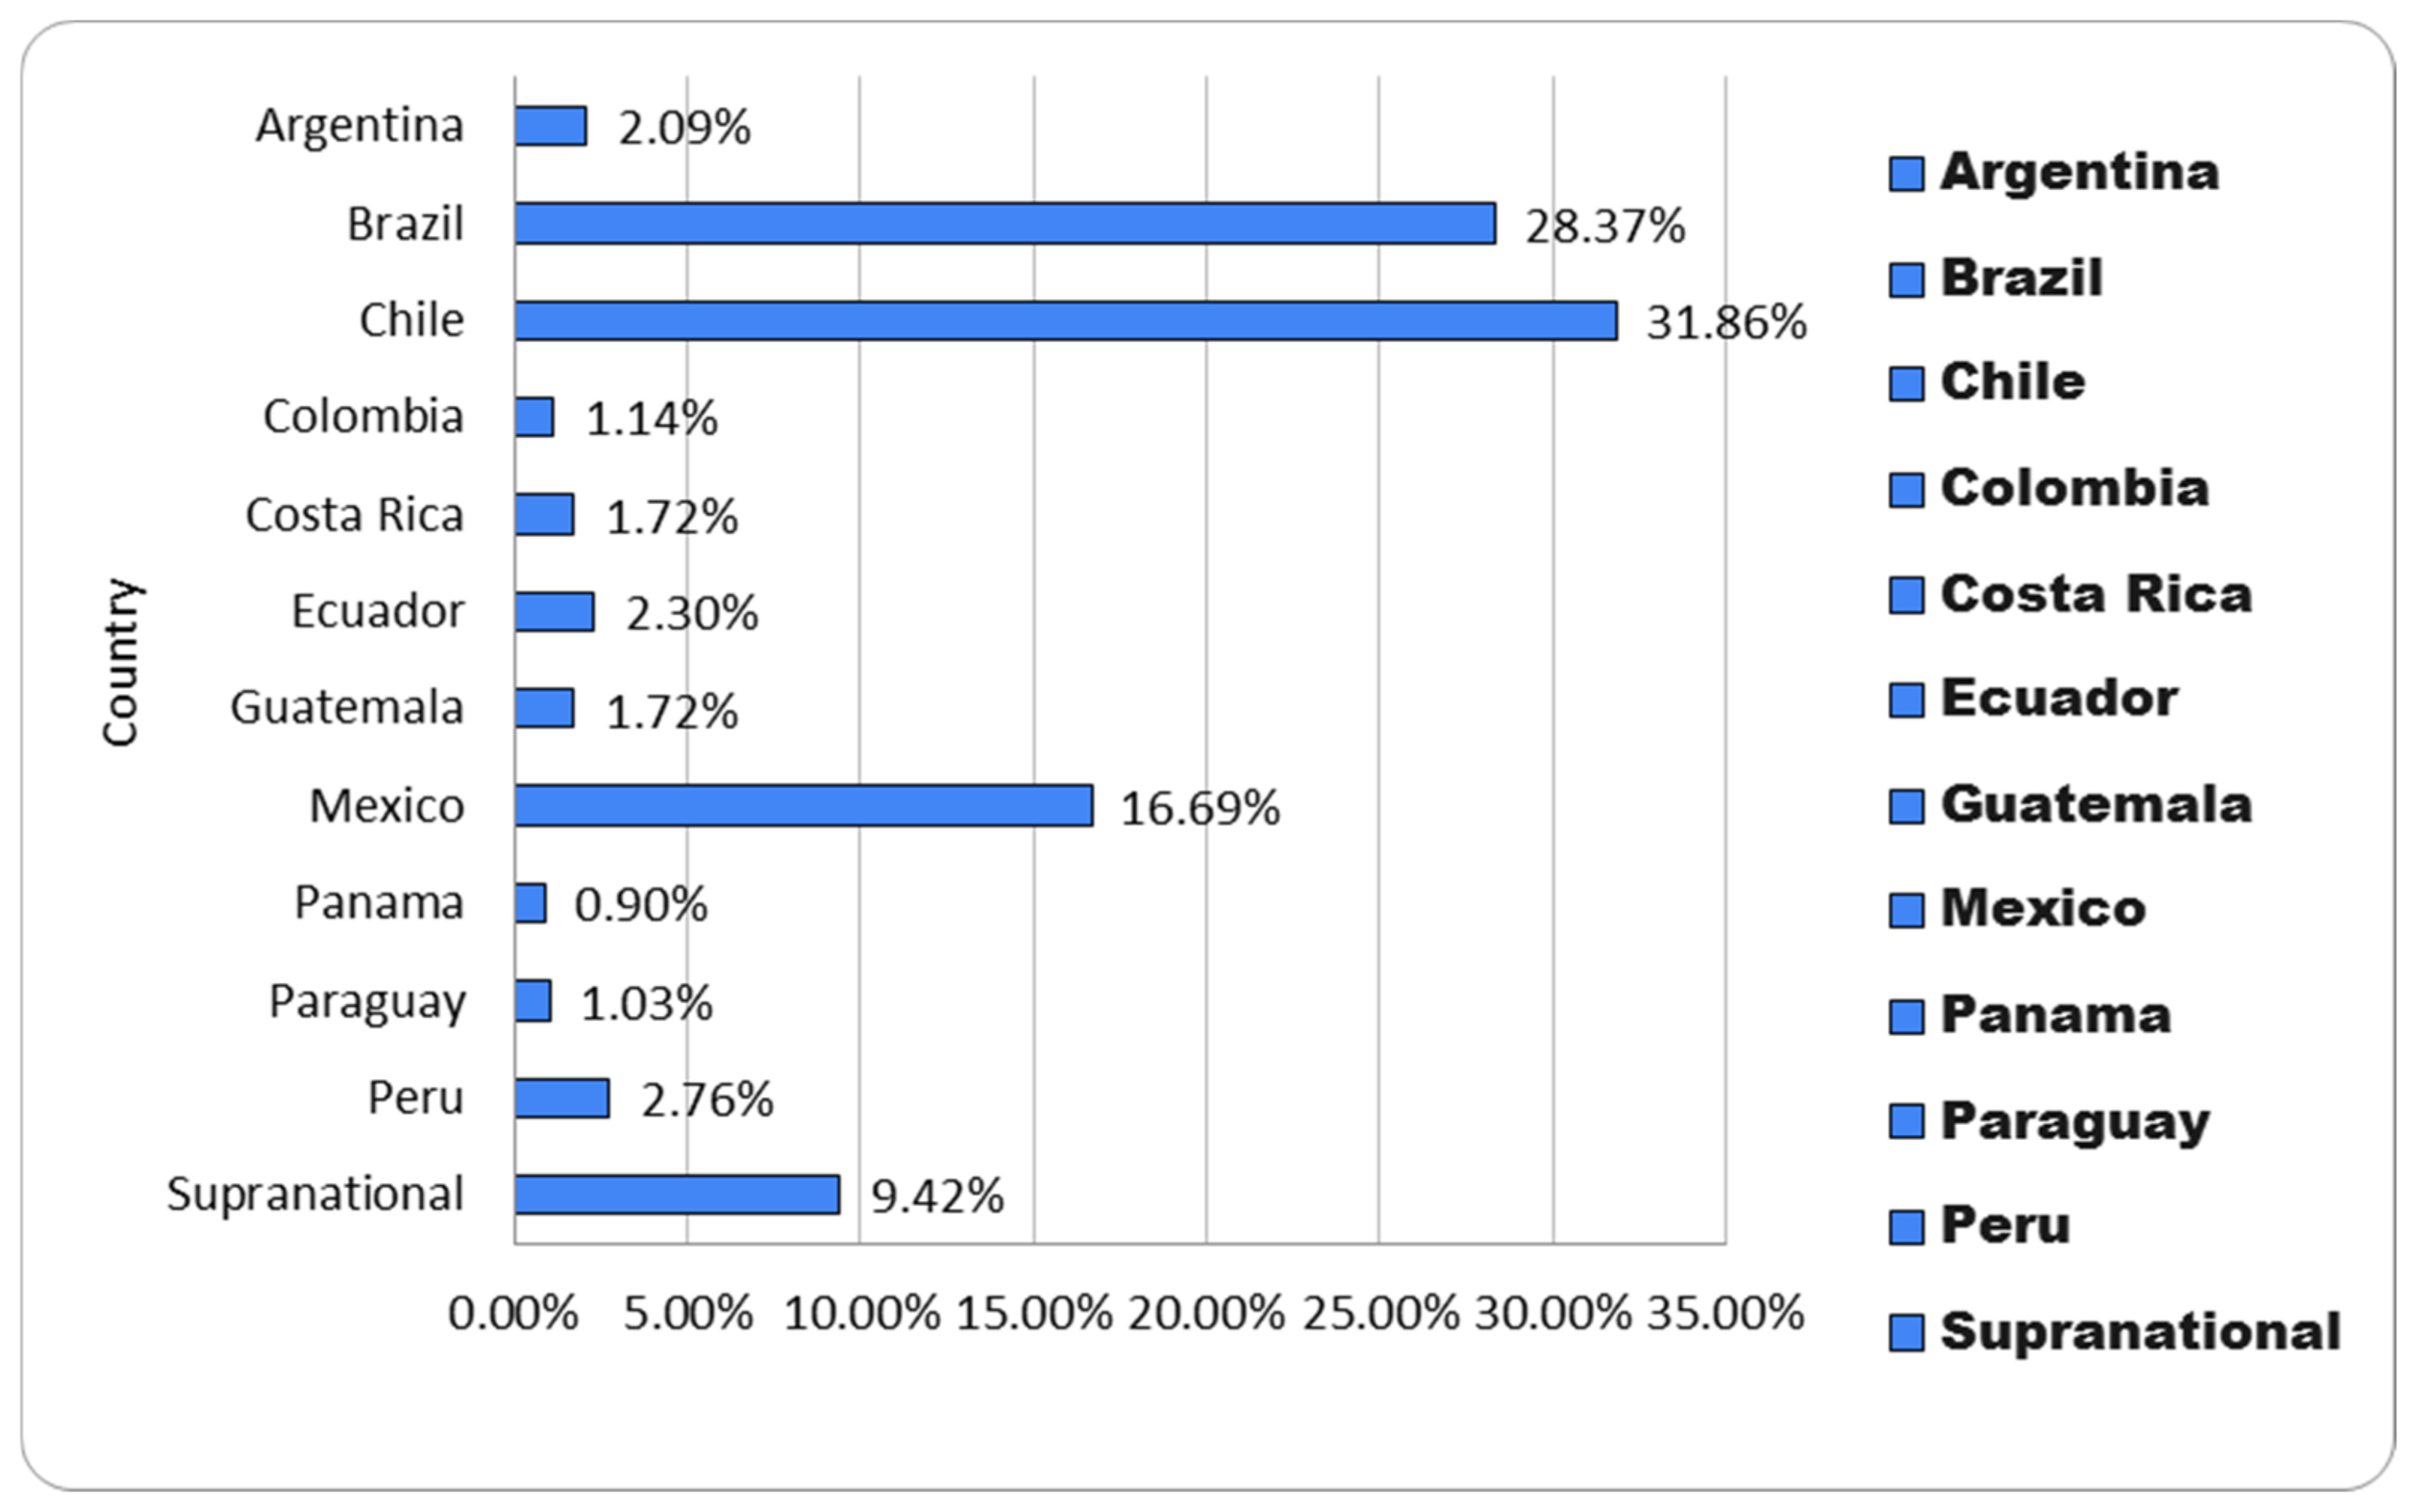
Some scholars have analyzed, until 2020, the factors which determine financing with green bonds in the LAC region and have determined that there is a correspondence between the countries with the highest issuances and the main capital markets of the region. This suggests that the necessary leverage from green bond markets is robust and moderately present in debt markets. However, there is a highly concentrated market and still incipient in the LAC region since almost 80% of accumulated issuances are concentrated in three countries: Brazil, Chile, and Mexico [13,51].
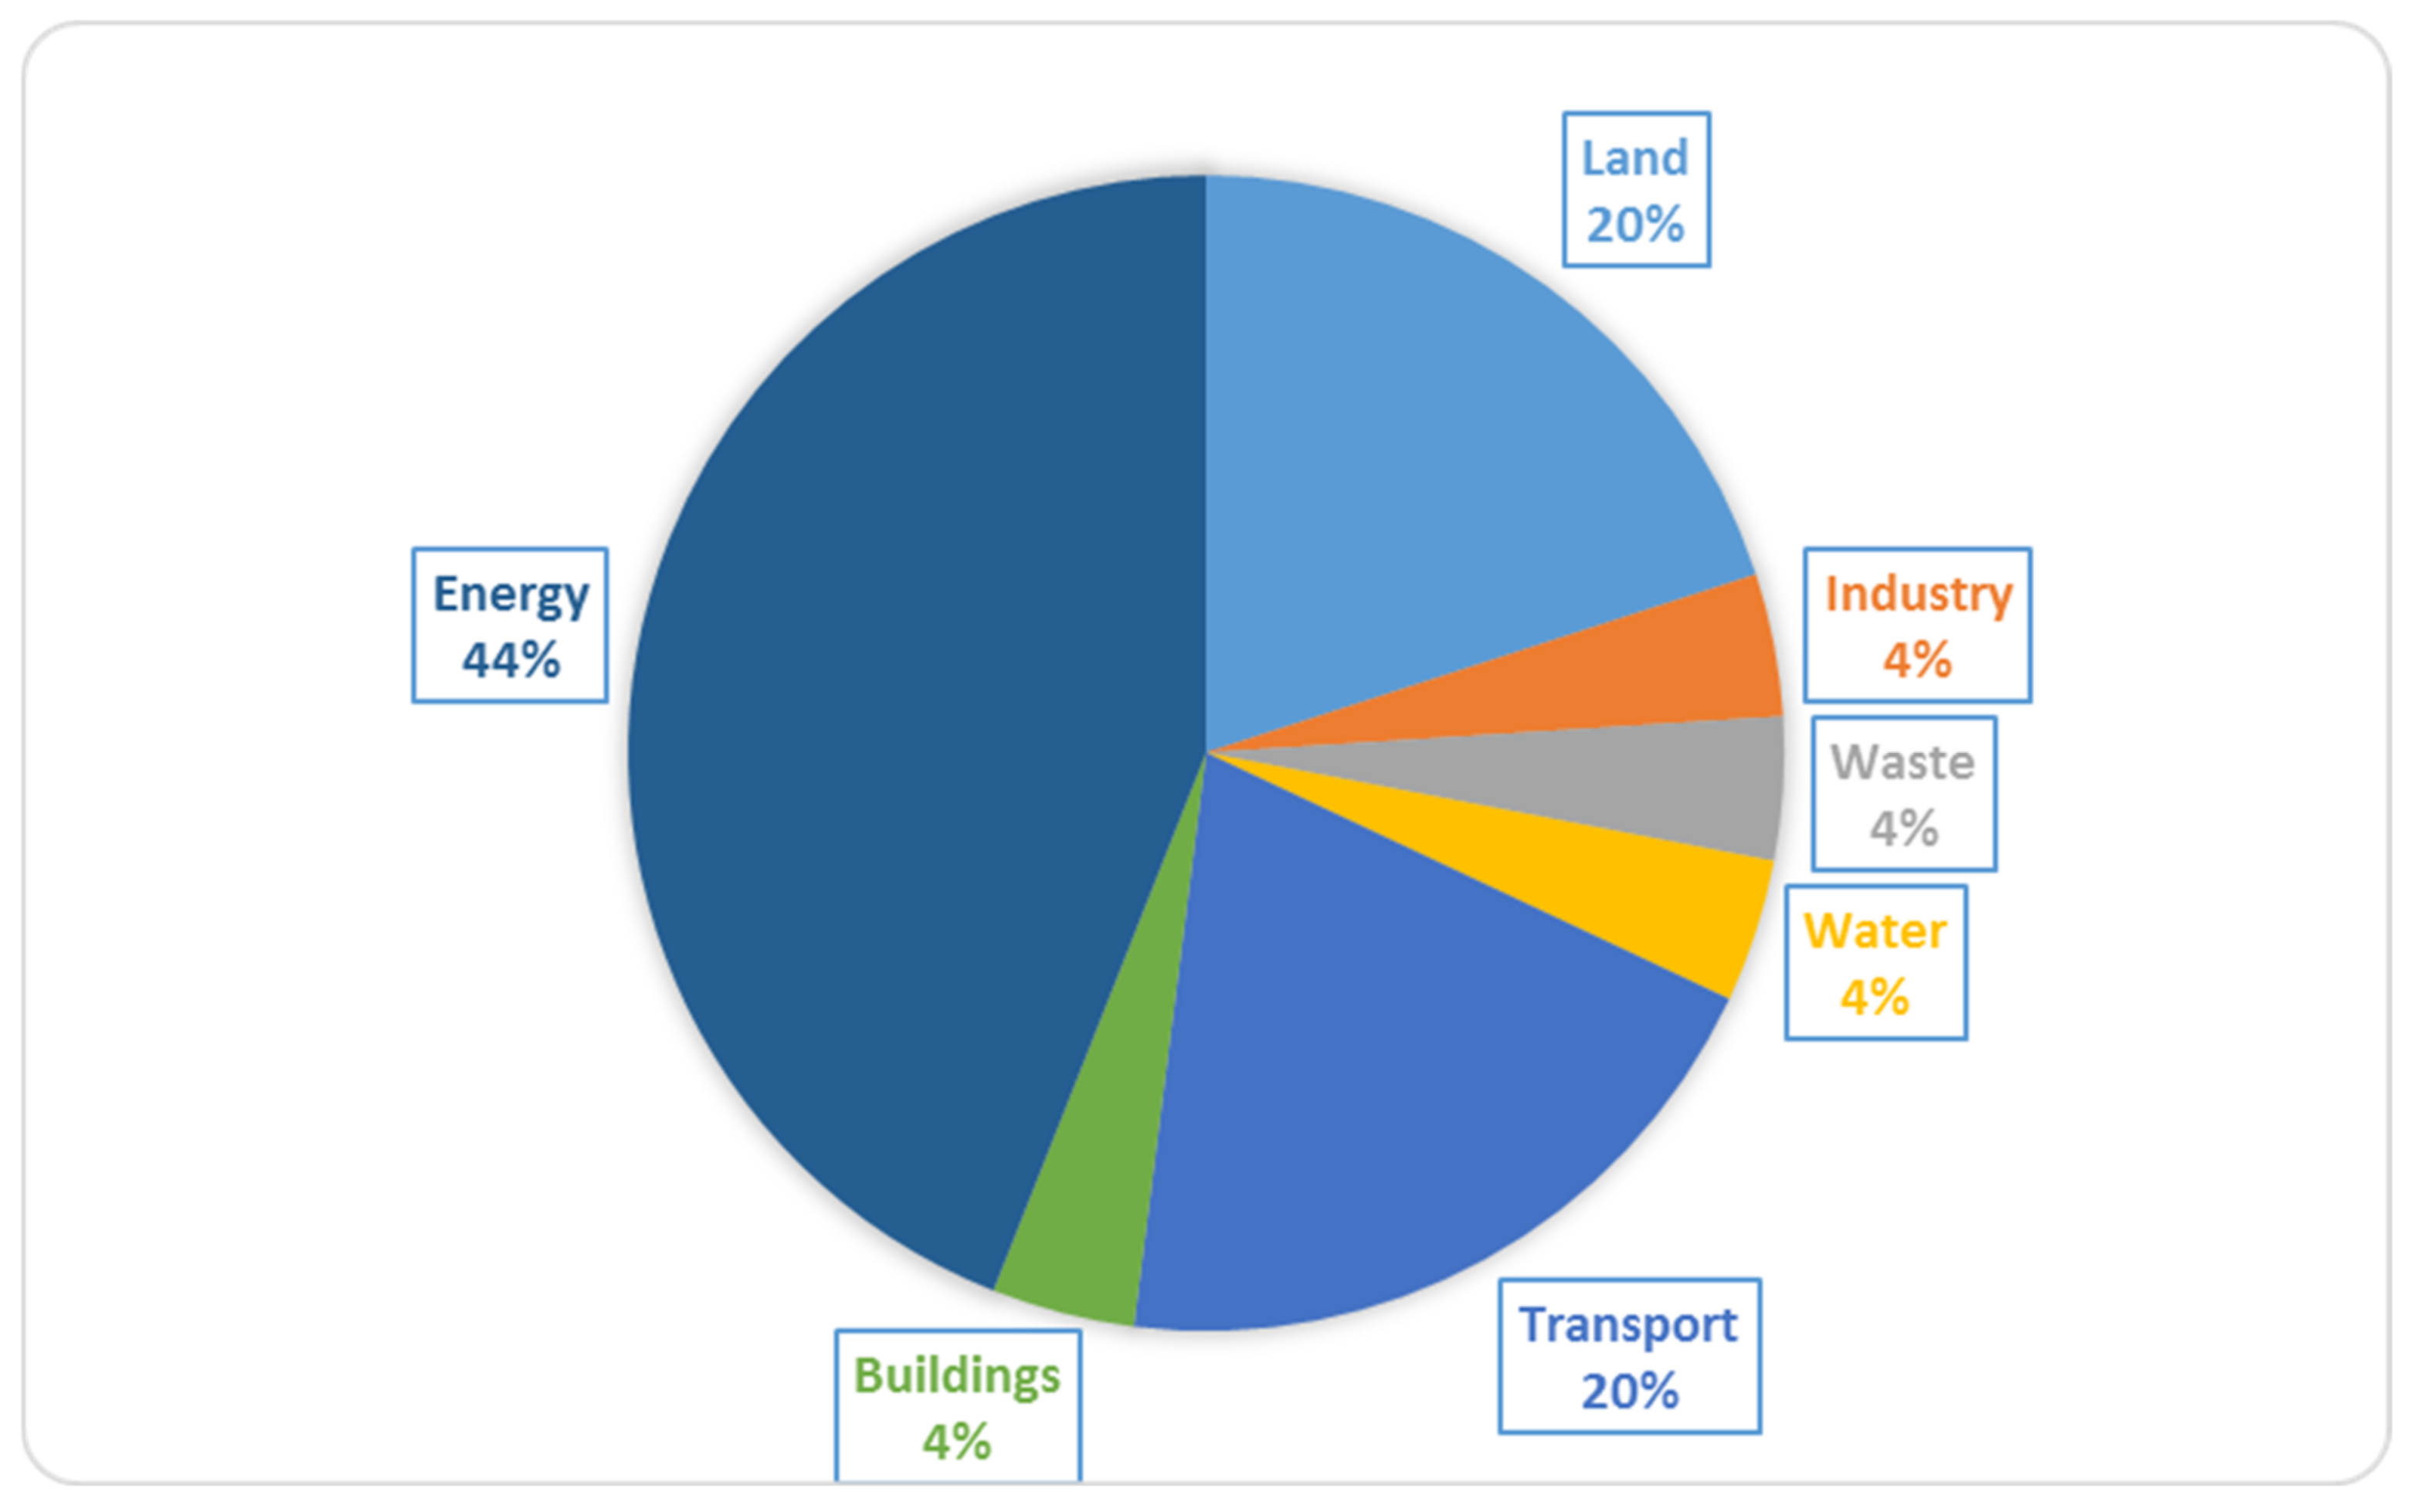
Consequently, in the analysis of the green infrastructure investment opportunities, in 2019 Brazil has estimated USD 1.3 tn green investment potential for energy, transport, buildings, waste, and industrial energy efficiency [52]. This matches our analysis that the economy grows in the countries of the LAC region because the green infrastructure has positive environmental and economic benefits. This can create prosperity by increasing competitiveness, productivity, and employment opportunities; by extending the reach, reliability, and efficiency of the national electricity grid, without creating air pollution; by broadening the economic base; by creating new markets, and by providing inclusion and connectivity across Brazil’s vast landmass [53].
On the other hand, economic growth is mainly driven by savings and investments but is also determined by population growth, change in the availability of natural resources, and technological change. The study of several countries in the world, including Brazil, shows that there is an enhanced GDP growth in every region but most pronounced in the European Union, followed by India, Japan, and China. Interestingly, the impact is less in the United States and Russia with a GDP only reaching about 1% above BAU (Business as Usual) in 2030, whereas European Union, India, and China raise their GDP by about 2–3% [50,54]. On the contrary, Brazil has been included in our study where we have shown that the economic growth of the countries (measured by the variation of the GDP) in the LAC region is related to the volume of issuances of green bonds, based on the Sustainable Banking Network (SBN).
The potential issuance of green bonds varies among emerging market countries and, although each economy has specific factors leading to the development of a green bond market, the factors that indicate the potential of its growth are: (a) promoting the issuance of green bonds, (b) establishing sustainable financing policies and frameworks, (c) capital market development, and (d) political stability and governance.
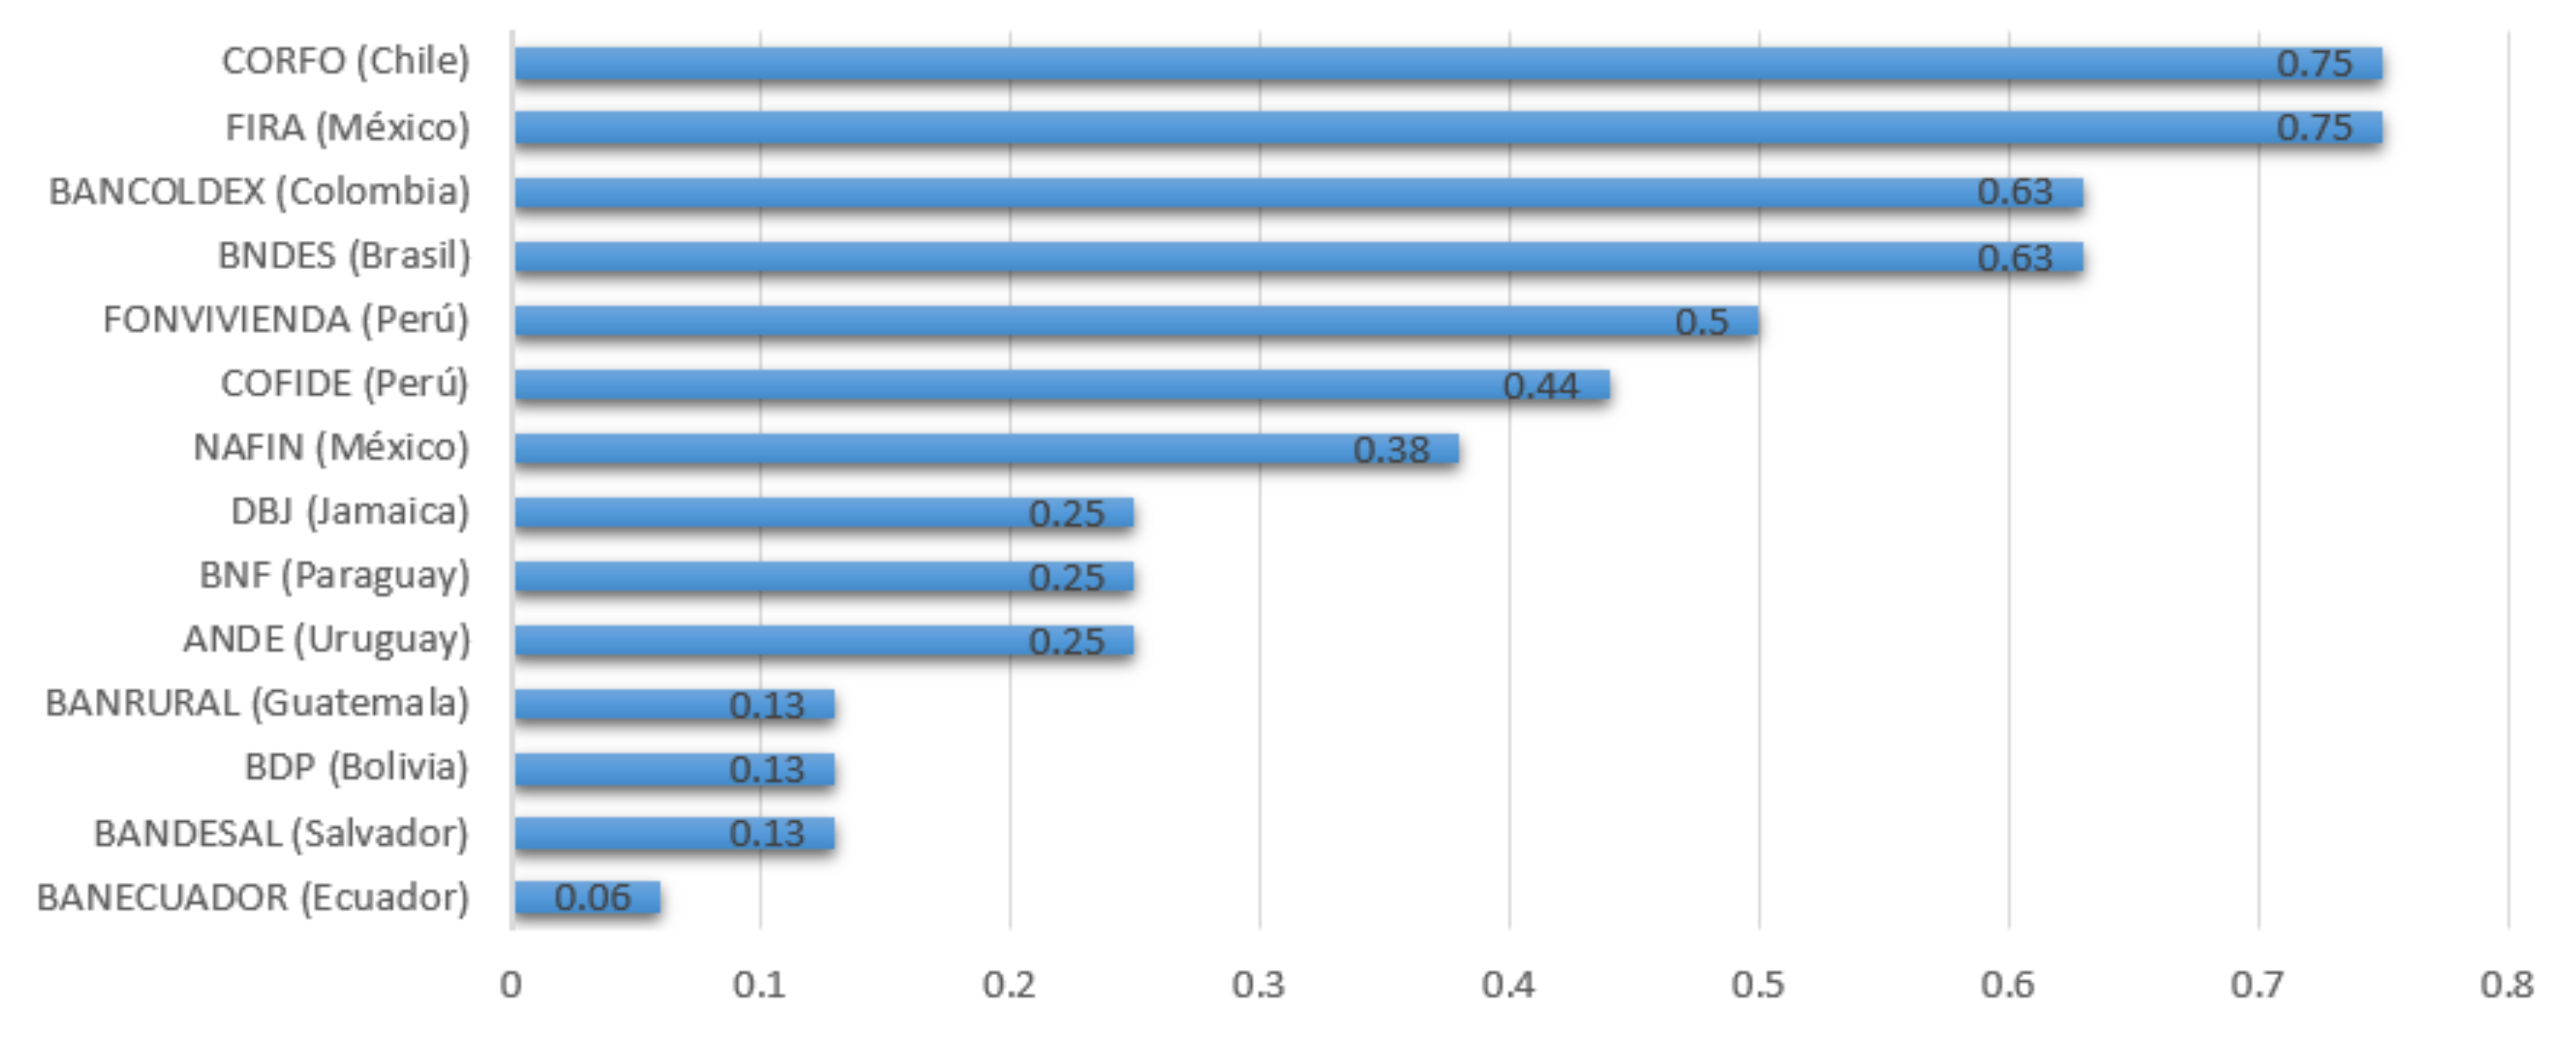
It has been shown that Chile, Brazil, and Mexico are the greatest green and sustainability bond market presences. Additionally, Peru, Argentina, Costa Rica, Colombia, Uruguay, Ecuador, Panama, and Paraguay have lesser extent entered this market. Likewise, development banks have had greater participation in the issuance of GSS bonds in Brazil, Colombia, and México.
It can be concluded that the main drawbacks to the issuance of GSS bonds are the issuance costs, the absence of a diversified portfolio of investment projects, and their low profitability. However, due to the current situation of the COVID-19 pandemic, a development opportunity for the GSS bond market can be presumed. All of this is related to the need for economic recovery which requires large investments linked to the conservation of the environment and greater attention and coordination among national development banks. Another aspect is that a good number of empirical and theoretical studies document that investors voluntarily exchange wealth for social benefits and, therefore, are willing to pay a premium, that is, accept lower yields for bonds related to the conservation of the environment.
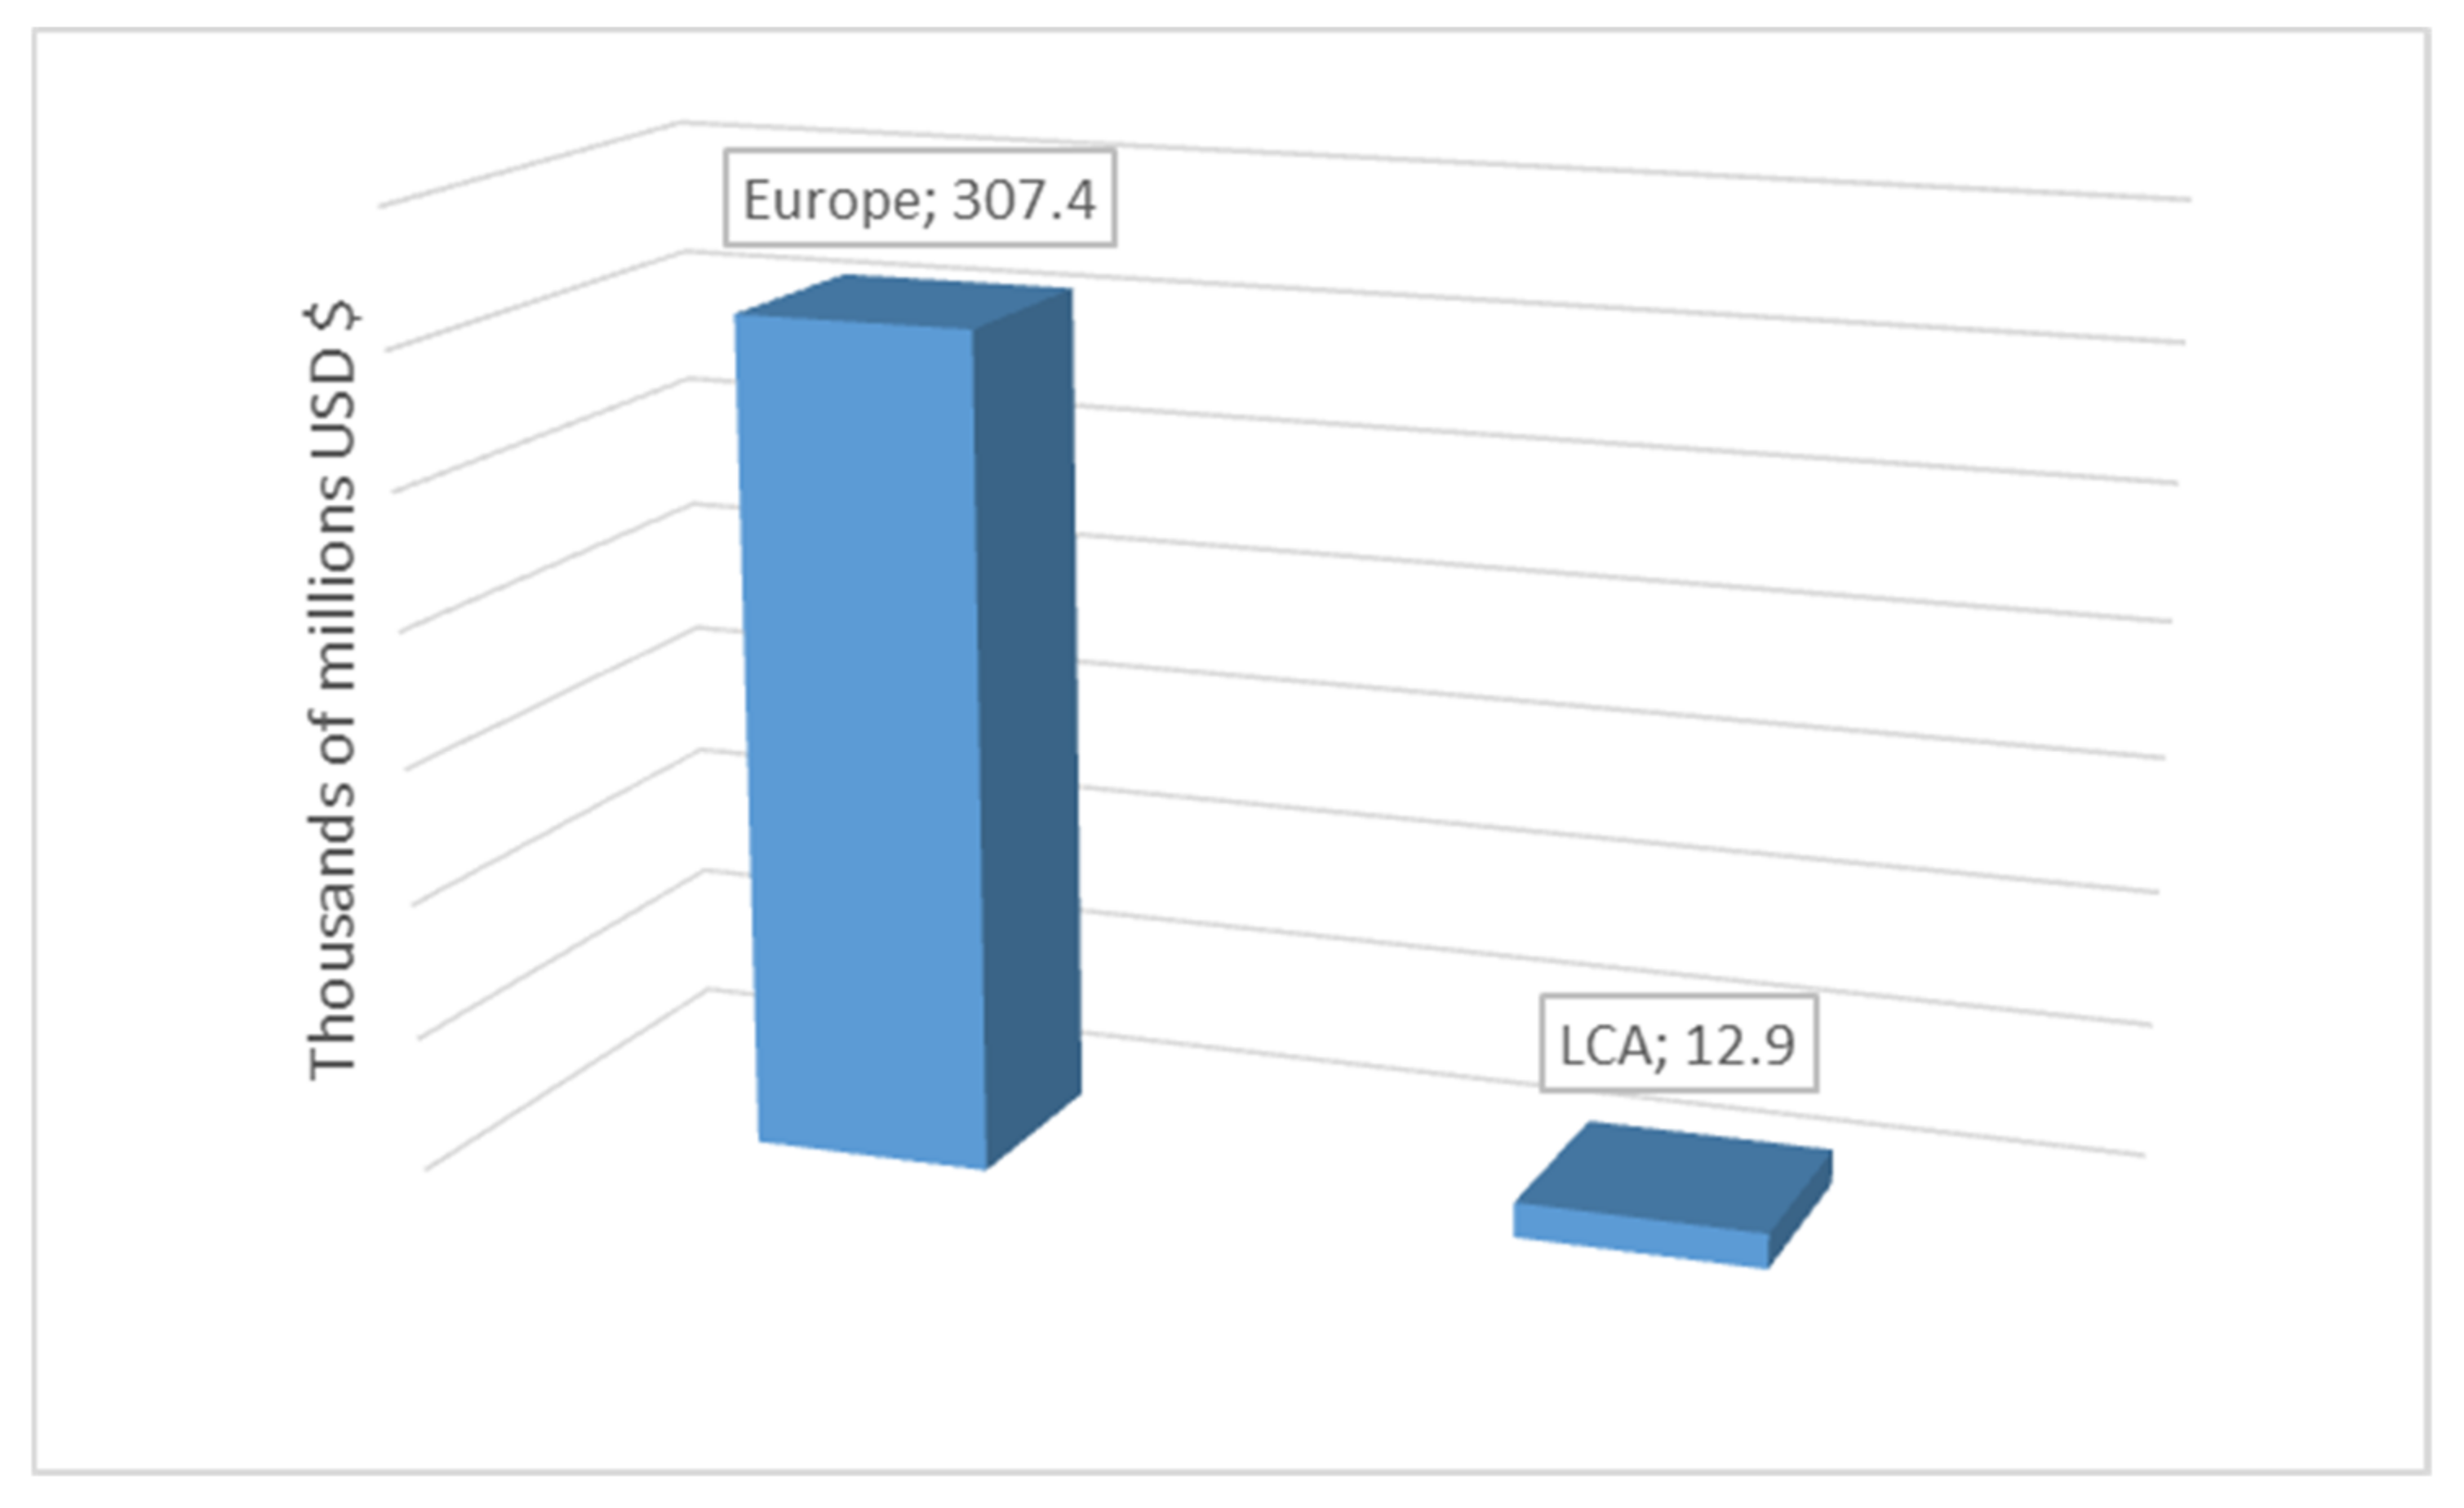
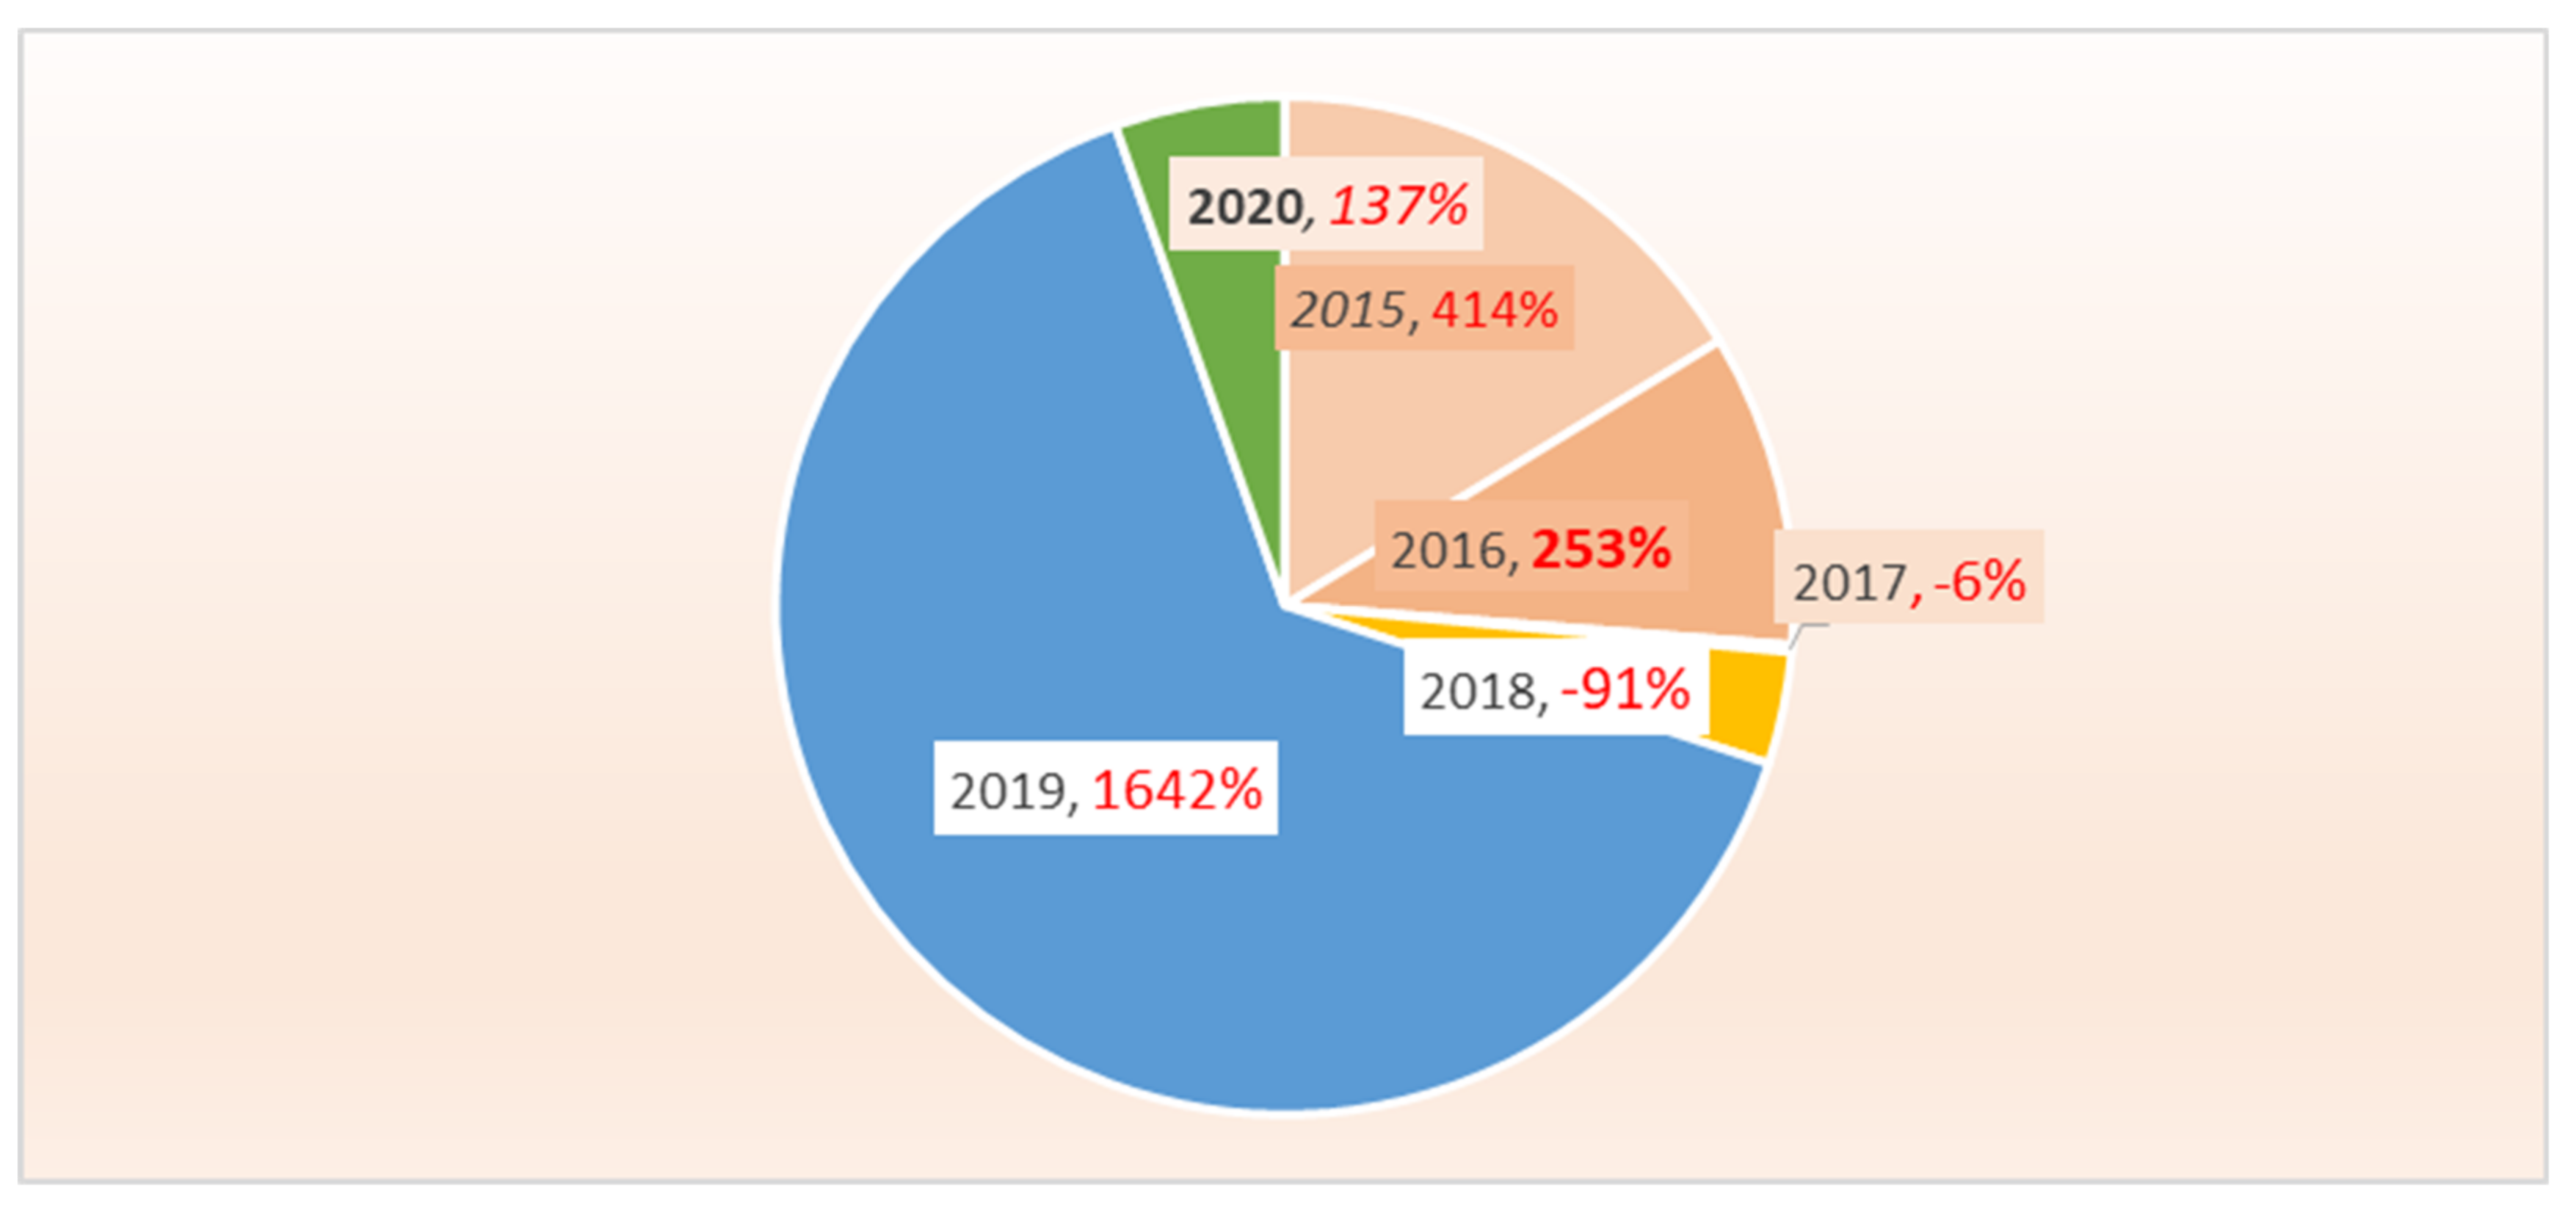
The international green bond market has grown exponentially by 2020 and, although the largest number of issues still comes from developed markets, LAC markets have started to take off. This type of issuance, due to its maturity and main features of the structured assets supporting them, makes an attractive operation for portfolio diversification. Furthermore, it is observed that this type of bond does not underperform other structures because it shows similar performance to the rest of the market.
The good news for the Latin American market in 2021 is that issues continue increasing as Colombia planned to launch domestic green bonds at the end of September for at least USD 500,000 million. Likewise, the Brazilian market reaches USD 9 billion in green bonds meaning an advance in its sustainable debt. In addition, México placed the second sustainable bond for 1480 million dollars over 15 years’ maturity at a rate of 2.25% for July 2021.
The growth of sustainable finance in the LAC region shows a top trend. Since the first bond in 2014 and in less than two years, the region’s green bond market has more than quadrupled from USD 15 bn in 2019 to USD 48.60 bn at the end of June 2021. This growth has been driven by the entrance of new issuers from new countries, now amounting to 14, and in particular the continued growth of the sovereign issuance from Chile.
According to the regression analysis carried out, we can determine that the capital market allows to achieve better possibilities in the economic development of nations and that sustainability projects should be taken with greater emphasis in the LAC region accompanied by a dynamic policy that allows awareness to the rulers, society in general and to motivate foreign investors to bet on these idle fund placement alternatives.
A clear limitation of this analysis has been the scarcity of data referred to bond issuances as all GSS bond markets in the LAC region are emerging and so it is necessary to wait for several years to consolidate issuances and then to have longer time series. Finally, future research is desirable and feasible. This work provides the basis to further explore the possible motivations for raising funds available from companies or individuals to invest in sustainability projects in a particular country, in a sample of countries selected for certain characteristics or for all the countries of the region that have or have not issued this type of bonds.

Author Contributions

Conceptualization, methodology, validation, formal analysis, writing—original draft preparation, L.C.B.A.; software, investigation, data curation, S.C.R.; validation, writing—review and editing, supervision, J.L.P. All authors have read and agreed to the published version of the manuscript.

Funding

This research received no external funding.

Institutional Review Board Statement

Not applicable.

Informed Consent Statement

Not applicable.

Data Availability Statement

Not applicable.

Acknowledgments

We are very grateful for the comments and suggestions offered by four anonymous referees. The second author thanks the Mediterranean Research Center for Economics and Sustainable Development (CIMEDES) of the University of Almería (Spain).

Conflicts of Interest

The authors declare no conflict of interest.

References

  1. United Nations. 17 Goals to Transform Our World. 2020. Available online: https://www.un.org/sustainabledevelopment/es/development-agenda/ (accessed on 20 June 2021).
  2. The World Bank. What Are Green Bonds? 2015. Available online: https://documents1.worldbank.org/curated/en/165281468188373879/pdf/99662-REPLACEMENT-FILE-Spanish-Green-Bonds-Box393223B-PUBLIC.pdf (accessed on 25 June 2021).
  3. Comisión Nacional del Mercado de Valores. Plan de Acción de la Comisión Europea. 2020. Available online: https://www.cnmv.es/portal/Finanzas-Sostenibles/Plan-accion-CE.aspx (accessed on 22 June 2021).
  4. International Finance Corporation (IFC). Green Finance: A Bottom-Up Approach to Track Existing Flows. 2016. Available online: https://www.cbd.int/financial/gcf/ifc-greentracking.pdf (accessed on 25 June 2021).
  5. Poberezhna, A. Addressing Water Sustainability with Blockchain Technology and Green Finance. In Transforming Climate Finance and Green Investment with Blockchains, 1st ed.; Marke, A., Ed.; Academic Press: London, UK, 2018; pp. 189–196. [Google Scholar]
  6. Yoshino, N.; Taghizadeh-Hesary, F.; Nakahigashi, M. Modelling the social funding and spill-over tax for addressing the green energy financing gap. Econ. Model. 2019, 77, 34–41. [Google Scholar] [CrossRef]
  7. The World Bank. 10 Years of Green Bonds: Creating the Blueprint for Sustainability across Capital Markets. 2019. Available online: https://www.worldbank.org/en/news/immersive-story/2019/03/18/10-years-of-green-bonds-creating-the-blueprint-for-sustainability-across-capital-markets (accessed on 28 June 2021).
  8. Climate Bonds Initiative. 2020. Available online: https://www.climatebonds.net/market/green-bond-database-methodology (accessed on 20 June 2021).
  9. Climate Bonds Initiative. The Green Bond Market in Europe. 2018. Available online: https://www.climatebonds.net/files/reports/the_green_bond_market_in_europe.pdf (accessed on 30 June 2021).
  10. International Capital Market Association. Social Bond Principles (SBP). 2021. Available online: https://www.icmagroup.org/sustainable-finance/the-principles-guidelines-and-handbooks/social-bond-principles-sbp/ (accessed on 1 July 2021).
  11. Fundación EU-LAC. El Potencial de los Mercados de Bonos Verdes en América Latina y el Caribe. 2020. Available online: https://eulacfoundation.org/es/system/files/el_potencial_de_los_mercados_de_bonos_v_erdes_en_america_latina_y_el_caribe.pdf (accessed on 2 July 2021).
  12. Climate Bonds Initiative. Sustainable Debt Global State of the Market 2020. 2021. Available online: https://www.climatebonds.net/files/reports/cbi_sd_sotm_2020_04d.pdf (accessed on 10 July 2021).
  13. Mejía-Escobar, J.C.; González-Ruiz, J.D.; Franco-Sepúlveda, G. Current state and development of green bonds market in the Latin America and the Caribbean. Sustainability 2021, 13, 10872. [Google Scholar] [CrossRef]
  14. Climate Bonds Initiative. Latin America & Caribbean: Sustainable Finance State of the Market 2021. 2021. Available online: https://www.climatebonds.net/resources/reports/latin-america-caribbean-sustainable-finance-state-market-2021 (accessed on 2 October 2021).
  15. BID FINANZAS. Latinoamérica Ofrece Más Transparencia en Bonos Verdes para Atraer Inversores. EFE News Service, Madrid, España, 27 de Abril 2021. Available online: https://www.proquest.com/wire-feeds/latinoamérica-ofrece-más-transparencia-en-bonos/docview/2518769747/se-2?accountid=171402 (accessed on 3 October 2021).
  16. Alianza Clima y Desarrollo. Lecciones Aprendidas de la Emisión de Bonos Verdes de los Países Miembros de la Alianza del Pacífico: Estudios de Caso. 2020. Available online: https://cdkn.org/wp-content/uploads/2020/05/V9_0805-PPT-Webinar-bonos-verdes.pdf (accessed on 3 October 2021).
  17. Economic Commission for Latin America and the Caribbean. Capital Flows to Latin America and the Caribbean: 2020 Year-in-Review in Times of COVID 19. 2021. Available online: https://repositorio.cepal.org/handle/11362/46697 (accessed on 5 October 2021).
  18. Climate Bonds Initiative. América Latina y el Caribe Estado del Mercado de las Finanzas Verdes 2019. 2019. Available online: https://www.climatebonds.net/files/reports/latam_sotm_19_esp_final_03_web_0.pdf (accessed on 2 October 2021).
  19. International Capital Market Association. The Principles, Guidelines and Handbooks. Available online: https://www.icmagroup.org/sustainable-finance/the-principles-guidelines-and-handbooks (accessed on 3 October 2021).
  20. CEPAL. Análisis del Financiamiento de la Banca de Desarrollo con Bonos Verdes: Intercambio Regional para un Gran Impulso Ambiental. 2021. Available online: https://repositorio.cepal.org/bitstream/handle/11362/46796/1/S2100043_es.pdf (accessed on 11 October 2021).
  21. Wang, J.; Chen, X.; Li, X.; Yu, J.; Zhong, R. The market reaction to green bond issuance: Evidence from China. Pac. Basin Financ. J. 2020, 60, 101294. [Google Scholar] [CrossRef]
  22. Lebelle, M.; Jarjir, S.L.; Sassi, S. Corporate Green Bond Issuances: An international evidence. J. Risk Financ. Manag. 2020, 13, 25. [Google Scholar] [CrossRef] [Green Version]
  23. Gianfrate, G.; Peri, M. The green advantage: Exploring the convenience of issuing green bonds. J. Clean. Prod. 2019, 219, 127–135. [Google Scholar] [CrossRef]
  24. Climate Bonds Initiative. Green Bond Issuance Tops $200bn Milestone-New Global Record in Green Finance: Latest Climate Bonds Data. 2019. Available online: https://www.climatebonds.net/2019/10/green-bond-issuance-tops-200bn-milestone-new-global-record-green-finance-latest-climate (accessed on 15 October 2021).
  25. Baker, M.; Bergstresser, D.; Serafeim, G.; Wurgler, J. Financing the Response to Climate Change: The Pricing and Ownership of U.S. Green Bonds; NBER Working Papers 25194; National Bureau of Economic Research, Inc.: Cambridge, MA, USA, 2018. [Google Scholar]
  26. Karpf, A.; Mandel, A. The changing value of the “green” label on the US municipal bond market. Nat. Clim. Change 2018, 8, 161–165. [Google Scholar] [CrossRef]
  27. Banga, J. The green bond market: A potential source of climate finance for developing countries. J. Sustain. Financ. Investig. 2018, 9, 17–32. [Google Scholar] [CrossRef]
  28. Hachenberg, B.; Shiereck, D. Are green bonds priced differently from conventional bonds? J. Asset Manag. 2018, 9, 371–383. [Google Scholar] [CrossRef]
  29. Nanayakkara, M.; Colombage, S. Do Investors in Green Bond Market Pay a Risk Premium? In Proceedings of the Global Evidence, 31st Australasian Finance and Banking Conference 2018, Sydney, Australia, 13–15 December 2018; Available online: https://papers.ssrn.com/sol3/papers.cfm?abstract_id=3221874 (accessed on 15 October 2021).
  30. Tolliver, C.; Keeley, A.; Managi, S. Drivers of green bond market growth: The importance of Nationally Determined Contributions to The Paris Agreement and implications for sustainability. J. Clean. Prod. 2020, 244, 118643. [Google Scholar] [CrossRef]
  31. MacAskill, S.; Roca, E.; Liu, B.; Stewart, R.; Sahin, O. Is there a green premium in the green bond market? Systematic literature review revealing premium determinants. J. Clean. Prod. 2021, 280, 124491. [Google Scholar] [CrossRef]
  32. Zerbib, O. The effect of pro-environmental preferences on bond prices: Evidence from green bonds. J. Bank. Financ. 2019, 98, 39–60. [Google Scholar] [CrossRef]
  33. Cheong, C.; Choi, J. Green bonds: A survey. J. Deriv. Quant. Stud. 2020, 28, 175–179. [Google Scholar] [CrossRef]
  34. Dan, A.; Tiron-Tudor, A. The determinants of green bond issuance in the European Union. J. Risk Financ. Manag. 2021, 14, 446. [Google Scholar] [CrossRef]
  35. Uribe, S. Análisis de la Rentabilidad Financiera de los Bonos Verdes en Comparación con Bonos Ordinarios en Latinoamérica Durante el Periodo 2015–2025. Available online: https://repositorio.uniandes.edu.co/handle/1992/45391 (accessed on 15 September 2021).
  36. Durán, C.; Morales, R. Comparación de las Tasas de Colocación de Bonos Verdes y Sociales Respecto a Bonos Convencionales. Available online: https://repositorio.uft.cl/xmlui/handle/20.500.12254/1908 (accessed on 15 September 2021).
  37. Torres, V. Propuesta de Financiamiento para Empresas Privadas en la Ciudad de Quito a Través de la Emisión de Bonos Verdes. Available online: http://repositorio.puce.edu.ec/handle/22000/17051 (accessed on 15 September 2021).
  38. Superintendencia de Compañías, Seguros y Valores de Ecuador. Estadísticas Boletín Mensual. 2020. Available online: https://portal.supercias.gob.ec/wps/portal/Inicio/Inicio/MercadoValores/Estadisticas/BoletinMensual#gsc.tab=0 (accessed on 15 September 2021).
  39. Bolsa de Valores de Quito. Prospectos. 2020. Available online: https://www.bolsadequito.com/index.php/mercados-bursatiles/emisores/prospectos (accessed on 7 October 2021).
  40. Banco Central del Ecuador. El BCE es Parte de Organización Mundial que Promueve las Finanzas Sostenibles. 2021. Available online: https://www.bce.fin.ec/index.php/boletines-de-prensa-archivo/item/1424-el-bce-es-parte-de-organizacion-mundial-que-promueve-las-finanzas-sostenibles (accessed on 20 November 2021).
  41. Statista. Producto Interno Bruto por País en América Latina y el Caribe en 2020. 2021. Available online: https://es.statista.com/estadisticas/1065726/pib-por-paises-america-latina-y-caribe/ (accessed on 15 December 2021).
  42. Banco Mundial. Available online: https://datos.bancomundial.org/ (accessed on 12 December 2021).
  43. Economic Commission for Latin America and the Caribbean. The Rise of Green Bonds. Financing for Development in Latin America and the Caribbean. 2017. Available online: https://repositorio.cepal.org/bitstream/handle/11362/42230/1/S1700985_en.pdf (accessed on 26 November 2021).
  44. Smaoui, H.; Grandes, M.; Akindele, A. The determinants of bond market development: Further evidence from emerging and developed countries. Emerg. Mark. Rev. 2017, 32, 148–167. [Google Scholar] [CrossRef]
  45. Inter-American Development Bank. Financing Infrastructure in Latin America and the Caribbean: How, How much and by Whom? 2015. Available online: https://publications.iadb.org/publications/english/document/Financing-Infrastructure-in-Latin-America-and-the-Caribbean-How-How-Much-and-by-Whom.pdf (accessed on 26 October 2021).
  46. Bloomberg. Available online: https://www.bloomberg.com/company/?utm_source=bloomberg-menu&utm_medium=offers (accessed on 17 December 2021).
  47. International Finance Corporation, World Bank Group. Emerging Market Green Bonds Report 2019. 2020. Available online: https://www.ifc.org/wps/wcm/connect/a64560ef-b074-4a53-8173-f678ccb4f9cd/202005-EM-Green-Bonds-Report-2019.pdf?MOD=AJPERES&CVID=n7Gtahg (accessed on 7 December 2021).
  48. International Finance Corporation, World Bank Group. Emerging Market Green Bonds Report 2020. 2021. Available online: https://www.ifc.org/wps/wcm/connect/publications_ext_content/ifc_external_publication_site/publications_listing_page/emerging-market-green-bonds-report-2020 (accessed on 10 December 2021).
  49. Chuch, A.; Tapan, S.; Ehsan, R. Factors influencing the green bond market expansion: Evidence from a multi-dimensional analysis. J. Risk Financ. Manag. 2020, 13, 126. [Google Scholar]
  50. Ning, Y.; Cherian, J.; Safdar Sial, M.; Álvarez, S.; Comite, U.; Ziaud-Din, M. Green bond as a new determinant of sustainable green financing, energy efficiency investment, and economic growth: A global perspective. Environ. Sci. Pollut. Res. 2022. [Google Scholar] [CrossRef] [PubMed]
  51. EU-LAC Foundation. Opportunities for the Bi-Regional Strategic Partnership in Shaping a Greener Recovery II EU-LAC Essay Contest on the Bi-Regional Partnership. 2021. Available online: https://eulacfoundation.org/en/new-multilateralism-age-covid-19-perspective-european-union-latin-america-and-caribbean-relations (accessed on 20 March 2022).
  52. Davidson, K.; Gunawan, N.; Ambrosano, J.; Souza, L.; Brakarz, B. Green Infrastructure Investment Opportunities: Brazil 2019; IDB Inter-American Development Bank: Washington, DC, USA, 2020; Available online: https://publications.iadb.org/publications/english/document/Green-Infrastructure-Investment-Opportunities-Brazil-2019.pdf (accessed on 21 March 2022).
  53. Cárdenas, M.; Guzmán, J.J. Planning a Sustainable Post-Pandemic Recovery in Latin America and the Caribbean. United Nations Development Programme: New York, NY, USA, 2020. Available online: www.latinamerica.undp.org (accessed on 20 March 2022).
  54. Glomsred, S.; Wei, T. Business as unusual: The implications of fossil divestment and green bonds for financial flows, economic growth and energy market. Energy Sustain. Dev. 2018, 44, 1–10. [Google Scholar] [CrossRef]
Figure 1. Sustainable Development Goals. Source: [1].
Sustainability 14 04693 g001
Figure 2. Cumulative issuance of sustainable bonds in Europe and the LCA region from 2019. Source: Own elaboration based on [11].
Sustainability 14 04693 g002
Figure 3. Cumulative size of GSS bond markets (December 2020). Source: Own elaboration based on [14].
Sustainability 14 04693 g003
Figure 4. Cumulative number of GSS bond issuers and instruments (December 2020). Source: Own elaboration based on [13].
Sustainability 14 04693 g004
Figure 5. Share (%) of bond issuances in the LAC region. Source: Own elaboration based on [12].
Sustainability 14 04693 g005
Figure 6. Use of GSS funds by type of project. Source: Own elaboration based on [18].
Sustainability 14 04693 g006
Figure 7. Development banks in the LAC region and progress in the green financing process. Source: Own elaboration based on [20].
Sustainability 14 04693 g007
Figure 8. Growth of bond issuance in Latin America taking 2014 as the base year. Source: Own elaboration.
Sustainability 14 04693 g008
Table 1. GSS bonds issued until December 2020 in the LAC region. Source: Own elaboration based on [12,17,18].
CountryNumber of BondsNumber of IssuersAmount Issued (in Millions of USD)
Argentina43610
Brazil28258260.30
Chile1039278.00
Colombia33332
Costa Rica11500
Ecuador33670
Guatemala11500
Mexico1294858.30
Panama11263
Paraguay11300
Peru32804
Supranational942742.00
Total765629,117.60
Table 2. LAC sustainable debt market. Source: Own elaboration based on [14].
CountryAmount of GSS Debt Issued USD (bn)% of LAC GSS Bond MarketNumber of
Issuers
Number of
Instruments
% Benchmark Issuance
by Amount
Average Instrument Size USD (m)
Chile17.80036.60%183376%540
Brazil11.70024.10%539030%130
Mexico7.80016.00%214420%181
Peru1.2002.40%7100%118
Argentina1.3002.60%11130%97
Guatemala1.2002.40%1258%600
Bermuda0.8001.60%2288%400
Colombia1.3002.70%9160%80
Costa Rica0.5541.10%330%185
Uruguay0.3760.80%230%125
Panama0.3800.80%4130%29
Ecuador0.5701.20%330%190
Barbados 0.0900.02%120%4
Supranational3.5306.90%31247%281
48.60 138246
Table 3. Barriers and progress in the issuance of green bonds in the LAC region. Source: Own elaboration based on [11].
BarriersAdvances
Higher issuance costs that are not offset by debt conditionsIn Costa Rica, the National Stock Exchange reduced the registration costs of green bonds.
In Colombia, the same is done with small bond issues.
Complex issuance procedures (including the definition of what is green)Stock exchanges have published guidelines for the issuance of green bonds in Costa Rica, the Dominican Republic, Colombia, and Chile, among others.
Some regulators have helped clarify these processes. In Colombia, the regulator issued a taxonomy.
Demanding reporting process and impact measurementFirst impact measurement practices.
Reporting to investors and other stakeholders is common practice.
Table 4. Summary of the studies on the issuance of green bonds. Source: Own elaboration.
YearAuthorsMain Results
2020MacAskill, Roca, Liu, Stewart, and SahinA part of the investors is willing to pay a higher price for green bonds and therefore accept a lower yield for these bonds
2020Lebelle, Lajili Jarjir, and SassiThe market reacts negatively to the announcement of green bond issues
2020Wang, Chen, Li, You, and ZhongThe price premium of the Chinese green bonds is much higher than that of an international green bond documented in previous studies
2020Cheong and ChoiIt was determined that more studies report positive evidence for “greenium”
2020Durán Quintana and Morales ZamoraFor the Chilean corporate bonds, it is shown that the Chilean market values the profitability requirements in a different way according to the type of bond, green or conventional
2019Gianfrate and PeriGreen bonds are more financially desirable than non-green ones. The advantage is greatest for corporate issuers and persists in the secondary market
2019FatinEnergy accounts for 33%, followed by low-carbon construction at 29%, low-carbon transportation at 20%, water at 9%, and waste and land use at a 3% each
2018BangaAs innovative financial instruments, green bonds provide an opportunity to direct private finance towards low-carbon investments
2019Nanayakkara and ColombageTrading a green bond with a premium provides a lower-risk investment opportunity for investors. Green bonds trade at a premium on the global capital market
2019Tolliver, Keeley, and ManagiMacroeconomic and institutional factors are driving the growth of green bond issues that finance investments in climate and sustainability for the future
2019ZerbibThe results suggest a small negative premium: the yield of a green bond is lower than that of a conventional bond. On average, the premium is −2 basis points for the entire sample
2019TorresIt is estimated that, if the interest rates of green bonds that the issuer could offer are lower than the active rates, they will be attractive to investors
2019UribeA negative premium is determined due to the high demand in a market with limited supply. Moreover, there is a lack of tax incentives and high issuance and certification costs
2018Karpf and MandelThey found that conventional bond yields are higher on average and that green bonds trade lower appreciations and higher yields in the markets
2018Baker, Bergstresser, Serafeim, and WurglerGreen bonds are in fact issued at a premium, underperforming by several basis points
2018Hachenberg and SchiereckGreen bonds rated AA and BBB are economically traded more strictly than their comparable non-green bonds, but we could not find any statistical significance
Table 5. Issuing countries in the LAC region of green bonds and amounts (USD million) per year. Source: Own elaboration based on [12,17,18].
Country/Year 2014201520162017201820192020Grand Total
Argentina 55060 610
Brazil 5498551750 10003606.38260.3
Chile 500 284959299278
Colombia 115217 332
Costa Rica 500 500
Ecuador 250420670
Guatemala 500500
Mexico 5002159338267 15944858
Panama 263263
Paraguay 300300
Peru204 400200804
Supranational 74136 120213302742
Grand Total204104937033491327570114,142.3029,117.60
Table 6. Amounts of GSS bond issues and average growth in the LAC countries. Source: Own elaboration based on [17,18,41,42,43].
YearAverage GrowthAmount USD
20142.93204.00
20152.681049.00
20161.863703.00
20172.733491.00
20182.33327.30
20191.335701.00
2020(7.24)14,142.30
29,117.60
Table 7. Determinants of the potential growth of GSS bond markets in the LAC region (2019) (on a maturity scale from 0 to 5). Source: Own elaboration based on [47,48].
SBN ScoreGreen Bond MomentumCapital Market Governance
CountryOverallGreen Bond Issuance/Total Bond IssuanceSovereign Green Issuance: Total PlannedPrivate Credit/GDPMarket
Capitalization (USD Billion)
Political Risk RatingRegulatory QualityRule of Law Index
Argentina12022443
Barbados01052154
Brazil43055324
Chile15554555
Colombia43253343
Costa Rica15252544
Ecuador32032211
Honduras10051311
Mexico 41233342
Panama33052544
Paraguay30031221
Peru33233342
Dominican Republic10231432
Uruguay13130554
Table 8. Defining the variables to be considered in the analysis. Source: Own elaboration.
Explained Variable
YEconomic growth
Explanatory Variables
X1Green Bond Issuance/Total Bond Issuance
X2Sovereign Green Issuance: Total Planned
X3Private Credit/GDP
X4Market Capitalization
X5Political Risk Rating
X6Regulatory Quality
X7Rule of Law Index
Table 9. Values of the explained variable used in the regression. Source: Own elaboration.
CountryGDP 2018GDP 2019GDP Variation (%)
Argentina2.50(1.80)(1.72)
Barbados0.800.10(0.88)
Brazil2.201.40(0.36)
Chile3.902.80(0.28)
Colombia2.603.300.27
Costa Rica3.402.50(0.26)
Ecuador2.000.20(0.90)
Honduras4.103.50(0.15)
Mexico2.301.00(0.57)
Panamá5.604.90(0.13)
Paraguay3.401.60(0.53)
Peru4.003.20(0.20)
Dominican Republic5.005.500.10
Uruguay1.620.30(0.81)
Table 10. Matrix of correlations of the independent variables. Source: Own elaboration.
YX1X2X3X4X5X6X7
Y1.00000.09980.39610.54920.13610.1590−0.0888−0.0121
X10.09981.00000.52210.37140.54010.59880.48390.7298
X20.39610.52211.00000.14510.36870.45720.49510.3622
X30.54920.37140.14511.00000.35180.07500.06890.4920
X40.13610.54010.36870.35181.00000.01420.15000.4526
X50.15900.59880.45720.07500.01421.00000.40390.5260
X6−0.08880.48390.49510.06890.15000.40391.00000.7272
X7−0.01210.72980.36220.49200.45260.52600.72721.0000
Table 11. Regression results. Source: Own elaboration.
VariableCoefficientStandard Errort-Statp-ValueVIF
Constant−1.3615 (***,**,*)0.3569−3.81530.0034
X20.1689 (**,*)0.07272.32390.04251.1529
X30.3327 (***,**,*)0.09963.34120.00751.3215
X7−0.2090 (**,*)0.0893−2.33990.04131.4890
Significance level: *** = 1%, ** = 5%, and * = 10%.
Publisher’s Note: MDPI stays neutral with regard to jurisdictional claims in published maps and institutional affiliations.

