Article

Bed Load Transport and Alternation of a Gravel-Bed River Morphology within a Vicinity of Block Ramp: Classical and Numerical Approach

1
Faculty of Environmental Engineering and Land Surveying, University of Agriculture in Kraków, 30-059 Krakow, Poland
2
Faculty of Civil Engineering, Cracow University of Technology, 31-155 Kraków, Poland
*
Author to whom correspondence should be addressed.
Sustainability 2022, 14(8), 4665; https://doi.org/10.3390/su14084665
Submission received: 17 February 2022 / Revised: 30 March 2022 / Accepted: 11 April 2022 / Published: 13 April 2022

Abstract

:
In current river management, we very often use environment-friendly hydraulic structures when it is required for river bed or river bank protection due to erosion of a river channel. Block ramps are one of many methods used to stabilize river beds. They provide a semi-natural solution to certain river engineering problems in mountain streams. When building block ramps, one can use the dissipative behavior of large rock blocks or boulder elements randomly placed on the river bed to enhance fish migration in an upstream direction; thus, they can serve as fish passes. In this paper, we present the results of the numerical modelling of a bed load transport and the morphological changes of a river bed where a block ramp was designed and built. The main aim of the study was to investigate the difference of 2D modelling of a bed load transport along the mountain stream reach with boulder ramps in comparison to the classical methods of Hjulström, Shields, and Russian standard ST-24-2396. The work was carried out on the stream of one of the chosen low-head hydraulic structures, where 25 identical block ramps were constructed for river training reasons. The novel approach of our study is, for the first time in the field, to show a very detailed analysis of block ramp influence on sediment transport and river morphology changes compared to the classical understanding of those phenomena, as well as 2D model results to give hydraulic engineers an inside look into classical and modern approaches of bed load transport calculations. This might be helpful for designing such kinds of hydraulic structures in the future, in all regions where sediment transport calculations are important but do not always require sophisticated modelling.

1. Introduction

Hydraulic engineering structure design and construction are increasingly facilitated and aided by various numerical models. Owing to the data results and analysis, which by conventional methods would require much time and labor, this method is faster and more efficient. Unfortunately, the results obtained from numerical simulation are often taken for granted, with no validation or verification [1]. A frequent case is also that a given model can be applied only in specific conditions, e.g., in the beds of natural rivers, while for engineered beds, the results obtained by means of the model are not very satisfactory. Verification and checking the correctness of the model for the given type and kind of river bed is essential and should precede the analysis of numerical simulation results.
In the literature, we can find many classical books and papers that help hydraulic engineers in their computations and numerical simulations [2,3,4,5,6,7,8,9,10,11]. All referenced here, authors present and refer to many numerical methods, which are, however, sometimes weighed down with many errors; thus, in situ measurements are the key to verifying computer model results. On the other hand, in situ measurements are time-consuming and expensive, so having verified numerical models is very important.
No one would question that water flow is a very complex problem needing not only theoretical but also a lot of practical knowledge. Physical analyses of this phenomenon provide a quantitative description of water flow, allowing the creation of mathematical models that have an important practical meaning. In previous years, rapid development of numerical software programs has improved their practical implementation; therefore, the results obtained through them can be applied in practical solutions [10,11,12,13,14,15,16,17,18,19]. However, one has to be very careful and experienced when using models. Bruk [1] states that the similarity between the river and its model could only be partially verified. In that sense, only some results of modelling might be used for design recommendations [20,21]. Ultimately, an engineer is the person who decides if the model works correctly and if the results are reliable. Mistakes that are made might later lead to errors in design that could cause catastrophic structural failure.
In the present study, we decided to examine what might be predicted by numerical modelling in the case of block ramps built in mountainous streams, specifically in the direction of predicting bed load transport and river channel morphology changes.
Block ramps made of natural stone with artificial roughness are used to stabilize smaller creeks and streams, especially in mountain areas where, apart from performing their technical functions, they facilitate fish migration and enhance water aeration, which is highly beneficial [22,23,24,25,26,27,28]. Thus, expensive and inefficient fish ladders, which are usually built with more traditional hydraulic structures spanning river channels, are not required. Block ramp structures have been extensively investigated in recent years, both in the field and in hydraulic laboratories, as both physical and numerical models [20,27,28,29,30,31,32]. Block ramps are environmentally friendly, low-head hydraulic structures that mimic natural river rapids, allowing fish and invertebrates to migrate [33] and, at the same time, are engineering structures that stabilize river and stream beds. Block ramps built with large rock blocks enable the migration of fish and benthic macroinvertebrates [34,35,36]. The pools formed by flow hydrodynamics should be preserved at the sections between the block ramps. Stones of different sizes should be placed in the river bed, creating shelters for fish and other living organisms.
Field studies and works were undertaken to examine boulder block ramps that already exist within mountain channels and the results of such investigations were later used for modelling ramps, numerical and physical, in laboratories (e.g., [32,37]) to improve their construction in terms of their hydraulics and their impact on river environment.
In view of the above, our paper presents the results of the numerical modelling of bed load transport and morphological changes of a river bed with a crossbar structure in the form of a block ramp. The main aim of the study was to compare the obtained results from 2D modelling (in our case the CCHE2D model) for determination of bed load transport with the classical approaches, which in our case are Hjulström, Shields, and Russian standard ST-24-2396 [38,39,40] methods (the last method listed here was used in Poland for many years, specifically during the construction of the ramp system on the Porębianka, and bed load transport results obtained with this method were checked in the field using radioisotope methods [41]). For bed load transport calculations in the classical methods, we used Meyer-Peter and Müller (MPM) [42], Parker [43], Šamov [44], and Jäggi [45]. The following detailed work was performed on the chosen block ramps built in Polish Carpathians on the Porębianka stream, where many (25) identically constructed boulder ramp structures were built for river training reasons. As it is said in the abstract, the novel approach of our study is to show, for the first time, a very detailed 2D analysis of block ramp influence on the sediment transport and river morphology changes and to compare the results of that data with the classical understanding of those phenomena to give hydraulic engineers an inside look into classical and modern approaches of bed load transport calculations. This could help them decide which way of calculation is faster, better, and more reliable.

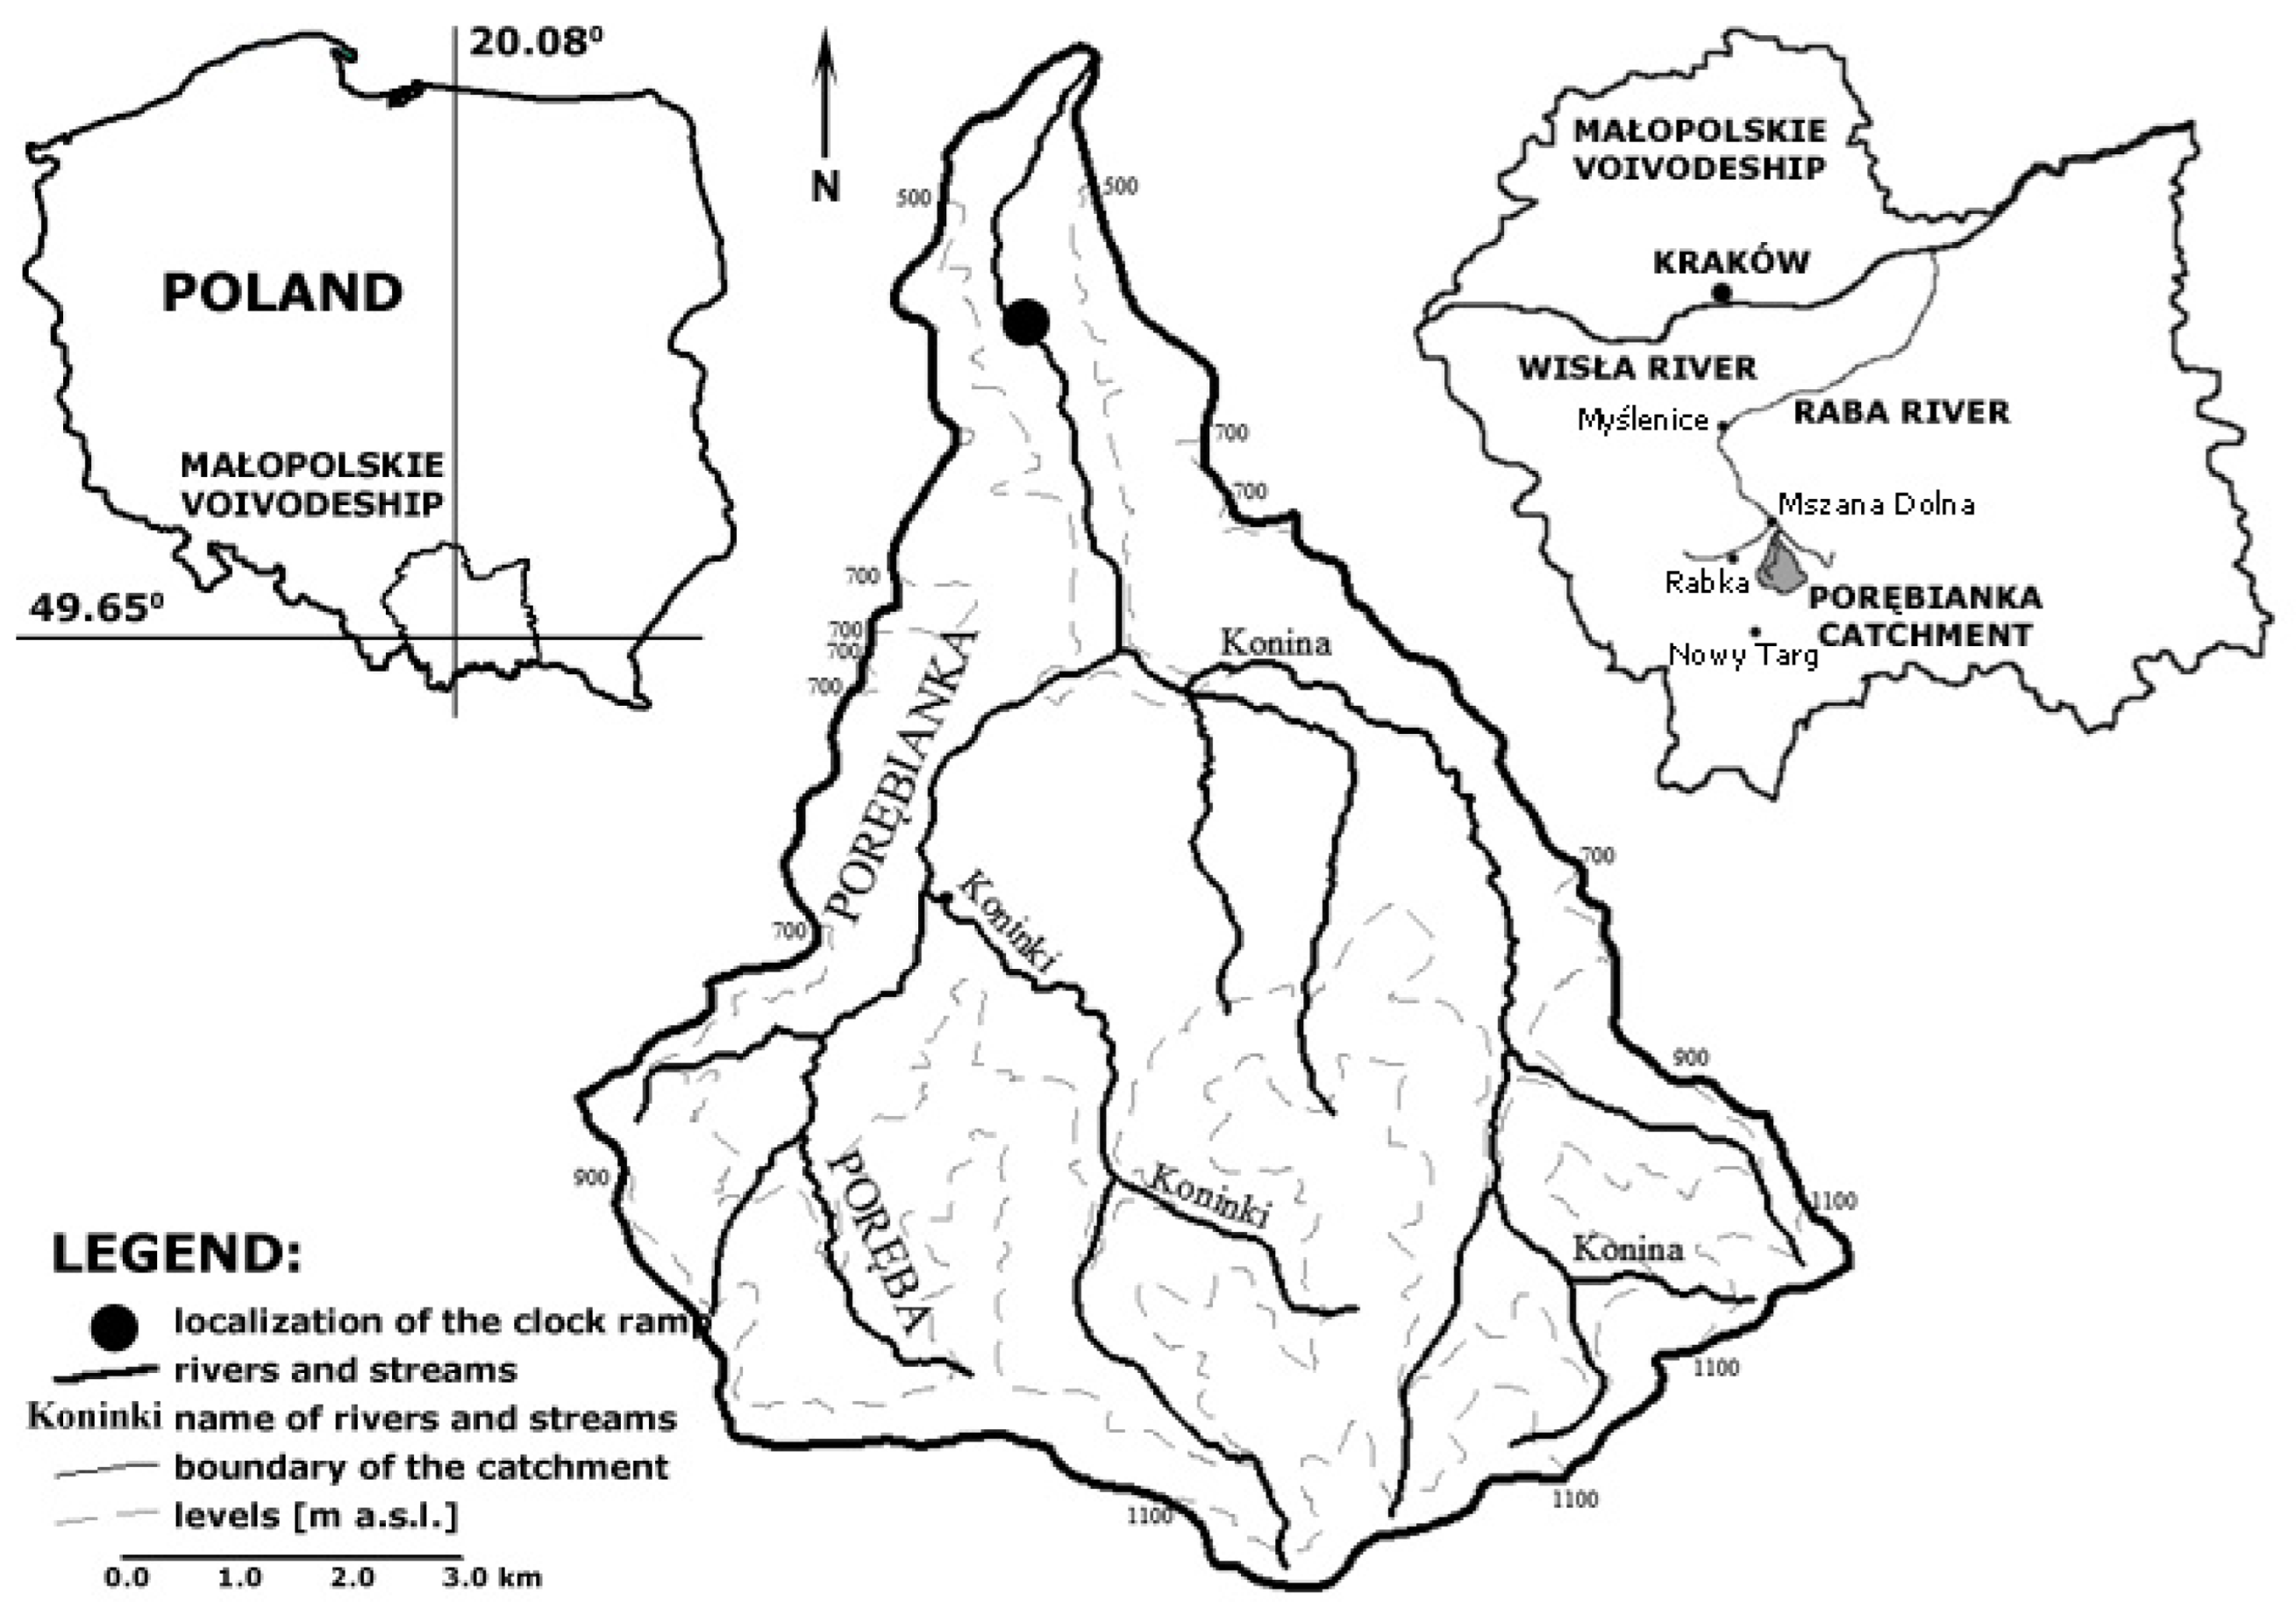
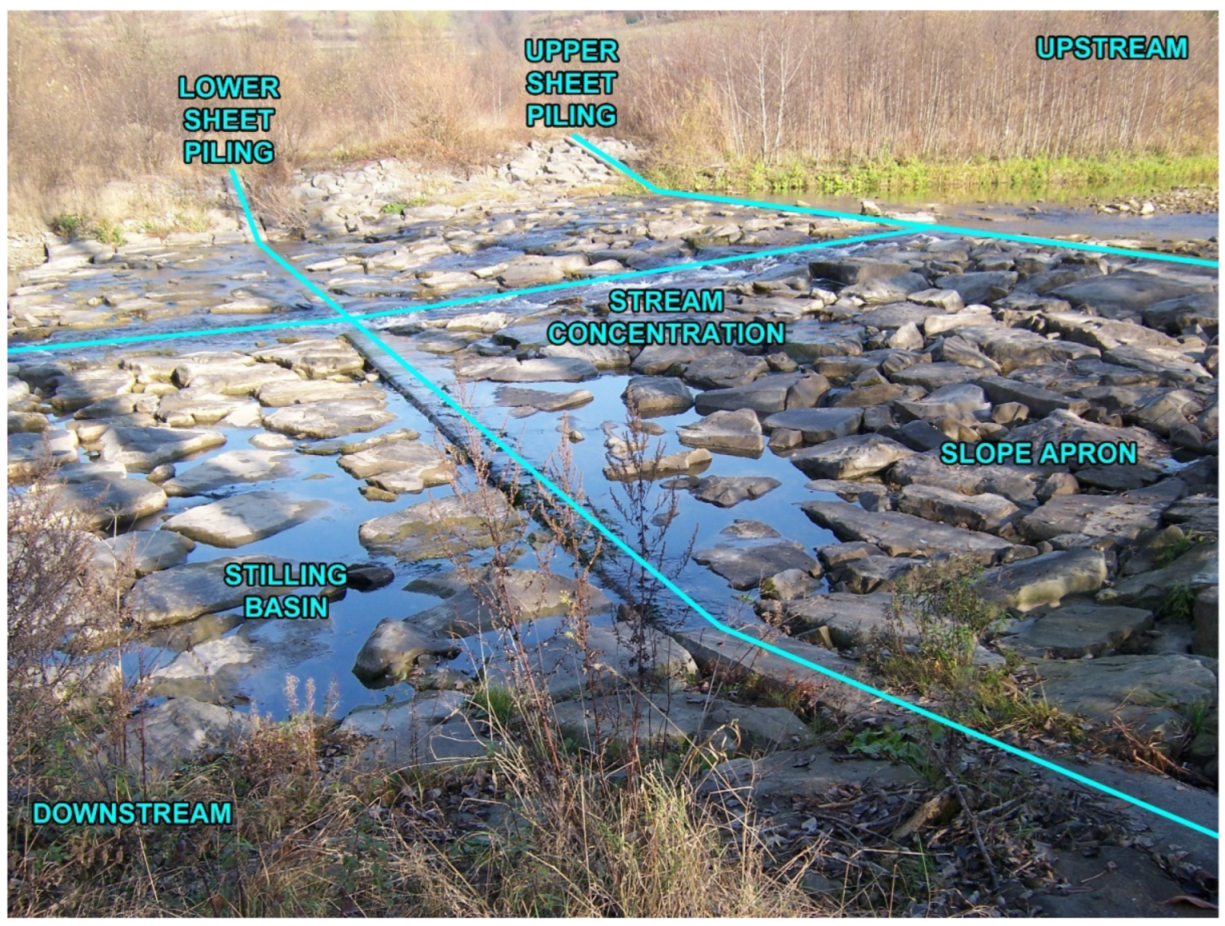
2. Research Region and Object Description

The Porębianka stream catchment (Figure 1) is located in the Beskidy Zachodnie mountain range, on the Northern hillside of the Gorce range. The highest point of the catchment is Kudłoń summit (1276 m. above sea level) and the lowest one at the Porębianka mouth leading into the Mszanka confluence in Mszana Dolna (400 m above sea level).
Porębianka stream is a watercourse 15.4 km long, with its springs on the Obidowiec hillside (1000 m above sea level). The Porębianka catchment covers an area of 71.8 km2. The average annual precipitation in the catchment is 1000 mm, but it ranges from 800 mm at the foot of Gorce to 1200 mm in the upper zones of the catchment. The Porębianka has a gauging station in Niedźwiedź, 5.2 km away from the mouth. Water levels and discharge were monitored at the station of the Institute of Meteorology and Water Management (IMGW).
Along the section of 0 + 836 − 4 + 080 km on the Porębianka stream, the watercourse was engineered using twenty-five block ramp hydraulic structures. The river regulation was targeted at the stabilization of the river bed and banks in order to protect the adjacent land and asphalt road on the route to Mszana Dolna-Niedźwiedź along with the neighboring houses.
The engineered river channel is 28 m wide. The channel gradient was reduced from 1.25 to 0.55%. On the majority of sections regulated by the block ramps, the channel is alluvial (the redeposition reach). For the present in situ study, block ramp No. 14 located at 2 + 890 km was selected (Figure 2). We decided to only investigate this block ramp in detail here, since the results obtained could be transferred to the rest of the existing hydraulic structures because of their similarity and the fact that all of them are situated in the same river reach, where no tributaries are present and no geometrical changes of the channel are present, including channel slope. Additionally, we had the best access to this block ramp (structure No. 14) in terms of completing the fieldwork.
The investigated hydraulic structure No. 14 on Porębianka (and all other 25 block ramps) is composed of two rows of G-62 steel sheet pilings topped with a reinforced concrete pile cap. The space between the sheet pilings’ walls was filled with square stone riprap with an average diameter of 0.90 m and layer thickness of 0.80 m. The stone riprap is set on an even base with no additional levelling layer. The inclination of the slope apron is 12:1 (length 12 m, slope 0.99 m).
There is also 3 m long and 1.2 m deep riprap at the river bed of the structure above the upper sheet pilings. Downstream from the lower sheet piling, there is a stilling basin 5 m long and 1.2 m deep (Figure 2). In the central part of the upper and lower sheet pilings at a distance of 4 m, the overflow crest was lowered by 0.20 m to concentrate the stream during the low water stages to help fish migrate.
To prevent channel water transfer at flood stages, side cut-off walls (designed as sheet piling walls) were lengthened to join them to ramp cut-off side wings and the naturally high riverbank and to fill in the space between the sheet pilings with local material.
The analyzed structure is trapezoidal in profile. The river bed slopes directly adjacent to the block ramp, which is also protected with stone riprap.
Block ramp No. 13 is located at a distance of 98 m downstream from the lower sheet piling of the studied ramp No. 14, and block ramp No. 15 is at a distance of 68 m upstream from the upper sheet piling.

3. Methodology

3.1. Field Measurements

The geodesic field measurements were taken with TOPCON GTS-226 total station (Topcon Corporation, Tokyo, Japan). The measurements were performed by means of the method of dispersed points, so as to map the horizontal and vertical systems in the river bed and floodplains as precisely as possible. This resulted in a very accurate modelling grid, which was then used for the simulation of river bed formation processes.
The hydrodynamic measurements of flowing water were done by means of OTT Nautilus 2000 current meter. Its operation is based on the measurement of electromagnetic induction in flowing water. The measurements can be done continuously or as a mean measurement of a given time interval. The measuring range of the device is from 0 to 2.5 m·s−1, which, with a measuring error of 1%, gives a maximum deviation of 0.025 m·s−1 at the highest measurable velocity value. Therefore, the accuracy of the device is 0.000 m·s−1. Several measurement profiles were established. The measurements were used for the calibration of the hydrodynamic parameters of the 2D model.
Next, granulometric measurement of the river bed sediment was performed by means of the Wolman Pebble Count procedure, in which a hundred pebbles are retrieved and measured [46]. This enabled the determination of river bed coarseness, which was then used for the interpretation of classical methods and in the 2D model.

3.2. Calculation of Bed Load Transport

The aim of the calculation of the bed load transport rate was to define the initial conditions of the bed load carried into the modelled section of the channel for its further validation. To reach this aim, the methods of MPM [42], Parker [43], Šamov [44] and Jäggi [45] were applied. All data necessary for bed load calculations required for those formulae were collected in the field.

3.3. Numerical Modelling

The CCHE2D numerical model was developed at The National Centre for Computational Hydroscience and Engineering (NCCHE), University of Mississippi, USA. It is used for 2D modelling of turbulent flow in open channels in steady and non-steady flow conditions, bed load and suspended sediment transport, morphological changes in the river channel, bank erosion, and water quality. The model is based on a 2D grid on which the presented resultant parameters are averaged vertically (2DH—two-dimensional). Water flow velocity distribution in the channel is calculated using the finite elements method (FEM) and finite volume method (FVM) [47,48,49,50]. The model is based on the equation of continuity and moments presented below.
Sediment material usually settles vertically, so the sediment above the non-eroded layer is divided into several sublayers. The upper layer is soluble, below which the other layers are located. Granulometric changes of sediment are expressed using partial differential equations, while the gradation of the material below the soluble layer can be described by the laws of conservation of mass [47]. The main equations for transport of suspended sediment bed load and load in traction are, respectively [48,51]:
( h C k ) t + u ( u h C k ) x + ν ( ν h C k ) y = x ( ε s h C k x ) + y ( ε s h C k y ) + α ω s k ( C * k c ) ( δ b c ¯ b k ) t + ( α b x q b k x ) x + ( α b y q b k y ) y + 1 L t ( q b k q b * k ) = 0
The variability of morphology and river bed layout is calculated from the equation:
( 1 p ) Z b k t = α ω s k ( C k C * k ) + ( q b k q b * k ) L t
where h is the local water depth; U and V are the depth-integrated velocity components in the x and y directions, respectively; εs is the eddy diffusivity of sediment; Ck is the concentration of the k-th size class; C*k is the corresponding transport capacity; α is the adaptation coefficient for suspended load; ωsk is the sediment settling velocity; qb*k, qbk, qbkx, and qbky are the bed load transport capacity, the bed load transport rate, and transport rate components in x and y directions, respectively; Lt is the adaptation length for bed load; p is the porosity of bed material, and Zbk is the bed change.
The nonequilibrium adaptation length Lt characterizes the distance for a sediment process adjusting from a nonequilibrium state to an equilibrium state, which is related to the scales of sediment transport processes, bedforms, and channel geometry. The non-equilibrium adaptation length Lt characterizes the distance for a sediment process adjusting from a nonequilibrium state to an equilibrium state, which is related to the scales of sediment transport processes, bed forms, and channel geometry. CCHE2D model enables the calculation of transport of bed load by means of the SEDTRA module [49].
The aim of the numerical modelling of a watercourse at a place where a block ramp is built was to analyze the hydrodynamic parameters and morphological changes as well as analyze the impact of bed load transport in the area of the block ramp for t-year flood discharges. Q50%, Q10%, Q1%, and Qflood were recorded during our measurements in the field. The t-year floods for Porębianka selected and used in the analysis were: Q1% = 190 m3·s−1, Q10% = 90 m3·s−1 and Q50% = 25 m3·s1. The flood recorded during our field measuring campaign was Qflood = 55 m3·s−1.

3.3.1. Drawing the Modelling Grid, Calibration and Verification Model, and Specification of Initial Conditions

To perform the simulation, it was necessary to draw a modelling grid. It was used not only as a spatial object representing the real-life context but also as a graphic presentation of the model results, and to specify some input parameters in the space modelled. For these reasons, the grid itself could also affect the quality of the obtained results. Therefore, every effort was made to draw it with the highest accuracy. It was also given the shape such that it corresponded as closely as possible to the actual topography of the area, both vertically and horizontally. It was drawn based on geodesic measurements taken by means of the dispersed points method (x, y, z). To numerically model the hydrodynamic parameters and morphologic changes in the Porębianka watercourse channel, a modelling grid was drawn consisting of 400 × 200 nodes (which corresponds to 227 m × 122 m in the field). The nodes were spaced at 0.57 m × 0.61 m. The grid covered the watercourse channel along with its floodplain and the investigated block ramp.
The model was calibrated by a comparison of the values obtained from numerical modelling with the values measured in situ. Hydrodynamic measurements were made for two flows: low and medium. During the low flow (Q = 1.25 m3·s−1), 45 measuring points were made, and during the medium (Q = 3.80 m3·s−1) flow, 70 points. Measurements were made in the river bed upstream and downstream of the structure and on the block ramp’s slope apron. The hydrodynamic parameters that were compared between the values from modelling and in situ measurements were water depth, flow velocity, shear stress, and Froude number. The values were compared using the Nash-Sutcliffe efficiency (NSE) [52], percent bias (PBias) [53], and coefficient of determination (R2) [53] as statistical measures:
N S E = 1 [ i = 1 n ( Y i o b s Y i s i m ) 2 i = 1 n ( Y i o b s Y i m e a n ) 2 ]
P B i a s = [ i = 1 n ( Y i o b s Y i s i m ) · 100 i = 1 n ( Y i o b s ) ]
R 2 = i = 1 n ( Y i s i m Y i m e a n ) 2 i = 1 n ( Y i o b s Y i m e a n ) 2
where Y i o b s is the i-th observation for the constituent being evaluated, Y i s i m is the i-th simulated value for the constituent being evaluated, Y i m e a n is the mean of observed data for the constituent being evaluated, and n is the total number of observations.
The values of the NSE, PBias, and R2 coefficients are shown in Table 1. It shows that the model fits properly.
Due to the design type of the block ramp, consisting of a random and close arrangement of the boulders, the modelling grid had to allow for model simplification for the slope apron of the structure. This consisted of the presentation of the investigated object as a smooth surface (disregarding the geometry of the boulders), and the effect of and energy dissipation caused by, in reality, coarse elements, was reached by attributing the object with an adequately high value of the Manning’s roughness coefficient. This operation, consisting of a compromise between the accuracy of the obtained results and the calculation capacity of the operating system, accelerated the calculation of the simulated flows. Otherwise, to take account of the complexity of the structure’s geometry, the grid nodes spacing would have to be made denser (that is, the distances between the nodes made shorter), which in turn would result in a considerably longer simulation time. All the simplifications in modelling were done to make them realistic since detailed surveys and measurements on every block on the ramp would take weeks. On the other hand, terrestrial LIDAR scanning was not possible since it does not work below water level. Thus, we wanted to prepare the data for modelling, which might be useful for future fast preparation of the model when designing a similar block ramp structure.
After the grid was drawn, the model’s basic characteristics, which affect the simulation quality and speed, were defined.
Simulation parameters:
  • Simulation time: 3600 s;
  • Time step: 0.1 s;
  • Turbulence model: mixing length model.
On the modelling grid, the following were specified:
  • The initial water table taken from the consumption curve for the simulated flow;
  • River bed roughness;
  • Type of bed erosion where only hydraulic structures were defined as non-erodible;
  • Bed load soluble layer thickness, the value of which was defined as the largest grain in the watercourse channel;
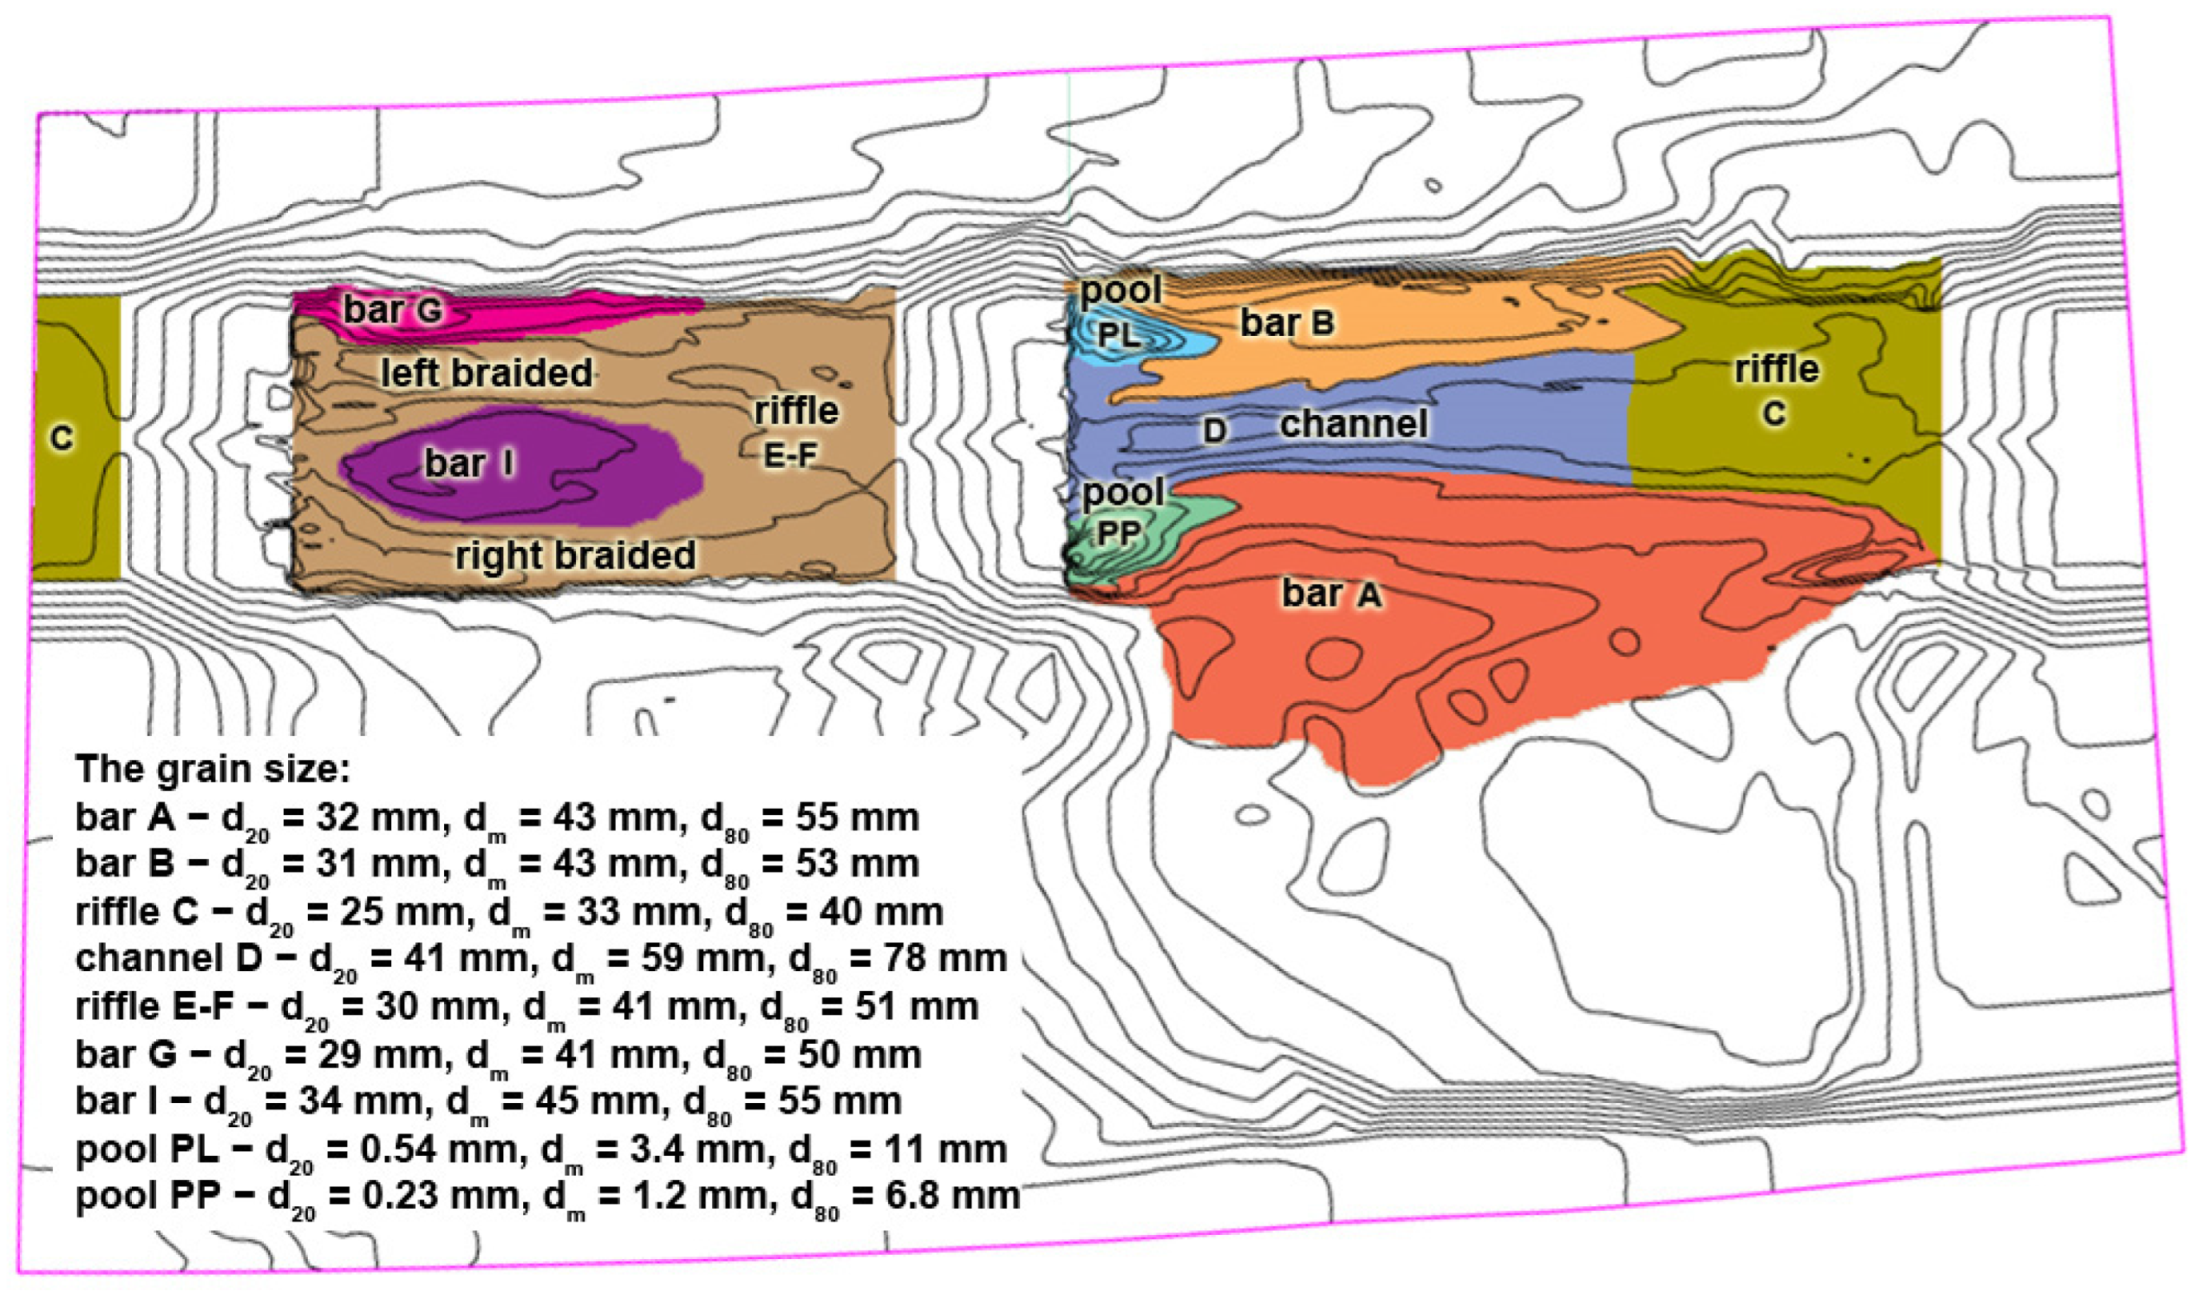
  • Particle size distribution (Figure 3):
Boundary conditions were defined as follows:
  • Upstream: flow (Qflood = 55 m3·s−1) and bed load transport (Tc = 5.7 kg·m−1·s−1) as well as inflowing sediment distribution (di < 0.030 mm—15%, di = 0.030–0.040 mm—35%, di = 0.040–0.050 mm—25%, di = 0.050–0.060 mm—15%, di > 0.060 mm—10%);
  • Downstream: water table level (H = 432.60 m above sea level).

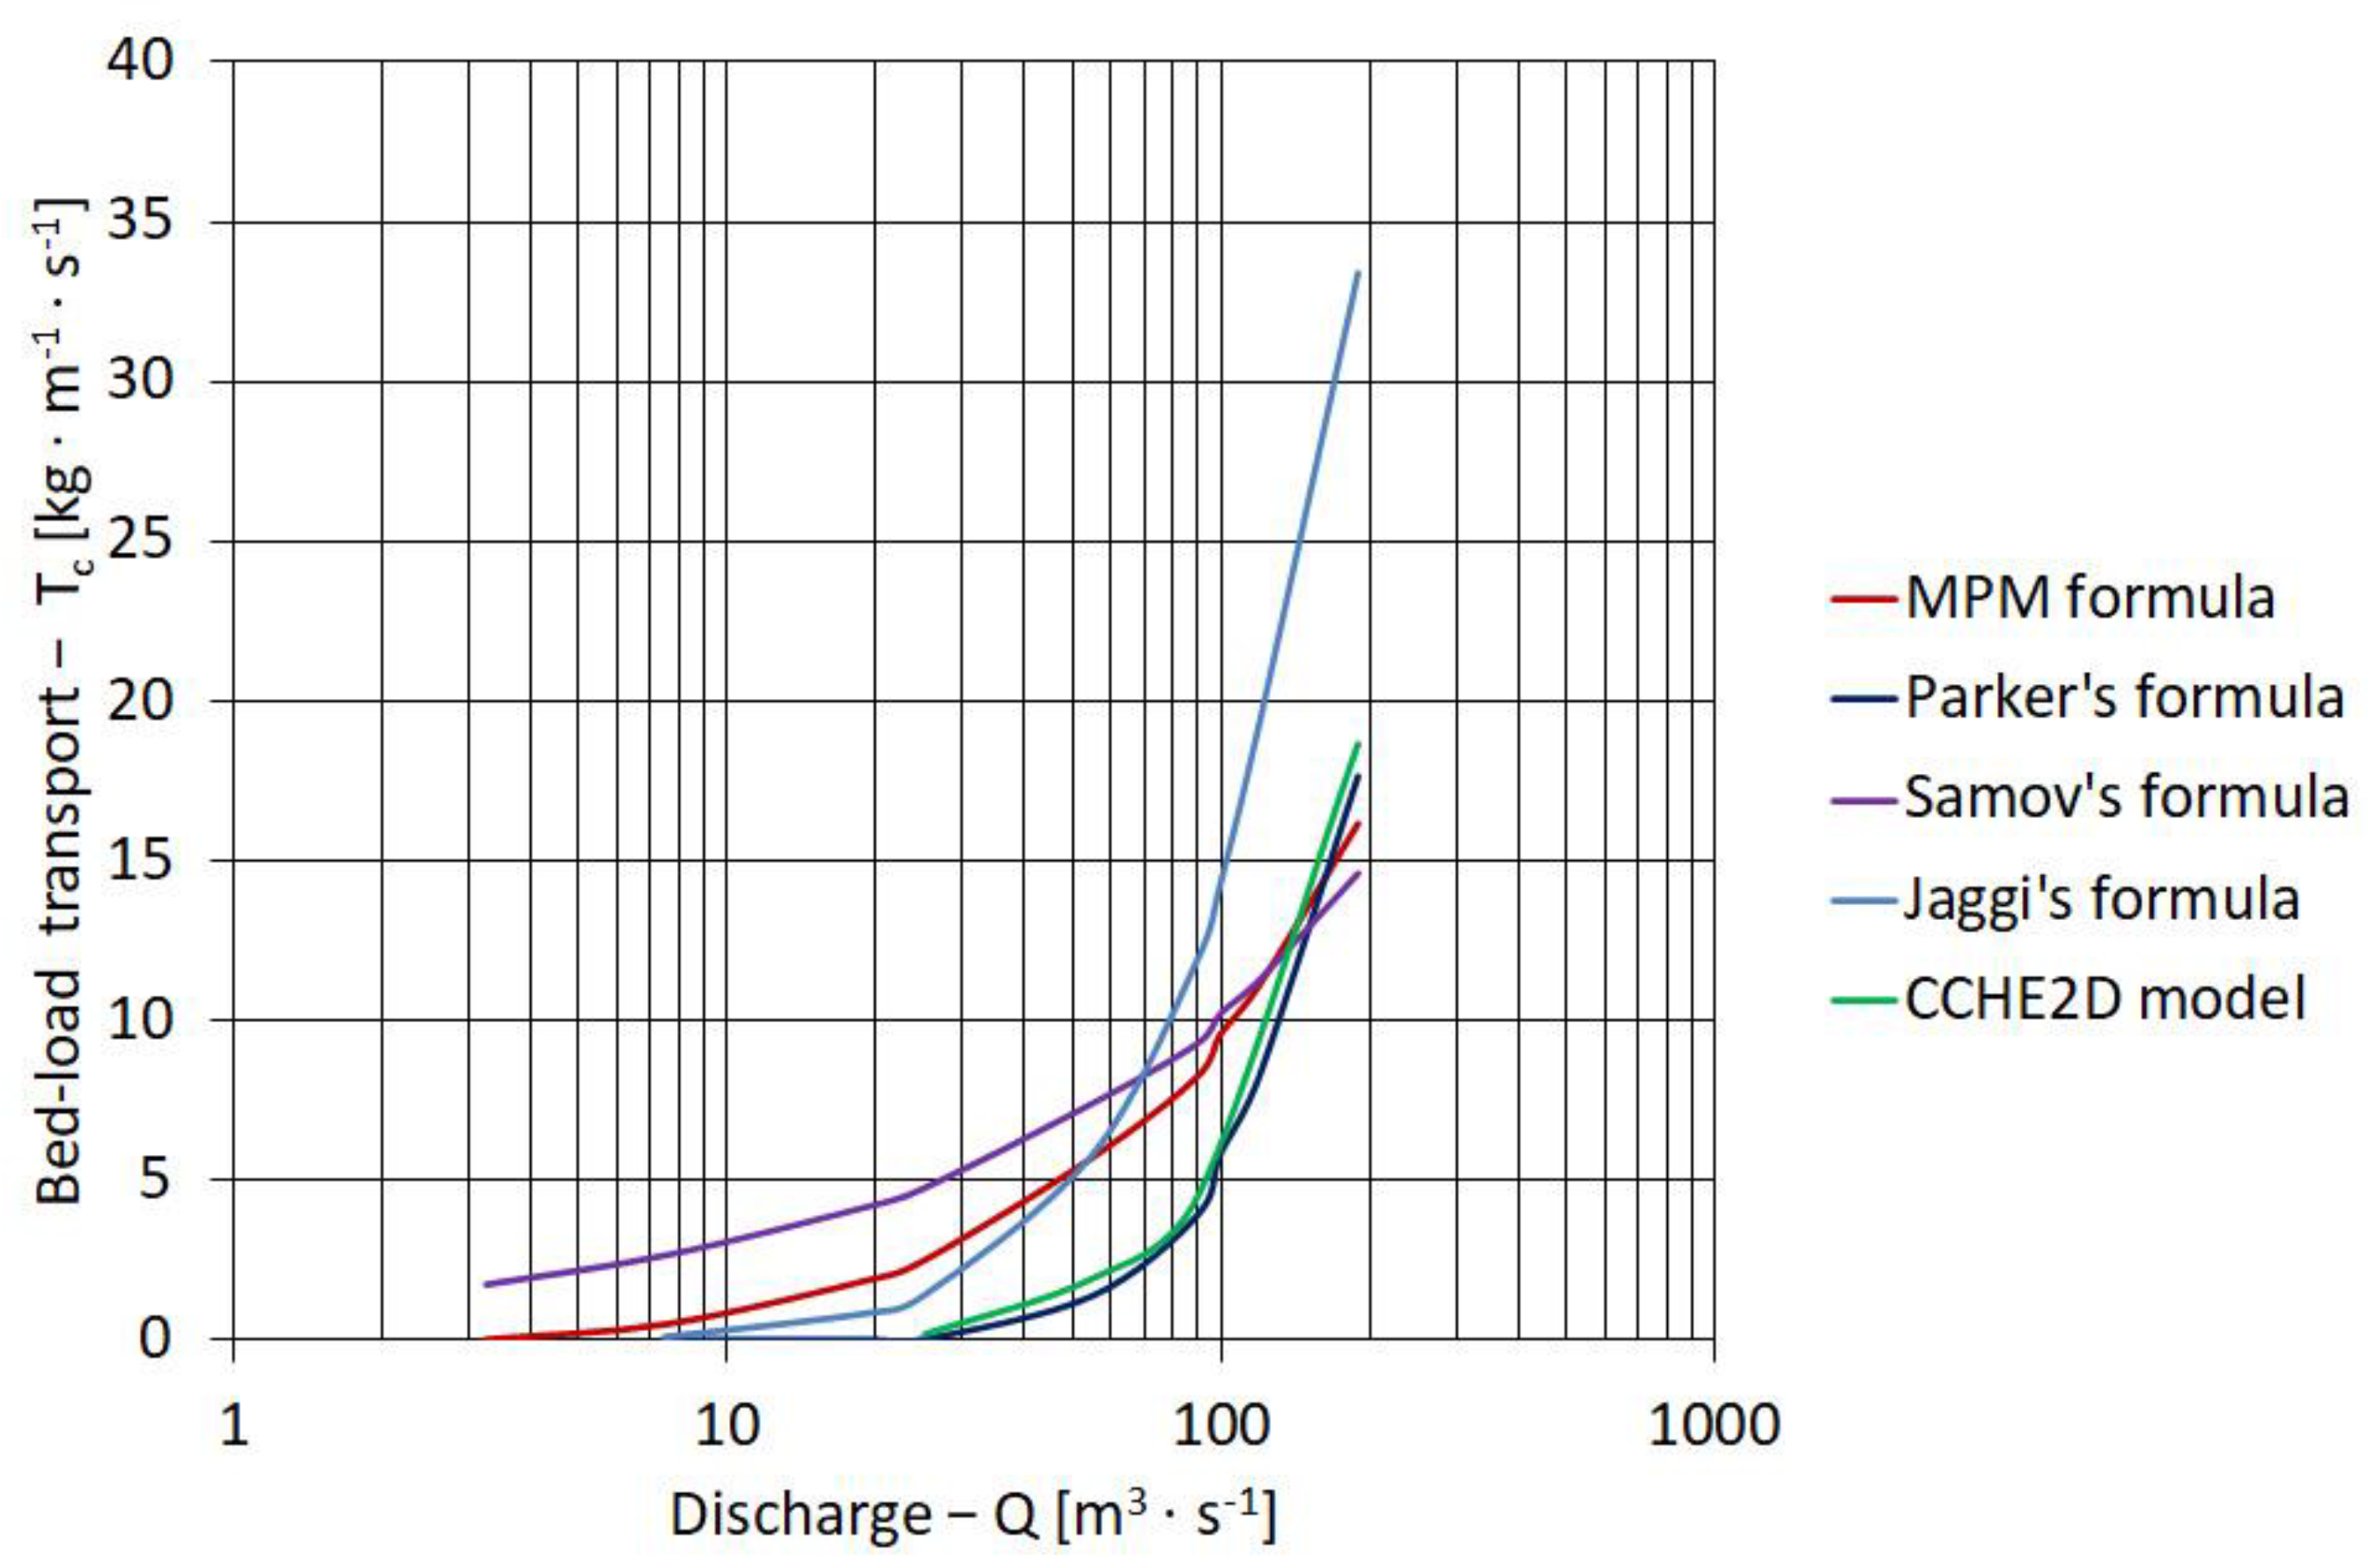
3.3.2. Model Comparison with Classical Approaches

The aim of the numerical modelling was to analyze the intensity and distribution of the transported bed load in three longitudinal profiles of the modelling grid (central profile at ½ channel width and two side profiles at ¼ distance away from the left-hand side bank and right-hand side bank). We always tried to run at least one profile (or its part) along the mainstream (Figure 4).
In the analysis, the correlation was checked between the hydrodynamic parameters affecting sediment transport (water depth, mean velocity, shear stress, and Shields’ parameter) obtained in flow simulation and the fraction distribution of the transported material. For this aim, Hjulström’s (Figure 5a) and Shields’ diagrams were used (Figure 5b), as well as the diagram presented in Russian standard ST-24-2396 (Figure 5c) [38,39,40].
The first diagram (Figure 5a) illustrates the relationship between the flowing water velocity and sediment material diameter. There are three zones: erosion, transport, and sedimentation, which inform the given types of phenomena occurring in the channel.
The second diagram (Figure 5b) demonstrates the relationship between Shields’ dimensionless parameter and the particle or shear Reynolds’ number. This method is based on the shear stress derivatives used for the determination of Shields’ parameter and the derivatives of the bed load’s relevant diameter, which are used for establishing the particle Reynolds’ number. Depending on the conditions in the channel, there is bed load movement or there is none. Shield’s dimensionless critical stress was calculated from the formula:
θ = τ ( γ s γ w ) · d
In turn, the particle Reynolds’ number was calculated as follows:
R e d = V * · d ν
where:
V * = τ ρ   —shear velocity [m·s−1];
τ—shear stress [N·m−2];
d—diameter of bed sediment [m];
γs—specific weight of sediment [N·m−3];
γw—specific weight of water [N·m−3];
ν—kinematic viscosity coefficient [m2·s−1], adopted for the temp. = 100 °C.
The third diagram (Figure 5c) illustrates the boundary velocity to boundary water depth ratio, at which particular sediment fractions are activated. There are three zones where sediment can or cannot be transported.

4. Results and Discussion

As was mentioned before, for purposes of this study, we analyzed the hydrodynamic parameters and morphological changes as well as bed load transport for t-year flood discharges for Porębianka: Q1%, Q10%, Q50%, and Qflood (respectively: Q1% = 190 m3·s−1, Q10% = 90 m3·s−1, Q50% = 25 m3·s−1, and Qflood = 55 m3·s−1). However, in the figures below, for the sake of simplification and space in this paper, we present only the results of the numerical modelling for the channel-central profile at discharge Qflood = 55 m3·s−1. In addition, as it was mentioned before, this discharge was the flood we recorded during our onsite measurements. This was the flood for which we recorded bed load transport (shear stresses were higher than initial shear stresses for entrainment) and for which we validated the 2D model. So, in Figure 6, Figure 7, Figure 8, Figure 9 and Figure 10 and in Table 2, one will find only results for Qflood = 55 m3·s−1. However, Figure 11 presents all of our findings for all analyzed discharges, including t-year floods Q1%, Q10%, Q50%, and Qflood. They are presented here and subsequently discussed.

4.1. Detailed Results and Discussion for Qflood

First, the hydrodynamic parameters affecting bed load transport were analyzed. Next, the changes in the stream channel bed and the river bed formation processes that cause these changes, simulated by the CCHE2D model, were described [50,51]. Finally, an analysis of the compatibility of the CCHE2D model with Hjulström’s and Shields’ diagrams and Russian standard ST-24-2396, which inform of the possibility of the occurrence of the given bed formation process in the channel, was performed [38,39,40,44,55].
During the numerical modelling of morphological changes and the vertical plan of the watercourse channel at flood flow Qflood = 55 m3·s−1 (Figure 6) the most extensive changes in the river bed system were found in the channel-central section, which is associated with the main current flowing here and higher values of hydrodynamic parameters, causing the bed load movement. Along reach L = 30–35 m, the bed load transported by the block ramp, which was located above the investigated part of the channel, was deposited. Along reach L = 35–50 m, erosion of the proximal part of a (sand) bar I and a washout of its top (ΔH = −0.10 m) were observed. A major portion of the moved rock material was deposited on the distal side of (sand) bar I and in its slipstream (L = 50–88 m). The accumulation rate in this place decreased along the channel and was ΔH = 0.10 m along reach L = 55 m and ΔH = 0.01 m along reach L = 80–88 m. The bed load material traction rate in the area of bar I reached the value of Tc = 2.00 kg·s−1, while in the vicinity of the block ramp, it dropped to Tc = 0.21 kg·s−1.
On the block ramp, bed load transport (no erosion or sedimentation) of Tc = 0.25 kg·s−1 was observed. This value was slightly higher than in the channel above the structure (Tc = 0.21 kg·s−1), because along reach L = 89, 90 m there was erosion (ΔH = −0.04 m). It was most likely caused by a calculation error of the system, which arose at the boundary between two erosion layers [55].
Immediately downstream from the structure, along a short reach (L = 111, 112 m), the bed load was deposited, which may be associated with erosion layer modification at the river bed, where the model misinterprets the bed load transport conditions. At a further distance, along reach L=113–160 m, erosion was observed, but its extent varied. At some sections of ca. 10 m, this extent amounted to ΔH = −0.10 ÷ −0.12 m, but between these, there were short sections (up to 1 m) of low or even negligible erosion of Δ ≤ −0.01 m. The process of larger and smaller extents of erosion sequences (of transport rate Tc = 1.75 kg·s−1) observed in the region of the channel was analogous to the processes observed with other simulated flows. Only at the flow lower than Q50% = 25 m3·s−1 (Tc = 0.33 kg·s−1), due to its lower value and weaker force moving the loaded particle, was the sequence of erosion and aggradation of rock material observed (Figure 6).
Along reach, L > 160 m, the process of accumulation of transported pebbles was found (ΔH ≤ 0.06 m). Only immediately in front of the block ramp (located outside the investigated part of the channel) was marginal erosion of the river bed observed to the extent of ΔH = −0.01 m, which also might be connected with a change of river bed erosion zones.
Figure 7 illustrates bed load transport results obtained from the model simulation with the CCHE2D program. Before the modelling procedure input, data bed load material fractions values d < 0.025 m—15%, d = 0.035 m—35%, d = 0.045 m—25%, d = 0.055 m—55%, and d > 0.065 m—10% were specified. The simulation proved that all the fractions are subject to the same transport processes. If pebbles were activated, all the pebbles in the river bed, regardless of their size, were activated along with the distribution as specified in the initial conditions. According to Hjulström, this process should first govern the particles of a smaller diameter, then the bigger ones, and the largest ones in the end. The same takes place during sedimentation, when all the fractions are deposited in the river channel. The CCHE2D model, then, deals with mass transport, which does not take account of the river water flow velocity fluctuations in the channel.
To perform a numerical simulation analysis comparing bed load transport and morphological changes of the river bed with the transport phenomena defined by Hjulström’s and Shields’ methods [39,40], the longitudinal profile was divided into nine reaches (segments) so that the values of mean velocity and shear stress in a given segment were close to each other. The division of individual reaches along with their hydrodynamic characteristic are as follows:
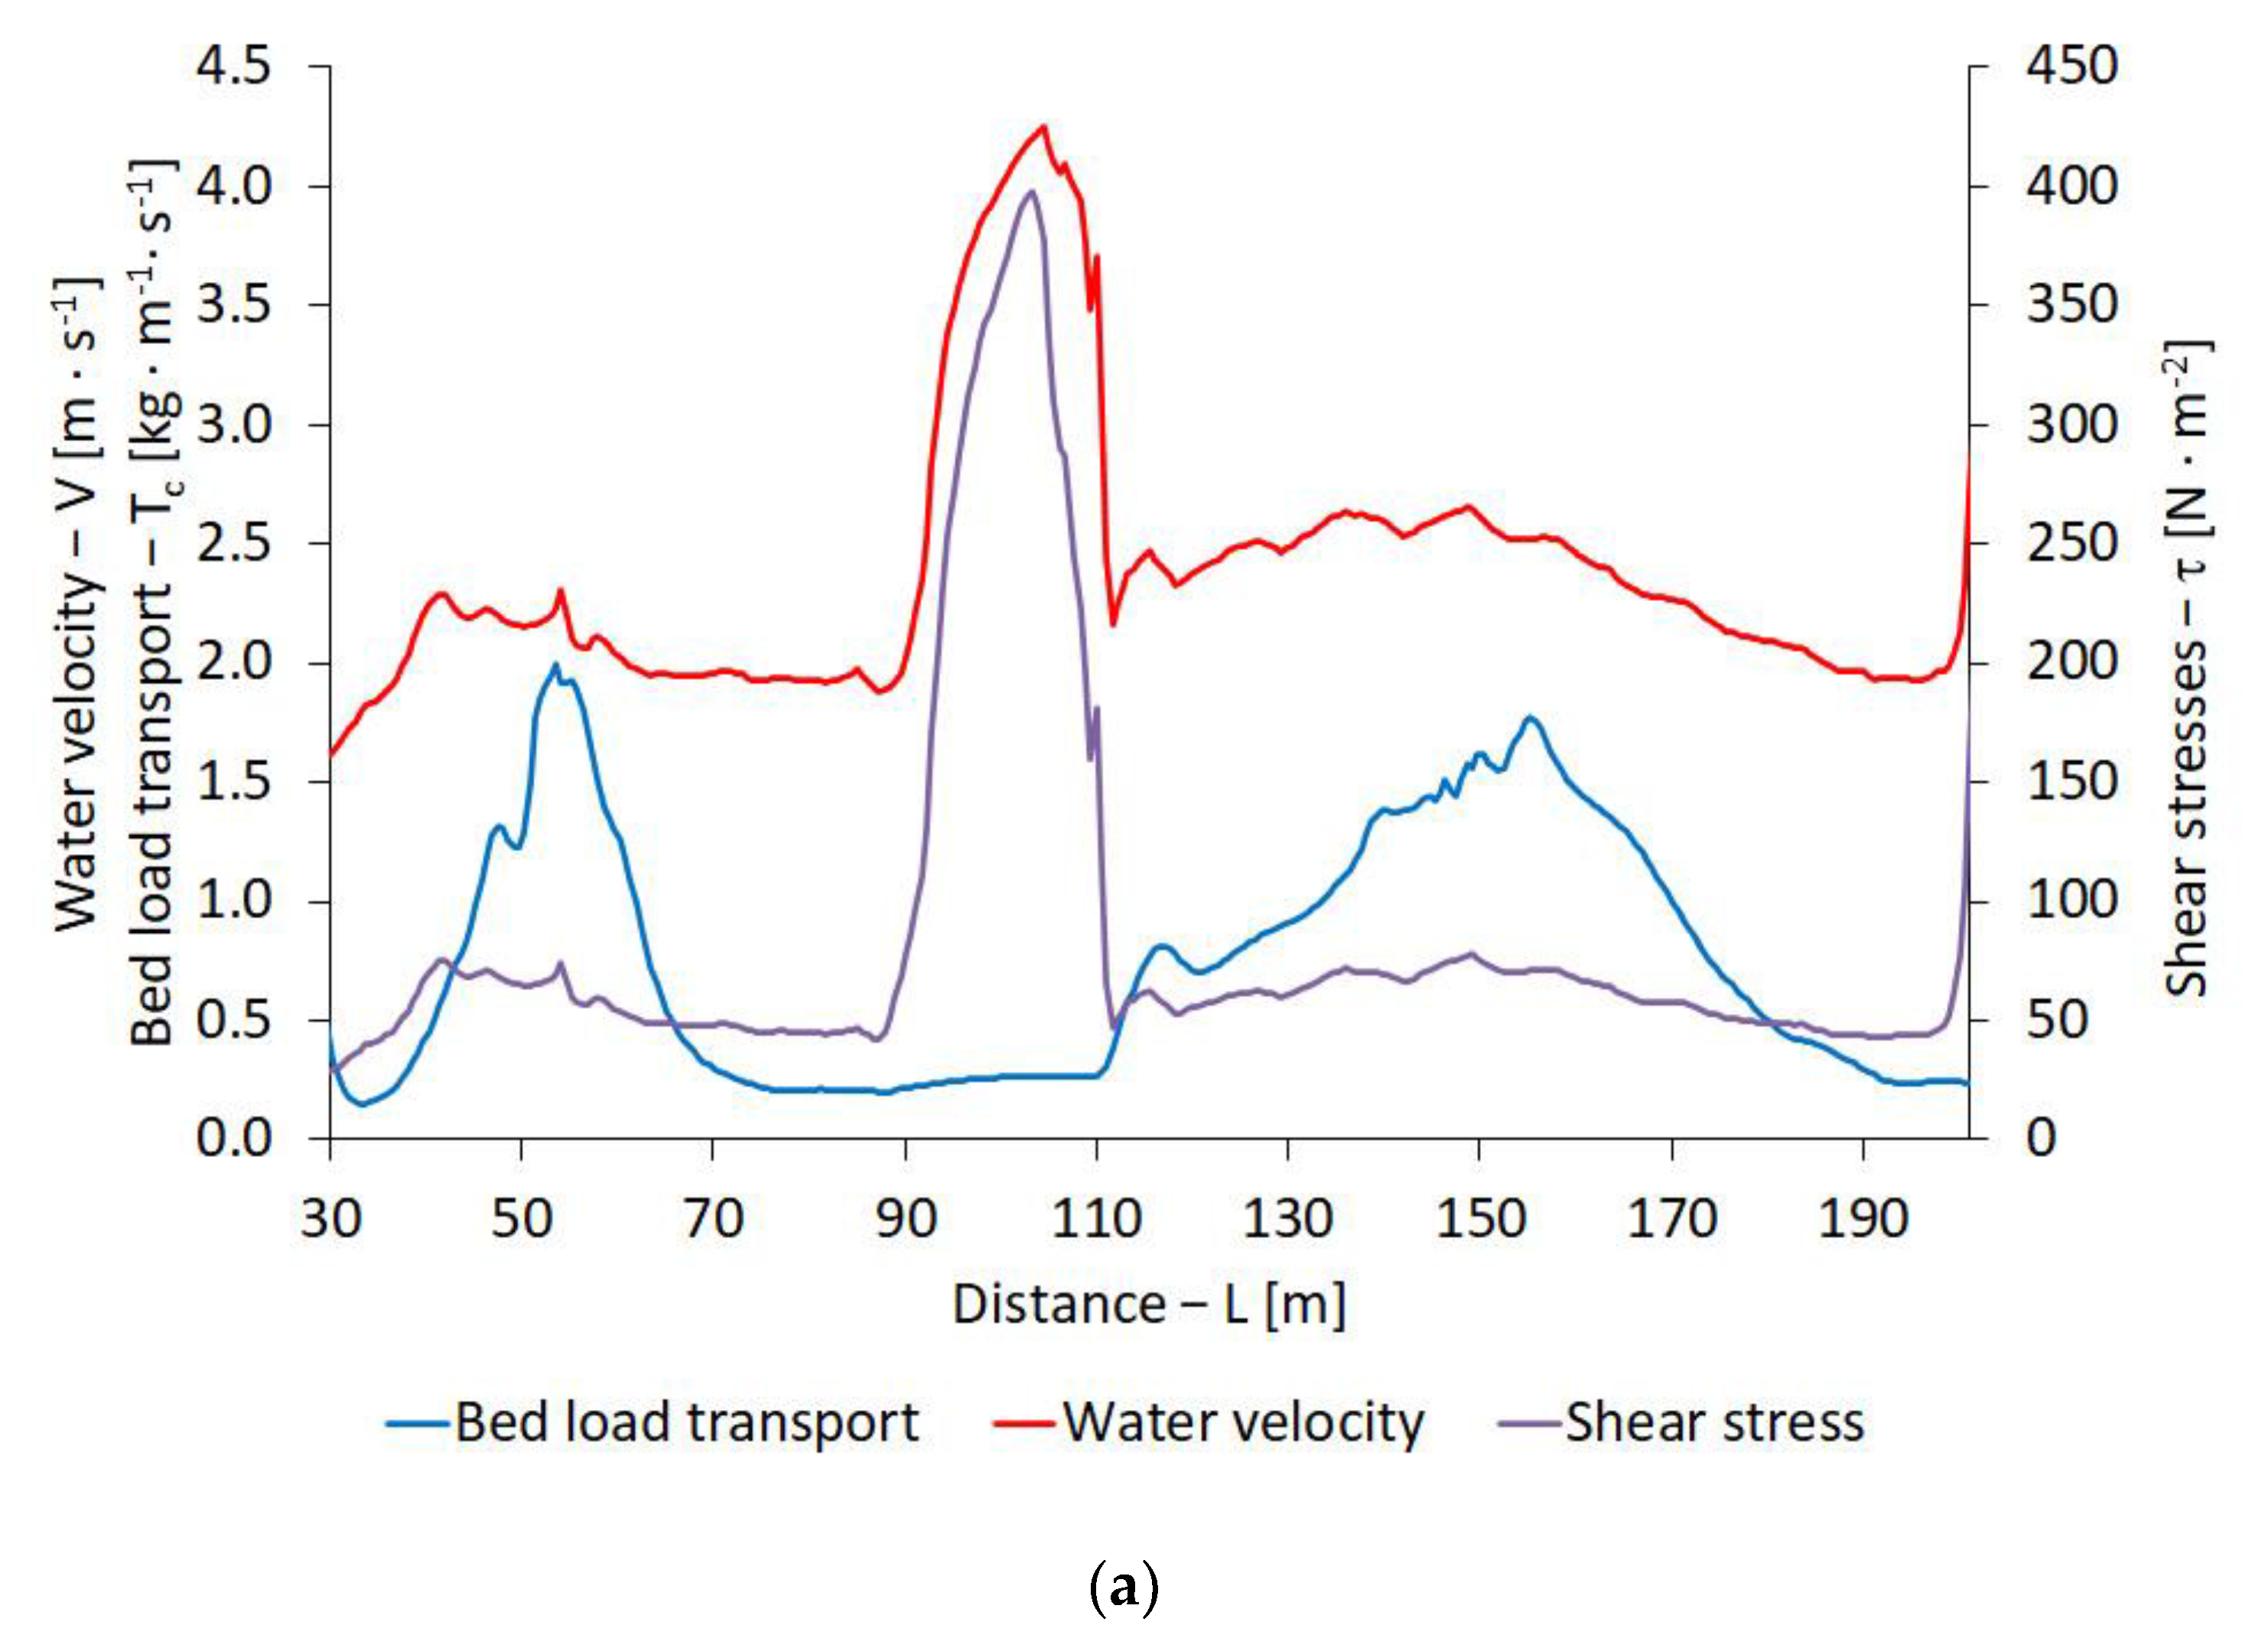
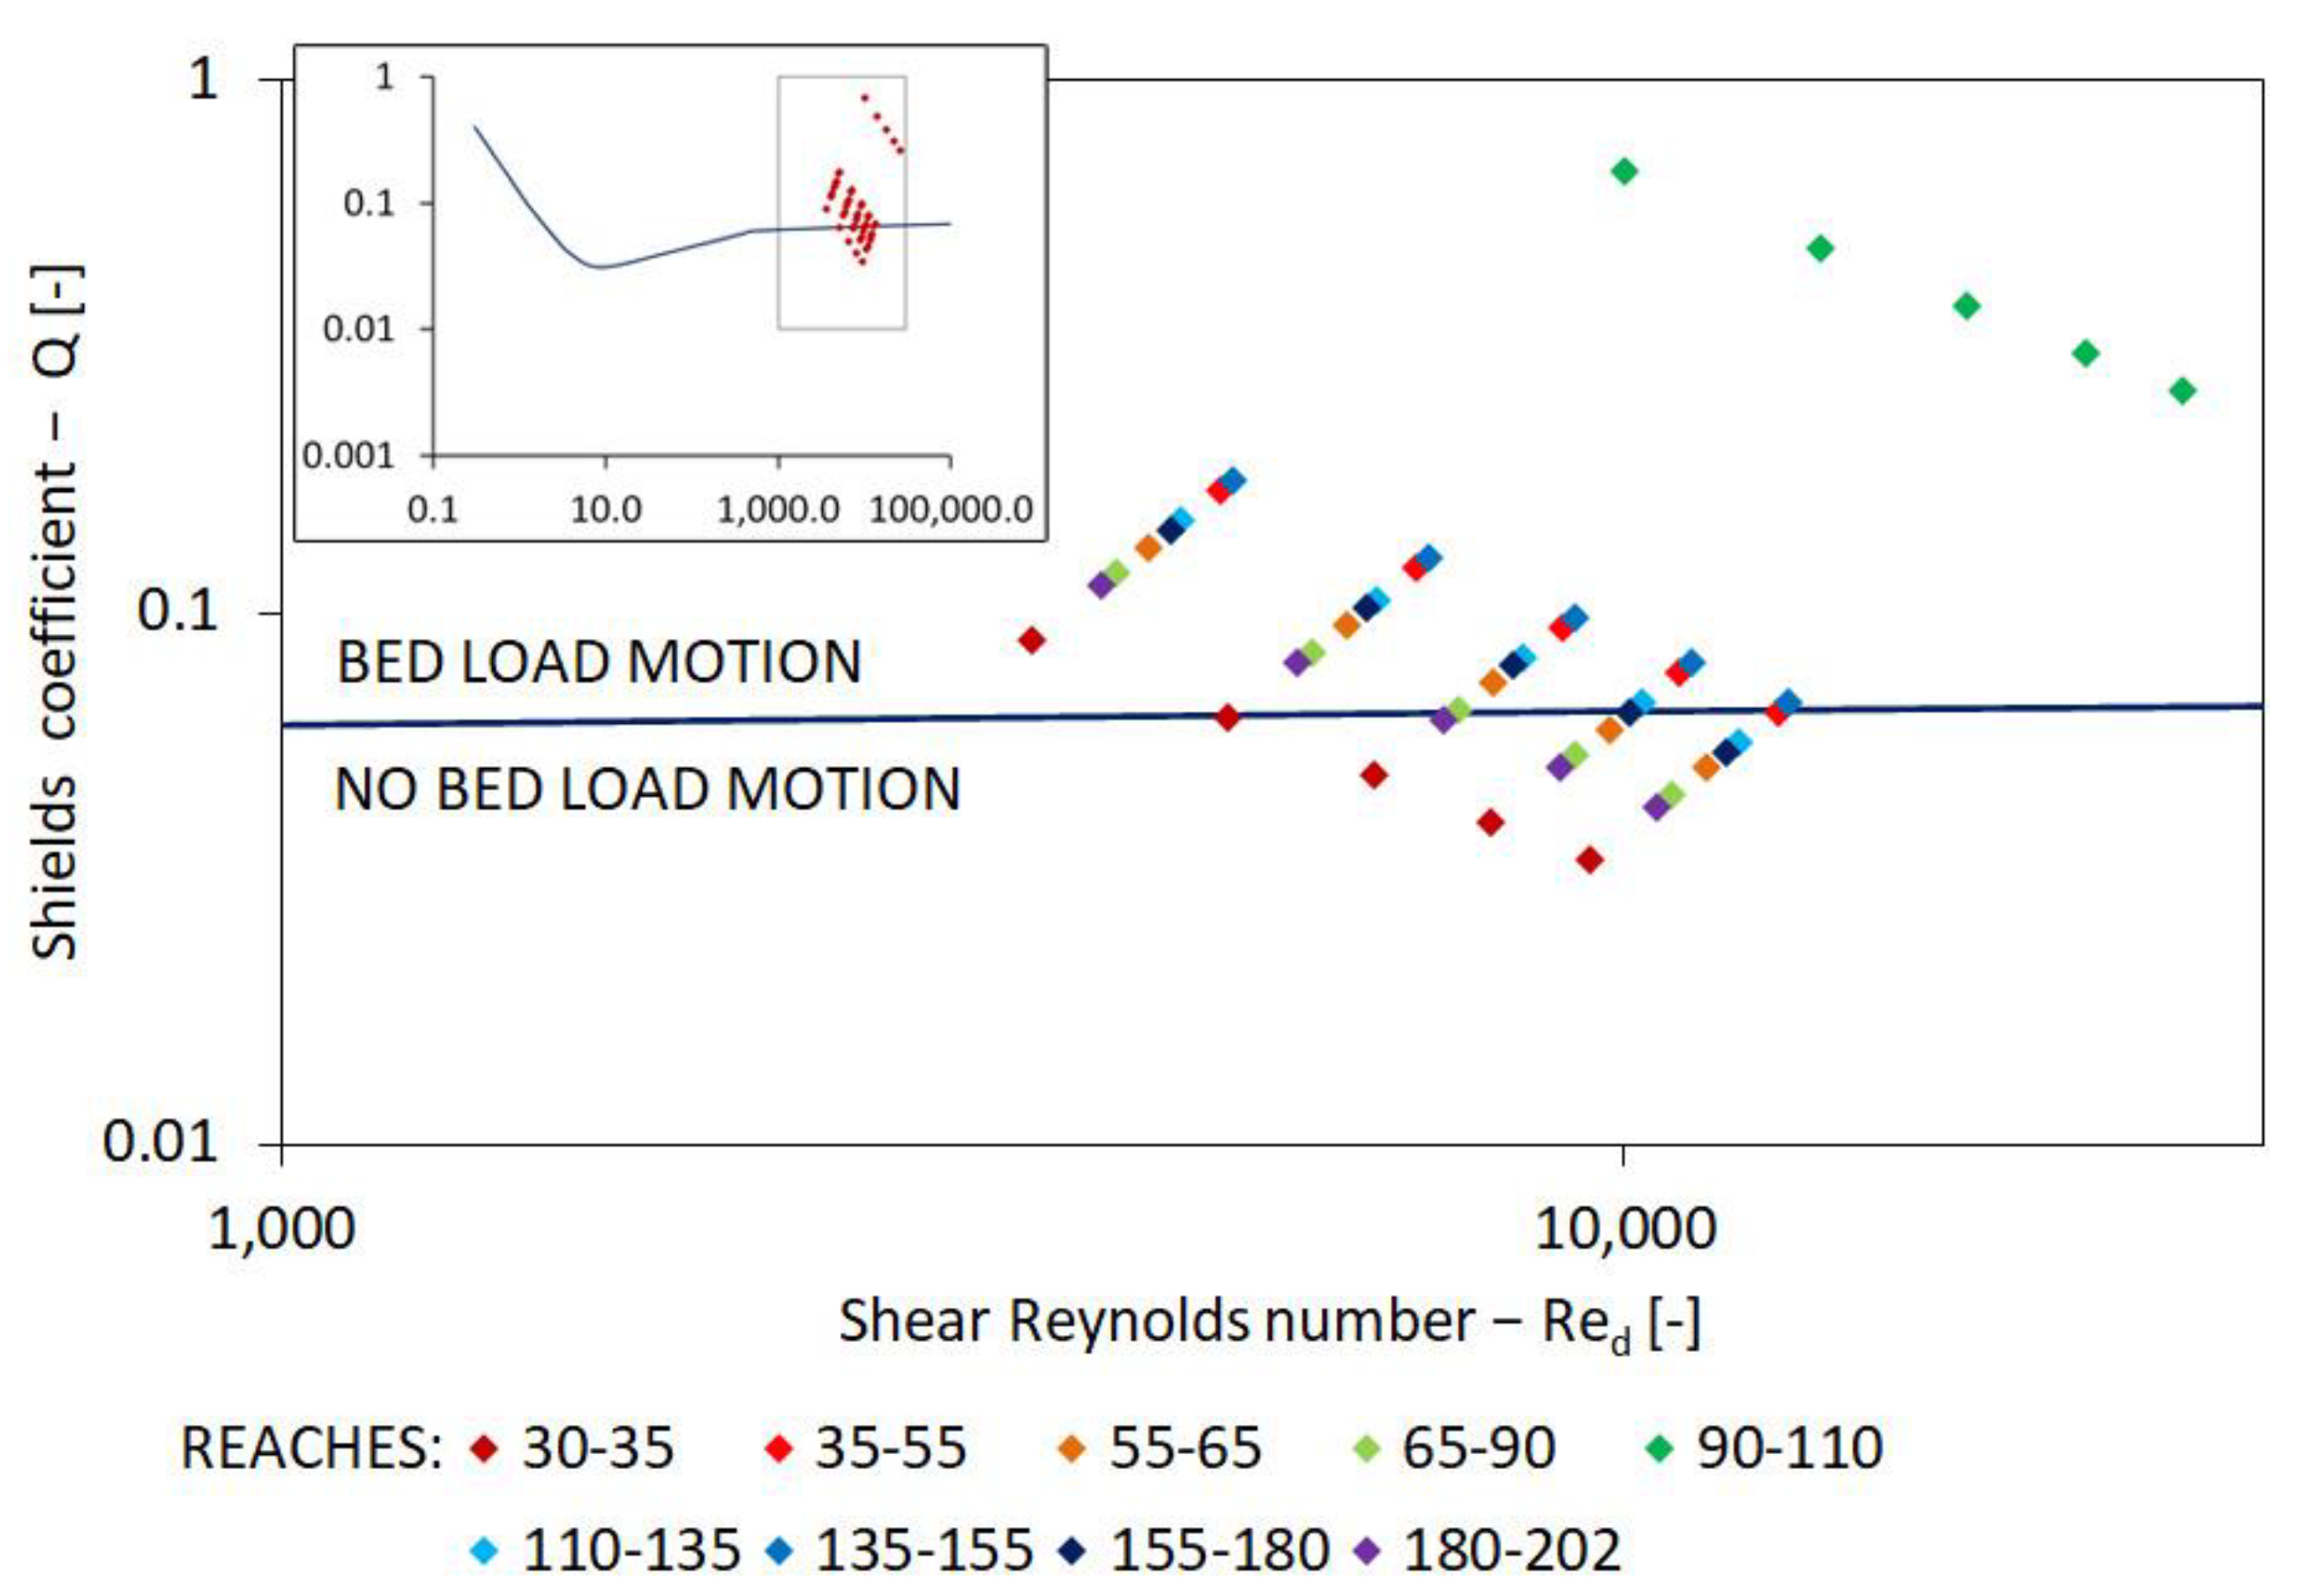
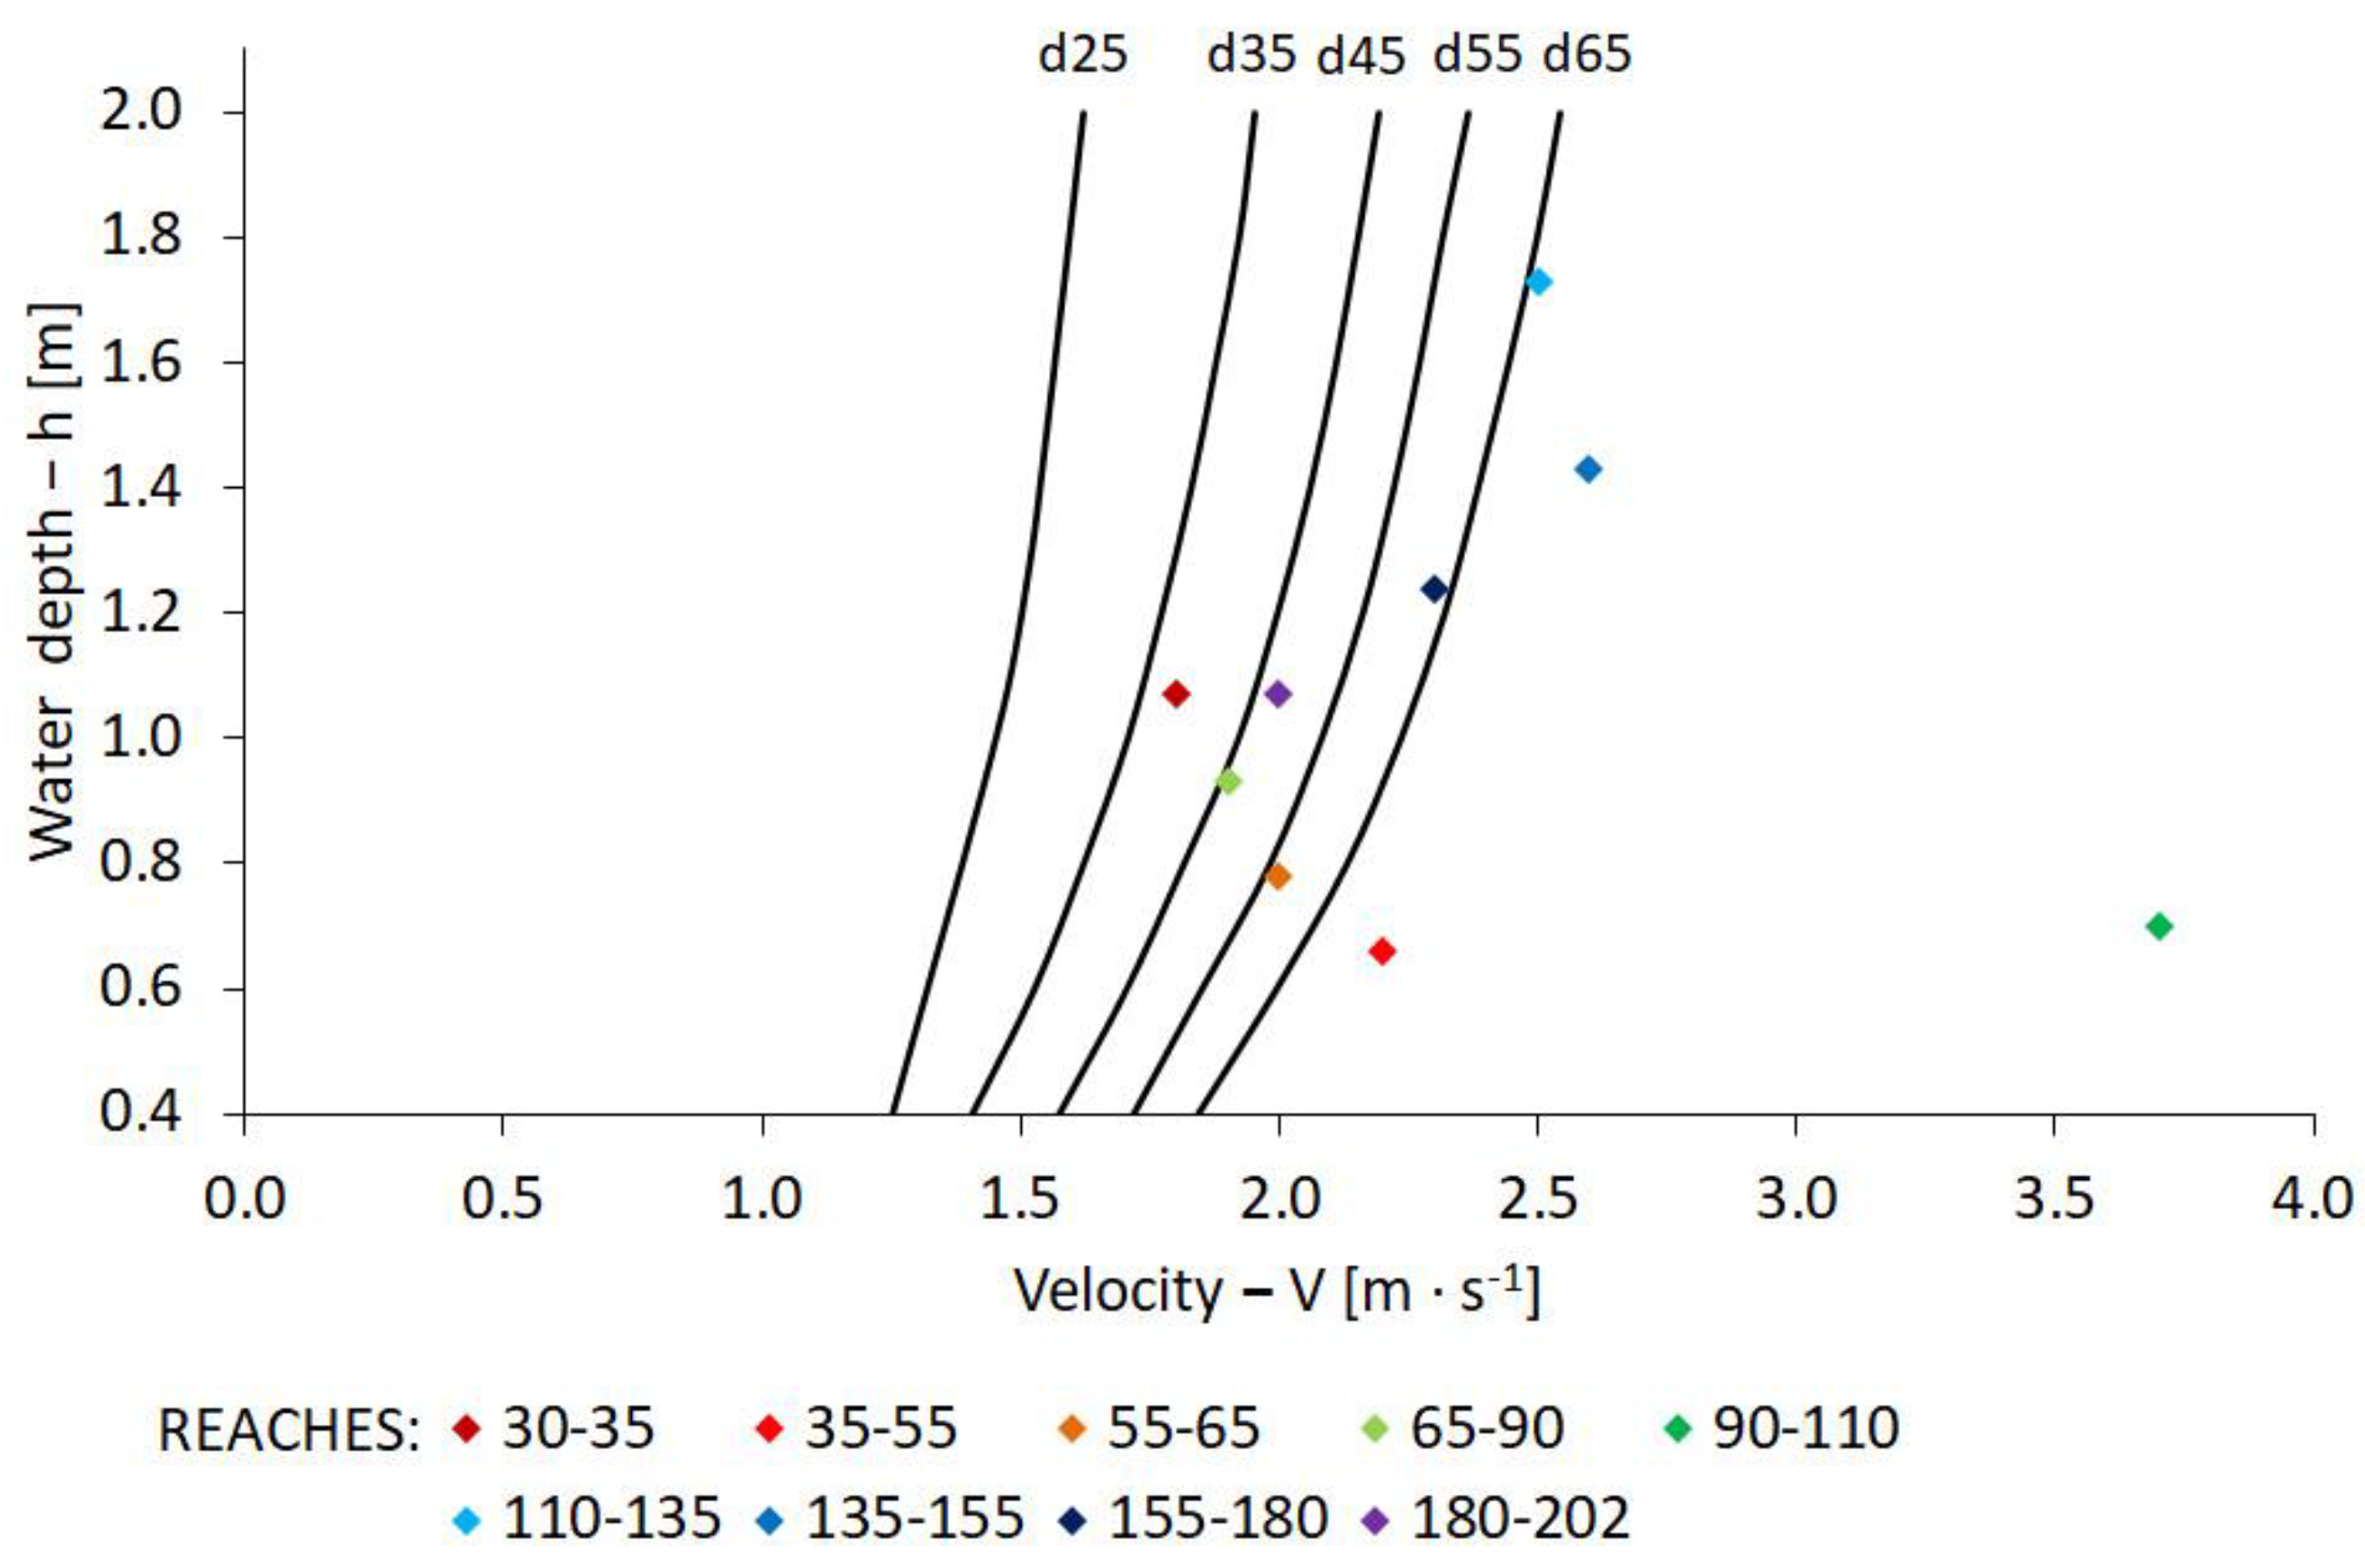
  • L = 30–35 m, h = 1.07 m, V = 1.8 m·s−1, τ = 36 N·m−2;
  • L = 35–55 m, h = 0.66 m, V = 2.2 m·s−1, τ = 69 N·m−2;
  • L = 55–65 m, h = 0.78 m, V = 2.0 m·s−1, τ = 54 N·m−2;
  • L = 65–90 m, h = 0.93 m, V = 1.9 m·s−1, τ = 48 N·m−2;
  • L = 90–110 m, h = 0.70 m, V = 3.7 m·s−1, τ = 275 N·m−2—a reach with the block ramp No. 14;
  • L = 110–135 m, h = 1.74 m, V = 2.5 m·s−1, τ = 60 N·m−2;
  • L = 135–155 m, h = 1.43 m, V = 2.6 m·s−1, τ = 72 N·m−2;
  • L = 155–180 m, h = 1.24 m, V = 2.3 m·s−1, τ = 58 N·m−2;
  • L = 180–202 m, h = 1.07 m, V = 2.0 m·s−1, τ = 46 N·m−2.
Next, the values of parameters averaged on an individual segment were compared with particle size distribution defined in the model (d = 0.025–0.065 m every Δd = 0.01 m), checking by means of Hjulström’s and Shields’ diagrams whether, along a given reach, the pebbles of particular diameters should be transported and whether this phenomenon was represented in the model. This helped to determine the usefulness of the numerical model for the simulation of bed load material in river channels with hydro-structures.
Referring to Hjulström’s diagram (Figure 8), it can be stated that along reach L = 30–35 m, pebbles of a diameter of d ≤ 0.055 m should be transported, while particles larger than d ≥ 0.065 m should be deposited [55]. According to the CCHE2D model, the material of all the observed fractions was deposited (Figure 8).
Along the next analyzed reach (L = 35–55 m), there should be an erosion of fine particle load (d ≤ 0.025 m) and pebbles of a diameter of d ≥ 0.035 m should be transported. In the model, the erosion is reflected and the mobility of bed load material of the entire diameter distribution was observed in the channel (d = 0.025–0.065 m; Figure 8).
Along reach L = 55–65 m, bed load transport was observed while, according to the numerical model, sedimentation took place. The velocity in this segment was V = 2.00 m·s−1 and was slightly lower than in the previous segment (L = 35–55 m, V = 2.20 m·s−1), where erosion was detected. It can be concluded that the computer program responded to velocity fluctuations and the tendency to increase or decrease rather than its value. Along reach L = 65–90 m, again on the basis of the model, sedimentation was observed in spite of the fact that, following Hjulström’s diagram [39], only coarse material d ≥ 0.065 m in diameter should be subject to sedimentation, while pebbles of a diameter smaller than d ≤ 0.055 m should be transported.
On the block ramp (L = 90–110 m) there should be erosion, but the construction of the object from oversized boulders prevented the observation of it in the model conditions, in which the inflowing bed load was transported to the object and was later deposited downstream from it.
Downstream from the structure (L = 110–180 m), according to Hjulström’s diagram [39], on the entire channel length, there was erosion [55], and a fine-particle material motion was initiated while the coarse bed load was transported. These data were not compatible with the model results, according to which, along reach L = 110–155 m, there was erosion and load motion was initiated at mean velocity increasing from V = 2.15 m·s−1 to V = 2.55 m·s−1. On the other hand, when the velocity of the flowing water decreased (from V = 2.55 m·s−1 to V = 2.00 m·s−1), according to the model, the pebbles were subject to sedimentation and deposition at the river bed (reach L = 155–202 m).
Additionally, reach L = 35–55 m should be compared with reach L = 155–180 m. Using the data from the model in the former segment, river bed erosion and rock material motion initiation at an increasing velocity of V = 2.20 m·s−1 (from V = 1.85 m·s−1 to V = 2.20 m·s−1) were observed. In the latter segment, sedimentation was observed despite a higher velocity of V = 2.30 m·s−1, but with a decreasing tendency (from V = 2.55 m·s−1 to V = 2.10 m·s−1).
Following the data presented in Shields’ diagram [40] (Figure 9) it can be stated that, in the first analyzed reach (L = 30–35 m), the majority of pebbles should be subject to sedimentation (d ≥ 0.035 m) [44]. Only particles smaller than d < 0.035 m could, in real-life conditions, be transported. Compared with Hjulström’s diagram (Table 2), where pebble transport (for d = 0.025–0.055 m) is predominant, there is no compatibility between the two methods of establishing transport conditions [55]. In the CCHE2D model for this segment, sedimentation was observed. Such conditions would be the closest to the data presented in Shields’ diagram (Figure 9), if it were not for the accumulation of all the transported pebbles, regardless of their size (Figure 8), which the model does reflect.
Along the next analyzed reach (L = 35–55 m), according to the CCHE2D model, there was erosion and initiation of motion of the pebbles deposited at the river bed at an increasing flow velocity. According to Shields, bed load transport should be predominant (d ≤ 0.055 m) [44]. The analysis of the CCHE2D model, the classical approach compatibility on the basis of Shields’ diagram is less accurate than Hjulström’s diagram, because in the former there are fewer specified transport conditions. According to Shields [44,55], only transport or no transport can be distinguished, while according to Hjulström, there is still erosion [39,55]. This results in the finding that the process of bed load erosion reflected in the CCHE2D model can be attributed to transport conditions, according to Shields. This is the case of the described reach.
The next two analyzed reaches (L = 55–65 m and L = 65–90 m) have very similar river bed formation conditions in both the model approach and according to Shields. In the former, there is the sedimentation of the carried material. In the latter, there is the transport of fraction d ≤ 0.045 m and sedimentation of fraction d ≥ 0.055 m. It was therefore stated that the CCHE2D model and Shields’ diagram are not compatible for the two segments [44,49]. They could be compatible if the model did not accumulate all the transported fractions of bed load but would differentiate between them on the basis of hydrodynamic conditions in the stream channel.
Along reach L = 90–110, the block ramp is located. Due to the heavy inclination of the slope apron of the structure, the sediment should be transported from the upper side to the downstream.
Along the next reach, L = 110–135 m, the CCHE2D model reflected erosion of all the bed load fractions defined in the model. According to Shields’ diagram, transport of fine and medium fractions (d ≤ 0.055 m) and no movement of coarse fractions should be observed (d ≥ 0.065 m).
Along reach L = 135–155 m, erosion of the river bed was found in the CCHE2D model. According to Shields’ diagram, all the deposited fractions (d ≤ 0.065 m) should be transported. However, as mentioned before, Shields’ diagram does not make any distinction between transport and erosion conditions, as if they were assigned to a single phenomenon, which is transport. Hence, it was recognized that the mass transport of all the pebble particles (even coarse fractions) in Shields’ diagram might suggest fine sediment erosion, which is confirmed by the more precise Hjulström’s diagram. Consequently, it is the only segment in which the CCHE2D model can be considered compatible with Shields’ diagram.
Along the next two reaches (L = 155–180 m and L = 180–202 m), according to the CCHE2D model, sedimentation takes place at a decreasing flow velocity from V = 2.55 m·s−1 to V = 2.00 m·s−1. According to Shields’ diagram, both the transport of fine fractions (d ≤ 0.045 m for L = 155–180 m and d ≤ 0.035 m for L = 180–202 m) and a lack of movement of coarse-grained load (d ≥ 0.055 m and d ≥ 0.045 m, respectively) should be observed. No compatibility of the CCHE2D model with Shields’ diagram can be concluded since the numerical simulation indicated sedimentation of pebbles of all the sizes found in the channel [44,49]. Only along the last analyzed reach (L = 180–202 m) were significant differences between Shield’s and Hjulström’s diagrams found [39,40]. According to the latter, there should be no sedimentation, accumulation, or lack of bed load movement at all in this segment, as was the case in Shields’ diagram.
In reference to Russian standard ST-24-2396 [38] it can be stated that, along the first analyzed reach (L = 30–35 m), the model data do not coincide with those on the diagram (Figure 10). According to the standard, only particles smaller than d ≤ 0.035 should move while the other ones should be transported, and in the model, sedimentation of all the carried pebbles was observed. Along this reach, the data from the ST-24-2396 standard are the closest to the results obtained from Shields’ diagram [38,40]. In comparison with the data in Hjulström’s diagram, in turn, the ST-24-2396 standard results, similarly as in the case of Shields’ diagram, differ substantially [39,40].
Along the next analyzed reach (L = 35–55 m), the CCHE2D model can be considered in agreement with Russian standard ST-24-2396. However, this agreement may be encumbered by an error due to a lack of precise data in the standard. The model reflected erosion. In the standard, on the other hand, only the conditions in which bed load is transported and stabilized are specified, with no mention of erosion. That is why the model indicated bed load transport or its erosion. Then, in both cases, these phenomena were classified as transport in the Russian standard. According to Shields’ and Hjulström’s diagrams, the data from the standard can also be considered comparable. In comparison with Shields, there is a slight difference, that is, no statement of movement of the bed load’s coarsest fraction (d ≥ 0.065 m), which was not stated in the standard. Hjulström’s diagram, on the other hand, is more precise than the standard (zones of not only sedimentation and transport but also erosion observed), so the standard is also in agreement with it, although Hjulström’s diagram itself is not compatible with the CCHE2D model.
Along the next two reaches (L = 55–65 m and L = 65–90 m) numerical simulation indicated sedimentation. According to the ST-24-2396 standard, there should be various river bed formation conditions here. There should be deposition at the river bed and sedimentation of coarse-grained fraction carried from the upper parts of the channel (d ≥ 0.065 m for L = 55–65 m and d ≥ 0.055 m for L = 65–90 m), as well as fine-grained fraction transport (d ≤ 0.055 m and d ≤ 0.045 m, respectively).
Reach L = 90–110 m was located on the block ramp; therefore, due to very differentiated model conditions (different type of river bed than in other segments, high roughness rate, large inclination, etc.) the analysis of compatibility with the standard was not performed.
The analysis of next two reaches (L = 110–135 m and L = 135–155 m) indicated compatibility of the CCHE2D model with the ST-24-2396 standard [38,49]. In the model, grid erosion was observed in these places, while according to the standard, all the bed load fractions at the river bed should be transported (d ≤ 0.065 m). Despite the agreement of the two approaches, the analysis can raise some doubts, as the simulation model results indicating erosion in the channel had to be assigned to the transport conditions given in the standard. A similar case was that of reach L = 35–55 m.
Along the last two reaches of the analyzed channel (L = 155–180 m and L = 180–202 m) there was no compatibility between the CCHE2D model and Russian standard ST-24-2396. The numerical modelling indicated accumulation of the carried pebbles, while according to the standard transport, d ≤ 0.055 m was predominant for the former segment and d ≤ 0.045 m for the latter one.
Table 2. Summary of bed material conditions obtained based on Hjulström’s diagram, Shields’ diagram, the ST-24-2396 standard, and data from the model that were observed during the simulation carried out for the flow Qflood = 55 m3·s−1.
Central Profile Segment L [m]Transport Conditions for Individual Pebbles
According to Hjulström’s Diagram
d [mm] 1
Transport Conditions for Individual Pebbles
According to Shields’ Diagram
d [mm] 2
Transport Conditions for Individual Pebbles
According to Russian Standard
ST-24-2396
d [mm] 3
Transport Conditions According to the CCHE2D Model for Bed Load 4Compatibility of the
CCHE2D Model with Hjulström’s Diagram 5
Compatibility of the
CCHE2D Model with Shields’ Diagram 6
Compatibility of the
CCHE2D Model with
ST-24-23967 Standard 7
Erosion—ETransport—TSedimentation—STransportNo TransportTransportNo TransportMorph DynamicV [m·s−1]
30–35-25–55≥65≤25≥35≤35≥45S↑ 1.60–1.85none *none *none *
35–55≤25≥35-≤55≥65≤65-E↑ 1.85–2.20nonenone *yes
55–65-25–65-≤45≥55≤55≥65S↓ 2.20–1.95nonenonenone
65–90-25–55≥65≤45≥55≤45≥55S↔ 1.95–1.95none *nonenone
90–11025–65--≤65-≤65-T----
110–135≤35≥45-≤55≥65≤65-E↑ 2.15–2.55none *none *yes
135–155≤45≥55-≤65-≤65-E↔ 2.55–2.55none *noneyes
155–180≤25≥35-≤45≥55≤55≥65S↓ 2.55–2.10nonenonenone
180–202-25–65-≤35≥45≤45≥55S↓ 2.10–2.00nonenonenone
1—Summary of transport conditions (erosion, transport, and sedimentation) for individual pebbles after Hjulström’s diagram; d [mm]—diameter of individual pebbles; 2—summary of transport conditions (sediment movement or lack thereof) for individual pebbles after Shields’ diagram; d [mm]—diameter of individual pebbles; 3—summary of transport conditions (sediment movement or lack thereof) for individual pebbles after Russian standard ST-24-2396; d [mm]—diameter of individual pebbles; 4—summary of transport conditions (erosion, transport, and sedimentation) for sediment after the CCHE2D model and velocity ranges at the beginning and end of a segment: E—erosion of the watercourse channel; T—transport, traction of pebbles; S—sedimentation, accumulation of carried material; ↑—velocity increase in an individual segment of channel; ↔—no velocity increase/decrease in an individual segment of channel; ↓—velocity decrease in an individual segment of channel; 5—established compatibility of transport conditions presented by the CCHE2D model with the conditions specified based on mean velocity obtained from numerical simulation using Hjulström’s diagram; 6—established compatibility of transport conditions presented by the CCHE2D model with the conditions specified based on shear stresses obtained from numerical simulation using Shields’ diagram; 7—established compatibility of transport conditions presented by the CCHE2D model with the conditions specified based on critical water depth and flow velocity using the Russian ST-24-2396 standard; *—in the CCHE2D model, river bed formation processes are simulated using all fractions in the channel of the modelled stream. This makes an unambiguous evaluation of compatibility difficult, as only part of the sediment fraction confirmed the agreement of the model with the classical approach, and part contradicted it.
The performed analysis allows us to state that the CCHE2D model cannot be used for predicting changes in the composition and morphology of a watercourse bed in the area of a riprap block ramp. The analysis of results of a model simulation of the above-mentioned changes indicates that the CCHE2D model does not cover any commonly known physical laws related to bed load particle traction.
The comparison of hydrodynamic parameters (first of all, flowing water velocity, shear stresses, and water depth, which determine transport conditions in the channel) obtained from the numerical simulation with relationships developed by Hjulström, Shields, and those in the Russian ST-24-2396 standard [38,39,40] expressly indicates that the values of these parameters do not determine these conditions. According to Hjulström, in the case of pebbles of diameter d = 0.025–0.065 m (defined on the model grid as bed load), their movement should be initiated after V = 2.05–2.90 m·s−1 has been exceeded, and their transport should be observed after V = 1.37–1.90 m·s−1 have been exceeded. However, there is no such relationship observed on the model grid. Frequently, at the same mean velocity values, there were varied and sometimes even opposite conditions from sedimentation, through transport and erosion of the river bed. The lack of response of the model to the values of the studied parameters was confirmed by the data presented in Shields’ diagram and that of the ST-24-2396 standard, which, concerning the conditions in the watercourse channel, usually correlated with the data on Hjulström’s diagram. The values of dimensionless critical stresses (Shields’ coefficient) obtained from the calculations from model shear stresses indicate that the model does not respond to the values of these parameters, either. It was similar to the ST-24-2396 standard, in which the relationship of boundary depth and flow boundary velocity for given bed load fractions also confirmed the lack of response to the values of hydrodynamic parameters obtained from numerical modelling.
Therefore, it is necessary to consider what processes affect the sediment entrainment and transport of pebbles in a watercourse channel if it is not the values of the key hydrodynamic parameters. From the observations, it follows that it is the variations of mean velocity and the tendency to increase or decrease. It was often found that if the mean velocity values increased, regardless of the velocity value itself, pebbles were washed out of the bed, pulled out, and activated. When the velocity values decreased, the transported material was most frequently deposited in the channel (regardless of the velocity value itself). When the velocity remained stable, most often, the rock material was transported (if the transport was initiated upstream) or its sedimentation took place, and when no sediment was delivered, there were no modifications of the river bed (no erosion, no sedimentation).

4.2. Results and Discussion for Q1% Q10%, Q50%, and Qflood

The compatibility of the CCHE2D model, depending on the simulated flow, ranges from 0% to 50% (Figure 11). It decreases with a flow increase from Z = 46–50% for flow Q50% = 25 m3·s−1, reaching a very low value of Z = 11–23% for flow Qflood = 55 m3·s−1. The poorest compatibility was observed for flow Q10% = 90 m3·s−1, with its value in the range of about Z = 0–22%. As the flow increased, the model compatibility increased to the value of Z = 23–44% for flow Q1% = 190 m3·s−1. Higher values of model compatibility at lower flows (Q50%) are caused by the prevalence of sedimentation processes in the modelled channel. Low values of hydrodynamic parameters obtained from numerical modelling were often not high enough to trigger the movement or even transport the pebbles deposited at the river bed, a finding which was also partly confirmed by Hjulström’s and Shields’ diagrams and the ST-24-2396 standard. The reverse takes place at high flow (Q1%), when, according to Hjulström, Shields, and the ST-24-2396 standard [38,39,40], mass transport of all bed load fractions should be observed. The CCHE2D model, on the other hand, reflects differentiated river bed formation processes, that is, erosion, transport, and even sedimentation. In the case of mean flows (Qflood, Q10%), the compatibility is the lowest since, in Hjulström’s [39,55] and Shields’ [40,55] diagrams and according to the ST-24-2396 standard [38], as well as in CCHE2D [49] model, the river bed formation conditions are the most differentiated but their rate and localization in the channel differ considerably. The lowest compatibility was noted when comparing the model results with the data obtained from Hjuström’s diagram. Its structure with three river bed formation processes (erosion, transport, and sedimentation), not just two as in Shields’ diagram and the ST-24-2396 standard, makes it the most restrictive method of evaluating the processes studied in model simulations.
It should also be noted that Hjulström’s diagram is a more precise tool for checking this kind of program [50,55]. It has an additional erosion zone distinguished, which is missing from Shields’ diagram and the ST-24-2396 standard. This is why in the analysis of the compatibility of the CCHE2D program, using Shields’ diagram and the ST-24-2396 standard, the transport and erosion processes observed in the model were compared only with the transport process in Shields’ diagram and the ST-24-2396 standard. This contributed to obtaining qualitatively poorer comparative data. On the other hand, the data obtained from Shields’ diagram and the ST-24-2396 standard most frequently overlapped with the data shown in Hjulström’s diagram [38,39,40]. In only very few cases, there was no compatibility between the three methods of determining river bed formation processes.
It might be noticed that a difference between the CCHE2D model results, classical approaches, and the morphological changes in a river channel is the process of sediment entrainment and sedimentation of individual bed load particles [55]. On the model grid, it was found that if pebbles were washed out of the river bed and made to move, the ones being moved were always those of every size present in the channel (d = 0.025–0.065 m). It should be remembered that in real-life conditions, however, in the case of nonhomogeneous bed load, the first pebbles to be moved are those of the biggest diameters because the forces that act on them cause them to slide against fine-grained sediment. When the sediment is homogeneous, the first pebbles to be moved are smaller ones, next to those bigger in size. A similar situation took place in the case of sedimentation, when the bed load of each fraction specified in the model was deposited. However, it is coarse material that should be deposited first, fine material next. In the CCHE2D numerical model, this type of phenomena was not observed in any of the cases. The unit rate of transport was, according to the model, close to the values obtained from calculations performed with Parker’s formula, although in the initial conditions, the value from calculations done with the MPM method was specified as MPM (Figure 12) [42,43,44,45].
The numerical modelling was performed for four discharges: Q50%, Qflood, Q10%, and Q1% (three t-year floods and one tested discharge). Generally, with their increase, the values of the model-based hydrodynamic parameters and those of vertical changes of the stream channel also increased. The transport phenomena most frequently occurred in the same place of the channel, although they differed in intensity and rate (Figure 13).
On the modelling grid, there were errors related to the varying bed channel. Block ramps were described as areas of non-erodible substrate because, otherwise, they were washed out and the river bed between the upstream and downstream position were completely levelled. The substrate downstream and upstream of the structure, on the other hand, was described as erodible. On the border of the two layers, there were errors in the modelling simulation of the erosion upstream of the structure and a big accumulation of the carried bed load.
Yeh et al. [48] stated in their paper on the numerical simulation of sediment transport and morphological changes of the upstream and downstream reach of the Chi-Chi weir that the CCHE2D model was modified to handle the bedrock erosion when they wanted to represent their erosion control structures. They also state that the bedrock erosion formula was modified to be feasible and applicable to the field engineering problem. We suggest that, in the future, the findings we present in this paper are taken into consideration to modify the model when working with ramp hydraulic structures (similarly to the results of Sklar and Dietrich [56,57] being adopted), especially with the large number of them. Research might be conducted on the basis of results obtained with the classical approaches analyzed in the present paper. So far (also similarly found in Yeh et al. [48]), the uncertainty of the data such as channel bed topography, sediment load, its composition, and bed material composition may affect the prediction accuracy of the numerical model.

5. Conclusions

The conclusions from the study are as follows:
  • Using 2D modelling for bed load transport calculations or the prediction of river bed morphological processes in a stream where block ramps are constructed must be safe and sometimes needs additional analysis.
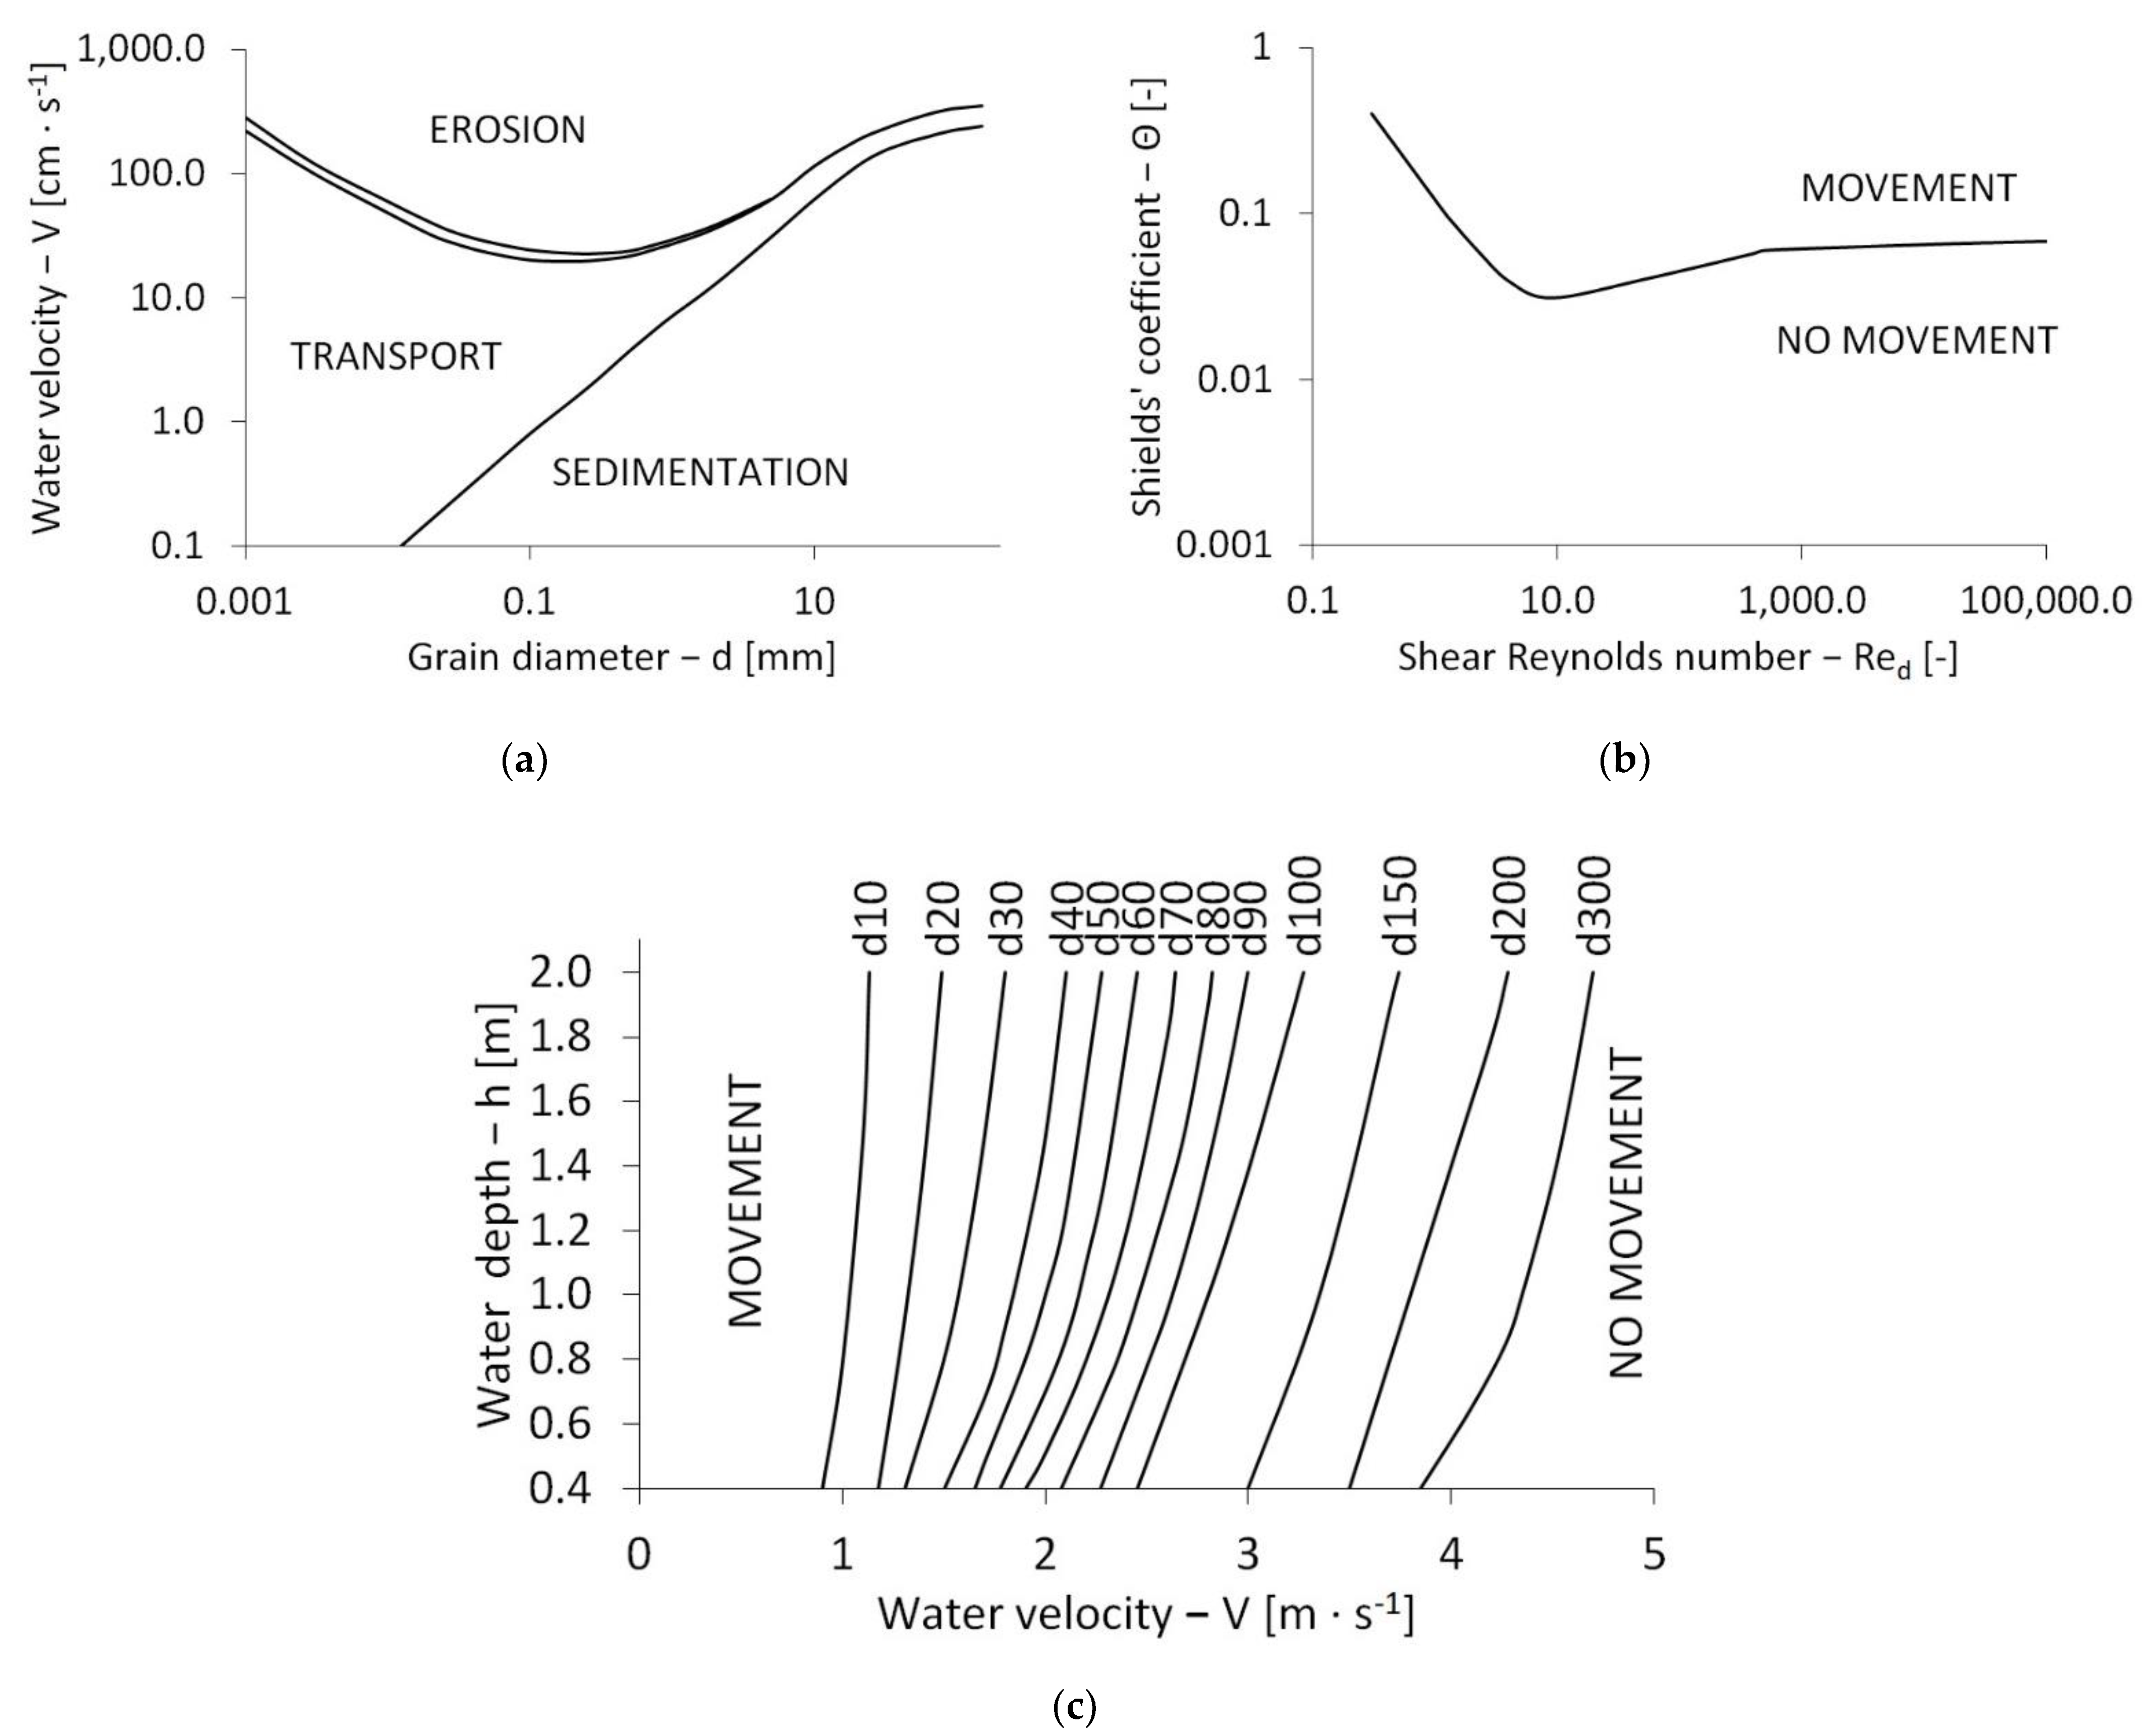
  • In hydraulic engineering, designing works is worthy of using some classical approaches such as those presented here, Hjulström’s and Shields’ diagrams and/or Russian standard ST-24-2396, which are classical tools for the analysis of bed load transport. All hydraulic structure designers and hydraulic engineers are supposed to be acquainted with at least one of those approaches.
  • Differences with classical approaches of Hjulström, Shields, and Russian standard ST-24-2396 and 2D modelling results might be due to uncertainty of the data, such as channel bed topography, sediment load, its composition, and bed material composition, possibly affecting the prediction accuracy of the numerical model.
  • Prediction of erosion, transport and sedimentation of bed load material, and calculation of the bed load transport rate in a gravel channel by means of a single numerical model, 2D in particular, such as CCHE2D, yields results that may be incompatible with in situ observations and predictions obtained using the classical approaches of Hjulström, Shields, or Russian standard ST-24-2396. For this kind of task, the use of at least two different models is suggested, supported by thorough quality control of the reliability of simulation results by making a comparison to in situ observations of morphological changes in the stream channel. It should also be remembered that the model is a simplification of the processes observed in reality. Therefore, the results obtained from modelling will never be perfectly compatible with classical methods and with reality.
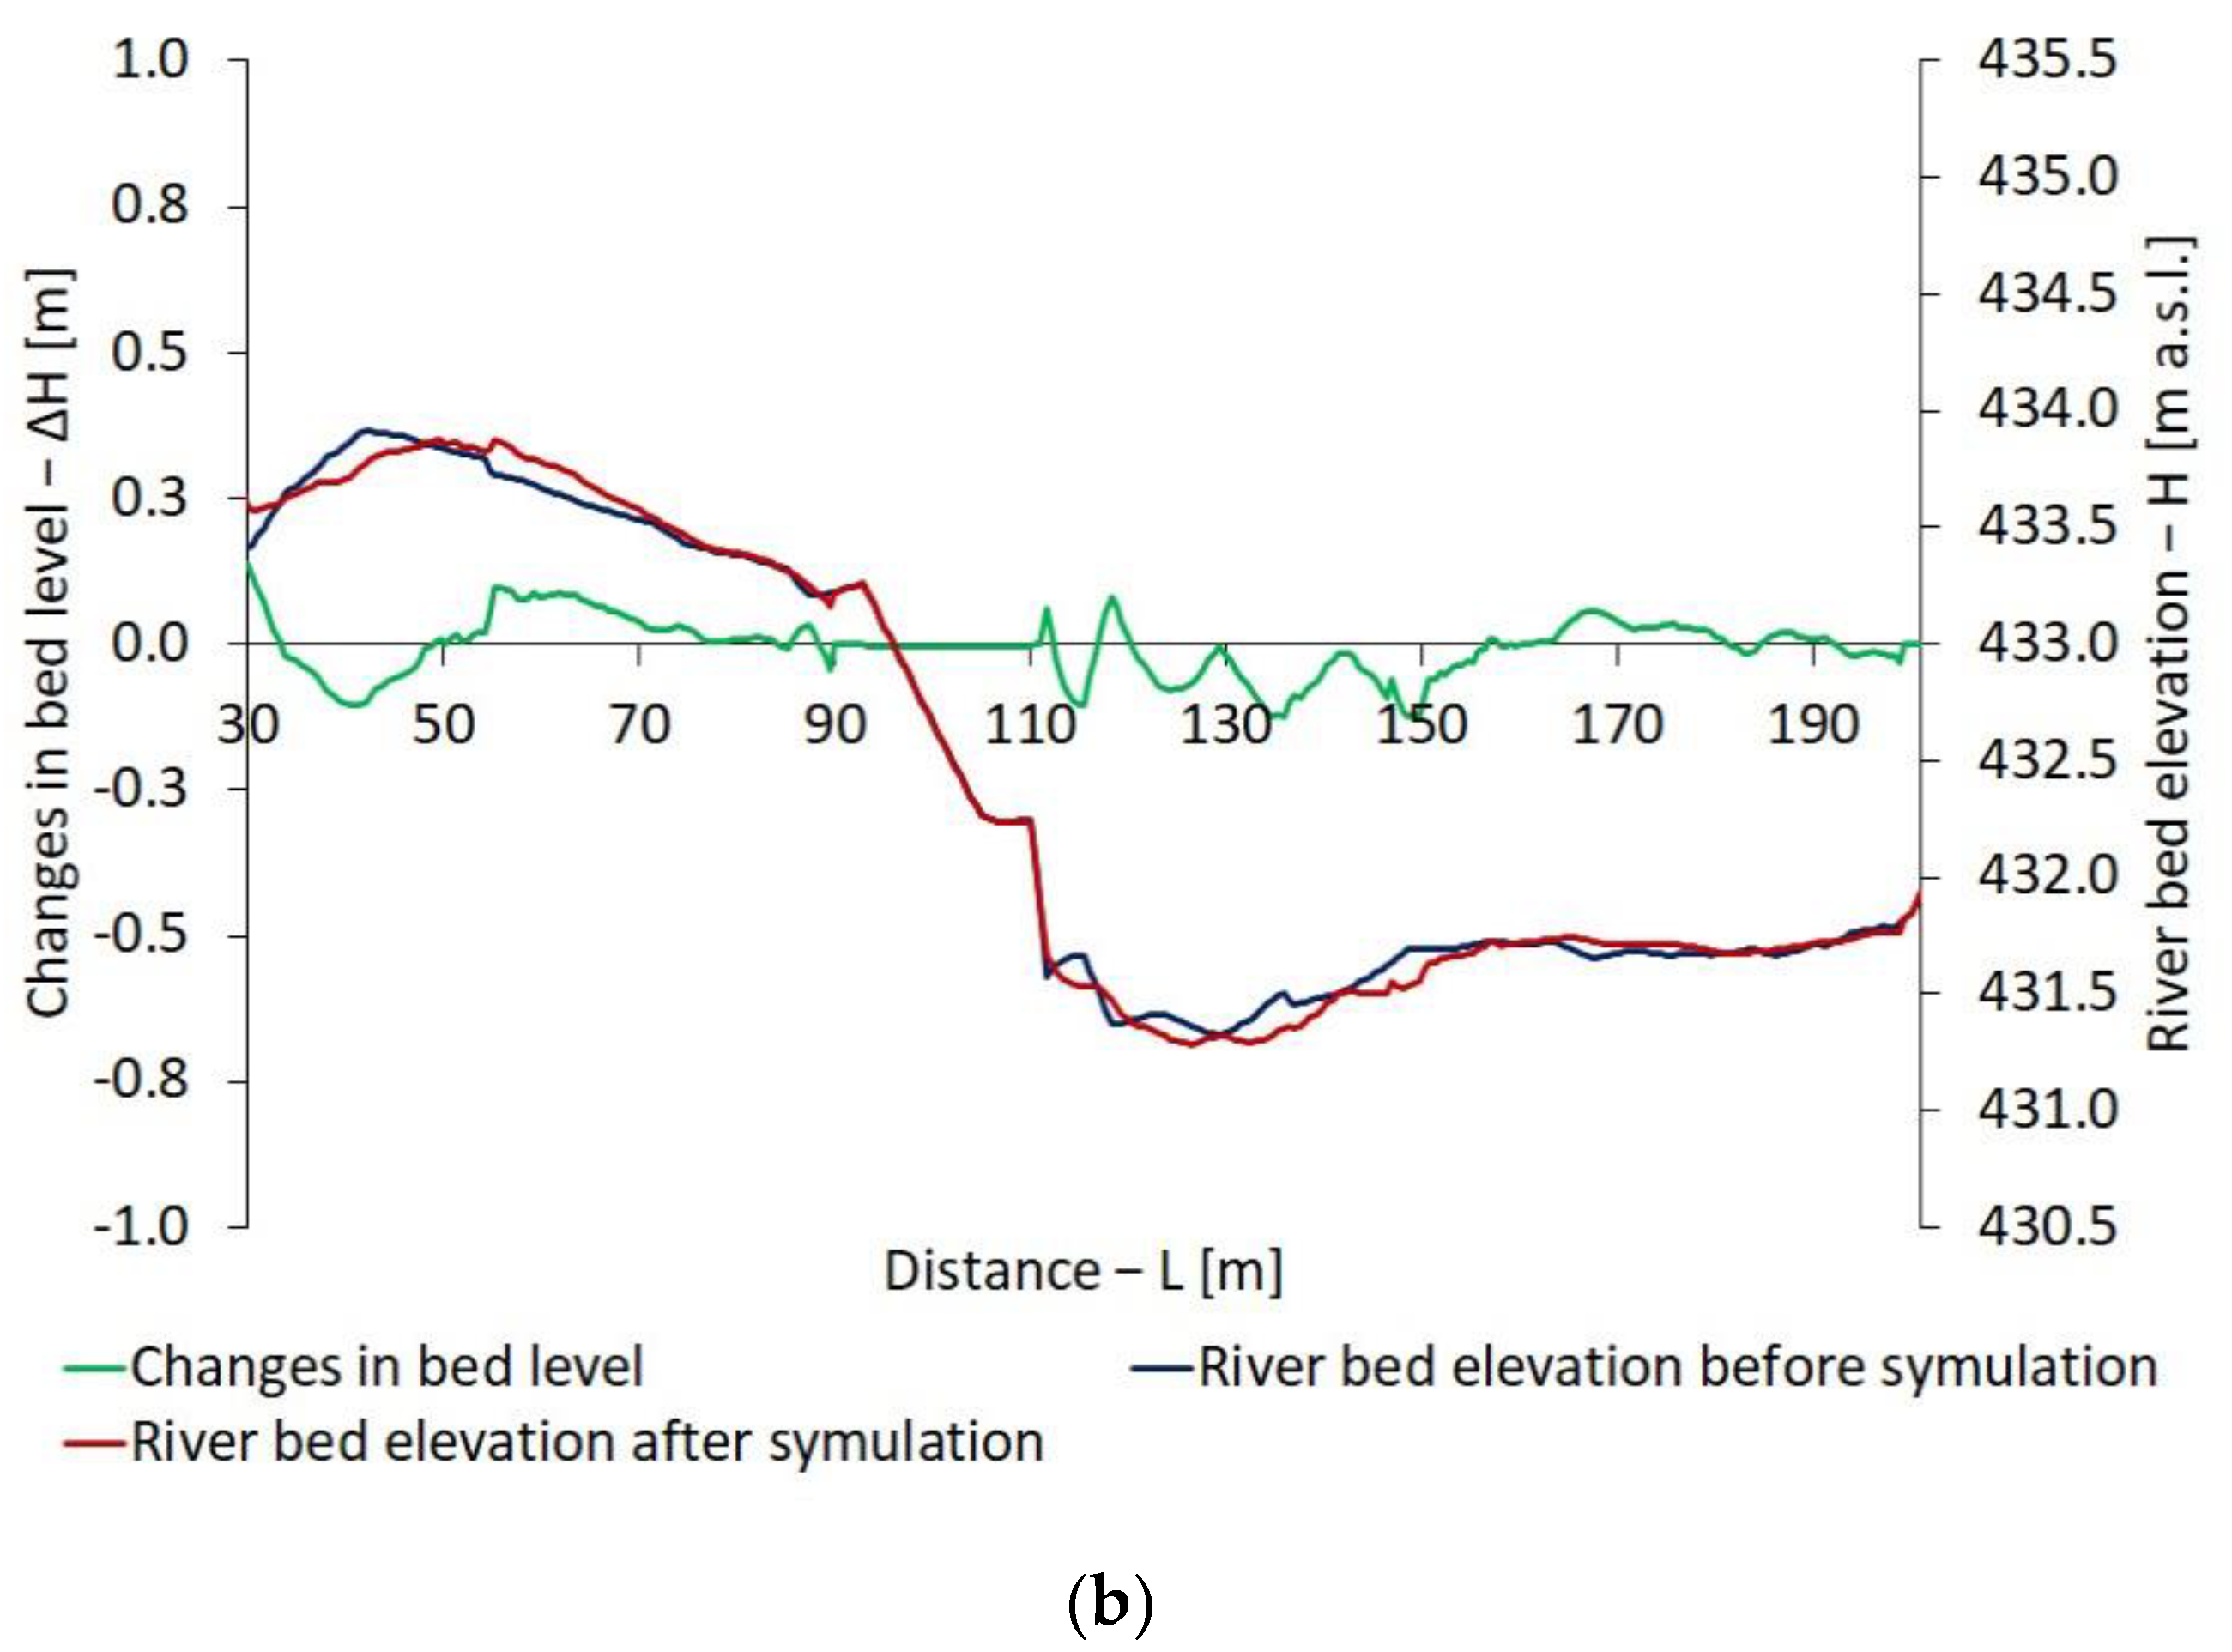
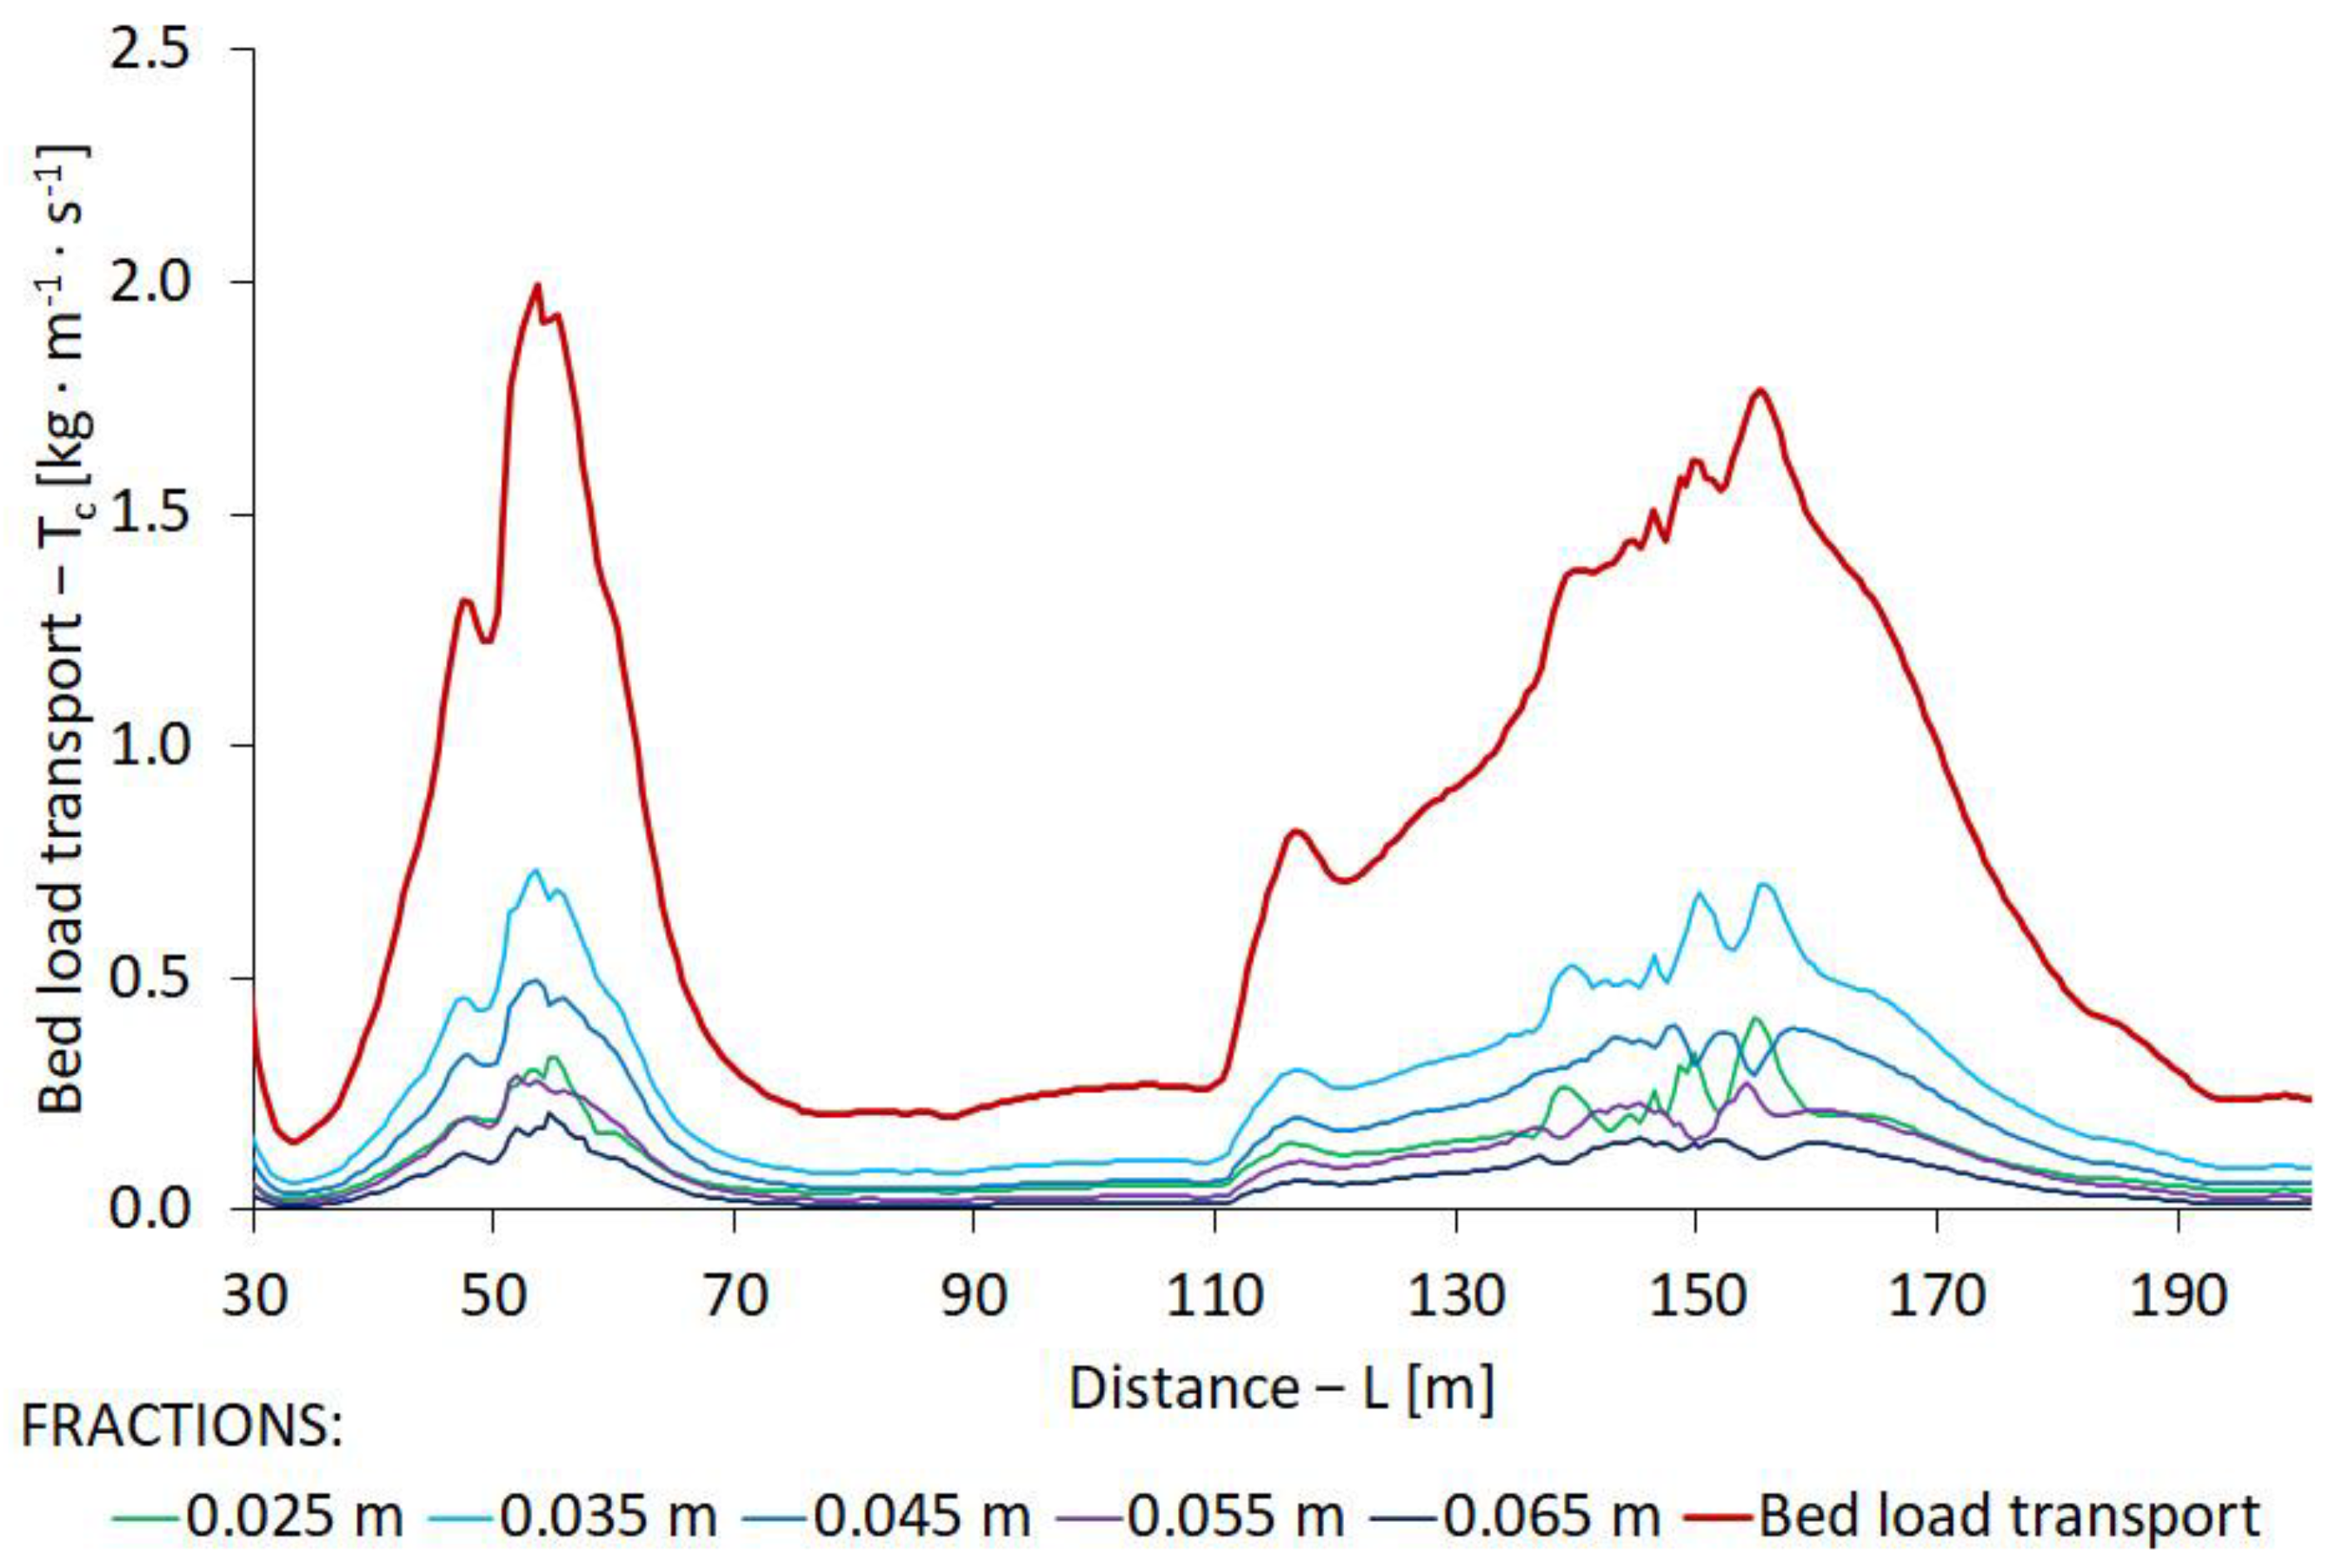
  • All sediment processes occur in the analyzed reach of the river. The highest values of hydrodynamic parameters (from V = 2.7 m·s−1 to up V = 5.1 m·s−1, from τ = 250 N·m−2 to up τ = 560 N·m−2 for Q50%–Q1%, respectively) occur in the block ramp. All gravel flowing into the structure should be transported downstream, primarily through the central lowering of the slope apron. However, the amount of sediment transported by the block ramp is relatively low (from Tc = 0.3 kg·m−1·s−1 to up Tc = 5 kg·m−1·s−1) because a small amount of gravel runs to the object. Sedimentation and lack of movement dominate directly above the structure for the coarse fraction (d > 0.045 m), and only the smallest grains are transported (d < 0.045 m). Above the block ramp, in the reach of 30–65, high values of hydrodynamic parameters (from V = 2.0 m·s−1 to up V = 3.5 m·s−1, from τ = 40 N·m−2 to up τ = 150 N·m−2) erode the central gravel bar, due to which large amounts of sediment (from Tc = 1.1 kg·m−1·s−1 to up Tc = 20 kg·m−1·s−1) are eroded on the upstream side of the bar and sedimented on the downstream side. Much higher values of hydrodynamic parameters also occur downstream of the structure (from V = 2.0 m·s−1 to up V = 3.5 m·s−1, from τ = 50 N·m−2 to up τ = 100 N·m−2), where an extensive erosion of the river bed can be observed (from Tc = 0.1 kg·m−1·s−1 to up Tc = 10 kg·m−1·s−1). The farther away from the block ramp, the lower the velocities and forces (from V = 1.5 m·s−1 to up V = 3.0 m·s−1, from τ = 30 N·m−2 to up τ = 80 N·m−2, from Tc = 0 kg·m−1·s−1 to up Tc = 2.5 kg·m−1·s−1); the erosion process disappears and the transport and even sedimentation processes begin to dominate in the river. At this point, a stream of water flows out of the erosion gutter, which was formed between two side gravel bars.
  • In modern river management and hydraulic structure designing works, there is still an important place for classical approaches since they form the theory for all the later developed models. Additionally, the developed models might be still improved based on the classical results. In some cases of designing works (especially when time is the issue), using the classical approaches might even be much more effective and still is advisable.
  • In the future, it might be valuable to change the model into a much more detailed one where each individual block would be included. It could make calculations much more precise. However, while such change is possibly useful for scientific reasons, in the case of a practical survey in the field, it is not. This is because land surveys take a very long time. In addition, such analysis will be possible in the future when we can conduct underwater laser scanning.

Author Contributions

Conceptualization, A.R.-P., K.P. and P.K.; methodology, A.R.-P., K.P. and P.K.; investigation, A.R.-P. and K.P.; resources, A.R.-P.; writing—original draft preparation, A.R.-P., P.K. and K.P.; writing—review and editing, A.R.-P., T.T. and F.P.; visualization, K.P. and N.J.; supervision, A.R.-P. All authors have read and agreed to the published version of the manuscript.

Funding

This research received no external funding.

Institutional Review Board Statement

Not applicable.

Informed Consent Statement

Not applicable.

Data Availability Statement

Not applicable.

Conflicts of Interest

The authors declare no conflict of interest.

Notations

ΔHdifference in the bed elevation before and after modelling
ddiameter of bed material
ggravity
hwater depth at measurement point(s)
Qfloodflow discharge during a spring flood
Qdischarge during measurements
Q%t-year flood
ReReynolds number
tunit bed load transport
Tcbed load transport
Vavaverage velocity
τshear stress

References

  1. Bruk, S. Design data for River management. Morphological, hydrological and hydraulic data. In Proceedings of the International Conference of Fluvial Hydraulics, Budapest, Hungary, 30 May–3 June 1988; pp. 409–419. [Google Scholar]
  2. Cunge, J.; Holly, F.M.; Verwey, A. Practical Aspects of Computational River Hydraulics; Pitman, Publishing: London, UK, 1980. [Google Scholar]
  3. Miller, W.A.; Cunge, J.A. Simplified equations of unsteady flow. In Unsteady Fow in Open Channels; Mahmood, K., Yevjewich, V., Eds.; Water Resources Publishing: Fort Collins, CO, USA, 1975. [Google Scholar]
  4. Abbott, M.B. Computational Hydraulics, Elements of the Theory of Free Surface flow; Pitman Publ: London, UK, 1979; p. 324. [Google Scholar]
  5. Chow, V.T. Open Channel Hydraulics; McGraw-Hill: New York, NY, USA, 1959; p. 680. [Google Scholar]
  6. Chow, V.T. Handbook of Applied Hydrology; McGraw-Hill: New York, NY, USA, 1964; p. 1467. [Google Scholar]
  7. Henderson, F.M. Open Channel Flow; Macmillan Company: New York, NY, USA, 1966; p. 522. [Google Scholar]
  8. Chanson, H. Hydraulics of Open Channel Flow; Butterworth-Heinemann: Oxford, UK, 2004; p. 650. [Google Scholar]
  9. Cunge, J.A. On the subject of a flood propagation computation method (Muskingum method). J. Hydr. Res. 1969, 7, 205–229. [Google Scholar] [CrossRef]
  10. Szymkiewicz, R. Open channel flow equations. In Numerical Modeling in Open Channel Hydraulics; Springer: Berlin/Heidelberg, Germany, 2015; p. 417. [Google Scholar]
  11. Gąsiorowski, D.; Napiórkowsk, J.; Szymkiewicz, R. One-Dimensional modeling of flows in open channels. In Rivers–Physical, Fluvial and Environmental Processes; Rowiński, P., Radecki-Pawlik, A., Eds.; Springer: Berlin/Heidelberg, Germany, 2015; pp. 137–167. [Google Scholar]
  12. Szymkiewicz, R. Numerical Modeling in Open Channel Hydraulics; Springer Science & Business Media: Berlin/Heidelberg, Germany, 2010; p. 416. [Google Scholar]
  13. Gresho, P.M.; Sani, R.L. Incompressible Flow and the Finite–Element Method, Volume 1: Advection-Diffusion; Wiley: Chichester, UK, 2000. [Google Scholar]
  14. Abbot, M.B.; Basco, D.R. Computational Fluid Dynamics an Introduction for Engineers; Cambridge University Press: Cambridge, UK, 1991; p. 425. [Google Scholar]
  15. Patankar, S.V. Computation of Conduction and Duct Flow Heat Transfer; CRC, CAT# GS904; Innovative Research Inc.: Novi, MI, USA, 1990; p. 205. [Google Scholar]
  16. Moussa, R.; Cheviron, B. Modeling of Floods-State of the Art and Research Challenges. In Rivers–Physical, Fluvial and Environmental Processes; Rowinski, P., Radecki-Pawlik, A., Eds.; Springer: Berlin/Heidelberg, Germany, 2015; pp. 169–192. [Google Scholar]
  17. Badawy, N.A.M.; El-Hazek, A.N.; Elserawy, H.M.; Mohammed, E.R. Modeling the hydrodynamic interactions between the river morphology and navigation channel operations. J. Water Land Dev. 2021, 51, 1–10. [Google Scholar]
  18. Plesiński, K.; Radecki-Pawlik, A.; Michalik, P. On using HEC-RAS model for river channel changes predictions along the engineered Czarny Dunajec river. Sci. Rev. Eng. Environ. Sci. 2017, 26, 346–360. (In Polish) [Google Scholar]
  19. Oertel, M. Numerical Modeling of Free-Surface Flows in Practical Applications. In Rivers–Physical, Fluvial and Environmental Processes; Rowiński, P., Radecki-Pawlik, A., Eds.; Springer: Berlin/Heidelberg, Germany, 2015; pp. 193–211. ISBN 978-3-319-17719-9. [Google Scholar]
  20. Plesiński, K.; Radecki-Pawlik, A.; Wyżga, B. Sediment Transport Processes Related to the Operation of a Rapid Hydraulic Structure (Boulder Ramp) in a Mountain Stream Channel: A Polish Carpathian Example. In Sediment Matters; Heininger, P., Cullmann, J., Eds.; Springer: Cham, Switzerland, 2015; p. 259. [Google Scholar]
  21. Plesiński, K.; Pachla, F.; Radecki-Pawlik, A.; Tatara, T.; Radecki-Pawlik, B. Numerical 2D simulation of morphological phenomena of a block ramp in Poniczanka stream: Polish Carpathians. In Proceedings of the 7th IAHR International Symposium on Hydraulic Structures, Aachen, Germany, 15–18 May 2018; Utah State University: Logan, UT, USA, 2018. [Google Scholar]
  22. Oertel, M. In-Situ Measurements on Cross-Bar Block Ramps. In Proceedings of the International Workshop on Hydraulic Design of Low-Head Structures (IWLHS), Aachen, Germany, 20–22 February 2013; Bung, D.B., Pagliara, S., Eds.; Bundesanstalt für Wasserbau: Aachen, Germany, 2013; pp. 111–119. [Google Scholar]
  23. Pagliara, S.; Palermo, M. Effect of energy dissipation pool geometry on the dissipative process in the presence of block ramps. J. Irrig. Drain. Eng. 2012, 138, 1027–1031. [Google Scholar] [CrossRef]
  24. Zastera, Z. Ramp Hydraulic Structures; Balvanite Skluzy, Hydroprojektukol R-4: Brno, Czech Republic, 1984. (In Czech) [Google Scholar]
  25. Ślizowski, R.; Radecki-Pawlik, A.; Huta, K. Analysis of chosen hydrodynamics parameters along the rapid hydraulic structure with increased roughness–the Sanoczek Stream. Infrastrukt. Ekol. Teren. Wiej. 2008, 2, 47–58. (In Polish) [Google Scholar]
  26. Radecki-Pawlik, A. On using artificial rapid hydraulic structures (RHS) within mountain stream channels–some exploitation and hydraulic problems. In Experimental and Computational Solutions of Hydraulic Problems; Rowiński, P., Ed.; Series: GeoPlanet: Earth and Planetary Sciences, Monograph; Springer: Berlin/Heidelberg, Germany, 2013; pp. 101–115. [Google Scholar]
  27. Radecki-Pawlik, A.; Plesiński, K.; Wyżga, B. Analysis of chosen hydraulic parameters of a rapid hydraulic structure (RHS) in porębianka stream, Polish Carpathians. In Proceedings of the International Workshop on Hydraulic Design of Low-Head Structures (IWLHS), Aachen, Germany, 20–22 February 2013; Bung, D.B., Pagliara, S., Eds.; Bundesanstalt für Wasserbau: Aachen, Germany, 2013; pp. 121–128. [Google Scholar]
  28. Tamagni, S.; Weitbrecht, V.; Boes, R. Experimental study on the flow characteristics of unstructured block ramps. J. Hydraul. Res. 2014, 52, 600–613. [Google Scholar] [CrossRef]
  29. Pagliara, S.; Palermo, M. Scour at foundations of rock made low-head structures. In Proceedings of the International Workshop on Hydraulic Design of Low-Head Structures (IWLHS), Aachen, Germany, 20–22 February 2013; Bung, D.B., Pagliara, S., Eds.; Bundesanstalt für Wasserbau: Aachen, Germany, 2013; pp. 169–177. [Google Scholar]
  30. Pagliara, S.; Palermo, M. Rock grade control structures and stepped gabion weirs: Scour analysis and flow features. Acta Geophys. 2013, 61, 126–150. [Google Scholar] [CrossRef]
  31. Pagliara, S.; Chiavaccini, P. Flow resistance of rock chutes with protruding boulders. J. Hydraul. Eng. 2006, 132, 545–552. [Google Scholar] [CrossRef]
  32. Pagliara, S.; Radecki-Pawlik, A.; Palermo, M.; Plesiński, K. Block ramps in curved rivers: Morphology analysis and prototype data supported design criteria for mild bed slopes. River Res. Appl. 2017, 33, 427–437. [Google Scholar] [CrossRef]
  33. Skalski, T.; Kędzior, R.; Radecki-Pawlik, A. Riverine ground beetles as indicators of inundation frequency of mountain stream: A case study of the Ochotnica Stream, Southern Poland. Baltic J. Coleopterol. 2012, 12, 117–126. [Google Scholar]
  34. Kłonowska-Olejnik, M.; Radecki-Pawlik, A. Zróżnicowanie Mikrosiedliskowe Makrobezkręgowców Dennych w Obrębie łach Korytowych Potoku Górskiego o dnie żwirowym; XVIII Zjazd Hydrobiologów Polskich: Białystok, Poland, 2000. (In Polish) [Google Scholar]
  35. Plesinski, K.; Gibbins, C.; Radecki-Pawlik, A. Effects of interlocked carpet ramps on upstream movement of brown trout Salmo trutta in an upland stream. J. Ecohydraulics 2020, 5, 3–30. [Google Scholar] [CrossRef]
  36. Radecki-Pawlik, A.; Plesiński, K.; Radecki-Pawlik, B.; Kuboń, P.; Manson, R. Hydrodynamic parameters in a flood impacted boulder block ramp: Krzczonówka mountain stream, Polish Carpathians. J. Mt. Sci. 2018, 15, 2335–2346. [Google Scholar] [CrossRef]
  37. Bung, D. Laboratory Models of Free-Surface Flows. In Rivers–Physical, Fluvial and Environmental Processes; Rowinski, P., Radecki-Pawlik, A., Eds.; Springer: Berlin/Heidelberg, Germany, 2015; pp. 213–227. [Google Scholar]
  38. Novák, L. Torrent control. In Soil Conservation and Silviculture; Dvořák, J., Novák, L., Eds.; Elsevier: Amsterdam, The Netherlands, 1992; p. 171. [Google Scholar]
  39. Hjulström, F. Studies of the Morphological Activity of Rivers as Illustrated by River Fyris; Bulletin of the Geological Institute University of Uppsala: Uppsala, Sweden, 1935; Volume 25, pp. 221–527. [Google Scholar]
  40. Shields, A. Anwendung der Ähnlichkeitsmechanik auf die Geschiebebewegung; H. 26, Berlin, monograph; Preussische Versuchanstalt für Wasserbau und Schiffbau, Mitteilungen der Preußischen Versuchsanstalt für Wasserbau und Schiffbau: Berlin, Germany, 1936. [Google Scholar]
  41. Gladki, H. Discussion of “Determination of Sand Roughness for Fixed Beds”. J. Hydraul. Res. 1975, 13, 2. [Google Scholar]
  42. Young, C.T. Sediment Transport: Theory and Practice; The McGraw-Hill Companies, Inc.: Beijing, China, 1996. [Google Scholar]
  43. Parker, G. Surface-based bedload transport relation for gravel rivers. J. Hydraul. Res. 1990, 28, 417–434. [Google Scholar] [CrossRef]
  44. Radecki-Pawlik, A. Hydromorphology of Rivers and Mountain Streams; Hydromorfologia rzek i potoków górskich; Publishing House of Agricultural University in Kraków: Krakow, Poland, 2014; p. 288. (In Polish) [Google Scholar]
  45. Jäggi, M. Der Geschiebetransport in Flüssen nach der VAW-Formel. Tec21 1983, 102, H47. [Google Scholar]
  46. Wolman, M.G. A method of sampling coarse river-bed material. In Transactions; American Geophysical Union: Washington, DC, USA, 1954; Volume 35, pp. 951–956. [Google Scholar]
  47. Zhang, Y. CCHE2D-GUI–Graphical User Interface for the CCHE2D Model. In User’s Manual–Version 3.0; National Center for Computational Hydroscience and Enginnering, School of Engineering, The University of Mississippi: Oxford, MS, USA, 2006. [Google Scholar]
  48. Yeh, K.-C.; Wang, S.; Chen, H.; Liao, C.-T.; Jia, Y.; Zhang, Y. Numerical Simulation of Sediment Transport and Morphological Change of Upstream and Downstream Reach of Chi-Chi Weir. In Numerical Simulation–Examples and Applications in Computational Fluid Dynamics; Angermann, L., Ed.; BoD–Books on Demand: Norderstedt, Germany, 2010; pp. 311–326. [Google Scholar]
  49. Wu, W. CCHE2D Sediment Transport Model (Version 2.1); National Center for Computational Hydroscience and Engineering, The University of Mississippi: Mississippi, MS, USA, 2001. [Google Scholar]
  50. Wu, W. CCHE2D Depth-averaged 2-D numerical modeling of unsteady flow and nonuniform sediment transport in open channels. J. Hydraul. Eng. ASCE 2004, 130, 1013–1024. [Google Scholar] [CrossRef]
  51. Wu, W.; Wang, S.S. Development and application of NCCHE’s sediment transport models. In Proceedings of the US–China WORKSHOP on Advanced Computational Modelling in Hydroscience & Engineering, Oxford, MS, USA, 19–21 September 2005. [Google Scholar]
  52. Nash, J.E.; Sutcliffe, J.V. River flow forecasting through conceptual models. Part I: A discussion of principles. J. Hydrol. 1970, 10, 282–290. [Google Scholar] [CrossRef]
  53. Moriasi, D.N.; Arnold, J.G.; Van Liew, M.W.; Bingner, R.L.; Harmel, R.D.; Veith, T.L. Model evaluation guidelines for systematic quantification of accuracy in watershed simulations. Trans. ASABE 2007, 50, 885–900. [Google Scholar] [CrossRef]
  54. Błażejewski, R. Introduction to empirical research. In Wstęp do Badań Empirycznych; Publishing House of Agricultural Academy in Poznań: Poznań, Poland, 1999; p. 101. (In Polish) [Google Scholar]
  55. Klimaszewski, M. Geomorphology; Geomorfologia; PWN: Warszawa, Poland, 1978. (In Polish) [Google Scholar]
  56. Sklar, L.S.; Dietrich, W.E. Sediment and rock strength controls on river incision into bed rock. Geol. Soc. Am. Bull. 2001, 29, 1087–1090. [Google Scholar]
  57. Sklar, L.S.; Dietrich, W.E. A mechanistic model for river incision into bedrock by saltating bed load. Water Resour. Res. 2004, 40, 1–21. [Google Scholar] [CrossRef]
Figure 1. Research region.
Sustainability 14 04665 g001
Figure 2. The block ramp on Porębianka stream.
Sustainability 14 04665 g002
Figure 3. The distribution of particle size on the grid model.
Sustainability 14 04665 g003
Figure 4. Analyzed longitudinal profiles.
Sustainability 14 04665 g004
Figure 5. Hjulström’s diagram [39] (a), Shields’ diagram [40] (b), and diagram according to Russian standard ST-24-2396 (c) [38].
Sustainability 14 04665 g005
Figure 6. The hydrodynamic parameters and bed load transport were obtained with numerical modelling with CCHE2D (a) and the observed changes in the elevation of the stream bed (b).
Sustainability 14 04665 g006aSustainability 14 04665 g006b
Figure 7. Distribution of transported material in individual sections of the stream channel.
Sustainability 14 04665 g007
Figure 8. Hjulström’s diagram showing bed material conditions in each section of the stream channel.
Sustainability 14 04665 g008
Figure 9. Shields’ diagram showing bed material conditions in each section of the stream channel.
Sustainability 14 04665 g009
Figure 10. Russian standard ST-24-2396 showing the critical average channel velocities for the analysis reaches.
Sustainability 14 04665 g010
Figure 11. Compatibility of CCHE2D model with Hjulström’s diagram (a), Shields’ diagram (b) and Russian standard ST-24-2396 (c).
Sustainability 14 04665 g011
Figure 12. Comparison of bed load transport rates calculated by means of CCHE2D, MPM’s formula, Parker’s formula, Samov’s formula, and Jäggi’s formula for changing flood discharge and different values of channel slope.
Sustainability 14 04665 g012
Figure 13. The changes of bed channel for different discharge Q values.
Sustainability 14 04665 g013
Table 1. Values of NSE, PBias, and R2 coefficient [53,54].
Water DepthVelocityShear StressFroude’s NumberModel Fit
NSE values0.990.940.990.96proper
PBias values−3.09−1.45−2.290.13proper
R2 values0.990.950.990.97proper
Publisher’s Note: MDPI stays neutral with regard to jurisdictional claims in published maps and institutional affiliations.

